Embed Size (px)
Citation preview
Available online at www.sciencedirect.com
Polymer 49 (2008) 2085e2094www.elsevier.com/locate/polymer
Analysis of the interaction using FTIR within the componentsof OREC composite GPE based on the synthesized copolymer
matrix of P(MMA-MAh)
Yun Huang, Xiaoyan Ma*, Guozheng Liang, Shuhui Wang, Qilu Zhang
Department of Applied Chemistry, School of Science, Northwestern Polytechnical University, Xi’an, Shaanxi 710072, China
Received 12 December 2007; received in revised form 14 January 2008; accepted 20 January 2008
Available online 31 January 2008
Abstract
Poly(methyl methacrylate-maleic anhydride) (P(MMA-MAh)) has been synthesized from methyl methacrylate (MMA) and maleic anhydride(MAh) monomers. The molar ratio of monomers was found to be 1MAh:8MMA. The molecular weight of copolymer was determined in theorder 104 (g/mol).
Rectorite modified with dodecyl benzyl dimethyl ammonium chloride (OREC) was used as a filler additive to modify gel polymer electro-lytes (GPEs) which consisted of P(MMA-MAh) used as polymer matrix, propylene carbonate (PC) as a plasticizer and LiClO4 as lithium ionproducer. Characterization of interaction of C]O in PC and copolymer with Liþ and OH group on OREC surface has been thoroughly examinedusing FTIR. The quantitative analysis of FTIR shows that the absorptivity coefficient a of copolymer/LiClO4, PC/LiClO4, PC/OREC andcopolymer/OREC is 0.756, 0.113, 0.430 and 0.602, respectively, which means that the Liþ or OH bonded C]O is more sensitive than freeC]O in FTIR spectra. The limit value of bonded C]O equivalent fraction of copolymer/LiClO4, PC/LiClO4, PC/OREC and copolymer/OREC is 55, 94, 57 and 26%, respectively, which implies that all the interaction within the components is reversible and the intensity ofinteraction is ordered as PC/LiClO4, PC/OREC, copolymer/OREC and copolymer/LiClO4.� 2008 Elsevier Ltd. All rights reserved.
Keywords: Rectorite; Gel polymer electrolytes; FTIR
1. Introduction
Gel polymer electrolytes (GPEs) are reported to be suitablefor electrochemical devices since their transport properties arequite exceptional and they have an ionic conductivity in the or-der of 10�3 S/cm, an electrochemical stability window exceed-ing 4.5 V and lithium-ion transference numbers averaging 0.9[1e9]. In GPEs, the addition of plasticizer to the polymerelectrolyte results in high segmental motion and thus increasesthe ionic conductivity. It is well recognized that the addition ofinorganic fillers such as ceramic powder, alumina or silica toGPEs based on the polyether matrix will not only enhance
* Corresponding author. Tel.: þ86 29 88474157; fax: þ86 29 88474080.
E-mail address: [email protected] (X. Ma).
0032-3861/$ - see front matter � 2008 Elsevier Ltd. All rights reserved.
doi:10.1016/j.polymer.2008.01.057
its ionic conductivity but also improve dimensional mechani-cal stability [10e14].
Rectorite (REC) is a type of layered clay with specific tex-ture similar to that of montmorillonite (MMT). It is a regularlyinterstratified clay mineral of dioctahedral mica-like layer(non-expansible) and dioctahedral smectite-like layer (expan-sible) in a 1:1 ratio. The smectite layer has the capability ofcation exchange. However, REC is also hydrophilic. To renderit more hydrophobic, the hydrated cations between the silicatelayers need to be exchanged with cationic surfactants such asorganic quaternary ammonium salts.
Maleic anhydride (MAh) is a unique comonomer because itdoes not readily undergo homopolymerization, but forms co-polymers without difficulty [15]. As the numbers of polar,rigid or cyclic groups in the backbone of polymers increased[16,17], the chain elasticity of polymer decreased. On the
2086 Y. Huang et al. / Polymer 49 (2008) 2085e2094
other side interactions of the electron accepting maleic anhy-dride groups with the charge carriers are expected, whichshould reduce the ionic association and should restrict themobility of the anions.
The application of Fourier transform infrared (FTIR) spec-troscopic techniques to assess polymer science has been con-ducted for many years [18e24]. FTIR is a particularly suitabletechnique for investigating the specific intermolecular interac-tion [25e28]. The changes of interaction behavior can be char-acterized through the identification of the IR spectral featuresin intensity, bandwidth and position with which it allows toquantitatively study the interaction. Digar et al. [29] quantita-tively studied the interaction of Liþ with segments of PUAwith FTIR, and found that the deconvoluted FTIR spectrashow three kinds of C]O in PUA/LiClO4 system. In addition,with the addition of lithium, three peaks were shifted to lowerwave number, and the area of three peaks also changed. Wuand Chang [28] also used FTIR to quantitatively study the in-teraction within polyester/LiClO4 system, which clearly clar-ifies the Liþ status in the polymer electrolyte. But until now,there have not been reports about FTIR quantitative researchof GPE. In GPE systems, there are more components, so itis more necessary and important to quantitatively study theinteraction between components.
In the present work, we will focus on the interaction be-tween the components of copolymer of poly(methyl methacry-late-maleic anhydride) (P(MMA-MAh)), filler additive ofrectorite modified with dodecyl benzyl dimethyl ammoniumchloride (OREC), propylene carbonate (PC) and LiClO4
with FTIR spectra, which will help us to understand themicro-interaction of OREC modified GPEs. In addition, thequantitative measurement method mentioned in the presentwork can be widely used in a variety of polymer science.
2. Experimental section
2.1. Materials
The plasticizer was propylene carbonate (PC) from Shang-shi Reagent Co. and acetone from Xi’an Chemical ReagentCo. was used as solvent. PC and acetone were stored over mo-lecular sieves (4 A) in order to remove residual water traces.LiClO4 was obtained from Xi’an Chemical Reagent Co. So-dium rectorite (Na-REC) was refined from clay minerals inWuhan, China. The CEC is 45 meq/100 g and the d-space is2.22 nm. The natural rectorite (REC) was modified with sur-factant of dodecyl benzyl dimethyl ammonium chloride inour lab. The amount of surfactant exchanged into ORECwas determined as 0.27 mmol g�1 and the d-spacing of or-ganic modified clay was 2.99 nm [30].
2.2. Synthesis of copolymer
To a 500 ml four-necked reactor equipped with mechanicalstirrer and condenser, toluene (200 ml), MMA (18.0 g), MAh(17.7 g) and AIBN (0.026 g) as catalyzer were added sequen-tially. The reaction was carried out at 80 �C under nitrogen
atmosphere for 8 h. Solvent in the reaction mixture was thenremoved by filtration method. The crude product was washedby diethyl ether until the unreacted monomers were removedcompletely. The purified product was dried in a vacuumoven to remove the trapped solvent at 100 �C for 24 h.
2.3. BeereLambert’s law
A single optical path was used to study the interactionwithin the GPE. All samples in the absorption range wouldobey BeereLambert’s law.
���� Icl
����limc/0 ¼ 3 ð1Þ
where I is the intensity of absorption; 3 is the absorptivitycoefficient; l is the thickness of sample; and c is theconcentration.
2.4. Characterization
The molar ratio of MAh and MMA was determined asfollows.
The hydrolysis of copolymer was carried out with a 2 MNaOH solution at 25 �C under argon atmosphere for 1 h.The copolymer solution was precipitated in 2 M HCl solution;then the sample was isolated by filtration and washed severaltimes with water to remove the traces of NaCl and then driedin vacuum at 50 �C. Titration of dicarboxylic groups wascarried out using a 0.1 M NaOH solution in the presence ofphenolphthalein. The percentage of sodium uptake is given bythe relationship
%Na¼ VNaOH � nNaOH � 40
a� 1000� 100 ð2Þ
where VNaOH is the volume of NaOH solution (ml); nNaOH isthe normality of solution (mol/l); a is the sample weight (g).
The total neutralized dicarboxylic content (%) can becalculated using the relationship
%Dicarboxylic¼%NaOH� a� 45
40� 2ð3Þ
where 40 and 45 are the chemical equivalents of NaOH andcarboxylic group, respectively.
1H NMR spectra of polymers were recorded witha 500 MHz BRUKE NMR spectrometer in CDCl3, usingTMS as the internal standard. The molecular weight of the co-polymer was determined by gel permeation chromatography(GPC) with laser scattering detector, ultrastyragel columnwith pore sizes of 103e105 A. The eluent used was THF ata flow rate of 0.5 ml min�1. Samples for 1H NMR determina-tion were typically scanned 64 times between d values of0e10 ppm.
FTIR was performed on an infrared spectroscopy of WQF-310 in the wave number range 4000e400 cm�1. The sampledispersed in acetone was casted on KBr pellets. Until acetone
CH3
OCH3
CH3
OCH3O
C C
O OO
AIBNCH
CO
HC
O
CH
OO
+8H2C H2C8
Scheme 1. Synthesis of copolymer of MMA-MAh.
4000 3500 3000 2500 2000 1500 1000 500
50
60
70
80
90
100
110
120
130
9421851
1786
1731
in
ten
sity (a.u
.)
2087Y. Huang et al. / Polymer 49 (2008) 2085e2094
was completely dropped out from the thin film, the KBr pelletwith sample was placed in the meter for measurement. Allinfrared spectra were obtained at 16 scans with a resolutionof 0.1 cm�1 at room temperature.
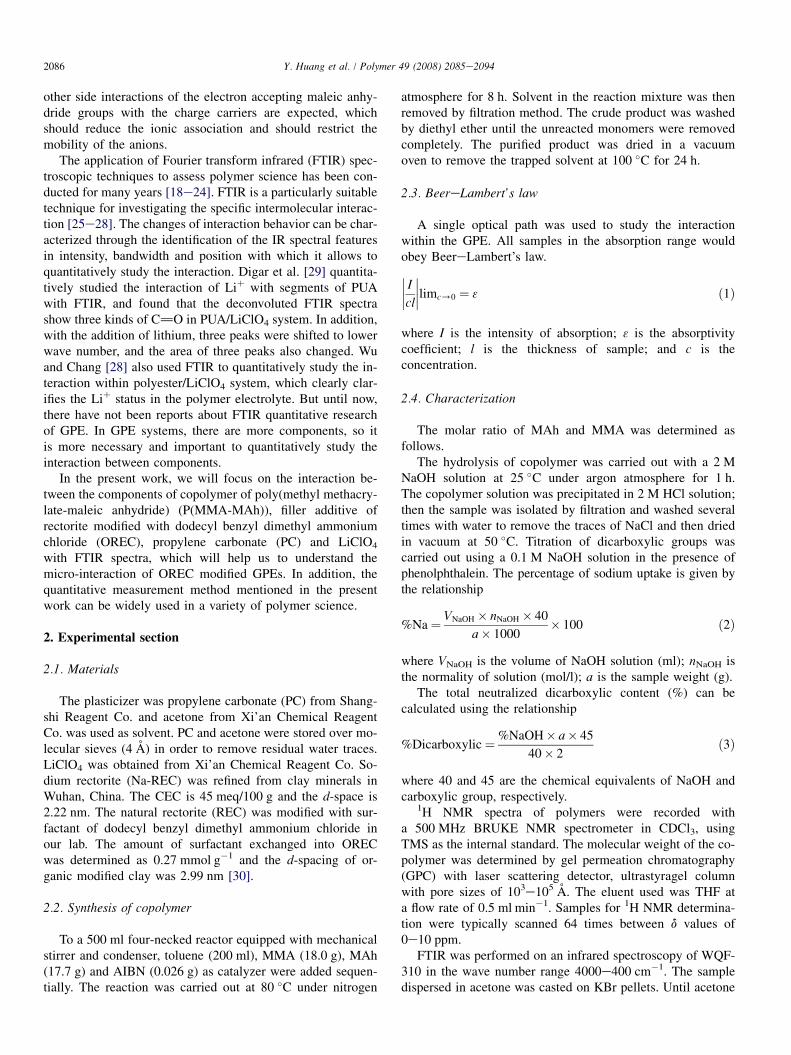
wavenumber / cm-1
Fig. 2. FTIR spectra of the synthesized copolymer.
3. Results and discussion3.1. Characterization of copolymer
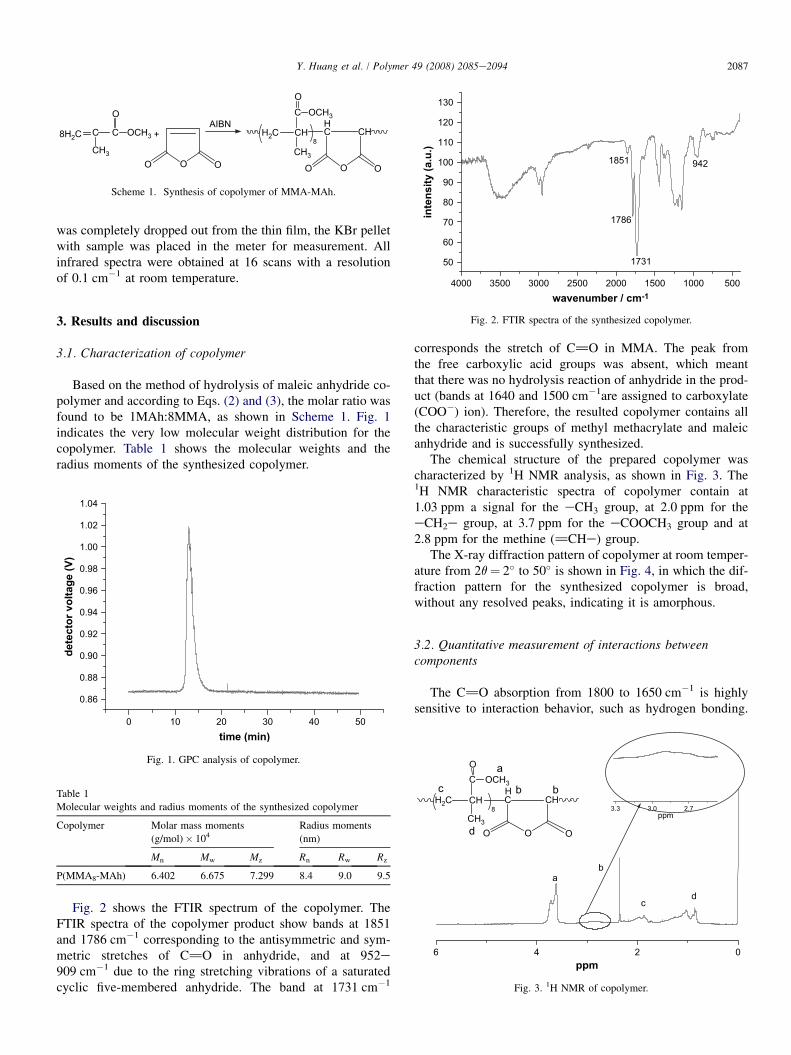
Based on the method of hydrolysis of maleic anhydride co-polymer and according to Eqs. (2) and (3), the molar ratio wasfound to be 1MAh:8MMA, as shown in Scheme 1. Fig. 1indicates the very low molecular weight distribution for thecopolymer. Table 1 shows the molecular weights and theradius moments of the synthesized copolymer.
0 10 20 30 40 50
0.86
0.88
0.90
0.92
0.94
0.96
0.98
1.00
1.02
1.04
detecto
r vo
ltag
e (V
)
time (min)
Fig. 1. GPC analysis of copolymer.
Table 1
Molecular weights and radius moments of the synthesized copolymer
Copolymer Molar mass moments
(g/mol)� 104Radius moments
(nm)
Mn Mw Mz Rn Rw Rz
P(MMA8-MAh) 6.402 6.675 7.299 8.4 9.0 9.5
6 4 2 0
d
cH2C CH
C
CH3
OCH3
O
HC
O
CH
OO
8
a
bb
c
b
3.3 3.0 2.7ppm
d
a
ppm
Fig. 3. 1H NMR of copolymer.
Fig. 2 shows the FTIR spectrum of the copolymer. TheFTIR spectra of the copolymer product show bands at 1851and 1786 cm�1 corresponding to the antisymmetric and sym-metric stretches of C]O in anhydride, and at 952e909 cm�1 due to the ring stretching vibrations of a saturatedcyclic five-membered anhydride. The band at 1731 cm�1
corresponds the stretch of C]O in MMA. The peak fromthe free carboxylic acid groups was absent, which meantthat there was no hydrolysis reaction of anhydride in the prod-uct (bands at 1640 and 1500 cm�1are assigned to carboxylate(COO�) ion). Therefore, the resulted copolymer contains allthe characteristic groups of methyl methacrylate and maleicanhydride and is successfully synthesized.
The chemical structure of the prepared copolymer wascharacterized by 1H NMR analysis, as shown in Fig. 3. The1H NMR characteristic spectra of copolymer contain at1.03 ppm a signal for the eCH3 group, at 2.0 ppm for theeCH2e group, at 3.7 ppm for the eCOOCH3 group and at2.8 ppm for the methine (]CHe) group.
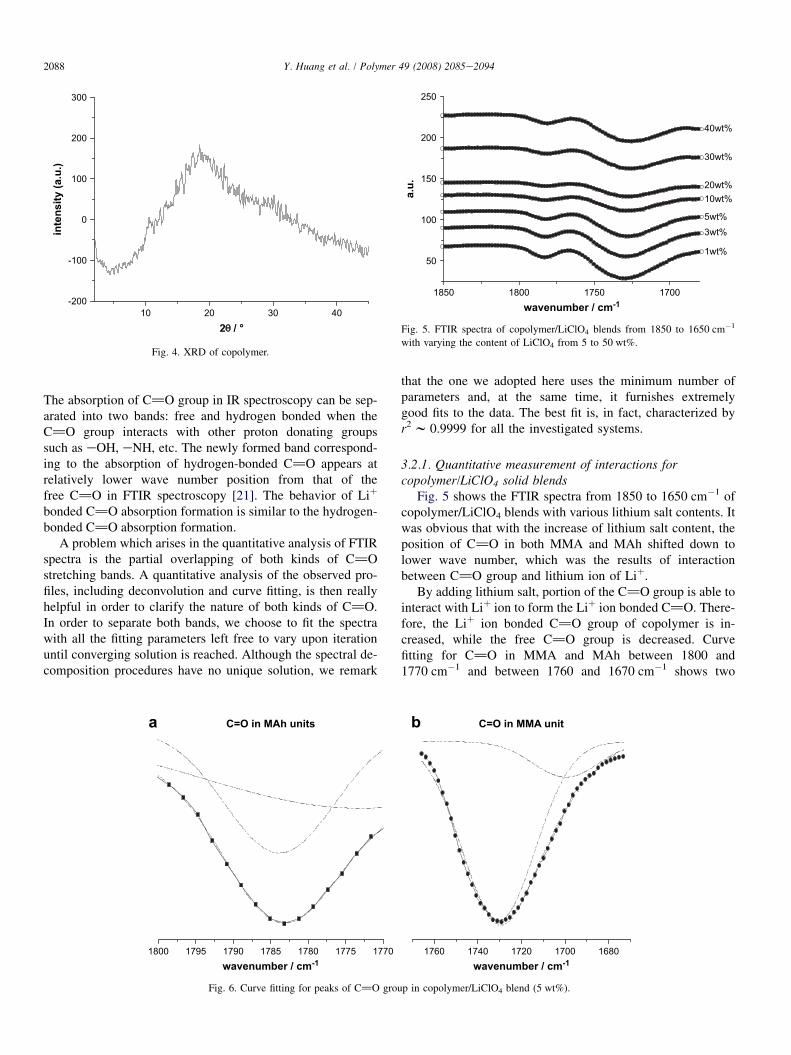
The X-ray diffraction pattern of copolymer at room temper-ature from 2q¼ 2� to 50� is shown in Fig. 4, in which the dif-fraction pattern for the synthesized copolymer is broad,without any resolved peaks, indicating it is amorphous.
3.2. Quantitative measurement of interactions betweencomponents
The C]O absorption from 1800 to 1650 cm�1 is highlysensitive to interaction behavior, such as hydrogen bonding.
10 20 30 40-200
-100
0
100
200
300
in
ten
sity (a.u
.)
2 / °
Fig. 4. XRD of copolymer.
1850 1800 1750 1700
50
100
150
200
250
40wt%
30wt%
20wt%10wt%
5wt%3wt%
1wt%
a.u
.
wavenumber / cm-1
Fig. 5. FTIR spectra of copolymer/LiClO4 blends from 1850 to 1650 cm�1
with varying the content of LiClO4 from 5 to 50 wt%.
2088 Y. Huang et al. / Polymer 49 (2008) 2085e2094
The absorption of C]O group in IR spectroscopy can be sep-arated into two bands: free and hydrogen bonded when theC]O group interacts with other proton donating groupssuch as eOH, eNH, etc. The newly formed band correspond-ing to the absorption of hydrogen-bonded C]O appears atrelatively lower wave number position from that of thefree C]O in FTIR spectroscopy [21]. The behavior of Liþ
bonded C]O absorption formation is similar to the hydrogen-bonded C]O absorption formation.
A problem which arises in the quantitative analysis of FTIRspectra is the partial overlapping of both kinds of C]Ostretching bands. A quantitative analysis of the observed pro-files, including deconvolution and curve fitting, is then reallyhelpful in order to clarify the nature of both kinds of C]O.In order to separate both bands, we choose to fit the spectrawith all the fitting parameters left free to vary upon iterationuntil converging solution is reached. Although the spectral de-composition procedures have no unique solution, we remark
1800 1795 1790 1785 1780 1775 1770wavenumber / cm
-1
C=O in MAh unitsa
Fig. 6. Curve fitting for peaks of C]O grou
that the one we adopted here uses the minimum number ofparameters and, at the same time, it furnishes extremelygood fits to the data. The best fit is, in fact, characterized byr2 w 0.9999 for all the investigated systems.
3.2.1. Quantitative measurement of interactions forcopolymer/LiClO4 solid blends
Fig. 5 shows the FTIR spectra from 1850 to 1650 cm�1 ofcopolymer/LiClO4 blends with various lithium salt contents. Itwas obvious that with the increase of lithium salt content, theposition of C]O in both MMA and MAh shifted down tolower wave number, which was the results of interactionbetween C]O group and lithium ion of Liþ.
By adding lithium salt, portion of the C]O group is able tointeract with Liþ ion to form the Liþ ion bonded C]O. There-fore, the Liþ ion bonded C]O group of copolymer is in-creased, while the free C]O group is decreased. Curvefitting for C]O in MMA and MAh between 1800 and1770 cm�1 and between 1760 and 1670 cm�1 shows two
1760 1740 1720 1700 1680wavenumber / cm
-1
C=O in MMA unitb
p in copolymer/LiClO4 blend (5 wt%).
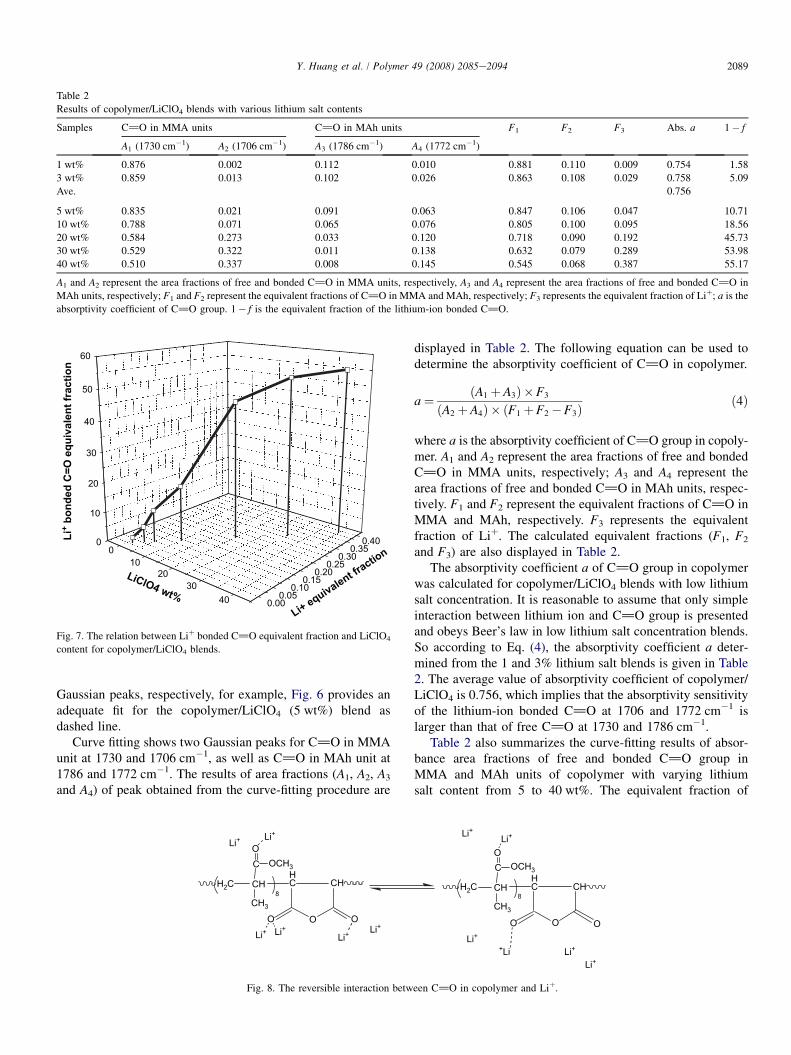
Table 2
Results of copolymer/LiClO4 blends with various lithium salt contents
Samples C]O in MMA units C]O in MAh units F1 F2 F3 Abs. a 1� f
A1 (1730 cm�1) A2 (1706 cm�1) A3 (1786 cm�1) A4 (1772 cm�1)
1 wt% 0.876 0.002 0.112 0.010 0.881 0.110 0.009 0.754 1.58
3 wt% 0.859 0.013 0.102 0.026 0.863 0.108 0.029 0.758 5.09
Ave. 0.756
5 wt% 0.835 0.021 0.091 0.063 0.847 0.106 0.047 10.71
10 wt% 0.788 0.071 0.065 0.076 0.805 0.100 0.095 18.56
20 wt% 0.584 0.273 0.033 0.120 0.718 0.090 0.192 45.73
30 wt% 0.529 0.322 0.011 0.138 0.632 0.079 0.289 53.98
40 wt% 0.510 0.337 0.008 0.145 0.545 0.068 0.387 55.17
A1 and A2 represent the area fractions of free and bonded C]O in MMA units, respectively, A3 and A4 represent the area fractions of free and bonded C]O in
MAh units, respectively; F1 and F2 represent the equivalent fractions of C]O in MMA and MAh, respectively; F3 represents the equivalent fraction of Liþ; a is the
absorptivity coefficient of C]O group. 1� f is the equivalent fraction of the lithium-ion bonded C]O.
010
2030
40
0
10
20
30
40
50
60
0.000.05
0.100.15
0.200.25
0.300.35
0.40Li+ b
on
ded
C
=O
eq
uivalen
t fractio
n
Li+
equiv
ale
nt fr
action
LiClO
4 wt%
Fig. 7. The relation between Liþ bonded C]O equivalent fraction and LiClO4
content for copolymer/LiClO4 blends.
2089Y. Huang et al. / Polymer 49 (2008) 2085e2094
Gaussian peaks, respectively, for example, Fig. 6 provides anadequate fit for the copolymer/LiClO4 (5 wt%) blend asdashed line.
Curve fitting shows two Gaussian peaks for C]O in MMAunit at 1730 and 1706 cm�1, as well as C]O in MAh unit at1786 and 1772 cm�1. The results of area fractions (A1, A2, A3
and A4) of peak obtained from the curve-fitting procedure are
H2C CH
C
CH3
OCH3
O
HC
O
CH
OO
8
Li+Li+
Li+Li+ Li+Li+
Fig. 8. The reversible interaction betw
displayed in Table 2. The following equation can be used todetermine the absorptivity coefficient of C]O in copolymer.
a¼ ðA1þA3Þ �F3
ðA2þA4Þ � ðF1þF2 �F3Þð4Þ
where a is the absorptivity coefficient of C]O group in copoly-mer. A1 and A2 represent the area fractions of free and bondedC]O in MMA units, respectively; A3 and A4 represent thearea fractions of free and bonded C]O in MAh units, respec-tively. F1 and F2 represent the equivalent fractions of C]O inMMA and MAh, respectively. F3 represents the equivalentfraction of Liþ. The calculated equivalent fractions (F1, F2
and F3) are also displayed in Table 2.The absorptivity coefficient a of C]O group in copolymer
was calculated for copolymer/LiClO4 blends with low lithiumsalt concentration. It is reasonable to assume that only simpleinteraction between lithium ion and C]O group is presentedand obeys Beer’s law in low lithium salt concentration blends.So according to Eq. (4), the absorptivity coefficient a deter-mined from the 1 and 3% lithium salt blends is given in Table2. The average value of absorptivity coefficient of copolymer/LiClO4 is 0.756, which implies that the absorptivity sensitivityof the lithium-ion bonded C]O at 1706 and 1772 cm�1 islarger than that of free C]O at 1730 and 1786 cm�1.
Table 2 also summarizes the curve-fitting results of absor-bance area fractions of free and bonded C]O group inMMA and MAh units of copolymer with varying lithiumsalt content from 5 to 40 wt%. The equivalent fraction of
H2C CH
C
CH3
OCH3
O
HC
O
CH
OO
8
Li+ Li+
Li++Li Li+
Li+
een C]O in copolymer and Liþ.
1900 1850 1800 1750 1700
50wt%40wt%30wt%20wt%
10wt%
5wt%
4wt%
3wt%
1wt%
wavenumber / cm-1
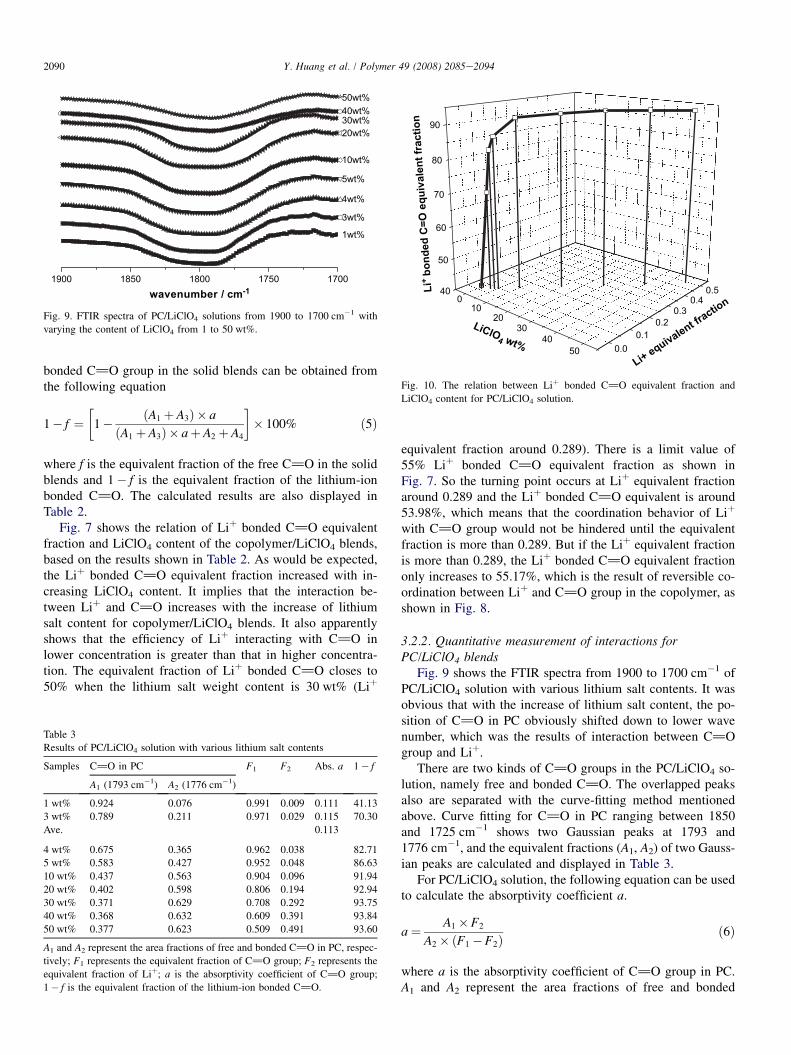
Fig. 9. FTIR spectra of PC/LiClO4 solutions from 1900 to 1700 cm�1 with
varying the content of LiClO4 from 1 to 50 wt%.
010
2030
4050
40
50
60
70
80
90
0.00.1
0.20.3
0.40.5L
i+ b
on
ded
C
=O
eq
uivalen
t fractio
n
Li+
equiv
ale
nt fr
action
LiClO
4 wt%
Fig. 10. The relation between Liþ bonded C]O equivalent fraction and
LiClO4 content for PC/LiClO4 solution.
2090 Y. Huang et al. / Polymer 49 (2008) 2085e2094
bonded C]O group in the solid blends can be obtained fromthe following equation
1� f ¼�
1� ðA1þA3Þ � a
ðA1þA3Þ � aþA2 þA4
�� 100% ð5Þ
where f is the equivalent fraction of the free C]O in the solidblends and 1� f is the equivalent fraction of the lithium-ionbonded C]O. The calculated results are also displayed inTable 2.
Fig. 7 shows the relation of Liþ bonded C]O equivalentfraction and LiClO4 content of the copolymer/LiClO4 blends,based on the results shown in Table 2. As would be expected,the Liþ bonded C]O equivalent fraction increased with in-creasing LiClO4 content. It implies that the interaction be-tween Liþ and C]O increases with the increase of lithiumsalt content for copolymer/LiClO4 blends. It also apparentlyshows that the efficiency of Liþ interacting with C]O inlower concentration is greater than that in higher concentra-tion. The equivalent fraction of Liþ bonded C]O closes to50% when the lithium salt weight content is 30 wt% (Liþ
Table 3
Results of PC/LiClO4 solution with various lithium salt contents
Samples C]O in PC F1 F2 Abs. a 1� f
A1 (1793 cm�1) A2 (1776 cm�1)
1 wt% 0.924 0.076 0.991 0.009 0.111 41.13
3 wt% 0.789 0.211 0.971 0.029 0.115 70.30
Ave. 0.113
4 wt% 0.675 0.365 0.962 0.038 82.71
5 wt% 0.583 0.427 0.952 0.048 86.63
10 wt% 0.437 0.563 0.904 0.096 91.94
20 wt% 0.402 0.598 0.806 0.194 92.94
30 wt% 0.371 0.629 0.708 0.292 93.75
40 wt% 0.368 0.632 0.609 0.391 93.84
50 wt% 0.377 0.623 0.509 0.491 93.60
A1 and A2 represent the area fractions of free and bonded C]O in PC, respec-
tively; F1 represents the equivalent fraction of C]O group; F2 represents the
equivalent fraction of Liþ; a is the absorptivity coefficient of C]O group;
1� f is the equivalent fraction of the lithium-ion bonded C]O.
equivalent fraction around 0.289). There is a limit value of55% Liþ bonded C]O equivalent fraction as shown inFig. 7. So the turning point occurs at Liþ equivalent fractionaround 0.289 and the Liþ bonded C]O equivalent is around53.98%, which means that the coordination behavior of Liþ
with C]O group would not be hindered until the equivalentfraction is more than 0.289. But if the Liþ equivalent fractionis more than 0.289, the Liþ bonded C]O equivalent fractiononly increases to 55.17%, which is the result of reversible co-ordination between Liþ and C]O group in the copolymer, asshown in Fig. 8.
3.2.2. Quantitative measurement of interactions forPC/LiClO4 blends
Fig. 9 shows the FTIR spectra from 1900 to 1700 cm�1 ofPC/LiClO4 solution with various lithium salt contents. It wasobvious that with the increase of lithium salt content, the po-sition of C]O in PC obviously shifted down to lower wavenumber, which was the results of interaction between C]Ogroup and Liþ.
There are two kinds of C]O groups in the PC/LiClO4 so-lution, namely free and bonded C]O. The overlapped peaksalso are separated with the curve-fitting method mentionedabove. Curve fitting for C]O in PC ranging between 1850and 1725 cm�1 shows two Gaussian peaks at 1793 and1776 cm�1, and the equivalent fractions (A1, A2) of two Gauss-ian peaks are calculated and displayed in Table 3.
For PC/LiClO4 solution, the following equation can be usedto calculate the absorptivity coefficient a.
a¼ A1�F2
A2� ðF1 �F2Þð6Þ
where a is the absorptivity coefficient of C]O group in PC.A1 and A2 represent the area fractions of free and bonded
Li+C=O
O
O
H2C
HC
CH3
C
O
OO
CH2CH
CH3
COO
O
CH2
CH
CH3
C
O
O O
H2C CH
CH3
CO
O
O
CH2
CH CH3
C
O
O
O CH2
CH
CH3
Li+C=O
O
O
H2C
HC
C
O
OO
CH2CH
CH3
COO
O
CH2
CH
CH3
C
O
O O
H2C CH
CH3
CO
O
O
CH2
CH CH3
C
O
O
OCH2
CH
CH3
CH3
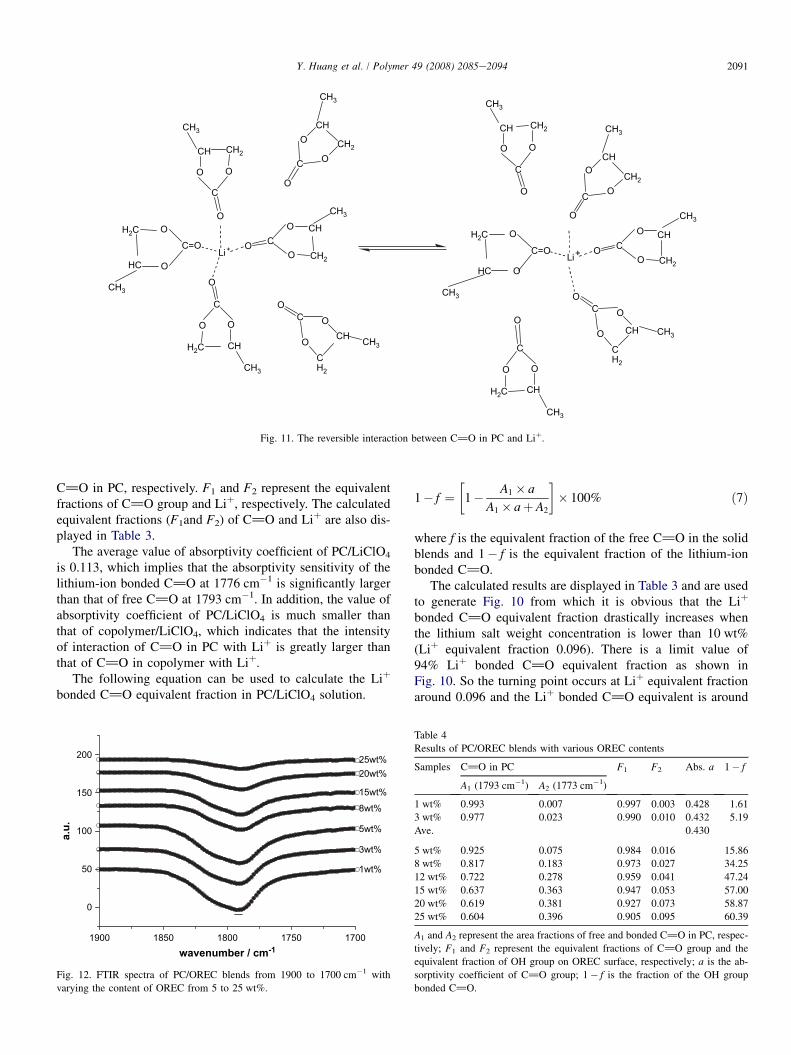
Fig. 11. The reversible interaction between C]O in PC and Liþ.
2091Y. Huang et al. / Polymer 49 (2008) 2085e2094
C]O in PC, respectively. F1 and F2 represent the equivalentfractions of C]O group and Liþ, respectively. The calculatedequivalent fractions (F1and F2) of C]O and Liþ are also dis-played in Table 3.
The average value of absorptivity coefficient of PC/LiClO4
is 0.113, which implies that the absorptivity sensitivity of thelithium-ion bonded C]O at 1776 cm�1 is significantly largerthan that of free C]O at 1793 cm�1. In addition, the value ofabsorptivity coefficient of PC/LiClO4 is much smaller thanthat of copolymer/LiClO4, which indicates that the intensityof interaction of C]O in PC with Liþ is greatly larger thanthat of C]O in copolymer with Liþ.
The following equation can be used to calculate the Liþ
bonded C]O equivalent fraction in PC/LiClO4 solution.
1900 1850 1800 1750 1700
0
50
100
150
200 25wt%20wt%
15wt%
8wt%
5wt%
3wt%
1wt%
a.u
.
wavenumber / cm-1
Fig. 12. FTIR spectra of PC/OREC blends from 1900 to 1700 cm�1 with
varying the content of OREC from 5 to 25 wt%.
1� f ¼�
1� A1 � a
A1� aþA2
�� 100% ð7Þ
where f is the equivalent fraction of the free C]O in the solidblends and 1� f is the equivalent fraction of the lithium-ionbonded C]O.
The calculated results are displayed in Table 3 and are usedto generate Fig. 10 from which it is obvious that the Liþ
bonded C]O equivalent fraction drastically increases whenthe lithium salt weight concentration is lower than 10 wt%(Liþ equivalent fraction 0.096). There is a limit value of94% Liþ bonded C]O equivalent fraction as shown inFig. 10. So the turning point occurs at Liþ equivalent fractionaround 0.096 and the Liþ bonded C]O equivalent is around
Table 4
Results of PC/OREC blends with various OREC contents
Samples C]O in PC F1 F2 Abs. a 1� f
A1 (1793 cm�1) A2 (1773 cm�1)
1 wt% 0.993 0.007 0.997 0.003 0.428 1.61
3 wt% 0.977 0.023 0.990 0.010 0.432 5.19
Ave. 0.430
5 wt% 0.925 0.075 0.984 0.016 15.86
8 wt% 0.817 0.183 0.973 0.027 34.25
12 wt% 0.722 0.278 0.959 0.041 47.24
15 wt% 0.637 0.363 0.947 0.053 57.00
20 wt% 0.619 0.381 0.927 0.073 58.87
25 wt% 0.604 0.396 0.905 0.095 60.39
A1 and A2 represent the area fractions of free and bonded C]O in PC, respec-
tively; F1 and F2 represent the equivalent fractions of C]O group and the
equivalent fraction of OH group on OREC surface, respectively; a is the ab-
sorptivity coefficient of C]O group; 1� f is the fraction of the OH group
bonded C]O.
05
1015
2025
0
10
20
30
40
50
60
0.000.02
0.040.06
0.080.10O
H b
on
ded
C
=O
eq
uivalen
t fractio
n
OH
equiv
ale
nt fr
action
OR
EC w
t%
Fig. 13. The relation between OH bonded C]O equivalent fraction and OREC
content for PC/OREC blends.
Si
O O O
O
Si
OO
Si
OO
O O
C
O
OO
CH2CH
CH3
C
O
OO
CH2CH
CH3
H H H
Fig. 14. The reversible interaction between C
1850 1800 1750 1700 1650
13wt%
10wt%
8wt%
5wt%
3wt%
1wt%
wavenumber / cm-1
Fig. 15. FTIR spectra of copolymer/OREC blends from 1850 to 1650 cm�1
with varying the content of OREC from 1 to 13 wt%.
2092 Y. Huang et al. / Polymer 49 (2008) 2085e2094
91.94%, which means that the coordination behavior of Liþ
with C]O group would not be hindered until the equivalentfraction is more than 0.096. But if the Liþ equivalent fractionis more than 0.096, the Liþ bonded C]O equivalent fractionincreases little, which is the result of strong coordination inter-action between Liþ and C]O group in PC, as shown inFig. 11.
3.2.3. Quantitative measurement of interactions forPC/OREC blends
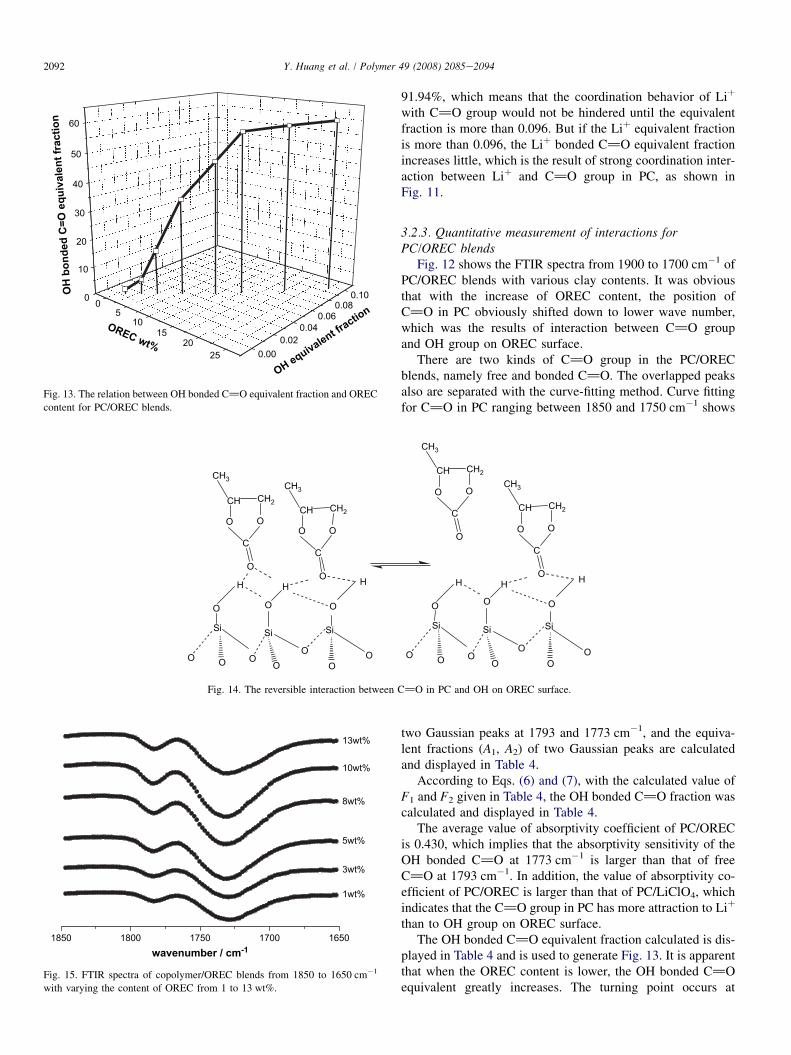
Fig. 12 shows the FTIR spectra from 1900 to 1700 cm�1 ofPC/OREC blends with various clay contents. It was obviousthat with the increase of OREC content, the position ofC]O in PC obviously shifted down to lower wave number,which was the results of interaction between C]O groupand OH group on OREC surface.
There are two kinds of C]O group in the PC/ORECblends, namely free and bonded C]O. The overlapped peaksalso are separated with the curve-fitting method. Curve fittingfor C]O in PC ranging between 1850 and 1750 cm�1 shows
Si
O O O
O
Si
OO
Si
OO
O O
C
O
OO
CH2CH
CH3
C
O
OO
CH2CH
CH3
H H H
]O in PC and OH on OREC surface.
two Gaussian peaks at 1793 and 1773 cm�1, and the equiva-lent fractions (A1, A2) of two Gaussian peaks are calculatedand displayed in Table 4.
According to Eqs. (6) and (7), with the calculated value ofF1 and F2 given in Table 4, the OH bonded C]O fraction wascalculated and displayed in Table 4.
The average value of absorptivity coefficient of PC/ORECis 0.430, which implies that the absorptivity sensitivity of theOH bonded C]O at 1773 cm�1 is larger than that of freeC]O at 1793 cm�1. In addition, the value of absorptivity co-efficient of PC/OREC is larger than that of PC/LiClO4, whichindicates that the C]O group in PC has more attraction to Liþ
than to OH group on OREC surface.The OH bonded C]O equivalent fraction calculated is dis-
played in Table 4 and is used to generate Fig. 13. It is apparentthat when the OREC content is lower, the OH bonded C]Oequivalent greatly increases. The turning point occurs at
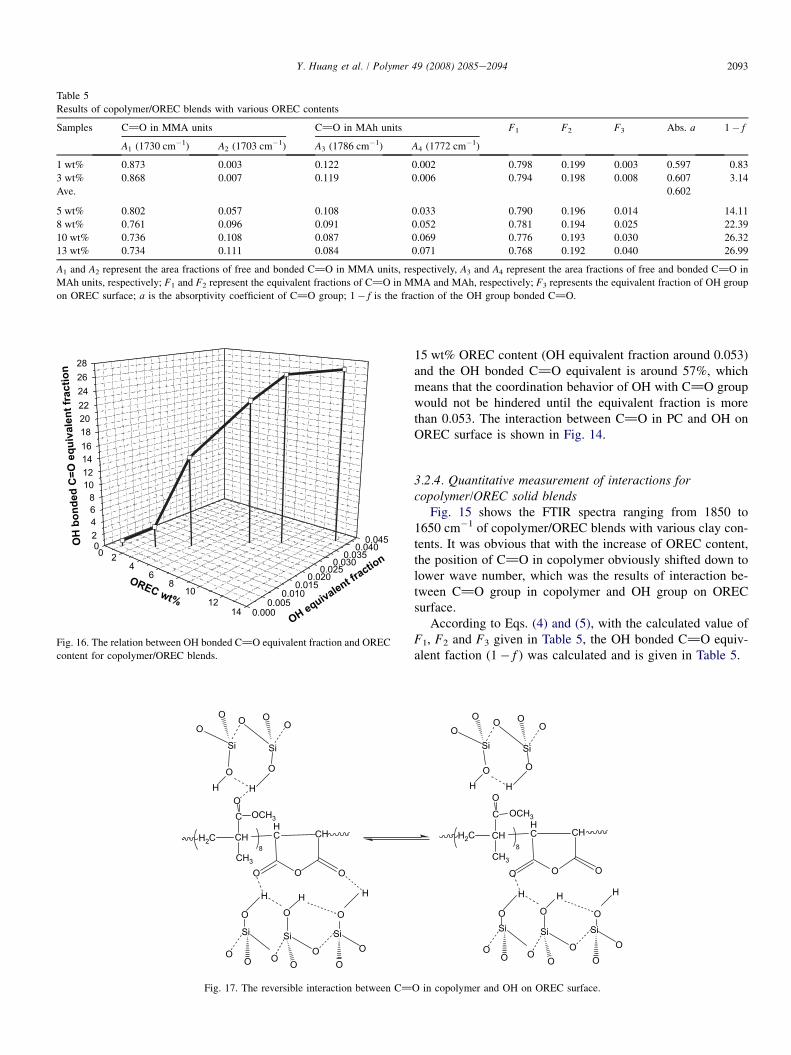
Table 5
Results of copolymer/OREC blends with various OREC contents
Samples C]O in MMA units C]O in MAh units F1 F2 F3 Abs. a 1� f
A1 (1730 cm�1) A2 (1703 cm�1) A3 (1786 cm�1) A4 (1772 cm�1)
1 wt% 0.873 0.003 0.122 0.002 0.798 0.199 0.003 0.597 0.83
3 wt% 0.868 0.007 0.119 0.006 0.794 0.198 0.008 0.607 3.14
Ave. 0.602
5 wt% 0.802 0.057 0.108 0.033 0.790 0.196 0.014 14.11
8 wt% 0.761 0.096 0.091 0.052 0.781 0.194 0.025 22.39
10 wt% 0.736 0.108 0.087 0.069 0.776 0.193 0.030 26.32
13 wt% 0.734 0.111 0.084 0.071 0.768 0.192 0.040 26.99
A1 and A2 represent the area fractions of free and bonded C]O in MMA units, respectively, A3 and A4 represent the area fractions of free and bonded C]O in
MAh units, respectively; F1 and F2 represent the equivalent fractions of C]O in MMA and MAh, respectively; F3 represents the equivalent fraction of OH group
on OREC surface; a is the absorptivity coefficient of C]O group; 1� f is the fraction of the OH group bonded C]O.
00 2
46
810
1214
2468
10121416182022242628
0.0000.005
0.0100.015
0.0200.025
0.0300.035
0.0400.045O
H b
on
ded
C
=O
eq
uivalen
t fractio
n
OH
equiv
ale
nt fr
action
OR
EC w
t%
Fig. 16. The relation between OH bonded C]O equivalent fraction and OREC
content for copolymer/OREC blends.
H2C CH
C
CH3
OCH3
O
HC
O
CH
OO
8
Si
OO O
O
Si
OO
Si
O
O
O O
H H H
Si
OOO
O
Si
OO
O
HH
Fig. 17. The reversible interaction between C]
2093Y. Huang et al. / Polymer 49 (2008) 2085e2094
15 wt% OREC content (OH equivalent fraction around 0.053)and the OH bonded C]O equivalent is around 57%, whichmeans that the coordination behavior of OH with C]O groupwould not be hindered until the equivalent fraction is morethan 0.053. The interaction between C]O in PC and OH onOREC surface is shown in Fig. 14.
3.2.4. Quantitative measurement of interactions forcopolymer/OREC solid blends
Fig. 15 shows the FTIR spectra ranging from 1850 to1650 cm�1 of copolymer/OREC blends with various clay con-tents. It was obvious that with the increase of OREC content,the position of C]O in copolymer obviously shifted down tolower wave number, which was the results of interaction be-tween C]O group in copolymer and OH group on ORECsurface.
According to Eqs. (4) and (5), with the calculated value ofF1, F2 and F3 given in Table 5, the OH bonded C]O equiv-alent faction (1� f ) was calculated and is given in Table 5.
H2C CH
C
CH3
OCH3
O
HC
O
CH
OO
8
Si
OO O
O
Si
OO
Si
OO
O O
H H H
Si
OOO
O
Si
OO
O
HH
O in copolymer and OH on OREC surface.
2094 Y. Huang et al. / Polymer 49 (2008) 2085e2094
The average value of absorptivity coefficient of copolymer/OREC is 0.602, which implies that the absorptivity sensitivityof the OH bonded C]O at 1703 and 1772 cm�1 is signifi-cantly larger than that of free C]O at 1730 and 1786 cm�1.
In addition, the value of absorptivity coefficient of PC/OREC is smaller than that of copolymer/OREC, which indi-cates that the stretching absorption of OH bonded C]O inPC is more sensitive than that of OH bonded C]O in copoly-mer, that is to say, the OH group on OREC surface is easier tointact with C]O in PC than to do with C]O in copolymer.
The relation between the calculated OH bonded C]Oequivalent fraction and the OREC added content is shown inFig. 16. It is apparent that when the OREC content is lower,the OH bonded C]O equivalent is greatly increases. The turn-ing point occurs at 10 wt% OREC content (OH equivalent frac-tion around 0.030) and the OH bonded C]O equivalent isaround 26%, which means that the coordination behavior ofOH with C]O group would not be hindered until the equiva-lent fraction is more than 0.030. The interaction between C]Oin copolymer and OH on OREC surface is shown in Fig. 17.
4. Conclusions
The copolymer of P(MMA-MAh) was successfully synthe-sized. The molar ratio of monomers of copolymer was foundto be 1MAh:8MMA, while the molecular weight of copolymerwas in the order 104 (g/mol).
Analysis of FTIR indicates that there is an interaction ofC]O in PC and copolymer with Liþ and OH group onOREC surface. The absorptivity coefficient a of copolymer/LiClO4, PC/LiClO4, PC/OREC and copolymer/OREC is0.756, 0.113, 0.430 and 0.602, respectively, which meansthat the Liþ or OH bonded C]O is more sensitive than freeC]O. In addition, the limit value of bonded C]O equivalentfraction (1� f ) of copolymer/LiClO4, PC/LiClO4, PC/ORECand copolymer/OREC is 55, 94, 57 and 26%, which impliesthat all the interaction within the components is reversibleand the intensity of interaction is ordered as PC/LiClO4, PC/OREC, copolymer/OREC and copolymer/LiClO4. So the polargroup of C]O in PC and copolymer can promote the higher‘‘dissolve’’ efficiency of lithium and increase the amount ofLiþ within the GPE system. The strong interaction betweenC]O in PC and OH on OREC surface can improve the sol-vent maintenance, and at the same time, the interaction ofC]O in copolymer and OH on OREC is favorable for thedispersion of clay in GPE system.
Acknowledgements
The authors gratefully acknowledge the financial supportfrom the Nature Science Foundation of Shaanxi (2005B23),the National Nature Science Foundation (20674062) andNew Century Excellent Talents in University (NCET-06-0880).
References
[1] Croce F, Gerace F, Dautzemberg G, Passerini S, Appetecchi GB,
Scrosati B. Electrochim Acta 1993;39:2190.
[2] Kim HS, Shin JH, Moon SI, Kim SP. Electrochim Acta 2003;48:1575.
[3] Yang MJ, Li WL, Wang GG, Zhang JQ. Solid State Ionics
2005;176:2831.
[4] Jiang J, Gao D, Li ZH, Su GY. React Funct Polym 2006;66:1144.
[5] Rajendran S, Kannan R, Mahendran O. Mater Lett 2001;49:176.
[6] Caravanier MC, Montigny BC, Lemordant D, Bosser G. Solid State
Ionics 2002;149:279.
[7] Cheng CL, Wan CC, Wang YY. J Power Sources 2004;134:206.
[8] Gentili V, Panero S, Reale P, Scrosati B. J Power Sources 2007;
170:188.
[9] Akbulut O, Taniguchi I, Kumar S, Horn YS, Mayes AM. Electrochim
Acta 2007;52:1986.
[10] Capunano F, Croce R, Scrosati B. J Electrochem Soc 1991;138:1919.
[11] Skaarup S, West K, Christiansen BZ. Solid State Ionics 1988;28e30:977.
[12] Wieczorek W, Florjaniczyk Z, Stevens JR. Electrochim Acta
1995;40:2255.
[13] Qiu WL, Ma XH, Yang QH, Fu YB, Zong XF. J Power Sources 2004;
138:248.
[14] Walls HJ, Riley MW, Singhal RR, Spontak RJ, Fedkiw PS, Khan SA.
Adv Funct Mater 2003;13:715.
[15] Mishra JK, Ryou JH, Kim GH, Hwang KJ, Ha CS. Mater Lett
2004;58:3483.
[16] Tager A. Physical chemistry of polymers. Moscow: Mir Pub; 1978.
[17] Cowie JMG, Ferguson R, McEwen IJ, Reid VMC. Polymer
1994;35:1475.
[18] Douglas JA, Hatsuo I. Polymer 2007;48:6763.
[19] Yu J, Wu PY. Polymer 2007;48:3477.
[20] Biswal D, Hilt JZ. Polymer 2006;47:7355.
[21] Sammon C, Li CM, Armes SP, Lewis AL. Polymer 2006;47:6123.
[22] Smith MR, Cooper SJ, Winter DJ, Everall N. Polymer 2006;47:5691.
[23] Ding XL, Fries D, Jun B. Polymer 2006;47:4718.
[24] Sammon C, Bajwa G, Timmins P, Melia CD. Polymer 2006;47:577.
[25] Wu HD, Wu ID, Chang FC. Polymer 2001;42:555.
[26] Wu HD, Wu SC, Chang FC. Polymer 2001;42:4719.
[27] Deepa M, Agnihotry SA, Gupta D, Chandra R. Electrochim Acta
2004;49:373.
[28] Wu ID, Chang FC. Polymer 2007;48:989e96.
[29] Digar M, Hung SL, Wang HL, Wen TC, Gopalan A. Polymer
2002;43:685.
[30] Huang Y, Ma XY, Liang GZ, Yan HX. Chem Eng J 2007. doi:10.1016/
j.cej.2007.10.009.


![PARTS CATALOG - OREC CO.,LTD. ]](https://img.pdfslide.us/doc/110x75/627ccd698a9e7904c867ae55/parts-catalog-orec-coltd-.jpg)


![PubTeX output 2007.07.04:1704 - OREC CO.,LTD. ]](https://img.pdfslide.us/doc/110x75/61dbf1af65c3171bf5703151/pubtex-output-200707041704-orec-coltd-.jpg)