Embed Size (px)
Citation preview
© 2019. Boin & Tri. This is a research/review paper, distributed under the terms of the Creative Commons Attribution-Noncommercial 3.0 Unported License http://creativecommons.org/licenses/by-nc/3.0/), permitting all non-commercial use, distribution, and reproduction in any medium, provided the original work is properly cited.
Global Journal of Management and Business Research: A Administration and Management
Type: Double Blind Peer Reviewed International Research Journal Publisher: Global Journals
Online ISSN: 2249-4588 & Print ISSN: 0975-5853
Analysis of the Influential Factors on the Performance of the Civil Service Police Unit in Pulogadung District, East Jakarta
By Boin & Tri Respati Indonesia University
Abstract- This study intends to examine the factors that influence the performance of the civil service police unit. This research approach is descriptive associative with sampling using a census. Sampling was carried out at the Pramong Praja Police in the Pulo Gadung District of East Jakarta. The method of data analysis uses Structural Equation Modeling - Partial Least Square (SEM-PLS) using Smart PLS software version 3. The test results show human resources, facilities, and communication have a positive and insignificant effect on the performance of the Civil Service Police Unit.
Index Terms: performance, public sector.
GJMBR-A Classification: JEL Code: D73
AnalysisoftheInfluentialFactorsonthePerformanceoftheCivilServicePoliceUnitinPulogadungDistrictEastJakarta
Strictly as per the compliance and regulations of:
Volume 19 Issue 2 Version 1.0 Year 2019
Analysis of the Influential Factors on the Performance of the Civil Service Police Unit in
Pulogadung District, East Jakarta Boin α & Tri σ
Abstract - This study intends to examine the factors that influence the performance of the civil service police unit. This research approach is descriptive associative with sampling using a census. Sampling was carried out at the Pramong Praja Police in the Pulo Gadung District of East Jakarta. The method of data analysis uses Structural Equation Modeling - Partial Least Square (SEM-PLS) using Smart PLS software version 3. The test results show human resources, facilities, and communication have a positive and insignificant effect on the performance of the Civil Service Police Unit. Index Terms: performance, public sector.
I. Introduction
neven development between cities and villages in Indonesia so far has given rise to the formal sector and the informal sector in economic
activities. The movement of population from village to city has become a very prominent symptom in Indonesia which ultimately has various impacts on the region concerned, both positive and negative impacts that must be faced. Some of the activities of the population movement can be accommodated in the economic activities of the formal sector; on the other hand some of the residents who are not accommodated without the skills needed by a region have created a form of informal activities to sustain their lives.
Some of those who are not accommodated in formal sector activities try to enter the informal sector activities, where this sector is very easy for anyone to enter without the skills indicated. The informal sector is mostly entered by the lower classes, namely those who are not accommodated in the formal sector and those who avoid the domination of the capitalists who have mastered the macro economy. Informal sector activities play a role in accommodating the workforce that is not accommodated in the formal sector. The sector enters the informal sector because there is no term contract employment long as in the formal sector so that the labor force mobility in the informal sector is high. This is one of the main factors that makes it easy for workers to enter this sector. Indonesia experienced the 1997 Author α σ: Business Administration Science, Respati Indonesia University, Indonesia. e-mails: [email protected], [email protected]
economic crisis which affected national and regional economic stability. The efforts made by the Regional Government of Pulogadung District in East Jakarta in dealing with the problem of violation of order, comfort and tranquility of the city are with street vendor (PKL) control activities, namely the issuance of the Provincial Regulation of the Special Capital Region of Jakarta Number 8 of 2007 concerning Public Order. Have tried to suppress the violation of order that was carried out by the street vendors with these regulations but still there was still a violation of order. Order violations carried out by the Kender Market PKL include violations of selling hours, selling area violations, violations of building establishment, cleanliness violations and violations related to the aesthetics and neatness of the city. Authority regarding the issue of Street Vendor Control (PKL) in East Jakarta Administrative City has been delegated to the DKI Jakarta Civil Service Police Unit (SATPOL PP), in accordance with Government Regulation Number 6 of 2010 concerning the Civil Service Police Unit, that the Civil Service Police Unit headed by a Head and domiciled under and responsible to the Regional Head through the Regional Secretary. The performance description of the SATPOL PP Unit in Pulogadung Sub-district, East Jakarta, can generally be seen from the activities of the SATPOL PP Unit which is serious in carrying out control activities against street vendors' acts. One example of a street vendor in East Jakarta City occupying public space as a place of business. The focus of the performance discussion specifically in this regard is the work done by the SATPOL PP Unit in Pulogadung Sub-District, East Jakarta in its efforts to curb street vendors in the Klender Market who occupy public space as business land, pay more attention to control activities and minimize
U
© 2019 Global Journals
23
Globa
l Jo
urna
l of M
anag
emen
t an
d Bu
siness Resea
rch
Volum
e X
IX Issu
e II
Ver
sion
IYe
ar
20
19(
)A
violations of order. There are 93 traders in Pasar Klender in 2016. Violations that have occurred so far have received an active response from the SATPOL PP Unit, but in reality these violations still occur, including PKL occupying public spaces, building permanent buildings, unsuitable selling hours. Rules. This is certainly the duty
II. Methods
This study is a quantitative study with an associative descriptive research approach, the purpose of descriptive research is to describe the object of research or research results while the purpose of associative research is to find out the relationship between two variables or more (Sugiyono, 2014). The population in this study was 38 SATPOL PP District Pulogadung. The data collection method that will be used in this study is structured interviews using a personal questionnaire. Questionnaire is a technique of data collection conducted by giving a set of questions or written statements to the respondent to answer (Sugiyono, 2014: 162). The statement presented in this questionnaire is a closed statement. Closed statements are made using an interval scale. The interval scale used in this study is the Likert scale, which is used to measure attitudes, opinions, and perceptions of a person or group of people about social phenomena (Sugiyono, 2004). The following is an overview of the score or score on the research questionnaire question.
Table 1: Likert Scale
1 Strongly Agree 4 2 Agree 3 3 Disagree 2 4 Strongly Disagree 1
A quantitative study that uses data collection techniques using questionnaires, it must do a validity test. The test was tried on a sample of the population taken, the members used were 38 respondents. Validity test aims to determine whether the questionnaire used is really valid to measure the variables under study. If the Pearson correlations test results have an asterisk.
a) Validity test
i. Test HR factor variable validity
Table 2: HR Factor Validity
ii. Test the validity of facilities and infrastructure variables
Table 3: Facility Factor Validity
iii. Test the validity of communication factor variables
Table 4: Validity of Communication Factors
iv. Test the effectiveness of variable validity
Table 5: Validity of Effectiveness
© 2019 Global Journals1
24
Globa
l Jo
urna
l of M
anag
emen
t an
d Bu
siness Resea
rch
Volum
e X
IX Issu
e II
Ver
sion
IYe
ar
20
19(
)A
Analysis of the Influential Factors on the Performance of the Civil Service Police Unit in Pulogadung District, East Jakarta
Source: SPSS, 2018
Source: Sugiyono, 2010
Source: SPSS, 2018
Source: SPSS, 2018
Source: SPSS, 2018
of the Pulo Gadung Sub district Unit of the SATPOL PP in East Jakarta to regulate it by increasing organizational performance. Seeing that the street vendors are not maximized by the Civil Service Police Unit (SATPOL PP) in Pulogadung Sub-District, East Jakarta, the authors concern the factors that affect the performance of the Civil Service Police Unit (SATPOL PP) in Pulogadung District, East Jakarta in controlling street vendors in Klender Market.
No. Answer Score Category Score
No. ItemPearson
CorrelationDescription
1. SDM.1 0.452** Valid2. SDM.2 0.722** Valid3. SDM.3 0.545** Valid4. SDM.4 0.738** Valid5. SDM.5 0.715** Valid6. SDM.6 0.864** Valid7. SDM.7 0.864** Valid8. SDM.8 0.840** Valid9. SDM.9 0.815** Valid10 SDM.10 0.573** Valid
No. ItemPearson
CorrelationDescription
1. SP.1 0.845** Valid2. SP.2 0.821** Valid3. SP.3 0.367* Valid4. SP.4 0.821** Valid5. SP.5 0.861** Valid6. SP.6 0.638** Valid7. SP.7 0.626** Valid8. SP.1 0.845** Valid
No. ItemPearson
CorrelationDescription
1. K.1 0.776** Valid2. K.2 0.705** Valid3. K.3 0.736** Valid4. K.4 0.598** Valid
No. ItemPearson
CorrelationDescription
1. EF.1 0.555** Valid2. EF.2 0.601** Valid3. EF.3 0.809** Valid4. EF.4 0.712** Valid
v. Test the validity of variable alertness (responsiveness)
Table 6: Validity of alertness (responsiveness)
vi. Test the variable validity of responsibility (responsibility)
Table 7: Validity of Responsibility (responsibility)
vii. Test the validity of sustainability variables (accountability)
Table 8: Sustainability (accountability) Responsibility (responsibility)
b) Reliability Test Reliability is an index that shows the extent to
which a measuring device can be trusted or reliable (Ancok: 140-141). Reliability test is used to measure whether a respondent's answer is consistent or stable over time (Sugiyono, 2004). Instrument score assessment criteria in reliability coefficient or Cronbach Alpha test is 0.60 or more, then the indicators in the instrument are declared reliable (reliable).
Table 9: Test of Reliability
No. Item Value Description
1 HR Factor 0.893 Reliable
2 Factors of facilities and infrastructure 0.846 Reliable
3 Communication Factors 0,656 Reliable
4 Effectiveness 0,646 Reliable
5 Alertness (responsiveness)
0,731 Reliable
6 Responsibility (responsibility)
0,777 Reliable
© 2019 Global Journals
25
Globa
l Jo
urna
l of M
anag
emen
t an
d Bu
siness Resea
rch
Volum
e X
IX Issu
e II
Ver
sion
IYe
ar
20
19(
)A
Analysis of the Influential Factors on the Performance of the Civil Service Police Unit in Pulogadung District, East Jakarta
Source: SPSS, 2018
Source: SPSS, 2018
Source: SPSS, 2018
Source: SPSS, 2018
c) Data analysisAccording to Sugiyono (2014) what is meant by
data analysis is as follows: "Data analysis is a process of
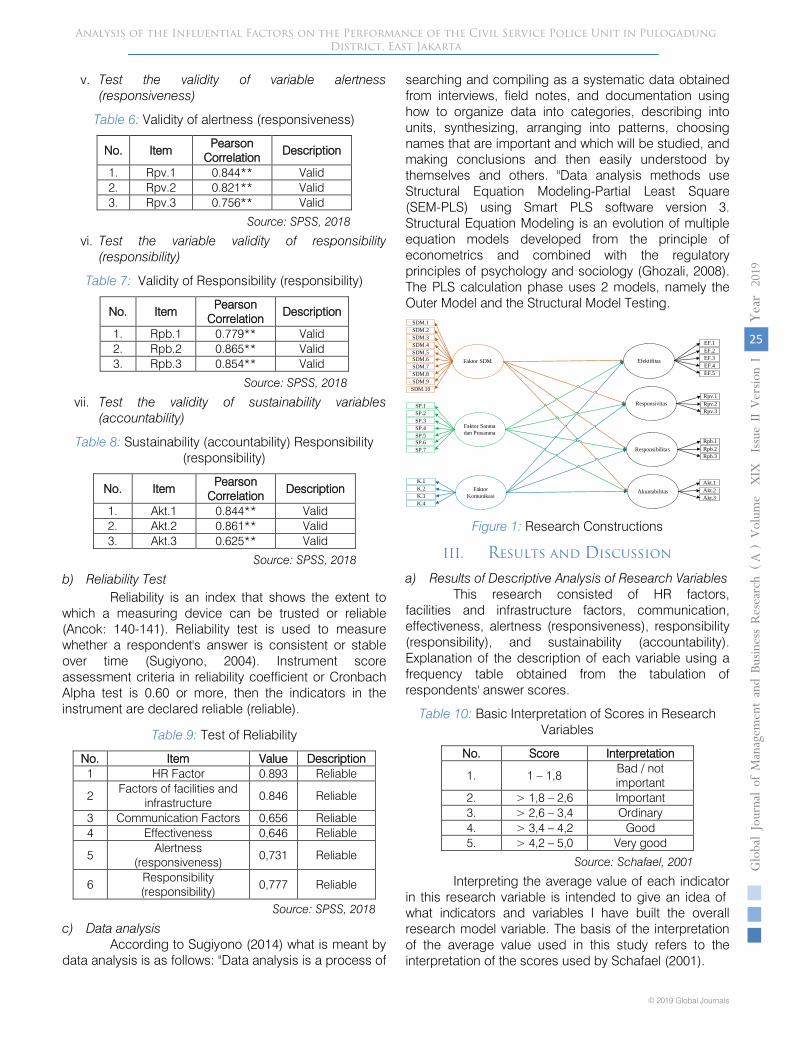
searching and compiling as a systematic data obtained from interviews, field notes, and documentation using how to organize data into categories, describing into units, synthesizing, arranging into patterns, choosing names that are important and which will be studied, and making conclusions and then easily understood by themselves and others. "Data analysis methods use Structural Equation Modeling-Partial Least Square (SEM-PLS) using Smart PLS software version 3. Structural Equation Modeling is an evolution of multiple equation models developed from the principle of econometrics and combined with the regulatory principles of psychology and sociology (Ghozali, 2008). The PLS calculation phase uses 2 models, namely the Outer Model and the Structural Model Testing.
Faktor SDM
Faktor Sarana dan Prasarana
Faktor Komunikasi
Efektifitas
Responsivitas
Responsibilitas
Akuntabilitas
EF.1EF.2EF.3EF.4EF.5
Rpv.1Rpv.2Rpv.3
Rpb.1Rpb.2Rpb.3
Akt.1Akt.2Akt.3
SDM.1SDM.2SDM.3SDM.4SDM.5SDM.6SDM.7SDM.8SDM.9
SDM.10
SP.1SP.2SP.3SP.4SP.5SP.6SP.7
K.1K.2K.3K.4
Figure 1: Research Constructions
III. Results and Discussion
a) Results of Descriptive Analysis of Research VariablesThis research consisted of HR factors,
facilities and infrastructure factors, communication, effectiveness, alertness (responsiveness), responsibility (responsibility), and sustainability (accountability). Explanation of the description of each variable using a frequency table obtained from the tabulation of respondents' answer scores.
Table 10: Basic Interpretation of Scores in Research Variables
Source: Schafael, 2001
Interpreting the average value of each indicator in this research variable is intended to give an idea of what indicators and variables I have built the overall research model variable. The basis of the interpretation of the average value used in this study refers to the interpretation of the scores used by Schafael (2001).
No. ItemPearson
CorrelationDescription
1. Rpv.1 0.844** Valid2. Rpv.2 0.821** Valid3. Rpv.3 0.756** Valid
No. ItemPearson
CorrelationDescription
1. Rpb.1 0.779** Valid2. Rpb.2 0.865** Valid3. Rpb.3 0.854** Valid
No. ItemPearson
CorrelationDescription
1. Akt.1 0.844** Valid2. Akt.2 0.861** Valid3. Akt.3 0.625** Valid
No. Score Interpretation
1. 1 – 1,8Bad / not important
2. > 1,8 – 2,6 Important3. > 2,6 – 3,4 Ordinary4. > 3,4 – 4,2 Good5. > 4,2 – 5,0 Very good
© 2019 Global Journals1
26
Globa
l Jo
urna
l of M
anag
emen
t an
d Bu
siness Resea
rch
Volum
e X
IX Issu
e II
Ver
sion
IYe
ar
20
19(
)A
Analysis of the Influential Factors on the Performance of the Civil Service Police Unit in Pulogadung District, East Jakarta
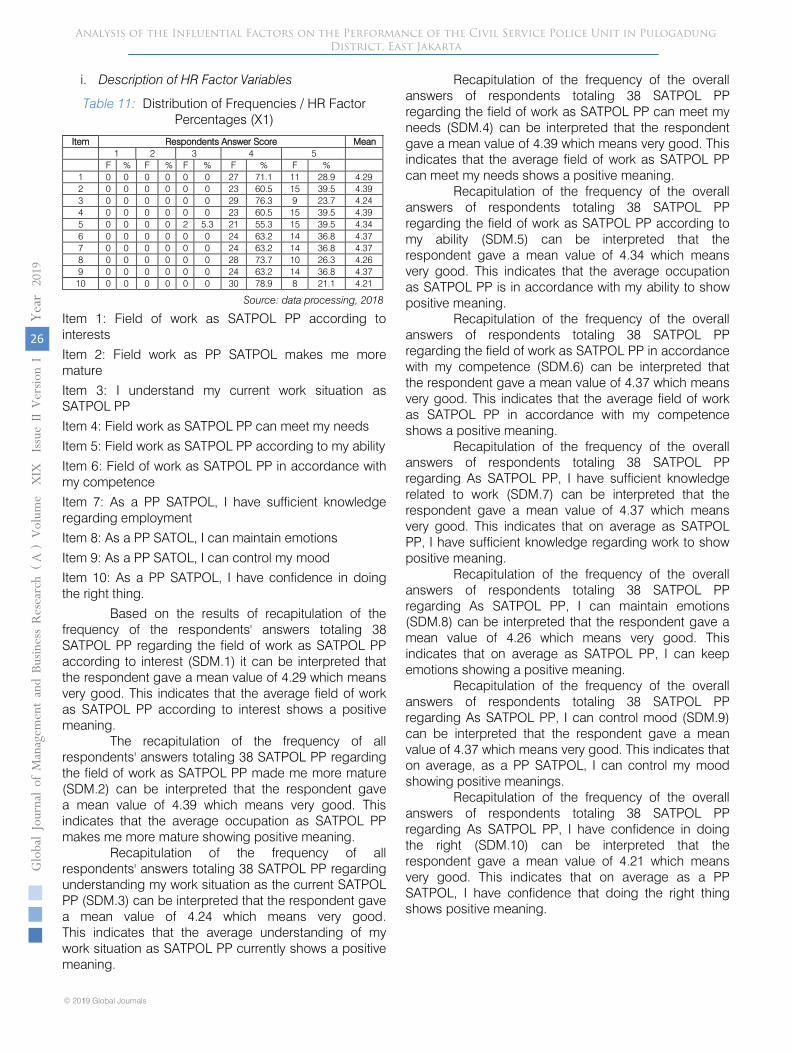
i. Description of HR Factor Variables
Table 11: Distribution of Frequencies / HR Factor Percentages (X1)
Item Respondents Answer Score Mean1 2 3 4 5
F % F % F % F % F %1 0 0 0 0 0 0 27 71.1 11 28.9 4.292 0 0 0 0 0 0 23 60.5 15 39.5 4.393 0 0 0 0 0 0 29 76.3 9 23.7 4.244 0 0 0 0 0 0 23 60.5 15 39.5 4.395 0 0 0 0 2 5.3 21 55.3 15 39.5 4.346 0 0 0 0 0 0 24 63.2 14 36.8 4.377 0 0 0 0 0 0 24 63.2 14 36.8 4.378 0 0 0 0 0 0 28 73.7 10 26.3 4.269 0 0 0 0 0 0 24 63.2 14 36.8 4.37
10 0 0 0 0 0 0 30 78.9 8 21.1 4.21
Source: data processing, 2018
Item 1: Field of work as SATPOL PP according to interests
Item 2: Field work as PP SATPOL makes me more mature
Item 3: I understand my current work situation as SATPOL PP
Item 4: Field work as SATPOL PP can meet my needs
Item 5: Field work as SATPOL PP according to my ability
Item 6: Field of work as SATPOL PP in accordance with my competence
Item 7: As a PP SATPOL, I have sufficient knowledge regarding employment
Item 8: As a PP SATOL, I can maintain emotions
Item 9: As a PP SATOL, I can control my moodItem 10: As a PP SATPOL, I have confidence in doing the right thing.
Based on the results of recapitulation of the frequency of the respondents' answers totaling 38 SATPOL PP regarding the field of work as SATPOL PP according to interest (SDM.1) it can be interpreted that the respondent gave a mean value of 4.29 which means very good. This indicates that the average field of work as SATPOL PP according to interest shows a positive meaning.
The recapitulation of the frequency of all respondents' answers totaling 38 SATPOL PP regarding the field of work as SATPOL PP made me more mature (SDM.2) can be interpreted that the respondent gave a mean value of 4.39 which means very good. This indicates that the average occupation as SATPOL PP makes me more mature showing positive meaning.
Recapitulation of the frequency of all respondents' answers totaling 38 SATPOL PP regarding understanding my work situation as the current SATPOL PP (SDM.3) can be interpreted that the respondent gave a mean value of 4.24 which means very good. This indicates that the average understanding of my work situation as SATPOL PP currently shows a positive meaning.
Recapitulation of the frequency of the overall answers of respondents totaling 38 SATPOL PP regarding the field of work as SATPOL PP can meet my needs (SDM.4) can be interpreted that the respondent gave a mean value of 4.39 which means very good. This indicates that the average field of work as SATPOL PP can meet my needs shows a positive meaning.
Recapitulation of the frequency of the overall answers of respondents totaling 38 SATPOL PP regarding the field of work as SATPOL PP according to my ability (SDM.5) can be interpreted that the respondent gave a mean value of 4.34 which means very good. This indicates that the average occupation as SATPOL PP is in accordance with my ability to show positive meaning.
Recapitulation of the frequency of the overall answers of respondents totaling 38 SATPOL PP regarding the field of work as SATPOL PP in accordance with my competence (SDM.6) can be interpreted that the respondent gave a mean value of 4.37 which means very good. This indicates that the average field of work as SATPOL PP in accordance with my competence shows a positive meaning.
Recapitulation of the frequency of the overall answers of respondents totaling 38 SATPOL PP regarding As SATPOL PP, I have sufficient knowledge related to work (SDM.7) can be interpreted that the respondent gave a mean value of 4.37 which means very good. This indicates that on average as SATPOL PP, I have sufficient knowledge regarding work to show positive meaning.
Recapitulation of the frequency of the overall answers of respondents totaling 38 SATPOL PP regarding As SATPOL PP, I can maintain emotions (SDM.8) can be interpreted that the respondent gave a mean value of 4.26 which means very good. This indicates that on average as SATPOL PP, I can keep emotions showing a positive meaning.
Recapitulation of the frequency of the overall answers of respondents totaling 38 SATPOL PP regarding As SATPOL PP, I can control mood (SDM.9) can be interpreted that the respondent gave a mean value of 4.37 which means very good. This indicates that on average, as a PP SATPOL, I can control my mood showing positive meanings.
Recapitulation of the frequency of the overall answers of respondents totaling 38 SATPOL PP regarding As SATPOL PP, I have confidence in doing the right (SDM.10) can be interpreted that the respondent gave a mean value of 4.21 which means very good. This indicates that on average as a PP SATPOL, I have confidence that doing the right thing shows positive meaning.
© 2019 Global Journals
27
Globa
l Jo
urna
l of M
anag
emen
t an
d Bu
siness Resea
rch
Volum
e X
IX Issu
e II
Ver
sion
IYe
ar
20
19(
)A
Analysis of the Influential Factors on the Performance of the Civil Service Police Unit in Pulogadung District, East Jakarta
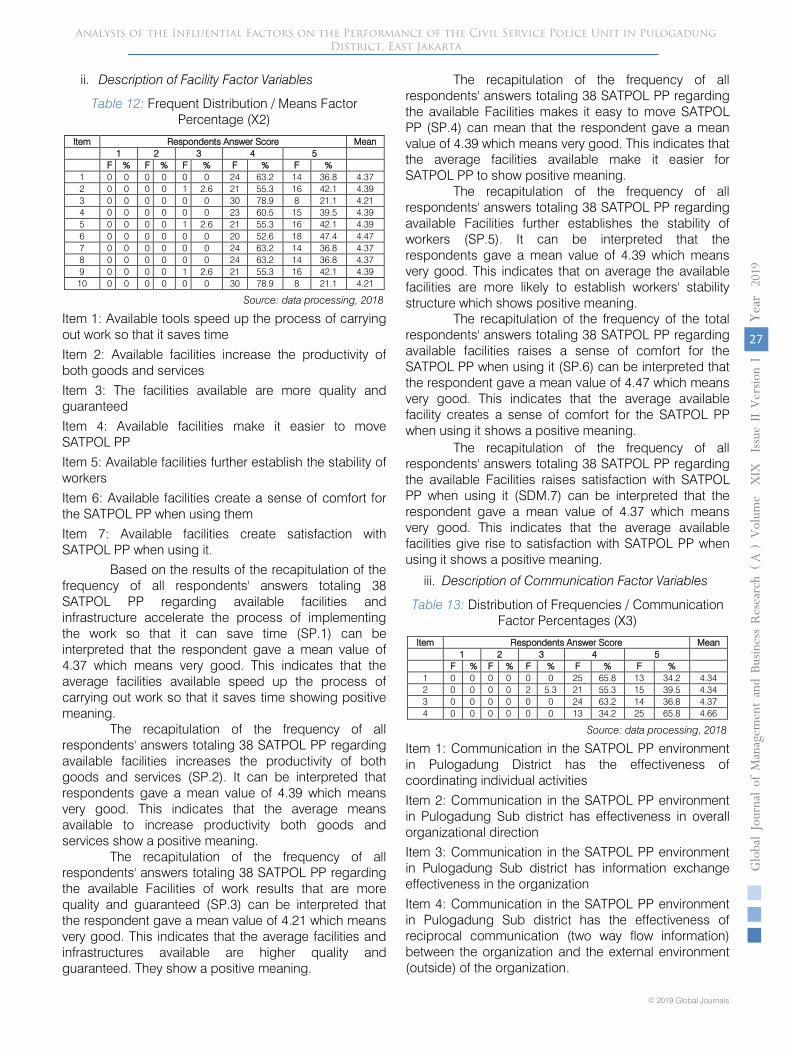
ii. Description of Facility Factor Variables
Table 12: Frequent Distribution / Means Factor Percentage (X2)
Item Respondents Answer Score Mean1 2 3 4 5
F % F % F % F % F %1 0 0 0 0 0 0 24 63.2 14 36.8 4.372 0 0 0 0 1 2.6 21 55.3 16 42.1 4.393 0 0 0 0 0 0 30 78.9 8 21.1 4.214 0 0 0 0 0 0 23 60.5 15 39.5 4.395 0 0 0 0 1 2.6 21 55.3 16 42.1 4.396 0 0 0 0 0 0 20 52.6 18 47.4 4.477 0 0 0 0 0 0 24 63.2 14 36.8 4.378 0 0 0 0 0 0 24 63.2 14 36.8 4.379 0 0 0 0 1 2.6 21 55.3 16 42.1 4.3910 0 0 0 0 0 0 30 78.9 8 21.1 4.21
Source: data processing, 2018
Item 1: Available tools speed up the process of carrying out work so that it saves time
Item 2: Available facilities increase the productivity of both goods and services
Item 3: The facilities available are more quality and guaranteed
Item 4: Available facilities make it easier to move SATPOL PP
Item 5: Available facilities further establish the stability of workers
Item 6: Available facilities create a sense of comfort for the SATPOL PP when using them
Item 7: Available facilities create satisfaction with SATPOL PP when using it.
Based on the results of the recapitulation of the frequency of all respondents' answers totaling 38 SATPOL PP regarding available facilities and infrastructure accelerate the process of implementing the work so that it can save time (SP.1) can be interpreted that the respondent gave a mean value of 4.37 which means very good. This indicates that the average facilities available speed up the process of carrying out work so that it saves time showing positive meaning.
The recapitulation of the frequency of all respondents' answers totaling 38 SATPOL PP regarding available facilities increases the productivity of both goods and services (SP.2). It can be interpreted that respondents gave a mean value of 4.39 which means very good. This indicates that the average means available to increase productivity both goods and services show a positive meaning.
The recapitulation of the frequency of all respondents' answers totaling 38 SATPOL PP regarding the available Facilities of work results that are more quality and guaranteed (SP.3) can be interpreted that the respondent gave a mean value of 4.21 which means very good. This indicates that the average facilities and infrastructures available are higher quality and guaranteed. They show a positive meaning.
The recapitulation of the frequency of all respondents' answers totaling 38 SATPOL PP regarding the available Facilities makes it easy to move SATPOL PP (SP.4) can mean that the respondent gave a mean value of 4.39 which means very good. This indicates that the average facilities available make it easier for SATPOL PP to show positive meaning.
The recapitulation of the frequency of all respondents' answers totaling 38 SATPOL PP regarding available Facilities further establishes the stability of workers (SP.5). It can be interpreted that the respondents gave a mean value of 4.39 which means very good. This indicates that on average the available facilities are more likely to establish workers' stability structure which shows positive meaning.
The recapitulation of the frequency of the total respondents' answers totaling 38 SATPOL PP regarding available facilities raises a sense of comfort for the SATPOL PP when using it (SP.6) can be interpreted that the respondent gave a mean value of 4.47 which means very good. This indicates that the average available facility creates a sense of comfort for the SATPOL PP when using it shows a positive meaning.
The recapitulation of the frequency of all respondents' answers totaling 38 SATPOL PP regarding the available Facilities raises satisfaction with SATPOL PP when using it (SDM.7) can be interpreted that the respondent gave a mean value of 4.37 which means very good. This indicates that the average available facilities give rise to satisfaction with SATPOL PP when using it shows a positive meaning.
iii. Description of Communication Factor Variables
Table 13: Distribution of Frequencies / Communication Factor Percentages (X3)
Item Respondents Answer Score Mean1 2 3 4 5
F % F % F % F % F %1 0 0 0 0 0 0 25 65.8 13 34.2 4.342 0 0 0 0 2 5.3 21 55.3 15 39.5 4.343 0 0 0 0 0 0 24 63.2 14 36.8 4.374 0 0 0 0 0 0 13 34.2 25 65.8 4.66
Source: data processing, 2018
Item 1: Communication in the SATPOL PP environment in Pulogadung District has the effectiveness of coordinating individual activities
Item 2: Communication in the SATPOL PP environment in Pulogadung Sub district has effectiveness in overall organizational directionItem 3: Communication in the SATPOL PP environment in Pulogadung Sub district has information exchange effectiveness in the organization
Item 4: Communication in the SATPOL PP environment in Pulogadung Sub district has the effectiveness of reciprocal communication (two way flow information) between the organization and the external environment (outside) of the organization.
© 2019 Global Journals1
28
Globa
l Jo
urna
l of M
anag
emen
t an
d Bu
siness Resea
rch
Volum
e X
IX Issu
e II
Ver
sion
IYe
ar
20
19(
)A
Analysis of the Influential Factors on the Performance of the Civil Service Police Unit in Pulogadung District, East Jakarta
Based on the results of the recapitulation of the frequency of all respondents' answers totaling 38 SATPOL PP regarding Communication in the SATPOL PP environment in Pulogadung Sub district, there is effectiveness in coordinating individual activities (K.1). It can be interpreted that respondents gave a mean value of 4.34 which means very good. This indicates that the average Communication in the SATPOL PP environment in Pulogadung Sub district has the effectiveness of coordinating individual activities showing positive meanings.
Recapitulation of the frequency of all respondents' answers totaling 38 SATPOL PP regarding Communication in the SATPOL PP environment in Pulogadung Sub district has effectiveness in overall organizational direction (K.2). It can be interpreted that respondents gave a mean value of 4.34 which means very good. This indicates that the average Communication in the SATPOL PP environment in Pulogadung Sub district has effectiveness in overall organizational direction indicating positive meaning.
Recapitulation of the frequency of all respondents' answers totaling 38 SATPOL PP regarding Communication in the SATPOL PP environment in Pulogadung Sub district has effectiveness in overall organizational direction (K.3) can be interpreted that the respondent gave a mean value of 4.37 which means very good. This indicates that the average Communication in the SATPOL PP environment in Pulogadung Sub district has effectiveness in overall organizational direction indicating positive meaning.
Recapitulation of the frequency of all respondents' answers totaling 38 SATPOL PP regarding Communication in the SATPOL PP environment in Pulogadung District there is the effectiveness of reciprocal communication (two way flow information) between the organization and the external (outside) organization (K.4) can be interpreted the mean value is 4.66 which means very good. This indicates that the average Communication in the SATPOL PP environment in Pulogadung District has the effectiveness of reciprocal communication (two way flow information) between the organization and the external environment (outside) the organization shows a positive meaning.
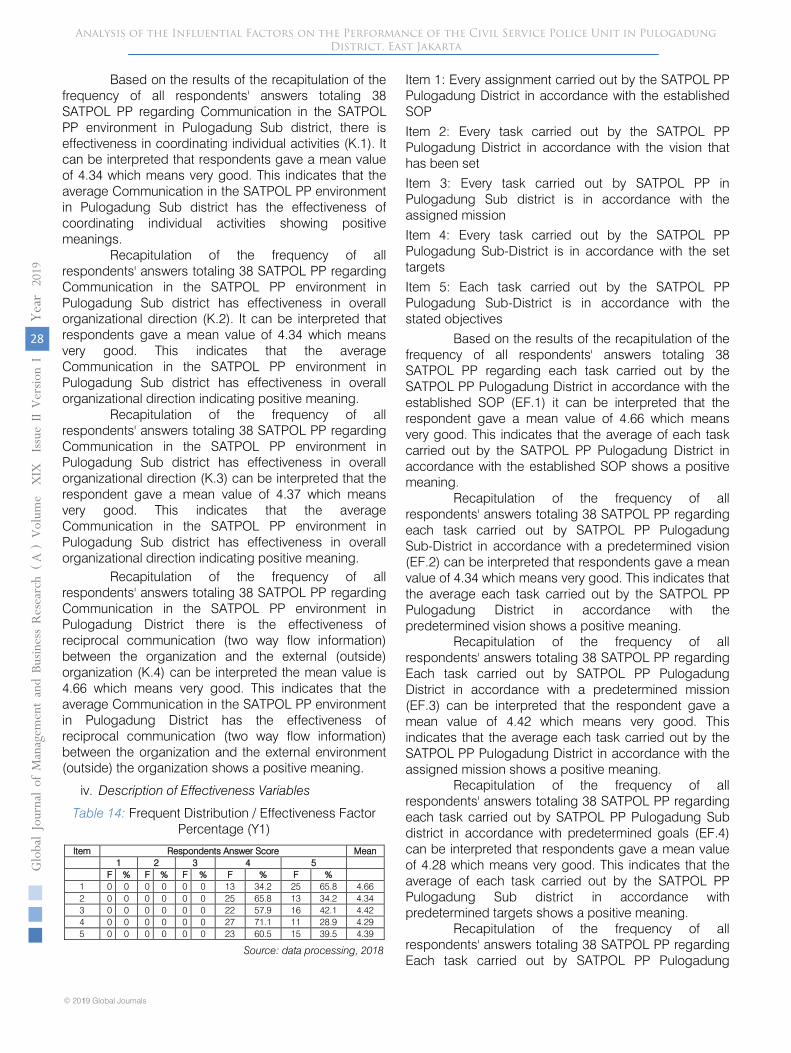
iv. Description of Effectiveness Variables
Table 14: Frequent Distribution / Effectiveness Factor Percentage (Y1)
Item Respondents Answer Score Mean1 2 3 4 5
F % F % F % F % F %1 0 0 0 0 0 0 13 34.2 25 65.8 4.662 0 0 0 0 0 0 25 65.8 13 34.2 4.343 0 0 0 0 0 0 22 57.9 16 42.1 4.424 0 0 0 0 0 0 27 71.1 11 28.9 4.295 0 0 0 0 0 0 23 60.5 15 39.5 4.39
Source: data processing, 2018
Item 1: Every assignment carried out by the SATPOL PP Pulogadung District in accordance with the established SOP
Item 2: Every task carried out by the SATPOL PP Pulogadung District in accordance with the vision that has been set
Item 3: Every task carried out by SATPOL PP in Pulogadung Sub district is in accordance with the assigned mission
Item 4: Every task carried out by the SATPOL PP Pulogadung Sub-District is in accordance with the set targets
Item 5: Each task carried out by the SATPOL PP Pulogadung Sub-District is in accordance with the stated objectives
Based on the results of the recapitulation of the frequency of all respondents' answers totaling 38 SATPOL PP regarding each task carried out by the SATPOL PP Pulogadung District in accordance with the established SOP (EF.1) it can be interpreted that the respondent gave a mean value of 4.66 which means very good. This indicates that the average of each task carried out by the SATPOL PP Pulogadung District in accordance with the established SOP shows a positive meaning.
Recapitulation of the frequency of all respondents' answers totaling 38 SATPOL PP regarding each task carried out by SATPOL PP Pulogadung Sub-District in accordance with a predetermined vision (EF.2) can be interpreted that respondents gave a mean value of 4.34 which means very good. This indicates that the average each task carried out by the SATPOL PP Pulogadung District in accordance with the predetermined vision shows a positive meaning.
Recapitulation of the frequency of all respondents' answers totaling 38 SATPOL PP regarding Each task carried out by SATPOL PP Pulogadung District in accordance with a predetermined mission (EF.3) can be interpreted that the respondent gave a mean value of 4.42 which means very good. This indicates that the average each task carried out by the SATPOL PP Pulogadung District in accordance with the assigned mission shows a positive meaning.
Recapitulation of the frequency of all respondents' answers totaling 38 SATPOL PP regarding each task carried out by SATPOL PP Pulogadung Sub district in accordance with predetermined goals (EF.4) can be interpreted that respondents gave a mean value of 4.28 which means very good. This indicates that the average of each task carried out by the SATPOL PP Pulogadung Sub district in accordance with predetermined targets shows a positive meaning.
Recapitulation of the frequency of all respondents' answers totaling 38 SATPOL PP regarding Each task carried out by SATPOL PP Pulogadung
© 2019 Global Journals
29
Globa
l Jo
urna
l of M
anag
emen
t an
d Bu
siness Resea
rch
Volum
e X
IX Issu
e II
Ver
sion
IYe
ar
20
19(
)A
Analysis of the Influential Factors on the Performance of the Civil Service Police Unit in Pulogadung District, East Jakarta
Sub-district in accordance with the stated objectives (EF.5) can be interpreted that the respondent gave a mean value of 4.39 which means very good. This indicates that the average of each task carried out by the SATPOL PP Pulogadung District in accordance with the stated objectives shows a positive meaning.
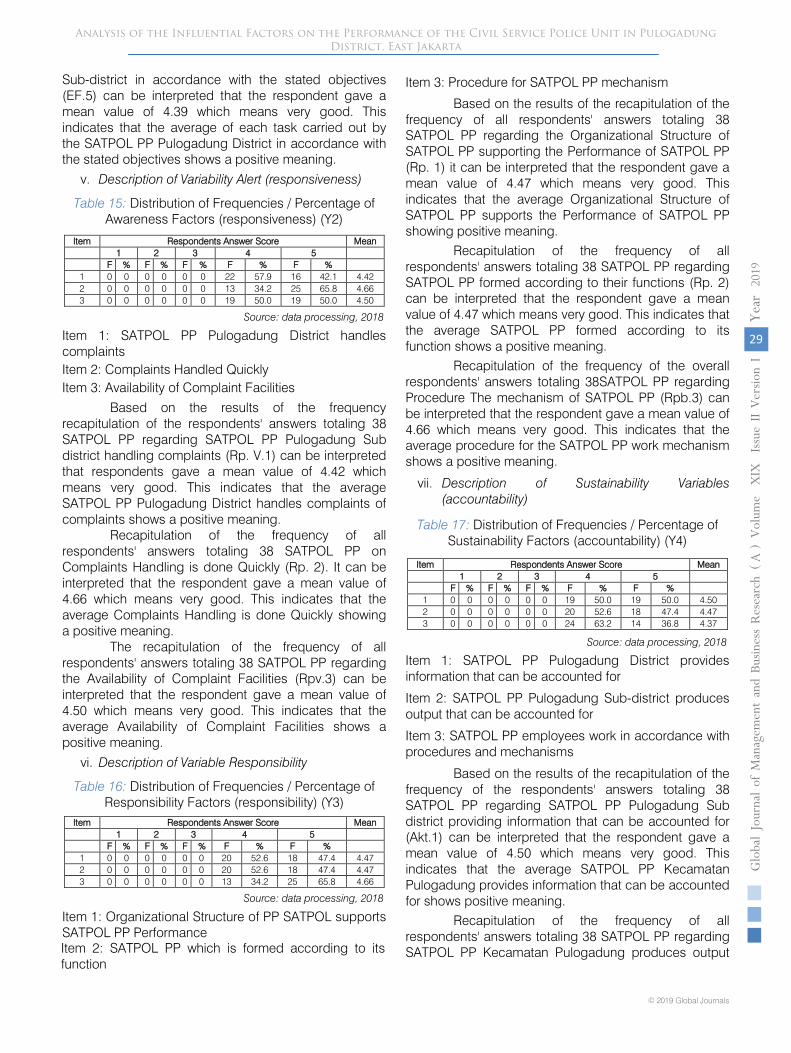
v. Description of Variability Alert (responsiveness)
Table 15: Distribution of Frequencies / Percentage of Awareness Factors (responsiveness) (Y2)
Item Respondents Answer Score Mean1 2 3 4 5
F % F % F % F % F %1 0 0 0 0 0 0 22 57.9 16 42.1 4.422 0 0 0 0 0 0 13 34.2 25 65.8 4.663 0 0 0 0 0 0 19 50.0 19 50.0 4.50
Source: data processing, 2018
Item 1: SATPOL PP Pulogadung District handles complaintsItem 2: Complaints Handled QuicklyItem 3: Availability of Complaint Facilities
Based on the results of the frequency recapitulation of the respondents' answers totaling 38 SATPOL PP regarding SATPOL PP Pulogadung Sub district handling complaints (Rp. V.1) can be interpreted that respondents gave a mean value of 4.42 which means very good. This indicates that the average SATPOL PP Pulogadung District handles complaints of complaints shows a positive meaning.
Recapitulation of the frequency of all respondents' answers totaling 38 SATPOL PP on Complaints Handling is done Quickly (Rp. 2). It can be interpreted that the respondent gave a mean value of 4.66 which means very good. This indicates that the average Complaints Handling is done Quickly showing a positive meaning.
The recapitulation of the frequency of all respondents' answers totaling 38 SATPOL PP regarding the Availability of Complaint Facilities (Rpv.3) can be interpreted that the respondent gave a mean value of 4.50 which means very good. This indicates that the average Availability of Complaint Facilities shows a positive meaning.
vi. Description of Variable Responsibility
Table 16: Distribution of Frequencies / Percentage of Responsibility Factors (responsibility) (Y3)
Item Respondents Answer Score Mean1 2 3 4 5
F % F % F % F % F %1 0 0 0 0 0 0 20 52.6 18 47.4 4.472 0 0 0 0 0 0 20 52.6 18 47.4 4.473 0 0 0 0 0 0 13 34.2 25 65.8 4.66
Source: data processing, 2018
Item 1: Organizational Structure of PP SATPOL supports SATPOL PP PerformanceItem 2: SATPOL PP which is formed according to its function
Item 3: Procedure for SATPOL PP mechanism
Based on the results of the recapitulation of the frequency of all respondents' answers totaling 38 SATPOL PP regarding the Organizational Structure of SATPOL PP supporting the Performance of SATPOL PP (Rp. 1) it can be interpreted that the respondent gave a mean value of 4.47 which means very good. This indicates that the average Organizational Structure of SATPOL PP supports the Performance of SATPOL PP showing positive meaning.
Recapitulation of the frequency of all respondents' answers totaling 38 SATPOL PP regarding SATPOL PP formed according to their functions (Rp. 2) can be interpreted that the respondent gave a mean value of 4.47 which means very good. This indicates that the average SATPOL PP formed according to its function shows a positive meaning.
Recapitulation of the frequency of the overall respondents' answers totaling 38SATPOL PP regarding Procedure The mechanism of SATPOL PP (Rpb.3) can be interpreted that the respondent gave a mean value of 4.66 which means very good. This indicates that the average procedure for the SATPOL PP work mechanism shows a positive meaning.
vii. Description of Sustainability Variables (accountability)
Table 17: Distribution of Frequencies / Percentage of Sustainability Factors (accountability) (Y4)
Item Respondents Answer Score Mean1 2 3 4 5
F % F % F % F % F %1 0 0 0 0 0 0 19 50.0 19 50.0 4.502 0 0 0 0 0 0 20 52.6 18 47.4 4.473 0 0 0 0 0 0 24 63.2 14 36.8 4.37
Source: data processing, 2018
Item 1: SATPOL PP Pulogadung District provides information that can be accounted for
Item 2: SATPOL PP Pulogadung Sub-district produces output that can be accounted for
Item 3: SATPOL PP employees work in accordance with procedures and mechanisms
Based on the results of the recapitulation of the frequency of the respondents' answers totaling 38 SATPOL PP regarding SATPOL PP Pulogadung Sub district providing information that can be accounted for (Akt.1) can be interpreted that the respondent gave a mean value of 4.50 which means very good. This indicates that the average SATPOL PP KecamatanPulogadung provides information that can be accounted for shows positive meaning.
Recapitulation of the frequency of all respondents' answers totaling 38 SATPOL PP regarding SATPOL PP Kecamatan Pulogadung produces output

© 2019 Global Journals1
30
Globa
l Jo
urna
l of M
anag
emen
t an
d Bu
siness Resea
rch
Volum
e X
IX Issu
e II
Ver
sion
IYe
ar
20
19(
)A
Analysis of the Influential Factors on the Performance of the Civil Service Police Unit in Pulogadung District, East Jakarta
that can be justified (Akt.2) can be interpreted that the respondent gave a mean value of 4.47 which means very good. This indicates that the average SATPOL PP Pulogadung Sub-district produces results that can be accounted for shows a positive meaning.
Recapitulation of the frequency of all respondents' answers totaling 38 SATPOL PP regarding SATPOL PP Employees working in accordance with procedures and mechanisms (Akt.3) can be interpreted that the respondent gave a mean value of 4.37 which means very good. This indicates that the SATPOL PP Employee average works according to procedures and the mechanism shows a positive meaning.
b) Overview of Structural Performance Models Through HR Factors, Means Factors and Communication Factors
Based on the operational variables of this study, a research model was formed using PLS - Algorithm to test the feasibility of the model. To test the feasibility of the model using the outer model (measurement model) is the relationship between the indicator and the construct factor loading. In testing the validity of the model using values while testing reliability using the value of Composite Reliability (CR), Cronbach's Alpha (CA) and Average Variance Extracted (AVE).
Figure 2: Testing the Outer Model
Based on the picture above, it can be seen that SDM.1, SDM.3, SDM.10, SP.3, SP.6, SP.7, EF.2, EF.3, EF.4, EF.5, and Akt.3 items. Has a loading factor value below 0.6. Therefore eight items must be removed from the model. After an item that has a loading factor below 0.6 is removed, the image of this research model can beseen in the following figure:
© 2019 Global Journals
31
Globa
l Jo
urna
l of M
anag
emen
t an
d Bu
siness Resea
rch
Volum
e X
IX Issu
e II
Ver
sion
IYe
ar
20
19(
)A
Analysis of the Influential Factors on the Performance of the Civil Service Police Unit in Pulogadung District, East Jakarta
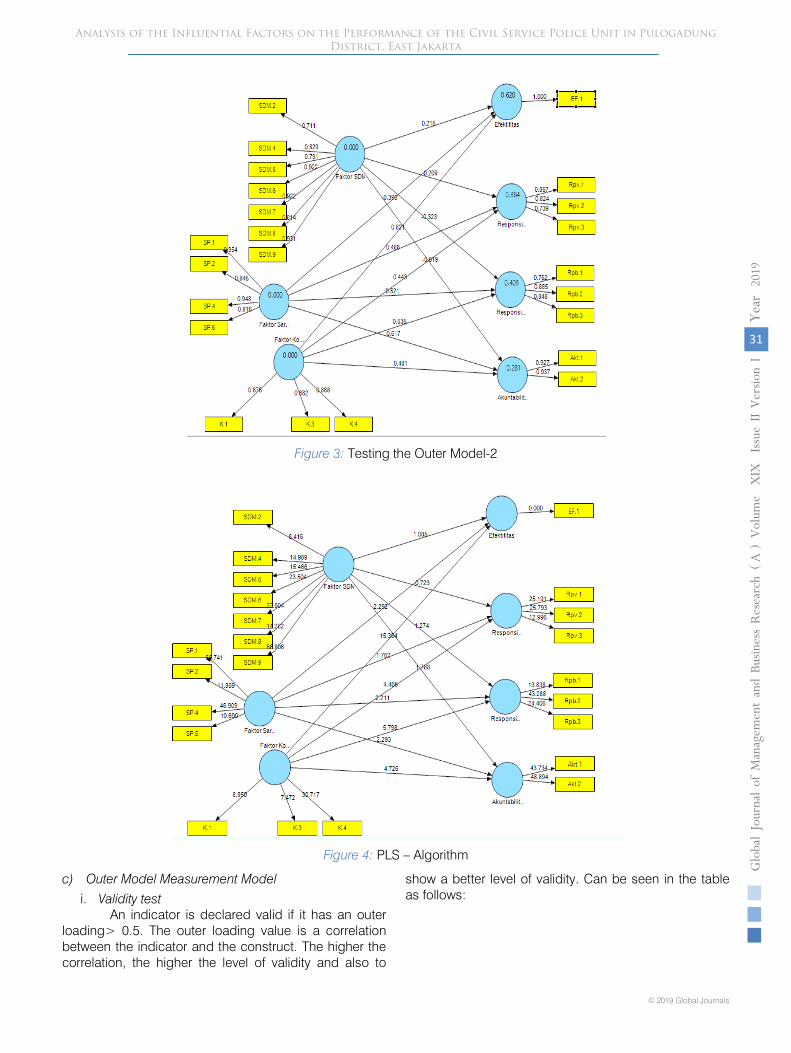
Figure 3: Testing the Outer Model-2
Figure 4: PLS – Algorithm
c) Outer Model Measurement Model
i. Validity testAn indicator is declared valid if it has an outer
loading> 0.5. The outer loading value is a correlation between the indicator and the construct. The higher the correlation, the higher the level of validity and also to
show a better level of validity. Can be seen in the table as follows:
© 2019 Global Journals1
32
Globa
l Jo
urna
l of M
anag
emen
t an
d Bu
siness Resea
rch
Volum
e X
IX Issu
e II
Ver
sion
IYe
ar
20
19(
)A
Analysis of the Influential Factors on the Performance of the Civil Service Police Unit in Pulogadung District, East Jakarta
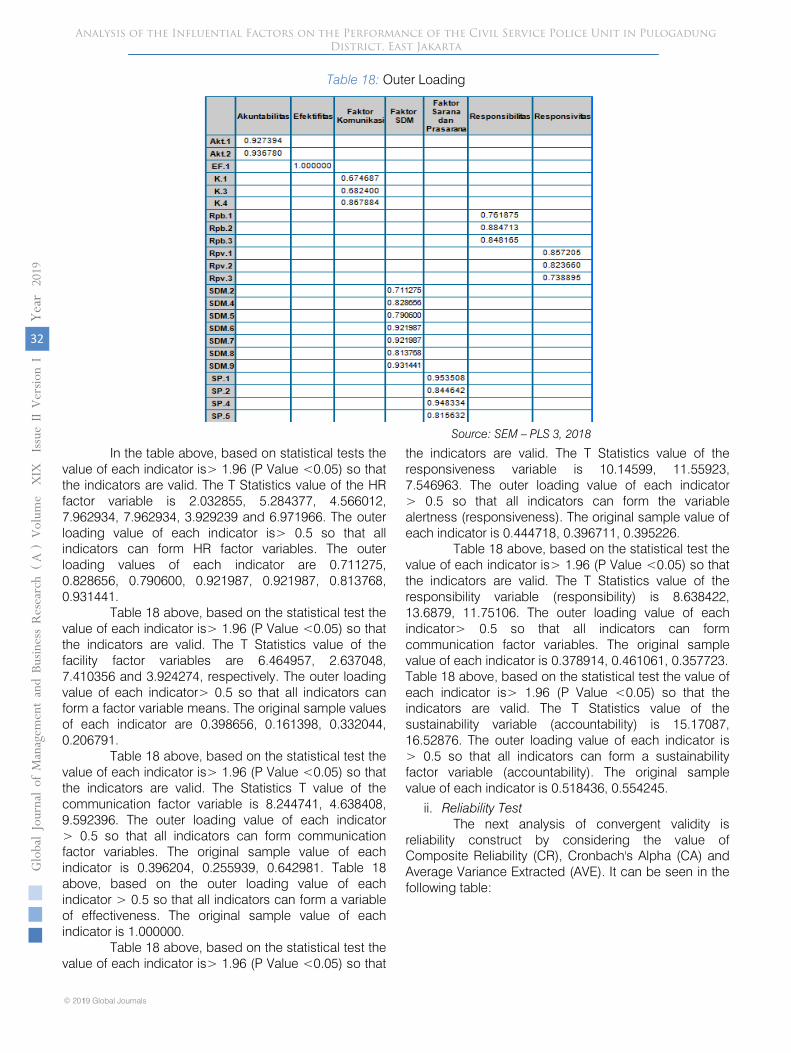
Table 18: Outer Loading
Source: SEM – PLS 3, 2018
In the table above, based on statistical tests the value of each indicator is> 1.96 (P Value <0.05) so that the indicators are valid. The T Statistics value of the HR factor variable is 2.032855, 5.284377, 4.566012, 7.962934, 7.962934, 3.929239 and 6.971966. The outer loading value of each indicator is> 0.5 so that all indicators can form HR factor variables. The outer loading values of each indicator are 0.711275, 0.828656, 0.790600, 0.921987, 0.921987, 0.813768, 0.931441.
Table 18 above, based on the statistical test the value of each indicator is> 1.96 (P Value <0.05) so that the indicators are valid. The T Statistics value of the facility factor variables are 6.464957, 2.637048, 7.410356 and 3.924274, respectively. The outer loading value of each indicator> 0.5 so that all indicators can form a factor variable means. The original sample values of each indicator are 0.398656, 0.161398, 0.332044, 0.206791.
Table 18 above, based on the statistical test the value of each indicator is> 1.96 (P Value <0.05) so that the indicators are valid. The Statistics T value of the communication factor variable is 8.244741, 4.638408, 9.592396. The outer loading value of each indicator > 0.5 so that all indicators can form communication factor variables. The original sample value of each indicator is 0.396204, 0.255939, 0.642981. Table 18 above, based on the outer loading value of each indicator > 0.5 so that all indicators can form a variable of effectiveness. The original sample value of each indicator is 1.000000.
Table 18 above, based on the statistical test the value of each indicator is> 1.96 (P Value <0.05) so that
the indicators are valid. The T Statistics value of the responsiveness variable is 10.14599, 11.55923, 7.546963. The outer loading value of each indicator > 0.5 so that all indicators can form the variable alertness (responsiveness). The original sample value of each indicator is 0.444718, 0.396711, 0.395226.
Table 18 above, based on the statistical test the value of each indicator is> 1.96 (P Value <0.05) so that the indicators are valid. The T Statistics value of the responsibility variable (responsibility) is 8.638422, 13.6879, 11.75106. The outer loading value of each indicator> 0.5 so that all indicators can form communication factor variables. The original sample value of each indicator is 0.378914, 0.461061, 0.357723.Table 18 above, based on the statistical test the value of each indicator is> 1.96 (P Value <0.05) so that the indicators are valid. The T Statistics value of the sustainability variable (accountability) is 15.17087, 16.52876. The outer loading value of each indicator is > 0.5 so that all indicators can form a sustainability factor variable (accountability). The original sample value of each indicator is 0.518436, 0.554245.
ii. Reliability TestThe next analysis of convergent validity is
reliability construct by considering the value of Composite Reliability (CR), Cronbach's Alpha (CA) and Average Variance Extracted (AVE). It can be seen in the following table:
© 2019 Global Journals
33
Globa
l Jo
urna
l of M
anag
emen
t an
d Bu
siness Resea
rch
Volum
e X
IX Issu
e II
Ver
sion
IYe
ar
20
19(
)A
Analysis of the Influential Factors on the Performance of the Civil Service Police Unit in Pulogadung District, East Jakarta
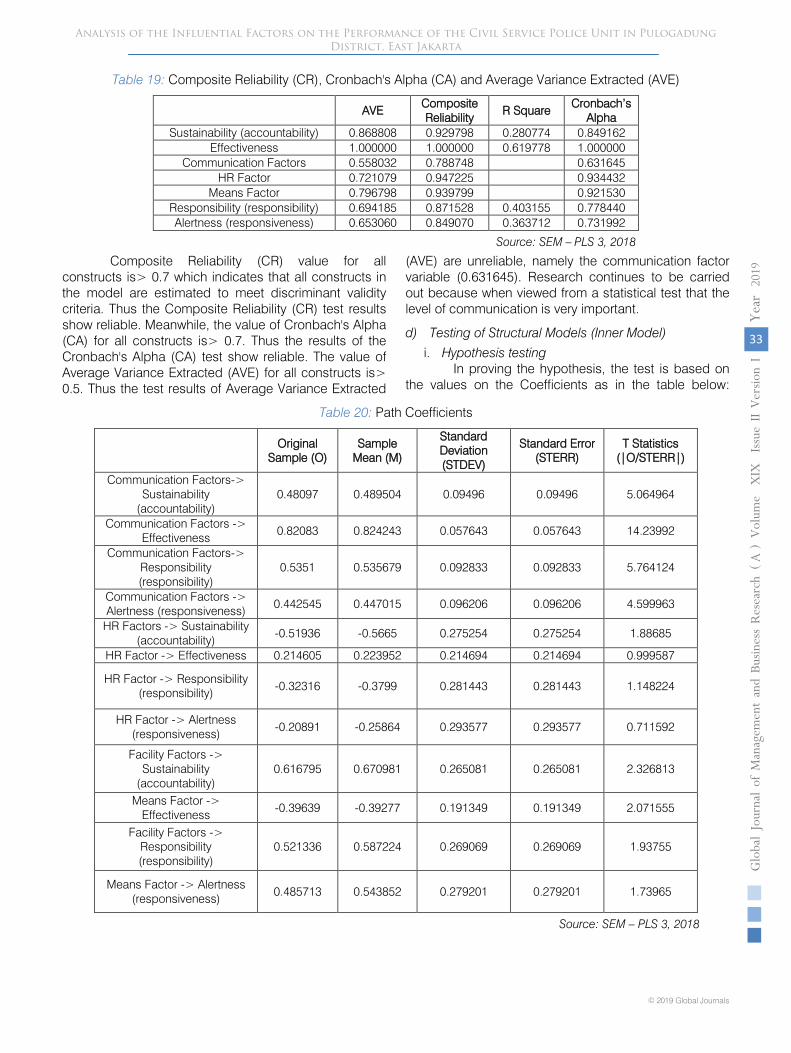
Table 19: Composite Reliability (CR), Cronbach's Alpha (CA) and Average Variance Extracted (AVE)
AVEComposite Reliability
R SquareCronbach’s
AlphaSustainability (accountability) 0.868808 0.929798 0.280774 0.849162
Effectiveness 1.000000 1.000000 0.619778 1.000000Communication Factors 0.558032 0.788748 0.631645
HR Factor 0.721079 0.947225 0.934432Means Factor 0.796798 0.939799 0.921530
Responsibility (responsibility) 0.694185 0.871528 0.403155 0.778440Alertness (responsiveness) 0.653060 0.849070 0.363712 0.731992
Source: SEM – PLS 3, 2018
Composite Reliability (CR) value for all constructs is> 0.7 which indicates that all constructs in the model are estimated to meet discriminant validity criteria. Thus the Composite Reliability (CR) test results show reliable. Meanwhile, the value of Cronbach's Alpha (CA) for all constructs is> 0.7. Thus the results of the Cronbach's Alpha (CA) test show reliable. The value of Average Variance Extracted (AVE) for all constructs is> 0.5. Thus the test results of Average Variance Extracted
(AVE) are unreliable, namely the communication factor variable (0.631645). Research continues to be carried out because when viewed from a statistical test that the level of communication is very important.
d) Testing of Structural Models (Inner Model)
i. Hypothesis testingIn proving the hypothesis, the test is based on
the values on the Coefficients as in the table below:
Table 20: Path Coefficients
Original Sample (O)
Sample Mean (M)
Standard Deviation (STDEV)
Standard Error (STERR)
T Statistics (|O/STERR|)
Communication Factors-> Sustainability
(accountability)0.48097 0.489504 0.09496 0.09496 5.064964
Communication Factors -> Effectiveness
0.82083 0.824243 0.057643 0.057643 14.23992
Communication Factors-> Responsibility (responsibility)
0.5351 0.535679 0.092833 0.092833 5.764124
Communication Factors -> Alertness (responsiveness)
0.442545 0.447015 0.096206 0.096206 4.599963
HR Factors -> Sustainability (accountability)
-0.51936 -0.5665 0.275254 0.275254 1.88685
HR Factor -> Effectiveness 0.214605 0.223952 0.214694 0.214694 0.999587
HR Factor -> Responsibility (responsibility) -0.32316 -0.3799 0.281443 0.281443 1.148224
HR Factor -> Alertness (responsiveness)
-0.20891 -0.25864 0.293577 0.293577 0.711592
Facility Factors -> Sustainability
(accountability)0.616795 0.670981 0.265081 0.265081 2.326813
Means Factor -> Effectiveness
-0.39639 -0.39277 0.191349 0.191349 2.071555
Facility Factors -> Responsibility (responsibility)
0.521336 0.587224 0.269069 0.269069 1.93755
Means Factor -> Alertness (responsiveness)
0.485713 0.543852 0.279201 0.279201 1.73965
Source: SEM – PLS 3, 2018
© 2019 Global Journals1
34
Globa
l Jo
urna
l of M
anag
emen
t an
d Bu
siness Resea
rch
Volum
e X
IX Issu
e II
Ver
sion
IYe
ar
20
19(
)A
Analysis of the Influential Factors on the Performance of the Civil Service Police Unit in Pulogadung District, East Jakarta
Hypothesis 1: HR factors have a positive and not significant effect on effectiveness.
The table above shows the results of the Original Sample = 0.2141, T Statistics = 0.886. This shows that the influence between HR factors on effectiveness is not significant. Thus H1 in this study was rejected. This means that HR factors cannot increase effectiveness.
Hypothesis 2: HR factors have a negative and not significant effect on responsiveness (responsiveness).
The table above shows the results of the Original Sample = -0.20891, T Statistics = 0.711592. This shows that the influence between HR factors on alertness (responsiveness) is not significant. Thus H2 in this study was rejected. That means HR factors cannot increase alertness (responsiveness).
Hypothesis 3: HR factors have a negative and not significant effect on responsibility (responsibility).
The table above shows the results of the Original Sample = -0.32316, T Statistics = 1.148224. This shows that the influence between HR factors on responsibility (responsibility) is not significant. Thus H3 in this study was rejected. This means that HR factors cannot increase responsibility (responsibility).Hypothesis 4: HR factors have a negative and not significant effect on sustainability (accountability).
The table above shows the results of the Original Sample = -0.51936, T Statistics = 1.88685. This shows that the influence between HR factors on sustainability (accountability) is not significant. Thus H4 in this study was rejected. That means HR factors cannot improve sustainability (accountability).
Hypothesis 5: Facility factors have a negative and significant effect on effectiveness.
The table above shows the results of the Original Sample = -0.39639, T Statistics = 2.071555. This shows that the influence between the facilities and infrastructure factors on effectiveness is significant. Thus the H5 in this study is rejected. That is, when the factor increases, the effectiveness decreases.
Hypothesis 6: Facility factors have a positive and not significant effect on alertness (responsiveness).
The table above shows the results of the Original Sample = 0.485713, T Statistics = 1.73965. This shows that the influence between the means of factors towards alertness (responsiveness) is significant. Thus H6 in this study was rejected. This means that when the factor increases, alertness (responsiveness) does not increase.
Hypothesis 7: Facility factors have a positive and significant effect on responsibility (responsibility).
The table above shows the results of the Original Sample = 0.521336, T Statistics = 1.93755. This shows that the influence between the facilities and infrastructure factors on responsibility (responsibility) is
significant. Thus H7 in this study is accepted. That is,when the facilities and infrastructure factors increase, responsibility (responsibility) increases.
Hypothesis 8: Facility factors have a positive and significant effect on sustainability (accountability).
The table above shows the results of the Original Sample = 0.616795, T Statistics = 2.326813. This shows that the influence between the factors of means towards sustainability (accountability) is significant. Thus the H8 in this study was accepted. This means that when facility factors increase, sustainability (accountability) increases.
Hypothesis 9: Communication factors have a positive and significant effect on effectiveness.
The table above shows the results of the Original Sample = 0.82083, T Statistics = 14.23992. This shows that the influence between communication factors on effectiveness is significant. Thus H9 in this study was accepted. This means that when communication factors increase, the effectiveness increases.
Hypothesis 10: Communication factors have a positive and significant effect on alertness (responsiveness).
The table above shows the results of the Original Sample = 0.442545, T Statistics = 4.599963. This shows that the influence between communication factors on alertness (responsiveness) is significant. Thus H10 in this study was accepted. This means that when communication factors increase, the responsiveness increases.
Hypothesis 11: Communication factors have a positive and significant effect on responsibility (responsibility).
The table above shows the results of the Original Sample = 0.5351, T Statistics = 5.764124. This shows that the influence between communication factors on alertness (responsiveness) is significant. Thus H11 in this study is accepted. That is, when communication factors increase, responsibility (responsibility) increases.
Hypothesis 12: Communication factors have a positive and significant effect on sustainability (accountability).
The table above shows the results of the Original Sample 0.48097, T Statistics 5.064964. This shows that the influence between communication factors on alertness (responsiveness) is significant. Thus H12 in this study was accepted. This means that when communication factors increase, sustainability (accountability) increases.
IV. Conclusion
a) ConclusionFrom a series of data management and
analysis carried out in this study the conclusions can be drawn as follows:
© 2019 Global Journals
35
Globa
l Jo
urna
l of M
anag
emen
t an
d Bu
siness Resea
rch
Volum
e X
IX Issu
e II
Ver
sion
IYe
ar
20
19(
)A
Analysis of the Influential Factors on the Performance of the Civil Service Police Unit in Pulogadung District, East Jakarta
1. Factors of Human Resources have a positive and not significant effect on the Effectiveness, Responsiveness, Responsibility and Accountability of SATPOL Performance PP Sub-District Pulogadung East Jakarta.
2. Facility Factors have a positive and not significant effect on the effectiveness, responsiveness, responsibility and accountability of SATPOL PP Kecamatan Pulogadung East Jakarta.
3. Communication Factors have a positive and not significant effect on the effectiveness, response-veness, responsibility and accountability of SATPOL PP performance pulogadung sub-district, East Jakarta.
b) SuggestionBased on the results of the above research, it is
recommended that SATPOL PP Pulogadung District, East Jakarta, namely:
1. We recommend that the strategies used from the factors of Human Resources, facilities and communication in realizing and prosperity of SATPOL PP in the Pulogadung sub-district must take advantage of opportunities that exist from several operational aspects, laws and regulations must be carried out in accordance with the SOP.
2. We recommend that SATPOL PP take an approach and coordinate with the community, TNI, Police and other information to be more efficient in carrying out their duties and get maximum results.
3. And for tidiness in the duty to pay attention to uniformity in appearance and for operational vehicles must also be considered in the duty so that more authoritative is seen by the community and helping others is faster and easier.
References Références Referencias
1. Aduda, Josiah, and James Gitonga. 2011. The Relationship between Credit Risk Management andProfitability among the Commercial Banks in Kenya. Journal of Modern Accounting and Auditing, ISSN 1548-6583 September 2011, Vol. 7, No. 9, 934-946 David Publishing.
2. Ariyanti, Fiki. 2015. The Republic of Indonesia Will Not Repeat the Crisis Like 1998, This Is the Proof. www.liputan6.com. Retrieved 12 June 2017.
3. Brigham, Eugene F. and Daves, Phillip R. 2016. Intermediate Financial Management. Boston, USA: Cengage Learning.
4. Birgham, Eugene F and Ehrhardt, Michael C. 2014. Financial Management: Theory and Practice, Fourteenth Edition. Oiho, USA: South-Western, Cengage Learning.
5. Birgham, Eugene F and Houston Joel F. 2017. Fundamentals of Financial Management. Boston, USA: Cengage Learning.
6. Banker Association for Risk Management. 2012. Banker Professional Competency Test Module for Risk Management. Jakarta.
7. Charnes, John. 2012. Financial Modeling with Crystal Ball and Excel. New Jersey, USA: John Wiley & Sons. Inc.
8. Dubecq, Simon, et al. 2016. Credit and Liquidity inInterbank Rates: A Quadratic Approach. Journal of Banking & Finance Published by Elsevier B.V.
9. Kasmir. 2016. Banking Management (Revised Edition). Jakarta: Raja Grafindo Persada.
10. Ni Nyoman, Karisma Dewi Paramitha, et al. 2014. The Influence of Credit and Liquidity Risks to Profitability in Banking Companies that Go Public in the Period of 2010 - 2012. E-Journal Bisma University of Ganesha Education Department of Management Vol. 2.
11. Prasetyo, Dwi Agung, and Ni Putu Ayu Darmayanti. 2015. Effect of Credit Risk, Liquidity, Capital Adequacy, and Operational Efficiency on Profitability at PT BPD Bali. E-Journal of Udayana University Management, Vol. 4, No. 9, 2015: 2590-2617.
12. Sekaran, Uma. 2014. Research Methods for Business Research Methods for Business. Jakarta: Salemba Empat.
13. Winarno, Wing Wahyu. 2015. Econometric and Statistical Analysis with EViews (4th Edition). Yogyakarta: UPP STIM YKPN.
14. Zuraya, Nidia. 2017. OJK: Bank Profitability Ratio 2016 Decreases. www.republika.com. Retrieved 12 June 2017.