Embed Size (px)
Citation preview

Analysis of the Impacts of Public Policies on the
Brazilian Households’ Pattern of Energy
Consumption and Emission of Greenhouse Gases
Mariana Weiss de Abreu
Advisor: Amaro Pereira Junior
CIRED, July 5th 2016.
Introduction
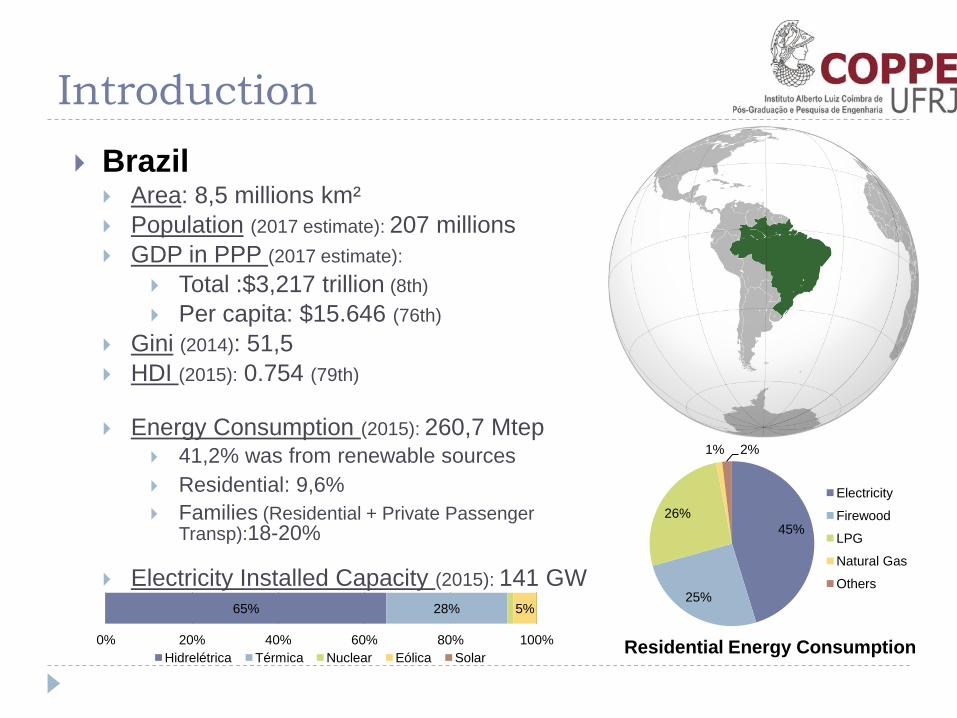
Brazil Area: 8,5 millions km²
Population (2017 estimate): 207 millions
GDP in PPP (2017 estimate):
Total :$3,217 trillion (8th)
Per capita: $15.646 (76th)
Gini (2014): 51,5
HDI (2015): 0.754 (79th)
Energy Consumption (2015): 260,7 Mtep 41,2% was from renewable sources
Residential: 9,6%
Families (Residential + Private Passenger Transp):18-20%
Electricity Installed Capacity (2015): 141 GW
45%
25%
26%
1% 2%
Electricity
Firewood
LPG
Natural Gas
Others
Residential Energy Consumption
65% 28% 5%
0% 20% 40% 60% 80% 100%
Hidrelétrica Térmica Nuclear Eólica Solar

Motivation In the beginning of the 21st century:
Social mobility through the increase of the per capita income;
A significant number of people has crossed the poverty line (ROCHA, 2013; UCHOA et al., 2013); 2002: 20,8% => 2011: 10,1%
Real increase of the minimum wage From 2003 to 2009 => real increase of 49,1%.
Income transfer programs, such as Bolsa Família;
Reduction of the social inequality; Higher concentration of the population in the middle income classes (de R$ 1.064 a
R$4.561,00 em valores de 2008) – (NERI, 2011);
Increase of the Human Development Index – HDI; 2000: 0,669 => 2010: 0,726 (PNUD 2013)
The household’s expendature has increased (GROTTERA & PEREIRA JUNIOR, 2013; NERI, 2011; IBGE) ….

Motivation So, the increase of income helps to…
The families’ energy increased theis energy consumption
The patterns of energy consumption have changed
As well as, in the last years, the families have responded to the variable electricity prices and to the variations in the. relative prices of firewood and LPG, for exemple.
Energy Consumption by income classes – 2002/2008.
0
1000
2000
3000
4000
5000
6000
7000
8000
9000
10000
11000
12000
D1 D2 D3 D4 D5 D6 D7 D8 D9 D10 D1 D2 D3 D4 D5 D6 D7 D8 D9 D10
2002 2008
kte
p
PETRÓLEO e DERIVADOS GÁS NATURAL CARVÃO e DERIVADOS
URÂNIO ELETRICIDADE LENHA e CARVÃO VEGETAL
PRODUTOS DA CANA OUTRAS FONTES PRIMÁRIAS
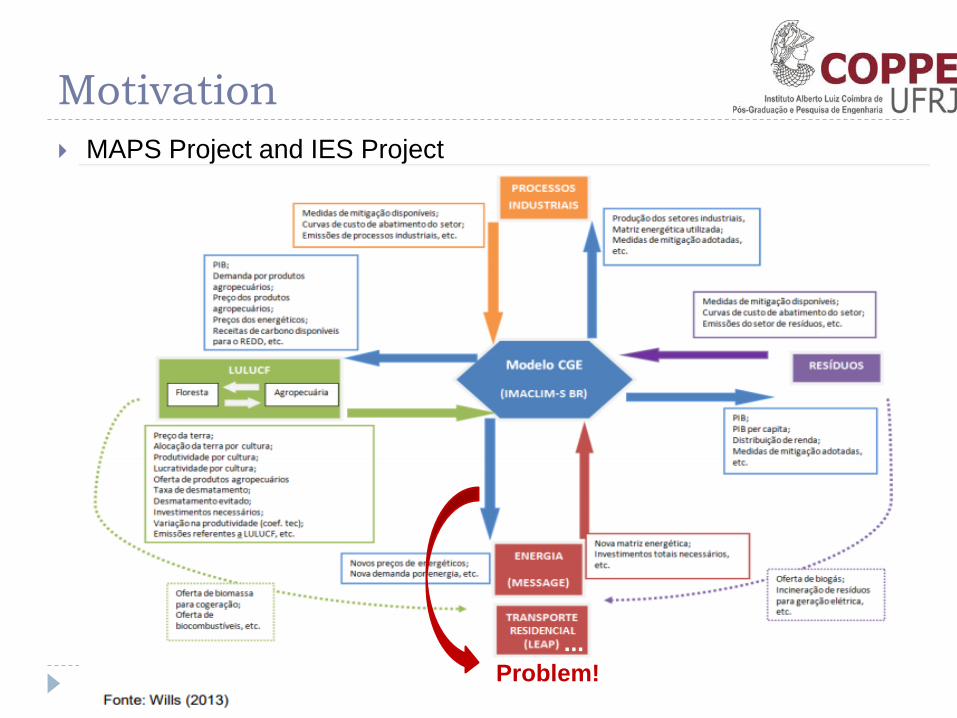
Motivation
MAPS Project and IES Project
Problem!
...

Objective
1º) Analyze the impacts of energy efficiency policies, mitigation of greenhouse gas emissions policies, etc;
2º) To construct a Behavior Realism Simulation Model that will be able to:
Represent the household energy consumption pattern disaggregated by income classes and end uses;
Estimate the variation of equipment ownership, energy intensity and the replacement of scrapped equipment by more efficient technologies in the face of changes in per capita income and relative prices of energy sources and technologies;
Be integrated into a general equilibrium model, preferably IMACLIM Brazil.
It will contribute to the formulation of more effective public policies (energy efficiency, mitigation of greenhouse gas emissions …)
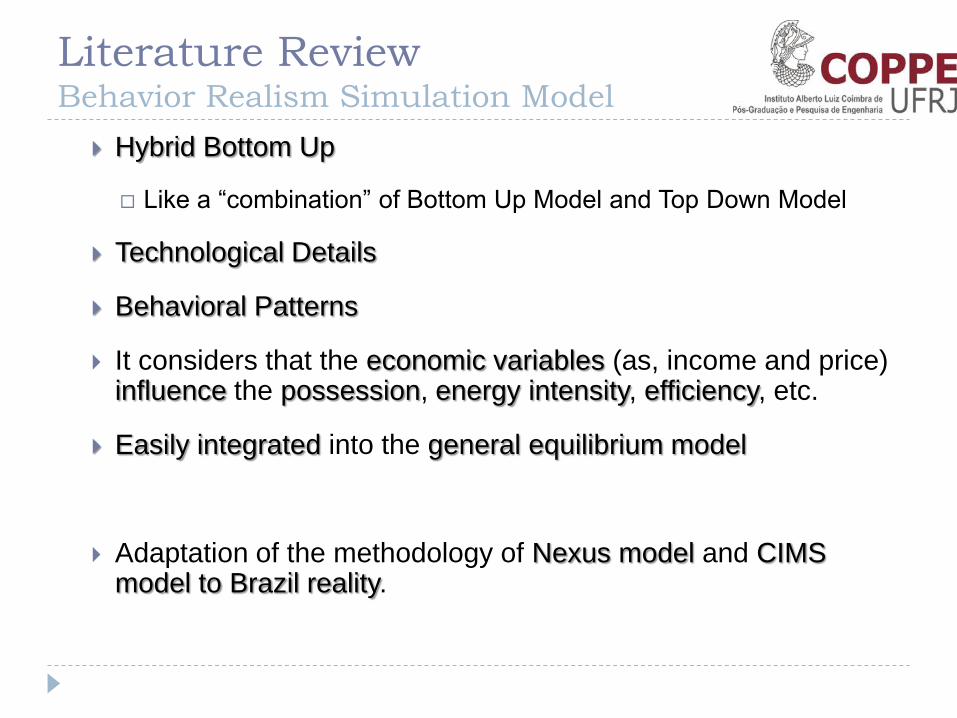
Literature Review Behavior Realism Simulation Model
Hybrid Bottom Up
Like a “combination” of Bottom Up Model and Top Down Model
Technological Details
Behavioral Patterns
It considers that the economic variables (as, income and price) influence the possession, energy intensity, efficiency, etc.
Easily integrated into the general equilibrium model
Adaptation of the methodology of Nexus model and CIMS model to Brazil reality.

Literature Review Integration into a General Equilibrium Model
Income Classes
Products(Energetic e Others)
Public Administration
Final DemandESUBs e AEEI
Prices andIncome
Taxes
Exports
Imports
Rest of the world
Simultaneous balance between energy flows in monetary and physical units
International Trade (ComparativeAdvantages)
Limited Adaptation Capacity
(Technical constraints and basic needs)
Public Finance Management (AsymmetricInformation and Miscellaneous Objectives)
Transfers Taxes
Technical Restrictions and Complications regarding
Salary Adjustments
Model of Behavior Simulation

Methodology Energy Requirement
P = Percentage of households of the income class h that owns the equipment of the type j to attend the final usage i;
T = Time of use of the equipment j in a year to attend to attend to the final use i in a house of the income class h;
p = Energy Efficiency of the equipment j in a house of the income class h;
I = Power of the equipment of the type j used to attend the final use i in a house of the income class h; i = final uses = lighting, water heating , refrigeration, conditioning air, coking and other uses = 1, 2, 3, 4, 5, 6; j = type of equipment to attend the final use i = 1, 2, 3, …, J; h = income classes = 1, 2, 3... 10.
SE = energy consumption to the final usage i;
M = number of households per income class h

Methodology Condition of Balance – Base Year
The Condition of Balance to calibrate the base year of
the Behavior Realism Simulation Model :
Nexus Model
CIMS Model
The adjustment variable: Degree of Market Heterogeneity (0 < v < infinite)
A higher v => A higher heterogeneity
Next Step: Assuming premises for the construction of scenarios in relation
to ownership, frequency of use, energy efficiency and power based on the
governmental planning program.

Methodology Reference Scenario Construction
Cobb Douglas Function
Ps.: According to the assumptions made

Methodology Reference Scenario Construction
II) Condition of Balance to the Scenario (Adapt. From CIMS Model)
The adjustment variable: Degree of Market Heterogeneity (0 < v < infinite)
The cost of the energy consumption from the technology j (ECj) will
depend on the prices of the energy source (s). These prices will come from
the General Equilibrium Model.

Methodology Integration into a General Equilibrium Model
After the Reference Scenario was calibrated: The final energy requirement of the families is sent to the general
equilibrium model
It is possible to assess the Energy Efficiency Policies and the Emission Mitigation Policies
General Equilibrium
Model
Behavior Realism
Simulation Model
Prices and
Incomes
Energy
Requirement It’s still possible to calculate: the Energy Price-Elasticity,
the Energy Income-Elasticity and the
Energy Efficiency Factor

Methodology Data Base
Family Expenditures and Income Classes Family budget survey (POF – microdata from 2008 – 2009)
Division of households by income decile
Analysis of family life cycle - Consumption Index from OECD
This index is calculated by weights assigned to each inhabitant of the household, being: 1.0 for the individual in the position of head of the household; 0.5 for other adults over 14 years and 0.3 for residents under the age of 14 years.
Decis Classes de renda *
D1 até 162,09
D2 de 162,10 até 239,45
D3 de 239,46 até 310,90
D4 de 310,91 até 388,36
D5 de 388,37 até 479,25
D6 de 479,26 até 602,17
D7 de 602,18 até 774,62
D8 de 774,63 até1.062,63
D9 de 1.062,64 até 1.732,16
D10 Maior que 1.732,17
fonte: elaboração própria, com base nos dados da POF 2008 - 2009
Nota: * valores em U$D 2005

Methodology Data Base
Energy Consumption
Family budget survey (POF 2008-2009) - possession
National Energy Balance – energy sources
Useful Energy Balance (energy efficiency) – energy services
Research about the Equipment Ownership and the Usage Habits from PROCEL (2007) – power and types of equipment
Costs
ANEEL e ANP – Price of the Energy Sources
Family budget survey (POF 2008-2009)
Inmetro + Market research
Scenarios National Energy Plans developed by EPE for the years 2030 and 2050
Decennial Energy Expansion Plans – PDEs and International Energy Efficiency Plans
Population Forecast and Number of people by household from IBGE
A improvement in the brazilian income distribuition
Gini Index Brazil in 2030 ~= 34 (Ex.: Spain, Canada, Italy, Ireland...)
Gini Index Brazil in 2014 = 51,5 (World Bank)

Thank you!