Embed Size (px)
Citation preview
Analysis of the Global Industrial Machine Vision Market Recovery of Traditional Markets to Spur Demand
NAFB-30
December 2012
2 NAFB-30
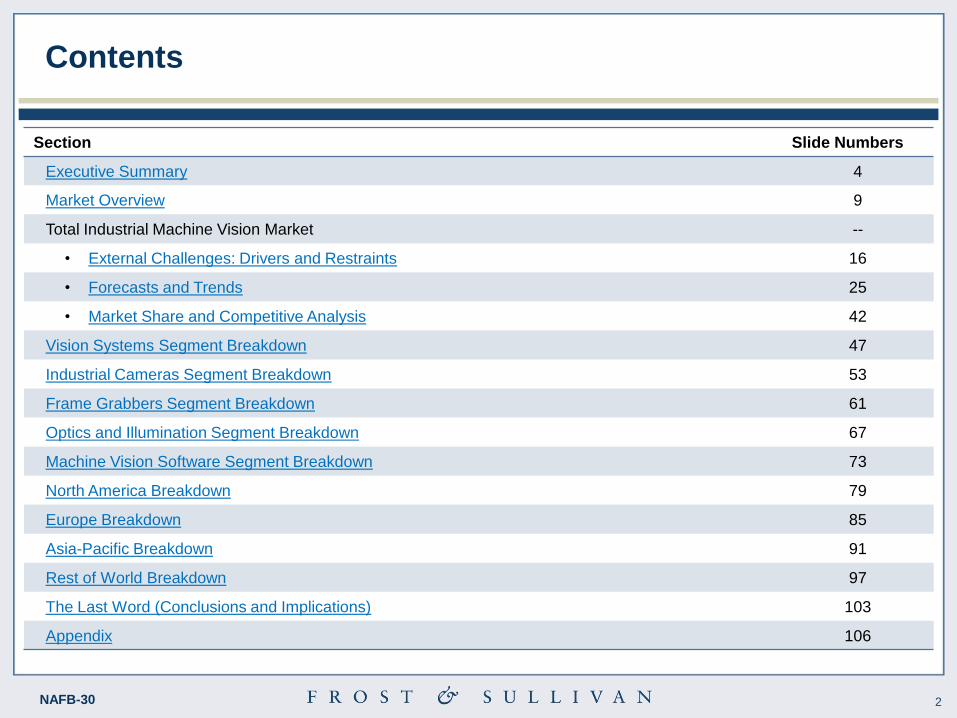
Contents
Section Slide Numbers
Executive Summary 4
Market Overview 9
Total Industrial Machine Vision Market --
• External Challenges: Drivers and Restraints 16
• Forecasts and Trends 25
• Market Share and Competitive Analysis 42
Vision Systems Segment Breakdown 47
Industrial Cameras Segment Breakdown 53
Frame Grabbers Segment Breakdown 61
Optics and Illumination Segment Breakdown 67
Machine Vision Software Segment Breakdown 73
North America Breakdown 79
Europe Breakdown 85
Asia-Pacific Breakdown 91
Rest of World Breakdown 97
The Last Word (Conclusions and Implications) 103
Appendix 106
3 NAFB-30
Executive Summary
4 NAFB-30
Executive Summary
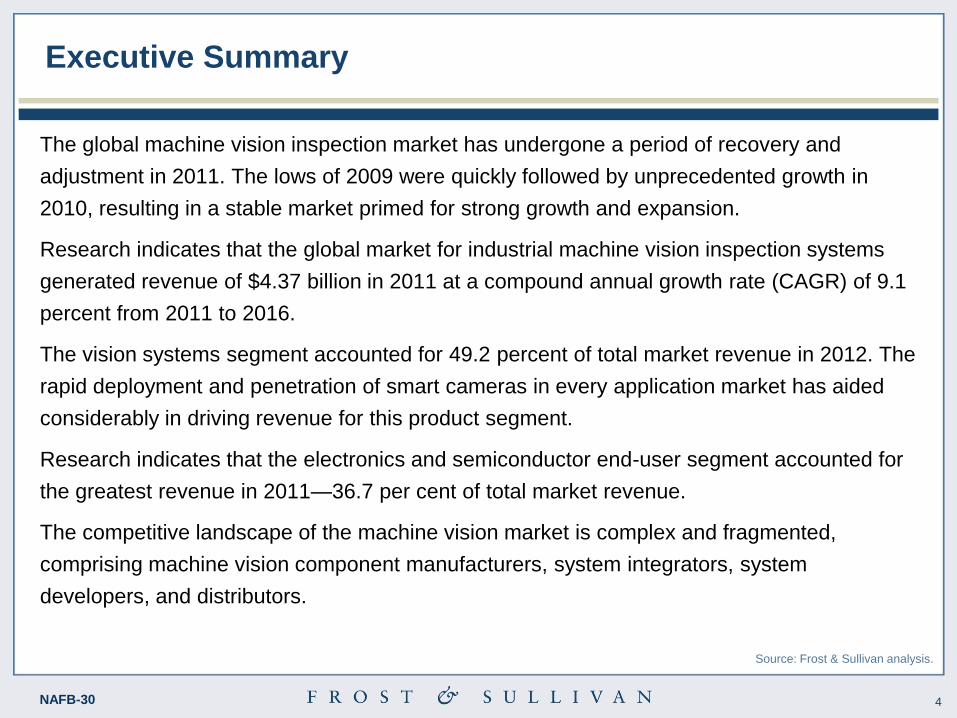
The global machine vision inspection market has undergone a period of recovery and
adjustment in 2011. The lows of 2009 were quickly followed by unprecedented growth in
2010, resulting in a stable market primed for strong growth and expansion.
Research indicates that the global market for industrial machine vision inspection systems
generated revenue of $4.37 billion in 2011 at a compound annual growth rate (CAGR) of 9.1
percent from 2011 to 2016.
The vision systems segment accounted for 49.2 percent of total market revenue in 2012. The
rapid deployment and penetration of smart cameras in every application market has aided
considerably in driving revenue for this product segment.
Research indicates that the electronics and semiconductor end-user segment accounted for
the greatest revenue in 2011—36.7 per cent of total market revenue.
The competitive landscape of the machine vision market is complex and fragmented,
comprising machine vision component manufacturers, system integrators, system
developers, and distributors.
Source: Frost & Sullivan analysis.
5 NAFB-30
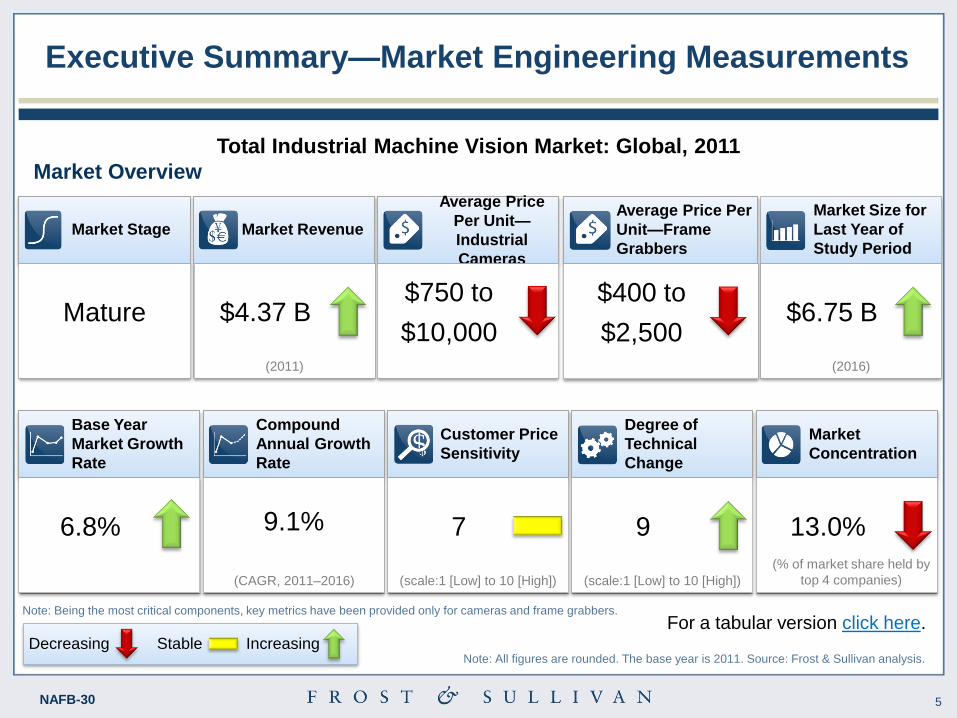
Compound
Annual Growth
Rate
9.1%
(CAGR, 2011–2016)
Market
Concentration
13.0%
(% of market share held by
top 4 companies)
Executive Summary—Market Engineering Measurements
Market Stage
Mature
Market Revenue
$4.37 B
(2011)
Average Price
Per Unit—
Industrial
Cameras
$750 to
$10,000
Market Size for
Last Year of
Study Period
$6.75 B
(2016)
Base Year
Market Growth
Rate
6.8%
Customer Price
Sensitivity
7
(scale:1 [Low] to 10 [High])
Degree of
Technical
Change
9
(scale:1 [Low] to 10 [High])
Total Industrial Machine Vision Market: Global, 2011
Market Overview
For a tabular version click here. Stable Increasing Decreasing
Note: All figures are rounded. The base year is 2011. Source: Frost & Sullivan analysis.
Average Price Per
Unit—Frame
Grabbers
$400 to
$2,500
Note: Being the most critical components, key metrics have been provided only for cameras and frame grabbers.
6 NAFB-30
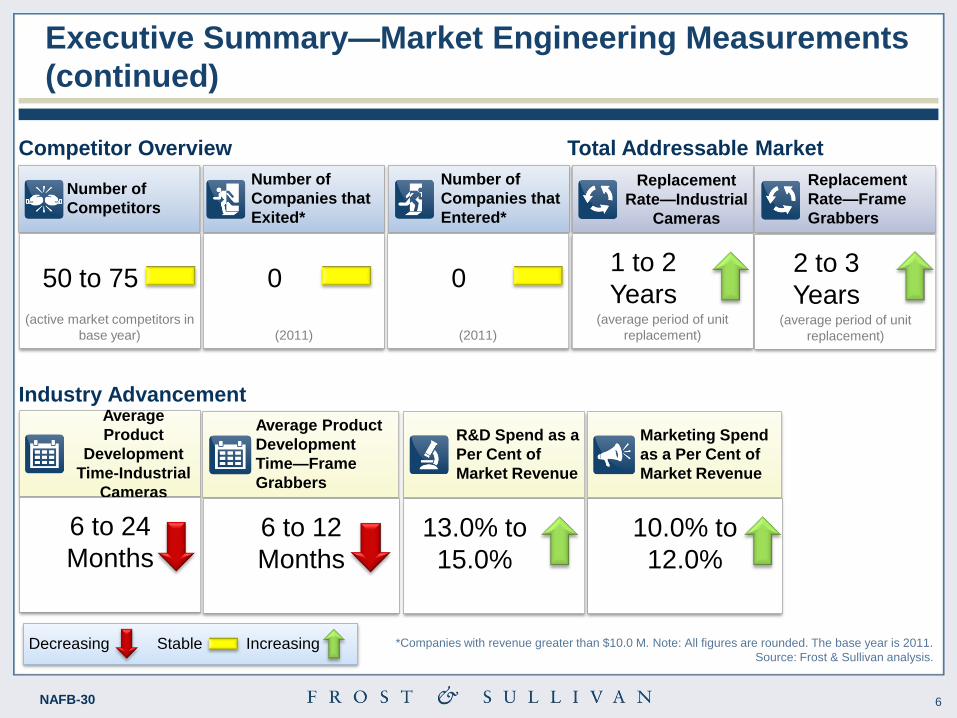
Replacement
Rate—Industrial
Cameras
1 to 2
Years (average period of unit
replacement)
Average
Product
Development
Time-Industrial
Cameras
6 to 24
Months
Number of
Companies that
Exited*
0
(2011)
Number of
Companies that
Entered*
0
(2011)
Number of
Competitors
50 to 75
(active market competitors in
base year)
Executive Summary—Market Engineering Measurements
(continued)
Competitor Overview
Stable Increasing Decreasing
Total Addressable Market
Industry Advancement
Marketing Spend
as a Per Cent of
Market Revenue
10.0% to
12.0%
R&D Spend as a
Per Cent of
Market Revenue
13.0% to
15.0%
*Companies with revenue greater than $10.0 M. Note: All figures are rounded. The base year is 2011.
Source: Frost & Sullivan analysis.
Replacement
Rate—Frame
Grabbers
2 to 3
Years (average period of unit
replacement)
Average Product
Development
Time—Frame
Grabbers
6 to 12
Months
7 NAFB-30
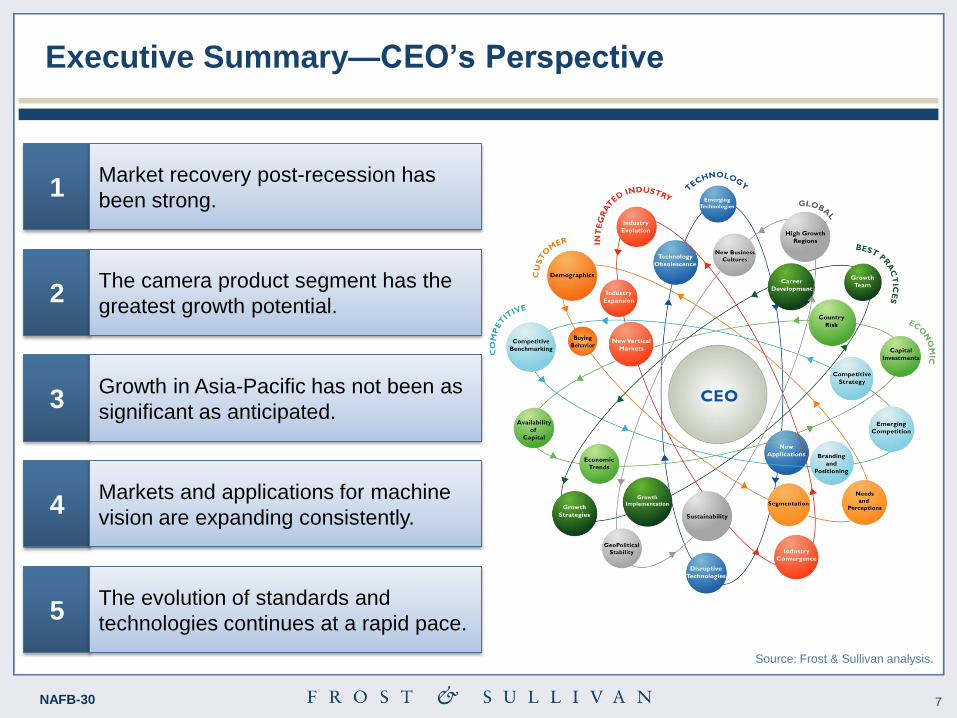
Executive Summary—CEO’s Perspective
2 The camera product segment has the
greatest growth potential.
3 Growth in Asia-Pacific has not been as
significant as anticipated.
4 Markets and applications for machine
vision are expanding consistently.
5 The evolution of standards and
technologies continues at a rapid pace.
1 Market recovery post-recession has
been strong.
Source: Frost & Sullivan analysis.

8 NAFB-30
Market Overview
9 NAFB-30
Market Overview—Definitions
In comparison to other industrial monitoring and inspection technologies, the machine
vision market is a relatively young discipline. Machine vision technologies were first used
for military inspection applications in the 1940s and 1950s, until advancements led to rapid
commercialisation of these solutions in the 1980s and 1990s.
Similar to human inspectors working on a production line, a machine vision system is used
for high-speed analysis of digital images using a combination of electronic, lighting, optic,
software, and automation technology.
For the purpose of this study, the global industrial machine vision market includes
application of vision technology to industrial applications such as manufacturing and
production environments.
Nonindustrial applications, such as traffic surveillance, security, and medical diagnostics,
have not been included in the scope of this research.
All references to revenue are in U.S. dollars.
Source: Frost & Sullivan analysis.
10 NAFB-30
Market Overview—Definitions (continued)
For the purpose of this research, Frost & Sullivan has analysed the market for machine vision systems and
components.
Vision systems—These systems include machine visions systems that are application specific and based
on personal computers (PCs), as well as standalone, fully integrated systems such as smart cameras,
embedded vision processors, and vision sensors.
Industrial Cameras—In a typical machine vision application, the camera is positioned on the production
line to capture the image of the part to be inspected. This is the most critical component of the system. This
segment includes analogue and digital cameras. Smart cameras are not included.
Optics and illumination system—Optics typically use lenses to focus the image of the object, while the
illumination or lighting system illuminates an object for viewing by the lens or camera.
Image-acquisition system, or frame grabber—The main purpose of the frame grabber is to interface with
the camera and capture the camera’s output to transfer data to a computer.
Machine vision software—Once the data are transferred to a computer, sophisticated software is used to
analyse and manipulate the image, extract information, and generate decisions based on those images.
Source: Frost & Sullivan analysis.
11 NAFB-30
Market Overview—Definitions (continued)
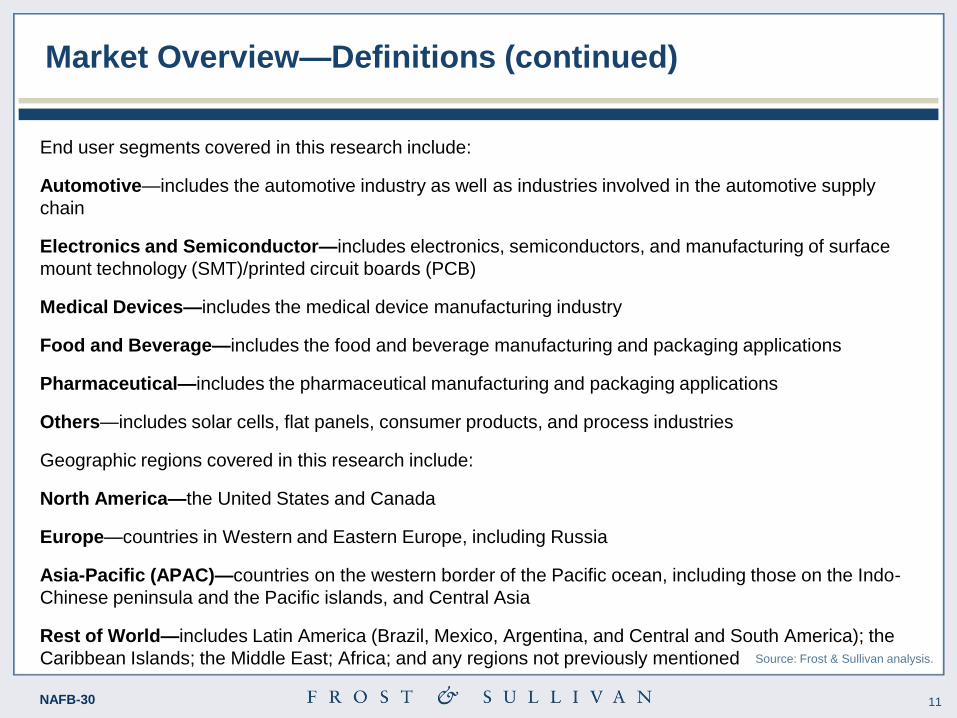
End user segments covered in this research include:
Automotive—includes the automotive industry as well as industries involved in the automotive supply
chain
Electronics and Semiconductor—includes electronics, semiconductors, and manufacturing of surface
mount technology (SMT)/printed circuit boards (PCB)
Medical Devices—includes the medical device manufacturing industry
Food and Beverage—includes the food and beverage manufacturing and packaging applications
Pharmaceutical—includes the pharmaceutical manufacturing and packaging applications
Others—includes solar cells, flat panels, consumer products, and process industries
Geographic regions covered in this research include:
North America—the United States and Canada
Europe—countries in Western and Eastern Europe, including Russia
Asia-Pacific (APAC)—countries on the western border of the Pacific ocean, including those on the Indo-
Chinese peninsula and the Pacific islands, and Central Asia
Rest of World—includes Latin America (Brazil, Mexico, Argentina, and Central and South America); the
Caribbean Islands; the Middle East; Africa; and any regions not previously mentioned Source: Frost & Sullivan analysis.
12 NAFB-30
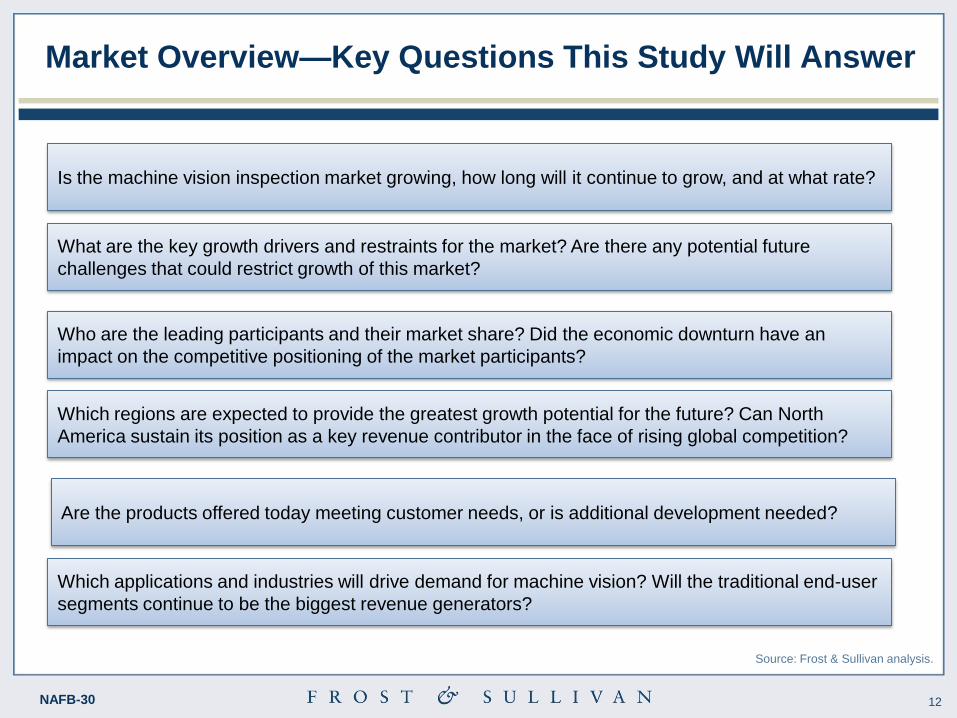
Market Overview—Key Questions This Study Will Answer
Is the machine vision inspection market growing, how long will it continue to grow, and at what rate?
What are the key growth drivers and restraints for the market? Are there any potential future
challenges that could restrict growth of this market?
Who are the leading participants and their market share? Did the economic downturn have an
impact on the competitive positioning of the market participants?
Which regions are expected to provide the greatest growth potential for the future? Can North
America sustain its position as a key revenue contributor in the face of rising global competition?
Are the products offered today meeting customer needs, or is additional development needed?
Which applications and industries will drive demand for machine vision? Will the traditional end-user
segments continue to be the biggest revenue generators?
Source: Frost & Sullivan analysis.
13 NAFB-30
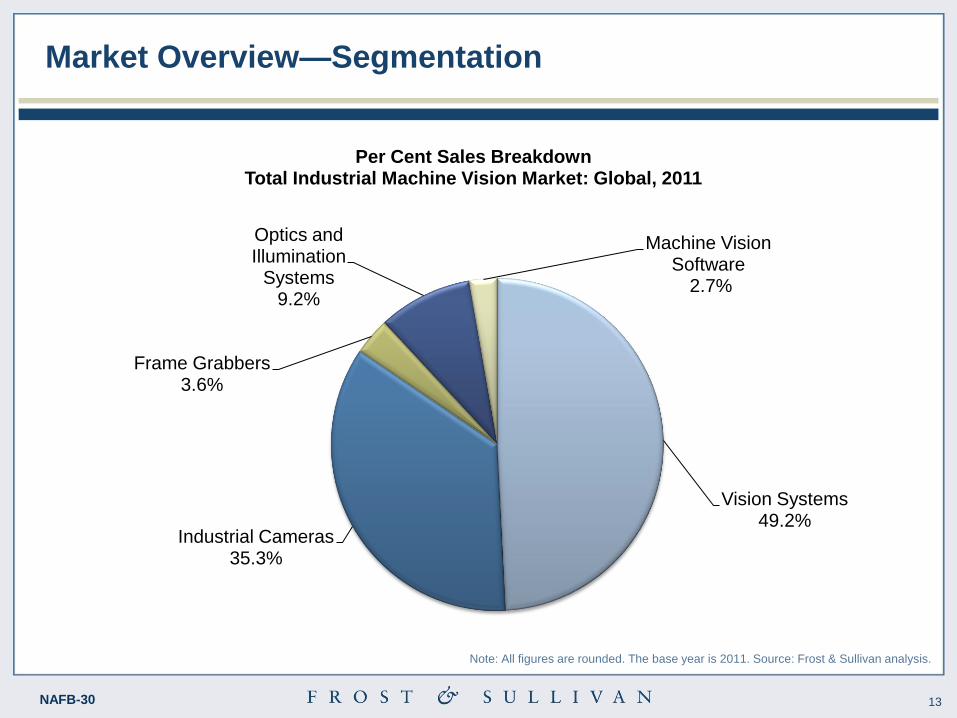
Market Overview—Segmentation
Vision Systems 49.2%
Industrial Cameras 35.3%
Frame Grabbers 3.6%
Optics and Illumination
Systems 9.2%
Machine Vision Software
2.7%
Per Cent Sales Breakdown Total Industrial Machine Vision Market: Global, 2011
Note: All figures are rounded. The base year is 2011. Source: Frost & Sullivan analysis.
14 NAFB-30
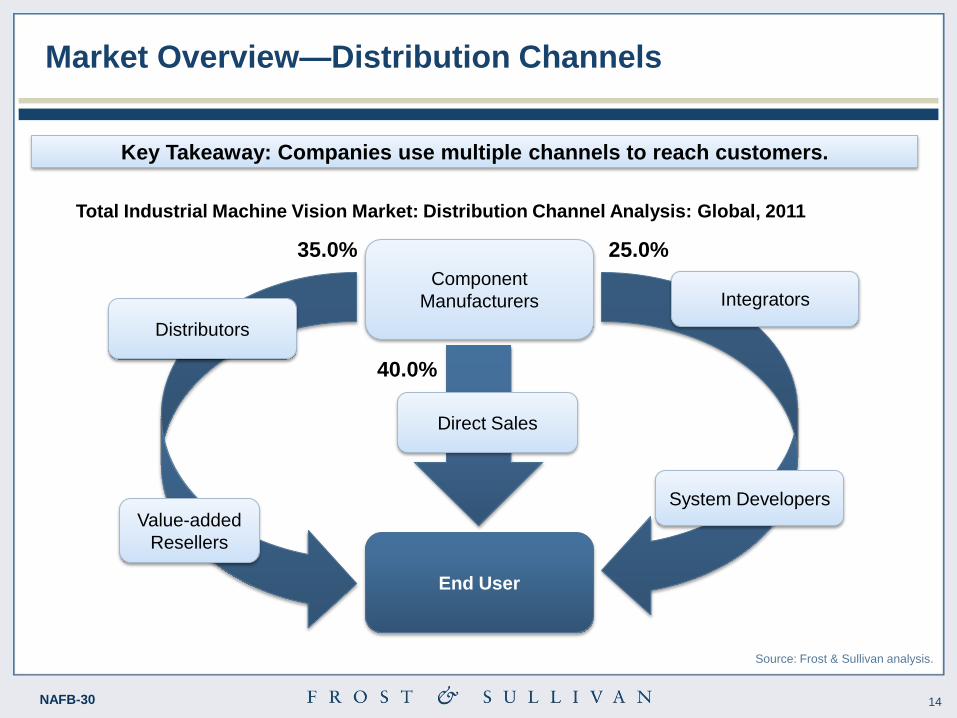
Market Overview—Distribution Channels
Component
Manufacturers
End User
Integrators
System Developers Value-added
Resellers
Distributors
Direct Sales
Total Industrial Machine Vision Market: Distribution Channel Analysis: Global, 2011
Source: Frost & Sullivan analysis.
40.0%
Key Takeaway: Companies use multiple channels to reach customers.
25.0% 35.0%
15 NAFB-30
For Additional Information
Jeannette Garcia
Corporate Communications
Measurement & Instrumentation
(210) 477- 8427