Embed Size (px)
Citation preview
ANALYSIS OF THE FEASIBILITY OF HEDGING
SCE&G’S COAL SUPPLIES FOR ELECTRIC
GENERATION
A Report Prepared in Compliance With Order No. 2009-289 of the Public Service Commission
of South Carolina
January 15, 2010

Coal Hedging Analysis January 15, 2010
2
1.0 BACKGROUND
In the 2009 Annual Review of Base Rates for Fuel Costs of South Carolina Electric & Gas Company, the Public Service Commission of South Carolina (“Commission”) reviewed South Carolina Electric & Gas Company’s (“SCE&G” or the “Company”) fuel expenses and power plant operations used in generating electricity for the period February 2008 through April 2009 in Docket No. 2009-2-E. In that matter, the parties of record entered into a Settlement Agreement which was approved by the Commission in Order No. 2009-289, dated April 30, 2009. SCE&G agreed to “perform an analysis of the feasibility, costs and potential benefits of operating a financial hedging program for its coal supplies as set out in the Settlement Agreement, including provision of a final written report to the parties and the Commission by January 15, 2010.” In fulfillment of its obligations pursuant to the Settlement Agreement and Order No. 2009-289, the Company conducted an analysis of the feasibility and prudency of implementing a financial hedging program for SCE&G’s coal supplies used for electric generation.
This report provides the Company’s analysis required by the ordering paragraph quoted above. The report first defines and provides an overview of a coal hedging program followed by a discussion of the coal marketplace, the hedging products currently offered in the coal marketplace, and a discussion of the various issues related to the implementation of a coal hedging program. The report further discusses SCE&G’s coal procurement requirements. Finally, the report contains an analysis of the feasibility of implementing a financial hedging program for SCE&G’s coal purchases.1
1 Related reference material and information on several issues raised in the body of this report are included in the appendices attached hereto.

Coal Hedging Analysis January 15, 2010
3
2.0 HEDGING OVERVIEW
To understand coal hedging, one must understand how commodity markets operate. There are two primary types of commodity marketing and trading: physical trading and financial trading. Physical commodity marketing is less complex and involves the buying and selling of physical commodities of coal with buyers and sellers negotiating physical trading contracts. Numerous types of physical trading contracts exist; however, most contracts share standard specifications including identifying the buyer and seller, the price, the type and amount of commodity to be sold, the receipt and delivery point, the tenure of the contract, and other terms and conditions.
Financial trading, on the other hand, employs sophisticated financial instruments in which the buyer and seller may never take physical delivery of the commodity. Financial trading is often used to reduce the financial risk associated with the inherent volatility of the price in all commodity markets. Buyers and sellers of commodities reduce this risk, or hedge, using a transaction process founded upon derivatives. Derivatives are financial instruments that ‘derive’ their value from an underlying commodity. Traditionally, most derivatives are traded in the over-the-counter (“OTC”) market, which is essentially comprised of a group of market participants inter-exchanging certain derivatives, as opposed to exchanging derivatives through a market such as the New York Mercantile Exchange, or NYMEX. Basic forms of derivatives used to hedge financial risk in the coal commodity marketplace include futures, options, and financial swaps.
Coal Futures:
To further explain, a short hedge, also known as an output hedge, is a hedging strategy used by coal producers. A short hedge involves taking a short futures position which is used by a producer to lock in the price of a commodity that will be sold at some point in the future while owning the underlying product or commodity to be delivered. In the event that the underlying commodity price falls, the gain in the value of the short futures position will offset the reduction in revenue from the sale of the underlying physical commodity (refer to Appendix A for an example of Short Hedging).
Coal futures are standardized, exchange-traded contracts in which the contract buyer agrees to take from the seller a delivery of a specific quantity of coal (e.g. 1550 tons, barge-load lot) at a predetermined price on a future delivery date. Consumers and producers of coal can manage coal price risk by purchasing and selling coal futures. Coal futures are also traded by speculators who assume the price risk that hedgers seek to avoid in return for an opportunity to profit from favorable coal price movement. Coal producers can employ a short hedge to lock in a selling price for the coal they produce while businesses that purchase coal may utilize a long hedge to secure a purchase price for the coal they need for some period in the future.

Coal Hedging Analysis January 15, 2010
4
A long hedge, also known as an input hedge, is a hedging strategy used by manufacturers to lock in the price of a product or commodity to be purchased at some time in the future. A long hedge involves taking a long future position which means a manufacturer or producer locks in the price of a commodity that will be required sometime in the future. Should the underlying commodity price rise, the gain in the value of the long futures position will be offset by the increase in purchasing costs.
Coal Options: An option gives the buyer the right, but not the obligation, to buy or sell an asset at a set price on or before a given date. Buyers of call options benefit when the commodity is worth more than the price set by the option (the strike price), plus the price of the option itself. Similarly, buyers of put options benefit when the price of the stock or commodity price falls below the price set by the option. In return for granting the option, the seller collects a payment (the premium) from the option buyer. If an option buyer chooses to exercise the option right, the seller is obligated to sell or buy the commodity at the agreed price. Alternatively, the buyer may choose not to exercise the right and let the option expire.
Coal Financial Swaps:
For example, a utility may need to purchase coal in the fourth quarter of 2008 (“Q4”). Should the utility choose to buy a Q4 swap on the derivatives market, the swap will increase in value if the price of coal on the spot market increases from the time of the purchase until Q4. Therefore, the profit realized from selling the swap and closing the position operates as an insurance policy against the rising physical price.
A swap is an agreement between two parties to exchange future cash flows, or “legs” of the swap, according to a prearranged formula. Usually when the contract is initiated, at least one series of cash flows is determined by a random or uncertain variable such as an interest rate or the price of a commodity price. A commodity swap is an agreement whereby a floating (market or spot) price is exchanged for a fixed price over a specified period. For example, the user of a commodity may secure a maximum price by agreeing to pay a swap seller, such as a financial institution, this fixed price. In return, the user will derive payments based on the market price for the commodity involved. Alternatively, a producer seeking to fix a set amount of income may agree to pay the market price to a financial institution in return for receiving fixed payments for the commodity.

Coal Hedging Analysis January 15, 2010
5
3.0 THE COAL MARKETPLACE AND HEDGING
3.1 The Coal Marketplace and Hedging Products The physical market for coal is comprised of both long-term and short-term contracts.
Long-term contracts (contracts greater than one year, but generally for periods of three or more years) act as a physical hedge since the contract price and other contract terms are specified in advance thereby reducing potential future price volatility. According to the American Coal Council, as much as 80% to 85% of coal used in electric generation nationwide is sold on the long-term market, usually through bilateral contracts for delivery over one year or more. The remaining purchases are divided between the spot and the OTC market.2
NYMEX first offered coal futures in July 2001 based on single barge load contracts (1,550 tons) at Big Sandy River origin. While this offering initially found few takers, a major effect of the NYMEX futures contract’s creation was the adaptation of its coal specifications into the “NYMEX lookalike” specification, which has become the eastern coal benchmark in OTC trading.
The OTC market generally manages contracts for short-term to mid-term (less than three years) deliveries, often through brokers. The spot market is based on a consumer’s request-for-proposal (“RFP”) which identifies tonnage, quality specifications and times of delivery needed. Delivery may be spread over as much as a year.
3
• Central Appalachian (“CAPP”) Coal Futures (12,000 Btu/lb coal, 1% Sulfur)
Currently, NYMEX offers three financial products that cover the major coal geographic markets; however, these products continue to have low liquidity. While a variety of coals trade in the OTC markets, the majority of the activity is based on these three NYMEX offerings:
• Eastern Rail (“CSX”) Coal Swap Futures (12,500 Btu/lb coal, 1 % Sulfur)
• Western Rail Powder River Basin (“PRB”) Coal Swap Futures (8,800 and 8,400 Btu/lb coal, 1.20 # SO2)
2 An OTC trade involves the buying and selling of equities off-exchange, as opposed to a listed stock option on a national securities exchange (such as the New York Mercantile Exchange). The OTC option is conducted between a buyer and a seller, sometimes without standardized prices and expiration dates.
3 For more information on the issue of coal trading refer to the Coal Trading Association (“CTA”), which is an association dedicated exclusively to the needs of traders, trading managers, brokers, risk managers, sales managers and purchasing managers in the coal trading industry. The CTA was established in 1999 to promote coal trading capability and liquidity in the US. The CTA develops and maintains industry standards for coal trading activity with the goal of achieving a disciplined, liquid and efficient coal trading industry. To achieve this goal, CTA develops policies, exchanges information among members and other interested professional and technical groups, and offers training programs to improve the knowledge, skills and practice tools of its members.

Coal Hedging Analysis January 15, 2010
6
The NYMEX CAPP contract is a physical futures contract. The CSX and PRB contracts trade are financial swaps that settle against the Platts OTC Monthly Broker Index. All three products utilize NYMEX’s Clearport for trade entry, trade under a standardized contract in the physical OTC market and trade under the contractual and credit guarantee of NYMEX. The following table illustrates the primary NYMEX coal derivative products and their standardized physical characteristics.

Coal Hedging Analysis January 15, 2010
7
3.2 Issues Related To Coal Hedging
3.2.1 Hedging Marketplace Requirements In order to create a tradable commodity derivative, the commodity must either be strictly
defined or ubiquitous in nature. For example, hedging is a common and widespread practice in the natural gas industry. In the electric industry, electric utilities commonly hedge as much as 25% or more of their natural gas fuel purchases for the following reasons:
• Natural gas is fungible, meaning that it is a uniform, homogeneous product in its physical properties. The physical commodity is, therefore, easy to use across multiple gas-fired generators and easy to define with respect to the physical properties or heat content of the gas itself. As such, contracts for hedging natural gas purchases are reasonably standardized. Standardization ensures that any one contract is indistinguishable from any other in terms of physical properties, heat content, quantity, and when and where a commodity is to be delivered. Therefore, all contracts for a particular commodity with the same physical characteristics on a particular date are the same. Through the standardization of contracts, a trader may, for example, sell a contract to deliver natural gas in November. The trader may then take an offsetting position by buying a contract to deliver natural gas in November. As a result, the trader can achieve a zero net position. If the trader sells natural gas for an amount exceeding his purchase price, the trader realizes a net profit. Otherwise, the trader would realize a net financial loss.
• Natural gas has a very reliable and well defined transportation system which rarely limits the deliverability of the gas.
• Natural gas has a well defined and price transparent spot marketplace.
• The natural gas marketplace is primarily comprised of short-term contracts (one year or less) and spot gas purchases. The use of longer term contracts (more than one year, but more generally for three to five years duration) to fix and stabilize prices is not commonplace.
• Natural gas prices have been historically volatile, often doubling or substantially declining over periods less than a year.
By comparison, derivatives are not so easily suitable for securing coal supply purchases largely because coal has few if any of the favorable attributes that make natural gas a good candidate for hedging. A comparison of the two commodities demonstrates quite clearly the reasons why coal is not a good candidate for financial hedging. Those reasons include:
Coal Hedging Analysis January 15, 2010
8
• Unlike natural gas, coal is not a uniform, homogenous product. Heat content, hardness, ash fusion temperature, volatility and ash content of coal commodities all vary greatly. Therefore, different types of coal cannot be used from one coal fired electric generator to another. As well, coal from different mines cannot be used interchangeably across a mix of coal fired generators. Rather, each coal fired generator is designed to use a particular coal product with physical properties specifically selected for that electric generator. It is therefore difficult to have a robust derivative coal marketplace because there is a wide variety of coal products to meet significantly varying quality demands and these differences in the physical properties of different coal products can cause substantial differences in the price of each type of coal.
• The transportation of coal, unlike gas, has proven to be problematic in terms of both capacity and scheduling. The transportation difficulties add to the complexity in trying to develop a derivatives marketplace because it increases the risks associated with derivative contracts and may significantly impact the delivered price of coal.
• Deliverability issues add to the price volatility risk and add more uncertainty into the design of appropriate derivatives contracts.
• Whereas the natural gas market is largely comprised of spot or short-term contracts (one year or less), the coal market is predominately made up of longer term (more than one year, but more generally for three to five years duration) fixed price contracts which themselves operate as a hedge against volatile prices thereby greatly diminishing (if not eliminating) the potential for dollar savings associated with hedging.
• Coal prices are not transparent due to the fact that many, if not most, coal contracts are confidential. This lack of price and contract term transparency constrains the liquidity of the coal derivative marketplace because traders of derivatives prefer a price transparent marketplace to make transactions data known in a timely fashion. Without this transparency, such transactions are risky and thus difficult for many potential market participants.
• The price of coal seldom experiences the price volatility routinely seen in the natural gas market. Consequently, if the primary reason for hedging derivatives is to reduce risk associated with price volatility, the lack of coal price volatility over the last fifty years obviates most of the need for hedging.

Coal Hedging Analysis January 15, 2010
9
3.3.2 Other Issues related to Coal Hedging
Contract Non-performance:
It should be noted that during the period under review in Docket No. 2009-2-E, certain of SCE&G’s suppliers gave notice that they would be unable to perform under the terms of their contracts for coal supply with SCE&G and asserted that any non-performance was excused due to circumstances of “force majeure” and other reasons. In order to maintain reliable coal inventory, SCE&G was required to purchase significant amounts of spot coal during the elevated market. Some of these purchases were made through a coal broker (OTC purchase). In these types of transactions, the coal broker locates a supplier willing to make spot sales of coal which meet the necessary criteria at a specified price. The purchaser does not directly interact with the suppliers and is not notified of the specific suppliers that are participating in the solicitation. Rather, the coal broker negotiates the sale and only after the purchaser contractually agrees with the coal broker to execute the purchase does the coal broker notify the purchaser of the supplier’s identity. Two of SCE&G’s suppliers under shipped their long-term contracts citing circumstances of force majeure and other problems. SCE&G made some spot coal purchases through a coal broker to maintain minimal supply inventory. The Company submitted solicitations to coal brokers and several suppliers submitted bids to the brokers in response. The two nonperforming vendors were the successful bidders to two of the solicitations. However, only after the purchase was closed and the coal broker provided SCE&G with confirmations of the sales did the Company learn that the spot coal would be supplied by the nonperforming vendors. Because spot coal purchases are made pursuant to a contract with the coal broker and not directly with the supplier, SCE&G was contractually obligated to honor the solicitation and, therefore, purchase the coal being supplied by the nonperforming vendors. However, the Company contacted the suppliers in question to inquire why they were able to supply coal on the spot market but were unable to perform pursuant to their long-term contracts with the Company. The suppliers responded that rail transportation was then available to ship the purchase of spot coal whereas it had been previously unavailable to ship SCE&G’s coal pursuant to its long-term contracts. After these two incidents, SCE&G informed coal brokers that it would not accept spot
One of the main reasons for hedging any commodity is to reduce price variability associated with exogenous marketplace variables. In the coal industry, some of these exogenous marketplace variables include largely unpredictable events such as coal mines labor strikes, railroad labor strikes, or environmental issues resulting in coal mine closures. These types of circumstances will almost undoubtedly lead to increasing near term coal prices, suggesting that a hedging program may provide significant financial benefits in such a situation. However, when these types of events occur, a force majeure clause negotiated in a coal or derivative contract often removes the financial liability associated with the financial derivative resulting in a hedging strategy that may have little if any value. Despite these protections, these types of situations are often cited as a primary contributor to historical fluctuations in the coal marketplace. Consequently, any analysis of potential financial impacts related to coal hedging must consider whether the price volatility being considered has negated the hedging opportunity by virtue of a force majeure circumstance.
Coal Hedging Analysis January 15, 2010
10
coal from the two suppliers in question and none of SCE&G’s other spot purchases were supplied by nonperforming vendors.
Additionally, history has demonstrated that coal companies occasionally avoid performing on supply contracts by declaring bankruptcy. Some industry observers believe this legal strategy is sometimes a means for coal companies to avoid low priced coal contract obligations, not dissimilar to SCE&G’s experience noted above. Furthermore, the bankruptcy option is not foreign to the coal industry. Below are some examples within the last six years:
• In November of 2002, Horizon Natural Resources Co., formerly AEI Resources, the second largest coal producer in central Appalachia, filed for reorganization under Chapter 11 of the U.S. Bankruptcy Code for the second time that year after reporting a net loss of $185.4 million for the first nine months of that year. The company stated that falling coal prices were among the reasons that it sought bankruptcy protection.
• In January 29, 2002, Pen Holdings Inc., a coal producer with mines south of Charleston and in Wayne County, filed voluntary bankruptcy petitions with the U.S. Bankruptcy Court for the Middle District of Tennessee.
• In October of 2002, Anker Coal Group Inc. and 18 subsidiaries filed for Chapter 11 bankruptcy protection. The company operated deep and surface mines in West Virginia, Pennsylvania and Maryland. Over this same time period, Steven F. Leer, Arch Coal Corporation’s President and CEO, in reporting his company’s 3rd quarter, 2002 operating results, commented that “[d]uring the past 18 months, many traditional eastern coal producers have closed mines, filed for bankruptcy protection or even exited the business.”
• Buffalo Coal Company, a Northern Appalachia coal producer, sought bankruptcy protection in May 2006.
• Black Diamond Mining Company, LLC, entered bankruptcy in February 2008.
Regulatory Issues: As has been the experience with regulated natural gas utility hedging, state utility regulators often monitor and limit a regulated electric utility’s potential coal hedging activities to reduce the financial and other risks associated with hedging coal. For example, state regulators may choose to limit the amount of allowable coal purchases to be hedged. In the case of regulated natural gas distribution utilities, state regulators often limit the level of hedging to 25% to 50% of firm purchases. This same limit would be inappropriate for coal primarily because 80% or more of SCE&G’s coal purchases are long-term contracts which themselves provide a physical hedge against coal price volatility. When determining the amount to hedge financially, one would first have to subtract any fixed price physical deals from the expected
Coal Hedging Analysis January 15, 2010
11
volume. Furthermore, it is generally not recommended that utilities hedge their entire fuel supply; rather, it is advisable for utilities to leave a portion of their purchases open in the event that prices fall or the actual fuel needs of the utility vary as compared to forecasted needs. Therefore, after allowing for fixed price physical deals, an allowance for a portion of the portfolio to be priced at spot prices, and a reasonable forecast variability, only a very small quantity of coal remains for consideration as the foundation of a financial hedging program.
Another regulatory issue surrounding hedging for coal purchases is that hedging, by definition, attempts to reduce the volatility of prices, but that, over time, hedging will not lower the long-term cost of the hedged product. Rather, the cost of operating a hedging program will likely create long-term average cost increases for the hedged product. Therefore, for a utility to enter into a hedging program it must have reasonable assurance in advance that regulators will allow full cost recovery for any hedged fuel and not allow intervening parties, who rely on hindsight, to evaluate whether to allow full recovery of the fuel costs.
A third regulatory related problem requiring resolution is whether or not hedging costs may be recovered through the State’s fuel adjustment mechanism. The statute is unclear on this critical cost-recovery issue and would require clarification if a coal hedging program was determined to be advisable.
Costs of a Hedging Program:
For example, in terms of the actual dollar cost (or price) of hedging, a Central Appalachian Coal Option “put” represents an option to assume a short underlying Central Appalachian Coal futures contract traded on the Exchange. The Central Appalachian Coal Option “call” represents an option to assume a long underlying Central Appalachian Coal futures contract traded on the Exchange. The “strike price” is offered in increments of $2.50 per ton above and below the at-the-money strike price. Strike price boundaries are adjusted according to futures price movements.
The implementation of any hedging program will add costs to a utility’s fuel purchasing program. These include the costs of the financial derivatives used in any hedging program as well as the costs of designing, implementing, and maintaining the hedge program which can include both employees, outside consultants, and software. The utility will also experience accounting issues that may or may not be easily incorporated into the Company’s current accounting software. Finally, as mentioned above, the fuel costs associated with the hedging could theoretically be higher than anticipated, which will be dependent on whether the price of future coal is higher or lower than what was expected when a particular hedge is initiated. For example, if prices decrease from when a hedge is initiated, all other things being equal the costs of any un-hedged coal will likely be lower than the hedged coal. As well, the purpose of a hedging program is to reduce price volatility which can only be obtained at a cost. Therefore, while any particular hedge might increase or decrease the cost of coal in a particular instance, over the long term and on average, a hedging program will increase the cost of coal.

Coal Hedging Analysis January 15, 2010
12
Accounting Impacts:
Hedge accounting has proven to be difficult in almost all industries because of the complexities in the accounting rules and infrastructure necessary to document, test, and track all the hedging relationships. Financial Accounting Standards 133 and 138 (FAS 133/138) apply to derivative instruments and certain hedging activities. These standards require all derivatives and certain embedded derivatives to be reported on a company’s balance sheet at fair value, i.e. mark-to-market. The issue to consider with coal hedging is not only the accounting treatment, but the potential impact on earnings relative to these standards. Typically, these standards require changes in the fair value of derivatives to be recorded through earnings which is an issue to consider before implementing coal hedging.

Coal Hedging Analysis January 15, 2010
13
4.0 SCE&G’S COAL FUEL REQUIREMENTS AND PURCHASING PROCEDURES
4.1 SCE&G’s Coal Fired Generation Facilities and Related Coal Demand In 2008, SCE&G reported that 65.3% of its total kWh output was produced by coal
burning facilities.4
Historically, coal has provided this same general percentage of total electricity demanded by SCE&G’s customers. The Company has ten coal-fired generating units with 2475 MW of capacity. As well, it is important to note that these coal-fired generating facilities are considered to be “baseload” generating facilities that are expected to run in a continuous nature to meet some or all of a given region’s continuous energy demand. For this reason, the coal supply for these facilities is critical – particularly in terms of supply reliability.
The historical operating performance of these coal-fired facilities has been outstanding. For example, in the December 2008 issue of Electric Light & Power, SCE&G was recognized for having three of its plants listed in the top 20 most energy efficient coal fired plants in the nation during calendar year 2007. Cope Station ranked 4th, McMeekin Station ranked 11th, and Williams Station ranked 16th. This ranking means that three of the Company’s six coal fired plants which represent 50% of the Company’s coal-fired generating capacity are ranked in the top 20 plants in the country for efficiency. In total, the Company’s coal burning plants burned 6,401,275 tons of coal in 2008 in the production of electricity for its customers. 4.2 SCE&G’s Coal Purchasing Practices
SCE&G’s Fuel Procurement Department is responsible for purchasing all necessary coal and associated transportation for the Company’s fossil plants. The Company’s coal purchasing activities are predicated on the fact that coal is the fuel for much of the Company’s baseload capacity. It is simply unacceptable and contrary to prudent electric utility practices to allow a coal fired baseload facility to risk fuel shortages as this could have a significant impact on the Company’s ability to meet its customers’ energy demands and its regulatory obligations pertaining to the provision of adequate and reliable service. In meeting these policy objectives, the Fuel Procurement Department must purchase coal that meets the operational and environmental needs of the particular facility for which the coal is being purchased.
In meeting the coal supply needs of the Company’s facilities while adhering to the
purchasing policy objectives, SCE&G maintains an active list of qualified suppliers of coal used to power its plants. SCE&G uses several methods to analyze the fuel supply and demand factors to determine the level of coal needs. In preparing the short-range sales forecast, the Company divides its customers into detailed forecasting groups defined by rate and class. Where possible, customers are further divided into electric space heating and non-electric space heating groups. 4 SCANA Corporation 2008 Statistical Information.

Coal Hedging Analysis January 15, 2010
14
Residential customers are further separated into those living in either single-family, multi-family or mobile homes. SCE&G also forecasts consumption for about twenty of its largest industrial customers on an individual basis while the balance are separated into 2-digit SIC groups. Where a detailed customer group contains a large number of homogeneous customers, separate econometric models are developed to project the number of customers and the average use per customer based on such factors as population growth, and levels of economic activity within SCE&G’s service territory. All residential groups and small commercial groups are projected in this way. Weather is a significant factor in the residential and commercial models and projections are based on normal weather where normal is defined as the average taken over the last fifteen years. Overall, nearly 100 econometric and statistical models are utilized to develop the short-run forecast.
SCE&G simulates the dispatch of our generating units with the software program PROSYM, a well-accepted tool in the industry being used by over 100 utilities. PROSYM is a chronological hourly dispatch model. In each hour of the study period, PROSYM arranges all of the available supply sources from lowest cost to highest and then determines the least-cost method of meeting customer load in that hour while considering a complex set of operating constraints. As part of this dispatching process, PROSYM also simulates random unscheduled outages of our plants based on forced outage rates. The PROSYM model output defines how the SCE&G electric system will meet the projected electric load. This information provides an appropriate forecast for projecting plant dispatch rates and fuel usage.
Fuel usage levels are calculated and forecasted for each of the generating plants. Coal inventories are then validated and contract quantities are summed and compared against system usage to determine needs going forward. Typically, as contracts expire or needs are identified, solicitations are tendered for competitive sealed bids. With this information, Fuel Procurement looks at the coal requirements and determines whether contract options, spot purchases or additional long-term agreements are appropriate. Coal is procured with long-term (more than one year) and spot purchase (up to one year) agreements to achieve a balance of reliable supplies, while maintaining flexibility to react to market changes or short-term system needs.
Typically, SCE&G’s long-term purchases represent approximately 75 to 80 percent of projected system demand. These long-term contracts help shield SCE&G’s customers from the price volatility of the spot market while also providing a physical hedge against unexpected increases in the price of coal. Thus, the Company already has in effect a significant physical hedging program. The remaining amount of coal needed to generate electricity is acquired through spot purchases which allow the Company to successfully manage its inventories and react to short-term changes in the marketplace. Throughout the years, SCE&G has been successful in leveraging long-term and short-term coal purchases to achieve reasonable purchase prices while insuring the reliability of coal supplies necessary to support system needs.
As part of it coal fuel strategy which has been approved in prior hearings by the Commission, the Company attempts to maintain approximately a 925,000 ton inventory of coal based on the average of each of twelve months’ ending inventories to support anticipated

Coal Hedging Analysis January 15, 2010
15
consumption. This methodology allows for an inventory of more than 925,000 tons at the beginning of high demand periods and less than 925,000 tons entering the milder months. Experience has shown, and the Commission has agreed, that this inventory level is reasonable and aids in protecting SCE&G’s customers against availability, production and delivery problems that may arise in the coal industry from time to time. It also affords the coal resources necessary to meet our supply needs when short-term market prices are unfavorable. It is always important to balance short-term decisions against long-term requirements and future operating conditions.
While coal supply reliability is the essential policy objective in order for the Company to meet its customers’ electric demands and the Company’s regulatory obligations, the Company also works diligently to achieve an optimization between adequate supplies at reasonable prices. Although they have historically remained relatively stable, coal markets may fluctuate due to such things as seasonality, political turmoil, national weather trends and supply/demand imbalances. SCE&G’s Fuel Procurement Department strives to use a variety of pricing mechanisms among coal contracts to mitigate or normalize the effects on prices created by changes in market conditions. The Fuel Procurement Department also monitors coal price information such as indexes and stays informed about market trends and conditions. This information flow is integral in the Company’s ongoing analysis of current or prospective coal costs and market conditions as the Fuel Procurement Department is continuously balancing adequate coal inventories against long-term coal contract supplies, spot market purchases and contract options.

Coal Hedging Analysis January 15, 2010
16
5.0 THE POTENTIAL COSTS OR BENEFITS FROM AN SCE&G COAL HEDGING PROGRAM 5.1 Introduction
Section K of the Settlement Agreement in Docket No. 2009-2-E specified that SCE&G would “receive and consider input from a Party regarding the design of the analysis and the factors to be included in the analysis for evaluation.” This third party input was to be received within sixty days of the Order approving the Settlement Agreement, or by June 29, 2009. SCE&G received no additional input from any party within the timeframe specified in the Settlement Agreement.
The remaining instructions outlined in the Settlement Agreement called for a methodology that considered the “[t]he volumes of coal that are the subject of this analysis” and the potential use of forecasted data “supplemented by all relevant data.” In addition, the analysis is to “explicitly address, among other things, electric system demand, weather, plant operating characteristics, forced outages, scheduled plant outages, and the market price of power.” To incorporate the parameters cited above “supplemented by all relevant data,” the Company performed an analysis that was based primarily on several years of actual coal purchasing data, such as coal contracts, contract terms and prices, delivery schedules, coal purchase volumes, and derivative pricing information. Using this actual coal purchasing data explicitly incorporates all of the characteristics cited above that relate to the use of coal in generating electric power, including coal usage, weather related coal usage patterns, system demand, coal plant performance and outages, and all other data relevant to the Company’s overall demand for coal.
However, it should be recognized that this historical data is somewhat limited due to the fact that coal hedging tools and coal spot market price data were largely unavailable before 2003. Notwithstanding this limitation, the Company undertook several different analyses using historical coal futures prices and historical SCE&G coal contract data. These analyses compare the coal costs the Company actually incurred versus what would have been incurred had the Company employed various types of hedging tools. This type of analysis clearly demonstrates that the resulting conclusions of the efficacy of a coal hedging program are based on actual facts and data as opposed to conclusions based on assumptions and suppositions.
5.2 Long-term Contract Hedging Analysis
5.2.1 Background
Longer term contracts, generally of duration for three or more years, represent approximately 80% of SCE&G’s coal purchases. One of the primary reasons to purchase coal through longer term contracts is that the Company’s coal-fired generation fleet is predominately baseload generation, meaning it is in continual operation. Therefore, an ongoing, reliable supply of coal is an absolute necessity to ensure that SCE&G’s coal generating facilities have adequate

Coal Hedging Analysis January 15, 2010
17
fuel to consistently and constantly generate electricity. Long-term types of coal purchases are generally for very large quantities, establish coal shipments over more than one year, if not over several years, and mandate that the delivery of the coal is a top priority in terms of need. These coal contract requirements, coupled with SCE&G’s practice of limiting spot coal purchases to around 20% of supply, restricts the applicable hedging tools to those tools which essentially guarantee the delivery of coal at a specified time.
Specifically, only coal futures and coal swaps can reasonably be used to hedge these long-term contracts, while a coal call option would not be a reasonable hedge alternative for the longer term contracts. A call option gives the buyer the right, but not the obligation, to purchase coal commodities. With SCE&G’s reliance on deliverability and specified inventory levels, it is impractical to assume that it could purchase coal options in lieu of long-term contracts and in those months of higher coal prices choose not to take delivery of this coal under the option contract. Such a scenario would mean that the Company would have to be willing to either allow coal inventories to decline or to purchase the “call optioned” coal through the spot market. This latter result assumes that a sufficient coal supply was available on the spot market and deliverable as needed. This assumption is unreasonable given the Company’s past experience with various suppliers and spot market purchases. Furthermore, reliance upon call options in lieu of long-term contracts would inherently place the Company into the short-term, spot market for a larger percentage of its coal purchases than it has historically used. Therefore, the two hedging instruments that are realistically available for SCE&G to employ in its longer term contracting practices are futures and swaps.
Historical long-term coal contract and price data can also be used to determine if there are benefits or costs related to employing either futures or swaps in the Company’s long-term coal purchasing practices. The Company used this data to analyze whether, at the time a long-term contract was initiated, the Company could have contracted for a coal future or swap that resulted in known cost savings over the term of the contract.
5.2.2 Would Futures Contracts Have Lowered Coal Costs as Compared to SCE&G’s Long-Term Contracts?
To determine whether employing financial derivatives would have resulted in savings for the Company’s fuel purchases, SCE&G compared the actual cost of coal purchased in historical long-term contracts to the actual price of futures contracts that were available at the time the long-term coal contract was executed. From a mathematical perspective, this comparison, using the futures market price, is essentially the same as comparing the settlement price of a swap contract to the long-term contract coal prices, assuming that both the futures price and the swap settlement price were established around the date the long-term contracts prices were consummated. The reason this swap contract analysis is effectively equivalent to a future based analysis is predicated on the premise that whether one purchases a coal futures contract on date X, or a coal swap contract on date X, the per ton price of coal for either derivative is established based on similar forecasts of future coal prices. Thus, the only quantitative difference in these
Coal Hedging Analysis January 15, 2010
18
two derivative contracts, assuming both were executed on the same day, is the difference in the price of the premium between a futures contract and a swap. For this analysis, it is assumed that this difference in premiums is negligible as compared to the underlying total cost of the coal contract. Therefore, this analysis only compares the cost of a futures contract to the actual cost of the Company’s long-term coal purchases.
The actual analysis requires the following data:
• A list of the long-term coal contracts, their delivery dates, delivery volumes, price and other terms (data available from SCE&G’s long-term coal contracts);
• The date the long-term contract price was established (which is prior to the contract initial delivery date);
• The price for a coal future or swap (with appropriate coal specifications) at the time that SCE&G established prices in its long-term coal contract; and
• Any other costs for the futures or swap contract, such as the cost of the premium.
The analysis is limited to long-term contracts beginning no earlier than November 2003 due to the fact that that is the first month that sufficient data on coal futures prices was available.
The Company then compared the actual contract price of coal per month for the thirty-four non-import long-term contracts the Company entered during the five-year period between late 2003 through 2008 to the price of a futures contract assuming a futures contract had been used rather than the long-term contract. The Company reviewed futures contracts’ prices from information provided by United Power, Inc. The date that prices were finalized for each long-term contract was assumed to be sixty days prior to the start date of the contract, except in those cases where data was available indicating otherwise. SCE&G used the consummation date of the contract to determine futures contracts’ prices for the comparison assuming that at the date of contract price consummation, the futures prices would also be known at that time. A sample of the spreadsheet used for each long-term contract analysis is shown in Table 5.1, and the corresponding worksheets are provided in Appendix D.

Coal Hedging Analysis January 15, 2010
19
TABLE 5.1: SAMPLE OF WORKSHEET USED TO ESTIMATE DIFFERENCE IN TOTAL COST USING LONG-TERM CONTRACTS VERSUS FUTURES CONTRACTS
CONTRACT
START DATE
DATA FOR FUTURES FROM UPI SHEET 11/3/03
Supplier A
8/1/2003
Tons per month
Actual Contract Price $/ton
Future Price $/ton
Cost of future per ton
Contract Price Minus Future Price per ton
Total monthly savings or (cost) to ratepayers using physical contracts as compared to futures
2004 JAN 30,000 $ 32.90 $ 34.40 $ 0.05 $ 1.55 $ 46,500.00
FAB 30,000 $ 32.90 $ 34.40 $ 0.05 $ 1.55 $ 46,500.00
MAR 30,000 $ 32.90 $ 34.40 $ 0.05 $ 1.55 $ 46,500.00
APR 30,000 $ 32.90 $ 34.50 $ 0.05 $ 1.65 $ 49,500.00
MAY 30,000 $ 32.90 $ 34.50 $ 0.05 $ 1.65 $ 49,500.00
JUNE 30,000 $ 32.90 $ 34.50 $ 0.05 $ 1.65 $ 49,500.00
JULY 30,000 $ 32.90 $ 34.65 $ 0.05 $ 1.80 $ 54,000.00
AUG 30,000 $ 32.90 $ 34.65 $ 0.05 $ 1.80 $ 54,000.00
SEPT 30,000 $ 32.90 $ 34.65 $ 0.05 $ 1.80 $ 54,000.00
OVT 30,000 $ 32.90 $ 34.85 $ 0.05 $ 2.00 $ 60,000.00
NOV 30,000 $ 32.90 $ 34.85 $ 0.05 $ 2.00 $ 60,000.00
DEC 30,000 $ 32.90 $ 34.85 $ 0.05 $ 2.00 $ 60,000.00
TOTAL CONTRACT SAVINGS (COST) $ 6,300,000
In performing the analysis there were two limitations. First, as previously mentioned,
futures pricing data was not available prior to November of 2003. Second, futures prices were limited to three years or less, depending on the start date of the contract. This meant that a price comparison between the actual contract price versus a futures contract price was not available in the outlying years of some long-term contracts.
The overall results of this analysis are summarized in Table 5.2 below. As this table
demonstrates, the overall experience indicates that SCE&G has saved in excess of $148 million by using long-term contracts as compared to the option of using futures contracts in lieu of these long-term contracts. As might be expected, in some of the contract analysis shown in Table 5.2 the results indicate that hypothetically entering a futures contract could have, on occasion, yielded some cost benefits over the actual long-term contract prices the Company paid. However, on those few occasions when a futures contract might appear, in this analysis, to have

Coal Hedging Analysis January 15, 2010
20
been slightly less expensive than the negotiated contract price, there could be other reasons for the Company to enter into a long-term contract, such as supplier reliability, that might be reflected in a negotiated price. SCE&G would also have sacrificed reliable deliverability of its coal purchases when employing futures contracts for coal purchases. Additionally, the overall result favored the continued use of the Company’s current long-term contracting practice over the use of futures contracts. Finally, as discussed earlier, the mathematical results for comparing long-term contracts to futures contracts should yield similar results to a comparison of long-term contracts to swaps. In short, the analysis demonstrates that, in general, SCE&G’s coal procurement team is signing long-term coal purchasing contracts that have been historically favorable to rate payers given the pricing knowledge available at the time of contracting.
TABLE 5.2: COMPARISON OF SCE&G’S LONG-TERM CONTRACTS VERSUS USING FUTURES CONTRACTS
CONTRACT CONTRACT START
DATE ESTIMATED CURRENT CONTRACT SAVINGS VERSUS USING FUTURES
(BENEFITS)
Supplier A 8/1/2003 $ 1,395,000.00
Supplier B 10/1/2003 $ 594,000.00
Supplier C 8/1/2003 $ 1,323,000.00
Supplier D 1/1/2004 $ (437,400.00)
Supplier E 1/1/2004 $ 615,600.00
Supplier F 9/1/2003 $ 1,390,000.00
Supplier G 1/1/2004 $ 3,080,015.40
Supplier H 4/1/2004 $ (2,199,600.00)
Supplier I 4/1/2004 $ (1,140,600.00)
Supplier J 1/1/2004 $ (408,000.00)
Supplier A 1/1/2004 $ 135,000.00
Supplier A 1/1/2005 $ 17,437,500.00
Supplier J 1/1/2005 $ 1,333,500.00
Supplier K 1/1/2005 $ 1,569,000.00
Supplier L 12/1/2004 $ (310,500.00)
Supplier M 1/1/2005 $ 5,463,000.00

Coal Hedging Analysis January 15, 2010
21
Supplier D 1/1/2005 $ 17,152,500.00
Supplier N 1/1/2005 $ 12,303,000.00
Supplier O 1/1/2005 $ 23,002,500.00
Supplier P 3/1/2005 $ (501,250.00)
Supplier Q 1/1/2007 $ (1,952,494.20)
Supplier R 1/1/2007 $ 5,040,000.00
Supplier G 1/1/2007 $ (4,343,000.00)
Supplier S 1/1/2007 $ 262,500.00
Supplier A 1/1/2008 $ 20,159,955.40
Supplier J 1/1/2008 $ (10,968,000.00)
Supplier T 1/1/2008 $ 8,049,000.00
Supplier U 1/1/2009 $ 5,047,200.00
Supplier K 1/1/2009 $ 13,548,000.00
Supplier K 1/1/2009 $ 7,878,000.00
Supplier V 1/1/2009 $ (5,299,875.00)
Supplier W 1/1/2009 $ (1,791,000.00)
Supplier Q 1/1/2009 $ 4,759,977.60
Supplier X 6/1/2008 $ 26,287,200.00
TOTAL SAVINGS OR (COSTS)
$ 148,473,729.20
5.3 Short-term Or Spot Market Hedging Analysis
5.3.1 Background
Spot market coal purchases are generally purchases of one year or less and represent approximately 20% of SCE&G’s coal purchases. These spot purchases augment the longer term contracts employed by SCE&G and allow the Company flexibility in coal delivery schedules to help manage inventory and the ability to take advantage of coal or delivery price movements. The quantity purchased in these types of coal purchases can vary dramatically, from a few thousand tons per month to ten thousand or more tons per month.
Coal Hedging Analysis January 15, 2010
22
The financial derivatives available for these shorter term purchases generally include futures, financial swaps, and call options. The Company first used historical short-term coal purchasing and price data to determine whether employing any of the available financial derivatives in SCE&G’s short-term coal purchasing practices might be beneficial. The Company also analyzed known historical spot market and futures pricing data.
5.3.2 Would Futures or Swaps Have Lowered Coal Costs as Compared to SCE&G’s Spot Market Coal Purchases?
In comparing the actual historical cost of coal purchased by the Company using spot market contracts to the actual price of futures contracts that were available at the time the spot market contracts were executed, the Company reviewed over 130 non-import short-term contracts employed between January 2004 through December 2008. As with the long-term contract analysis, the comparison of a futures contract to spot market purchases is roughly equivalent, from a mathematical analytical perspective, to the same comparison using a swap contract.
The actual comparison of the spot market purchase prices to an optional futures contract requires the following data:
• A list of the spot market contracts, their delivery dates, delivery volumes, price and other terms (data available from SCE&G);
• The date the spot market price was established (which is usually just prior to the contract initial delivery date);
• The price for a coal future or swap (with appropriate coal specifications) at the time that SCE&G established prices in its spot market coal purchases; and
• Any other costs for the futures or swap contract such as a premium.
Because of data limitations the analysis was limited to spot market purchases beginning in 2004.
To perform the comparison which is more fully provided in Appendix E, the Company compared the actual spot market purchase price for coal per month for each spot market purchase to the price of futures contracts, assuming a futures contract had been used rather than the spot market purchase. This analysis exempted import coal, which could not be compared absent the addition of delivery costs. Futures prices were obtained from information provided by United Power, Inc. Spot market purchase price dates were based on information provided by SCE&G and this was also the date used to establish comparable futures contract prices. The spreadsheet analysis is similar to that used for the analysis of long-term contracts, except that the actual number of spot market purchases, though not the coal volumes, exceeded the number of long-term contracts.

Coal Hedging Analysis January 15, 2010
23
The overall results of this analysis are summarized in Table 5.3 below. As this table shows, SCE&G has generally saved several million dollars each year by using its spot market purchasing techniques as compared to the option of using futures contracts. As might be expected, in some of the contract analyses shown in Appendix E and reflected in Table 5.3 in 2007, employing futures contracts for short-term coal purchasing could, on occasion, have yielded some lower costs over straightforward spot market contract purchases. However, SCE&G would have sacrificed reliable deliverability of its coal purchases when employing futures contracts for coal purchases. Additionally, the overall results heavily favor the continued use of spot market purchases rather than using futures contracts. As discussed earlier, the results of comparing a spot market contract to a futures contract should yield very similar results to a comparison of spot market contracts to swaps. Another conclusion supported by this analysis is that in general, SCE&G’s coal procurement team has historically been using the spot market to the benefit of rate payers given the pricing knowledge available at the time of contracting.
TABLE 5.3: COMPARISON OF SPOT MARKET PURCHASES VERSUS EMPLOYING FUTURES CONTRACTS
CONTRACT YEAR
TOTAL SAVINGS USING SCE&G TYPICAL SPOT MARKET
CONTRACTS VERSUS POTENTIAL (BENEFITS) USING FUTURES FOR
SPOT MARKET PURCHASES
2004 $ 2,272,639.04 2005 $ 834,825.00 2006 $ 20,977,900.00 2007 $ (459,694.70) 2008 $ 4,472,508.00
The Company also analyzed historical coal prices and futures prices, without any
comparison with the Company’s actual coal contracts. This analysis assumed that, unlike longer term contracts, the Company could rely on the spot market to provide sufficient short-term coal if it were willing to pay the prevailing market price. The Company also assumed that near the first of every month, beginning in 2004, and for every month thereafter through September 2009, the Company could either enter into a six-month, nine-month, or twelve-month futures contract (or swap, which would use the same analysis) for short-term coal purchases, or simply purchase coal each month in the spot market at prevailing spot market price. The analysis then compared the cost difference had the Company entered into a futures contract as opposed to simply waiting and purchasing the coal in the spot market on a monthly basis. Consequently, this analysis does

Coal Hedging Analysis January 15, 2010
24
not pick and choose which month to enter a futures contract, but rather assumes a futures contract is entered every single month for coal purchases some six, nine and twelve months out. This analysis represented a sample size of some 69 months and over 200 potential futures contracts. The futures prices at the beginning of each month for all three different futures options were then compared to the actual spot market price of coal six, nine, or twelve months later. The Company believes these timeframes are reasonable in that they cover several potential types of short-term futures contracts and are consistent with some of the futures contract options discussed by the intervenors in Docket No. 2009-2-E. The actual comparison of the spot market purchase prices to futures contract required the following data:
• The monthly price of coal futures (or swap) six, nine, and twelve months out; and
• The spot market price of coal near the beginning of each month under the assumption that this is a reasonable proxy for the price the Company would have paid at the time for a month’s worth of spot market coal.
The analysis is limited to spot market purchases beginning in 2004 due to the fact that this is the first month that coal futures prices were available.
To perform the comparison which is more fully provided in Appendix F, the Company compared the actual spot market potential purchase price for coal per month to the price of coal futures some six, nine and twelve months earlier. The futures prices and monthly spot prices were obtained from information provided by United Power, Inc., augmented where necessary by data from SNL.
Table 5.4 illustrates how this analysis was actually performed. For example, assume a six-month futures contract was purchased in January 2004 at the indicated price of $38.50 per ton. Alternatively, rather than enter a futures contract in January for June coal, the Company assumed that it entered into a short-term (one-month) contract to purchase spot coal six months later in June at the then prevailing price of $56.00 per ton to determine which of the two coal purchasing options produces the lowest purchase price for coal. In this particular case, entering a futures contract in January would have saved the Company $17.50 per ton as compared to purchasing the coal in June on the spot market. A similar analysis was used for both the nine- and twelve-month futures contracts.

Coal Hedging Analysis January 15, 2010
25
TABLE 5.4: EXAMPLE OF COAL FUTURES VERSUS MONTHLY SPOT PRICING COMPARISON
Year Month
Last week of Prior Month Actual Price per Ton for Following Month
Coal Futures Pricing at First of Month
Assume Buying Futures- Current Month Price Less Futures Price (positive value indicates using a futures contract would have saved
money on a $ per ton basis)
6 Month Spot price per Ton
9 Month Spot Price per Ton
12 Month Spot Price per Ton
Assume Bought 6- Month Future
Assume Bought 9- Month Future
Assume Bought a 12- month Future
2004 Jan $37.80
$ 38.50 $ 39.00 $ 39.20
$ 17.50 $ 24.00 $ 21.55
Feb $44
$ 44.85 $ 44.88 $ 42.50
$ 11.65 $ 20.12 $ 12.00
March $52
$ 55.25 $ 55.25 $ 52.00
$ 3.25 $ 8.25 $ 5.00
April $55
$ 55.00 $ 55.00 $ 50.50
$ 8.00 $ 5.75 $ 8.75
May $54
$ 54.00 $ 50.00 $ 47.00
$ 11.00 $ 4.50 $ 12.75
June $56
$ 58.00 $ 55.00 $ 52.25
$ 5.50 $ 2.00 $ 9.75
July $56.50
$ 58.25 $ 58.25 $ 56.25
$ 2.50 $ 1.00 $ 0.25
Aug $58.50
$ 60.00 $ 57.50 $ 56.25
$ (5.50) $ 2.25 $ (1.50)
Sept $63
$ 61.50 $ 58.00 $ 56.00
$ (4.50) $ 4.00 $ (1.00)
Oct $65
$ 62.00 $ 59.90 $ 57.75
$ (2.75) $ (3.40) $ (3.75)
Nov $63.50
$ 58.75 $ 57.75 $ 56.50
$ 1.00 $ (3.00) $ -
Dec $60.75
$ 58.75 $ 58.25 $ 57.75
$ 3.25 $ (3.25) $ (1.00)
2005 Jan $54.50
$ 57.50 $ 57.00 $ 56.00
$ (1.00) $ (3.00) $ 0.75
Feb $57
$ 57.50 $ 56.50 $ 55.00
$ (2.75) $ - $ 2.75
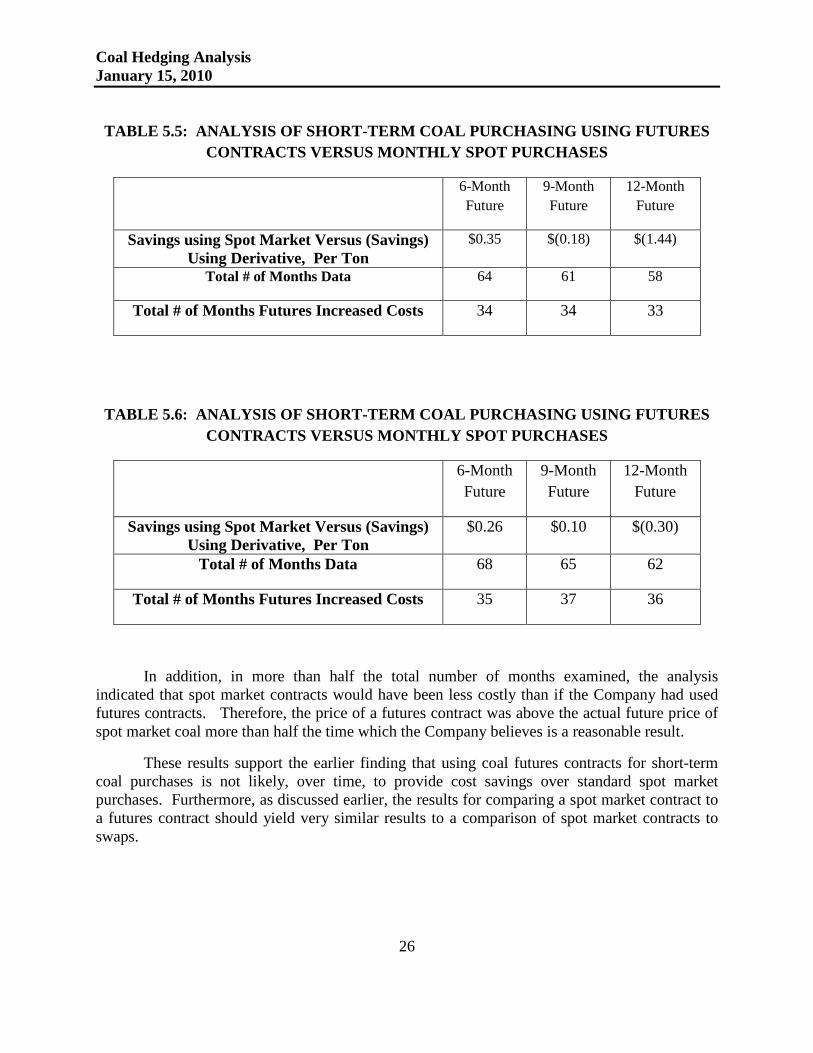
The overall results of this analysis are summarized in Table 5.5 below. As this table demonstrates, using six-month coal futures (or swaps) provides a savings over the use of a futures derivative ($0.35/ton). Using either nine- or twelve-month futures contracts (or swaps) would have provided some savings over using the spot market ($0.18/ton or $1.44/ton). However, the latter two results are driven by the unprecedented increase and decline in coal prices through 2008. Furthermore, the methodology used to make the comparisons terminates before the full impact of the decline in prices following the unprecedented spike in coal prices is captured in the modeling data. As shown in Table 5.6, assuming that coal prices will remain as currently forecasted through the remainder of 2009, the nine- and twelve-month results indicating benefits from using either nine- or twelve-month futures contracts over monthly spot purchases will be either largely negated or reversed.
Coal Hedging Analysis January 15, 2010
26
TABLE 5.5: ANALYSIS OF SHORT-TERM COAL PURCHASING USING FUTURES CONTRACTS VERSUS MONTHLY SPOT PURCHASES
6-Month Future
9-Month Future
12-Month Future
Savings using Spot Market Versus (Savings) Using Derivative, Per Ton
$0.35 $(0.18) $(1.44)
Total # of Months Data 64 61 58
Total # of Months Futures Increased Costs 34 34 33
TABLE 5.6: ANALYSIS OF SHORT-TERM COAL PURCHASING USING FUTURES CONTRACTS VERSUS MONTHLY SPOT PURCHASES
6-Month Future
9-Month Future
12-Month Future
Savings using Spot Market Versus (Savings) Using Derivative, Per Ton
$0.26 $0.10 $(0.30)
Total # of Months Data 68 65 62
Total # of Months Futures Increased Costs 35 37 36
In addition, in more than half the total number of months examined, the analysis indicated that spot market contracts would have been less costly than if the Company had used futures contracts. Therefore, the price of a futures contract was above the actual future price of spot market coal more than half the time which the Company believes is a reasonable result.
These results support the earlier finding that using coal futures contracts for short-term coal purchases is not likely, over time, to provide cost savings over standard spot market purchases. Furthermore, as discussed earlier, the results for comparing a spot market contract to a futures contract should yield very similar results to a comparison of spot market contracts to swaps.

Coal Hedging Analysis January 15, 2010
27
5.3.3 Would Call Options Have Lowered Coal Costs For SCE&G Spot Market Coal Purchases?
To determine whether SCE&G could save money if it employed call options in its spot market coal purchases, the Company employed a similar methodology to the analysis in Section 5.3.2. The first method compared the actual historical cost of coal purchased by the Company using spot market contracts to the actual price of call options (plus the call premium) that were available at the time the spot market contracts were executed. This analysis was premised on the assumption that, unlike longer term contracts, the Company could rely on the spot market to provide sufficient short-term coal if it were willing to pay the prevailing market price. Given this assumption, the number of actual short-term contracts reviewed included over 130 non-import short-term contracts employed by the Company used between January 2004 through December 2008. The actual comparison of the spot market purchase prices to a call option required the following data:
• A list of the spot market contracts, their delivery dates, delivery volumes, price and other terms (data available from SCE&G);
• The date the spot market price was established (which is usually just prior to the contract initial delivery date); and
• The price for a coal call option plus premium at the time that SCE&G established prices in its spot market coal purchases.
Because of data limitations the analysis is limited to spot market purchases beginning in 2004.
To perform the comparison which is provided in Appendix G, the Company compared the actual spot market purchase price for coal per month for each spot market purchase to the price of call options, assuming a call option could have been used rather than the spot market purchase. The futures prices were obtained from data sheets provided by United Power, Inc. Spot market purchase price dates were based on information provided by SCE&G and were used to establish comparable futures contracts’ prices.
The overall results of this analysis are summarized in Table 5.7 below. As this table shows, using call options for short-term coal purchases would have increased the overall cost of coal in three out of the five years examined. Over the entire five years of the analysis the overall cost of coal using call options would have increased by approximately $6.1 million. Even where the Company would have realized cost savings, SCE&G would have sacrificed reliable deliverability of its coal purchases when employing call options for short-term coal purchases. It is therefore reasonable to conclude that the use of call options in short-term coal purchasing will likely increase the overall cost of coal purchases. Furthermore, SCE&G’s short-term coal procurement methodology generally would not likely produce coal cost savings if the Company employed six- to twelve-month call option coal contracts as opposed to standard, short-term spot market based contracts.

Coal Hedging Analysis January 15, 2010
28
TABLE 5.7: ACTUAL SHORT-TERM COAL PURCHASE CONTRACTS AS COMPARED TO CALL OPTIONS
CONTRACT YEAR
TOTAL SAVINGS USING CURRENT PRACTICE
VERSUS (BENEFITS) OF USING CALL OPTIONS FOR SPOT MARKET PURCHASES
2004
$ 3,199,072.03
2005
$ 629,300.00
2006
$ 3,921,560.00
2007
$ (1,504,496.60)
2008
$ (119,956.00)
Total
$ 6,125,479.43
The second method analyzed historical coal prices and estimated call option strike prices, without any reliance on the Company’s actual coal contracts. This analysis assumes that unlike longer term contracts, the Company could rely on the spot market to provide sufficient short-term coal if it were willing to pay the prevailing market price. Additionally, this analysis assumes that near the first of every month, beginning in 2004, and for every single month thereafter through September 2009, the Company could either enter into a six-month, nine-month, or twelve-month call option contract for short-term coal purchases, or simply purchase coal each month in the spot market at prevailing spot market price. The analysis then compared the cost difference had the Company entered into a call option contract as opposed to purchasing the coal in the spot market on a monthly basis. Consequently, this analysis does not pick and choose which month to enter a call option contract, but rather assumes a futures contract is entered every single month for coal purchases some six, nine and twelve months out. This analysis represented a sample size of some 69 months and over 200 potential futures contracts. The call option prices at the beginning of each month for all three different futures options plus the call premium, were then compared to the actual spot market price of coal some six, nine, or twelve months later. These timeframes are reasonable in that they cover several potential types of short-term futures contracts and are consistent with some of the futures contract options discussed by intervenors in Docket No. 2009-2-E. The actual comparison of the spot market purchase prices to futures contract requires the following data:
• The monthly price of coal futures assuming this would be a proxy for call option prices (plus the call option premium) six, nine, and twelve months out; and

Coal Hedging Analysis January 15, 2010
29
• The spot market price of coal near the beginning of each month under the assumption that this is a reasonable proxy for the price the Company would have paid at the time for a month’s worth of spot market coal.
The analysis is limited to spot market purchases beginning in 2004 due to the fact that this is the first month that coal futures prices were available.
In addition, as in the previous call option analysis, this analysis assumes the Company could rely on the spot market to provide sufficient short-term coal if the Company were willing to forego exercising a previously entered call option to purchase coal in the spot market and pay the prevailing market price. The analysis also assumes that, if SCE&G had purchased call options in lieu of signing firm spot market purchase contracts, in the month when the call option became exercisable, the Company would exercise the call option in those situations when the call option price was lower than the then-current spot market price. In the opposite situation the Company would simply rely on spot market purchases.
Using a similar spreadsheet analysis to that shown in Table 5.4, the estimated price of the call option was determined using the actual forward looking future price of coal (using ICAP, United, Inc. coal pricing data) for the future month for which the purchase was being contracted, plus a call premium of $2.00 per ton (which is the call premium used by intervenors in Docket No. 2009-2-E and which SCE&G affirmed is a reasonable estimate for a call premium). The tables illustrating the total analysis are shown in Appendix F. Table 5.8 below provides a summary of the results.
TABLE 5.8: ANALYSIS OF SHORT-TERM COAL PURCHASING USING CALL OPTION CONTRACTS VERSUS MONTHLY SPOT PURCHASES
6-Month Call Option
9-Month Call Option
12-Month Call Option
Cost (Savings) per Ton Coal Using Derivative
$ 2.32 $ 1.79 $ 0.53
Total # of Months Data 64 61 58
Total # of Months Call Options Increased Costs
41 41 36

Coal Hedging Analysis January 15, 2010
30
As Table 5.8 shows, using call options for short-term coal purchases is not likely to provide cost savings over spot market purchases. Therefore, SCE&G’s short-term coal procurement methodology would not likely produce coal cost savings if the Company began to employ six- to twelve-month call option coal contracts as opposed to simple, short-term spot market based contracts.
5.4 SUMMARY AND CONCLUSION The purpose of the Company’s analysis is to determine whether SCE&G could reduce its coal purchasing costs by employing financial derivatives in its coal purchasing practices. The analysis examines the potential benefits or costs of using various financial derivatives for both long-term and short-term coal purchasing options and uses both actual and projected data in formulating the various comparisons developed.
The first analysis examines the potential use of either futures contracts or swaps in longer term coal contracting assuming only these types of derivatives could reasonably be used to hedge these long-term contracts. SCE&G reviewed historical long-term coal contact and price data to determine if the Company could have saved money in its long-term coal purchasing costs if it had used either futures or swaps in lieu of its current long-term contracting methodology. This analysis indicates that SCE&G saved approximately $148 million by using long-term contracts as compared to the option of using futures contracts in lieu of these long-term contracts.
The second analysis examines the potential for derivatives to reduce the Company’s costs associated with shorter term coal contracts, usually referred to as spot market purchases. The financial derivatives available for these shorter term purchases generally include futures, financial swaps, and call options. This analysis relies on Company specific data and indicates that SCE&G has generally saved several million dollars each year by employing its spot market purchasing techniques as compared to the option of using either futures or swap type contracts. In a similar analysis that did not rely upon Company specific data, the results indicate that using either futures or swaps would not provide a financial benefit in terms of cost savings.
Another analysis considers the use of call options for shorter term coal purchases using actual Company short-term contract data in one analysis and general market data in a second analysis. In both cases, using call options for shorter term coal purchases proves to be more costly than SCE&G’s current short-term coal contracting practice.
In summary, the Company’s analysis demonstrates that the use of financial derivatives in its coal contracting efforts is unlikely to result in cost savings. Furthermore, using financial derivatives in either its long-term or short-term coal purchasing practice would likely increase the Company’s overall coal costs. While the results do show that on occasion, the use of financial derivatives could reduce coal purchase costs, it would be impossible for coal buyers to accurately and routinely forecast future market prices in an attempt to time the use of derivatives

Coal Hedging Analysis January 15, 2010
31
in a manner to consistently reduce coal costs. Moreover, these results indicate that any consistent use of financial derivatives in this market would likely lead to higher overall coal costs.
Finally, these quantitative considerations cannot override the myriad of other issues that make the use of derivatives in the Company’s coal purchasing practices undesirable. These other issues include the following:
• Historically, coal prices have been fairly stable, reducing the need for derivatives in this market.
• Unlike natural gas, coal is not a uniform, homogenous product. Coal’s heat content, hardness, ash fusion temperature, volatility and ash content all greatly vary, and for this reason different types of coal cannot be used from one coal fired electric generator to another. This makes it difficult to have a robust derivative marketplace simply because there are so many types of coal products.
• The transportation of coal, unlike gas, has been found to be quite problematic in terms of capacity, scheduling, and reliability.
• The lack of transparency in coal prices constrains the liquidity of the coal derivative marketplace simply because most traders prefer a price transparent marketplace to make transaction data known in a timely fashion.
• In the coal marketplace, there is a persistent concern regarding supplier contract performance. This includes issues such as suppliers going bankrupt or simply not fulfilling contracts when spot market coal prices greatly exceed the contract price.
In conclusion, given the lack of any apparent financial benefit from using coal derivatives in its coal purchasing practices, coupled with a number of other non-quantitative concerns, it would be unwise at this time and in current market conditions, for SCE&G to modify its current coal purchasing practices to include any use of financial derivatives.

Coal Hedging Analysis January 15, 2010
32
APPENDICES

Coal Hedging Analysis January 15, 2010
33
In March, a wheat farmer is planning to plant 100,000 bushels of wheat, which will be ready for harvesting by late August and delivery in September. The farmer knows from past years that the total cost of planting and harvesting the crops is about $6.30 per bushel. At this time, September Wheat futures are trading at $6.70 per bushel, and the wheat farmer wishes to lock in this selling price. To do this, he enters a short hedge by selling some September Wheat futures. Since each Wheat futures contract covers 5,000 bushels, he will need to sell 20 futures contracts to hedge his projected 100,000 bushels production.
APPENDIX A: SHORT HEDGE EXAMPLE
By mid-August, his wheat crops are ready for harvesting. However, the price of wheat has since risen to $6.80 per bushel. Correspondingly, prices of September Wheat futures have also risen and are now trading at $7.30 per bushel.
Selling his harvest of 100,000 bushels of wheat at the local elevator yields $680,000 ($6.80*100,000), however the farmers cost of growing the crops is $630,000 ($6.30*100,000. Consequently, absent the short hedge the farmer would have made $50,000.
With the short hedge, the farmer had contracted to sell his wheat for $6.70 per bushel. Thus the farmer made the value of Wheat futures Sold in March = $6.70 x 20 contracts x 5000 bushels = $670,000. The value of Wheat futures purchased in August was $7.30 x 20 contracts x 5,000 bushels = $730,000, making the farmers net loss in the futures market = $670,000 - $730,000 = ($60,000).
Overall, the farmers profit is equal to his loss in the futures market less his gain in the cash market, or ($60,000) + $50,000 = ($10,000) in net losses. Consequently, with the short hedge in place, the farmer lost money although he would have made a profit had he not used the hedge.

Coal Hedging Analysis January 15, 2010
34
APPENDIX B: LONG HEDGE EXAMPLE
Assume that in May, a flour manufacturer signs a contract to supply flour to a supermarket in September and that the total amount of wheat needed to produce the flour is 50,000 bushels. Based on the agreed selling price for the flour, the flour maker calculates that he must purchase wheat at $7.00 per bushel or less in order to breakeven.
At that time, wheat is selling at a price of $6.60 per bushel at the local elevator while September Wheat futures are trading at $6.70 per bushel. The flour maker wishes to lock in this current purchase price, so to do this he enters a long hedge by buying September Wheat futures.
Each Wheat futures contract covers 5,000 bushels, meaning the flour manufacturer needs to purchase 10 futures contracts to hedge his projected 50,000 bushels requirement.
In August, the manufacturing process begins and the flour maker needs to purchase his wheat supply from the local elevator. However, the price of wheat has risen to $7.20 per bushel. Correspondingly, the price of September Wheat futures have also risen and are now trading at $7.27 per bushel.
The manufacturers breakeven cost for Wheat was $7.00 per bushel as compared to the current purchase prices of $7.20 per bushel. This means absent the long hedge, the manufacturer would lose $0.20 per bushel or a total $10,000 in the cash market for his 50,000 bushels.
However, with the long hedge the manufacturer’s long position in September Wheat futures purchased in May was $6.70 per bushel, which times 50,000 bushels equals $335,000. The value of September Wheat futures sold in August equals $7.27 per bushel times 50,000 bushels equals $363,500. This makes the manufacturer’s net gain in the futures market equal to $363,500 minus $335,000 which is equal to $28,500.
The manufactures overall profit equals $18,500 (Gain in Futures Market - Loss in Cash Market = $28,500 - $10,000 = $18,500).

Coal Hedging Analysis January 15, 2010
35
APPENDIX C: COAL FUTURE – NYMEX
Central Appalachian Coal Futures Overview
In 1996, the New York Mercantile Exchange (NYMEX) began providing companies in the electric power industry with secure and reliable risk management tools by creating a series of electricity futures contracts fashioned to meet the particular regional needs and practices of the power industry. The buying and selling of these futures contracts and the related options contracts have given the industry a much-needed price reference and risk management tool. In the restructured electric power industry, where annual sales nationally are over $250 billion, and price increases can no longer be passed along to customers, the pricing of resources used to generate electricity becomes more important.
Since coal is now the largest single power generating fuel in the United States, the once relatively sedate cash markets for coal have become more volatile and very strong market forces. Thus, electric utilities are no longer eager to enter into long-term coal supply contracts that once were the industry norm. Instead, there is now a preference for short-term and more price-flexible contracts that rely more on cash market purchases as power producers try to reduce their inventory holding levels.
U.S. coal exports, chiefly Central Appalachian bituminous, make up a significant percentage of the world export market and are a relevant factor in world coal prices. Because coal is a bulk commodity, transportation is an important aspect of its price and availability. In response to dramatic changes in both electric and coal industry practices, the New York Mercantile Exchange, after conferring with coal producers and consumers, sought and received regulatory approval to offer coal futures and options contracts. On July 12, 2001, NYMEX began trading Central Appalachian Coal Futures.
Coal futures provide the electric power industry with another set of risk management options, as well as offer the coal industry new and necessary risk management tools.
Coal producers can sell futures contracts to lock in a specific sales price for a specific volume of the coal they intend to produce in coming months. Electric utilities can buy coal futures to hedge against rising prices for their base load fuel. Power marketers can mitigate their generation price risk and hedge with electricity futures to control their delivery price risk. Non-utility industrial coal users, such as steel mills, can use futures to lock in their own coal supply costs. International coal trading companies can use futures to hedge their export or import prices.
Power generating companies that use both coal and natural gas to produce electricity can use coal futures in conjunction with natural gas futures to offset seasonal cost variations and to take advantage of the “spark spread” – the differential between the cost of the two fuels and the relative value of the electricity generated by each of the two fuels.

Coal Hedging Analysis January 15, 2010
36
For the NYMEX futures market, coal contracts specify delivery by seller to the buyer at barge terminals on two limited sections of river located in Central Appalachia (see map), near the confluence of the Big Sandy and the Ohio Rivers. The sections are a twelve-mile stretch of the Ohio River and the adjoining Big Sandy River (where coal barge terminals are within the lowermost nine miles). The actual origins of the coal are not defined, but the coal must meet a set of specifications as to heat, ash, moisture, sulfur, volatile matter, hardness or grind ability, and sizing and must be delivered in 1,550 ton trading units (barge-load lots).
Trading Unit: 1,550 tons of coal.
Price Quotation: U.S. dollars and cents per ton.
Trading Hours: (All times are New York time) The contract is available for trading on the Globex® trading platform from 6:00 PM Sundays through 5:15 PM Fridays, with a 45-minute break each day between 5:15 PM and 6:00 PM. Off-Exchange transactions can be submitted solely for clearing to the NYMEX ClearPort® clearing website as an exchange of futures for swaps (EFS) or exchange of futures for physicals (EFP) transaction until 5:15 PM, Monday through Friday, and the day preceding a holiday.
Trading Months: The current year and the next four years. Contracts for each new calendar year will be added following the termination of trading in the December contract of the current year.
Minimum Price Fluctuation: $0.01 (1¢) per ton ($15.50 per contract).
Last Trading Day: Trading terminates on the fourth to last business day of the month prior to the delivery month.
Delivery: Delivery shall be made F.O.B. buyer’s barge at seller’s delivery facility on the Ohio River between Mileposts 306 and 317, or on the Big Sandy River, with all duties, entitlements, taxes, fees, and other charges imposed prior to delivery paid by the seller. There will be a discount of $0.10 (10¢) per ton below the final settlement price for any delivery to a terminal on the Big Sandy River.
Contract Delivery Unit: The seller shall deliver 1,550 tons of coal per contract. A loading tolerance of 60 tons or 2%, whichever is greater, over the total number of contracts delivered is permitted.
Heat Content: Minimum of 12,000 Btus per pound, gross calorific value, with an analysis tolerance of 250 Btus per pound below.
Ash Content: Maximum of 13.50% by weight with no analysis tolerance.
Sulfur Content: Maximum of 1.00%, with analysis tolerance of 0.050% above.

Coal Hedging Analysis January 15, 2010
37
Moisture Content: Maximum of 10.00%, with no analysis tolerance.
Volatile Matter: Minimum of 30.00%, with no analysis tolerance.
Hardness/Grindability: Minimum 41 Hardgrove Index with three point analysis tolerance below. Hardness measures how difficult it is to pulverize coal for injection into the boiler flame.
Size: Three inches topsize, nominal, with a maximum of 55% passing one-quarter-inch-square wire cloth sieve or smaller, to be determined on the basis of the primary cutter of the mechanical sampling system.
Exchange of Futures for Physicals (EFP): The buyer or seller may exchange a futures position for a physical position of equal quantity/quality by submitting a notice to the Exchange. EFPs may be used either to initiate or liquidate a futures position. The EFP deadline is 10:00 AM (New York time) on the first business day following termination of trading.
Margin Requirements: Margins are required for open futures positions.
Trading Symbol: QL

Coal Hedging Analysis January 15, 2010
38
APPENDIX D:
Long-term Contract Excel spreadsheet

Coal Hedging Analysis January 15, 2010
39
APPENDIX E:
Short-term futures actual contract analysis spreadsheet

Coal Hedging Analysis January 15, 2010
40
APPENDIX F:
Short-term futures generic analysis spreadsheet

Coal Hedging Analysis January 15, 2010
41
APPENDIX G:
Short-term Call Option actual contract analysis spreadsheet
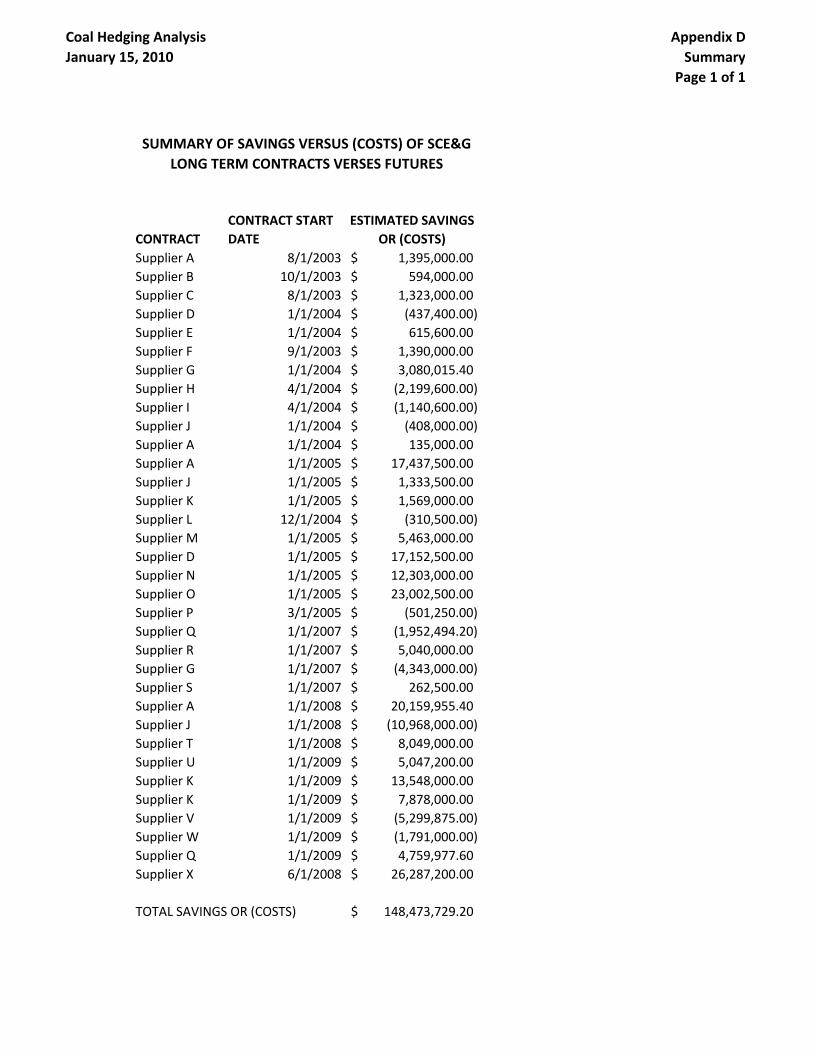
Coal Hedging Analysis January 15, 2010
Appendix DSummary
Page 1 of 1
CONTRACTCONTRACT START DATE
ESTIMATED SAVINGS OR (COSTS)
Supplier A 8/1/2003 1,395,000.00$ Supplier B 10/1/2003 594,000.00$ Supplier C 8/1/2003 1,323,000.00$ Supplier D 1/1/2004 (437,400.00)$ Supplier E 1/1/2004 615,600.00$ Supplier F 9/1/2003 1,390,000.00$ Supplier G 1/1/2004 3,080,015.40$ Supplier H 4/1/2004 (2,199,600.00)$ Supplier I 4/1/2004 (1,140,600.00)$ Supplier J 1/1/2004 (408,000.00)$ Supplier A 1/1/2004 135,000.00$ Supplier A 1/1/2005 17,437,500.00$ Supplier J 1/1/2005 1,333,500.00$ Supplier K 1/1/2005 1,569,000.00$ Supplier L 12/1/2004 (310,500.00)$ Supplier M 1/1/2005 5,463,000.00$ Supplier D 1/1/2005 17,152,500.00$ Supplier N 1/1/2005 12,303,000.00$ Supplier O 1/1/2005 23,002,500.00$ Supplier P 3/1/2005 (501,250.00)$ Supplier Q 1/1/2007 (1,952,494.20)$ Supplier R 1/1/2007 5,040,000.00$ Supplier G 1/1/2007 (4,343,000.00)$ Supplier S 1/1/2007 262,500.00$ Supplier A 1/1/2008 20,159,955.40$ Supplier J 1/1/2008 (10,968,000.00)$ Supplier T 1/1/2008 8,049,000.00$ Supplier U 1/1/2009 5,047,200.00$ Supplier K 1/1/2009 13,548,000.00$ Supplier K 1/1/2009 7,878,000.00$ Supplier V 1/1/2009 (5,299,875.00)$ Supplier W 1/1/2009 (1,791,000.00)$ Supplier Q 1/1/2009 4,759,977.60$ Supplier X 6/1/2008 26,287,200.00$
TOTAL SAVINGS OR (COSTS) 148,473,729.20$
SUMMARY OF SAVINGS VERSUS (COSTS) OF SCE&G LONG TERM CONTRACTS VERSES FUTURES

Coal Hedging Analysis January 15, 2010
Appendix DJuly 22, 03
Page 1 of 9
CONTRACT WORK SHEET 22-Jul-03Assume contract was a future rather than a purchase contract- note that buying a future and buying a swap is basically mathematically similar
CONTRACT Date of Info START DATE END DATESupplier A 7/22/2003 8/1/2003 7/31/2009
DATA FOR FUTURES FROM UPI SHEET 11/3/03Purchase Futures Option two months prior to contract start date is optimal, but data not available, assume purchase futures starting on 11/3/03, 1st data data available
TOTAL CONTRACT SAVINGS (COST) 1,395,000.00$
Tons per month
Actual Contract Price $/ton
Future Price $/ton
Cost of future per ton
Contract Price Minus Future Price Price per ton
Total monthly savings or (cost) to ratepayers
2003 AUG 30,000 32.90$ 34.85$ 0.05$ 2.00$ 60,000.00$ SEPT 30,000 32.90$ 34.85$ 0.05$ 2.00$ 60,000.00$ OCT 30,000 32.90$ 34.85$ 0.05$ 2.00$ 60,000.00$ NOV 30,000 32.90$ 34.85$ 0.05$ 2.00$ 60,000.00$ DEC 30,000 32.90$ 34.25$ 0.05$ 1.40$ 42,000.00$
2004 JAN 30,000 32.90$ 34.40$ 0.05$ 1.55$ 46,500.00$ FEB 30,000 32.90$ 34.40$ 0.05$ 1.55$ 46,500.00$
MAR 30,000 32.90$ 34.40$ 0.05$ 1.55$ 46,500.00$ APR 30,000 32.90$ 34.50$ 0.05$ 1.65$ 49,500.00$ MAY 30,000 32.90$ 34.50$ 0.05$ 1.65$ 49,500.00$ JUNE 30,000 32.90$ 34.50$ 0.05$ 1.65$ 49,500.00$ JULY 30,000 32.90$ 34.65$ 0.05$ 1.80$ 54,000.00$ AUG 30,000 32.90$ 34.65$ 0.05$ 1.80$ 54,000.00$ SEPT 30,000 32.90$ 34.65$ 0.05$ 1.80$ 54,000.00$ OCT 30,000 32.90$ 34.85$ 0.05$ 2.00$ 60,000.00$ NOV 30,000 32.90$ 34.85$ 0.05$ 2.00$ 60,000.00$ DEC 30,000 32.90$ 34.85$ 0.05$ 2.00$ 60,000.00$
2005 JAN 30,000 32.90$ 35.15$ 0.05$ 2.30$ 69,000.00$ FEB 30,000 32.90$ 35.15$ 0.05$ 2.30$ 69,000.00$
MAR 30,000 32.90$ 35.15$ 0.05$ 2.30$ 69,000.00$ APR 30,000 32.90$ 35.15$ 0.05$ 2.30$ 69,000.00$ MAY 30,000 32.90$ 35.15$ 0.05$ 2.30$ 69,000.00$ JUNE 30,000 32.90$ 35.15$ 0.05$ 2.30$ 69,000.00$ JULY 30,000 32.90$ 35.15$ 0.05$ 2.30$ 69,000.00$ AUG

Coal Hedging Analysis January 15, 2010
Appendix DJuly 22, 03
Page 2 of 9
SEPTOCTNOVDEC
2006 JANFEB
MARAPRMAYJUNEJULYAUGSEPTOCTNOVDEC
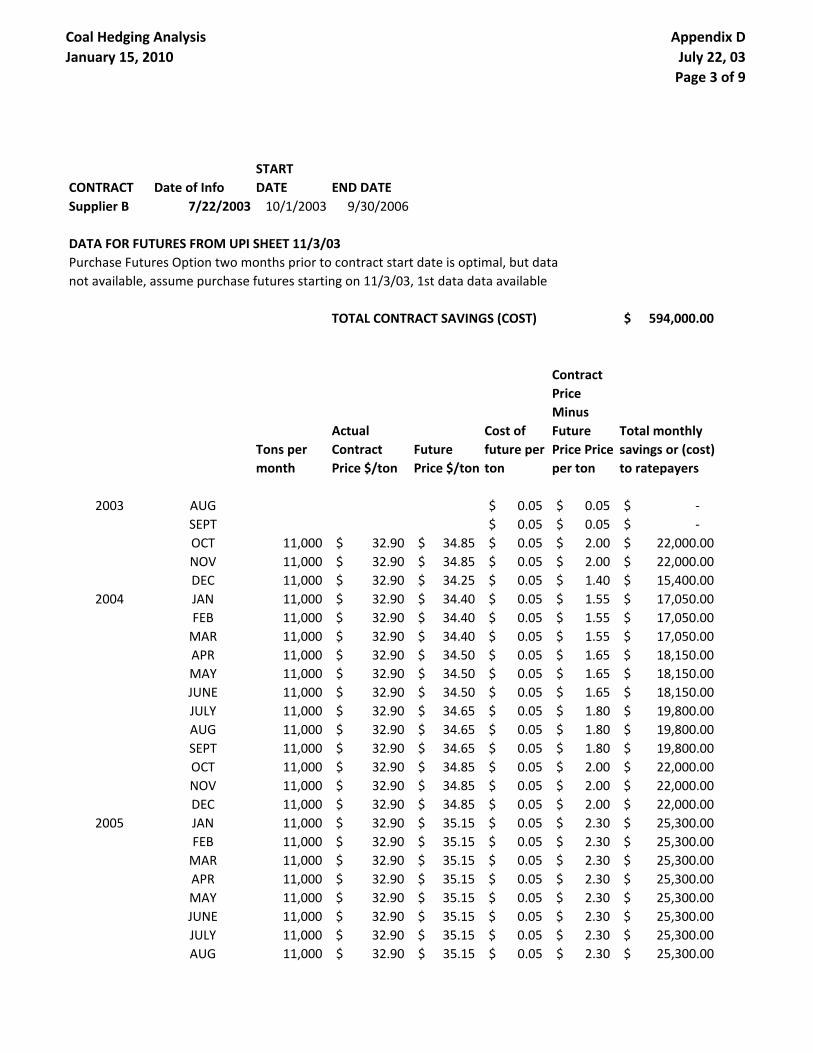
Coal Hedging Analysis January 15, 2010
Appendix DJuly 22, 03
Page 3 of 9
CONTRACT Date of InfoSTART DATE END DATE
Supplier B 7/22/2003 10/1/2003 9/30/2006
DATA FOR FUTURES FROM UPI SHEET 11/3/03Purchase Futures Option two months prior to contract start date is optimal, but data not available, assume purchase futures starting on 11/3/03, 1st data data available
TOTAL CONTRACT SAVINGS (COST) 594,000.00$
Tons per month
Actual Contract Price $/ton
Future Price $/ton
Cost of future per ton
Contract Price Minus Future Price Price per ton
Total monthly savings or (cost) to ratepayers
2003 AUG 0.05$ 0.05$ -$ SEPT 0.05$ 0.05$ -$ OCT 11,000 32.90$ 34.85$ 0.05$ 2.00$ 22,000.00$ NOV 11,000 32.90$ 34.85$ 0.05$ 2.00$ 22,000.00$ DEC 11,000 32.90$ 34.25$ 0.05$ 1.40$ 15,400.00$
2004 JAN 11,000 32.90$ 34.40$ 0.05$ 1.55$ 17,050.00$ FEB 11,000 32.90$ 34.40$ 0.05$ 1.55$ 17,050.00$
MAR 11,000 32.90$ 34.40$ 0.05$ 1.55$ 17,050.00$ APR 11,000 32.90$ 34.50$ 0.05$ 1.65$ 18,150.00$ MAY 11,000 32.90$ 34.50$ 0.05$ 1.65$ 18,150.00$ JUNE 11,000 32.90$ 34.50$ 0.05$ 1.65$ 18,150.00$ JULY 11,000 32.90$ 34.65$ 0.05$ 1.80$ 19,800.00$ AUG 11,000 32.90$ 34.65$ 0.05$ 1.80$ 19,800.00$ SEPT 11,000 32.90$ 34.65$ 0.05$ 1.80$ 19,800.00$ OCT 11,000 32.90$ 34.85$ 0.05$ 2.00$ 22,000.00$ NOV 11,000 32.90$ 34.85$ 0.05$ 2.00$ 22,000.00$ DEC 11,000 32.90$ 34.85$ 0.05$ 2.00$ 22,000.00$
2005 JAN 11,000 32.90$ 35.15$ 0.05$ 2.30$ 25,300.00$ FEB 11,000 32.90$ 35.15$ 0.05$ 2.30$ 25,300.00$
MAR 11,000 32.90$ 35.15$ 0.05$ 2.30$ 25,300.00$ APR 11,000 32.90$ 35.15$ 0.05$ 2.30$ 25,300.00$ MAY 11,000 32.90$ 35.15$ 0.05$ 2.30$ 25,300.00$ JUNE 11,000 32.90$ 35.15$ 0.05$ 2.30$ 25,300.00$ JULY 11,000 32.90$ 35.15$ 0.05$ 2.30$ 25,300.00$ AUG 11,000 32.90$ 35.15$ 0.05$ 2.30$ 25,300.00$

Coal Hedging Analysis January 15, 2010
Appendix DJuly 22, 03
Page 4 of 9
SEPT 11,000 32.90$ 35.15$ 0.05$ 2.30$ 25,300.00$ OCT 11,000 32.90$ 35.15$ 0.05$ 2.30$ 25,300.00$ NOV 11,000 32.90$ 35.15$ 0.05$ 2.30$ 25,300.00$ DEC 11,000 32.90$ 35.15$ 0.05$ 2.30$ 25,300.00$
2006 JAN 11,000 32.90$ NA -$ FEB 11,000 32.90$ NA -$
MAR 11,000 32.90$ NA -$ APR 11,000 32.90$ NA -$ MAY 11,000 32.90$ NA -$ JUNE 11,000 32.90$ NA -$ JULY 11,000 32.90$ NA -$ AUG 11,000 32.90$ NA -$ SEPT 11,000 32.90$ NA -$ OCTNOVDEC

Coal Hedging Analysis January 15, 2010
Appendix DJuly 22, 03
Page 5 of 9
CONTRACTDate of Info
START DATE END DATE
Supplier C 7/22/2003 8/1/2003 7/31/2008
DATA FOR FUTURES FROM UPI SHEET 11/3/03Purchase Futures Option two months prior to contract start date is optimal, but data not available, assume purchase futures starting on 11/3/03, 1st data data available
TOTAL CONTRACT SAVINGS (COST) 1,323,000.00$
Tons per month
Actual Contract Price $/ton
Future Price $/ton
Cost of future per ton
Contract Price Minus Future Price Price per ton
Total monthly savings or (cost) to ratepayers
2003 AUG 30,000 33.00$ 34.85$ 0.05$ 1.90$ 57,000.00$ SEPT 30,000 33.00$ 34.85$ 0.05$ 1.90$ 57,000.00$ OCT 30,000 33.00$ 34.85$ 0.05$ 1.90$ 57,000.00$ NOV 30,000 33.00$ 34.85$ 0.05$ 1.90$ 57,000.00$ DEC 30,000 33.00$ 34.25$ 0.05$ 1.30$ 39,000.00$
2004 JAN 30,000 33.00$ 34.40$ 0.05$ 1.45$ 43,500.00$ FEB 30,000 33.00$ 34.40$ 0.05$ 1.45$ 43,500.00$
MAR 30,000 33.00$ 34.40$ 0.05$ 1.45$ 43,500.00$ APR 30,000 33.00$ 34.50$ 0.05$ 1.55$ 46,500.00$ MAY 30,000 33.00$ 34.50$ 0.05$ 1.55$ 46,500.00$ JUNE 30,000 33.00$ 34.50$ 0.05$ 1.55$ 46,500.00$ JULY 30,000 33.00$ 34.65$ 0.05$ 1.70$ 51,000.00$ AUG 30,000 33.50$ 34.65$ 0.05$ 1.20$ 36,000.00$ SEPT 30,000 33.50$ 34.65$ 0.05$ 1.20$ 36,000.00$ OCT 30,000 33.50$ 34.85$ 0.05$ 1.40$ 42,000.00$ NOV 30,000 33.50$ 34.85$ 0.05$ 1.40$ 42,000.00$ DEC 30,000 33.50$ 34.85$ 0.05$ 1.40$ 42,000.00$
2005 JAN 30,000 33.50$ 35.15$ 0.05$ 1.70$ 51,000.00$ FEB 30,000 33.50$ 35.15$ 0.05$ 1.70$ 51,000.00$
MAR 30,000 33.50$ 35.15$ 0.05$ 1.70$ 51,000.00$ APR 30,000 33.50$ 35.15$ 0.05$ 1.70$ 51,000.00$ MAY 30,000 33.50$ 35.15$ 0.05$ 1.70$ 51,000.00$ JUNE 30,000 33.50$ 35.15$ 0.05$ 1.70$ 51,000.00$ JULY 30,000 33.50$ 35.15$ 0.05$ 1.70$ 51,000.00$ AUG 30,000 34.00$ 35.15$ 0.05$ 1.20$ 36,000.00$
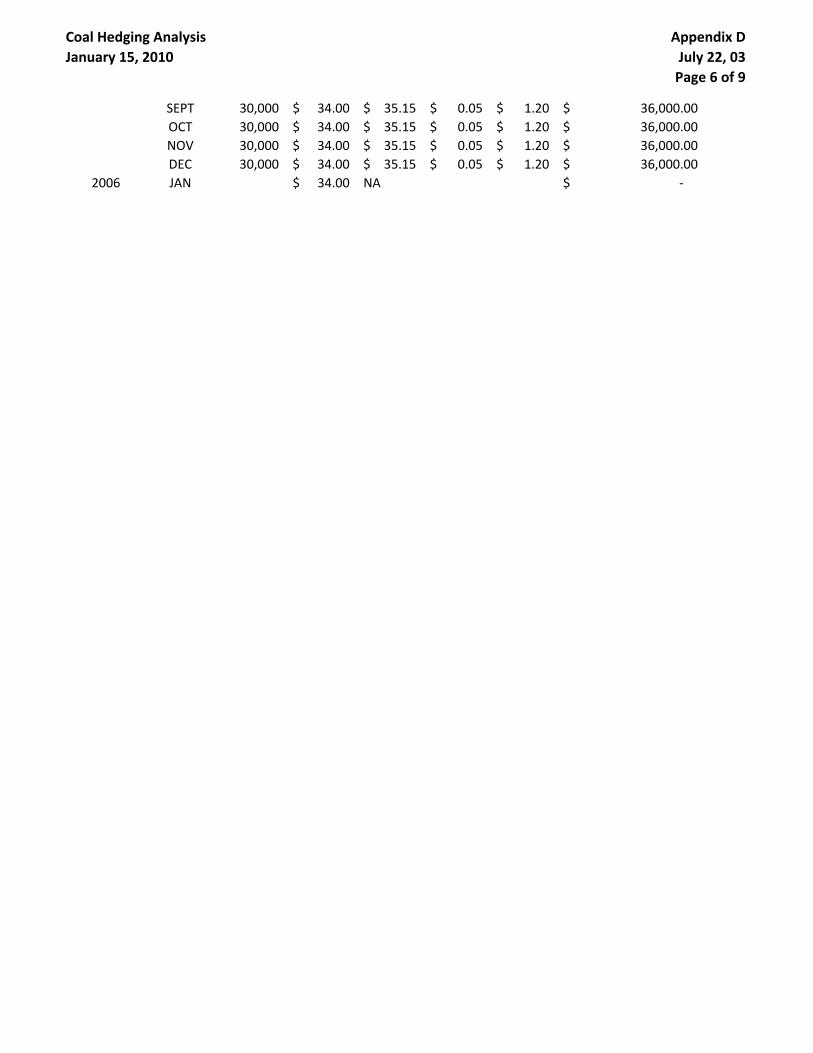
Coal Hedging Analysis January 15, 2010
Appendix DJuly 22, 03
Page 6 of 9
SEPT 30,000 34.00$ 35.15$ 0.05$ 1.20$ 36,000.00$ OCT 30,000 34.00$ 35.15$ 0.05$ 1.20$ 36,000.00$ NOV 30,000 34.00$ 35.15$ 0.05$ 1.20$ 36,000.00$ DEC 30,000 34.00$ 35.15$ 0.05$ 1.20$ 36,000.00$
2006 JAN 34.00$ NA -$

Coal Hedging Analysis January 15, 2010
Appendix DJuly 22, 03
Page 7 of 9
CONTRACT Date of InfoSTART DATE END DATE
Supplier D 7/22/2003 1/1/2004 12/31/2004
DATA FOR FUTURES FROM UPI SHEET 11/3/03Purchase Futures Option two months prior to contract start date is optimal, but data not available, assume purchase futures starting on 11/3/03, 1st data data available
TOTAL CONTRACT SAVINGS (COST) (437,400.00)$
Tons per month
Actual Contract Price $/ton
Future Price $/ton
Cost of future per ton
Contract Price Minus Future Price Price per ton
Total monthly savings or (cost) to ratepayers
2003 AUG - 0.05$ 0.05$ -$ SEPT - 0.05$ 0.05$ -$ OCT - 0.05$ 0.05$ -$ NOV - 0.05$ 0.05$ -$ DEC - 0.05$ 0.05$ -$
2004 JAN 27,000 36.00$ 34.40$ 0.05$ (1.55)$ (41,850.00)$ FEB 27,000 36.00$ 34.40$ 0.05$ (1.55)$ (41,850.00)$
MAR 27,000 36.00$ 34.40$ 0.05$ (1.55)$ (41,850.00)$ APR 27,000 36.00$ 34.50$ 0.05$ (1.45)$ (39,150.00)$ MAY 27,000 36.00$ 34.50$ 0.05$ (1.45)$ (39,150.00)$ JUNE 27,000 36.00$ 34.50$ 0.05$ (1.45)$ (39,150.00)$ JULY 27,000 36.00$ 34.65$ 0.05$ (1.30)$ (35,100.00)$ AUG 27,000 36.00$ 34.65$ 0.05$ (1.30)$ (35,100.00)$ SEPT 27,000 36.00$ 34.65$ 0.05$ (1.30)$ (35,100.00)$ OCT 27,000 36.00$ 34.85$ 0.05$ (1.10)$ (29,700.00)$ NOV 27,000 36.00$ 34.85$ 0.05$ (1.10)$ (29,700.00)$ DEC 27,000 36.00$ 34.85$ 0.05$ (1.10)$ (29,700.00)$
2005 JAN - 0.05$ 0.05$ -$ FEB - 0.05$ 0.05$ -$
MAR - 0.05$ 0.05$ -$ APR - 0.05$ 0.05$ -$ MAY - 0.05$ 0.05$ -$

Coal Hedging Analysis January 15, 2010
Appendix DJuly 22, 03
Page 8 of 9

Coal Hedging Analysis January 15, 2010
Appendix DJuly 22, 03
Page 9 of 9
CONTRACT Date of InfoSTART DATE END DATE
Supplier E 7/22/2003 1/1/2004 12/31/2004
DATA FOR FUTURES FROM UPI SHEET 11/3/03Purchase Futures Option two months prior to contract start date is optimal, but data not available, assume purchase futures starting on 11/3/03, 1st data data available
TOTAL CONTRACT SAVINGS (COST) 615,600.00$
Tons per month
Actual Contract Price $/ton
Future Price $/ton
Cost of future per ton
Contract Price Minus Future Price Price per ton
Total monthly savings or (cost) to ratepayers
2003 AUG - 0.05$ 0.05$ -$ SEPT - 0.05$ 0.05$ -$ OCT - 0.05$ 0.05$ -$ NOV - 0.05$ 0.05$ -$ DEC - 0.05$ 0.05$ -$
2004 JAN 27,000 32.75$ 34.40$ 0.05$ 1.70$ 45,900.00$ FEB 27,000 32.75$ 34.40$ 0.05$ 1.70$ 45,900.00$
MAR 27,000 32.75$ 34.40$ 0.05$ 1.70$ 45,900.00$ APR 27,000 32.75$ 34.50$ 0.05$ 1.80$ 48,600.00$ MAY 27,000 32.75$ 34.50$ 0.05$ 1.80$ 48,600.00$ JUNE 27,000 32.75$ 34.50$ 0.05$ 1.80$ 48,600.00$ JULY 27,000 32.75$ 34.65$ 0.05$ 1.95$ 52,650.00$ AUG 27,000 32.75$ 34.65$ 0.05$ 1.95$ 52,650.00$ SEPT 27,000 32.75$ 34.65$ 0.05$ 1.95$ 52,650.00$ OCT 27,000 32.75$ 34.85$ 0.05$ 2.15$ 58,050.00$ NOV 27,000 32.75$ 34.85$ 0.05$ 2.15$ 58,050.00$ DEC 27,000 32.75$ 34.85$ 0.05$ 2.15$ 58,050.00$
2005 JAN - 0.05$ 0.05$ -$ FEB - 0.05$ 0.05$ -$
MAR - 0.05$ 0.05$ -$ APR - 0.05$ 0.05$ -$ MAY - 0.05$ 0.05$ -$ JUNE - 0.05$ 0.05$ -$

Coal Hedging Analysis January 15, 2010
Appendix DOct 22, 03
Page 1 of 2
CONTRACT WORK SHEET 22-Oct-03Assume contract was a future rather than a purchase contract- note that buying a future and buying a swap is basically mathematically similar
CONTRACT Date of Info START DATE END DATESupplier F 10/22/2003 9/1/2003 8/31/2006
DATA FOR FUTURES FROM UPI SHEET 11/3/03Purchase Futures Option two months prior to contract start date is optimal, but data not available, assume purchase futures starting on 11/3/03, 1st data data available
TOTAL CONTRACT SAVINGS (COST) 1,390,000.00$
Tons per month
Actual Contract Price $/ton
Future Price $/ton
Cost of future per ton
Contract Price Minus Future Price Price per ton
Total monthly savings or (cost) to ratepayers
2003 AUG -$ -$ SEPT 25,000 32.50$ 34.85$ 0.05$ 2.40$ 60,000.00$ OCT 25,000 32.50$ 34.85$ 0.05$ 2.40$ 60,000.00$ NOV 25,000 32.50$ 34.85$ 0.05$ 2.40$ 60,000.00$ DEC 25,000 32.50$ 34.25$ 0.05$ 1.80$ 45,000.00$
2004 JAN 25,000 32.50$ 34.40$ 0.05$ 1.95$ 48,750.00$ FEB 25,000 32.50$ 34.40$ 0.05$ 1.95$ 48,750.00$
MAR 25,000 32.50$ 34.40$ 0.05$ 1.95$ 48,750.00$ APR 25,000 32.50$ 34.50$ 0.05$ 2.05$ 51,250.00$ MAY 25,000 32.50$ 34.50$ 0.05$ 2.05$ 51,250.00$ JUNE 25,000 32.50$ 34.50$ 0.05$ 2.05$ 51,250.00$ JULY 25,000 32.50$ 34.65$ 0.05$ 2.20$ 55,000.00$ AUG 25,000 32.50$ 34.65$ 0.05$ 2.20$ 55,000.00$ SEPT 25,000 33.10$ 34.65$ 0.05$ 1.60$ 40,000.00$ OCT 25,000 33.10$ 34.85$ 0.05$ 1.80$ 45,000.00$ NOV 25,000 33.10$ 34.85$ 0.05$ 1.80$ 45,000.00$ DEC 25,000 33.10$ 34.85$ 0.05$ 1.80$ 45,000.00$
2005 JAN 25,000 33.10$ 35.15$ 0.05$ 2.10$ 52,500.00$ FEB 25,000 33.10$ 35.15$ 0.05$ 2.10$ 52,500.00$
MAR 25,000 33.10$ 35.15$ 0.05$ 2.10$ 52,500.00$ APR 25,000 33.10$ 35.15$ 0.05$ 2.10$ 52,500.00$ MAY 25,000 33.10$ 35.15$ 0.05$ 2.10$ 52,500.00$ JUNE 25,000 33.10$ 35.15$ 0.05$ 2.10$ 52,500.00$ JULY 25,000 33.10$ 35.15$ 0.05$ 2.10$ 52,500.00$ AUG 25,000 33.10$ 35.15$ 0.05$ 2.10$ 52,500.00$ SEPT 25,000 33.60$ 35.15$ 0.05$ 1.60$ 40,000.00$ OCT 25,000 33.60$ 35.15$ 0.05$ 1.60$ 40,000.00$ NOV 25,000 33.60$ 35.15$ 0.05$ 1.60$ 40,000.00$ DEC 25,000 33.60$ 35.15$ 0.05$ 1.60$ 40,000.00$

Coal Hedging Analysis January 15, 2010
Appendix DOct 22, 03
Page 2 of 2
CONTRACT Date of Info START DATE END DATESupplier G 10/22/2003 1/1/2004 12/31/2006
DATA FOR FUTURES FROM UPI SHEET 11/3/03Purchase Futures Option two months prior to contract start date is optimal, but data not available, assume purchase futures starting on 11/3/03, 1st data data available
TOTAL CONTRACT SAVINGS (COST) 3,080,015.40$
Tons per month
Actual Contract Price $/ton
Future Price $/ton
Cost of future per ton
Contract Price Minus Future Price Price per ton
Total monthly savings or (cost) to ratepayers
2003 AUG -$ -$ SEPT 34.85$ 0.05$ 34.90$ -$ OCT 34.85$ 0.05$ 34.90$ -$ NOV 34.85$ 0.05$ 34.90$ -$ DEC 34.25$ 0.05$ 34.30$ -$
2004 JAN 66,667 33.00$ 34.40$ 0.05$ 1.45$ 96,667.15$ FEB 66,667 33.00$ 34.40$ 0.05$ 1.45$ 96,667.15$
MAR 66,667 33.00$ 34.40$ 0.05$ 1.45$ 96,667.15$ APR 66,667 33.00$ 34.50$ 0.05$ 1.55$ 103,333.85$ MAY 66,667 33.00$ 34.50$ 0.05$ 1.55$ 103,333.85$ JUNE 66,667 33.00$ 34.50$ 0.05$ 1.55$ 103,333.85$ JULY 66,667 33.00$ 34.65$ 0.05$ 1.70$ 113,333.90$ AUG 66,667 33.00$ 34.65$ 0.05$ 1.70$ 113,333.90$ SEPT 66,667 33.00$ 34.65$ 0.05$ 1.70$ 113,333.90$ OCT 66,667 33.00$ 34.85$ 0.05$ 1.90$ 126,667.30$ NOV 66,667 33.00$ 34.85$ 0.05$ 1.90$ 126,667.30$ DEC 66,667 33.00$ 34.85$ 0.05$ 1.90$ 126,667.30$
2005 JAN 66,667 33.00$ 35.15$ 0.05$ 2.20$ 146,667.40$ FEB 66,667 33.00$ 35.15$ 0.05$ 2.20$ 146,667.40$
MAR 66,667 33.00$ 35.15$ 0.05$ 2.20$ 146,667.40$ APR 66,667 33.00$ 35.15$ 0.05$ 2.20$ 146,667.40$ MAY 66,667 33.00$ 35.15$ 0.05$ 2.20$ 146,667.40$ JUNE 66,667 33.00$ 35.15$ 0.05$ 2.20$ 146,667.40$ JULY 66,667 33.00$ 35.15$ 0.05$ 2.20$ 146,667.40$ AUG 66,667 33.00$ 35.15$ 0.05$ 2.20$ 146,667.40$ SEPT 66,667 33.00$ 35.15$ 0.05$ 2.20$ 146,667.40$ OCT 66,667 33.00$ 35.15$ 0.05$ 2.20$ 146,667.40$ NOV 66,667 33.00$ 35.15$ 0.05$ 2.20$ 146,667.40$ DEC 66,667 33.00$ 35.15$ 0.05$ 2.20$ 146,667.40$

Coal Hedging Analysis January 15, 2010
Appendix DFeb 18, 04
Page 1 of 3
18-Feb-04Assume contract was a future rather than a purchase contract- note that buying a future and buying a swap is basically mathematically similar
CONTRACT Date of InfoSTART DATE END DATE
Supplier H 1/31/2005 4/1/2004 12/31/2006
DATA FOR FUTURES FROM UPI SHEET 2/1/04
TOTAL CONTRACT SAVINGS (COST) (2,199,600.00)$
Tons per month
Actual Contract Price $/ton
Future Price $/ton
Cost of future per ton
Contract Price Minus Future Price Price per ton
Total monthly savings or (cost) to ratepayers
2004 JAN 0.05$ 42.55$ -$ FEB 0.05$ 0.05$ -$
MAR 0.05$ 0.05$ -$ APR 20,000 46.50$ 44.88$ 0.05$ (1.57)$ (31,400.00)$ MAY 20,000 46.50$ 44.88$ 0.05$ (1.57)$ (31,400.00)$ JUNE 20,000 46.50$ 44.88$ 0.05$ (1.57)$ (31,400.00)$ JULY 20,000 46.50$ 44.88$ 0.05$ (1.57)$ (31,400.00)$ AUG 20,000 46.50$ 44.88$ 0.05$ (1.57)$ (31,400.00)$ SEPT 20,000 46.50$ 44.88$ 0.05$ (1.57)$ (31,400.00)$ OCT 20,000 46.50$ 44.88$ 0.05$ (1.57)$ (31,400.00)$ NOV 20,000 46.50$ 44.88$ 0.05$ (1.57)$ (31,400.00)$ DEC 20,000 46.50$ 44.88$ 0.05$ (1.57)$ (31,400.00)$
2005 JAN 30,000 46.50$ 42.50$ 0.05$ (3.95)$ (118,500.00)$ FEB 30,000 46.50$ 42.50$ 0.05$ (3.95)$ (118,500.00)$
MAR 30,000 46.50$ 42.50$ 0.05$ (3.95)$ (118,500.00)$ APR 30,000 46.50$ 41.00$ 0.05$ (5.45)$ (163,500.00)$ MAY 30,000 46.50$ 41.00$ 0.05$ (5.45)$ (163,500.00)$ JUNE 30,000 46.50$ 41.00$ 0.05$ (5.45)$ (163,500.00)$ JULY 30,000 46.50$ 40.50$ 0.05$ (5.95)$ (178,500.00)$ AUG 30,000 46.50$ 40.50$ 0.05$ (5.95)$ (178,500.00)$ SEPT 30,000 46.50$ 40.50$ 0.05$ (5.95)$ (178,500.00)$ OCT 30,000 46.50$ 40.50$ 0.05$ (5.95)$ (178,500.00)$ NOV 30,000 46.50$ 40.50$ 0.05$ (5.95)$ (178,500.00)$ DEC 30,000 46.50$ 40.50$ 0.05$ (5.95)$ (178,500.00)$
CONTRACT WORK SHEET

Coal Hedging Analysis January 15, 2010
Appendix DFeb 18, 04
Page 2 of 3
CONTRACT Date of InfoSTART DATE END DATE
Supplier I 1/31/2005 4/1/2004 3/31/2006
DATA FOR FUTURES FROM UPI SHEET 2/1/04
TOTAL CONTRACT SAVINGS (COST) (1,140,600.00)$
Tons per month
Actual Contract Price $/ton
Future Price $/ton
Cost of future per ton
Contract Price Minus Future Price Price per ton
Total monthly savings or (cost) to ratepayers
2004 JAN 0.05$ 42.55$ -$ FEB 0.05$ 0.05$ -$
MAR 0.05$ 0.05$ -$ APR 20,000 45.50$ 44.88$ 0.05$ (0.57)$ (11,400.00)$ MAY 20,000 45.50$ 44.88$ 0.05$ (0.57)$ (11,400.00)$ JUNE 20,000 45.50$ 44.88$ 0.05$ (0.57)$ (11,400.00)$ JULY 20,000 45.50$ 44.88$ 0.05$ (0.57)$ (11,400.00)$ AUG 20,000 45.50$ 44.88$ 0.05$ (0.57)$ (11,400.00)$ SEPT 20,000 45.50$ 44.88$ 0.05$ (0.57)$ (11,400.00)$ OCT 20,000 45.50$ 44.88$ 0.05$ (0.57)$ (11,400.00)$ NOV 20,000 45.50$ 44.88$ 0.05$ (0.57)$ (11,400.00)$ DEC 20,000 45.50$ 44.88$ 0.05$ (0.57)$ (11,400.00)$
2005 JAN 20,000 45.50$ 42.50$ 0.05$ (2.95)$ (59,000.00)$ FEB 20,000 45.50$ 42.50$ 0.05$ (2.95)$ (59,000.00)$
MAR 20,000 45.50$ 42.50$ 0.05$ (2.95)$ (59,000.00)$ APR 20,000 45.50$ 41.00$ 0.05$ (4.45)$ (89,000.00)$ MAY 20,000 45.50$ 41.00$ 0.05$ (4.45)$ (89,000.00)$ JUNE 20,000 45.50$ 41.00$ 0.05$ (4.45)$ (89,000.00)$ JULY 20,000 45.50$ 40.50$ 0.05$ (4.95)$ (99,000.00)$ AUG 20,000 45.50$ 40.50$ 0.05$ (4.95)$ (99,000.00)$ SEPT 20,000 45.50$ 40.50$ 0.05$ (4.95)$ (99,000.00)$ OCT 20,000 45.50$ 40.50$ 0.05$ (4.95)$ (99,000.00)$ NOV 20,000 45.50$ 40.50$ 0.05$ (4.95)$ (99,000.00)$ DEC 20,000 45.50$ 40.50$ 0.05$ (4.95)$ (99,000.00)$

Coal Hedging Analysis January 15, 2010
Appendix DFeb 18, 04
Page 3 of 3
CONTRACT Date of InfoSTART DATE END DATE
Supplier J 1/31/2005 1/1/2004 12/31/2004
DATA FOR FUTURES FROM UPI SHEET 11/3/03Purchase Futures Option two months prior to contract start date is optimal, but data not available, assume purchase futures starting on 11/3/03, 1st data data available
TOTAL CONTRACT SAVINGS (COST) (408,000.00)$
Tons per month
Actual Contract Price $/ton
Future Price $/ton
Cost of future per ton
Contract Price Minus Future Price Price per ton
Total monthly savings or (cost) to ratepayers
2004 JAN 20,000 36.20$ 34.25$ 0.05$ (1.90)$ (38,000.00)$ FEB 20,000 36.20$ 34.25$ 0.05$ (1.90)$ (38,000.00)$
MAR 20,000 36.20$ 34.25$ 0.05$ (1.90)$ (38,000.00)$ APR 20,000 36.20$ 34.40$ 0.05$ (1.75)$ (35,000.00)$ MAY 20,000 36.20$ 34.40$ 0.05$ (1.75)$ (35,000.00)$ JUNE 20,000 36.20$ 34.40$ 0.05$ (1.75)$ (35,000.00)$ JULY 20,000 36.20$ 34.50$ 0.05$ (1.65)$ (33,000.00)$ AUG 20,000 36.20$ 34.50$ 0.05$ (1.65)$ (33,000.00)$ SEPT 20,000 36.20$ 34.50$ 0.05$ (1.65)$ (33,000.00)$ OCT 20,000 36.20$ 34.65$ 0.05$ (1.50)$ (30,000.00)$ NOV 20,000 36.20$ 34.65$ 0.05$ (1.50)$ (30,000.00)$ DEC 20,000 36.20$ 34.65$ 0.05$ (1.50)$ (30,000.00)$
2005 JANFEB
MARAPRMAYJUNEJULYAUGSEPTOCTNOVDEC

Coal Hedging Analysis January 15, 2010
Appendix DJan 31, 05
Page 1 of 18
CONTRACT WORK SHEET 31-Jan-05Assume contract was a future rather than a purchase contract- note that buying a future and buying a swap is basically mathematically similar
CONTRACT Date of InfoSTART DATE END DATE
Supplier A 1/31/2005 1/1/2004 12/31/2005
DATA FOR FUTURES FROM UPI SHEET 11/3/03Purchase Futures Option two months prior to contract start date is optimal, but data not available, assume purchase futures starting on 11/3/03, 1st data data available
TOTAL CONTRACT SAVINGS (COST) 135,000.00$
Tons per month
Actual Contract Price $/ton
Future Price $/ton
Cost of future per ton
Contract Price Minus Future Price Price per ton
Total monthly savings or (cost) to ratepayers
2004 JAN 50,000 34.70$ 34.25$ 0.05$ (0.40)$ (20,000.00)$ FEB 50,000 34.70$ 34.25$ 0.05$ (0.40)$ (20,000.00)$
MAR 50,000 34.70$ 34.25$ 0.05$ (0.40)$ (20,000.00)$ APR 50,000 34.70$ 34.40$ 0.05$ (0.25)$ (12,500.00)$ MAY 50,000 34.70$ 34.40$ 0.05$ (0.25)$ (12,500.00)$ JUNE 50,000 34.70$ 34.40$ 0.05$ (0.25)$ (12,500.00)$ JULY 50,000 34.70$ 34.50$ 0.05$ (0.15)$ (7,500.00)$ AUG 50,000 34.70$ 34.50$ 0.05$ (0.15)$ (7,500.00)$ SEPT 50,000 34.70$ 34.50$ 0.05$ (0.15)$ (7,500.00)$ OCT 50,000 34.70$ 34.65$ 0.05$ -$ -$ NOV 50,000 34.70$ 34.65$ 0.05$ -$ -$ DEC 50,000 34.70$ 34.65$ 0.05$ -$ -$
2005 JAN 50,000 34.70$ 34.85$ 0.05$ 0.20$ 10,000.00$ FEB 50,000 34.70$ 34.85$ 0.05$ 0.20$ 10,000.00$
MAR 50,000 34.70$ 34.85$ 0.05$ 0.20$ 10,000.00$ APR 50,000 34.70$ 35.15$ 0.05$ 0.50$ 25,000.00$ MAY 50,000 34.70$ 35.15$ 0.05$ 0.50$ 25,000.00$ JUNE 50,000 34.70$ 35.15$ 0.05$ 0.50$ 25,000.00$ JULY 50,000 34.70$ 35.15$ 0.05$ 0.50$ 25,000.00$ AUG 50,000 34.70$ 35.15$ 0.05$ 0.50$ 25,000.00$ SEPT 50,000 34.70$ 35.15$ 0.05$ 0.50$ 25,000.00$ OCT 50,000 34.70$ 35.15$ 0.05$ 0.50$ 25,000.00$ NOV 50,000 34.70$ 35.15$ 0.05$ 0.50$ 25,000.00$ DEC 50,000 34.70$ 35.15$ 0.05$ 0.50$ 25,000.00$

Coal Hedging Analysis January 15, 2010
Appendix DJan 31, 05
Page 2 of 18
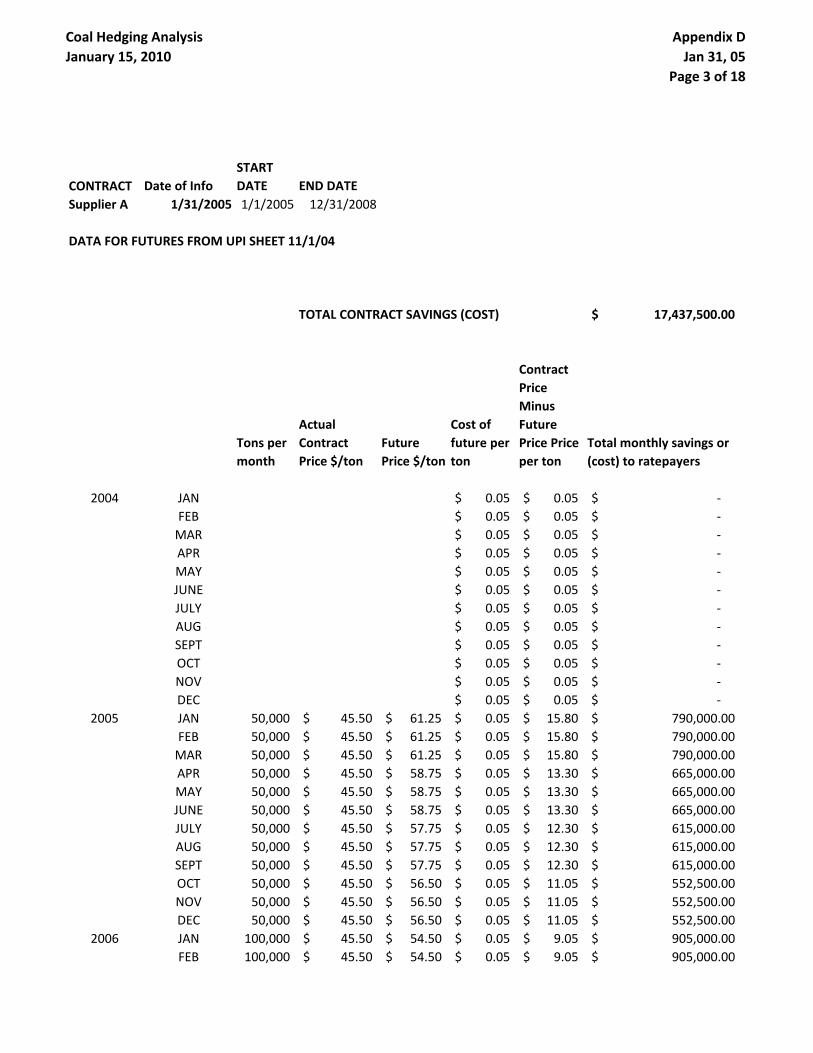
Coal Hedging Analysis January 15, 2010
Appendix DJan 31, 05
Page 3 of 18
CONTRACT Date of InfoSTART DATE END DATE
Supplier A 1/31/2005 1/1/2005 12/31/2008
DATA FOR FUTURES FROM UPI SHEET 11/1/04
TOTAL CONTRACT SAVINGS (COST) 17,437,500.00$
Tons per month
Actual Contract Price $/ton
Future Price $/ton
Cost of future per ton
Contract Price Minus Future Price Price per ton
Total monthly savings or (cost) to ratepayers
2004 JAN 0.05$ 0.05$ -$ FEB 0.05$ 0.05$ -$
MAR 0.05$ 0.05$ -$ APR 0.05$ 0.05$ -$ MAY 0.05$ 0.05$ -$ JUNE 0.05$ 0.05$ -$ JULY 0.05$ 0.05$ -$ AUG 0.05$ 0.05$ -$ SEPT 0.05$ 0.05$ -$ OCT 0.05$ 0.05$ -$ NOV 0.05$ 0.05$ -$ DEC 0.05$ 0.05$ -$
2005 JAN 50,000 45.50$ 61.25$ 0.05$ 15.80$ 790,000.00$ FEB 50,000 45.50$ 61.25$ 0.05$ 15.80$ 790,000.00$
MAR 50,000 45.50$ 61.25$ 0.05$ 15.80$ 790,000.00$ APR 50,000 45.50$ 58.75$ 0.05$ 13.30$ 665,000.00$ MAY 50,000 45.50$ 58.75$ 0.05$ 13.30$ 665,000.00$ JUNE 50,000 45.50$ 58.75$ 0.05$ 13.30$ 665,000.00$ JULY 50,000 45.50$ 57.75$ 0.05$ 12.30$ 615,000.00$ AUG 50,000 45.50$ 57.75$ 0.05$ 12.30$ 615,000.00$ SEPT 50,000 45.50$ 57.75$ 0.05$ 12.30$ 615,000.00$ OCT 50,000 45.50$ 56.50$ 0.05$ 11.05$ 552,500.00$ NOV 50,000 45.50$ 56.50$ 0.05$ 11.05$ 552,500.00$ DEC 50,000 45.50$ 56.50$ 0.05$ 11.05$ 552,500.00$
2006 JAN 100,000 45.50$ 54.50$ 0.05$ 9.05$ 905,000.00$ FEB 100,000 45.50$ 54.50$ 0.05$ 9.05$ 905,000.00$

Coal Hedging Analysis January 15, 2010
Appendix DJan 31, 05
Page 4 of 18
MAR 100,000 45.50$ 54.50$ 0.05$ 9.05$ 905,000.00$ APR 100,000 45.50$ 51.00$ 0.05$ 5.55$ 555,000.00$ MAY 100,000 45.50$ 51.00$ 0.05$ 5.55$ 555,000.00$ JUNE 100,000 45.50$ 51.00$ 0.05$ 5.55$ 555,000.00$ JULY 100,000 45.50$ 51.00$ 0.05$ 5.55$ 555,000.00$ AUG 100,000 45.50$ 51.00$ 0.05$ 5.55$ 555,000.00$ SEPT 100,000 45.50$ 51.00$ 0.05$ 5.55$ 555,000.00$ OCT 100,000 45.50$ 51.00$ 0.05$ 5.55$ 555,000.00$ NOV 100,000 45.50$ 51.00$ 0.05$ 5.55$ 555,000.00$ DEC 100,000 45.50$ 51.00$ 0.05$ 5.55$ 555,000.00$
2007 JAN 100,000 45.50$ 47.00$ 0.05$ 1.55$ 155,000.00$ FEB 100,000 45.50$ 47.00$ 0.05$ 1.55$ 155,000.00$
MAR 100,000 45.50$ 47.00$ 0.05$ 1.55$ 155,000.00$ APR 100,000 45.50$ 47.00$ 0.05$ 1.55$ 155,000.00$ MAY 100,000 45.50$ 47.00$ 0.05$ 1.55$ 155,000.00$ JUNE 100,000 45.50$ 47.00$ 0.05$ 1.55$ 155,000.00$ JULY 100,000 45.50$ 47.00$ 0.05$ 1.55$ 155,000.00$ AUG 100,000 45.50$ 47.00$ 0.05$ 1.55$ 155,000.00$ SEPT 100,000 45.50$ 47.00$ 0.05$ 1.55$ 155,000.00$ OCT 100,000 45.50$ 47.00$ 0.05$ 1.55$ 155,000.00$ NOV 100,000 45.50$ 47.00$ 0.05$ 1.55$ 155,000.00$ DEC 100,000 45.50$ 47.00$ 0.05$ 1.55$ 155,000.00$
2008 JAN 100,000 45.50$ FEB 100,000 45.50$
MAR 100,000 45.50$ APR 100,000 45.50$ MAY 100,000 45.50$ JUNE 100,000 45.50$ JULY 100,000 45.50$ AUG 100,000 45.50$ SEPT 100,000 45.50$ OCT 100,000 45.50$ NOV 100,000 45.50$ DEC 100,000 45.50$

Coal Hedging Analysis January 15, 2010
Appendix DJan 31, 05
Page 5 of 18
CONTRACT Date of InfoSTART DATE END DATE
Supplier J 1/31/2005 1/1/2005 12/31/2007
DATA FOR FUTURES FROM UPI SHEET 11/1/04
TOTAL CONTRACT SAVINGS (COST) 1,333,500.00$
Tons per month
Actual Contract Price $/ton
Future Price $/ton
Cost of future per ton
Contract Price Minus Future Price Price per ton
Total monthly savings or (cost) to ratepayers
2004 JAN 0.05$ 0.05$ -$ FEB 0.05$ 0.05$ -$
MAR 0.05$ 0.05$ -$ APR 0.05$ 0.05$ -$ MAY 0.05$ 0.05$ -$ JUNE 0.05$ 0.05$ -$ JULY 0.05$ 0.05$ -$ AUG 0.05$ 0.05$ -$ SEPT 0.05$ 0.05$ -$ OCT 0.05$ 0.05$ -$ NOV 0.05$ 0.05$ -$ DEC 0.05$ 0.05$ -$
2005 JAN 70,000 52.00$ 61.25$ 0.05$ 9.30$ 651,000.00$ FEB 70,000 52.00$ 61.25$ 0.05$ 9.30$ 651,000.00$
MAR 70,000 52.00$ 61.25$ 0.05$ 9.30$ 651,000.00$ APR 70,000 52.00$ 58.75$ 0.05$ 6.80$ 476,000.00$ MAY 70,000 52.00$ 58.75$ 0.05$ 6.80$ 476,000.00$ JUNE 70,000 52.00$ 58.75$ 0.05$ 6.80$ 476,000.00$ JULY 70,000 52.00$ 57.75$ 0.05$ 5.80$ 406,000.00$ AUG 70,000 52.00$ 57.75$ 0.05$ 5.80$ 406,000.00$ SEPT 70,000 52.00$ 57.75$ 0.05$ 5.80$ 406,000.00$ OCT 70,000 52.00$ 56.50$ 0.05$ 4.55$ 318,500.00$ NOV 70,000 52.00$ 56.50$ 0.05$ 4.55$ 318,500.00$ DEC 70,000 52.00$ 56.50$ 0.05$ 4.55$ 318,500.00$
2006 JAN 70,000 52.00$ 54.50$ 0.05$ 2.55$ 178,500.00$ FEB 70,000 52.00$ 54.50$ 0.05$ 2.55$ 178,500.00$

Coal Hedging Analysis January 15, 2010
Appendix DJan 31, 05
Page 6 of 18
MAR 70,000 52.00$ 54.50$ 0.05$ 2.55$ 178,500.00$ APR 70,000 52.00$ 51.00$ 0.05$ (0.95)$ (66,500.00)$ MAY 70,000 52.00$ 51.00$ 0.05$ (0.95)$ (66,500.00)$ JUNE 70,000 52.00$ 51.00$ 0.05$ (0.95)$ (66,500.00)$ JULY 70,000 52.00$ 51.00$ 0.05$ (0.95)$ (66,500.00)$ AUG 70,000 52.00$ 51.00$ 0.05$ (0.95)$ (66,500.00)$ SEPT 70,000 52.00$ 51.00$ 0.05$ (0.95)$ (66,500.00)$ OCT 70,000 52.00$ 51.00$ 0.05$ (0.95)$ (66,500.00)$ NOV 70,000 52.00$ 51.00$ 0.05$ (0.95)$ (66,500.00)$ DEC 70,000 52.00$ 51.00$ 0.05$ (0.95)$ (66,500.00)$
2007 JAN 70,000 52.00$ 47.00$ 0.05$ (4.95)$ (346,500.00)$ FEB 70,000 52.00$ 47.00$ 0.05$ (4.95)$ (346,500.00)$
MAR 70,000 52.00$ 47.00$ 0.05$ (4.95)$ (346,500.00)$ APR 70,000 52.00$ 47.00$ 0.05$ (4.95)$ (346,500.00)$ MAY 70,000 52.00$ 47.00$ 0.05$ (4.95)$ (346,500.00)$ JUNE 70,000 52.00$ 47.00$ 0.05$ (4.95)$ (346,500.00)$ JULY 70,000 52.00$ 47.00$ 0.05$ (4.95)$ (346,500.00)$ AUG 70,000 52.00$ 47.00$ 0.05$ (4.95)$ (346,500.00)$ SEPT 70,000 52.00$ 47.00$ 0.05$ (4.95)$ (346,500.00)$ OCT 70,000 52.00$ 47.00$ 0.05$ (4.95)$ (346,500.00)$ NOV 70,000 52.00$ 47.00$ 0.05$ (4.95)$ (346,500.00)$ DEC 70,000 52.00$ 47.00$ 0.05$ (4.95)$ (346,500.00)$
2008 JANFEB

Coal Hedging Analysis January 15, 2010
Appendix DJan 31, 05
Page 7 of 18
CONTRACTDate of Info
START DATE END DATE
Supplier K 1/31/2005 1/1/2005 12/31/2006
DATA FOR FUTURES FROM UPI SHEET 11/1/04
TOTAL CONTRACT SAVINGS (COST) 1,569,000.00$
Tons per month
Actual Contract Price $/ton
Future Price $/ton
Cost of future per ton
Contract Price Minus Future Price Price per ton
Total monthly savings or (cost) to ratepayers
2004 JAN 0.05$ 0.05$ -$ FEB 0.05$ 0.05$ -$
MAR 0.05$ 0.05$ -$ APR 0.05$ 0.05$ -$ MAY 0.05$ 0.05$ -$ JUNE 0.05$ 0.05$ -$ JULY 0.05$ 0.05$ -$ AUG 0.05$ 0.05$ -$ SEPT 0.05$ 0.05$ -$ OCT 0.05$ 0.05$ -$ NOV 0.05$ 0.05$ -$ DEC 0.05$ 0.05$ -$
2005 JAN 20,000 52.00$ 61.25$ 0.05$ 9.30$ 186,000.00$ FEB 20,000 52.00$ 61.25$ 0.05$ 9.30$ 186,000.00$
MAR 20,000 52.00$ 61.25$ 0.05$ 9.30$ 186,000.00$ APR 20,000 52.00$ 58.75$ 0.05$ 6.80$ 136,000.00$ MAY 20,000 52.00$ 58.75$ 0.05$ 6.80$ 136,000.00$ JUNE 20,000 52.00$ 58.75$ 0.05$ 6.80$ 136,000.00$ JULY 20,000 52.00$ 57.75$ 0.05$ 5.80$ 116,000.00$ AUG 20,000 52.00$ 57.75$ 0.05$ 5.80$ 116,000.00$ SEPT 20,000 52.00$ 57.75$ 0.05$ 5.80$ 116,000.00$ OCT 20,000 52.00$ 56.50$ 0.05$ 4.55$ 91,000.00$ NOV 20,000 52.00$ 56.50$ 0.05$ 4.55$ 91,000.00$ DEC 20,000 52.00$ 56.50$ 0.05$ 4.55$ 91,000.00$
2006 JAN 20,000 52.00$ 54.50$ 0.05$ 2.55$ 51,000.00$ FEB 20,000 52.00$ 54.50$ 0.05$ 2.55$ 51,000.00$

Coal Hedging Analysis January 15, 2010
Appendix DJan 31, 05
Page 8 of 18
MAR 20,000 52.00$ 54.50$ 0.05$ 2.55$ 51,000.00$ APR 20,000 52.00$ 51.00$ 0.05$ (0.95)$ (19,000.00)$ MAY 20,000 52.00$ 51.00$ 0.05$ (0.95)$ (19,000.00)$ JUNE 20,000 52.00$ 51.00$ 0.05$ (0.95)$ (19,000.00)$ JULY 20,000 52.00$ 51.00$ 0.05$ (0.95)$ (19,000.00)$ AUG 20,000 52.00$ 51.00$ 0.05$ (0.95)$ (19,000.00)$ SEPT 20,000 52.00$ 51.00$ 0.05$ (0.95)$ (19,000.00)$ OCT 20,000 52.00$ 51.00$ 0.05$ (0.95)$ (19,000.00)$ NOV 20,000 52.00$ 51.00$ 0.05$ (0.95)$ (19,000.00)$ DEC 20,000 52.00$ 51.00$ 0.05$ (0.95)$ (19,000.00)$
2007 JAN 47.00$ 0.05$ 47.05$ -$ FEB 47.00$ 0.05$ 47.05$ -$
MAR 47.00$ 0.05$ 47.05$ -$ APR 47.00$ 0.05$ 47.05$ -$ MAY 47.00$ 0.05$ 47.05$ -$ JUNE 47.00$ 0.05$ 47.05$ -$ JULY 47.00$ 0.05$ 47.05$ -$ AUG 47.00$ 0.05$ 47.05$ -$ SEPT 47.00$ 0.05$ 47.05$ -$ OCT 47.00$ 0.05$ 47.05$ -$ NOV 47.00$ 0.05$ 47.05$ -$ DEC 47.00$ 0.05$ 47.05$ -$
2008 JANFEB

Coal Hedging Analysis January 15, 2010
Appendix DJan 31, 05
Page 9 of 18
CONTRACTDate of Info
START DATE END DATE
Supplier L 1/31/2005 12/1/2004 11/30/2007
DATA FOR FUTURES FROM UPI SHEET 10/1/04
TOTAL CONTRACT SAVINGS (COST) (310,500.00)$
Tons per month
Actual Contract Price $/ton
Future Price $/ton
Cost of future per ton
Contract Price Minus Future Price Price per ton
Total monthly savings or (cost) to ratepayers
2004 JAN 0.05$ 0.05$ -$ FEB 0.05$ 0.05$ -$
MAR 0.05$ 0.05$ -$ APR 0.05$ 0.05$ -$ MAY 0.05$ 0.05$ -$ JUNE 0.05$ 0.05$ -$ JULY 0.05$ 0.05$ -$ AUG 0.05$ 0.05$ -$ SEPT 0.05$ 0.05$ -$ OCT 0.05$ 0.05$ -$ NOV 0.05$ 0.05$ -$ DEC 54,000 53.00$ 65.25$ 0.05$ 12.30$ 664,200.00$
2005 JAN 54,000 53.00$ 62.00$ 0.05$ 9.05$ 488,700.00$ FEB 54,000 53.00$ 62.00$ 0.05$ 9.05$ 488,700.00$
MAR 54,000 53.00$ 62.00$ 0.05$ 9.05$ 488,700.00$ APR 54,000 53.00$ 59.90$ 0.05$ 6.95$ 375,300.00$ MAY 54,000 53.00$ 59.90$ 0.05$ 6.95$ 375,300.00$ JUNE 54,000 53.00$ 59.90$ 0.05$ 6.95$ 375,300.00$ JULY 54,000 53.00$ 57.75$ 0.05$ 4.80$ 259,200.00$ AUG 54,000 53.00$ 57.75$ 0.05$ 4.80$ 259,200.00$ SEPT 54,000 53.00$ 57.75$ 0.05$ 4.80$ 259,200.00$ OCT 54,000 53.00$ 55.75$ 0.05$ 2.80$ 151,200.00$ NOV 54,000 53.00$ 55.75$ 0.05$ 2.80$ 151,200.00$ DEC 54,000 53.00$ 55.75$ 0.05$ 2.80$ 151,200.00$
2006 JAN 54,000 53.00$ 51.00$ 0.05$ (1.95)$ (105,300.00)$ FEB 54,000 53.00$ 51.00$ 0.05$ (1.95)$ (105,300.00)$
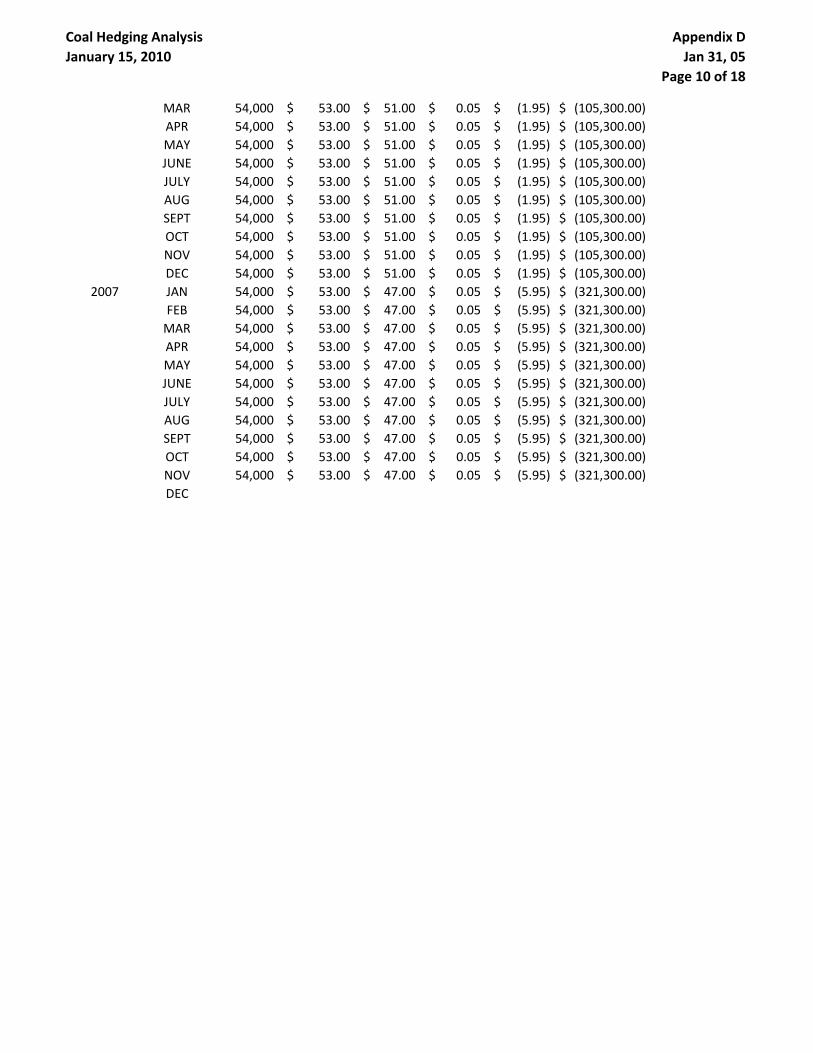
Coal Hedging Analysis January 15, 2010
Appendix DJan 31, 05
Page 10 of 18
MAR 54,000 53.00$ 51.00$ 0.05$ (1.95)$ (105,300.00)$ APR 54,000 53.00$ 51.00$ 0.05$ (1.95)$ (105,300.00)$ MAY 54,000 53.00$ 51.00$ 0.05$ (1.95)$ (105,300.00)$ JUNE 54,000 53.00$ 51.00$ 0.05$ (1.95)$ (105,300.00)$ JULY 54,000 53.00$ 51.00$ 0.05$ (1.95)$ (105,300.00)$ AUG 54,000 53.00$ 51.00$ 0.05$ (1.95)$ (105,300.00)$ SEPT 54,000 53.00$ 51.00$ 0.05$ (1.95)$ (105,300.00)$ OCT 54,000 53.00$ 51.00$ 0.05$ (1.95)$ (105,300.00)$ NOV 54,000 53.00$ 51.00$ 0.05$ (1.95)$ (105,300.00)$ DEC 54,000 53.00$ 51.00$ 0.05$ (1.95)$ (105,300.00)$
2007 JAN 54,000 53.00$ 47.00$ 0.05$ (5.95)$ (321,300.00)$ FEB 54,000 53.00$ 47.00$ 0.05$ (5.95)$ (321,300.00)$
MAR 54,000 53.00$ 47.00$ 0.05$ (5.95)$ (321,300.00)$ APR 54,000 53.00$ 47.00$ 0.05$ (5.95)$ (321,300.00)$ MAY 54,000 53.00$ 47.00$ 0.05$ (5.95)$ (321,300.00)$ JUNE 54,000 53.00$ 47.00$ 0.05$ (5.95)$ (321,300.00)$ JULY 54,000 53.00$ 47.00$ 0.05$ (5.95)$ (321,300.00)$ AUG 54,000 53.00$ 47.00$ 0.05$ (5.95)$ (321,300.00)$ SEPT 54,000 53.00$ 47.00$ 0.05$ (5.95)$ (321,300.00)$ OCT 54,000 53.00$ 47.00$ 0.05$ (5.95)$ (321,300.00)$ NOV 54,000 53.00$ 47.00$ 0.05$ (5.95)$ (321,300.00)$ DEC

Coal Hedging Analysis January 15, 2010
Appendix DJan 31, 05
Page 11 of 18
CONTRACTDate of Info
START DATE END DATE
Supplier M 1/31/2005 1/1/2005 12/31/2008
DATA FOR FUTURES FROM UPI SHEET 11/1/04
TOTAL CONTRACT SAVINGS (COST) 5,463,000.00$
Tons per month
Actual Contract Price $/ton
Future Price $/ton
Cost of future per ton
Contract Price Minus Future Price Price per ton
Total monthly savings or (cost) to ratepayers
2004 JAN 0.05$ 0.05$ -$ FEB 0.05$ 0.05$ -$
MAR 0.05$ 0.05$ -$ APR 0.05$ 0.05$ -$ MAY 0.05$ 0.05$ -$ JUNE 0.05$ 0.05$ -$ JULY 0.05$ 0.05$ -$ AUG 0.05$ 0.05$ -$ SEPT 0.05$ 0.05$ -$ OCT 0.05$ 0.05$ -$ NOV 0.05$ 0.05$ -$ DEC 0.05$ 0.05$ -$
2005 JAN 60,000 50.00$ 61.25$ 0.05$ 11.30$ 678,000.00$ FEB 60,000 50.00$ 61.25$ 0.05$ 11.30$ 678,000.00$
MAR 60,000 50.00$ 61.25$ 0.05$ 11.30$ 678,000.00$ APR 60,000 50.00$ 58.75$ 0.05$ 8.80$ 528,000.00$ MAY 60,000 50.00$ 58.75$ 0.05$ 8.80$ 528,000.00$ JUNE 60,000 50.00$ 58.75$ 0.05$ 8.80$ 528,000.00$ JULY 60,000 50.00$ 57.75$ 0.05$ 7.80$ 468,000.00$ AUG 60,000 50.00$ 57.75$ 0.05$ 7.80$ 468,000.00$ SEPT 60,000 50.00$ 57.75$ 0.05$ 7.80$ 468,000.00$ OCT 60,000 50.00$ 56.50$ 0.05$ 6.55$ 393,000.00$ NOV 60,000 50.00$ 56.50$ 0.05$ 6.55$ 393,000.00$ DEC 60,000 50.00$ 56.50$ 0.05$ 6.55$ 393,000.00$
2006 JAN 60,000 50.00$ 54.50$ 0.05$ 4.55$ 273,000.00$ FEB 60,000 50.00$ 54.50$ 0.05$ 4.55$ 273,000.00$

Coal Hedging Analysis January 15, 2010
Appendix DJan 31, 05
Page 12 of 18
MAR 60,000 50.00$ 54.50$ 0.05$ 4.55$ 273,000.00$ APR 60,000 50.00$ 51.00$ 0.05$ 1.05$ 63,000.00$ MAY 60,000 50.00$ 51.00$ 0.05$ 1.05$ 63,000.00$ JUNE 60,000 50.00$ 51.00$ 0.05$ 1.05$ 63,000.00$ JULY 60,000 50.00$ 51.00$ 0.05$ 1.05$ 63,000.00$ AUG 60,000 50.00$ 51.00$ 0.05$ 1.05$ 63,000.00$ SEPT 60,000 50.00$ 51.00$ 0.05$ 1.05$ 63,000.00$ OCT 60,000 50.00$ 51.00$ 0.05$ 1.05$ 63,000.00$ NOV 60,000 50.00$ 51.00$ 0.05$ 1.05$ 63,000.00$ DEC 60,000 50.00$ 51.00$ 0.05$ 1.05$ 63,000.00$
2007 JAN 60,000 50.00$ 47.00$ 0.05$ (2.95)$ (177,000.00)$ FEB 60,000 50.00$ 47.00$ 0.05$ (2.95)$ (177,000.00)$
MAR 60,000 50.00$ 47.00$ 0.05$ (2.95)$ (177,000.00)$ APR 60,000 50.00$ 47.00$ 0.05$ (2.95)$ (177,000.00)$ MAY 60,000 50.00$ 47.00$ 0.05$ (2.95)$ (177,000.00)$ JUNE 60,000 50.00$ 47.00$ 0.05$ (2.95)$ (177,000.00)$ JULY 60,000 50.00$ 47.00$ 0.05$ (2.95)$ (177,000.00)$ AUG 60,000 50.00$ 47.00$ 0.05$ (2.95)$ (177,000.00)$ SEPT 60,000 50.00$ 47.00$ 0.05$ (2.95)$ (177,000.00)$ OCT 60,000 50.00$ 47.00$ 0.05$ (2.95)$ (177,000.00)$ NOV 60,000 50.00$ 47.00$ 0.05$ (2.95)$ (177,000.00)$ DEC 60,000 50.00$ 47.00$ 0.05$ (2.95)$ (177,000.00)$

Coal Hedging Analysis January 15, 2010
Appendix DJan 31, 05
Page 13 of 18
CONTRACT Date of InfoSTART DATE END DATE
Supplier D 1/31/2005 1/1/2005 12/31/2008
DATA FOR FUTURES FROM UPI SHEET 11/1/04
TOTAL CONTRACT SAVINGS (COST) 17,152,500.00$
Tons per month
Actual Contract Price $/ton
Future Price $/ton
Cost of future per ton
Contract Price Minus Future Price Price per ton
Total monthly savings or (cost) to ratepayers
2004 JAN 0.05$ 0.05$ -$ FEB 0.05$ 0.05$ -$
MAR 0.05$ 0.05$ -$ APR 0.05$ 0.05$ -$ MAY 0.05$ 0.05$ -$ JUNE 0.05$ 0.05$ -$ JULY 0.05$ 0.05$ -$ AUG 0.05$ 0.05$ -$ SEPT 0.05$ 0.05$ -$ OCT 0.05$ 0.05$ -$ NOV 0.05$ 0.05$ -$ DEC 0.05$ 0.05$ -$
2005 JAN 50,000 43.00$ 61.25$ 0.05$ 18.30$ 915,000.00$ FEB 50,000 43.00$ 61.25$ 0.05$ 18.30$ 915,000.00$
MAR 50,000 43.00$ 61.25$ 0.05$ 18.30$ 915,000.00$ APR 50,000 43.00$ 58.75$ 0.05$ 15.80$ 790,000.00$ MAY 50,000 43.00$ 58.75$ 0.05$ 15.80$ 790,000.00$ JUNE 50,000 43.00$ 58.75$ 0.05$ 15.80$ 790,000.00$ JULY 50,000 43.00$ 57.75$ 0.05$ 14.80$ 740,000.00$ AUG 50,000 43.00$ 57.75$ 0.05$ 14.80$ 740,000.00$ SEPT 50,000 43.00$ 57.75$ 0.05$ 14.80$ 740,000.00$ OCT 50,000 43.00$ 56.50$ 0.05$ 13.55$ 677,500.00$ NOV 50,000 43.00$ 56.50$ 0.05$ 13.55$ 677,500.00$ DEC 50,000 43.00$ 56.50$ 0.05$ 13.55$ 677,500.00$
2006 JAN 50,000 43.00$ 54.50$ 0.05$ 11.55$ 577,500.00$ FEB 50,000 43.00$ 54.50$ 0.05$ 11.55$ 577,500.00$

Coal Hedging Analysis January 15, 2010
Appendix DJan 31, 05
Page 14 of 18
MAR 50,000 43.00$ 54.50$ 0.05$ 11.55$ 577,500.00$ APR 50,000 43.00$ 51.00$ 0.05$ 8.05$ 402,500.00$ MAY 50,000 43.00$ 51.00$ 0.05$ 8.05$ 402,500.00$ JUNE 50,000 43.00$ 51.00$ 0.05$ 8.05$ 402,500.00$ JULY 50,000 43.00$ 51.00$ 0.05$ 8.05$ 402,500.00$ AUG 50,000 43.00$ 51.00$ 0.05$ 8.05$ 402,500.00$ SEPT 50,000 43.00$ 51.00$ 0.05$ 8.05$ 402,500.00$ OCT 50,000 43.00$ 51.00$ 0.05$ 8.05$ 402,500.00$ NOV 50,000 43.00$ 51.00$ 0.05$ 8.05$ 402,500.00$ DEC 50,000 43.00$ 51.00$ 0.05$ 8.05$ 402,500.00$
2007 JAN 50,000 43.00$ 47.00$ 0.05$ 4.05$ 202,500.00$ FEB 50,000 43.00$ 47.00$ 0.05$ 4.05$ 202,500.00$
MAR 50,000 43.00$ 47.00$ 0.05$ 4.05$ 202,500.00$ APR 50,000 43.00$ 47.00$ 0.05$ 4.05$ 202,500.00$ MAY 50,000 43.00$ 47.00$ 0.05$ 4.05$ 202,500.00$ JUNE 50,000 43.00$ 47.00$ 0.05$ 4.05$ 202,500.00$ JULY 50,000 43.00$ 47.00$ 0.05$ 4.05$ 202,500.00$ AUG 50,000 43.00$ 47.00$ 0.05$ 4.05$ 202,500.00$ SEPT 50,000 43.00$ 47.00$ 0.05$ 4.05$ 202,500.00$ OCT 50,000 43.00$ 47.00$ 0.05$ 4.05$ 202,500.00$ NOV 50,000 43.00$ 47.00$ 0.05$ 4.05$ 202,500.00$ DEC 50,000 43.00$ 47.00$ 0.05$ 4.05$ 202,500.00$

Coal Hedging Analysis January 15, 2010
Appendix DJan 31, 05
Page 15 of 18
CONTRACT Date of InfoSTART DATE END DATE
Supplier N 1/31/2005 1/1/2005 12/31/2008
DATA FOR FUTURES FROM UPI SHEET 11/1/04
TOTAL CONTRACT SAVINGS (COST) 12,303,000.00$
Tons per month
Actual Contract Price $/ton
Future Price $/ton
Cost of future per ton
Contract Price Minus Future Price Price per ton
Total monthly savings or (cost) to ratepayers
2004 JAN 0.05$ 0.05$ -$ FEB 0.05$ 0.05$ -$
MAR 0.05$ 0.05$ -$ APR 0.05$ 0.05$ -$ MAY 0.05$ 0.05$ -$ JUNE 0.05$ 0.05$ -$ JULY 0.05$ 0.05$ -$ AUG 0.05$ 0.05$ -$ SEPT 0.05$ 0.05$ -$ OCT 0.05$ 0.05$ -$ NOV 0.05$ 0.05$ -$ DEC 0.05$ 0.05$ -$
2005 JAN 60,000 46.75$ 61.25$ 0.05$ 14.55$ 873,000.00$ FEB 60,000 46.75$ 61.25$ 0.05$ 14.55$ 873,000.00$
MAR 60,000 46.75$ 61.25$ 0.05$ 14.55$ 873,000.00$ APR 60,000 46.75$ 58.75$ 0.05$ 12.05$ 723,000.00$ MAY 60,000 46.75$ 58.75$ 0.05$ 12.05$ 723,000.00$ JUNE 60,000 46.75$ 58.75$ 0.05$ 12.05$ 723,000.00$ JULY 60,000 46.75$ 57.75$ 0.05$ 11.05$ 663,000.00$ AUG 60,000 46.75$ 57.75$ 0.05$ 11.05$ 663,000.00$ SEPT 60,000 46.75$ 57.75$ 0.05$ 11.05$ 663,000.00$ OCT 60,000 46.75$ 56.50$ 0.05$ 9.80$ 588,000.00$ NOV 60,000 46.75$ 56.50$ 0.05$ 9.80$ 588,000.00$ DEC 60,000 46.75$ 56.50$ 0.05$ 9.80$ 588,000.00$
2006 JAN 60,000 46.75$ 54.50$ 0.05$ 7.80$ 468,000.00$ FEB 60,000 46.75$ 54.50$ 0.05$ 7.80$ 468,000.00$

Coal Hedging Analysis January 15, 2010
Appendix DJan 31, 05
Page 16 of 18
MAR 60,000 46.75$ 54.50$ 0.05$ 7.80$ 468,000.00$ APR 60,000 46.75$ 51.00$ 0.05$ 4.30$ 258,000.00$ MAY 60,000 46.75$ 51.00$ 0.05$ 4.30$ 258,000.00$ JUNE 60,000 46.75$ 51.00$ 0.05$ 4.30$ 258,000.00$ JULY 60,000 46.75$ 51.00$ 0.05$ 4.30$ 258,000.00$ AUG 60,000 46.75$ 51.00$ 0.05$ 4.30$ 258,000.00$ SEPT 60,000 46.75$ 51.00$ 0.05$ 4.30$ 258,000.00$ OCT 60,000 46.75$ 51.00$ 0.05$ 4.30$ 258,000.00$ NOV 60,000 46.75$ 51.00$ 0.05$ 4.30$ 258,000.00$ DEC 60,000 46.75$ 51.00$ 0.05$ 4.30$ 258,000.00$
2007 JAN 60,000 46.75$ 47.00$ 0.05$ 0.30$ 18,000.00$ FEB 60,000 46.75$ 47.00$ 0.05$ 0.30$ 18,000.00$
MAR 60,000 46.75$ 47.00$ 0.05$ 0.30$ 18,000.00$ APR 60,000 46.75$ 47.00$ 0.05$ 0.30$ 18,000.00$ MAY 60,000 46.75$ 47.00$ 0.05$ 0.30$ 18,000.00$ JUNE 60,000 46.75$ 47.00$ 0.05$ 0.30$ 18,000.00$ JULY 60,000 46.75$ 47.00$ 0.05$ 0.30$ 18,000.00$ AUG 60,000 46.75$ 47.00$ 0.05$ 0.30$ 18,000.00$ SEPT 60,000 46.75$ 47.00$ 0.05$ 0.30$ 18,000.00$ OCT 60,000 46.75$ 47.00$ 0.05$ 0.30$ 18,000.00$ NOV 60,000 46.75$ 47.00$ 0.05$ 0.30$ 18,000.00$ DEC 60,000 46.75$ 47.00$ 0.05$ 0.30$ 18,000.00$

Coal Hedging Analysis January 15, 2010
Appendix DJan 31, 05
Page 17 of 18
CONTRACT Date of InfoSTART DATE END DATE
Supplier O 1/31/2005 1/1/2005 12/31/2008
DATA FOR FUTURES FROM UPI SHEET 11/1/04
TOTAL CONTRACT SAVINGS (COST) 23,002,500.00$
Tons per month
Actual Contract Price $/ton
Future Price $/ton
Cost of future per ton
Contract Price Minus Future Price Price per ton
Total monthly savings or (cost) to ratepayers
2004 JAN 0.05$ 0.05$ -$ FEB 0.05$ 0.05$ -$
MAR 0.05$ 0.05$ -$ APR 0.05$ 0.05$ -$ MAY 0.05$ 0.05$ -$ JUNE 0.05$ 0.05$ -$ JULY 0.05$ 0.05$ -$ AUG 0.05$ 0.05$ -$ SEPT 0.05$ 0.05$ -$ OCT 0.05$ 0.05$ -$ NOV 0.05$ 0.05$ -$ DEC 0.05$ 0.05$ -$
2005 JAN 50,000 39.75$ 61.25$ 0.05$ 21.55$ 1,077,500.00$ FEB 50,000 39.75$ 61.25$ 0.05$ 21.55$ 1,077,500.00$
MAR 50,000 39.75$ 61.25$ 0.05$ 21.55$ 1,077,500.00$ APR 50,000 39.75$ 58.75$ 0.05$ 19.05$ 952,500.00$ MAY 50,000 39.75$ 58.75$ 0.05$ 19.05$ 952,500.00$ JUNE 50,000 39.75$ 58.75$ 0.05$ 19.05$ 952,500.00$ JULY 50,000 39.75$ 57.75$ 0.05$ 18.05$ 902,500.00$ AUG 50,000 39.75$ 57.75$ 0.05$ 18.05$ 902,500.00$ SEPT 50,000 39.75$ 57.75$ 0.05$ 18.05$ 902,500.00$ OCT 50,000 39.75$ 56.50$ 0.05$ 16.80$ 840,000.00$ NOV 50,000 39.75$ 56.50$ 0.05$ 16.80$ 840,000.00$ DEC 50,000 39.75$ 56.50$ 0.05$ 16.80$ 840,000.00$
2006 JAN 50,000 39.75$ 54.50$ 0.05$ 14.80$ 740,000.00$ FEB 50,000 39.75$ 54.50$ 0.05$ 14.80$ 740,000.00$

Coal Hedging Analysis January 15, 2010
Appendix DJan 31, 05
Page 18 of 18
MAR 50,000 39.75$ 54.50$ 0.05$ 14.80$ 740,000.00$ APR 50,000 39.75$ 51.00$ 0.05$ 11.30$ 565,000.00$ MAY 50,000 39.75$ 51.00$ 0.05$ 11.30$ 565,000.00$ JUNE 50,000 39.75$ 51.00$ 0.05$ 11.30$ 565,000.00$ JULY 50,000 39.75$ 51.00$ 0.05$ 11.30$ 565,000.00$ AUG 50,000 39.75$ 51.00$ 0.05$ 11.30$ 565,000.00$ SEPT 50,000 39.75$ 51.00$ 0.05$ 11.30$ 565,000.00$ OCT 50,000 39.75$ 51.00$ 0.05$ 11.30$ 565,000.00$ NOV 50,000 39.75$ 51.00$ 0.05$ 11.30$ 565,000.00$ DEC 50,000 39.75$ 51.00$ 0.05$ 11.30$ 565,000.00$
2007 JAN 50,000 39.75$ 47.00$ 0.05$ 7.30$ 365,000.00$ FEB 50,000 39.75$ 47.00$ 0.05$ 7.30$ 365,000.00$
MAR 50,000 39.75$ 47.00$ 0.05$ 7.30$ 365,000.00$ APR 50,000 39.75$ 47.00$ 0.05$ 7.30$ 365,000.00$ MAY 50,000 39.75$ 47.00$ 0.05$ 7.30$ 365,000.00$ JUNE 50,000 39.75$ 47.00$ 0.05$ 7.30$ 365,000.00$ JULY 50,000 39.75$ 47.00$ 0.05$ 7.30$ 365,000.00$ AUG 50,000 39.75$ 47.00$ 0.05$ 7.30$ 365,000.00$ SEPT 50,000 39.75$ 47.00$ 0.05$ 7.30$ 365,000.00$ OCT 50,000 39.75$ 47.00$ 0.05$ 7.30$ 365,000.00$ NOV 50,000 39.75$ 47.00$ 0.05$ 7.30$ 365,000.00$ DEC 50,000 39.75$ 47.00$ 0.05$ 7.30$ 365,000.00$

Coal Hedging Analysis January 15, 2010
Appendix DJune 17, 05Page 1 of 2
CONTRACT WORK SHEET 17-Jun-05Assume contract was a future rather than a purchase contract- note that buying a future and buying a swap is basically mathematically similar
CONTRACT Date of InfoSTART DATE END DATE
Supplier P 6/17/2005 3/1/2005 12/31/2007
DATA FOR FUTURES FROM UPI SHEET 1/3/05
TOTAL CONTRACT SAVINGS (COST) (501,250.00)$
Tons per month
Actual Contract Price $/ton
Future Price $/ton
Cost of future per ton
Contract Price Minus Future Price Price per ton
Total monthly savings or (cost) to ratepayers
2003 AUG 0.05$ 0.05$ -$ SEPT 0.05$ 0.05$ -$ OCT 0.05$ 0.05$ -$ NOV 0.05$ 0.05$ -$ DEC 0.05$ 0.05$ -$
2004 JAN 0.05$ 0.05$ -$ FEB 0.05$ 0.05$ -$
MAR 0.05$ 0.05$ -$ APR 0.05$ 0.05$ -$ MAY 0.05$ 0.05$ -$ JUNE 0.05$ 0.05$ -$ JULY 0.05$ 0.05$ -$ AUG 0.05$ 0.05$ -$ SEPT 0.05$ 0.05$ -$ OCT 0.05$ 0.05$ -$ NOV 0.05$ 0.05$ -$ DEC 0.05$ 0.05$ -$
2005 JAN 0.05$ 0.05$ -$ FEB 0.05$ 0.05$ -$
MAR 25,000 52.00$ 56.50$ 0.05$ 4.55$ 113,750.00$ APR 25,000 52.00$ 57.50$ 0.05$ 5.55$ 138,750.00$ MAY 25,000 52.00$ 57.50$ 0.05$ 5.55$ 138,750.00$ JUNE 25,000 52.00$ 57.50$ 0.05$ 5.55$ 138,750.00$ JULY 25,000 52.00$ 57.00$ 0.05$ 5.05$ 126,250.00$ AUG 25,000 52.00$ 57.00$ 0.05$ 5.05$ 126,250.00$ SEPT 25,000 52.00$ 57.00$ 0.05$ 5.05$ 126,250.00$ OCT 25,000 52.00$ 56.00$ 0.05$ 4.05$ 101,250.00$ NOV 25,000 52.00$ 56.00$ 0.05$ 4.05$ 101,250.00$

Coal Hedging Analysis January 15, 2010
Appendix DJune 17, 05Page 2 of 2
DEC 25,000 52.00$ 56.00$ 0.05$ 4.05$ 101,250.00$ 2006 JAN 25,000 52.00$ 53.75$ 0.05$ 1.80$ 45,000.00$
FEB 25,000 52.00$ 53.75$ 0.05$ 1.80$ 45,000.00$ MAR 25,000 52.00$ 53.75$ 0.05$ 1.80$ 45,000.00$ APR 25,000 52.00$ 51.50$ 0.05$ (0.45)$ (11,250.00)$ MAY 25,000 52.00$ 51.50$ 0.05$ (0.45)$ (11,250.00)$ JUNE 25,000 52.00$ 51.50$ 0.05$ (0.45)$ (11,250.00)$ JULY 25,000 52.00$ 50.25$ 0.05$ (1.70)$ (42,500.00)$ AUG 25,000 52.00$ 50.25$ 0.05$ (1.70)$ (42,500.00)$ SEPT 25,000 52.00$ 50.25$ 0.05$ (1.70)$ (42,500.00)$ OCT 25,000 52.00$ 50.25$ 0.05$ (1.70)$ (42,500.00)$ NOV 25,000 52.00$ 50.25$ 0.05$ (1.70)$ (42,500.00)$ DEC 25,000 52.00$ 50.25$ 0.05$ (1.70)$ (42,500.00)$
2007 JAN 25,000 52.00$ 46.75$ 0.05$ (5.20)$ (130,000.00)$ FEB 25,000 52.00$ 46.75$ 0.05$ (5.20)$ (130,000.00)$
MAR 25,000 52.00$ 46.75$ 0.05$ (5.20)$ (130,000.00)$ APR 25,000 52.00$ 46.75$ 0.05$ (5.20)$ (130,000.00)$ MAY 25,000 52.00$ 46.75$ 0.05$ (5.20)$ (130,000.00)$ JUNE 25,000 52.00$ 46.75$ 0.05$ (5.20)$ (130,000.00)$ JULY 25,000 52.00$ 46.75$ 0.05$ (5.20)$ (130,000.00)$ AUG 25,000 52.00$ 46.75$ 0.05$ (5.20)$ (130,000.00)$ SEPT 25,000 52.00$ 46.75$ 0.05$ (5.20)$ (130,000.00)$ OCT 25,000 52.00$ 46.75$ 0.05$ (5.20)$ (130,000.00)$ NOV 25,000 52.00$ 46.75$ 0.05$ (5.20)$ (130,000.00)$ DEC 25,000 52.00$ 46.75$ 0.05$ (5.20)$ (130,000.00)$

Coal Hedging Analysis January 15, 2010
Appendix DJan 06 to Jan 08
Page 1 of 8
CONTRACT WORK SHEET 1/1/2006 to Jan 2008Assume contract was a future rather than a purchase contract- note that buying a future and buying a swap is basically mathematically similar
CONTRACTDate of Info START DATE END DATE
Supplier Q 1/1/2007 12/31/2008
DATA FOR FUTURES FROM UPI SHEET 1/3 8/1/2006
TOTAL CONTRACT SAVINGS (COST) (1,952,494.20)$
Tons per month
Actual Contract Price $/ton
Future Price $/ton
Cost of future per ton
Contract Price Minus Future Price Price per ton
Total monthly savings or (cost) to ratepayers
DEC -$ -$ 2006 JAN -$ -$
FEB -$ -$ MAR -$ -$ APR -$ -$ MAY -$ -$ JUNE -$ -$ JULY -$ -$ AUG -$ -$ SEPT -$ -$ OCT -$ -$ NOV -$ -$ DEC -$ -$
2007 JAN 50,000 52.00$ 50.75$ 0.05$ (1.20)$ (60,000.00)$ FEB 50,000 52.00$ 50.75$ 0.05$ (1.20)$ (60,000.00)$
MAR 50,000 52.00$ 50.75$ 0.05$ (1.20)$ (60,000.00)$ APR 50,000 52.00$ 50.75$ 0.05$ (1.20)$ (60,000.00)$ MAY 50,000 52.00$ 50.75$ 0.05$ (1.20)$ (60,000.00)$ JUNE 50,000 52.00$ 50.75$ 0.05$ (1.20)$ (60,000.00)$ JULY 50,000 52.00$ 50.75$ 0.05$ (1.20)$ (60,000.00)$ AUG 50,000 52.00$ 50.75$ 0.05$ (1.20)$ (60,000.00)$ SEPT 50,000 52.00$ 50.75$ 0.05$ (1.20)$ (60,000.00)$ OCT 50,000 52.00$ 50.75$ 0.05$ (1.20)$ (60,000.00)$ NOV 50,000 52.00$ 50.75$ 0.05$ (1.20)$ (60,000.00)$ DEC 50,000 52.00$ 50.75$ 0.05$ (1.20)$ (60,000.00)$
2008 JAN 70,833 52.50$ 51.00$ 0.05$ (1.45)$ (102,707.85)$ FEB 70,833 52.50$ 51.00$ 0.05$ (1.45)$ (102,707.85)$
MAR 70,833 52.50$ 51.00$ 0.05$ (1.45)$ (102,707.85)$

Coal Hedging Analysis January 15, 2010
Appendix DJan 06 to Jan 08
Page 2 of 8
APR 70,833 52.50$ 51.00$ 0.05$ (1.45)$ (102,707.85)$ MAY 70,833 52.50$ 51.00$ 0.05$ (1.45)$ (102,707.85)$ JUNE 70,833 52.50$ 51.00$ 0.05$ (1.45)$ (102,707.85)$ JULY 70,833 52.50$ 51.00$ 0.05$ (1.45)$ (102,707.85)$ AUG 70,833 52.50$ 51.00$ 0.05$ (1.45)$ (102,707.85)$ SEPT 70,833 52.50$ 51.00$ 0.05$ (1.45)$ (102,707.85)$ OCT 70,833 52.50$ 51.00$ 0.05$ (1.45)$ (102,707.85)$ NOV 70,833 52.50$ 51.00$ 0.05$ (1.45)$ (102,707.85)$ DEC 70,833 52.50$ 51.00$ 0.05$ (1.45)$ (102,707.85)$

Coal Hedging Analysis January 15, 2010
Appendix DJan 06 to Jan 08
Page 3 of 8
CONTRACTDate of Info START DATE END DATE
Supplier R 1/1/2007 12/31/2010
DATA FOR FUTURES FROM UPI SHEET 1/3 1/13/2006
TOTAL CONTRACT SAVINGS (COST) 5,040,000.00$
Tons per month
Actual Contract Price $/ton
Future Price $/ton
Cost of future per ton
Contract Price Minus Future Price Price per ton
Total monthly savings or (cost) to ratepayers
DEC -$ -$ 2006 JAN -$ -$
FEB -$ -$ MAR -$ -$ APR -$ -$ MAY -$ -$ JUNE -$ -$ JULY -$ -$ AUG -$ -$ SEPT -$ -$ OCT -$ -$ NOV -$ -$ DEC -$ -$
2007 JAN 25,000 51.00$ 56.65$ 0.05$ 5.70$ 142,500.00$ FEB 25,000 51.00$ 56.65$ 0.05$ 5.70$ 142,500.00$
MAR 25,000 51.00$ 56.65$ 0.05$ 5.70$ 142,500.00$ APR 25,000 51.00$ 56.65$ 0.05$ 5.70$ 142,500.00$ MAY 25,000 51.00$ 56.65$ 0.05$ 5.70$ 142,500.00$ JUNE 25,000 51.00$ 56.65$ 0.05$ 5.70$ 142,500.00$ JULY 25,000 51.00$ 56.65$ 0.05$ 5.70$ 142,500.00$ AUG 25,000 51.00$ 56.65$ 0.05$ 5.70$ 142,500.00$ SEPT 25,000 51.00$ 56.65$ 0.05$ 5.70$ 142,500.00$ OCT 25,000 51.00$ 56.65$ 0.05$ 5.70$ 142,500.00$ NOV 25,000 51.00$ 56.65$ 0.05$ 5.70$ 142,500.00$ DEC 25,000 51.00$ 56.65$ 0.05$ 5.70$ 142,500.00$
2008 JAN 25,000 50.00$ 55.75$ 0.05$ 5.80$ 145,000.00$ FEB 25,000 50.00$ 55.75$ 0.05$ 5.80$ 145,000.00$
MAR 25,000 50.00$ 55.75$ 0.05$ 5.80$ 145,000.00$

Coal Hedging Analysis January 15, 2010
Appendix DJan 06 to Jan 08
Page 4 of 8
APR 25,000 50.00$ 55.75$ 0.05$ 5.80$ 145,000.00$ MAY 25,000 50.00$ 55.75$ 0.05$ 5.80$ 145,000.00$ JUNE 25,000 50.00$ 55.75$ 0.05$ 5.80$ 145,000.00$ JULY 25,000 50.00$ 55.75$ 0.05$ 5.80$ 145,000.00$ AUG 25,000 50.00$ 55.75$ 0.05$ 5.80$ 145,000.00$ SEPT 25,000 50.00$ 55.75$ 0.05$ 5.80$ 145,000.00$ OCT 25,000 50.00$ 55.75$ 0.05$ 5.80$ 145,000.00$ NOV 25,000 50.00$ 55.75$ 0.05$ 5.80$ 145,000.00$ DEC 25,000 50.00$ 55.75$ 0.05$ 5.80$ 145,000.00$
2009 JAN 25,000 50.00$ 55.25$ 0.05$ 5.30$ 132,500.00$ FEB 25,000 50.00$ 55.25$ 0.05$ 5.30$ 132,500.00$
MAR 25,000 50.00$ 55.25$ 0.05$ 5.30$ 132,500.00$ APR 25,000 50.00$ 55.25$ 0.05$ 5.30$ 132,500.00$ MAY 25,000 50.00$ 55.25$ 0.05$ 5.30$ 132,500.00$ JUNE 25,000 50.00$ 55.25$ 0.05$ 5.30$ 132,500.00$ JULY 25,000 50.00$ 55.25$ 0.05$ 5.30$ 132,500.00$ AUG 25,000 50.00$ 55.25$ 0.05$ 5.30$ 132,500.00$ SEPT 25,000 50.00$ 55.25$ 0.05$ 5.30$ 132,500.00$ OCT 25,000 50.00$ 55.25$ 0.05$ 5.30$ 132,500.00$ NOV 25,000 50.00$ 55.25$ 0.05$ 5.30$ 132,500.00$ DEC 25,000 50.00$ 55.25$ 0.05$ 5.30$ 132,500.00$

Coal Hedging Analysis January 15, 2010
Appendix DJan 06 to Jan 08
Page 5 of 8
CONTRACTDate of Info START DATE END DATE
Supplier G 1/1/2007 12/31/2009
DATA FOR FUTURES FROM UPI SHEET 1/3 11/1/2006
TOTAL CONTRACT SAVINGS (COST) (4,343,000.00)$
Tons per month
Actual Contract Price $/ton
Future Price $/ton
Cost of future per ton
Contract Price Minus Future Price Price per ton
Total monthly savings or (cost) to ratepayers
DEC -$ -$ 2006 JAN -$ -$
FEB -$ -$ MAR -$ -$ APR -$ -$ MAY -$ -$ JUNE -$ -$ JULY -$ -$ AUG -$ -$ SEPT -$ -$ OCT -$ -$ NOV -$ -$ DEC -$ -$
2007 JAN 50,000 47.31$ 45.65$ 0.05$ (1.61)$ (80,500.00)$ FEB 50,000 47.31$ 45.75$ 0.05$ (1.51)$ (75,500.00)$
MAR 50,000 47.31$ 45.75$ 0.05$ (1.51)$ (75,500.00)$ APR 50,000 47.31$ 46.25$ 0.05$ (1.01)$ (50,500.00)$ MAY 50,000 47.31$ 46.25$ 0.05$ (1.01)$ (50,500.00)$ JUNE 50,000 47.31$ 46.25$ 0.05$ (1.01)$ (50,500.00)$ JULY 50,000 47.31$ 46.75$ 0.05$ (0.51)$ (25,500.00)$ AUG 50,000 47.31$ 46.75$ 0.05$ (0.51)$ (25,500.00)$ SEPT 50,000 47.31$ 46.75$ 0.05$ (0.51)$ (25,500.00)$ OCT 50,000 47.31$ 47.00$ 0.05$ (0.26)$ (13,000.00)$ NOV 50,000 47.31$ 47.00$ 0.05$ (0.26)$ (13,000.00)$ DEC 50,000 47.31$ 47.00$ 0.05$ (0.26)$ (13,000.00)$
2008 JAN 50,000 51.31$ 47.50$ 0.05$ (3.76)$ (188,000.00)$ FEB 50,000 51.31$ 47.50$ 0.05$ (3.76)$ (188,000.00)$
MAR 50,000 51.31$ 47.50$ 0.05$ (3.76)$ (188,000.00)$
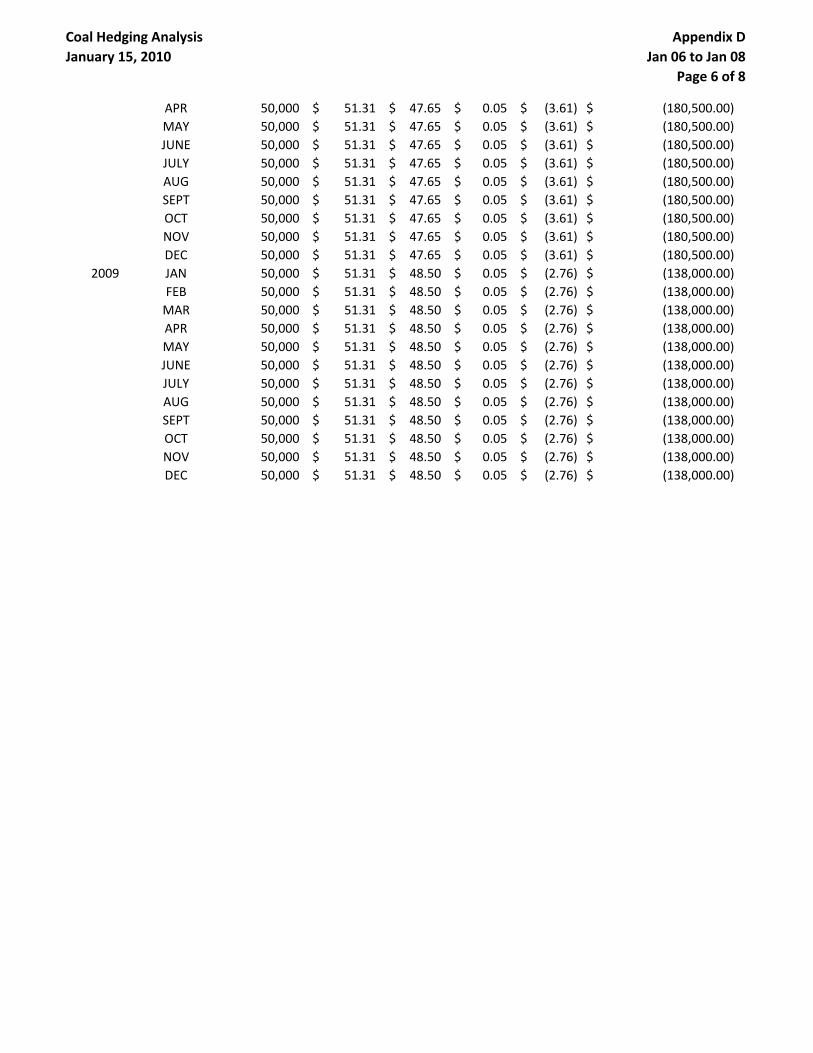
Coal Hedging Analysis January 15, 2010
Appendix DJan 06 to Jan 08
Page 6 of 8
APR 50,000 51.31$ 47.65$ 0.05$ (3.61)$ (180,500.00)$ MAY 50,000 51.31$ 47.65$ 0.05$ (3.61)$ (180,500.00)$ JUNE 50,000 51.31$ 47.65$ 0.05$ (3.61)$ (180,500.00)$ JULY 50,000 51.31$ 47.65$ 0.05$ (3.61)$ (180,500.00)$ AUG 50,000 51.31$ 47.65$ 0.05$ (3.61)$ (180,500.00)$ SEPT 50,000 51.31$ 47.65$ 0.05$ (3.61)$ (180,500.00)$ OCT 50,000 51.31$ 47.65$ 0.05$ (3.61)$ (180,500.00)$ NOV 50,000 51.31$ 47.65$ 0.05$ (3.61)$ (180,500.00)$ DEC 50,000 51.31$ 47.65$ 0.05$ (3.61)$ (180,500.00)$
2009 JAN 50,000 51.31$ 48.50$ 0.05$ (2.76)$ (138,000.00)$ FEB 50,000 51.31$ 48.50$ 0.05$ (2.76)$ (138,000.00)$
MAR 50,000 51.31$ 48.50$ 0.05$ (2.76)$ (138,000.00)$ APR 50,000 51.31$ 48.50$ 0.05$ (2.76)$ (138,000.00)$ MAY 50,000 51.31$ 48.50$ 0.05$ (2.76)$ (138,000.00)$ JUNE 50,000 51.31$ 48.50$ 0.05$ (2.76)$ (138,000.00)$ JULY 50,000 51.31$ 48.50$ 0.05$ (2.76)$ (138,000.00)$ AUG 50,000 51.31$ 48.50$ 0.05$ (2.76)$ (138,000.00)$ SEPT 50,000 51.31$ 48.50$ 0.05$ (2.76)$ (138,000.00)$ OCT 50,000 51.31$ 48.50$ 0.05$ (2.76)$ (138,000.00)$ NOV 50,000 51.31$ 48.50$ 0.05$ (2.76)$ (138,000.00)$ DEC 50,000 51.31$ 48.50$ 0.05$ (2.76)$ (138,000.00)$

Coal Hedging Analysis January 15, 2010
Appendix DJan 06 to Jan 08
Page 7 of 8
CONTRACTDate of Info
START DATE END DATE
Supplier S 1/1/2007 5/31/2009
DATA FOR FUTURES FROM UPI SHEE 9/7/2006
TOTAL CONTRACT SAVINGS (COST) 262,500.00$
Tons per month
Actual Contract Price $/ton
Future Price $/ton
Cost of future per ton
Contract Price Minus Future Price Price per ton
Total monthly savings or (cost) to ratepayers
DEC -$ -$ 2006 JAN -$ -$
FEB -$ -$ MAR -$ -$ APR -$ -$ MAY -$ -$ JUNE -$ -$ JULY -$ -$ AUG -$ -$ SEPT -$ -$ OCT -$ -$ NOV -$ -$ DEC -$ -$
2007 JAN 25,000 48.60$ 48.15$ 0.05$ (0.40)$ (10,000.00)$ FEB 25,000 48.60$ 48.15$ 0.05$ (0.40)$ (10,000.00)$
MAR 25,000 48.60$ 48.15$ 0.05$ (0.40)$ (10,000.00)$ APR 25,000 48.60$ 48.15$ 0.05$ (0.40)$ (10,000.00)$ MAY 25,000 48.60$ 48.15$ 0.05$ (0.40)$ (10,000.00)$ JUNE 25,000 48.60$ 48.15$ 0.05$ (0.40)$ (10,000.00)$ JULY 25,000 48.60$ 48.15$ 0.05$ (0.40)$ (10,000.00)$ AUG 25,000 48.60$ 48.15$ 0.05$ (0.40)$ (10,000.00)$ SEPT 25,000 48.60$ 48.15$ 0.05$ (0.40)$ (10,000.00)$ OCT 25,000 48.60$ 48.15$ 0.05$ (0.40)$ (10,000.00)$ NOV 25,000 48.60$ 48.15$ 0.05$ (0.40)$ (10,000.00)$ DEC 25,000 48.60$ 48.15$ 0.05$ (0.40)$ (10,000.00)$
2008 JAN 25,000 48.60$ 49.20$ 0.05$ 0.65$ 16,250.00$ FEB 25,000 48.60$ 49.20$ 0.05$ 0.65$ 16,250.00$
MAR 25,000 48.60$ 49.20$ 0.05$ 0.65$ 16,250.00$

Coal Hedging Analysis January 15, 2010
Appendix DJan 06 to Jan 08
Page 8 of 8
APR 25,000 48.60$ 49.20$ 0.05$ 0.65$ 16,250.00$ MAY 25,000 48.60$ 49.20$ 0.05$ 0.65$ 16,250.00$ JUNE 25,000 48.60$ 49.20$ 0.05$ 0.65$ 16,250.00$ JULY 25,000 48.60$ 49.20$ 0.05$ 0.65$ 16,250.00$ AUG 25,000 48.60$ 49.20$ 0.05$ 0.65$ 16,250.00$ SEPT 25,000 48.60$ 49.20$ 0.05$ 0.65$ 16,250.00$ OCT 25,000 48.60$ 49.20$ 0.05$ 0.65$ 16,250.00$ NOV 25,000 48.60$ 49.20$ 0.05$ 0.65$ 16,250.00$ DEC 25,000 48.60$ 49.20$ 0.05$ 0.65$ 16,250.00$
2009 JAN 25,000 48.60$ 50.05$ 0.05$ 1.50$ 37,500.00$ FEB 25,000 48.60$ 50.05$ 0.05$ 1.50$ 37,500.00$
MAR 25,000 48.60$ 50.05$ 0.05$ 1.50$ 37,500.00$ APR 25,000 48.60$ 50.05$ 0.05$ 1.50$ 37,500.00$ MAY 25,000 48.60$ 50.05$ 0.05$ 1.50$ 37,500.00$ JUNEJULYAUGSEPTOCTNOVDEC

Coal Hedging Analysis January 15, 2010
Appendix DJan 1 08
Page 1 of 6
CONTRACT WORK SHEET 1-Jan-08Assume contract was a future rather than a purchase contract- note that buying a future and buying a swap is basically mathematically similar
CONTRACT Date of InfoSTART DATE END DATE
Supplier A 1/1/2008 1/1/2008 12/31/011
DATA FOR FUTURES FROM UPI SHEET 1 11/2/2007 and 2/1/08 effective 3/1/08
TOTAL CONTRACT SAVINGS (COST) 20,159,955.40$
Tons per month
Actual Contract Price $/ton
Future Price $/ton
Cost of future per ton
Contract Price Minus Future Price Price per ton
Total monthly savings or (cost) to ratepayers
DEC -$ -$ 2008 JAN 100,000 64.50$ 54.00$ 0.05$ (10.45)$ (1,045,000.00)$
FEB 100,000 64.50$ 54.50$ 0.05$ (9.95)$ (995,000.00)$ MAR 100,000 64.50$ 77.00$ 0.05$ 12.55$ 1,255,000.00$ APR 100,000 64.50$ 77.00$ 0.05$ 12.55$ 1,255,000.00$ MAY 100,000 64.50$ 77.00$ 0.05$ 12.55$ 1,255,000.00$ JUNE 100,000 64.50$ 77.00$ 0.05$ 12.55$ 1,255,000.00$ JULY 100,000 64.50$ 75.00$ 0.05$ 10.55$ 1,055,000.00$ AUG 100,000 64.50$ 75.00$ 0.05$ 10.55$ 1,055,000.00$ SEPT 100,000 64.50$ 75.00$ 0.05$ 10.55$ 1,055,000.00$ OCT 100,000 64.50$ 74.00$ 0.05$ 9.55$ 955,000.00$ NOV 100,000 64.50$ 74.00$ 0.05$ 9.55$ 955,000.00$ DEC 100,000 64.50$ 74.00$ 0.05$ 9.55$ 955,000.00$
2009 JAN 83,333 64.50$ 71.25$ 0.05$ 6.80$ 566,664.40$ FEB 83,333 64.50$ 71.25$ 0.05$ 6.80$ 566,664.40$
MAR 83,333 64.50$ 71.25$ 0.05$ 6.80$ 566,664.40$ APR 83,333 64.50$ 71.25$ 0.05$ 6.80$ 566,664.40$ MAY 83,333 64.50$ 71.25$ 0.05$ 6.80$ 566,664.40$ JUNE 83,333 64.50$ 71.25$ 0.05$ 6.80$ 566,664.40$ JULY 83,333 64.50$ 71.25$ 0.05$ 6.80$ 566,664.40$ AUG 83,333 64.50$ 71.25$ 0.05$ 6.80$ 566,664.40$ SEPT 83,333 64.50$ 71.25$ 0.05$ 6.80$ 566,664.40$ OCT 83,333 64.50$ 71.25$ 0.05$ 6.80$ 566,664.40$ NOV 83,333 64.50$ 71.25$ 0.05$ 6.80$ 566,664.40$ DEC 83,333 64.50$ 71.25$ 0.05$ 6.80$ 566,664.40$
2010 JAN 83,333 64.50$ 68.25$ 0.05$ 3.80$ 316,665.40$ FEB 83,333 64.50$ 68.25$ 0.05$ 3.80$ 316,665.40$
MAR 83,333 64.50$ 68.25$ 0.05$ 3.80$ 316,665.40$ APR 83,333 64.50$ 68.25$ 0.05$ 3.80$ 316,665.40$ MAY 83,333 64.50$ 68.25$ 0.05$ 3.80$ 316,665.40$

Coal Hedging Analysis January 15, 2010
Appendix DJan 1 08
Page 2 of 6
JUNE 83,333 64.50$ 68.25$ 0.05$ 3.80$ 316,665.40$ JULY 83,333 64.50$ 68.25$ 0.05$ 3.80$ 316,665.40$ AUG 83,333 64.50$ 68.25$ 0.05$ 3.80$ 316,665.40$ SEPT 83,333 64.50$ 68.25$ 0.05$ 3.80$ 316,665.40$ OCT 83,333 64.50$ 68.25$ 0.05$ 3.80$ 316,665.40$ NOV 83,333 64.50$ 68.25$ 0.05$ 3.80$ 316,665.40$ DEC 83,333 64.50$ 68.25$ 0.05$ 3.80$ 316,665.40$
2011 JAN 83,333 64.50$ 65.00$ 0.05$ 0.55$ 45,833.15$ FEB 83,333 64.50$ 65.00$ 0.05$ 0.55$ 45,833.15$
MAR 83,333 64.50$ 65.00$ 0.05$ 0.55$ 45,833.15$ APR 83,333 64.50$ 65.00$ 0.05$ 0.55$ 45,833.15$ MAY 83,333 64.50$ 65.00$ 0.05$ 0.55$ 45,833.15$ JUNE 83,333 64.50$ 65.00$ 0.05$ 0.55$ 45,833.15$ JULY 83,333 64.50$ 65.00$ 0.05$ 0.55$ 45,833.15$ AUG 83,333 64.50$ 65.00$ 0.05$ 0.55$ 45,833.15$ SEPT 83,333 64.50$ 65.00$ 0.05$ 0.55$ 45,833.15$ OCT 83,333 64.50$ 65.00$ 0.05$ 0.55$ 45,833.15$ NOV 83,333 64.50$ 65.00$ 0.05$ 0.55$ 45,833.15$ DEC 83,333 64.50$ 65.00$ 0.05$ 0.55$ 45,833.15$

Coal Hedging Analysis January 15, 2010
Appendix DJan 1 08
Page 3 of 6
CONTRACT Date of Info START DATE END DATESupplier J 1/1/2008 1/1/2008 12/31/2008
DATA FOR FUTURES FROM UPI SHEET 1/3 2/12/2007
TOTAL CONTRACT SAVINGS (COST) (10,968,000.00)$
Tons per month
Actual Contract Price $/ton
Future Price $/ton
Cost of future per ton
Contract Price Minus Future Price Price per ton
Total monthly savings or (cost) to ratepayers
2008 JAN 100,000 50.00$ 40.81$ 0.05$ (9.14)$ (914,000.00)$ FEB 100,000 50.00$ 40.81$ 0.05$ (9.14)$ (914,000.00)$
MAR 100,000 50.00$ 40.81$ 0.05$ (9.14)$ (914,000.00)$ APR 100,000 50.00$ 40.81$ 0.05$ (9.14)$ (914,000.00)$ MAY 100,000 50.00$ 40.81$ 0.05$ (9.14)$ (914,000.00)$ JUNE 100,000 50.00$ 40.81$ 0.05$ (9.14)$ (914,000.00)$ JULY 100,000 50.00$ 40.81$ 0.05$ (9.14)$ (914,000.00)$ AUG 100,000 50.00$ 40.81$ 0.05$ (9.14)$ (914,000.00)$ SEPT 100,000 50.00$ 40.81$ 0.05$ (9.14)$ (914,000.00)$ OCT 100,000 50.00$ 40.81$ 0.05$ (9.14)$ (914,000.00)$ NOV 100,000 50.00$ 40.81$ 0.05$ (9.14)$ (914,000.00)$ DEC 100,000 50.00$ 40.81$ 0.05$ (9.14)$ (914,000.00)$
2009 JANFEB
MARAPRMAYJUNEJULYAUGSEPTOCTNOVDEC

Coal Hedging Analysis January 15, 2010
Appendix DJan 1 08
Page 4 of 6

Coal Hedging Analysis January 15, 2010
Appendix DJan 1 08
Page 5 of 6
CONTRACT Date of InfoSTART DATE END DATE
Supplier T 1/1/2008 1/1/2008 12/31/2001
DATA FOR FUTURES FROM UPI SHEET 1/ 11/2/2007
TOTAL CONTRACT SAVINGS (COST) 8,049,000.00$
Tons per month
Actual Contract Price $/ton
Future Price $/ton
Cost of future per ton
Contract Price Minus Future Price Price per ton
Total monthly savings or (cost) to ratepayers
2008 JAN 30,000 47.00$ 54.00$ 0.05$ 7.05$ 211,500.00$ FEB 30,000 47.00$ 54.50$ 0.05$ 7.55$ 226,500.00$
MAR 30,000 47.00$ 54.50$ 0.05$ 7.55$ 226,500.00$ APR 30,000 47.00$ 54.80$ 0.05$ 7.85$ 235,500.00$ MAY 30,000 47.00$ 54.80$ 0.05$ 7.85$ 235,500.00$ JUNE 30,000 47.00$ 54.80$ 0.05$ 7.85$ 235,500.00$ JULY 30,000 47.00$ 55.10$ 0.05$ 8.15$ 244,500.00$ AUG 30,000 47.00$ 55.10$ 0.05$ 8.15$ 244,500.00$ SEPT 30,000 47.00$ 55.10$ 0.05$ 8.15$ 244,500.00$ OCT 30,000 47.00$ 55.40$ 0.05$ 8.45$ 253,500.00$ NOV 30,000 47.00$ 55.40$ 0.05$ 8.45$ 253,500.00$ DEC 30,000 47.00$ 55.40$ 0.05$ 8.45$ 253,500.00$
2009 JAN 30,000 48.00$ 55.40$ 0.05$ 7.45$ 223,500.00$ FEB 30,000 48.00$ 55.40$ 0.05$ 7.45$ 223,500.00$
MAR 30,000 48.00$ 55.40$ 0.05$ 7.45$ 223,500.00$ APR 30,000 48.00$ 55.40$ 0.05$ 7.45$ 223,500.00$ MAY 30,000 48.00$ 55.40$ 0.05$ 7.45$ 223,500.00$ JUNE 30,000 48.00$ 55.40$ 0.05$ 7.45$ 223,500.00$ JULY 30,000 48.00$ 55.40$ 0.05$ 7.45$ 223,500.00$ AUG 30,000 48.00$ 55.40$ 0.05$ 7.45$ 223,500.00$ SEPT 30,000 48.00$ 55.40$ 0.05$ 7.45$ 223,500.00$ OCT 30,000 48.00$ 55.40$ 0.05$ 7.45$ 223,500.00$ NOV 30,000 48.00$ 55.40$ 0.05$ 7.45$ 223,500.00$ DEC 30,000 48.00$ 55.40$ 0.05$ 7.45$ 223,500.00$
2010 JAN 30,000 49.00$ 55.90$ 0.05$ 6.95$ 208,500.00$ FEB 30,000 49.00$ 55.90$ 0.05$ 6.95$ 208,500.00$
MAR 30,000 49.00$ 55.90$ 0.05$ 6.95$ 208,500.00$ APR 30,000 49.00$ 55.90$ 0.05$ 6.95$ 208,500.00$ MAY 30,000 49.00$ 55.90$ 0.05$ 6.95$ 208,500.00$

Coal Hedging Analysis January 15, 2010
Appendix DJan 1 08
Page 6 of 6
JUNE 30,000 49.00$ 55.90$ 0.05$ 6.95$ 208,500.00$ JULY 30,000 49.00$ 55.90$ 0.05$ 6.95$ 208,500.00$ AUG 30,000 49.00$ 55.90$ 0.05$ 6.95$ 208,500.00$ SEPT 30,000 49.00$ 55.90$ 0.05$ 6.95$ 208,500.00$ OCT 30,000 49.00$ 55.90$ 0.05$ 6.95$ 208,500.00$ NOV 30,000 49.00$ 55.90$ 0.05$ 6.95$ 208,500.00$ DEC 30,000 49.00$ 55.90$ 0.05$ 6.95$ 208,500.00$

Coal Hedging Analysis January 15, 2010
Appendix DJan 1, 09
Page 1 of 14
CONTRACT WORK SHEET 1-Jan-09Assume contract was a future rather than a purchase contract- note that buying a future and buying a swap is basically mathematically similar
CONTRACT Date of InfoSTART DATE END DATE
Supplier U 1/1/2009 1/1/2009 12/31/2011
DATA FOR FUTURES FROM UPI SHEET 9/23/2008
TOTAL CONTRACT SAVINGS (COST) 5,047,200.00$
Tons per month
Actual Contract Price $/ton
Future Price $/ton
Cost of future per ton
Contract Price Minus Future Price Price per ton
Total monthly savings or (cost) to ratepayers
2009 JAN 20,000 104.00$ 115.38$ 0.05$ 11.43$ 228,600.00$ FEB 20,000 104.00$ 115.38$ 0.05$ 11.43$ 228,600.00$
MAR 20,000 104.00$ 115.38$ 0.05$ 11.43$ 228,600.00$ APR 20,000 104.00$ 115.38$ 0.05$ 11.43$ 228,600.00$ MAY 20,000 104.00$ 115.38$ 0.05$ 11.43$ 228,600.00$ JUNE 20,000 104.00$ 115.38$ 0.05$ 11.43$ 228,600.00$ JULY 20,000 104.00$ 115.38$ 0.05$ 11.43$ 228,600.00$ AUG 20,000 104.00$ 115.38$ 0.05$ 11.43$ 228,600.00$ SEPT 20,000 104.00$ 115.38$ 0.05$ 11.43$ 228,600.00$ OCT 20,000 104.00$ 115.38$ 0.05$ 11.43$ 228,600.00$ NOV 20,000 104.00$ 115.38$ 0.05$ 11.43$ 228,600.00$ DEC 20,000 104.00$ 115.38$ 0.05$ 11.43$ 228,600.00$
2010 JAN 20,000 104.00$ 110.00$ 0.05$ 6.05$ 121,000.00$ FEB 20,000 104.00$ 110.00$ 0.05$ 6.05$ 121,000.00$
MAR 20,000 104.00$ 110.00$ 0.05$ 6.05$ 121,000.00$ APR 20,000 104.00$ 110.00$ 0.05$ 6.05$ 121,000.00$ MAY 20,000 104.00$ 110.00$ 0.05$ 6.05$ 121,000.00$ JUNE 20,000 104.00$ 110.00$ 0.05$ 6.05$ 121,000.00$ JULY 20,000 104.00$ 110.00$ 0.05$ 6.05$ 121,000.00$ AUG 20,000 104.00$ 110.00$ 0.05$ 6.05$ 121,000.00$ SEPT 20,000 104.00$ 110.00$ 0.05$ 6.05$ 121,000.00$ OCT 20,000 104.00$ 110.00$ 0.05$ 6.05$ 121,000.00$ NOV 20,000 104.00$ 110.00$ 0.05$ 6.05$ 121,000.00$ DEC 20,000 104.00$ 110.00$ 0.05$ 6.05$ 121,000.00$
2011 JAN 20,000 104.00$ 107.50$ 0.05$ 3.55$ 71,000.00$ FEB 20,000 104.00$ 107.50$ 0.05$ 3.55$ 71,000.00$
MAR 20,000 104.00$ 107.50$ 0.05$ 3.55$ 71,000.00$ APR 20,000 104.00$ 107.50$ 0.05$ 3.55$ 71,000.00$

Coal Hedging Analysis January 15, 2010
Appendix DJan 1, 09
Page 2 of 14
MAY 20,000 104.00$ 107.50$ 0.05$ 3.55$ 71,000.00$ JUNE 20,000 104.00$ 107.50$ 0.05$ 3.55$ 71,000.00$ JULY 20,000 104.00$ 107.50$ 0.05$ 3.55$ 71,000.00$ AUG 20,000 104.00$ 107.50$ 0.05$ 3.55$ 71,000.00$ SEPT 20,000 104.00$ 107.50$ 0.05$ 3.55$ 71,000.00$ OCT 20,000 104.00$ 107.50$ 0.05$ 3.55$ 71,000.00$ NOV 20,000 104.00$ 107.50$ 0.05$ 3.55$ 71,000.00$ DEC 20,000 104.00$ 107.50$ 0.05$ 3.55$ 71,000.00$

Coal Hedging Analysis January 15, 2010
Appendix DJan 1, 09
Page 3 of 14
CONTRACT Date of InfoSTART DATE END DATE
Supplier K 1/1/2009 1/1/2009 12/31/2011
DATA FOR FUTURES FROM UPI SHEET 1 7/1/2008
TOTAL CONTRACT SAVINGS (COST) 13,548,000.00$
Tons per month
Actual Contract Price $/ton
Future Price $/ton
Cost of future per ton
Contract Price Minus Future Price Price per ton
Total monthly savings or (cost) to ratepayers
2009 JAN 10,000 107.00$ 152.00$ 0.05$ 45.05$ 450,500.00$ FEB 10,000 107.00$ 152.00$ 0.05$ 45.05$ 450,500.00$
MAR 10,000 107.00$ 152.00$ 0.05$ 45.05$ 450,500.00$ APR 10,000 107.00$ 149.00$ 0.05$ 42.05$ 420,500.00$ MAY 10,000 107.00$ 149.00$ 0.05$ 42.05$ 420,500.00$ JUNE 10,000 107.00$ 149.00$ 0.05$ 42.05$ 420,500.00$ JULY 10,000 107.00$ 147.50$ 0.05$ 40.55$ 405,500.00$ AUG 10,000 107.00$ 147.50$ 0.05$ 40.55$ 405,500.00$ SEPT 10,000 107.00$ 147.50$ 0.05$ 40.55$ 405,500.00$ OCT 10,000 107.00$ 146.50$ 0.05$ 39.55$ 395,500.00$ NOV 10,000 107.00$ 146.50$ 0.05$ 39.55$ 395,500.00$ DEC 10,000 107.00$ 146.50$ 0.05$ 39.55$ 395,500.00$
2010 JAN 10,000 107.00$ 145.00$ 0.05$ 38.05$ 380,500.00$ FEB 10,000 107.00$ 145.00$ 0.05$ 38.05$ 380,500.00$
MAR 10,000 107.00$ 145.00$ 0.05$ 38.05$ 380,500.00$ APR 10,000 107.00$ 145.00$ 0.05$ 38.05$ 380,500.00$ MAY 10,000 107.00$ 145.00$ 0.05$ 38.05$ 380,500.00$ JUNE 10,000 107.00$ 145.00$ 0.05$ 38.05$ 380,500.00$ JULY 10,000 107.00$ 145.00$ 0.05$ 38.05$ 380,500.00$ AUG 10,000 107.00$ 145.00$ 0.05$ 38.05$ 380,500.00$ SEPT 10,000 107.00$ 145.00$ 0.05$ 38.05$ 380,500.00$ OCT 10,000 107.00$ 145.00$ 0.05$ 38.05$ 380,500.00$ NOV 10,000 107.00$ 145.00$ 0.05$ 38.05$ 380,500.00$ DEC 10,000 107.00$ 145.00$ 0.05$ 38.05$ 380,500.00$
2011 JAN 10,000 107.00$ 140.00$ 0.05$ 33.05$ 330,500.00$ FEB 10,000 107.00$ 140.00$ 0.05$ 33.05$ 330,500.00$
MAR 10,000 107.00$ 140.00$ 0.05$ 33.05$ 330,500.00$ APR 10,000 107.00$ 140.00$ 0.05$ 33.05$ 330,500.00$

Coal Hedging Analysis January 15, 2010
Appendix DJan 1, 09
Page 4 of 14
MAY 10,000 107.00$ 140.00$ 0.05$ 33.05$ 330,500.00$ JUNE 10,000 107.00$ 140.00$ 0.05$ 33.05$ 330,500.00$ JULY 10,000 107.00$ 140.00$ 0.05$ 33.05$ 330,500.00$ AUG 10,000 107.00$ 140.00$ 0.05$ 33.05$ 330,500.00$ SEPT 10,000 107.00$ 140.00$ 0.05$ 33.05$ 330,500.00$ OCT 10,000 107.00$ 140.00$ 0.05$ 33.05$ 330,500.00$ NOV 10,000 107.00$ 140.00$ 0.05$ 33.05$ 330,500.00$ DEC 10,000 107.00$ 140.00$ 0.05$ 33.05$ 330,500.00$

Coal Hedging Analysis January 15, 2010
Appendix DJan 1, 09
Page 5 of 14
CONTRACT Date of InfoSTART DATE END DATE
Supplier K 1/1/2009 1/1/2009 12/31/2011
DATA FOR FUTURES FROM UPI SHEET 1 6/18/2008
TOTAL CONTRACT SAVINGS (COST) 7,878,000.00$
Tons per month
Actual Contract Price $/ton
Future Price $/ton
Cost of future per ton
Contract Price Minus Future Price Price per ton
Total monthly savings or (cost) to ratepayers
2009 JAN 10,000 105.00$ 132.50$ 0.05$ 27.55$ 275,500.00$ FEB 10,000 105.00$ 132.50$ 0.05$ 27.55$ 275,500.00$
MAR 10,000 105.00$ 132.50$ 0.05$ 27.55$ 275,500.00$ APR 10,000 105.00$ 130.50$ 0.05$ 25.55$ 255,500.00$ MAY 10,000 105.00$ 130.50$ 0.05$ 25.55$ 255,500.00$ JUNE 10,000 105.00$ 130.50$ 0.05$ 25.55$ 255,500.00$ JULY 10,000 105.00$ 129.00$ 0.05$ 24.05$ 240,500.00$ AUG 10,000 105.00$ 129.00$ 0.05$ 24.05$ 240,500.00$ SEPT 10,000 105.00$ 129.00$ 0.05$ 24.05$ 240,500.00$ OCT 10,000 105.00$ 130.00$ 0.05$ 25.05$ 250,500.00$ NOV 10,000 105.00$ 130.00$ 0.05$ 25.05$ 250,500.00$ DEC 10,000 105.00$ 130.00$ 0.05$ 25.05$ 250,500.00$
2010 JAN 10,000 105.00$ 127.00$ 0.05$ 22.05$ 220,500.00$ FEB 10,000 105.00$ 127.00$ 0.05$ 22.05$ 220,500.00$
MAR 10,000 105.00$ 127.00$ 0.05$ 22.05$ 220,500.00$ APR 10,000 105.00$ 127.00$ 0.05$ 22.05$ 220,500.00$ MAY 10,000 105.00$ 127.00$ 0.05$ 22.05$ 220,500.00$ JUNE 10,000 105.00$ 127.00$ 0.05$ 22.05$ 220,500.00$ JULY 10,000 105.00$ 127.00$ 0.05$ 22.05$ 220,500.00$ AUG 10,000 105.00$ 127.00$ 0.05$ 22.05$ 220,500.00$ SEPT 10,000 105.00$ 127.00$ 0.05$ 22.05$ 220,500.00$ OCT 10,000 105.00$ 127.00$ 0.05$ 22.05$ 220,500.00$ NOV 10,000 105.00$ 127.00$ 0.05$ 22.05$ 220,500.00$ DEC 10,000 105.00$ 127.00$ 0.05$ 22.05$ 220,500.00$
2011 JAN 10,000 105.00$ 123.00$ 0.05$ 18.05$ 180,500.00$ FEB 10,000 105.00$ 123.00$ 0.05$ 18.05$ 180,500.00$
MAR 10,000 105.00$ 123.00$ 0.05$ 18.05$ 180,500.00$ APR 10,000 105.00$ 123.00$ 0.05$ 18.05$ 180,500.00$

Coal Hedging Analysis January 15, 2010
Appendix DJan 1, 09
Page 6 of 14
MAY 10,000 105.00$ 123.00$ 0.05$ 18.05$ 180,500.00$ JUNE 10,000 105.00$ 123.00$ 0.05$ 18.05$ 180,500.00$ JULY 10,000 105.00$ 123.00$ 0.05$ 18.05$ 180,500.00$ AUG 10,000 105.00$ 123.00$ 0.05$ 18.05$ 180,500.00$ SEPT 10,000 105.00$ 123.00$ 0.05$ 18.05$ 180,500.00$ OCT 10,000 105.00$ 123.00$ 0.05$ 18.05$ 180,500.00$ NOV 10,000 105.00$ 123.00$ 0.05$ 18.05$ 180,500.00$ DEC 10,000 105.00$ 123.00$ 0.05$ 18.05$ 180,500.00$

Coal Hedging Analysis January 15, 2010
Appendix DJan 1, 09
Page 7 of 14
CONTRACTDate of Info
START DATE END DATE
Supplier V 1/1/2009 1/1/2009 12/31/2011
DATA FOR FUTURES FROM UPI SHE 10/1/2008
TOTAL CONTRACT SAVINGS (COST) (5,299,875.00)$
Tons per month
Actual Contract Price $/ton
Future Price $/ton
Cost of future per ton
Contract Price Minus Future Price Price per ton
Total monthly savings or (cost) to ratepayers
2009 JAN 52,500 112.50$ 127.00$ 0.05$ 14.55$ 763,875.00$ FEB 52,500 112.50$ 127.00$ 0.05$ 14.55$ 763,875.00$
MAR 52,500 112.50$ 127.00$ 0.05$ 14.55$ 763,875.00$ APR 52,500 112.50$ 119.00$ 0.05$ 6.55$ 343,875.00$ MAY 52,500 112.50$ 119.00$ 0.05$ 6.55$ 343,875.00$ JUNE 52,500 112.50$ 119.00$ 0.05$ 6.55$ 343,875.00$ JULY 52,500 112.50$ 114.00$ 0.05$ 1.55$ 81,375.00$ AUG 52,500 112.50$ 114.00$ 0.05$ 1.55$ 81,375.00$ SEPT 52,500 112.50$ 114.00$ 0.05$ 1.55$ 81,375.00$ OCT 52,500 112.50$ 109.00$ 0.05$ (3.45)$ (181,125.00)$ NOV 52,500 112.50$ 109.00$ 0.05$ (3.45)$ (181,125.00)$ DEC 52,500 112.50$ 109.00$ 0.05$ (3.45)$ (181,125.00)$
2010 JAN 52,500 112.50$ 107.50$ 0.05$ (4.95)$ (259,875.00)$ FEB 52,500 112.50$ 107.50$ 0.05$ (4.95)$ (259,875.00)$
MAR 52,500 112.50$ 107.50$ 0.05$ (4.95)$ (259,875.00)$ APR 52,500 112.50$ 106.75$ 0.05$ (5.70)$ (299,250.00)$ MAY 52,500 112.50$ 106.75$ 0.05$ (5.70)$ (299,250.00)$ JUNE 52,500 112.50$ 106.75$ 0.05$ (5.70)$ (299,250.00)$ JULY 52,500 112.50$ 106.75$ 0.05$ (5.70)$ (299,250.00)$ AUG 52,500 112.50$ 106.75$ 0.05$ (5.70)$ (299,250.00)$ SEPT 52,500 112.50$ 106.75$ 0.05$ (5.70)$ (299,250.00)$ OCT 52,500 112.50$ 106.75$ 0.05$ (5.70)$ (299,250.00)$ NOV 52,500 112.50$ 106.75$ 0.05$ (5.70)$ (299,250.00)$ DEC 52,500 112.50$ 106.75$ 0.05$ (5.70)$ (299,250.00)$
2011 JAN 52,500 112.50$ 104.75$ 0.05$ (7.70)$ (404,250.00)$ FEB 52,500 112.50$ 104.75$ 0.05$ (7.70)$ (404,250.00)$
MAR 52,500 112.50$ 104.75$ 0.05$ (7.70)$ (404,250.00)$ APR 52,500 112.50$ 104.75$ 0.05$ (7.70)$ (404,250.00)$

Coal Hedging Analysis January 15, 2010
Appendix DJan 1, 09
Page 8 of 14
MAY 52,500 112.50$ 104.75$ 0.05$ (7.70)$ (404,250.00)$ JUNE 52,500 112.50$ 104.75$ 0.05$ (7.70)$ (404,250.00)$ JULY 52,500 112.50$ 104.75$ 0.05$ (7.70)$ (404,250.00)$ AUG 52,500 112.50$ 104.75$ 0.05$ (7.70)$ (404,250.00)$ SEPT 52,500 112.50$ 104.75$ 0.05$ (7.70)$ (404,250.00)$ OCT 52,500 112.50$ 104.75$ 0.05$ (7.70)$ (404,250.00)$ NOV 52,500 112.50$ 104.75$ 0.05$ (7.70)$ (404,250.00)$ DEC 52,500 112.50$ 104.75$ 0.05$ (7.70)$ (404,250.00)$

Coal Hedging Analysis January 15, 2010
Appendix DJan 1, 09
Page 9 of 14
CONTRACTDate of Info
START DATE END DATE
Supplier W 1/1/2009 1/1/2009 12/31/2011
DATA FOR FUTURES FROM UPI SHE 9/23/2008
TOTAL CONTRACT SAVINGS (COST) (1,791,000.00)$
Tons per month
Actual Contract Price $/ton
Future Price $/ton
Cost of future per ton
Contract Price Minus Future Price Price per ton
Total monthly savings or (cost) to ratepayers
2009 JAN 25,000 113.00$ 115.38$ 0.05$ 2.43$ 60,750.00$ FEB 25,000 113.00$ 115.38$ 0.05$ 2.43$ 60,750.00$
MAR 25,000 113.00$ 115.38$ 0.05$ 2.43$ 60,750.00$ APR 25,000 113.00$ 115.38$ 0.05$ 2.43$ 60,750.00$ MAY 25,000 113.00$ 115.38$ 0.05$ 2.43$ 60,750.00$ JUNE 25,000 113.00$ 115.38$ 0.05$ 2.43$ 60,750.00$ JULY 25,000 113.00$ 115.38$ 0.05$ 2.43$ 60,750.00$ AUG 25,000 113.00$ 115.38$ 0.05$ 2.43$ 60,750.00$ SEPT 25,000 113.00$ 115.38$ 0.05$ 2.43$ 60,750.00$ OCT 25,000 113.00$ 115.38$ 0.05$ 2.43$ 60,750.00$ NOV 25,000 113.00$ 115.38$ 0.05$ 2.43$ 60,750.00$ DEC 25,000 113.00$ 115.38$ 0.05$ 2.43$ 60,750.00$
2010 JAN 25,000 113.00$ 110.00$ 0.05$ (2.95)$ (73,750.00)$ FEB 25,000 113.00$ 110.00$ 0.05$ (2.95)$ (73,750.00)$
MAR 25,000 113.00$ 110.00$ 0.05$ (2.95)$ (73,750.00)$ APR 25,000 113.00$ 110.00$ 0.05$ (2.95)$ (73,750.00)$ MAY 25,000 113.00$ 110.00$ 0.05$ (2.95)$ (73,750.00)$ JUNE 25,000 113.00$ 110.00$ 0.05$ (2.95)$ (73,750.00)$ JULY 25,000 113.00$ 110.00$ 0.05$ (2.95)$ (73,750.00)$ AUG 25,000 113.00$ 110.00$ 0.05$ (2.95)$ (73,750.00)$ SEPT 25,000 113.00$ 110.00$ 0.05$ (2.95)$ (73,750.00)$ OCT 25,000 113.00$ 110.00$ 0.05$ (2.95)$ (73,750.00)$ NOV 25,000 113.00$ 110.00$ 0.05$ (2.95)$ (73,750.00)$ DEC 25,000 113.00$ 110.00$ 0.05$ (2.95)$ (73,750.00)$
2011 JAN 25,000 113.00$ 107.50$ 0.05$ (5.45)$ (136,250.00)$ FEB 25,000 113.00$ 107.50$ 0.05$ (5.45)$ (136,250.00)$
MAR 25,000 113.00$ 107.50$ 0.05$ (5.45)$ (136,250.00)$ APR 25,000 113.00$ 107.50$ 0.05$ (5.45)$ (136,250.00)$

Coal Hedging Analysis January 15, 2010
Appendix DJan 1, 09
Page 10 of 14
MAY 25,000 113.00$ 107.50$ 0.05$ (5.45)$ (136,250.00)$ JUNE 25,000 113.00$ 107.50$ 0.05$ (5.45)$ (136,250.00)$ JULY 25,000 113.00$ 107.50$ 0.05$ (5.45)$ (136,250.00)$ AUG 25,000 113.00$ 107.50$ 0.05$ (5.45)$ (136,250.00)$ SEPT 25,000 113.00$ 107.50$ 0.05$ (5.45)$ (136,250.00)$ OCT 25,000 113.00$ 107.50$ 0.05$ (5.45)$ (136,250.00)$ NOV 25,000 113.00$ 107.50$ 0.05$ (5.45)$ (136,250.00)$ DEC 25,000 113.00$ 107.50$ 0.05$ (5.45)$ (136,250.00)$

Coal Hedging Analysis January 15, 2010
Appendix DJan 1, 09
Page 11 of 14
CONTRACTDate of Info
START DATE END DATE
Supplier Q 1/1/2009 1/1/2009 12/31/2010
DATA FOR FUTURES FROM UPI SHE 2/1/2008
TOTAL CONTRACT SAVINGS (COST) 4,759,977.60$
Tons per month
Actual Contract Price $/ton
Future Price $/ton
Cost of future per ton
Contract Price Minus Future Price Price per ton
Total monthly savings or (cost) to ratepayers
2009 JAN 70,833 67.00$ 71.25$ 0.05$ 4.30$ 304,581.90$ FEB 70,833 67.00$ 71.25$ 0.05$ 4.30$ 304,581.90$
MAR 70,833 67.00$ 71.25$ 0.05$ 4.30$ 304,581.90$ APR 70,833 67.00$ 71.25$ 0.05$ 4.30$ 304,581.90$ MAY 70,833 67.00$ 71.25$ 0.05$ 4.30$ 304,581.90$ JUNE 70,833 67.00$ 71.25$ 0.05$ 4.30$ 304,581.90$ JULY 70,833 67.00$ 71.25$ 0.05$ 4.30$ 304,581.90$ AUG 70,833 67.00$ 71.25$ 0.05$ 4.30$ 304,581.90$ SEPT 70,833 67.00$ 71.25$ 0.05$ 4.30$ 304,581.90$ OCT 70,833 67.00$ 71.25$ 0.05$ 4.30$ 304,581.90$ NOV 70,833 67.00$ 71.25$ 0.05$ 4.30$ 304,581.90$ DEC 70,833 67.00$ 71.25$ 0.05$ 4.30$ 304,581.90$
2010 JAN 70,833 67.00$ 68.25$ 0.05$ 1.30$ 92,082.90$ FEB 70,833 67.00$ 68.25$ 0.05$ 1.30$ 92,082.90$
MAR 70,833 67.00$ 68.25$ 0.05$ 1.30$ 92,082.90$ APR 70,833 67.00$ 68.25$ 0.05$ 1.30$ 92,082.90$ MAY 70,833 67.00$ 68.25$ 0.05$ 1.30$ 92,082.90$ JUNE 70,833 67.00$ 68.25$ 0.05$ 1.30$ 92,082.90$ JULY 70,833 67.00$ 68.25$ 0.05$ 1.30$ 92,082.90$ AUG 70,833 67.00$ 68.25$ 0.05$ 1.30$ 92,082.90$ SEPT 70,833 67.00$ 68.25$ 0.05$ 1.30$ 92,082.90$ OCT 70,833 67.00$ 68.25$ 0.05$ 1.30$ 92,082.90$ NOV 70,833 67.00$ 68.25$ 0.05$ 1.30$ 92,082.90$ DEC 70,833 67.00$ 68.25$ 0.05$ 1.30$ 92,082.90$

Coal Hedging Analysis January 15, 2010
Appendix DJan 1, 09
Page 12 of 14

Coal Hedging Analysis January 15, 2010
Appendix DJan 1, 09
Page 13 of 14
CONTRACTDate of Info
START DATE END DATE
Supplier X 1/1/2009 6/1/2008 5/31/2011
DATA FOR FUTURES FROM UPI SHE 3/3/2008
TOTAL CONTRACT SAVINGS (COST) 26,287,200.00$
Tons per month
Actual Contract Price $/ton
Future Price $/ton
Cost of future per ton
Contract Price Minus Future Price Price per ton
Total monthly savings or (cost) to ratepayers
2008 JANFEB
MARAPRMAYJUNE 54,000 69.50$ 89.00$ 0.05$ 19.55$ 1,055,700.00$ JULY 54,000 69.50$ 90.00$ 0.05$ 20.55$ 1,109,700.00$ AUG 54,000 69.50$ 90.00$ 0.05$ 20.55$ 1,109,700.00$ SEPT 54,000 69.50$ 90.00$ 0.05$ 20.55$ 1,109,700.00$ OCT 54,000 69.50$ 90.00$ 0.05$ 20.55$ 1,109,700.00$ NOV 54,000 69.50$ 90.00$ 0.05$ 20.55$ 1,109,700.00$ DEC 54,000 69.50$ 90.00$ 0.05$ 20.55$ 1,109,700.00$
2009 JAN 54,000 69.50$ 86.00$ 0.05$ 16.55$ 893,700.00$ FEB 54,000 69.50$ 86.00$ 0.05$ 16.55$ 893,700.00$
MAR 54,000 69.50$ 86.00$ 0.05$ 16.55$ 893,700.00$ APR 54,000 69.50$ 86.00$ 0.05$ 16.55$ 893,700.00$ MAY 54,000 69.50$ 86.00$ 0.05$ 16.55$ 893,700.00$ JUNE 54,000 69.50$ 86.00$ 0.05$ 16.55$ 893,700.00$ JULY 54,000 69.50$ 86.00$ 0.05$ 16.55$ 893,700.00$ AUG 54,000 69.50$ 86.00$ 0.05$ 16.55$ 893,700.00$ SEPT 54,000 69.50$ 86.00$ 0.05$ 16.55$ 893,700.00$ OCT 54,000 69.50$ 86.00$ 0.05$ 16.55$ 893,700.00$ NOV 54,000 69.50$ 86.00$ 0.05$ 16.55$ 893,700.00$ DEC 54,000 69.50$ 86.00$ 0.05$ 16.55$ 893,700.00$
2010 JAN 54,000 69.50$ 78.00$ 0.05$ 8.55$ 461,700.00$ FEB 54,000 69.50$ 78.00$ 0.05$ 8.55$ 461,700.00$
MAR 54,000 69.50$ 78.00$ 0.05$ 8.55$ 461,700.00$ APR 54,000 69.50$ 78.00$ 0.05$ 8.55$ 461,700.00$

Coal Hedging Analysis January 15, 2010
Appendix DJan 1, 09
Page 14 of 14
MAY 54,000 69.50$ 78.00$ 0.05$ 8.55$ 461,700.00$ JUNE 54,000 69.50$ 78.00$ 0.05$ 8.55$ 461,700.00$ JULY 54,000 69.50$ 78.00$ 0.05$ 8.55$ 461,700.00$ AUG 54,000 69.50$ 78.00$ 0.05$ 8.55$ 461,700.00$ SEPT 54,000 69.50$ 78.00$ 0.05$ 8.55$ 461,700.00$ OCT 54,000 69.50$ 78.00$ 0.05$ 8.55$ 461,700.00$ NOV 54,000 69.50$ 78.00$ 0.05$ 8.55$ 461,700.00$ DEC 54,000 69.50$ 78.00$ 0.05$ 8.55$ 461,700.00$
2011 JAN 54,000 69.50$ 78.00$ 0.05$ 8.55$ 461,700.00$ FEB 54,000 69.50$ 78.00$ 0.05$ 8.55$ 461,700.00$
MAR 54,000 69.50$ 78.00$ 0.05$ 8.55$ 461,700.00$ APR 54,000 69.50$ 78.00$ 0.05$ 8.55$ 461,700.00$ MAY 54,000 69.50$ 78.00$ 0.05$ 8.55$ 461,700.00$ JUNEJULYAUGSEPTOCTNOVDEC
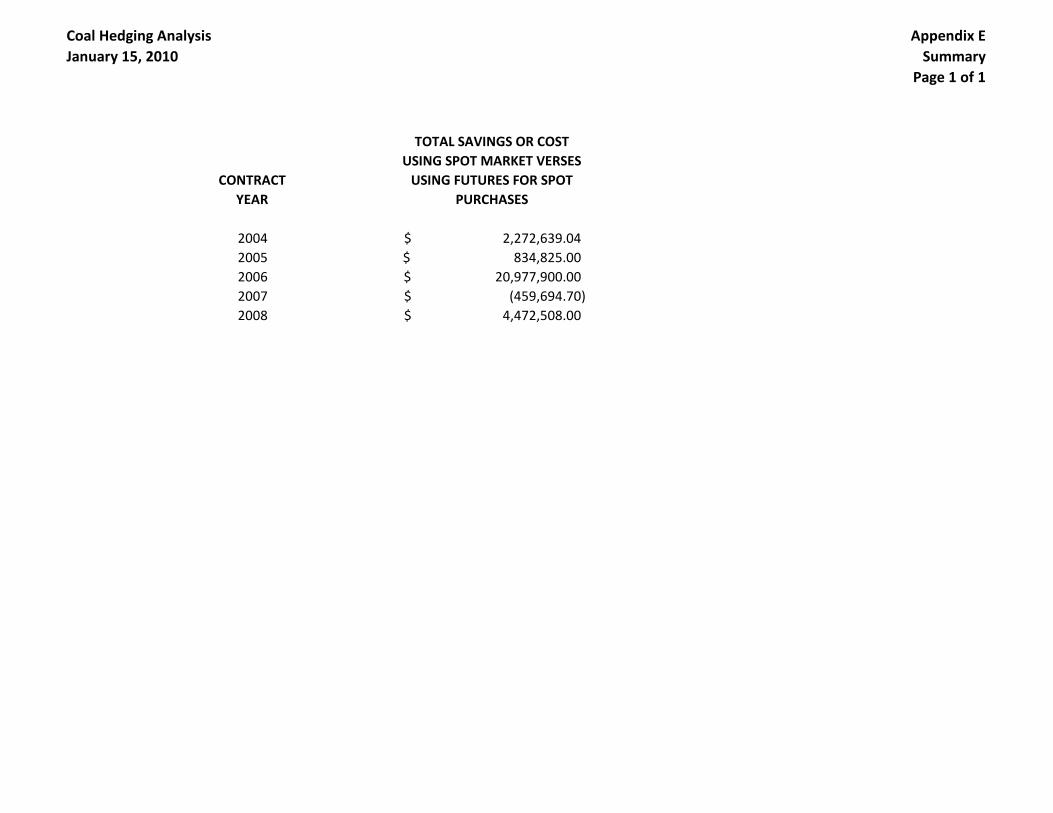
Coal Hedging AnalysisJanuary 15, 2010
Appendix ESummary
Page 1 of 1
CONTRACT YEAR
TOTAL SAVINGS OR COST USING SPOT MARKET VERSES
USING FUTURES FOR SPOT PURCHASES
2004 2,272,639.04$ 2005 834,825.00$ 2006 20,977,900.00$ 2007 (459,694.70)$ 2008 4,472,508.00$

Coal Hedging AnalysisJanuary 15, 2010
Appendix E2004
Page 1 of 4
South Carolina Electric & Gas CompanySpot Coal Purchases
2004
Delivery Tonnage Per MonthBid Supplier Coal Month(s) Jan Feb March April May June July Aug Sept Oct Nov Dec
Jan-04 Supplier A $37.00 Jan-04 10,000Jan-04 Supplier B $38.00 Jan-04 20,000Feb-04 Supplier A $36.00 Feb-04 10,000Feb-04 Supplier A $41.00 Mar-04 10,000 0 0 0Jan-04 Supplier C $39.75 Feb/March 25,000 25,000 0 0 0Feb-04 Supplier D $49.50 March 20,000 0 0 0Mar-04 Supplier E $50.00 March 20,000 0 0 0Jan-04 Supplier F $33.00 March 20,000 0 0 0Mar-04 Supplier G $54.00 March 10,000 0 0 0Mar-04 Supplier H $54.00 pril thru Dec 04 11,000 11,000 11,000 11,000 11,000 11,000 11,000 11,000 11,000Apr-04 Supplier E $53.00 May 50,000 0 0Apr-04 Supplier I $52.05 April 10,000 0 0Apr-04 Supplier J $48.00 April 1,177 0 0May-04 Supplier K $52.00 May 9,000 0 0May-04 Supplier L $45.50 May, June 25,000 25,000 0 0May-04 Supplier M $46.00 May 10,000 0 0May-04 Supplier G $53.50 June 10,000 0 0
Jun-04 Supplier E $53.00 July,August 20,000 0Jul-04 Supplier A $48.50 August 10,000 0Jul-04 Supplier N $36.00 August 10,000 0
Aug-04 Supplier M $37.50 August 22,000 0Aug-04 Supplier M $30.00 August 6,000 0Aug-04 Supplier M $52.00 August 10,000 0Aug-04 Supplier O $54.50 August 9,000 0Aug-04 Supplier P $55.00 September 20,000 0Aug-04 Supplier D $50.50 September 10,000 0

Coal Hedging AnalysisJanuary 15, 2010
Appendix E2004
Page 2 of 4
Sep-04 Supplier L $50.00 September 10,000 0
Sep-04 Supplier Q $53.00 October 10,000Nov-04 Supplier G $54.00 November 11,820 11,280Nov-04 Supplier R $56.00 November 10,000Nov-04 Supplier S $73.00 November 23,000
Dec 04 Supplier T $55.00 December 10,000Dec-04 Supplier U $70.87 December 50,000

Coal Hedging AnalysisJanuary 15, 2010
Appendix E2004
Page 3 of 4
Bid Supplier
Jan-04 Supplier AJan-04 Supplier BFeb-04 Supplier AFeb-04 Supplier AJan-04 Supplier CFeb-04 Supplier DMar-04 Supplier EJan-04 Supplier FMar-04 Supplier GMar-04 Supplier HApr-04 Supplier EApr-04 Supplier IApr-04 Supplier JMay-04 Supplier KMay-04 Supplier LMay-04 Supplier MMay-04 Supplier G
Jun-04 Supplier EJul-04 Supplier AJul-04 Supplier N
Aug-04 Supplier MAug-04 Supplier MAug-04 Supplier MAug-04 Supplier OAug-04 Supplier PAug-04 Supplier D
Jan Feb Mar April May June July Aug Sept Oct Nov Dec
38.10$ -$ -$ -$ -$ -$ -$ -$ -$ -$ -$ -$ 11,000.00$ 38.10$ 2,000.00$
44.88$ 88,800.00$ 44.88$ 38,800.00$
38.10$ 38.20$ (80,000.00)$ 44.88$ (92,400.00)$ 52.75$ 55,000.00$ 38.20$ 104,000.00$ 52.75$ (12,500.00)$
52.75$ 53.00$ 53.00$ 55.25$ 55.25$ 55.25$ 55.25$ 55.25$ 55.25$ 46,750.00$ 54.75$ 87,500.00$
54.75$ 27,000.00$ 54.75$ 7,943.74$
54.00$ 18,000.00$ 54.00$ 54.00$ 425,000.00$ 54.00$ 80,000.00$
54.00$ 5,000.00$ 57.00$ 57.50$ 90,000.00$
57.00$ 85,000.00$ 57.00$ 210,000.00$ 59.75$ 489,500.00$ 59.75$ 178,500.00$ 59.75$ 77,500.00$ 59.75$ 47,250.00$
59.75$ 95,000.00$ 59.75$ 92,500.00$
Futures Price from UPI Futures Price Sheet Savings or Costs

Coal Hedging AnalysisJanuary 15, 2010
Appendix E2004
Page 4 of 4
Sep-04 Supplier LSep-04 Supplier QNov-04 Supplier GNov-04 Supplier RNov-04 Supplier S
Dec 04 Supplier TDec-04 Supplier U
63.75$ 137,500.00$ 63.75$ 107,500.00$
64.00$ 64.00$ 230,995.30$ 64.00$ 80,000.00$ 64.00$ (207,000.00)$
64.00$ 90,000.00$ 64.00$ (343,500.00)$
TOTAL SAVINGS OR COSTS 2,272,639$

Coal Hedging AnalysisJanuary 15, 2010
Appendix E2005
Page 1 of 2
South Carolina Electric & Gas CompanySpot Coal Purchases
2005
Delivery Tonnage Per MonthBid Supplier Coal Month(s) Jan Feb March April May June July Aug Sept Oct Nov Dec
Jan-05 Supplier A $53.50 Jan-05 20,000Jan-05 Supplier B $55.00 Feb 05 20,000Feb-05 Supplier B $54.00 Feb 05 20,000Jan-05 Supplier A $54.00 Feb-June 05 10,000 10,000 10,000 10,000 10,000Feb-05 Supplier E $54.25 Mar 05 30,000Feb-05 Supplier V $54.87 Feb 05 10,000Mar-05 Supplier B $56.00 Mar 05 10,000Mar-05 Supplier B $56.00 Mar 05 10,000Mar-05 Supplier B $56.00 Mar 05 10,000Jun-05 Supplier T $54.00 June 05 20,000Jun-05 Supplier I $56.00 June 05 20,000 10,000Jun-05 Supplier W $54.55 June 05 10,000May-27 Supplier X $52.00 July 05 10,000Jul-05 Supplier Y $54.00 July-Sept 2,000 20,000 20,000
Aug-05 Supplier Z $47.00 August 800Aug-05 Supplier Z $67.25 August 6,000Oct-05 Supplier A $55.00 Nov-05 thru Jan06 18,000 18,000Oct-05 Supplier E $46.00 October 1,700Nov-05 Supplier O $39.00 Dec 05 / Jan 06 9,000

Coal Hedging AnalysisJanuary 15, 2010
Appendix E2005
Page 2 of 2
South C
Bid Supplier
Jan-05 Supplier AJan-05 Supplier BFeb-05 Supplier BJan-05 Supplier AFeb-05 Supplier EFeb-05 Supplier VMar-05 Supplier BMar-05 Supplier BMar-05 Supplier BJun-05 Supplier TJun-05 Supplier IJun-05 Supplier WMay-27 Supplier XJul-05 Supplier Y
Aug-05 Supplier ZAug-05 Supplier ZOct-05 Supplier AOct-05 Supplier ENov-05 Supplier O
Jan Feb Mar April May June July Aug Sept Oct Nov Dec
56.00$ 50,000.00$
56.00$ 20,000.00$
56.00$ 40,000.00$
56.00$ 56.50$ 57.50$ 57.50$ 57.50$ 150,000.00$
56.50$ 67,500.00$
56.50$ 16,300.00$
59.75$ 37,500.00$
59.75$ 37,500.00$
59.75$ 37,500.00$
56.50$ 50,000.00$
56.50$ 56.50$ 15,000.00$
56.50$ 19,500.00$
63.50$ 115,000.00$
54.00$ 54.00$ 54.00$ -$
55.75$ 7,000.00$
55.75$ (69,000.00)$
56.75$ 56.75$ 63,000.00$
56.75$ 18,275.00$
56.75$ 159,750.00$
TOTAL SAVINGS OR (COSTS) 834,825.00$
Savings or CostsFutures Price from UPI Futures Price Sheet

Coal Hedging AnalysisJanuary 15, 2010
Appendix E2006
Page 1 of 2
South Carolina Electric & Gas CompanySpot Coal Purchases
2006
Bid Supplier Coal Jan Feb March April May June July Aug Sept Oct Nov Dec
Nov-05 Supplier O $39.00 9,000Oct-05 Supplier A $55.00 9,000Jan-06 Supplier E $55.00 20,000 20,000 20,000 20,000 20,000 20,000
Jan-06 Supplier F $29.00 10,000 10,000 10,000 10,000 10,000 10,000
Feb-06 Supplier AA $40.65 20,000Feb-06 Supplier F $43.75 7,500Feb-06 Supplier BB $40.00 100Apr-06 Supplier AA $42.75 10,000 10,000Apr-06 Supplier F $28.00 10,000 10,000 10,000 10,000Apr-06 Supplier F $51.00 10,000 10,000Jun-06 Supplier CC $49.90 10,000Jun-06 Supplier DD $51.50 10,000
Aug-06 Supplier P $52.00 30,000Jul-06 Supplier EE $47.00 10,000
Aug-06 Supplier FF $50.00 10,000Oct-o6 Supplier GG $51.00 10,000Sep-06 Supplier AA $49.30 10,000Aug-06 Supplier HH $50.50 30,000Sep-06 Supplier C $49.05 10,000Sep-06 Supplier C $49.05 10,000Sep-06 Supplier AA $48.25 22,000
Sep-06 Supplier FFF $51.05 10,000Oct-06 Supplier JJ 48.55 20,000 20,000
Oct-06 Supplier X $47.75 66,666 66,666 66,666
Nov-06 Supplier F $26.50 10,000 10,000
Tonnage Per Month

Coal Hedging AnalysisJanuary 15, 2010
Appendix E2006
Page 2 of 2
South Carolina Elec Spot Coal Pur
2006
Bid Supplier
Nov-05 Supplier OOct-05 Supplier AJan-06 Supplier EJan-06 Supplier FFeb-06 Supplier AAFeb-06 Supplier FFeb-06 Supplier BBApr-06 Supplier AAApr-06 Supplier FApr-06 Supplier FJun-06 Supplier CCJun-06 Supplier DD
Aug-06 Supplier PJul-06 Supplier EE
Aug-06 Supplier FFOct-o6 Supplier GGSep-06 Supplier AAAug-06 Supplier HHSep-06 Supplier CSep-06 Supplier CSep-06 Supplier AASep-06 Supplier FFFOct-06 Supplier JJOct-06 Supplier X
Nov-06 Supplier F
Jan Feb Mar April May June July Aug Sept Oct Nov Dec
57.00$ 162,000.00$
58.00$ 27,000.00$
57.75$ 57.75$ 57.75$ 57.75$ 57.75$ 57.75$ 5,830,000.00$
57.75$ 57.75$ 57.75$ 57.75$ 57.75$ 57.75$ 3,175,000.00$
57.75$ 1,155,000.00$
57.75$ 433,125.00$
57.75$ 5,775.00$
57.75$ -$
52.25$ 52.25$ 52.25$ 52.25$ 2,090,000.00$
52.25$ 52.25$ 1,045,000.00$
50.75$ 507,500.00$
50.75$ 507,500.00$
51.50$ 1,545,000.00$
49.50$ 495,000.00$
51.50$ 515,000.00$
48.50$ 485,000.00$
48.50$ 485,000.00$
51.50$ 1,545,000.00$
48.50$ 485,000.00$
48.50$ 485,000.00$
48.50$ 1,067,000.00$
48.50$ 485,000.00$
48.00$ 48.00$ 949,000.00$
48.00$ 48.00$ 48.00$ 6,416,602.50$
45.50$ 45.50$ 645,000.00$
TOTAL SAVINGS OR (COSTS) 20,977,900.00$
Savings or cost
Futures Price from UPI Futures Price Sheet

Coal Hedging AnalysisJanuary 15, 2010
Appendix E2007
Page 1 of 2
South Carolina Electric & Gas CompanySpot Coal Purchases
2007
Bid Supplier Coal Jan Feb March April May June July Aug Sept Oct Nov Dec
Jul-06 Supplier EE $47.00 20,000 20,000 20,000 20,000 20,000 20,000 20,000 20,000 20,000 20,000 20,000 20,000Nov-06 Supplier KK $43.05 10,000 10,000 10,000Nov-06 Supplier F $26.50 10,000Nov-06 Supplier LL $40.80 20,000Nov-06 Supplier MM $44.50 20,000 20,000 20,000Dec-06 Supplier NN $41.05 20,000Dec-06 Supplier JJ $40.55 20,000Dec-06 Supplier AA $47.15 20,000 20,000 33,333 33,333 33,333 33,333 33,333 33,333Feb-07 Supplier OO $39.00 200Apr-07 Supplier F $39.75 10,000Apr-07 Supplier C $43.00 10,000 10,000
Sept 07 Supplier PP $44.00 7,500
Tonnage Per Month

Coal Hedging AnalysisJanuary 15, 2010
Appendix E2007
Page 2 of 2
Bid Supplier
Jul-06 Supplier EENov-06 Supplier KKNov-06 Supplier FNov-06 Supplier LLNov-06 Supplier MMDec-06 Supplier NNDec-06 Supplier JJDec-06 Supplier AAFeb-07 Supplier OOApr-07 Supplier FApr-07 Supplier C
Sept 07 Supplier PP
Jan Feb Mar April May June July Aug Sept Oct Nov Dec
46.75$ 46.75$ 46.75$ 46.75$ 46.75$ 46.75$ 46.75$ 46.75$ 46.75$ 46.75$ 46.75$ 46.75$ (60,000.00)$
45.65$ 45.75$ 45.75$ 80,000.00$
45.65$ 191,500.00$
45.65$ 97,000.00$
45.65$ 45.75$ 45.75$ 73,000.00$
40.55$ (10,000.00)$
40.55$ -$
40.55$ 40.75$ 44.25$ 44.25$ 44.25$ 44.75$ 44.75$ 44.75$ (789,994.70)$
36.75$ (450.00)$
40.75$ 10,000.00$
40.75$ 41.00$ (42,500.00)$
42.90$ (8,250.00)$
TOTAL SAVINGS OR (COSTS) (459,694.70)$
Savings or cost
Futures Price from UPI Futures Price Sheet

Coal Hedging AnalysisJanuary 15, 2010
Appendix E2008
Page 1 of 4
South Carolina Electric & Gas CompanySpot Coal Purchases
2008
DeliveryBid Supplier Coal Month(s) Jan Feb March April May June July Aug Sept Oct Nov Dec
Apr 07 Supplier C $45.50 Jan - Dec 40,000 40,000 40,000 40,000 40,000 40,000 20,000 20,000 20,000 20,000 20,000 20,000Apr 08 Supplier QQ $88.05 May 10,000
Apr 08 Supplier RR $86.05 May 10,000
May 08 Supplier SS $98.00 Jul-Dec 10,000 10,000 10,000 10,000 10,000 10,000May 08 Supplier A $105.00 Jun 10,000May 08 Supplier TT $100.00 Jun 10,000Jun 08 Supplier E $128.00 Jun 10,000Jun 08 Supplier A $125.00 Jun 10,000Jun 08 Supplier PP $144.00 Jul 7,500Jul 08 Supplier UU $120.00 Jul 4,500Jul 08 Supplier VV $147.05 Jul 10,000Jul 08 Supplier WW $141.00 Jul 20,000Jul 08 Supplier XX $140.05 Jul 10,000Jul -08 Supplier YY $140.00 Aug-Sep 20,000 20,000Jul 08 Supplier JJ $141.05 Jul 10,000Jul 08 Supplier V $140.00 Jul 10,000Jul 08 Supplier JJ $141.05 Aug 10,000Jul 08 Supplier KK $141.05 Aug 10,000Jul 08 Supplier ZZ $141.05 Aug 10,000Jul 08 Supplier JJ $140.05 Aug 10,000Jul 08 Supplier AAA $141.05 Aug 20,000Jul 08 Supplier BBB $138.50 Jul 10,000Jul 08 Supplier JJ $141.55 Jul 10,000Jul 08 Supplier C 132.5 Jul 20,000
Aug 08 Supplier GG $150.00 aug 30,000Aug 08 Supplier CCC $146.50 Aug 10,000
Tonnage Per Month

Coal Hedging AnalysisJanuary 15, 2010
Appendix E2008
Page 2 of 4
"Aug 08 Supplier QQ $135.00 Sep-Dec 10,000 10,000 10,000 30,000 30,000 30,000Aug 08 Supplier DDD $138.00 Sep 10,000Sep 08 Supplier GG $122.00 Sep 20,000Sep 08 Supplier JJ $121.05 Sep 10,000Sep 08 Supplier JJ $121.05 Sep 10,000Sep 08 Supplier QQ $112.00 Oct-Dec 10,000 10,000 10,000Sep 08 Supplier DDD $121.00 Oct-Dec 16,666 16,666 16,666Sep 08 Supplier JJ $121.05 Sep 10,000Sep 08 Supplier C $126.50 Oct-Dec 20,000 20,000 20,000Sep 08 Supplier WW $131.00 Oct 30,000Sep 08 Supplier EEE $147.00 Oct 20,000Sep 08 Supplier V $131.00 Oct-Dec 20,000 20,000 20,000Oct 08 Supplier KK $145.05 Oct 10,000Oct 08 Supplier FFF $145.05 Oct 10,000Oct 08 Supplier GGG $140.00 Oct 10,000Oct 08 Supplier HHH $125.75 Nov-Dec 20,000 20,000Oct 08 Supplier TT $110.00 Oct 10,000Oct 08 Supplier HHH $103.00 Dec 20,000Oct 08 Supplier NN $104.05 Nov 10,000Oct 08 Supplier NN $104.05 Dec 10,000Nov-08 Supplier C $85.00 Nov-Dec 30,000 30,000Nov-08 Supplier C $78.00 Dec 50,000Nov-08 Supplier WW $79.50 Dec 20,000

Coal Hedging AnalysisJanuary 15, 2010
Appendix E2008
Page 3 of 4
South Car Spot C
Bid Supplier
Apr 07 Supplier CApr 08 Supplier QQApr 08 Supplier RRMay 08 Supplier SSMay 08 Supplier AMay 08 Supplier TTJun 08 Supplier EJun 08 Supplier AJun 08 Supplier PPJul 08 Supplier UUJul 08 Supplier VVJul 08 Supplier WWJul 08 Supplier XXJul -08 Supplier YYJul 08 Supplier JJJul 08 Supplier VJul 08 Supplier JJJul 08 Supplier KKJul 08 Supplier ZZJul 08 Supplier JJJul 08 Supplier AAAJul 08 Supplier BBBJul 08 Supplier JJJul 08 Supplier C
Aug 08 Supplier GGAug 08 Supplier CCC
Jan Feb Mar April May June July Aug Sept Oct Nov Dec
45.25$ 45.25$ 45.25$ 45.25$ 45.25$ 45.25$ 45.25$ 45.25$ 45.25$ 45.25$ 45.25$ 45.25$ (90,000.00)$
83.75$ (43,000.00)$
83.75$ (23,000.00)$
103.50$ 103.50$ 103.50$ 102.00$ 102.00$ 102.00$ 285,000.00$
104.00$ (10,000.00)$
104.00$ 40,000.00$
110.00$ (180,000.00)$
110.00$ (150,000.00)$
110.00$ (255,000.00)$
161.00$ 184,500.00$
161.00$ 139,500.00$
161.00$ 400,000.00$
161.00$ 209,500.00$
161.00$ 161.00$ 840,000.00$
161.00$ 199,500.00$
161.00$ 210,000.00$
161.00$ 199,500.00$
161.00$ 199,500.00$
161.00$ 199,500.00$
161.00$ 209,500.00$
161.00$ 399,000.00$
161.00$ 225,000.00$
161.00$ 194,500.00$
161.00$ 570,000.00$
152.00$ 60,000.00$
152.00$ 55,000.00$
Futures Price from UPI Futures Price SheetSavings or cost

Coal Hedging AnalysisJanuary 15, 2010
Appendix E2008
Page 4 of 4
"Aug 08 Supplier QQAug 08 Supplier DDDSep 08 Supplier GGSep 08 Supplier JJSep 08 Supplier JJSep 08 Supplier QQSep 08 Supplier DDDSep 08 Supplier JJSep 08 Supplier CSep 08 Supplier WWSep 08 Supplier EEESep 08 Supplier VOct 08 Supplier KKOct 08 Supplier FFFOct 08 Supplier GGGOct 08 Supplier HHHOct 08 Supplier TTOct 08 Supplier HHHOct 08 Supplier NNOct 08 Supplier NNNov-08 Supplier CNov-08 Supplier CNov-08 Supplier WW
152.00$ 152.00$ 149.25$ 149.25$ 149.25$ 272,500.00$
152.00$ 140,000.00$
119.00$ (60,000.00)$
119.00$ (20,500.00)$
119.00$ (20,500.00)$
119.00$ 116.00$ 116.00$ 150,000.00$
119.00$ 116.00$ 116.00$ (199,992.00)$
119.00$ (1,210,500.00)$
119.00$ 116.00$ 116.00$ (570,000.00)$
119.00$ (360,000.00)$
119.00$ (560,000.00)$
119.00$ 116.00$ 116.00$ (840,000.00)$
148.00$ 29,500.00$
148.00$ 29,500.00$
148.00$ 80,000.00$
150.00$ 141.00$ 790,000.00$
148.00$ 380,000.00$
141.00$ 760,000.00$
150.00$ 459,500.00$
141.00$ 369,500.00$
87.50$ 87.50$ 150,000.00$
87.50$ 475,000.00$
87.50$ 160,000.00$
TOTAL SAVINGS OR (COSTS) 4,472,508.00$

Coal Hedging Analysis January 15, 2010
Appendix FPage 1 of 3
DERIVATIVE ANALYSIS USING FICTIONAL FORWARD LOOKING ANALYSIS
Year Month
Last week of Prior Month Actual Price per Ton for Following Month
6 Month Spot price per Ton
9 Month Spot Price per Ton
12 Month Spot Price per Ton
Assume Bought 6 Month Future
Assume Bought 9 Month Future
Assume Bought a 12 month Future
Assume Bought 6 Month Call option
Assume Bought 9 Month Future
Assume Bought a 12 month Future
2004 Jan 37.8 38.50$ 39.00$ 39.20$ 17.50$ 24.00$ 21.55$ 15.50$ 22.00$ 19.55$ Feb 44 44.85$ 44.88$ 42.50$ 11.65$ 20.12$ 12.00$ 9.65$ 18.12$ 10.00$
March 52 55.25$ 55.25$ 52.00$ 3.25$ 8.25$ 5.00$ 1.25$ 6.25$ 3.00$ April 55 55.00$ 55.00$ 50.50$ 8.00$ 5.75$ 8.75$ 6.00$ 3.75$ 6.75$ May 54 54.00$ 50.00$ 47.00$ 11.00$ 4.50$ 12.75$ 9.00$ 2.50$ 10.75$ June 56 58.00$ 55.00$ 52.25$ 5.50$ 2.00$ 9.75$ 3.50$ -$ 7.75$ July 56.5 58.25$ 58.25$ 56.25$ 2.50$ 1.00$ 0.25$ 0.50$ (1.00)$ (1.75)$ Aug 58.5 60.00$ 57.50$ 56.25$ (5.50)$ 2.25$ (1.50)$ (7.50)$ 0.25$ (3.50)$ Sept 63 61.50$ 58.00$ 56.00$ (4.50)$ 4.00$ (1.00)$ (6.50)$ 2.00$ (3.00)$ Oct 65 62.00$ 59.90$ 57.75$ (2.75)$ (3.40)$ (3.75)$ (4.75)$ (5.40)$ (5.75)$ Nov 63.5 58.75$ 57.75$ 56.50$ 1.00$ (3.00)$ -$ (1.00)$ (5.00)$ (2.00)$ Dec 60.75 58.75$ 58.25$ 57.75$ 3.25$ (3.25)$ (1.00)$ 1.25$ (5.25)$ (3.00)$
2005 Jan 54.5 57.50$ 57.00$ 56.00$ (1.00)$ (3.00)$ 0.75$ (3.00)$ (5.00)$ (1.25)$ Feb 57 57.50$ 56.50$ 55.00$ (2.75)$ -$ 2.75$ (4.75)$ (2.00)$ 0.75$
March 59.25 60.25$ 59.75$ 58.25$ (5.25)$ (3.00)$ (0.50)$ (7.25)$ (5.00)$ (2.50)$ April 59.75 61.00$ 61.50$ 61.50$ (7.00)$ (4.75)$ (4.50)$ (9.00)$ (6.75)$ (6.50)$ May 62 63.50$ 62.50$ 61.50$ (7.00)$ (4.75)$ (9.75)$ (9.00)$ (6.75)$ (11.75)$ June 56.5 57.50$ 57.75$ 56.75$ (0.75)$ -$ (4.50)$ (2.75)$ (2.00)$ (6.50)$
Assume Buying Futures- Current Month Price Less Futures Price (positive value
indicates futures saved money)
Assume Buying Call Option - Current Month Price Less Call option and $2.00
Call Option premium (positive value indicates call option saved money)

Coal Hedging Analysis January 15, 2010
Appendix FPage 2 of 3
July 54.75 54.50$ 54.75$ 54.25$ 2.25$ 2.25$ (4.00)$ 0.25$ 0.25$ (6.00)$ Aug 55 57.00$ 56.25$ 55.65$ 0.75$ (4.50)$ (4.90)$ (1.25)$ (6.50)$ (6.90)$ Sept 54 60.00$ 59.75$ 59.50$ (2.25)$ (7.50)$ (8.00)$ (4.25)$ (9.50)$ (10.00)$ Oct 56.5 58.00$ 58.00$ 57.25$ (1.00)$ (7.75)$ (8.25)$ (3.00)$ (9.75)$ (10.25)$ Nov 56.75 56.50$ 56.10$ 56.00$ (4.75)$ (5.35)$ (7.25)$ (6.75)$ (7.35)$ (9.25)$ Dec 56.75 57.00$ 56.75$ 56.75$ (4.75)$ (5.25)$ (10.75)$ (6.75)$ (7.25)$ (12.75)$
2006 Jan 57.75 57.75$ 57.75$ 57.75$ (7.50)$ (8.75)$ (17.00)$ (9.50)$ (10.75)$ (19.00)$ Feb 57.75 58.35$ 58.35$ 58.00$ (7.60)$ (9.60)$ (18.50)$ (9.60)$ (11.60)$ (20.50)$
March 57 x x xApril 51.75 52.75$ 52.75$ 52.00$ (3.75)$ (12.00)$ (12.75)$ (5.75)$ (14.00)$ (14.75)$ May 52.25 52.75$ 52.00$ 51.75$ (4.00)$ (12.50)$ (11.35)$ (6.00)$ (14.50)$ (13.35)$ June 50.25 50.75$ 49.60$ 49.60$ (4.75)$ (15.10)$ (8.10)$ (6.75)$ (17.10)$ (10.10)$ July 50.75 48.25$ 46.75$ 46.75$ (7.50)$ (7.50)$ (5.25)$ (9.50)$ (9.50)$ (7.25)$ Aug 51.5 51.25$ 50.75$ 50.50$ (11.75)$ (10.35)$ (8.75)$ (13.75)$ (12.35)$ (10.75)$ Sept 49 48.50$ 48.10$ 48.00$ (14.00)$ (6.60)$ (6.15)$ (16.00)$ (8.60)$ (8.15)$ Oct 48.75 47.00$ 47.00$ 47.50$ (7.75)$ (5.50)$ (4.65)$ (9.75)$ (7.50)$ (6.65)$ Nov 46 46.25$ 46.75$ 47.00$ (5.85)$ (5.00)$ (1.00)$ (7.85)$ (7.00)$ (3.00)$ Dec 40.75 42.50$ 44.25$ 44.75$ (1.00)$ (2.40)$ 6.75$ (3.00)$ (4.40)$ 4.75$
2007 Jan 39.5 40.00$ 41.00$ 42.00$ 1.50$ 1.85$ 10.50$ (0.50)$ (0.15)$ 8.50$ Feb 34.5 37.75$ 38.25$ 39.75$ 4.00$ 7.75$ 10.50$ 2.00$ 5.75$ 8.50$
March 39.25 40.50$ 41.75$ 42.75$ 1.35$ 9.75$ 17.25$ (0.65)$ 7.75$ 15.25$ April 40.4 42.50$ 43.50$ 44.50$ 0.35$ 9.00$ 45.00$ (1.65)$ 7.00$ 43.00$ May 41.5 44.25$ 45.25$ 46.25$ 1.75$ 5.00$ 36.75$ (0.25)$ 3.00$ 34.75$ June 41.5 44.00$ 45.60$ 46.75$ 7.50$ 14.40$ 49.25$ 5.50$ 12.40$ 47.25$ July 41.75 43.85$ 45.40$ 46.60$ 8.65$ 44.10$ 64.40$ 6.65$ 42.10$ 62.40$ Aug 41.85 45.00$ 46.00$ 47.00$ 5.25$ 37.00$ 107.00$ 3.25$ 35.00$ 105.00$ Sept 42.85 44.90$ 46.15$ 47.40$ 15.10$ 49.85$ 92.60$ 13.10$ 47.85$ 90.60$ Oct 46 48.10$ 50.10$ 51.35$ 41.40$ 60.90$ 83.65$ 39.40$ 58.90$ 81.65$ Nov 51.5 54.80$ 55.10$ 55.40$ 28.20$ 98.90$ 92.60$ 26.20$ 96.90$ 90.60$ Dec 52.5 56.50$ 56.60$ 56.60$ 39.50$ 83.40$ 39.40$ 37.50$ 81.40$ 37.40$
2008 Jan 50.25 56.25$ 57.00$ 57.75$ 54.75$ 78.00$ 17.25$ 52.75$ 76.00$ 15.25$ Feb 60 75.00$ 74.00$ 72.00$ 79.00$ 74.00$ (19.00)$ 77.00$ 72.00$ (21.00)$
March 89.5 90.00$ 90.00$ 88.50$ 50.00$ 6.00$ (34.75)$ 48.00$ 4.00$ (36.75)$

Coal Hedging Analysis January 15, 2010
Appendix FPage 3 of 3
April 83 83.75$ 83.75$ 81.75$ 51.25$ (8.75)$ (26.75)$ 49.25$ (10.75)$ (28.75)$ May 96 102.00$ 97.75$ 95.50$ 46.00$ (44.75)$ (46.25)$ 44.00$ (46.75)$ (48.25)$ June 111 111.00$ 108.00$ 107.00$ (15.00)$ (54.25)$ (66.50)$ (17.00)$ (56.25)$ (68.50)$ July 154 161.00$ 152.00$ 149.00$ (86.00)$ (97.00)$ (103.00)$ (88.00)$ (99.00)$ (105.00)$ Aug 140 134.00$ 129.00$ 124.00$ (81.00)$ (79.75)$ (76.50)$ (83.00)$ (81.75)$ (78.50)$ Sept 135 112.00$ 110.00$ 108.00$ (58.25)$ (69.50)$ (61.00)$ (60.25)$ (71.50)$ (63.00)$ Oct 148 127.00$ 119.00$ 114.00$ (72.00)$ (73.00)$ (66.00)$ (74.00)$ (75.00)$ (68.00)$ Nov 96 85.25$ 85.00$ 84.75$ (36.00)$ (37.50)$ (38.00)$ (39.50)$ Dec 75 64.00$ 63.25$ 63.25$ (23.50)$ (16.25)$ (25.50)$ (18.25)$
2009 Jan 53 58.25$ 59.75$ 61.00$ (12.25)$ (11.75)$ (14.25)$ (13.75)$ Feb 53.75 57.00$ 58.50$ 63.25$ (9.50)$ (11.50)$
March 55 53.25$ 53.50$ 55.50$ (6.25)$ (8.25)$ April 49.25 48.00$ 49.50$ 54.50$ -$ (2.00)$ May 40.5 43.75$ 47.65$ 51.65$ June 46 48.75$ 53.50$ 58.25$ July 47.5 47.25$ 52.00$ 55.25$ Aug 47 49.75$ 53.75$ 58.15$ Sept 48 estimate
Cost (Savings) per Ton Coal Using Derivative 0.35$ (0.18)$ (1.44)$ 2.32$ 1.79$ 0.53$ Total # of Months Data 64 61 58 64 61 58Total # of Months Derivative Increased Costs 34 34 33 41 41 36
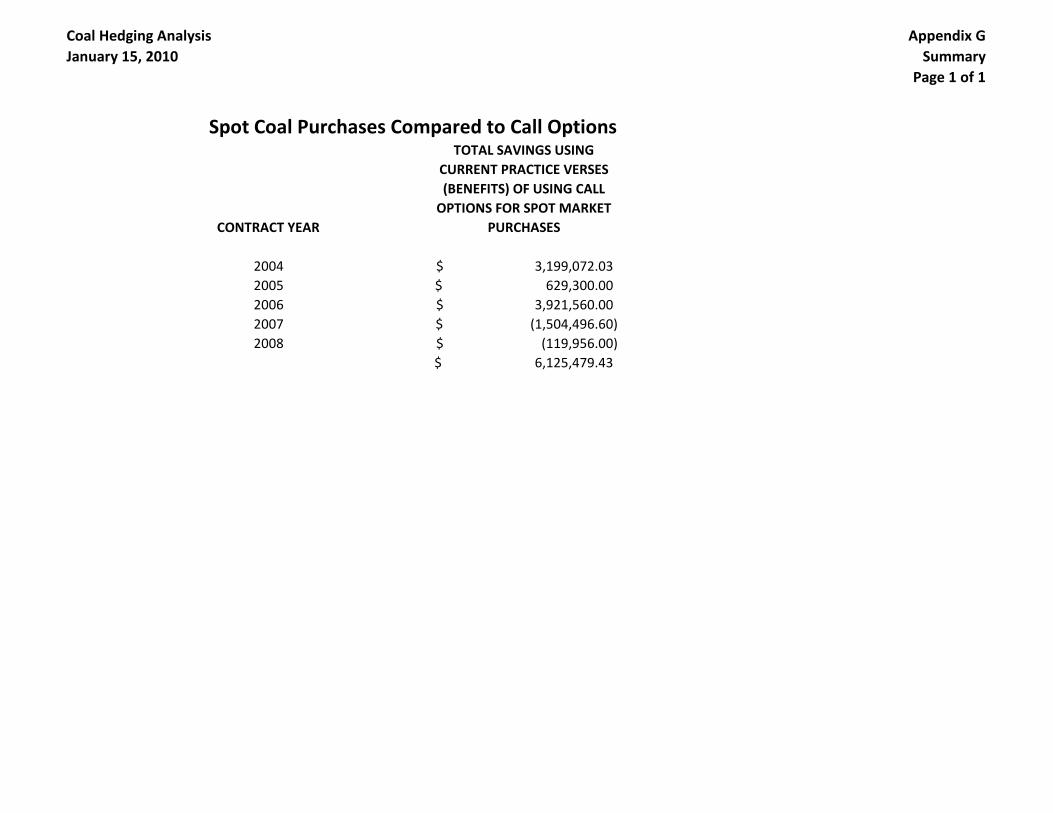
Coal Hedging Analysis January 15, 2010
Appendix GSummary
Page 1 of 1
CONTRACT YEAR
TOTAL SAVINGS USING CURRENT PRACTICE VERSES (BENEFITS) OF USING CALL
OPTIONS FOR SPOT MARKET PURCHASES
2004 3,199,072.03$ 2005 629,300.00$ 2006 3,921,560.00$ 2007 (1,504,496.60)$ 2008 (119,956.00)$
6,125,479.43$
Spot Coal Purchases Compared to Call Options

Coal Hedging Analysis January 15, 2010
Appendix G2004
Page 1 of 6
South Carolina Electric & Gas CompanySpot Coal Purchases Compared to Call Options
2004
Delivery Tonnage Per Month
Bid Supplier Coal Month(s) Jan Feb March April May June July Aug Sept Oct Nov DecOption
Prermium
Jan-04 Supplier A $37.00 Jan-04 10,000 2.00$ Jan-04 Supplier B $38.00 Jan-04 20,000 2.00$ Feb-04 Supplier A $36.00 Feb-04 10,000 2.00$ Feb-04 Supplier A $41.00 Mar-04 10,000 0 0 0 2.00$ Jan-04 Supplier C $39.75 Feb/March 25,000 25,000 0 0 0 2.00$ Feb-04 Supplier D $49.50 March 20,000 0 0 0 2.00$ Mar-04 Supplier E $50.00 March 20,000 0 0 0 2.00$ Jan-04 Supplier F $33.00 March 20,000 0 0 0 2.00$ Mar-04 Supplier G $54.00 March 10,000 0 0 0 2.00$ Mar-04 Supplier H $54.00 April thru Dec 04 11,000 11,000 11,000 11,000 11,000 11,000 11,000 11,000 11,000 2.00$ Apr-04 Supplier E $53.00 May 50,000 0 0 2.00$ Apr-04 Supplier I $52.05 April 10,000 0 0 2.00$ Apr-04 Supplier J $48.00 April 1,177 0 0 2.00$ May-04 Supplier K $52.00 May 9,000 0 0 2.00$ May-04 Supplier L $45.50 May, June 25,000 25,000 0 0 2.00$ May-04 Supplier M $46.00 May 10,000 0 0 2.00$ May-04 Supplier G $53.50 June 10,000 0 0 2.00$
Jun-04 Supplier E $53.00 July,August 20,000 0 2.00$ Jul-04 Supplier A $48.50 August 10,000 0 2.00$ Jul-04 Supplier N $36.00 August 10,000 0 2.00$
Aug-04 Supplier M $37.50 August 22,000 0 2.00$ Aug-04 Supplier M $30.00 August 6,000 0 2.00$ Aug-04 Supplier M $52.00 August 10,000 0 2.00$ Aug-04 Supplier O $54.50 August 9,000 0 2.00$ Aug-04 Supplier P $55.00 September 20,000 0 2.00$ Aug-04 Supplier D $50.50 September 10,000 0 2.00$ Sep-04 Supplier L $50.00 September 10,000 0 2.00$ Sep-04 Supplier Q $53.00 October 10,000 2.00$ Nov-04 Supplier G $54.00 November 11,820 11,280 2.00$ Nov-04 Supplier R $56.00 November 10,000 2.00$ Nov-04 Supplier S $73.00 November 23,000 2.00$
Dec 04 Supplier T $55.00 December 10,000 2.00$ Dec-04 Supplier U $70.87 December 50,000 2.00$

Coal Hedging Analysis January 15, 2010
Appendix G2004
Page 2 of 6
Bid Supplier
Jan-04 Supplier AJan-04 Supplier BFeb-04 Supplier AFeb-04 Supplier AJan-04 Supplier CFeb-04 Supplier DMar-04 Supplier EJan-04 Supplier FMar-04 Supplier GMar-04 Supplier HApr-04 Supplier EApr-04 Supplier IApr-04 Supplier JMay-04 Supplier KMay-04 Supplier LMay-04 Supplier MMay-04 Supplier G
Jun-04 Supplier EJul-04 Supplier AJul-04 Supplier N
Aug-04 Supplier MAug-04 Supplier MAug-04 Supplier MAug-04 Supplier OAug-04 Supplier PAug-04 Supplier DSep-04 Supplier LSep-04 Supplier QNov-04 Supplier GNov-04 Supplier RNov-04 Supplier S
Dec 04 Supplier TDec-04 Supplier U
Jan Feb Mar April May June July Aug Sept Oct Nov Dec
38.10$ 38.10$
44.88$ 44.88$
38.10$ 38.20$
44.88$ 52.75$ 38.20$ 52.75$
52.75$ 53.00$ 53.00$ 55.25$ 55.25$ 55.25$ 55.25$ 55.25$ 55.25$
54.75$
54.75$
54.75$
54.00$
54.00$ 54.00$
54.00$
54.00$
57.00$ 57.50$
57.00$
57.00$
59.75$
59.75$
59.75$
59.75$
59.75$
59.75$
63.75$
63.75$
64.00$ 64.00$
64.00$
64.00$
64.00$
64.00$
Futures Price from UPI Futures Price Sheet Which Establishes Call Option Strike Price
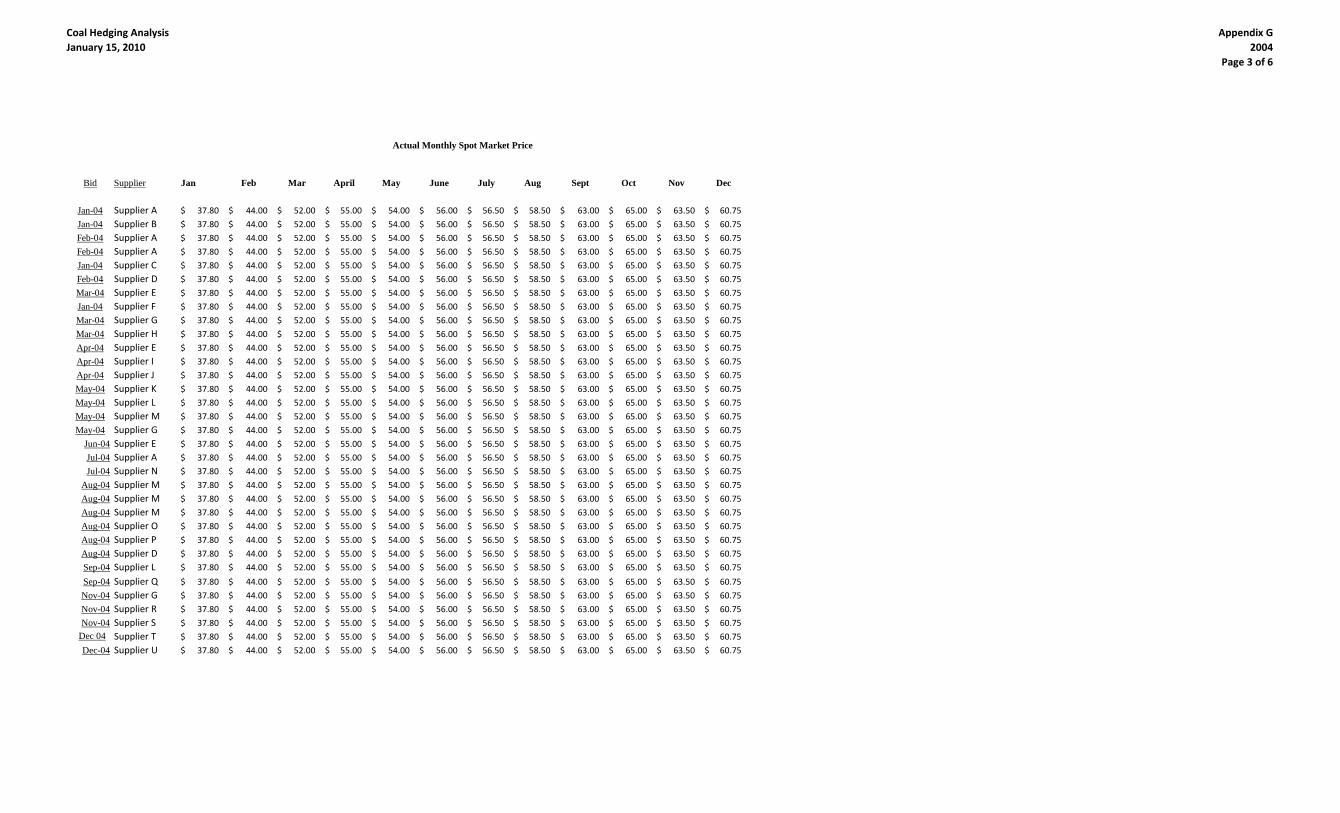
Coal Hedging Analysis January 15, 2010
Appendix G2004
Page 3 of 6
Bid Supplier
Jan-04 Supplier AJan-04 Supplier BFeb-04 Supplier AFeb-04 Supplier AJan-04 Supplier CFeb-04 Supplier DMar-04 Supplier EJan-04 Supplier FMar-04 Supplier GMar-04 Supplier HApr-04 Supplier EApr-04 Supplier IApr-04 Supplier JMay-04 Supplier KMay-04 Supplier LMay-04 Supplier MMay-04 Supplier G
Jun-04 Supplier EJul-04 Supplier AJul-04 Supplier N
Aug-04 Supplier MAug-04 Supplier MAug-04 Supplier MAug-04 Supplier OAug-04 Supplier PAug-04 Supplier DSep-04 Supplier LSep-04 Supplier QNov-04 Supplier GNov-04 Supplier RNov-04 Supplier S
Dec 04 Supplier TDec-04 Supplier U
Jan Feb Mar April May June July Aug Sept Oct Nov Dec
37.80$ 44.00$ 52.00$ 55.00$ 54.00$ 56.00$ 56.50$ 58.50$ 63.00$ 65.00$ 63.50$ 60.75$
37.80$ 44.00$ 52.00$ 55.00$ 54.00$ 56.00$ 56.50$ 58.50$ 63.00$ 65.00$ 63.50$ 60.75$
37.80$ 44.00$ 52.00$ 55.00$ 54.00$ 56.00$ 56.50$ 58.50$ 63.00$ 65.00$ 63.50$ 60.75$
37.80$ 44.00$ 52.00$ 55.00$ 54.00$ 56.00$ 56.50$ 58.50$ 63.00$ 65.00$ 63.50$ 60.75$
37.80$ 44.00$ 52.00$ 55.00$ 54.00$ 56.00$ 56.50$ 58.50$ 63.00$ 65.00$ 63.50$ 60.75$
37.80$ 44.00$ 52.00$ 55.00$ 54.00$ 56.00$ 56.50$ 58.50$ 63.00$ 65.00$ 63.50$ 60.75$
37.80$ 44.00$ 52.00$ 55.00$ 54.00$ 56.00$ 56.50$ 58.50$ 63.00$ 65.00$ 63.50$ 60.75$
37.80$ 44.00$ 52.00$ 55.00$ 54.00$ 56.00$ 56.50$ 58.50$ 63.00$ 65.00$ 63.50$ 60.75$
37.80$ 44.00$ 52.00$ 55.00$ 54.00$ 56.00$ 56.50$ 58.50$ 63.00$ 65.00$ 63.50$ 60.75$
37.80$ 44.00$ 52.00$ 55.00$ 54.00$ 56.00$ 56.50$ 58.50$ 63.00$ 65.00$ 63.50$ 60.75$
37.80$ 44.00$ 52.00$ 55.00$ 54.00$ 56.00$ 56.50$ 58.50$ 63.00$ 65.00$ 63.50$ 60.75$
37.80$ 44.00$ 52.00$ 55.00$ 54.00$ 56.00$ 56.50$ 58.50$ 63.00$ 65.00$ 63.50$ 60.75$
37.80$ 44.00$ 52.00$ 55.00$ 54.00$ 56.00$ 56.50$ 58.50$ 63.00$ 65.00$ 63.50$ 60.75$
37.80$ 44.00$ 52.00$ 55.00$ 54.00$ 56.00$ 56.50$ 58.50$ 63.00$ 65.00$ 63.50$ 60.75$
37.80$ 44.00$ 52.00$ 55.00$ 54.00$ 56.00$ 56.50$ 58.50$ 63.00$ 65.00$ 63.50$ 60.75$
37.80$ 44.00$ 52.00$ 55.00$ 54.00$ 56.00$ 56.50$ 58.50$ 63.00$ 65.00$ 63.50$ 60.75$
37.80$ 44.00$ 52.00$ 55.00$ 54.00$ 56.00$ 56.50$ 58.50$ 63.00$ 65.00$ 63.50$ 60.75$
37.80$ 44.00$ 52.00$ 55.00$ 54.00$ 56.00$ 56.50$ 58.50$ 63.00$ 65.00$ 63.50$ 60.75$
37.80$ 44.00$ 52.00$ 55.00$ 54.00$ 56.00$ 56.50$ 58.50$ 63.00$ 65.00$ 63.50$ 60.75$
37.80$ 44.00$ 52.00$ 55.00$ 54.00$ 56.00$ 56.50$ 58.50$ 63.00$ 65.00$ 63.50$ 60.75$
37.80$ 44.00$ 52.00$ 55.00$ 54.00$ 56.00$ 56.50$ 58.50$ 63.00$ 65.00$ 63.50$ 60.75$
37.80$ 44.00$ 52.00$ 55.00$ 54.00$ 56.00$ 56.50$ 58.50$ 63.00$ 65.00$ 63.50$ 60.75$
37.80$ 44.00$ 52.00$ 55.00$ 54.00$ 56.00$ 56.50$ 58.50$ 63.00$ 65.00$ 63.50$ 60.75$
37.80$ 44.00$ 52.00$ 55.00$ 54.00$ 56.00$ 56.50$ 58.50$ 63.00$ 65.00$ 63.50$ 60.75$
37.80$ 44.00$ 52.00$ 55.00$ 54.00$ 56.00$ 56.50$ 58.50$ 63.00$ 65.00$ 63.50$ 60.75$
37.80$ 44.00$ 52.00$ 55.00$ 54.00$ 56.00$ 56.50$ 58.50$ 63.00$ 65.00$ 63.50$ 60.75$
37.80$ 44.00$ 52.00$ 55.00$ 54.00$ 56.00$ 56.50$ 58.50$ 63.00$ 65.00$ 63.50$ 60.75$
37.80$ 44.00$ 52.00$ 55.00$ 54.00$ 56.00$ 56.50$ 58.50$ 63.00$ 65.00$ 63.50$ 60.75$
37.80$ 44.00$ 52.00$ 55.00$ 54.00$ 56.00$ 56.50$ 58.50$ 63.00$ 65.00$ 63.50$ 60.75$
37.80$ 44.00$ 52.00$ 55.00$ 54.00$ 56.00$ 56.50$ 58.50$ 63.00$ 65.00$ 63.50$ 60.75$
37.80$ 44.00$ 52.00$ 55.00$ 54.00$ 56.00$ 56.50$ 58.50$ 63.00$ 65.00$ 63.50$ 60.75$
37.80$ 44.00$ 52.00$ 55.00$ 54.00$ 56.00$ 56.50$ 58.50$ 63.00$ 65.00$ 63.50$ 60.75$
37.80$ 44.00$ 52.00$ 55.00$ 54.00$ 56.00$ 56.50$ 58.50$ 63.00$ 65.00$ 63.50$ 60.75$
Actual Monthly Spot Market Price

Coal Hedging Analysis January 15, 2010
Appendix G2004
Page 4 of 6
Bid Supplier
Jan-04 Supplier AJan-04 Supplier BFeb-04 Supplier AFeb-04 Supplier AJan-04 Supplier CFeb-04 Supplier DMar-04 Supplier EJan-04 Supplier FMar-04 Supplier GMar-04 Supplier HApr-04 Supplier EApr-04 Supplier IApr-04 Supplier JMay-04 Supplier KMay-04 Supplier LMay-04 Supplier MMay-04 Supplier G
Jun-04 Supplier EJul-04 Supplier AJul-04 Supplier N
Aug-04 Supplier MAug-04 Supplier MAug-04 Supplier MAug-04 Supplier OAug-04 Supplier PAug-04 Supplier DSep-04 Supplier LSep-04 Supplier QNov-04 Supplier GNov-04 Supplier RNov-04 Supplier S
Dec 04 Supplier TDec-04 Supplier U
Jan Feb Mar April May June July Aug Sept Oct Nov Dec
no - - - - - - - - - - -
no - - - - - - - - - - -
- no - - - - - - - - - -
- - yes - - - - - - - - -
- yes yes - - - - - - - - -
- - yes - - - - - - - - -
- - no - - - - - - - - -
- - yes - - - - - - - - -
- - no - - - - - - - - -
- - - yes yes yes yes yes yes yes yes yes
- - - - no - - - - - - -
- - - yes - - - - - - - -
- - - yes - - - - - - - -
- - - - yes - - - - - - -
- - - - yes yes - - - - - -
- - - - yes - - - - - - -
- - - - - yes - - - - - -
- - - - - - no yes - - - -
- - - - - - - yes - - - -
- - - - - - - yes - - - -
- - - - - - - no - - - -
- - - - - - - no - - - -
- - - - - - - no - - - -
- - - - - - - no - - - -
- - - - - - - - yes - - -
- - - - - - - - yes - - -
- - - - - - - - no - - -
- - - - - - - - - yes - -
- - - - - - - - - - no no
- - - - - - - - - - no -
- - - - - - - - - - no -
- - - - - - - - - - - no
- - - - - - - - - - - no
Exercise Call Option?

Coal Hedging Analysis January 15, 2010
Appendix G2004
Page 5 of 6
Bid Supplier
Jan-04 Supplier AJan-04 Supplier BFeb-04 Supplier AFeb-04 Supplier AJan-04 Supplier CFeb-04 Supplier DMar-04 Supplier EJan-04 Supplier FMar-04 Supplier GMar-04 Supplier HApr-04 Supplier EApr-04 Supplier IApr-04 Supplier JMay-04 Supplier KMay-04 Supplier LMay-04 Supplier MMay-04 Supplier G
Jun-04 Supplier EJul-04 Supplier AJul-04 Supplier N
Aug-04 Supplier MAug-04 Supplier MAug-04 Supplier MAug-04 Supplier OAug-04 Supplier PAug-04 Supplier DSep-04 Supplier LSep-04 Supplier QNov-04 Supplier GNov-04 Supplier RNov-04 Supplier S
Dec 04 Supplier TDec-04 Supplier U
Jan Feb Mar April May June July Aug Sept Oct Nov Dec
(28,000.00)$ - - - - - - - - - - -(36,000.00)$ - - - - - - - - - - -
- (100,000.00)$ - - - - - - - - - -- - - - - - - - - - - -- - - - - - - - - - - -- - - - - - - - - - - -- - (80,000.00)$ - - - - - - - - -- - - - - - - - - - - -- - -$ - - - - - - - - -- - - - - - - - - - - -- - - - (150,000.00)$ - - - - - - -- - - - - - - - - - - -- - - - - - - - - - - -- - - - - - - - - - - -- - - - - - - - - - - -- - - - - - - - - - - -- - - - - - - - - - - -- - - - - - -$ - - - - -- - - - - - - - - - - -- - - - - - - - - - - -- - - - - - - (506,000.00)$ - - - -- - - - - - - (183,000.00)$ - - - -- - - - - - - (85,000.00)$ - - - -- - - - - - - (54,000.00)$ - - - -- - - - - - - - - - - -- - - - - - - - - - - -- - - - - - - - (150,000.00)$ - - -- - - - - - - - - - - -- - - - - - - - - - (135,924.60)$ (98,700.00)$ - - - - - - - - - - (95,000.00)$ -- - - - - - - - - - 172,500.00$ -- - - - - - - - - - - (77,500.00)$ - - - - - - - - - - - 406,000.00$
Savings or (Cost) if Call Not Exercised

Coal Hedging Analysis January 15, 2010
Appendix G2004
Page 6 of 6
Bid Supplier
Jan-04 Supplier AJan-04 Supplier BFeb-04 Supplier AFeb-04 Supplier AJan-04 Supplier CFeb-04 Supplier DMar-04 Supplier EJan-04 Supplier FMar-04 Supplier GMar-04 Supplier HApr-04 Supplier EApr-04 Supplier IApr-04 Supplier JMay-04 Supplier KMay-04 Supplier LMay-04 Supplier MMay-04 Supplier G
Jun-04 Supplier EJul-04 Supplier AJul-04 Supplier N
Aug-04 Supplier MAug-04 Supplier MAug-04 Supplier MAug-04 Supplier OAug-04 Supplier PAug-04 Supplier DSep-04 Supplier LSep-04 Supplier QNov-04 Supplier GNov-04 Supplier RNov-04 Supplier S
Dec 04 Supplier TDec-04 Supplier U
Jan Feb Mar April May June July Aug Sept Oct Nov Dec
- - - - - - - - - - - - (28,000.00)$ - - - - - - - - - - - - (36,000.00)$ - - - - - - - - - - - - (100,000.00)$ - - (58,800.00)$ - - - - - - - - - (58,800.00)$ - (8,750.00)$ (11,250.00)$ - - - - - - - - - (20,000.00)$ - - 52,400.00$ - - - - - - - - - 52,400.00$ - - - - - - - - - - - - (80,000.00)$ - - (144,000.00)$ - - - - - - - - - (144,000.00)$ - - - - - - - - - - - - -$ - - - (8,250.00)$ (11,000.00)$ (11,000.00)$ (35,750.00)$ (35,750.00)$ (35,750.00)$ (35,750.00)$ (35,750.00)$ (35,750.00)$ (244,750.00)$ - - - - - - - - - - - - (150,000.00)$ - - - (47,000.00)$ - - - - - - - - (47,000.00)$ - - - (10,297.44)$ - - - - - - - - (10,297.44)$ - - - - (36,000.00)$ - - - - - - - (36,000.00)$ - - - - (262,500.00)$ (262,500.00)$ - - - - - - (525,000.00)$ - - - - (100,000.00)$ - - - - - - - (100,000.00)$ - - - - - (25,000.00)$ - - - - - - (25,000.00)$ - - - - - - - (130,000.00)$ - - - - (130,000.00)$ - - - - - - - (105,000.00)$ - - - - (105,000.00)$ - - - - - - - (230,000.00)$ - - - - (230,000.00)$ - - - - - - - - - - - - (506,000.00)$ - - - - - - - - - - - - (183,000.00)$ - - - - - - - - - - - - (85,000.00)$ - - - - - - - - - - - - (54,000.00)$ - - - - - - - - (135,000.00)$ - - - (135,000.00)$ - - - - - - - - (112,500.00)$ - - - (112,500.00)$ - - - - - - - - - - - - (150,000.00)$ - - - - - - - - - (127,500.00)$ - - (127,500.00)$ - - - - - - - - - - - - (234,624.60)$ - - - - - - - - - - - - (95,000.00)$ - - - - - - - - - - - - 172,500.00$ - - - - - - - - - - - - (77,500.00)$ - - - - - - - - - - - - 406,000.00$
(3,199,072)$ TOTAL SAVINGS OR COSTS
Total Savings or (Costs)Savings or (Costs) if Call Is Exercised

Coal Hedging Analysis January 15, 2010
Appendix G2005
Page 1 of 6
South Carolina Electric & Gas CompanySpot Coal Purchases Compared to Call Options
2005
Delivery Tonnage Per MonthBid Supplier Coal Month(s) Jan Feb March April May June July Aug Sept Oct Nov Dec
Dec-04 Supplier CCC $73.62 Feb-05 50,000 2.00$ Jan-05 Supplier A $53.50 Jan-05 20,000 2.00$ Jan-05 Supplier B $55.00 Feb 05 20,000 2.00$
Feb-05 Supplier B $54.00 Feb 05 20,000 2.00$ Jan-05 Supplier A $54.00 Feb-June 05 10,000 10,000 10,000 10,000 10,000 2.00$
Feb-05 Supplier E $54.25 Mar 05 30,000 2.00$ Feb-05 Supplier V $54.87 Feb 05 10,000 2.00$ Mar-05 Supplier B $56.00 Mar 05 10,000 2.00$ Mar-05 Supplier B $56.00 Mar 05 10,000 2.00$ Mar-05 Supplier B $56.00 Mar 05 10,000 2.00$ Jun-05 Supplier T $54.00 June 05 20,000 2.00$ Jun-05 Supplier I $56.00 June 05 20,000 10,000 2.00$ Jun-05 Supplier W $54.55 June 05 10,000 2.00$
May-27 Supplier X $52.00 July 05 10,000 2.00$ Jul-05 Supplier Y $54.00 July-Sept 2,000 20,000 20,000 2.00$
Aug-05 Supplier Z $47.00 August 800 2.00$ Aug-05 Supplier Z $67.25 August 6,000 2.00$ Oct-05 Supplier A $55.00 Nov-05 thru Jan06 18,000 18,000 2.00$ Oct-05 Supplier E $46.00 October 1,700 2.00$
Nov-05 Supplier O $39.00 Dec 05 / Jan 06 9,000 2.00$
Option Prermium

Coal Hedging Analysis January 15, 2010
Appendix G2005
Page 2 of 6
Bid Supplier
Dec-04 Supplier CCCJan-05 Supplier AJan-05 Supplier B
Feb-05 Supplier BJan-05 Supplier A
Feb-05 Supplier EFeb-05 Supplier VMar-05 Supplier BMar-05 Supplier BMar-05 Supplier BJun-05 Supplier TJun-05 Supplier IJun-05 Supplier W
May-27 Supplier XJul-05 Supplier Y
Aug-05 Supplier ZAug-05 Supplier ZOct-05 Supplier AOct-05 Supplier E
Nov-05 Supplier O
Jan Feb Mar April May June July Aug Sept Oct Nov Dec
59.25$ 56.00$
56.00$ 56.00$ 56.00$ 56.50$ 57.50$ 57.50$ 57.50$
56.50$ 56.50$
59.75$ 59.75$ 59.75$
56.50$ 56.50$ 56.50$ 56.50$
63.50$ 54.00$ 54.00$ 54.00$
55.75$ 55.75$
56.75$ 56.75$ 56.75$
56.75$
Futures Price from UPI Futures Price Sheet
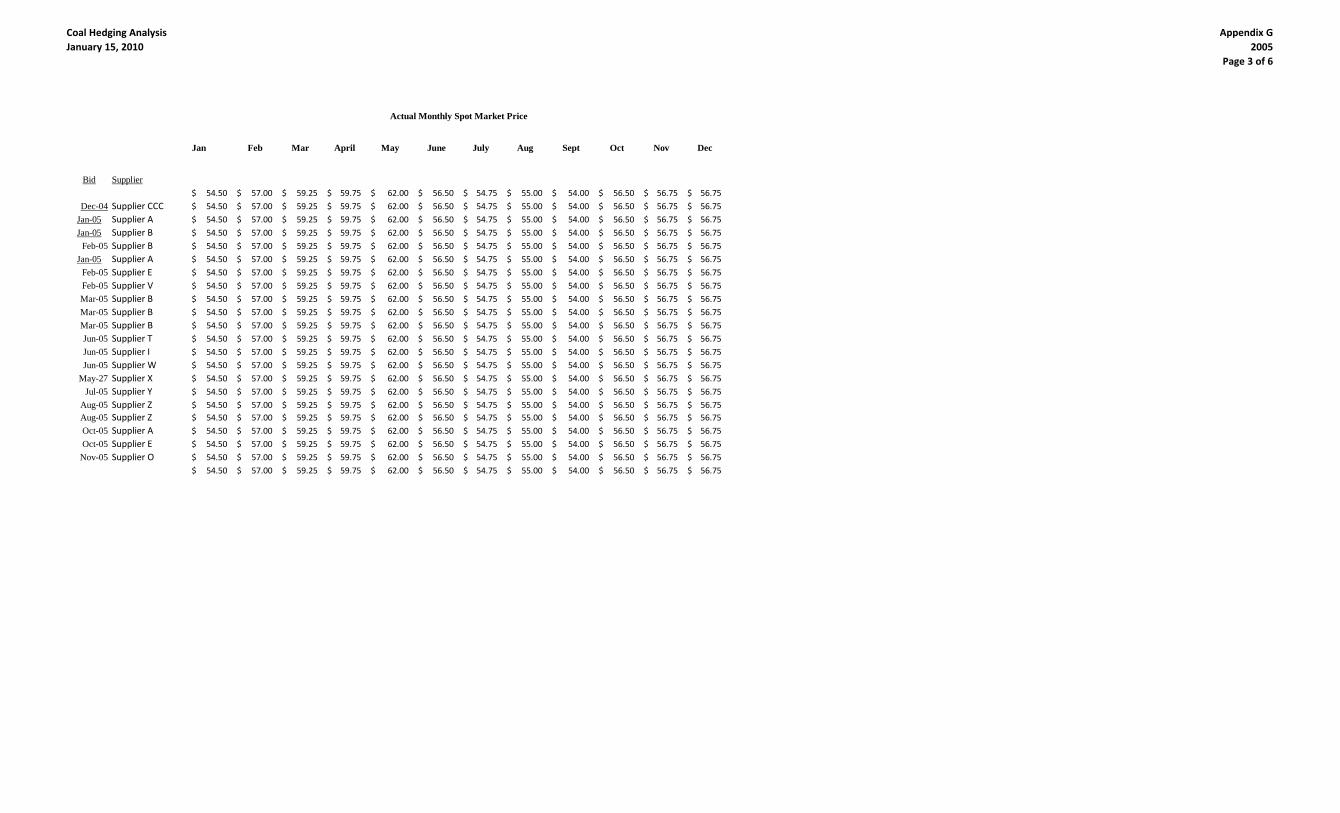
Coal Hedging Analysis January 15, 2010
Appendix G2005
Page 3 of 6
Bid Supplier
Dec-04 Supplier CCCJan-05 Supplier AJan-05 Supplier B
Feb-05 Supplier BJan-05 Supplier A
Feb-05 Supplier EFeb-05 Supplier VMar-05 Supplier BMar-05 Supplier BMar-05 Supplier BJun-05 Supplier TJun-05 Supplier IJun-05 Supplier W
May-27 Supplier XJul-05 Supplier Y
Aug-05 Supplier ZAug-05 Supplier ZOct-05 Supplier AOct-05 Supplier E
Nov-05 Supplier O
Jan Feb Mar April May June July Aug Sept Oct Nov Dec
54.50$ 57.00$ 59.25$ 59.75$ 62.00$ 56.50$ 54.75$ 55.00$ 54.00$ 56.50$ 56.75$ 56.75$ 54.50$ 57.00$ 59.25$ 59.75$ 62.00$ 56.50$ 54.75$ 55.00$ 54.00$ 56.50$ 56.75$ 56.75$ 54.50$ 57.00$ 59.25$ 59.75$ 62.00$ 56.50$ 54.75$ 55.00$ 54.00$ 56.50$ 56.75$ 56.75$ 54.50$ 57.00$ 59.25$ 59.75$ 62.00$ 56.50$ 54.75$ 55.00$ 54.00$ 56.50$ 56.75$ 56.75$ 54.50$ 57.00$ 59.25$ 59.75$ 62.00$ 56.50$ 54.75$ 55.00$ 54.00$ 56.50$ 56.75$ 56.75$ 54.50$ 57.00$ 59.25$ 59.75$ 62.00$ 56.50$ 54.75$ 55.00$ 54.00$ 56.50$ 56.75$ 56.75$ 54.50$ 57.00$ 59.25$ 59.75$ 62.00$ 56.50$ 54.75$ 55.00$ 54.00$ 56.50$ 56.75$ 56.75$ 54.50$ 57.00$ 59.25$ 59.75$ 62.00$ 56.50$ 54.75$ 55.00$ 54.00$ 56.50$ 56.75$ 56.75$ 54.50$ 57.00$ 59.25$ 59.75$ 62.00$ 56.50$ 54.75$ 55.00$ 54.00$ 56.50$ 56.75$ 56.75$ 54.50$ 57.00$ 59.25$ 59.75$ 62.00$ 56.50$ 54.75$ 55.00$ 54.00$ 56.50$ 56.75$ 56.75$ 54.50$ 57.00$ 59.25$ 59.75$ 62.00$ 56.50$ 54.75$ 55.00$ 54.00$ 56.50$ 56.75$ 56.75$ 54.50$ 57.00$ 59.25$ 59.75$ 62.00$ 56.50$ 54.75$ 55.00$ 54.00$ 56.50$ 56.75$ 56.75$ 54.50$ 57.00$ 59.25$ 59.75$ 62.00$ 56.50$ 54.75$ 55.00$ 54.00$ 56.50$ 56.75$ 56.75$ 54.50$ 57.00$ 59.25$ 59.75$ 62.00$ 56.50$ 54.75$ 55.00$ 54.00$ 56.50$ 56.75$ 56.75$ 54.50$ 57.00$ 59.25$ 59.75$ 62.00$ 56.50$ 54.75$ 55.00$ 54.00$ 56.50$ 56.75$ 56.75$ 54.50$ 57.00$ 59.25$ 59.75$ 62.00$ 56.50$ 54.75$ 55.00$ 54.00$ 56.50$ 56.75$ 56.75$ 54.50$ 57.00$ 59.25$ 59.75$ 62.00$ 56.50$ 54.75$ 55.00$ 54.00$ 56.50$ 56.75$ 56.75$ 54.50$ 57.00$ 59.25$ 59.75$ 62.00$ 56.50$ 54.75$ 55.00$ 54.00$ 56.50$ 56.75$ 56.75$ 54.50$ 57.00$ 59.25$ 59.75$ 62.00$ 56.50$ 54.75$ 55.00$ 54.00$ 56.50$ 56.75$ 56.75$ 54.50$ 57.00$ 59.25$ 59.75$ 62.00$ 56.50$ 54.75$ 55.00$ 54.00$ 56.50$ 56.75$ 56.75$ 54.50$ 57.00$ 59.25$ 59.75$ 62.00$ 56.50$ 54.75$ 55.00$ 54.00$ 56.50$ 56.75$ 56.75$ 54.50$ 57.00$ 59.25$ 59.75$ 62.00$ 56.50$ 54.75$ 55.00$ 54.00$ 56.50$ 56.75$ 56.75$
Actual Monthly Spot Market Price

Coal Hedging Analysis January 15, 2010
Appendix G2005
Page 4 of 6
Bid Supplier
Dec-04 Supplier CCCJan-05 Supplier AJan-05 Supplier B
Feb-05 Supplier BJan-05 Supplier A
Feb-05 Supplier EFeb-05 Supplier VMar-05 Supplier BMar-05 Supplier BMar-05 Supplier BJun-05 Supplier TJun-05 Supplier IJun-05 Supplier W
May-27 Supplier XJul-05 Supplier Y
Aug-05 Supplier ZAug-05 Supplier ZOct-05 Supplier AOct-05 Supplier E
Nov-05 Supplier O
Jan Feb Mar April May June July Aug Sept Oct Nov Dec
- - - - - - - - - - - -- no - - - - - - - - - -no - - - - - - - - - - -- yes - - - - - - - - - -- yes - - - - - - - - - -- yes yes yes yes no - - - - - -- - yes - - - - - - - - -- yes - - - - - - - - - -- - no - - - - - - - - -- - no - - - - - - - - -- - no - - - - - - - - -- - - - - yes - - - - - -- - - - - yes no - - - - -- - - - - yes - - - - - -- - - - - - no - - - - -- - - - - - yes yes yes - - -- - - - - - - no - - - -- - - - - - - no - - - -- - - - - - - - - - yes yes- - - - - - - - - no - -- - - - - - - - - - - yes- - - - - - - - - - - -
Exercise Call Option?
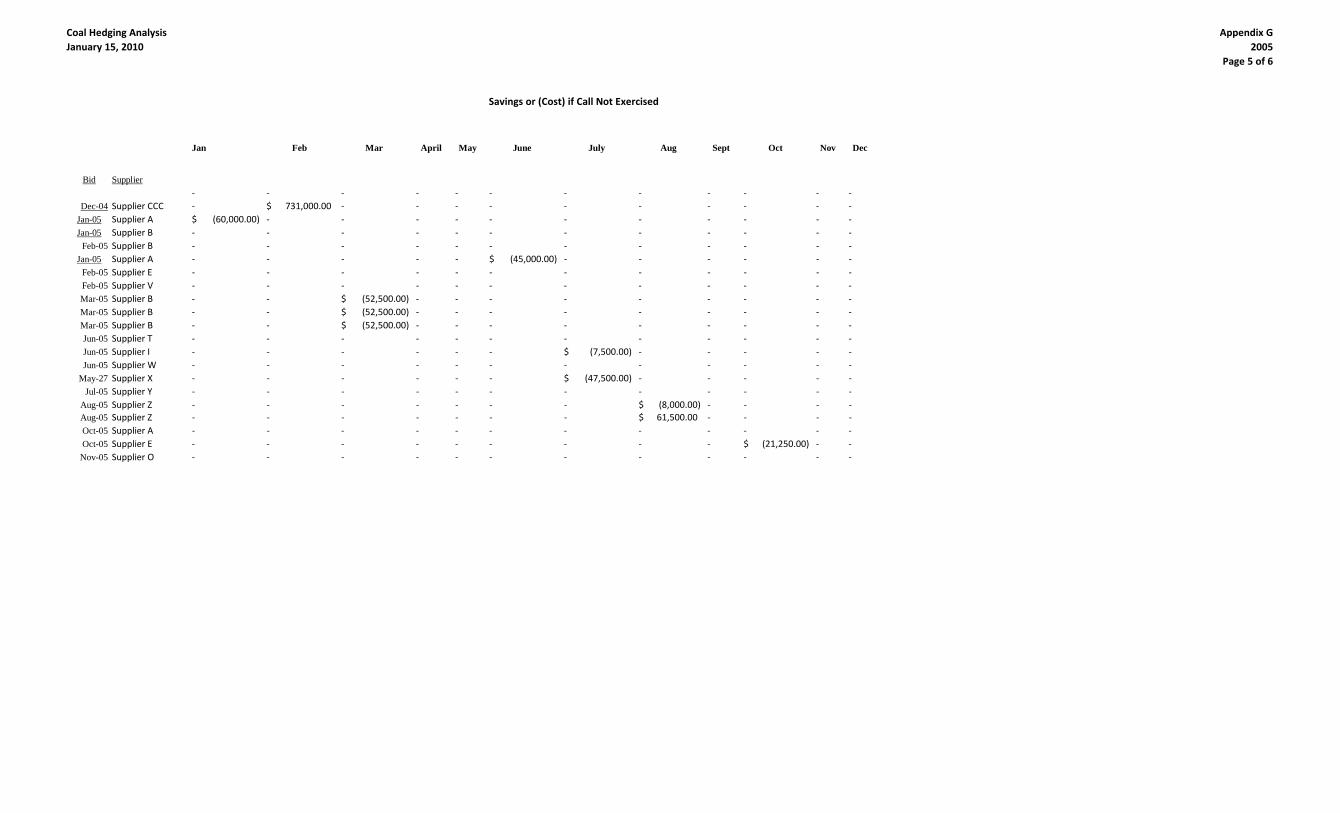
Coal Hedging Analysis January 15, 2010
Appendix G2005
Page 5 of 6
Bid Supplier
Dec-04 Supplier CCCJan-05 Supplier AJan-05 Supplier B
Feb-05 Supplier BJan-05 Supplier A
Feb-05 Supplier EFeb-05 Supplier VMar-05 Supplier BMar-05 Supplier BMar-05 Supplier BJun-05 Supplier TJun-05 Supplier IJun-05 Supplier W
May-27 Supplier XJul-05 Supplier Y
Aug-05 Supplier ZAug-05 Supplier ZOct-05 Supplier AOct-05 Supplier E
Nov-05 Supplier O
Jan Feb Mar April May June July Aug Sept Oct Nov Dec
- - - - - - - - - - - -- 731,000.00$ - - - - - - - - - -
(60,000.00)$ - - - - - - - - - - -- - - - - - - - - - - -- - - - - - - - - - - -- - - - - (45,000.00)$ - - - - - -- - - - - - - - - - - -- - - - - - - - - - - -- - (52,500.00)$ - - - - - - - - -- - (52,500.00)$ - - - - - - - - -- - (52,500.00)$ - - - - - - - - -- - - - - - - - - - - -- - - - - - (7,500.00)$ - - - - -- - - - - - - - - - - -- - - - - - (47,500.00)$ - - - - -- - - - - - - - - - - -- - - - - - - (8,000.00)$ - - - -- - - - - - - 61,500.00$ - - - -- - - - - - - - - - - -- - - - - - - - - (21,250.00)$ - -- - - - - - - - - - - -
Savings or (Cost) if Call Not Exercised

Coal Hedging Analysis January 15, 2010
Appendix G2005
Page 6 of 6
Bid Supplier
Dec-04 Supplier CCCJan-05 Supplier AJan-05 Supplier B
Feb-05 Supplier BJan-05 Supplier A
Feb-05 Supplier EFeb-05 Supplier VMar-05 Supplier BMar-05 Supplier BMar-05 Supplier BJun-05 Supplier TJun-05 Supplier IJun-05 Supplier W
May-27 Supplier XJul-05 Supplier Y
Aug-05 Supplier ZAug-05 Supplier ZOct-05 Supplier AOct-05 Supplier E
Nov-05 Supplier O
Jan Feb Mar April May June July Aug Sept Oct Nov Dec
- - - - - - - - - - - - -$ - - - - - - - - - - - - 731,000.00$ - - - - - - - - - - - - (60,000.00)$ - (60,000.00)$ - - - - - - - - - - (60,000.00)$ - (80,000.00)$ - - - - - - - - - - (80,000.00)$ - (40,000.00)$ (45,000.00)$ (55,000.00)$ (55,000.00)$ - - - - - - - (240,000.00)$ - - (127,500.00)$ - - - - - - - - - (127,500.00)$ - (36,300.00)$ - - - - - - - - - - (36,300.00)$ - - - - - - - - - - - - (52,500.00)$ - - - - - - - - - - - - (52,500.00)$ - - - - - - - - - - - - (52,500.00)$ - - - - - (90,000.00)$ - - - - - - (90,000.00)$ - - - - - (50,000.00)$ - - - - - - (57,500.00)$ - - - - - (39,500.00)$ - - - - - - (39,500.00)$ - - - - - - - - - - - - (47,500.00)$ - - - - - - (4,000.00)$ (40,000.00)$ (40,000.00)$ - - - (84,000.00)$ - - - - - - - - - - - - (8,000.00)$ - - - - - - - - - - - - 61,500.00$ - - - - - - - - - - (67,500.00)$ (67,500.00)$ (135,000.00)$ - - - - - - - - - - - - (21,250.00)$ - - - - - - - - - - - (177,750.00)$ (177,750.00)$
TOTAL SAVINGS OR COSTS (629,300)$
Savings or (Costs) if Call Is ExercisedSavings or (Costs)
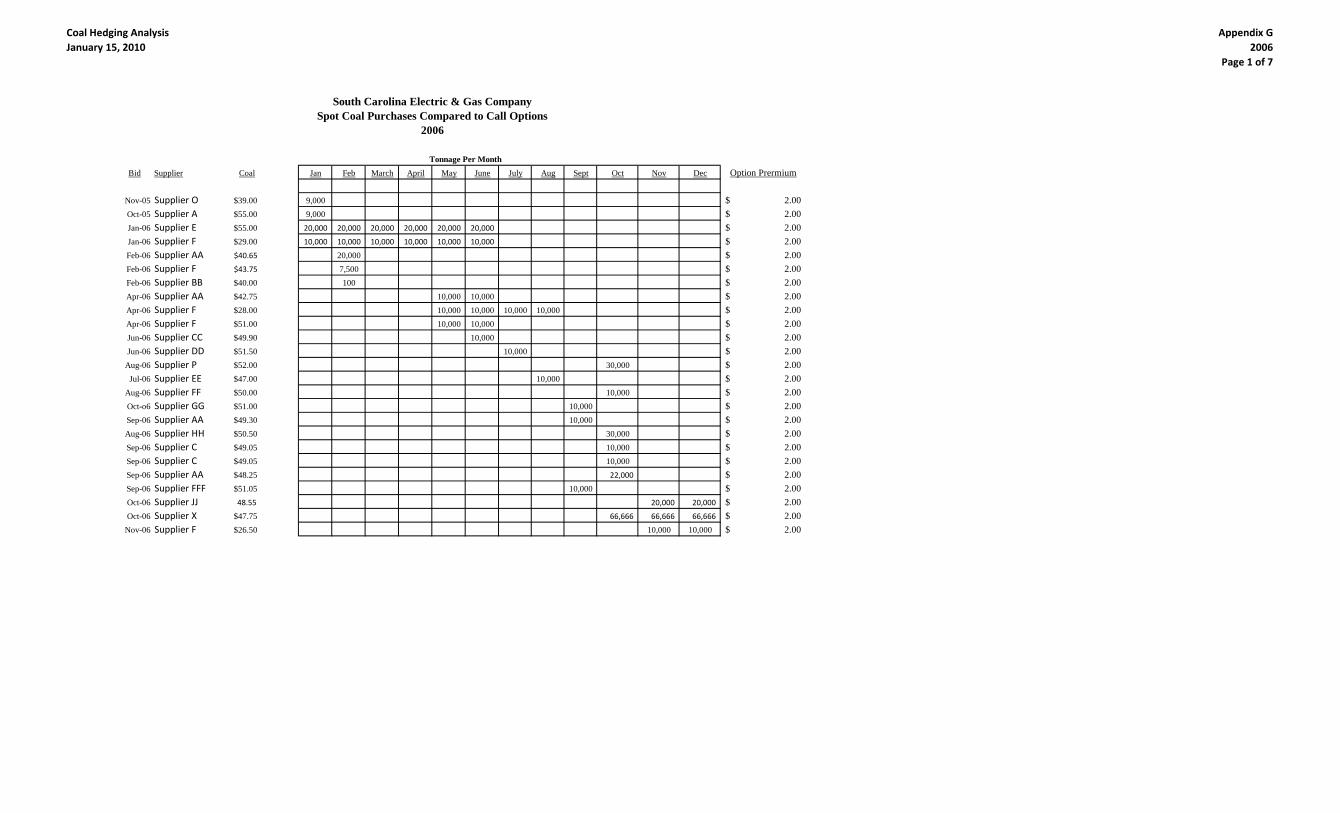
Coal Hedging Analysis January 15, 2010
Appendix G2006
Page 1 of 7
South Carolina Electric & Gas CompanySpot Coal Purchases Compared to Call Options
2006
Bid Supplier Coal Jan Feb March April May June July Aug Sept Oct Nov Dec
Nov-05 Supplier O $39.00 9,000 2.00$ Oct-05 Supplier A $55.00 9,000 2.00$ Jan-06 Supplier E $55.00 20,000 20,000 20,000 20,000 20,000 20,000 2.00$ Jan-06 Supplier F $29.00 10,000 10,000 10,000 10,000 10,000 10,000 2.00$ Feb-06 Supplier AA $40.65 20,000 2.00$ Feb-06 Supplier F $43.75 7,500 2.00$ Feb-06 Supplier BB $40.00 100 2.00$ Apr-06 Supplier AA $42.75 10,000 10,000 2.00$ Apr-06 Supplier F $28.00 10,000 10,000 10,000 10,000 2.00$ Apr-06 Supplier F $51.00 10,000 10,000 2.00$ Jun-06 Supplier CC $49.90 10,000 2.00$ Jun-06 Supplier DD $51.50 10,000 2.00$
Aug-06 Supplier P $52.00 30,000 2.00$ Jul-06 Supplier EE $47.00 10,000 2.00$
Aug-06 Supplier FF $50.00 10,000 2.00$ Oct-o6 Supplier GG $51.00 10,000 2.00$ Sep-06 Supplier AA $49.30 10,000 2.00$ Aug-06 Supplier HH $50.50 30,000 2.00$ Sep-06 Supplier C $49.05 10,000 2.00$ Sep-06 Supplier C $49.05 10,000 2.00$ Sep-06 Supplier AA $48.25 22,000 2.00$ Sep-06 Supplier FFF $51.05 10,000 2.00$ Oct-06 Supplier JJ 48.55 20,000 20,000 2.00$ Oct-06 Supplier X $47.75 66,666 66,666 66,666 2.00$
Nov-06 Supplier F $26.50 10,000 10,000 2.00$
Tonnage Per MonthOption Prermium

Coal Hedging Analysis January 15, 2010
Appendix G2006
Page 2 of 7
Bid Supplier
Nov-05 Supplier OOct-05 Supplier AJan-06 Supplier EJan-06 Supplier FFeb-06 Supplier AAFeb-06 Supplier FFeb-06 Supplier BBApr-06 Supplier AAApr-06 Supplier FApr-06 Supplier FJun-06 Supplier CCJun-06 Supplier DD
Aug-06 Supplier PJul-06 Supplier EE
Aug-06 Supplier FFOct-o6 Supplier GGSep-06 Supplier AAAug-06 Supplier HHSep-06 Supplier CSep-06 Supplier CSep-06 Supplier AASep-06 Supplier FFFOct-06 Supplier JJOct-06 Supplier X
Nov-06 Supplier F
Jan Feb Mar April May June July Aug Sept Oct Nov Dec
57.00$ 58.00$ 57.75$ 57.75$ 57.75$ 57.75$ 57.75$ 57.75$ 57.75$ 57.75$ 57.75$ 57.75$ 57.75$ 57.75$
57.75$ 57.75$ 57.75$ 57.75$
52.25$ 52.25$ 52.25$ 52.25$
52.25$ 52.25$
50.75$
50.75$
51.50$
49.50$
51.50$
48.50$
48.50$
51.50$
48.50$
48.50$
48.50$
48.50$
48.00$ 48.00$
48.00$ 48.00$ 48.00$
45.50$ 45.50$
Futures Price from UPI Futures Price Sheet

Coal Hedging Analysis January 15, 2010
Appendix G2006
Page 3 of 7
Bid Supplier
Nov-05 Supplier OOct-05 Supplier AJan-06 Supplier EJan-06 Supplier FFeb-06 Supplier AAFeb-06 Supplier FFeb-06 Supplier BBApr-06 Supplier AAApr-06 Supplier FApr-06 Supplier FJun-06 Supplier CCJun-06 Supplier DD
Aug-06 Supplier PJul-06 Supplier EE
Aug-06 Supplier FFOct-o6 Supplier GGSep-06 Supplier AAAug-06 Supplier HHSep-06 Supplier CSep-06 Supplier CSep-06 Supplier AASep-06 Supplier FFFOct-06 Supplier JJOct-06 Supplier X
Nov-06 Supplier F
Jan Feb Mar April May June July Aug Sept Oct Nov Dec
57.75$ 57.75$ 58.00$ 55.00$ 52.00$ 50.25$ 50.50$ 51.50$ 49.00$ 48.75$ 46.00$ 40.75$
57.75$ 57.75$ 58.00$ 55.00$ 52.00$ 50.25$ 50.50$ 51.50$ 49.00$ 48.75$ 46.00$ 40.75$
57.75$ 57.75$ 58.00$ 55.00$ 52.00$ 50.25$ 50.50$ 51.50$ 49.00$ 48.75$ 46.00$ 40.75$
57.75$ 57.75$ 58.00$ 55.00$ 52.00$ 50.25$ 50.50$ 51.50$ 49.00$ 48.75$ 46.00$ 40.75$
57.75$ 57.75$ 58.00$ 55.00$ 52.00$ 50.25$ 50.50$ 51.50$ 49.00$ 48.75$ 46.00$ 40.75$
57.75$ 57.75$ 58.00$ 55.00$ 52.00$ 50.25$ 50.50$ 51.50$ 49.00$ 48.75$ 46.00$ 40.75$
57.75$ 57.75$ 58.00$ 55.00$ 52.00$ 50.25$ 50.50$ 51.50$ 49.00$ 48.75$ 46.00$ 40.75$
57.75$ 57.75$ 58.00$ 55.00$ 52.00$ 50.25$ 50.50$ 51.50$ 49.00$ 48.75$ 46.00$ 40.75$
57.75$ 57.75$ 58.00$ 55.00$ 52.00$ 50.25$ 50.50$ 51.50$ 49.00$ 48.75$ 46.00$ 40.75$
57.75$ 57.75$ 58.00$ 55.00$ 52.00$ 50.25$ 50.50$ 51.50$ 49.00$ 48.75$ 46.00$ 40.75$
57.75$ 57.75$ 58.00$ 55.00$ 52.00$ 50.25$ 50.50$ 51.50$ 49.00$ 48.75$ 46.00$ 40.75$
57.75$ 57.75$ 58.00$ 55.00$ 52.00$ 50.25$ 50.50$ 51.50$ 49.00$ 48.75$ 46.00$ 40.75$
57.75$ 57.75$ 58.00$ 55.00$ 52.00$ 50.25$ 50.50$ 51.50$ 49.00$ 48.75$ 46.00$ 40.75$
57.75$ 57.75$ 58.00$ 55.00$ 52.00$ 50.25$ 50.50$ 51.50$ 49.00$ 48.75$ 46.00$ 40.75$
57.75$ 57.75$ 58.00$ 55.00$ 52.00$ 50.25$ 50.50$ 51.50$ 49.00$ 48.75$ 46.00$ 40.75$
57.75$ 57.75$ 58.00$ 55.00$ 52.00$ 50.25$ 50.50$ 51.50$ 49.00$ 48.75$ 46.00$ 40.75$
57.75$ 57.75$ 58.00$ 55.00$ 52.00$ 50.25$ 50.50$ 51.50$ 49.00$ 48.75$ 46.00$ 40.75$
57.75$ 57.75$ 58.00$ 55.00$ 52.00$ 50.25$ 50.50$ 51.50$ 49.00$ 48.75$ 46.00$ 40.75$
57.75$ 57.75$ 58.00$ 55.00$ 52.00$ 50.25$ 50.50$ 51.50$ 49.00$ 48.75$ 46.00$ 40.75$
57.75$ 57.75$ 58.00$ 55.00$ 52.00$ 50.25$ 50.50$ 51.50$ 49.00$ 48.75$ 46.00$ 40.75$
57.75$ 57.75$ 58.00$ 55.00$ 52.00$ 50.25$ 50.50$ 51.50$ 49.00$ 48.75$ 46.00$ 40.75$
57.75$ 57.75$ 58.00$ 55.00$ 52.00$ 50.25$ 50.50$ 51.50$ 49.00$ 48.75$ 46.00$ 40.75$
57.75$ 57.75$ 58.00$ 55.00$ 52.00$ 50.25$ 50.50$ 51.50$ 49.00$ 48.75$ 46.00$ 40.75$
57.75$ 57.75$ 58.00$ 55.00$ 52.00$ 50.25$ 50.50$ 51.50$ 49.00$ 48.75$ 46.00$ 40.75$
57.75$ 57.75$ 58.00$ 55.00$ 52.00$ 50.25$ 50.50$ 51.50$ 49.00$ 48.75$ 46.00$ 40.75$
Actual Monthly Spot Market Price

Coal Hedging Analysis January 15, 2010
Appendix G2006
Page 4 of 7
Bid Supplier
Nov-05 Supplier OOct-05 Supplier AJan-06 Supplier EJan-06 Supplier FFeb-06 Supplier AAFeb-06 Supplier FFeb-06 Supplier BBApr-06 Supplier AAApr-06 Supplier FApr-06 Supplier FJun-06 Supplier CCJun-06 Supplier DD
Aug-06 Supplier PJul-06 Supplier EE
Aug-06 Supplier FFOct-o6 Supplier GGSep-06 Supplier AAAug-06 Supplier HHSep-06 Supplier CSep-06 Supplier CSep-06 Supplier AASep-06 Supplier FFFOct-06 Supplier JJOct-06 Supplier X
Nov-06 Supplier F
Jan Feb Mar April May June July Aug Sept Oct Nov Dec
yes - - - - - - - - - - -
no - - - - - - - - - - -
yes yes yes no no no - - - - - -
yes yes yes no no no - - - - - -
- yes - - - - - - - - - -
- yes - - - - - - - - - -
- yes - - - - - - - - - -
- yes - - - - - - - - - -
- - - - no no no no - - - -
- - - - no no - - - - - -
- - - - - no - - - - - -
- - - - - - no - - - - -
- - - - - - - - - no - -
- - - - - - - yes - - - -
- - - - - - - - - no - -
- - - - - - - - yes - - -
- - - - - - - - yes - - -
- - - - - - - - - no - -
- - - - - - - - - yes - -
- - - - - - - - - yes - -
- - - - - - - - - yes - -
- - - - - - - - yes - - -
- - - - - - - - - - no no
- - - - - - - - - yes no no
- - - - - - - - - - yes no
Exercise Call Option?

Coal Hedging Analysis January 15, 2010
Appendix G2006
Page 5 of 7
Bid Supplier
Nov-05 Supplier OOct-05 Supplier AJan-06 Supplier EJan-06 Supplier FFeb-06 Supplier AAFeb-06 Supplier FFeb-06 Supplier BBApr-06 Supplier AAApr-06 Supplier FApr-06 Supplier FJun-06 Supplier CCJun-06 Supplier DD
Aug-06 Supplier PJul-06 Supplier EE
Aug-06 Supplier FFOct-o6 Supplier GGSep-06 Supplier AAAug-06 Supplier HHSep-06 Supplier CSep-06 Supplier CSep-06 Supplier AASep-06 Supplier FFFOct-06 Supplier JJOct-06 Supplier X
Nov-06 Supplier F
Jan Feb Mar April May June July Aug Sept Oct Nov Dec
- - - - - - - - - - - -(42,750.00)$ - - - - - - - - - - -
- - - (40,000.00)$ 20,000.00$ 55,000.00$ - - - - - -- - - (280,000.00)$ (250,000.00)$ (232,500.00)$ - - - - - -- - - - - - - - - - - -- - - - - - - - - - - -- - - - - - - - - - - -- - - - - - - - - - - -- - - - (260,000.00)$ (242,500.00)$ (245,000.00)$ (255,000.00)$ - - - -- - - - (30,000.00)$ (12,500.00)$ - - - - - -- - - - - (23,500.00)$ - - - - - -- - - - - - (10,000.00)$ - - - - -- - - - - - - - - 37,500.00$ - -- - - - - - - - - - - -- - - - - - - - - (7,500.00)$ - -- - - - - - - - - - - -- - - - - - - - - - - -- - - - - - - - - (7,500.00)$ - -- - - - - - - - - - - -- - - - - - - - - - - -- - - - - - - - - - - -- - - - - - - - - - - -- - - - - - - - - - 11,000.00$ 116,000.00$ - - - - - - - - - - (16,666.50)$ 333,330.00$ - - - - - - - - - - - (162,500.00)$
Savings or (Cost) if Call Not Exercised

Coal Hedging Analysis January 15, 2010
Appendix G2006
Page 6 of 7
Bid Supplier
Nov-05 Supplier OOct-05 Supplier AJan-06 Supplier EJan-06 Supplier FFeb-06 Supplier AAFeb-06 Supplier FFeb-06 Supplier BBApr-06 Supplier AAApr-06 Supplier FApr-06 Supplier FJun-06 Supplier CCJun-06 Supplier DD
Aug-06 Supplier PJul-06 Supplier EE
Aug-06 Supplier FFOct-o6 Supplier GGSep-06 Supplier AAAug-06 Supplier HHSep-06 Supplier CSep-06 Supplier CSep-06 Supplier AASep-06 Supplier FFFOct-06 Supplier JJOct-06 Supplier X
Nov-06 Supplier F

Coal Hedging Analysis January 15, 2010
Appendix G2006
Page 7 of 7
Bid Supplier
Nov-05 Supplier OOct-05 Supplier AJan-06 Supplier EJan-06 Supplier FFeb-06 Supplier AAFeb-06 Supplier FFeb-06 Supplier BBApr-06 Supplier AAApr-06 Supplier FApr-06 Supplier FJun-06 Supplier CCJun-06 Supplier DD
Aug-06 Supplier PJul-06 Supplier EE
Aug-06 Supplier FFOct-o6 Supplier GGSep-06 Supplier AAAug-06 Supplier HHSep-06 Supplier CSep-06 Supplier CSep-06 Supplier AASep-06 Supplier FFFOct-06 Supplier JJOct-06 Supplier X
Nov-06 Supplier F
Jan Feb Mar April May June July Aug Sept Oct Nov Dec
(180,000.00)$ - - - - - - - - - - - (180,000.00)$ - - - - - - - - - - - - (42,750.00)$
(95,000.00)$ (95,000.00)$ (95,000.00)$ - - - - - - - - - (250,000.00)$ (307,500.00)$ (307,500.00)$ (307,500.00)$ - - - - - - - - - (1,685,000.00)$
- (382,000.00)$ - - - - - - - - - - (382,000.00)$ - (120,000.00)$ - - - - - - - - - - (120,000.00)$ - (1,975.00)$ - - - - - - - - - - (1,975.00)$ - -$ - - - - - - - - - - -$ - - - - - - - - - - - - (1,002,500.00)$ - - - - - - - - - - - - (42,500.00)$ - - - - - - - - - - - - (23,500.00)$ - - - - - - - - - - - - (10,000.00)$ - - - - - - - - - - - - 37,500.00$ - - - - - - - (45,000.00)$ - - - - (45,000.00)$ - - - - - - - - - - - - (7,500.00)$ - - - - - - - - 5,000.00$ - - - 5,000.00$ - - - - - - - - (12,000.00)$ - - - (12,000.00)$ - - - - - - - - - - - - (7,500.00)$ - - - - - - - - - (14,500.00)$ - - (14,500.00)$ - - - - - - - - - (14,500.00)$ - - (14,500.00)$ - - - - - - - - - (49,500.00)$ - - (49,500.00)$ - - - - - - - - 5,500.00$ - - - 5,500.00$ - - - - - - - - - - - - 127,000.00$ - - - - - - - - - (149,998.50)$ - - 166,665.00$ - - - - - - - - - - (210,000.00)$ - (372,500.00)$
TOTAL SAVINGS OR COSTS (3,921,560)$
Savings or (Costs)Savings or (Costs) if Call Is Exercised

Coal Hedging Analysis January 15, 2010
Appendix G2007
Page 1 of 7
South Carolina Electric & Gas CompanySpot Coal Purchases Compared to Call Options
2007
Option Prermium
Bid Supplier Coal Jan Feb March April May June July Aug Sept Oct Nov Dec
Jul-06 Supplier EE $47.00 20,000 20,000 20,000 20,000 20,000 20,000 20,000 20,000 20,000 20,000 20,000 20,000 2.00$ Nov-06 Supplier KK $43.05 10,000 10,000 10,000 2.00$ Nov-06 Supplier F $26.50 10,000 2.00$ Nov-06 Supplier LL $40.80 20,000 2.00$ Nov-06 Supplier MM $44.50 20,000 20,000 20,000 2.00$ Dec-06 Supplier NN $41.05 20,000 2.00$ Dec-06 Supplier JJ $40.55 20,000 2.00$ Dec-06 Supplier AA $47.15 20,000 20,000 33,333 33,333 33,333 33,333 33,333 33,333 2.00$ Feb-07 Supplier OO $39.00 200 2.00$ Apr-07 Supplier F $39.75 10,000 2.00$ Apr-07 Supplier C $43.00 10,000 10,000 2.00$
Sept 07 Supplier PP $44.00 7,500 2.00$
Tonnage Per Month

Coal Hedging Analysis January 15, 2010
Appendix G2007
Page 2 of 7
Bid Supplier
Jul-06 Supplier EENov-06 Supplier KKNov-06 Supplier FNov-06 Supplier LLNov-06 Supplier MMDec-06 Supplier NNDec-06 Supplier JJDec-06 Supplier AAFeb-07 Supplier OOApr-07 Supplier FApr-07 Supplier C
Sept 07 Supplier PP
Jan Feb Mar April May June July Aug Sept Oct Nov Dec
46.75$ 46.75$ 46.75$ 46.75$ 46.75$ 46.75$ 46.75$ 46.75$ 46.75$ 46.75$ 46.75$ 46.75$ 45.65$ 45.75$ 45.75$
45.65$ 45.65$ 45.65$ 45.75$ 45.75$
40.55$ 40.55$
40.55$ 40.75$ 44.25$ 44.25$ 44.25$ 44.75$ 44.75$ 44.75$
36.75$
40.75$
40.75$ 41.00$
42.90$
Futures Price from UPI Futures Price Sheet

Coal Hedging Analysis January 15, 2010
Appendix G2007
Page 3 of 7
Bid Supplier
Jul-06 Supplier EENov-06 Supplier KKNov-06 Supplier FNov-06 Supplier LLNov-06 Supplier MMDec-06 Supplier NNDec-06 Supplier JJDec-06 Supplier AAFeb-07 Supplier OOApr-07 Supplier FApr-07 Supplier C
Sept 07 Supplier PP
Jan Feb Mar April May June July Aug Sept Oct Nov Dec
39.50$ 34.50$ 39.25$ 40.40$ 41.50$ 41.50$ 41.75$ 41.85$ 42.85$ 46.00$ 51.50$ 52.50$
39.50$ 34.50$ 39.25$ 40.40$ 41.50$ 41.50$ 41.75$ 41.85$ 42.85$ 46.00$ 51.50$ 52.50$
39.50$ 34.50$ 39.25$ 40.40$ 41.50$ 41.50$ 41.75$ 41.85$ 42.85$ 46.00$ 51.50$ 52.50$
39.50$ 34.50$ 39.25$ 40.40$ 41.50$ 41.50$ 41.75$ 41.85$ 42.85$ 46.00$ 51.50$ 52.50$
39.50$ 34.50$ 39.25$ 40.40$ 41.50$ 41.50$ 41.75$ 41.85$ 42.85$ 46.00$ 51.50$ 52.50$
39.50$ 34.50$ 39.25$ 40.40$ 41.50$ 41.50$ 41.75$ 41.85$ 42.85$ 46.00$ 51.50$ 52.50$
39.50$ 34.50$ 39.25$ 40.40$ 41.50$ 41.50$ 41.75$ 41.85$ 42.85$ 46.00$ 51.50$ 52.50$
39.50$ 34.50$ 39.25$ 40.40$ 41.50$ 41.50$ 41.75$ 41.85$ 42.85$ 46.00$ 51.50$ 52.50$
39.50$ 34.50$ 39.25$ 40.40$ 41.50$ 41.50$ 41.75$ 41.85$ 42.85$ 46.00$ 51.50$ 52.50$
39.50$ 34.50$ 39.25$ 40.40$ 41.50$ 41.50$ 41.75$ 41.85$ 42.85$ 46.00$ 51.50$ 52.50$
39.50$ 34.50$ 39.25$ 40.40$ 41.50$ 41.50$ 41.75$ 41.85$ 42.85$ 46.00$ 51.50$ 52.50$
39.50$ 34.50$ 39.25$ 40.40$ 41.50$ 41.50$ 41.75$ 41.85$ 42.85$ 46.00$ 51.50$ 52.50$
Actual Monthly Spot Market Price

Coal Hedging Analysis January 15, 2010
Appendix G2007
Page 4 of 7
Bid Supplier
Jul-06 Supplier EENov-06 Supplier KKNov-06 Supplier FNov-06 Supplier LLNov-06 Supplier MMDec-06 Supplier NNDec-06 Supplier JJDec-06 Supplier AAFeb-07 Supplier OOApr-07 Supplier FApr-07 Supplier C
Sept 07 Supplier PP
Jan Feb Mar April May June July Aug Sept Oct Nov Dec
- - - - - - - - - - - -
no no no no no no no no no no yes yes
no no no - - - - - - - - -
no - - - - - - - - - - -
no - - - - - - - - - - -
no no no - - - - - - - - -
no - - - - - - - - - - -
no - - - - - - - - - - -
no no - - - - no no no yes yes yes
- no - - - - - - - - - -
- - - no - - - - - - - -
- - - - yes yes - - - - - -
- - - - - - - - - yes - -
Exercise Call Option?
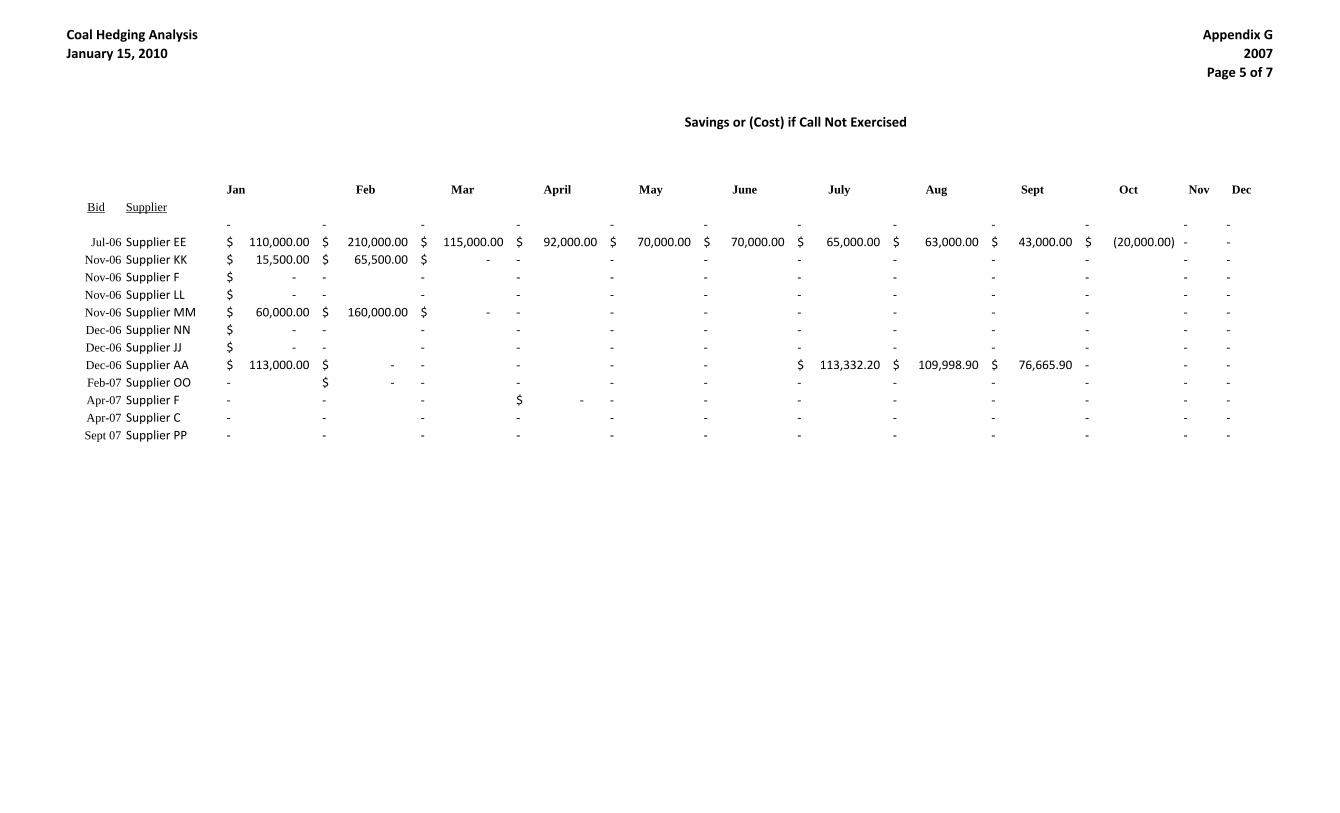
Coal Hedging Analysis January 15, 2010
Appendix G2007
Page 5 of 7
Bid Supplier
Jul-06 Supplier EENov-06 Supplier KKNov-06 Supplier FNov-06 Supplier LLNov-06 Supplier MMDec-06 Supplier NNDec-06 Supplier JJDec-06 Supplier AAFeb-07 Supplier OOApr-07 Supplier FApr-07 Supplier C
Sept 07 Supplier PP
Jan Feb Mar April May June July Aug Sept Oct Nov Dec
- - - - - - - - - - - -110,000.00$ 210,000.00$ 115,000.00$ 92,000.00$ 70,000.00$ 70,000.00$ 65,000.00$ 63,000.00$ 43,000.00$ (20,000.00)$ - -
15,500.00$ 65,500.00$ -$ - - - - - - - - --$ - - - - - - - - - - --$ - - - - - - - - - - -
60,000.00$ 160,000.00$ -$ - - - - - - - - --$ - - - - - - - - - - --$ - - - - - - - - - - -
113,000.00$ -$ - - - - 113,332.20$ 109,998.90$ 76,665.90$ - - -- -$ - - - - - - - - - -- - - -$ - - - - - - - -- - - - - - - - - - - -- - - - - - - - - - - -
Savings or (Cost) if Call Not Exercised
Coal Hedging Analysis January 15, 2010
Appendix G2007
Page 6 of 7
Bid Supplier
Jul-06 Supplier EENov-06 Supplier KKNov-06 Supplier FNov-06 Supplier LLNov-06 Supplier MMDec-06 Supplier NNDec-06 Supplier JJDec-06 Supplier AAFeb-07 Supplier OOApr-07 Supplier FApr-07 Supplier C
Sept 07 Supplier PP

Coal Hedging Analysis January 15, 2010
Appendix G2007
Page 7 of 7
Bid Supplier
Jul-06 Supplier EENov-06 Supplier KKNov-06 Supplier FNov-06 Supplier LLNov-06 Supplier MMDec-06 Supplier NNDec-06 Supplier JJDec-06 Supplier AAFeb-07 Supplier OOApr-07 Supplier FApr-07 Supplier C
Sept 07 Supplier PP
Jan Feb Mar April May June July Aug Sept Oct Nov Dec
- - - - - - - - - - - - -$ - - - - - - - - - - (35,000.00)$ (35,000.00)$ 748,000.00$ - - - - - - - - - - - - 81,000.00$ - - - - - - - - - - - - -$ - - - - - - - - - - - - -$ - - - - - - - - - - - - 220,000.00$ - - - - - - - - - - - - -$ - - - - - - - - - - - - -$ - - - - - - - - - 13,333.20$ 13,333.20$ 13,333.20$ 452,996.60$ - - - - - - - - - - - - -$ - - - - - - - - - - - - -$ - - - - 2,500.00$ -$ - - - - - - 2,500.00$ - - - - - - - - - (6,750.00)$ - -
1,504,497$ TOTAL SAVINGS OR COSTS
Savings or (Costs) if Call Is ExercisedSavings or (Costs)

Coal Hedging Analysis January 15, 2010
Appendix G2008
Page 1 of 12
South Carolina Electric & Gas CompanySpot Coal Purchases Compared to Call Options
2008
Delivery
Bid Supplier Coal Month(s) Jan Feb March April May June July Aug Sept Oct Nov DecOption
Prermium
Apr 07 Supplier C $45.50 Jan - Dec 40,000 40,000 40,000 40,000 40,000 40,000 20,000 20,000 20,000 20,000 20,000 20,000 2.00$ Apr 08 Supplier QQ $88.05 May 10,000 2.00$ Apr 08 Supplier RR $86.05 May 10,000 2.00$ May 08 Supplier SS $98.00 Jul-Dec 10,000 10,000 10,000 10,000 10,000 10,000 2.00$ May 08 Supplier A $105.00 Jun 10,000 2.00$ May 08 Supplier TT $100.00 Jun 10,000 2.00$ Jun 08 Supplier E $128.00 Jun 10,000 2.00$ Jun 08 Supplier A $125.00 Jun 10,000 2.00$ Jun 08 Supplier PP $144.00 Jul 7,500 2.00$ Jul 08 Supplier UU $120.00 Jul 4,500 2.00$ Jul 08 Supplier VV $147.05 Jul 10,000 2.00$ Jul 08 Supplier WW $141.00 Jul 20,000 2.00$ Jul 08 Supplier XX $140.05 Jul 10,000 2.00$ Jul -08 Supplier YY $140.00 Aug-Sep 20,000 20,000 2.00$ Jul 08 Supplier JJ $141.05 Jul 10,000 2.00$ Jul 08 Supplier V $140.00 Jul 10,000 2.00$ Jul 08 Supplier JJ $141.05 Aug 10,000 2.00$ Jul 08 Supplier KK $141.05 Aug 10,000 2.00$ Jul 08 Supplier ZZ $141.05 Aug 10,000 2.00$ Jul 08 Supplier JJ $140.05 Aug 10,000 2.00$ Jul 08 Supplier AAA $141.05 Aug 20,000 2.00$ Jul 08 Supplier BBB $138.50 Jul 10,000 2.00$ Jul 08 Supplier JJ $141.55 Jul 10,000 2.00$ Jul 08 Supplier C 132.5 Jul 20,000 2.00$ Aug 08 Supplier GG $150.00 aug 30,000 2.00$ Aug 08 Supplier CCC $146.50 Aug 10,000 2.00$ "Aug 08 Supplier QQ $135.00 Sep-Dec 10,000 10,000 10,000 30,000 30,000 30,000 2.00$ Aug 08 Supplier DDD $138.00 Sep 10,000 2.00$ Sep 08 Supplier GG $122.00 Sep 20,000 2.00$ Sep 08 Supplier JJ $121.05 Sep 10,000 2.00$ Sep 08 Supplier JJ $121.05 Sep 10,000 2.00$ Sep 08 Supplier QQ $112.00 Oct-Dec 10,000 10,000 10,000 2.00$ Sep 08 Supplier DDD $121.00 Oct-Dec 16,666 16,666 16,666 2.00$ Sep 08 Supplier JJ $121.05 Sep 10,000 2.00$ Sep 08 Supplier C $126.50 Oct-Dec 20,000 20,000 20,000 2.00$ Sep 08 Supplier WW $131.00 Oct 30,000 2.00$ Sep 08 Supplier EEE $147.00 Oct 20,000 2.00$ Sep 08 Supplier V $131.00 Oct-Dec 20,000 20,000 20,000 2.00$ Oct 08 Supplier KK $145.05 Oct 10,000 2.00$
Tonnage Per Month

Coal Hedging Analysis January 15, 2010
Appendix G2008
Page 2 of 12
Oct 08 Supplier FFF $145.05 Oct 10,000 2.00$ Oct 08 Supplier GGG $140.00 Oct 10,000 2.00$ Oct 08 Supplier HHH $125.75 Nov-Dec 20,000 20,000 2.00$ Oct 08 Supplier TT $110.00 Oct 10,000 2.00$ Oct 08 Supplier HHH $103.00 Dec 20,000 2.00$ Oct 08 Supplier NN $104.05 Nov 10,000 2.00$ Oct 08 Supplier NN $104.05 Dec 10,000 2.00$ Nov-08 Supplier C $85.00 Nov-Dec 30,000 30,000 2.00$ Nov-08 Supplier C $78.00 Dec 50,000 2.00$ Nov-08 Supplier WW $79.50 Dec 20,000 2.00$
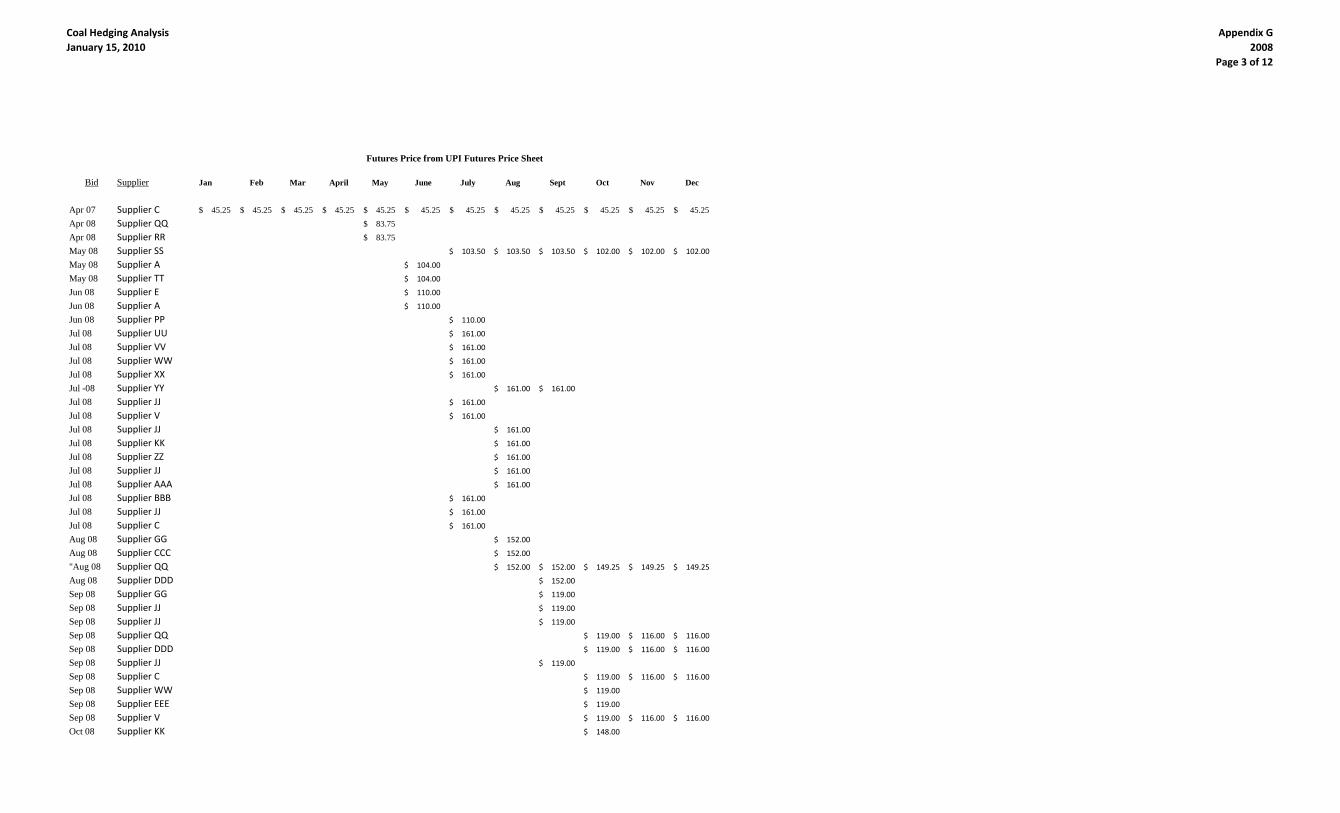
Coal Hedging Analysis January 15, 2010
Appendix G2008
Page 3 of 12
Bid Supplier
Apr 07 Supplier CApr 08 Supplier QQApr 08 Supplier RRMay 08 Supplier SSMay 08 Supplier AMay 08 Supplier TTJun 08 Supplier EJun 08 Supplier AJun 08 Supplier PPJul 08 Supplier UUJul 08 Supplier VVJul 08 Supplier WWJul 08 Supplier XXJul -08 Supplier YYJul 08 Supplier JJJul 08 Supplier VJul 08 Supplier JJJul 08 Supplier KKJul 08 Supplier ZZJul 08 Supplier JJJul 08 Supplier AAAJul 08 Supplier BBBJul 08 Supplier JJJul 08 Supplier CAug 08 Supplier GGAug 08 Supplier CCC"Aug 08 Supplier QQAug 08 Supplier DDDSep 08 Supplier GGSep 08 Supplier JJSep 08 Supplier JJSep 08 Supplier QQSep 08 Supplier DDDSep 08 Supplier JJSep 08 Supplier CSep 08 Supplier WWSep 08 Supplier EEESep 08 Supplier VOct 08 Supplier KK
Jan Feb Mar April May June July Aug Sept Oct Nov Dec
45.25$ 45.25$ 45.25$ 45.25$ 45.25$ 45.25$ 45.25$ 45.25$ 45.25$ 45.25$ 45.25$ 45.25$ 83.75$ 83.75$
103.50$ 103.50$ 103.50$ 102.00$ 102.00$ 102.00$
104.00$
104.00$
110.00$
110.00$
110.00$
161.00$
161.00$
161.00$
161.00$
161.00$ 161.00$
161.00$
161.00$
161.00$
161.00$
161.00$
161.00$
161.00$
161.00$
161.00$
161.00$
152.00$
152.00$
152.00$ 152.00$ 149.25$ 149.25$ 149.25$
152.00$
119.00$
119.00$
119.00$
119.00$ 116.00$ 116.00$
119.00$ 116.00$ 116.00$
119.00$
119.00$ 116.00$ 116.00$
119.00$
119.00$
119.00$ 116.00$ 116.00$
148.00$
Futures Price from UPI Futures Price Sheet

Coal Hedging Analysis January 15, 2010
Appendix G2008
Page 4 of 12
Oct 08 Supplier FFFOct 08 Supplier GGGOct 08 Supplier HHHOct 08 Supplier TTOct 08 Supplier HHHOct 08 Supplier NNOct 08 Supplier NNNov-08 Supplier CNov-08 Supplier CNov-08 Supplier WW
148.00$
148.00$
150.00$ 141.00$
148.00$
141.00$
150.00$
141.00$
87.50$ 87.50$
87.50$
87.50$

Coal Hedging Analysis January 15, 2010
Appendix G2008
Page 5 of 12
Bid Supplier
Apr 07 Supplier CApr 08 Supplier QQApr 08 Supplier RRMay 08 Supplier SSMay 08 Supplier AMay 08 Supplier TTJun 08 Supplier EJun 08 Supplier AJun 08 Supplier PPJul 08 Supplier UUJul 08 Supplier VVJul 08 Supplier WWJul 08 Supplier XXJul -08 Supplier YYJul 08 Supplier JJJul 08 Supplier VJul 08 Supplier JJJul 08 Supplier KKJul 08 Supplier ZZJul 08 Supplier JJJul 08 Supplier AAAJul 08 Supplier BBBJul 08 Supplier JJJul 08 Supplier CAug 08 Supplier GGAug 08 Supplier CCC"Aug 08 Supplier QQAug 08 Supplier DDDSep 08 Supplier GGSep 08 Supplier JJSep 08 Supplier JJSep 08 Supplier QQSep 08 Supplier DDDSep 08 Supplier JJSep 08 Supplier CSep 08 Supplier WWSep 08 Supplier EEESep 08 Supplier VOct 08 Supplier KK
Jan Feb Mar April May June July Aug Sept Oct Nov Dec
50.25$ 75.00$ 89.50$ 86.00$ 96.00$ 111.00$ 154.00$ 156.00$ 135.00$ 148.00$ 96.50$ 75.50$ 50.25$ 75.00$ 89.50$ 86.00$ 96.00$ 111.00$ 154.00$ 156.00$ 135.00$ 148.00$ 96.50$ 75.50$ 50.25$ 75.00$ 89.50$ 86.00$ 96.00$ 111.00$ 154.00$ 156.00$ 135.00$ 148.00$ 96.50$ 75.50$ 50.25$ 75.00$ 89.50$ 86.00$ 96.00$ 111.00$ 154.00$ 156.00$ 135.00$ 148.00$ 96.50$ 75.50$ 50.25$ 75.00$ 89.50$ 86.00$ 96.00$ 111.00$ 154.00$ 156.00$ 135.00$ 148.00$ 96.50$ 75.50$ 50.25$ 75.00$ 89.50$ 86.00$ 96.00$ 111.00$ 154.00$ 156.00$ 135.00$ 148.00$ 96.50$ 75.50$ 50.25$ 75.00$ 89.50$ 86.00$ 96.00$ 111.00$ 154.00$ 156.00$ 135.00$ 148.00$ 96.50$ 75.50$ 50.25$ 75.00$ 89.50$ 86.00$ 96.00$ 111.00$ 154.00$ 156.00$ 135.00$ 148.00$ 96.50$ 75.50$ 50.25$ 75.00$ 89.50$ 86.00$ 96.00$ 111.00$ 154.00$ 156.00$ 135.00$ 148.00$ 96.50$ 75.50$ 50.25$ 75.00$ 89.50$ 86.00$ 96.00$ 111.00$ 154.00$ 156.00$ 135.00$ 148.00$ 96.50$ 75.50$ 50.25$ 75.00$ 89.50$ 86.00$ 96.00$ 111.00$ 154.00$ 156.00$ 135.00$ 148.00$ 96.50$ 75.50$ 50.25$ 75.00$ 89.50$ 86.00$ 96.00$ 111.00$ 154.00$ 156.00$ 135.00$ 148.00$ 96.50$ 75.50$ 50.25$ 75.00$ 89.50$ 86.00$ 96.00$ 111.00$ 154.00$ 156.00$ 135.00$ 148.00$ 96.50$ 75.50$ 50.25$ 75.00$ 89.50$ 86.00$ 96.00$ 111.00$ 154.00$ 156.00$ 135.00$ 148.00$ 96.50$ 75.50$ 50.25$ 75.00$ 89.50$ 86.00$ 96.00$ 111.00$ 154.00$ 156.00$ 135.00$ 148.00$ 96.50$ 75.50$ 50.25$ 75.00$ 89.50$ 86.00$ 96.00$ 111.00$ 154.00$ 156.00$ 135.00$ 148.00$ 96.50$ 75.50$ 50.25$ 75.00$ 89.50$ 86.00$ 96.00$ 111.00$ 154.00$ 156.00$ 135.00$ 148.00$ 96.50$ 75.50$ 50.25$ 75.00$ 89.50$ 86.00$ 96.00$ 111.00$ 154.00$ 156.00$ 135.00$ 148.00$ 96.50$ 75.50$ 50.25$ 75.00$ 89.50$ 86.00$ 96.00$ 111.00$ 154.00$ 156.00$ 135.00$ 148.00$ 96.50$ 75.50$ 50.25$ 75.00$ 89.50$ 86.00$ 96.00$ 111.00$ 154.00$ 156.00$ 135.00$ 148.00$ 96.50$ 75.50$ 50.25$ 75.00$ 89.50$ 86.00$ 96.00$ 111.00$ 154.00$ 156.00$ 135.00$ 148.00$ 96.50$ 75.50$ 50.25$ 75.00$ 89.50$ 86.00$ 96.00$ 111.00$ 154.00$ 156.00$ 135.00$ 148.00$ 96.50$ 75.50$ 50.25$ 75.00$ 89.50$ 86.00$ 96.00$ 111.00$ 154.00$ 156.00$ 135.00$ 148.00$ 96.50$ 75.50$ 50.25$ 75.00$ 89.50$ 86.00$ 96.00$ 111.00$ 154.00$ 156.00$ 135.00$ 148.00$ 96.50$ 75.50$ 50.25$ 75.00$ 89.50$ 86.00$ 96.00$ 111.00$ 154.00$ 156.00$ 135.00$ 148.00$ 96.50$ 75.50$ 50.25$ 75.00$ 89.50$ 86.00$ 96.00$ 111.00$ 154.00$ 156.00$ 135.00$ 148.00$ 96.50$ 75.50$ 50.25$ 75.00$ 89.50$ 86.00$ 96.00$ 111.00$ 154.00$ 156.00$ 135.00$ 148.00$ 96.50$ 75.50$ 50.25$ 75.00$ 89.50$ 86.00$ 96.00$ 111.00$ 154.00$ 156.00$ 135.00$ 148.00$ 96.50$ 75.50$ 50.25$ 75.00$ 89.50$ 86.00$ 96.00$ 111.00$ 154.00$ 156.00$ 135.00$ 148.00$ 96.50$ 75.50$ 50.25$ 75.00$ 89.50$ 86.00$ 96.00$ 111.00$ 154.00$ 156.00$ 135.00$ 148.00$ 96.50$ 75.50$ 50.25$ 75.00$ 89.50$ 86.00$ 96.00$ 111.00$ 154.00$ 156.00$ 135.00$ 148.00$ 96.50$ 75.50$ 50.25$ 75.00$ 89.50$ 86.00$ 96.00$ 111.00$ 154.00$ 156.00$ 135.00$ 148.00$ 96.50$ 75.50$ 50.25$ 75.00$ 89.50$ 86.00$ 96.00$ 111.00$ 154.00$ 156.00$ 135.00$ 148.00$ 96.50$ 75.50$ 50.25$ 75.00$ 89.50$ 86.00$ 96.00$ 111.00$ 154.00$ 156.00$ 135.00$ 148.00$ 96.50$ 75.50$ 50.25$ 75.00$ 89.50$ 86.00$ 96.00$ 111.00$ 154.00$ 156.00$ 135.00$ 148.00$ 96.50$ 75.50$ 50.25$ 75.00$ 89.50$ 86.00$ 96.00$ 111.00$ 154.00$ 156.00$ 135.00$ 148.00$ 96.50$ 75.50$ 50.25$ 75.00$ 89.50$ 86.00$ 96.00$ 111.00$ 154.00$ 156.00$ 135.00$ 148.00$ 96.50$ 75.50$ 50.25$ 75.00$ 89.50$ 86.00$ 96.00$ 111.00$ 154.00$ 156.00$ 135.00$ 148.00$ 96.50$ 75.50$ 50.25$ 75.00$ 89.50$ 86.00$ 96.00$ 111.00$ 154.00$ 156.00$ 135.00$ 148.00$ 96.50$ 75.50$
Actual Monthly Spot Market Price

Coal Hedging Analysis January 15, 2010
Appendix G2008
Page 6 of 12
Oct 08 Supplier FFFOct 08 Supplier GGGOct 08 Supplier HHHOct 08 Supplier TTOct 08 Supplier HHHOct 08 Supplier NNOct 08 Supplier NNNov-08 Supplier CNov-08 Supplier CNov-08 Supplier WW
50.25$ 75.00$ 89.50$ 86.00$ 96.00$ 111.00$ 154.00$ 156.00$ 135.00$ 148.00$ 96.50$ 75.50$ 50.25$ 75.00$ 89.50$ 86.00$ 96.00$ 111.00$ 154.00$ 156.00$ 135.00$ 148.00$ 96.50$ 75.50$ 50.25$ 75.00$ 89.50$ 86.00$ 96.00$ 111.00$ 154.00$ 156.00$ 135.00$ 148.00$ 96.50$ 75.50$ 50.25$ 75.00$ 89.50$ 86.00$ 96.00$ 111.00$ 154.00$ 156.00$ 135.00$ 148.00$ 96.50$ 75.50$ 50.25$ 75.00$ 89.50$ 86.00$ 96.00$ 111.00$ 154.00$ 156.00$ 135.00$ 148.00$ 96.50$ 75.50$ 50.25$ 75.00$ 89.50$ 86.00$ 96.00$ 111.00$ 154.00$ 156.00$ 135.00$ 148.00$ 96.50$ 75.50$ 50.25$ 75.00$ 89.50$ 86.00$ 96.00$ 111.00$ 154.00$ 156.00$ 135.00$ 148.00$ 96.50$ 75.50$ 50.25$ 75.00$ 89.50$ 86.00$ 96.00$ 111.00$ 154.00$ 156.00$ 135.00$ 148.00$ 96.50$ 75.50$ 50.25$ 75.00$ 89.50$ 86.00$ 96.00$ 111.00$ 154.00$ 156.00$ 135.00$ 148.00$ 96.50$ 75.50$ 50.25$ 75.00$ 89.50$ 86.00$ 96.00$ 111.00$ 154.00$ 156.00$ 135.00$ 148.00$ 96.50$ 75.50$

Coal Hedging Analysis January 15, 2010
Appendix G2008
Page 7 of 12
Bid Supplier
Apr 07 Supplier CApr 08 Supplier QQApr 08 Supplier RRMay 08 Supplier SSMay 08 Supplier AMay 08 Supplier TTJun 08 Supplier EJun 08 Supplier AJun 08 Supplier PPJul 08 Supplier UUJul 08 Supplier VVJul 08 Supplier WWJul 08 Supplier XXJul -08 Supplier YYJul 08 Supplier JJJul 08 Supplier VJul 08 Supplier JJJul 08 Supplier KKJul 08 Supplier ZZJul 08 Supplier JJJul 08 Supplier AAAJul 08 Supplier BBBJul 08 Supplier JJJul 08 Supplier CAug 08 Supplier GGAug 08 Supplier CCC"Aug 08 Supplier QQAug 08 Supplier DDDSep 08 Supplier GGSep 08 Supplier JJSep 08 Supplier JJSep 08 Supplier QQSep 08 Supplier DDDSep 08 Supplier JJSep 08 Supplier CSep 08 Supplier WWSep 08 Supplier EEESep 08 Supplier VOct 08 Supplier KK
Jan Feb Mar April May June July Aug Sept Oct Nov Dec
yes yes yes yes yes yes yes yes yes yes yes yes
- - - - yes - - - - - - -
- - - - yes - - - - - - -
- - - - - - yes yes yes yes no no
- - - - - yes - - - - - -
- - - - - yes - - - - - -
- - - - - yes - - - - - -
- - - - - yes - - - - - -
- - - - - - yes - - - - -
- - - - - - no - - - - -
- - - - - - no - - - - -
- - - - - - no - - - - -
- - - - - - no - - - - -
- - - - - - - no no - - -
- - - - - - no - - - - -
- - - - - - no - - - - -
- - - - - - - no - - - -
- - - - - - - no - - - -
- - - - - - - no - - - -
- - - - - - - no - - - -
- - - - - - - no - - - -
- - - - - - no - - - - -
- - - - - - no - - - - -
- - - - - - no - - - - -
- - - - - - - yes - - - -
- - - - - - - yes - - - -
- - - - - - - yes no no no no
- - - - - - - - no - - -
- - - - - - - - yes - - -
- - - - - - - - yes - - -
- - - - - - - - yes - - -
- - - - - - - - - yes no no
- - - - - - - - - yes no no
- - - - - - - - yes - - -
- - - - - - - - - yes no no
- - - - - - - - - yes - -
- - - - - - - - - yes - -
- - - - - - - - - yes no no
- - - - - - - - - yes - -
Exercise Call Option?
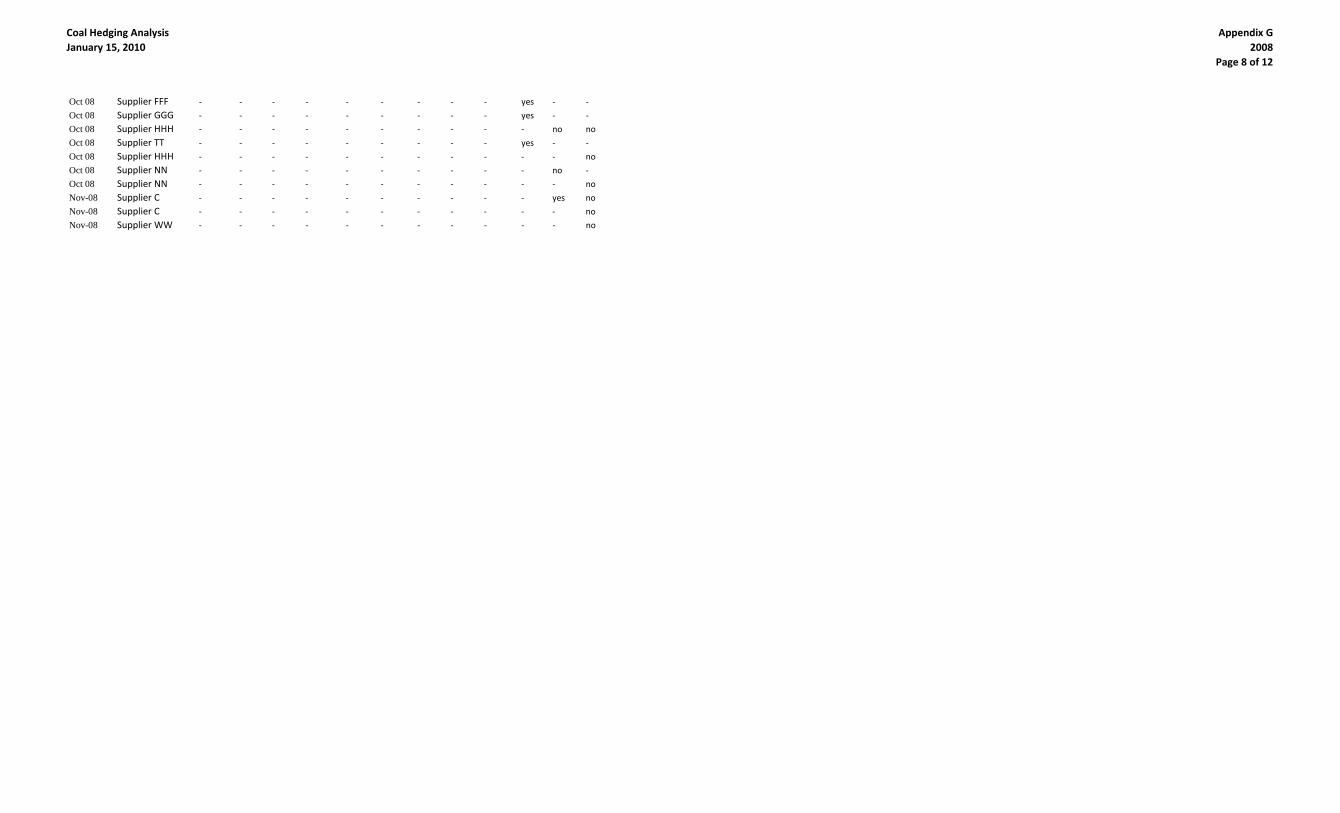
Coal Hedging Analysis January 15, 2010
Appendix G2008
Page 8 of 12
Oct 08 Supplier FFFOct 08 Supplier GGGOct 08 Supplier HHHOct 08 Supplier TTOct 08 Supplier HHHOct 08 Supplier NNOct 08 Supplier NNNov-08 Supplier CNov-08 Supplier CNov-08 Supplier WW
- - - - - - - - - yes - -
- - - - - - - - - yes - -
- - - - - - - - - - no no
- - - - - - - - - yes - -
- - - - - - - - - - - no
- - - - - - - - - - no -
- - - - - - - - - - - no
- - - - - - - - - - yes no
- - - - - - - - - - - no
- - - - - - - - - - - no

Coal Hedging Analysis January 15, 2010
Appendix G2008
Page 9 of 12
Bid Supplier
Apr 07 Supplier CApr 08 Supplier QQApr 08 Supplier RRMay 08 Supplier SSMay 08 Supplier AMay 08 Supplier TTJun 08 Supplier EJun 08 Supplier AJun 08 Supplier PPJul 08 Supplier UUJul 08 Supplier VVJul 08 Supplier WWJul 08 Supplier XXJul -08 Supplier YYJul 08 Supplier JJJul 08 Supplier VJul 08 Supplier JJJul 08 Supplier KKJul 08 Supplier ZZJul 08 Supplier JJJul 08 Supplier AAAJul 08 Supplier BBBJul 08 Supplier JJJul 08 Supplier CAug 08 Supplier GGAug 08 Supplier CCC"Aug 08 Supplier QQAug 08 Supplier DDDSep 08 Supplier GGSep 08 Supplier JJSep 08 Supplier JJSep 08 Supplier QQSep 08 Supplier DDDSep 08 Supplier JJSep 08 Supplier CSep 08 Supplier WWSep 08 Supplier EEESep 08 Supplier VOct 08 Supplier KK
Jan Feb Mar April May June July Aug Sept Oct Nov Dec
- - - - - - - - - - - -- - - - - - - - - - - -- - - - - - - - - - - -- - - - - - - - - - (5,000.00)$ 205,000.00$ - - - - - - - - - - - -- - - - - - - - - - - -- - - - - - - - - - - -- - - - - - - - - - - -- - - - - - - - - - - -- - - - - - (162,000.00)$ - - - - -- - - - - - (89,500.00)$ - - - - -- - - - - - (300,000.00)$ - - - - -- - - - - - (159,500.00)$ - - - - -- - - - - - - (360,000.00)$ 60,000.00$ - - -- - - - - - (149,500.00)$ - - - - -- - - - - - (160,000.00)$ - - - - -- - - - - - - (169,500.00)$ - - - -- - - - - - - (169,500.00)$ - - - -- - - - - - - (169,500.00)$ - - - -- - - - - - - (179,500.00)$ - - - -- - - - - - - (339,000.00)$ - - - -- - - - - - (175,000.00)$ - - - - -- - - - - - (144,500.00)$ - - - - -- - - - - - (470,000.00)$ - - - - -- - - - - - - - - - - -- - - - - - - - - - - -- - - - - - - - (20,000.00)$ (450,000.00)$ 1,095,000.00$ 1,725,000.00$ - - - - - - - - 10,000.00$ - - -- - - - - - - - - - - -- - - - - - - - - - - -- - - - - - - - - - - -- - - - - - - - - - 135,000.00$ 345,000.00$ - - - - - - - - - - 374,985.00$ 724,971.00$ - - - - - - - - - - - -- - - - - - - - - - 560,000.00$ 980,000.00$ - - - - - - - - - - - -- - - - - - - - - - - -- - - - - - - - - - 650,000.00$ 1,070,000.00$ - - - - - - - - - - - -
Savings or (Cost) if Call Not Exercised

Coal Hedging Analysis January 15, 2010
Appendix G2008
Page 10 of 12
Oct 08 Supplier FFFOct 08 Supplier GGGOct 08 Supplier HHHOct 08 Supplier TTOct 08 Supplier HHHOct 08 Supplier NNOct 08 Supplier NNNov-08 Supplier CNov-08 Supplier CNov-08 Supplier WW
- - - - - - - - - - - -- - - - - - - - - - - -- - - - - - - - - - 545,000.00$ 965,000.00$ - - - - - - - - - - - -- - - - - - - - - - - 510,000.00$ - - - - - - - - - - 55,500.00$ -- - - - - - - - - - - 265,500.00$ - - - - - - - - - - - 225,000.00$ - - - - - - - - - - - 25,000.00$ - - - - - - - - - - - 40,000.00$

Coal Hedging Analysis January 15, 2010
Appendix G2008
Page 11 of 12
Bid Supplier
Apr 07 Supplier CApr 08 Supplier QQApr 08 Supplier RRMay 08 Supplier SSMay 08 Supplier AMay 08 Supplier TTJun 08 Supplier EJun 08 Supplier AJun 08 Supplier PPJul 08 Supplier UUJul 08 Supplier VVJul 08 Supplier WWJul 08 Supplier XXJul -08 Supplier YYJul 08 Supplier JJJul 08 Supplier VJul 08 Supplier JJJul 08 Supplier KKJul 08 Supplier ZZJul 08 Supplier JJJul 08 Supplier AAAJul 08 Supplier BBBJul 08 Supplier JJJul 08 Supplier CAug 08 Supplier GGAug 08 Supplier CCC"Aug 08 Supplier QQAug 08 Supplier DDDSep 08 Supplier GGSep 08 Supplier JJSep 08 Supplier JJSep 08 Supplier QQSep 08 Supplier DDDSep 08 Supplier JJSep 08 Supplier CSep 08 Supplier WWSep 08 Supplier EEESep 08 Supplier VOct 08 Supplier KK
Jan Feb Mar April May June July Aug Sept Oct Nov Dec
(70,000.00)$ (70,000.00)$ (70,000.00)$ (70,000.00)$ (70,000.00)$ (70,000.00)$ (35,000.00)$ (35,000.00)$ (35,000.00)$ (35,000.00)$ (35,000.00)$ (35,000.00)$ (630,000.00)$ - - - - 23,000.00$ - - - - - - - 23,000.00$ - - - - 3,000.00$ - - - - - - - 3,000.00$ - - - - - - (75,000.00)$ (75,000.00)$ (75,000.00)$ (60,000.00)$ - - (85,000.00)$ - - - - - (10,000.00)$ - - - - - - (10,000.00)$ - - - - - (60,000.00)$ - - - - - - (60,000.00)$ - - - - - 160,000.00$ - - - - - - 160,000.00$ - - - - - 130,000.00$ - - - - - - 130,000.00$ - - - - - - 240,000.00$ - - - - - 240,000.00$ - - - - - - - - - - - - (162,000.00)$ - - - - - - - - - - - - (89,500.00)$ - - - - - - - - - - - - (300,000.00)$ - - - - - - - - - - - - (159,500.00)$ - - - - - - - - - - - - (300,000.00)$ - - - - - - - - - - - - (149,500.00)$ - - - - - - - - - - - - (160,000.00)$ - - - - - - - - - - - - (169,500.00)$ - - - - - - - - - - - - (169,500.00)$ - - - - - - - - - - - - (169,500.00)$ - - - - - - - - - - - - (179,500.00)$ - - - - - - - - - - - - (339,000.00)$ - - - - - - - - - - - - (175,000.00)$ - - - - - - - - - - - - (144,500.00)$ - - - - - - - - - - - - (470,000.00)$ - - - - - - - (120,000.00)$ - - - - (120,000.00)$ - - - - - - - (75,000.00)$ - - - - (75,000.00)$ - - - - - - - (190,000.00)$ - - - - 2,160,000.00$ - - - - - - - - - - - - 10,000.00$ - - - - - - - - 20,000.00$ - - - 20,000.00$ - - - - - - - - 500.00$ - - - 500.00$ - - - - - - - - 500.00$ - - - 500.00$ - - - - - - - - - (90,000.00)$ - - 390,000.00$ - - - - - - - - - -$ - - 1,099,956.00$ - - - - - - - - -$ - - - -$ - - - - - - - - - 110,000.00$ - - 1,650,000.00$ - - - - - - - - - 300,000.00$ - - 300,000.00$ - - - - - - - - - 520,000.00$ - - 520,000.00$ - - - - - - - - - 200,000.00$ - - 1,920,000.00$ - - - - - - - - - (49,500.00)$ - - (49,500.00)$
Savings or (Costs)Savings or (Cost) if Call Is Exercised

Coal Hedging Analysis January 15, 2010
Appendix G2008
Page 12 of 12
Oct 08 Supplier FFFOct 08 Supplier GGGOct 08 Supplier HHHOct 08 Supplier TTOct 08 Supplier HHHOct 08 Supplier NNOct 08 Supplier NNNov-08 Supplier CNov-08 Supplier CNov-08 Supplier WW
- - - - - - - - - (49,500.00)$ - - (49,500.00)$ - - - - - - - - - (100,000.00)$ - - (100,000.00)$ - - - - - - - - - - - - 1,510,000.00$ - - - - - - - - - (400,000.00)$ - - (400,000.00)$ - - - - - - - - - - - - 510,000.00$ - - - - - - - - - - - - 55,500.00$ - - - - - - - - - - - - 265,500.00$ - - - - - - - - - - (135,000.00)$ - 90,000.00$ - - - - - - - - - - - - 25,000.00$ - - - - - - - - - - - - 40,000.00$
119,956$ TOTAL SAVINGS OR COSTS

Coal Hedging Analysis January 15, 2010
Appendix GTable
Page 1 of 1
Date Price Bid
Delivery Month(s)
Option Prermium
Feb March Feb Mar Feb Mar Feb Mar
Jan-04 Feb/March 25,000 25,000 2.00$ 38.10$ 38.20$ 40.00$ 45.00$ NO NO
Feb-04 March 20,000 2.00$ 44.88$ 40.00$ 45.00$ na YES
Jan-04 March 20,000 2.00$ 38.20$ 40.00$ 45.00$ na YES
Tonnage Per Month
TABLE
Futures Price from UPI Futures Price
Sheet Which Establishes Call
Option Strike Price Actual Monthly Spot
Market Price Exercise Call Option?