Embed Size (px)
Citation preview
M. GEHDE, L. BEVAN, and G. W. EHRENSTEIN
Lehrstuhl f u r Kunststofftechnik Universitat Erlangen Nurnberg
0-8520 Erlangen-Tennenlohe, Germany
Thin microtomed samples from hot-tool butt welds of polypropylene pipes are subjected to uniaxial tensile stress using a specially built instrumented mi- crotesting machine. The deformation of the interface between the weld and the bulk polymer is measured by an optical method. An analysis of these measure- ments is carried out using the finite element method, and contours of the effective stress are obtained. There is a steep stress gradient at the junction of the weld flash and the bulk polymer, although the stress concentration factor is relatively low. The stress is essentially constant in the bulk polymer apart from the region near the weld zone. Tests on samples without the weld flash show that the maximum stress occurs within the weld zone. This is consistent with long-term tests on larger samples, where the fracture is found to initiate within the weld. The method of analysis enables the stress-strain response of the weld material to be determined.
INTRODUCTION
elding is widely used in the plastics industry W for joining thermoplastic components. Hot-tool butt welding, the technique considered in this pa- per, can be used with large joining areas, and it has an important application in the joining of pipes. Polymer welding research has tended to concentrate on the study of processing parameters (1-4) and on the testing of welded joints (5-7). The deformation of the weld zone has received little attention, al- though laser-speckle photography has been used (8) to measure low elongations in butt welds. This pa- per describes tests on microtomed samples of pipe welds using a specially built instrumented mi- crotesting machine. The measured displacements of the weld boundary are analyzed by the finite ele- ment method, and the mechanical response of the weld material is estimated.
WELDING EXPERIMENTS AND ANALYSIS
Welding experiments were conducted on two ma- terials using a hot-tool machine with controls to obtain reproducible welds. The materials used were two grades of polypropylene, one with a high crys- tallinity level of about 70% (Hostalen@ PPH 2250 grau 34, from Hoechst AG), and the other with a low crystallinity level of about 40% (Vestolen@ P 6422, from Hiils AG). The range of the welding parameters considered is listed in Table 1, which shows that both the parameters “melting length” and “joining length/melting length” (J, /M,) were increased for both materials in the sequence of weld tests H1 to
Table 1. Variation of the Welding Parameters.
Heating El. Melting Joining Joining Joining Length1 Test Temp. Length Pressure Length Melting Length No. [“C] [mml IMPal [mml 1-1 PP-H H I 200 0.8 0.05 0.2 0.25 H2 200 2.9 0.1 1 1.3 0.45 H3 200 5.12 0.16 4.2 0.82 PP-R c 1 200 1.3 0.05 0.5 0.38 c 2 200 3.0 0.1 1 1.3 0.43 c 3 200 3.0 0.16 2.0 0.66
H3 and C1 to C3. These two parameters mainly affect the rheological behavior of the material and the development of the microstructure in the weld zone. The main differences between the three welds investigated for each material are the weld zone widths and the microstructure of the deformed spherulites.
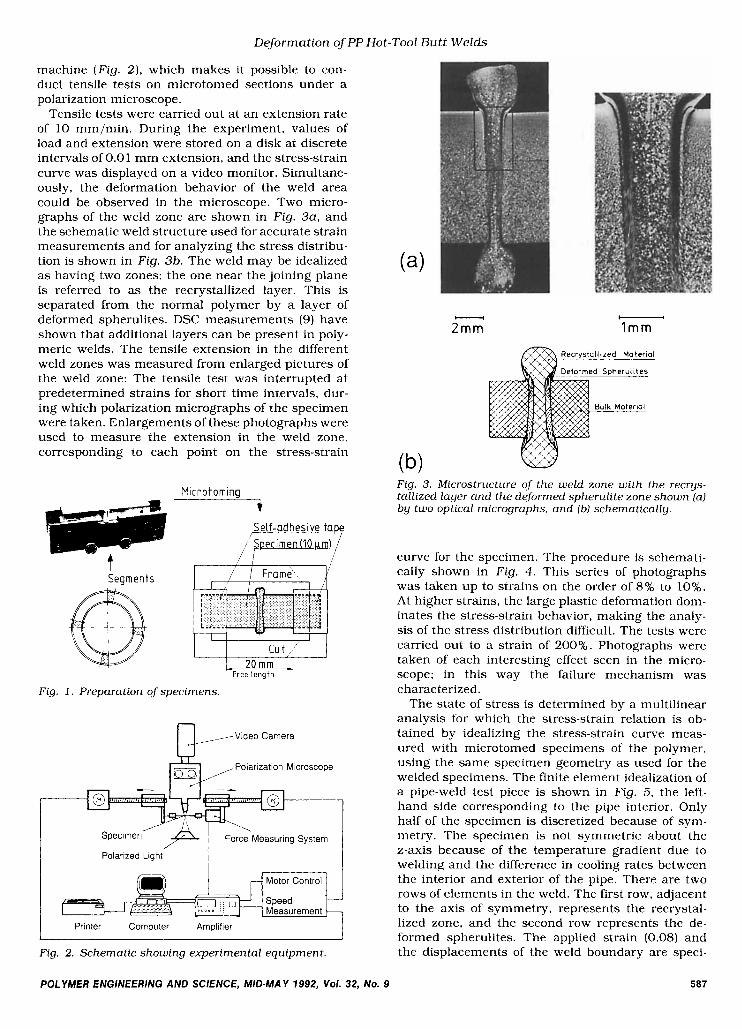
Pipes of 100-mm internal diameter and 10-mm wall thickness were welded. Microtomed 10-pm- thick sections for microtesting were then prepared from sawed-off specimens. An HK1 knife was used because other knives were found to cause a slight compression in the microtomed films, resulting in an apparent change in the measured mechanical properties. Immediately after cutting, the micro- tomed sections were attached to test frames with self-adhesive tape. Figure 1 shows the preparation of specimens.
The testing machine used for the experiments is a specially built, computer-controlled microtesting
586 POLYMER ENGINEERING AND SCIENCE, MID-MAY 1992, Vol. 32, NO. 9
Deformat ion of PP Hot-Tool Butt W e l d s
/ Frame
machine (Fig. Z ) , which makes it possible to con- duct tensile tests on microtomed sections under a polarization microscope.
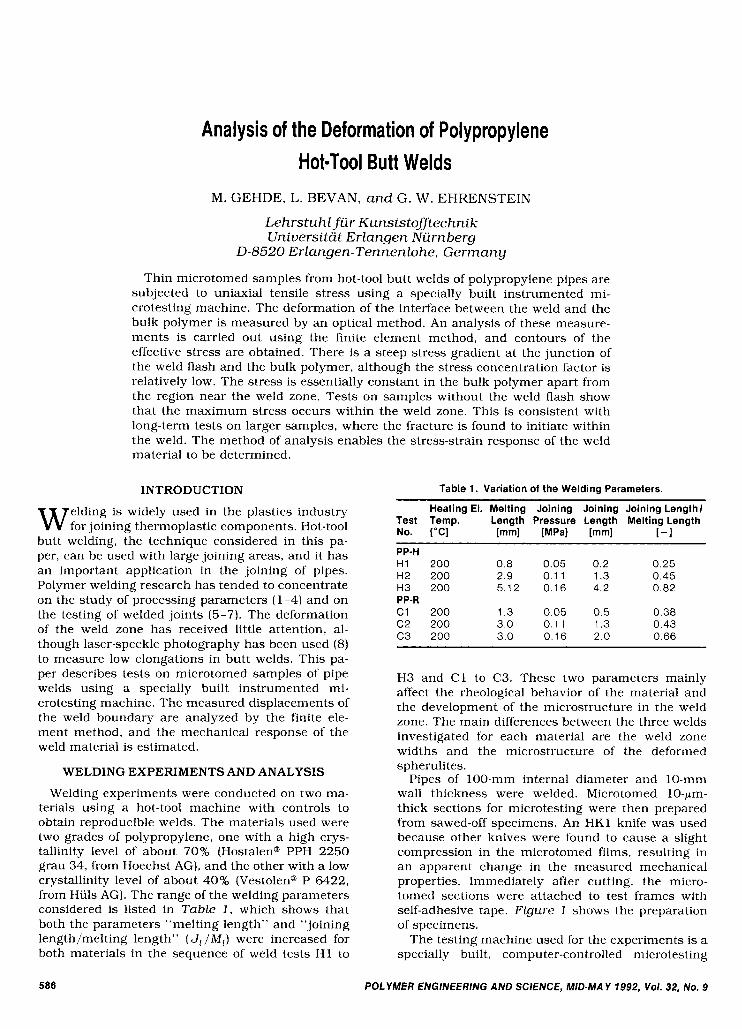
Tensile tests were carried out at an extension rate of 10 mm/min. During the experiment, values of load and extension were stored on a disk at discrete intervals of 0.01 mm extension, and the stress-strain curve was displayed on a video monitor. Simultane- ously, the deformation behavior of the weld area could be observed in the microscope. Two micro- graphs of the weld zone are shown in Fig. 3a, and the schematic weld structure used for accurate strain measurements and for analyzing the stress distribu- tion is shown in Fig. 3b. The weld may be idealized as having two zones; the one near the joining plane is referred to as the recrystallized layer. This is separated from the normal polymer by a layer of deformed spherulites. DSC measurements (9) have shown that additional layers can be present in poly- meric welds. The tensile extension in the different weld zones was measured from enlarged pictures of the weld zone: The tensile test was interrupted at predetermined strains for short time intervals, dur- ing which polarization micrographs of the specimen were taken. Enlargements of these photographs were used to measure the extension in the weld zone, corresponding to each point on the stress-strain
Microtoming t
Self-adhesive ta e / p e r i m e n (10 pm) 5
I
c - 2 O m m Free Length
Fig. I . Preparation of specimens.
Video Camera I-+ U
Polarization Microscope EP \
Specimen’ I Force Measuring System
Polarized Light
Motor Control
Printer Computer Amplifier
Fig. 2. Schematic showing experimental equipment.
- 2 m m
- I m m
zed Material
Fig. 3. Microstructure of the weld zone with the recrys- tallized layer and the deformed spherulite zone shown [a) by two optical micrographs, and [b) schematically.
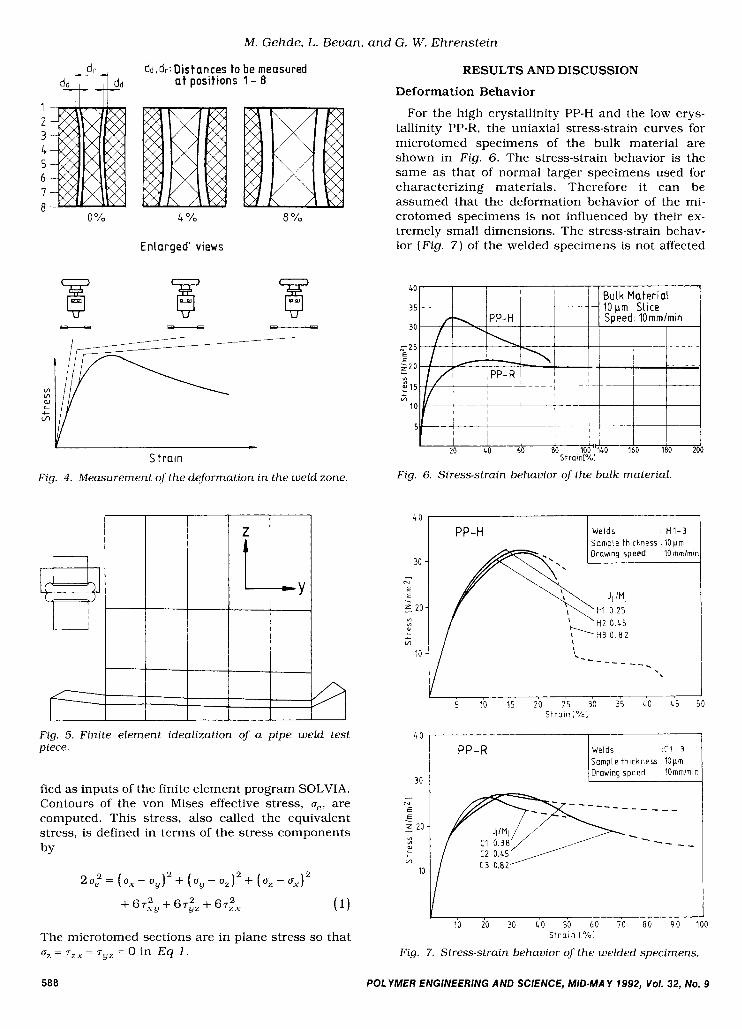
curve for the specimen. The procedure is schemati- cally shown in Fig. 4. This series of photographs was taken up to strains on the order of 8% to 10%. At higher strains, the large plastic deformation dom- inates the stress-strain behavior, making the analy- sis of the stress distribution difficult. The tests were carried out to a strain of 200%. Photographs were taken of each interesting effect seen in the micro- scope: in this way the failure mechanism was characterized.
The state of stress is determined by a multilinear analysis for which the stress-strain relation is ob- tained by idealizing the stress-strain curve meas- ured with microtomed specimens of the polymer, using the same specimen geometry as used for the welded specimens. The finite element idealization of a pipe-weld test piece is shown in Fig. 5, the left- hand side corresponding to the pipe interior. Only half of the specimen is discretized because of sym- metry. The specimen is not symmetric about the z-axis because of the temperature gradient due to welding and the difference in cooling rates between the interior and exterior of the pipe. There are two rows of elements in the weld. The first row, adjacent to the axis of symmetry, represents the recrystal- lized zone, and the second row represents the de- formed spherulites. The applied strain (0.08) and the displacements of the weld boundary are speci-
POLYMER ENGINEERING AND SCIENCE, MID-MAY 1992, Yo/. 32, NO. 9 507
M . Gehde, L. Bevan, and G. W. Ehrenstein
dd,dr:Distances to be measured a t positions 1 - 8
Y
0 Y o 4 O/O
E n L ar g e d' views
8
5 train
Fig. 4. Measurement of the deformation in the weld zone.
Fig. 5. Finite element idealization of a pipe weld test piece.
fied as inputs of the finite element program SOLVIA. Contours of the von Mises effective stress, ue, are computed. This stress, also called the equivalent stress, is defined in terms of the stress components by
2 2 2.: = ( ux - UJ2 + ( uy - u,) + ( uz - u,)
+ 6 ~ : ~ + 6 ~ : ~ + 6& (1)
The microtomed sections are in plane stress so that uz = r Z x = rL/, = 0 in Eq 1 .
RESULTS AND DISCUSSION
Deformation Behavior
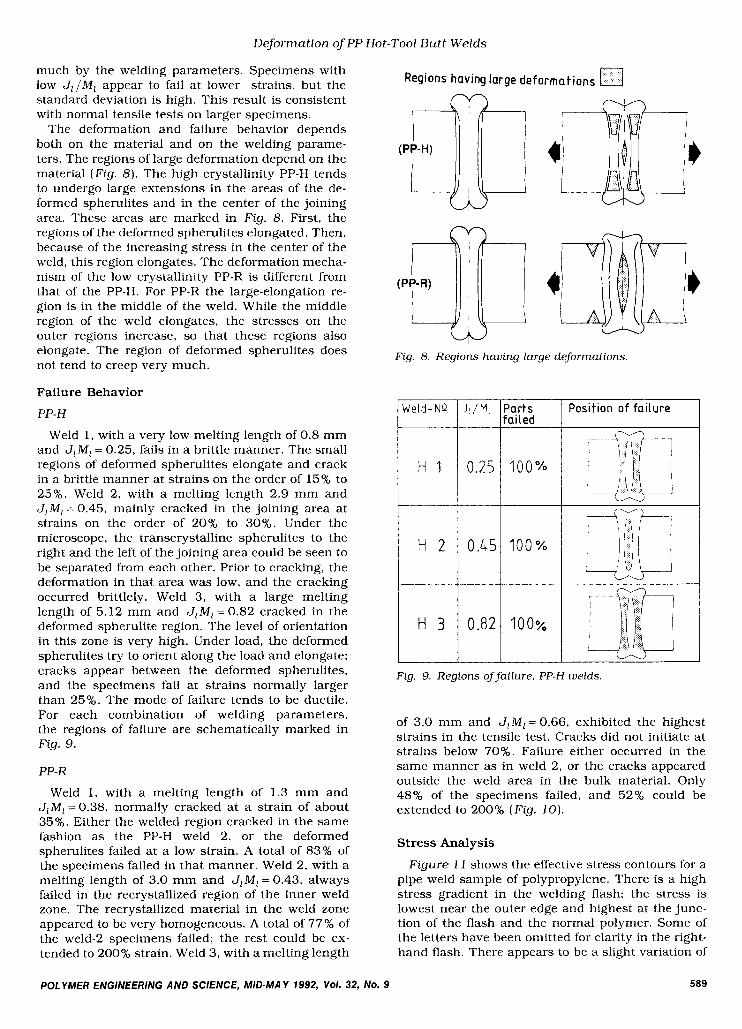
For the high crystallinity PP-H and the low crys- tallinity PP-R, the uniaxial stress-strain curves for microtomed specimens of the bulk material are shown in Fig. 6. The stress-strain behavior is the same as that of normal larger specimens used for characterizing materials. Therefore it can be assumed that the deformation behavior of the mi- crotomed specimens is not influenced by their ex- tremely small dimensions. The stress-strain behav- ior (Fig. 7) of the welded specimens is not affected
40
35
30
z-25 E E 2 2 0 - yl
:15
10 c LA
I I I 1
5 20 40 I 60 80 100' i_to 140
St roin[%l
Fig. 6. Stress-strain behavior of the bulk material.
40 I I I 1 PP-H Welds HI-3 1 Samole thickiess 10um e. I Drawing speed 10mmlrnml
;'H3 0 . 8 2
.-- - - - _ _ _
Y J 5 10 15 20 2 5 30 35 4.0 45 50
Stra in [ % I
Welds Sample thickness 10pm
30
I
E E
N
. v)
al L +
- - -_ 3 20 -
LII
10 -
10 20 30 LO 50 60 70 8 0 9 0 '
S t r a i n [ % I 0
Fig. 7. Stress-strain behavior of the welded specimens.
588 POLYMER ENGINEERING AND SCIENCE, MID-MAY 1992, Vol. 32, NO. 9
Deformation ofPP Hot-Tool Butt Welds
Weld-NQ
much by the welding parameters. Specimens with low J , / M , appear to fail at lower strains, but the standard deviation is high. This result is consistent with normal tensile tests on larger specimens.
The deformation and failure behavior depends both on the material and on the welding parame- ters. The regions of large deformation depend on the material (Fig. 8). The high crystallinity PP-H tends to undergo large extensions in the areas of the de- formed spherulites and in the center of the joining area. These areas are marked in Fig. 8. First, the regions of the deformed spherulites elongated. Then, because of the increasing stress in the center of the weld, this region elongates. The deformation mecha- nism of the low crystallinity PP-R is different from that of the PP-H. For PP-R the large-elongation re- gion is in the middle of the weld. While the middle region of the weld elongates, the stresses on the outer regions increase, so that these regions also elongate. The region of deformed spherulites does not tend to creep very much.
Failure Behavior
PP- H
Weld 1, with a very low melting length of 0.8 mm and J I M , = 0.25, fails in a brittle manner. The small regions of deformed spherulites elongate and crack in a brittle manner at strains on the order of 15% to 25%. Weld 2, with a melting length 2.9 mm and J , M , = 0.45, mainly cracked in the joining area at strains on the order of 20% to 30%. Under the microscope, the transcrystalline spherulites to the right and the left of the joining area could be seen to be separated from each other. Prior to cracking, the deformation in that area was low, and the cracking occurred brittlely. Weld 3, with a large melting length of 5.12 mm and J , M , = 0.82 cracked in the deformed spherulite region. The level of orientation in this zone is very high. Under load, the deformed spherulites try to orient along the load and elongate; cracks appear between the deformed spherulites, and the specimens fail at strains normally larger than 25%. The mode of failure tends to be ductile. For each combination of welding parameters, the regions of failure are schematically marked in Fig. 9.
J I / M , Parts Position of failure fai led
PP- R
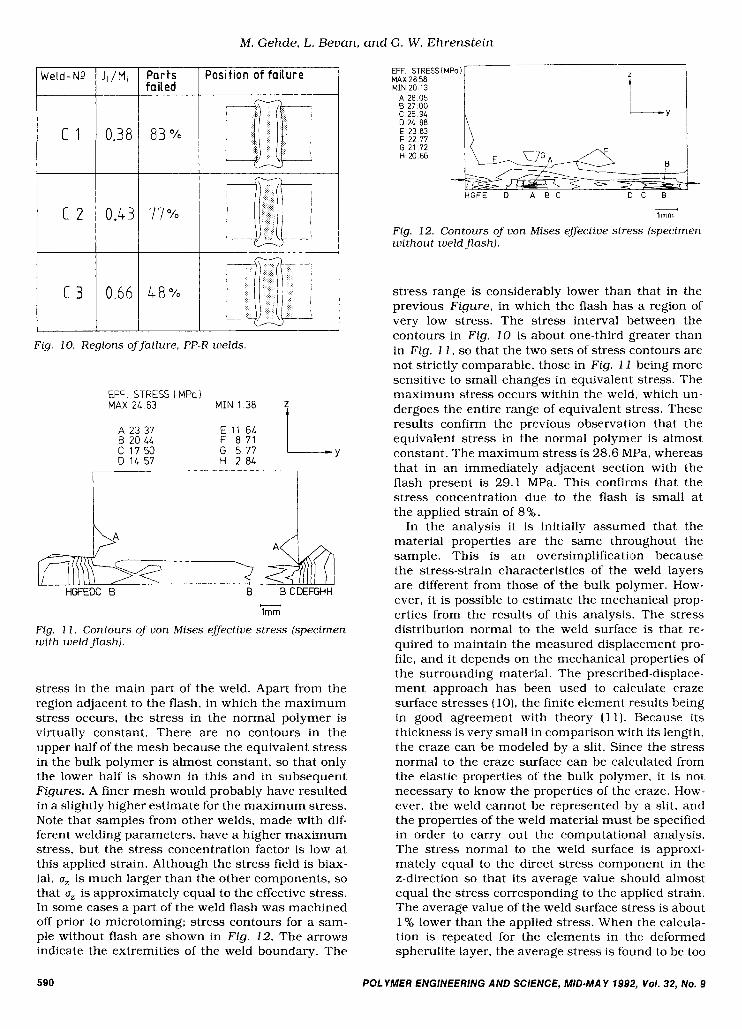
Weld 1, with a melting length of 1.3 mm and J ,M,=0 .38 , normally cracked at a strain of about 35%. Either the welded region cracked in the same fashion as the PP-H weld 2, or the deformed spherulites failed at a low strain. A total of 83% of the specimens failed in that manner. Weld 2, with a melting length of 3.0 mm and J , M , = 0.43, always failed in the recrystallized region of the inner weld zone. The recrystallized material in the weld zone appeared to be very homogeneous. A total of 77% of the weld-2 specimens failed: the rest could be ex- tended to 200% strain. Weld 3 , with a melting length
Regions having large deformations 0
CI Fig. 8. Regions having large deformations.
Fig. 9. Regions offailure, PP-H welds.
of 3.0 mm and J,M,=0.66, exhibited the highest strains in the tensile test. Cracks did not initiate at strains below 70%. Failure either occurred in the same manner as in weld 2, or the cracks appeared outside the weld area in the bulk material. Only 48% of the specimens failed, and 52% could be extended to 200% (Fig. 10).
Stress Analysis
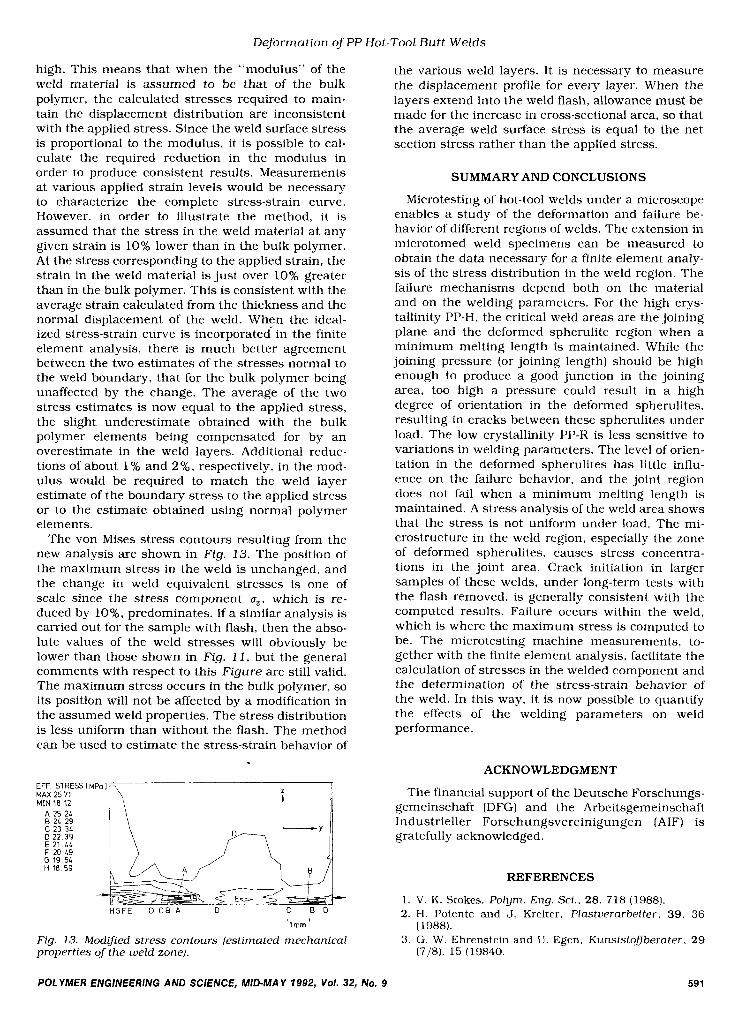
Figure 11 shows the effective stress contours for a pipe weld sample of polypropylene. There is a high stress gradient in the welding flash: the stress is lowest near the outer edge and highest at the junc- tion of the flash and the normal polymer. Some of the letters have been omitted for clarity in the right- hand flash. There appears to be a slight variation of
POLYMER ENGINEERING AND SCIENCE, MID-MAY 1992, VOl. 32, NO. 9 589
t
J , / M , deld-NQ
c 1
c 2
c 3
Parts Position of failure failed
Fig. 10. Regions of failure, PP-R welds
EFF STRESS MPa 1 MAX 2L 83 MIN 1 3 8
A 23 37 B 20 11
E 11 61 F 8 7 1 I
C 1 7 5 0 G 5 7 7 L y
F-
c(
lmm
Fig. 1 1 . Contours of von Mises effective stress (specimen with weldflash).
stress in the main part of the weld. Apart from the region adjacent to the flash, in which the maximum stress occurs, the stress in the normal polymer is virtually constant. There are no contours in the upper half of the mesh because the equivalent stress in the bulk polymer is almost constant, so that only the lower half is shown in this and in subsequent Figures. A finer mesh would probably have resulted in a slightly higher estimate for the maximum stress. Note that samples from other welds, made with dif- ferent welding parameters, have a higher maximum stress, but the stress concentration factor is low at this applied strain. Although the stress field is biax- ial, uz is much larger than the other components, so that uz is approximately equal to the effective stress. In some cases a part of the weld flash was machined off prior to microtoming; stress contours for a sam- ple without flash are shown in Fig. 12. The arrows indicate the extremities of the weld boundary. The
EFF STRESSIMPal MAX 28 58 MIN 20 13
i A 28 05 B 27 00 C 25 9L L i
'------, 1
t_
lrnrn
Fig. 12. Contours of von Mises effective stress (specimen without weld flash).
stress range is considerably lower than that in the previous Figure, in which the flash has a region of very low stress. The stress interval between the contours in Fig. 10 is about one-third greater than in Fig. 11, so that the two sets of stress contours are not strictly comparable, those in Fig. 1 1 being more sensitive to small changes in equivalent stress. The maximum stress occurs within the weld, which un- dergoes the entire range of equivalent stress. These results confirm the previous observation that the equivalent stress in the normal polymer is almost constant. The maximum stress is 28.6 MPa, whereas that in an immediately adjacent section with the flash present is 29.1 MPa. This confirms that the stress concentration due to the flash is small at the applied strain of 8 % .
In the analysis it is initially assumed that the material properties are the same throughout the sample. This is an oversimplification because the stress-strain characteristics of the weld layers are different from those of the bulk polymer. How- ever, it is possible to estimate the mechanical prop- erties from the results of this analysis. The stress distribution normal to the weld surface is that re- quired to maintain the measured displacement pro- file, and it depends on the mechanical properties of the surrounding material. The prescribed-displace- ment approach has been used to calculate craze surface stresses (lo), the finite element results being in good agreement with theory (11). Because its thickness is very small in comparison with its length, the craze can be modeled by a slit. Since the stress normal to the craze surface can be calculated from the elastic properties of the bulk polymer, it is not necessary to know the properties of the craze. How- ever, the weld cannot be represented by a slit, and the properties of the weld material must be specified in order to carry out the computational analysis. The stress normal to the weld surface is approxi- mately equal to the direct stress component in the z-direction so that its average value should almost equal the stress corresponding to the applied strain. The average value of the weld surface stress is about 1 % lower than the applied stress. When the calcula- tion is repeated for the elements in the deformed spherulite layer, the average stress is found to be too
590 POLYMER ENGINEERING AND SCIENCE, MID-MAY 1992, Vol. 32, NO. 9
Deformation of PP Hot-Tool Butt Welds
high. This means that when the “modulus” of the weld material is assumed to be that of the bulk polymer, the calculated stresses required to main- tain the displacement distribution are inconsistent with the applied stress. Since the weld surface stress is proportional to the modulus, it is possible to cal- culate the required reduction in the modulus in order to produce consistent results. Measurements at various applied strain levels would be necessary to characterize the complete stress-strain curve. However, in order to illustrate the method, it is assumed that the stress in the weld material at any given strain is 10% lower than in the bulk polymer. At the stress corresponding to the applied strain, the strain in the weld material is just over 10% greater than in the bulk polymer. This is consistent with the average strain calculated from the thickness and the normal displacement of the weld. When the ideal- ized stress-strain curve is incorporated- in the finite element analysis, there is much better agreement between the two estimates of the stresses normal to the weld boundary, that for the bulk polymer being unaffected by the change. The average of the two stress estimates is now equal to the applied stress, the slight underestimate obtained with the bulk polymer elements being compensated for by an overestimate in the weld layers. Additional reduc- tions of about 1 % and 2%, respectively, in the mod- ulus would be required to match the weld layer estimate of the boundary stress to the applied stress or to the estimate obtained using normal polymer elements.
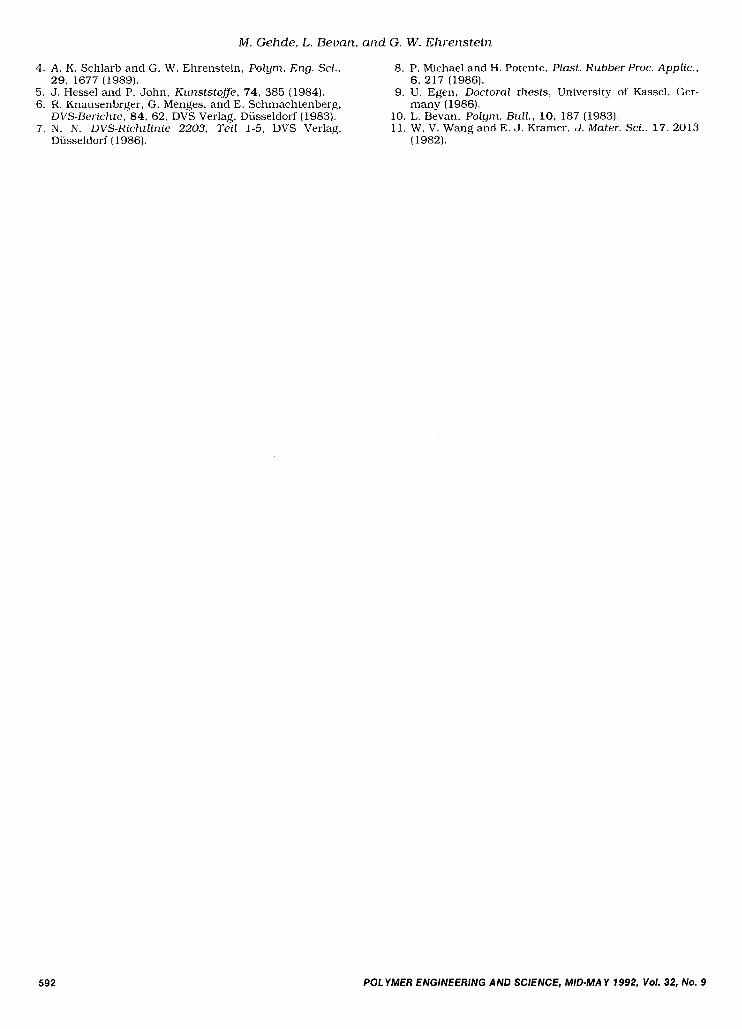
The von Mises stress contours resulting from the new analysis are shown in Fig. 13. The position of the maximum stress in the weld is unchanged, and the change in weld equivalent stresses is one of scale since the stress component uz, which is re- duced by lo%, predominates. If a similar analysis is carried out for the sample with flash, then the abso- lute values of the weld stresses will obviously be lower than those shown in Fig. 11 , but the general comments with respect to this Figure are still valid. The maximum stress occurs in the bulk polymer, so its position will not be affected by a modification in the assumed weld properties. The stress distribution is less uniform than without the flash. The method can be used to estimate the stress-strain behavior of
EFF STRESS I MPa 1 MAX 25 71 MIN 18 12 A
A 25 2L B 2L 29 C 23 3L D 22 39 E 21 LL F 20 L9 G 19 5L H 18 59
HGFE D C B A D c B D ti 1 mm
Fig. 13. Modified stress contours (estimated mechanical properties of the weld zoneJ.
the various weld layers. It is necessary to measure the displacement profile for every layer. When the layers extend into the weld flash, allowance must be made for the increase in cross-sectional area, so that the average weld surface stress is equal to the net section stress rather than the applied stress.
SUMMARY AND CONCLUSIONS
Microtesting of hot-tool welds under a microscope enables a study of the deformation and failure be- havior of different regions of welds. The extension in microtomed weld specimens can be measured to obtain the data necessary for a finite element analy- sis of the stress distribution in the weld region. The failure mechanisms depend both on the material and on the welding parameters. For the high crys- tallinity PP-H, the critical weld areas are the joining plane and the deformed spherulite region when a minimum melting length is maintained. While the joining pressure (or joining length) should be high enough to produce a good junction in the joining area, too high a pressure could result in a high degree of orientation in the deformed spherulites, resulting in cracks between these spherulites under load. The low crystallinity PP-R is less sensitive to variations in welding parameters. The level of orien- tation in the deformed spherulites has little influ- ence on the failure behavior, and the joint region does not fail when a minimum melting length is maintained. A stress analysis of the weld area shows that the stress is not uniform under load. The mi- crostructure in the weld region, especially the zone of deformed spherulites, causes stress concentra- tions in the joint area. Crack initiation in larger samples of these welds, under long-term tests with the flash removed, is generally consistent with the computed results. Failure occurs within the weld, which is where the maximum stress is computed to be. The microtesting machine measurements, to- gether with the finite element analysis, facilitate the calculation of stresses in the welded component and the determination of the stress-strain behavior of the weld. In this way, it is now possible to quantify the effects of the welding parameters on weld performance.
ACKNOWLEDGMENT
The financial support of the Deutsche Forschungs- gemeinschaft (DFG) and the Arbeitsgemeinschaft Industrieller Forschungsvereinigungen (AIF) is gratefully acknowledged.
REFERENCES
1. V. K. Stokes, Polyrn. Eng. Sci., 28, 718 (1988). 2. H. Potente and J. Kreiter, Plastuerarbeiter, 39, 36
3. G. W. Ehrenstein and U. Egen, Kunststoffberater, 29 (1988).
(7/8), 15 (19840.
POLYMER ENGINEERING AND SCIENCE, MID-MAY 1992, VOl. 32, NO. 9 591
M . Gehde, L. Bevan, and G. W. Ehrenstein
4. A. K. Schlarb and G. W. Ehrenstein, Polyrn. Eng. Sci.,
5. J. Hessel and P. John, Kunststoffe, 74, 385 (1984). 6. R. Knausenbrger, G. Menges, and E. Schmachtenberg,
7. N. N. DVS-Richtlinie 2203, Teil 1-5, DVS Verlag, 11. W. V. Wang and E. J. Kramer, J. Mater. Sci., 17, 2013
8. P. Michael and H. Potente, P l a t . Rubber Proc. Applic.,
9. U. Egen, Doctoral thesis, University of Kassel, Ger-
10. L. Bevan, Polyrn. Bull., 10, 187 (1983).
29, 1677 (1989). 6, 217 (1986).
many (1986). DVS-Berichte, 84, 62, DVS Verlag, Dusseldorf (1983).
Dusseldorf (1986). (1982).
592 POLYMER ENGINEERING AND SCIENCE, MID-MAY 1992, VOI. 32, NO. 9