Embed Size (px)
Citation preview
R 276 Philips Res. Rep. 10, 337-348, 1955
ANALYSIS OF THE DECAYOF PHOTOCONDUCTANCE IN GERMANIUM
hy B. H~ SCHULTZ 537.312.5: 546.289
SummaryA method of analysing surface and volume effects in the re-combination of injected 'charge carriers is described. The influenceof the capacity of a surface double layer is discussed and someof theresults of measurements are given.
RésuméTJne nouvelle méthode de mesure de la photoconduction du germa-nium permet de séparer les effets de récombinaison en volume et ensurface, De plus nous avons montré théoriquement que la présenced'une barrière superficielle a un effet capacitif sur les variations desconcentrations des particules injectées. eet effet a été confirmé parles expériences.
ZusammenfassungEs wird eine neue Methode zur Analyse der Rekombinationspro-zesse in Germanium beschrieben, mit deren Hilfe Volumen- undOberflächen-Rekombinationseffekte getrennt werden können. Eswird weiter theoretisch und experimentelI gezeigt, daf eine vor-handene Oberflächen-Potentialschwelle den zeitlichen Verlauf derKonzentrationen von injektierten Ladungsträgern beeinflul3t.
1. Introduetion
Recomhination of injected electron-hole pairs in germanium is usuallycharacterized hy a single constant, the relaxation time r, In general,however, the process is more complicated due to the effects of traps andof surface recomhination. It will he shown in this paper that the surfaceis not only a source of recombination hut also affects the time dependenceof the carrier concentrations hecause of the capacity connected with thesurface potential harrier. For the study of the effects mentioned theanalysis of the relaxation of photoconductance or of the photovoltaiceffect suggests itself. This analysis may he obtained from the directlymeasured decay curve after a short illumination 1). We shall describe herea method of measurement, in which use is made of modulated light. Themodulation frequency is varied over a wide range. The analysis obtainedwith this method is very sensitive to differences between the actual relax-ation process and one with a single time constant.Before investigating the more complicated processes in silicon, some
measurements on germanium showing the combined effects of volumerecombination and surface effects were made, as a check on the method.
338 B. H. SCHULTZ
In this paper the method is described, the formulae used for the analysisare derived and some of the experimental results are given. At presentwe are using the method for the study of the influence of traps in silicon.
2. The experimental arrangement
A rod of the semiconducting material is illuminated on one surface. Thelight intensity is modulated with an angular frequency cv which can bevaried. The photoconductance of the rod or the photovoltaic effect on oneof its surfaces gives rise to an a.c. signal, the phase and amplitude of whichare measured as a function of cv. This measurement consists in the compar-ison of the signal with that across a condenser C and a resistance R inparallel. The current through this combination comes' from a photocellon which the light reflected from the semiconductive rod is' projected.This current, therefore, varies in exactly the same way with time as therate of injection. For a certain combination of Rand C the two signalsare equal in amplitude and phase; they can be made to compensate eachother. This is observed with a zero instrument, and the R- and C-values areread. As zero instrument a wave analyser is used, tuned to the modulationfrequency cv. The measurements yield R and C as a function of co. If therecombination processes can be described with the aid of a single relaxationtime r, then Rand C are independent of the measuring frequency andRC = r. In the general case the a.c. voltage across the semiconductingrod can be written as Wo exp(jwt)lf(cv) where Wo exp(jcvt) represents thevarying part of the generation.
Compensation then means that
f(cv) = const. (~ + jWC),
where the constant is determined by the sensitivity of the photocell andthe efficiency of the injection process, and is usually unknown.
The frequencies needed for the study of recombination in germaniumand silicon are not excessively high. Usually the time constants involvedare not much smaller than one microsecend. The phase shifts then yield asufficiently sensitive criterion for the compensation at frequencies as low as104 cis. In our apparatus a disc with 720 holes is used, withwhichfrequenciesup to 4.104 cis can be realized. Another light source which has been usedis a non-focussed cathode-ray tube with a rapidly responding 'fluorescentscreen. The modulation is obtained by applying an a.c. voltage of the desiredfrequency to the cathode. The constancy of the modulation frequency issuch that the wave analyser may be used with a band width of 2 cis, sothat the noise level is low. It has been possible to make measurements withsignals as small as 10 fLV. This is of importance in connection with the
85481
ANALYSIS OF THE DECAY OF PHOTOCONDUCTANCE IN GERMANIUM 339
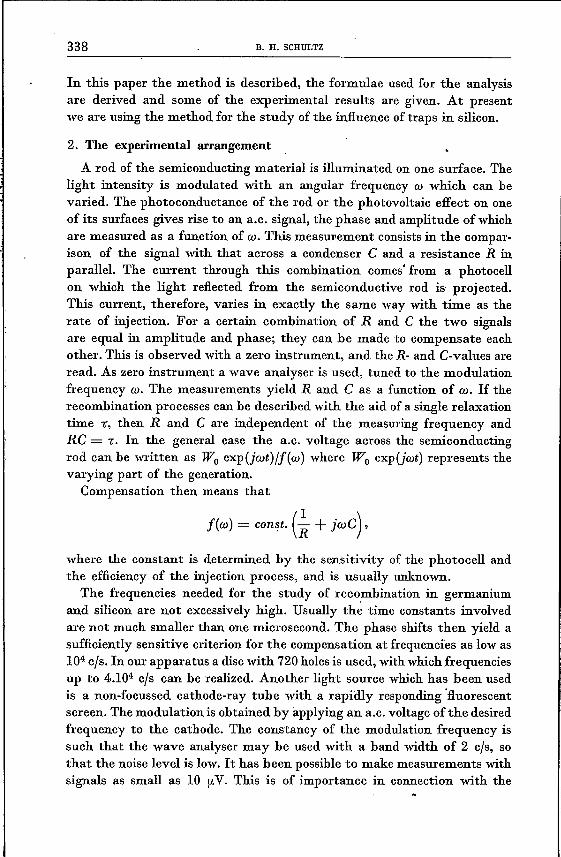
requirement that the conductivity modulation in the semiconductor besmall. The semiconductor and photocell circuits are connected with thewave analyser via two carefully designed cathode followers, as shown infig.l. The variahle resistor R and capacity C are adjusted. The potentiom-eter T permits an independent adjustment ofthe ratio ofthe amplitudes *).
modulatedlight
Fig. 1. Circuit used for measurement of the photoconductive effect.
For sufficiently small light intensities the equations for the recombina-tion processes are Iinear. The a.c. voltage across the semiconductor thenvaries proportionally to the total numher of carriers present at any time,if certain geometrical conditions are fulfilled. The variation of the lightintensity need not he sinusoidal; if the wave analyser is tuned to a fre-quency w the measurement records the effect of the harmonic componentin the light intensity represented hy 10 exp(jwt).
3. Recombination and barrier capacity effects at the surface
In the model for the surface of germanium proposed by Brattain andBardeen 2) there are electrons in surface states and positive charges in a space-charge layer, giving rise to a potential harrier. If, immediately heneaththis, there is a density of electrons and holes Llin excess of the equilibriumdensities, there will he a flow to the surface across the harrier, owing to therecombination via the surface states. The flow density is szl, where s isthe surface recombination velocity. The assumption is made that the mohileelectrons at hoth sides of the harrier are always in Boltzmann equilibriumand similarly for holes. The condition of electroneutrality then impliesthat the potential drop in the douhle layer is dependent on zl. We denotethe equilibrium densities in the interior just beneath the harrier hy pand n;
*) The electric circuitry has been designed by Mr L. J. van der Pauw to whom I expressmy sincere thanks.
340 B. H. ,SCHULTZ
those at the surface by Ps and ns *). If V is the rise in the electrostaticpotentlal on passing to the surface (usually V<0 for n-type germanium),the assumption mentioned means that
n + LI (q V) p + LI (qV) (1)ns + LIs = exp - kT ' ps + LIs = exp kT .
We write V = Vo+ aV, where for LI = 0, LIs = 0 and aV = O. Forsufficiently small injections qaV ~ kT, and the relation between aVand LI is found by elimination of LIs:
qaV . kT (Ps _ ns) LIp n ns + P»
For larger injection densities aV becomes less than according to (2). Theexact solution is simple for n-type germanium with a p-type surface, wheren ~ ns and P» ~ ns. In this case it is found that
(qaV ~kT). (2)
qaV =,kTln (1+ LI/p). (3)
The linear varratton of aV with LI, as in (2), is only found for LI <r-i.e. if the injected concentration is smaller than the minority concentration.In the general case, we may write for n-type germanium
ps LIqaV=kT -T,
ns +ps p(4)
where a reduction factor r :::::;;1 is introduced. The variation aV is the resultof a variation of the charges aQ in the double layer. We consider this layeras a condenser with thickness b:
"aQ =- aV.4nb
(5)
If now LI varies with time, av and aQ also vary with time, so that there isa flow of aQ/q electrons and holes to the double layer. The variation ofthe excess surface concentrations with time, 'Lis, also gives a flow to thesurface; LIs can be found from (1) and (4). The resulting total flow tothe surface of n-type germanium may be writen in the form
aO' ps n dLlszl + - + LIs = szl + I-r' -.
q ns + ps p dt(6)
The reduction factor r' is unity for LI 4;. p; the coefficient I has thedimension of a length and depends mainly on ns and Ps- In view of thesimplifications made in the theory and the lack of knowledge of charge
*) The symbolsps and ns include carriers in surface states,

ANALYSIS OF THE DECAY OF PHOTOCONDUCTANCE IN GERlIIANIUM 341
distribution and states at the surface, a precise evaluation of l is notpossible. If ps and ns are not very much larger than 109 per cmê, l willbe ~ 10-5 or 10-:6 cm. For p-type germanium a similar formula is found.Formula (6) states that whenever surface recombination is consideredand the concentration Ll varies with time, a capacitive flow should betaken into account. This capacitive flow is large for strongly dopedmaterial, due to the factor nip.
The effect of the capacitive flow on our surface recombination velocitymeasurements 4) will be discussed later. Here we stress the fact that it alsoinfluences the decay curve found after a short illumination of a thin rod.It slows down the decay, especially the last pàrt of the curve, where LJis small and r approaches unity, thus giving a tail to an otherwise exponen-tial curve *). With stationary injection concentrations, such as with theusual diffusion-length measurement, the capacitive flow is absent.
4. The distribution of charge carriers injected by light
The semiconductor is illuminated at the surface x = 0; the absorptioncoefficient for the light will be taken very large, so that the generation ofelectron-hole pairs takes place at x . 0 at a rate W. The dimensions inthe y- and z-directions are so large that only diffusion in the x-directionhas to be considered **).
We shall first consider the case of constant illumination. The solution ofthe diffusion problem for constant injection W yields the following distri-bution of excess electron-hole pairs in the rod:
where L = -vDi is the diffusionlength and Pthe dimensionless quantity sLID.The concentratien at the illuminated surface x = 0 is
WLIDLl(0) = -p-+-P-c-o-sh-"(-dl_:L~)-+-sin-h-(d-IL-)
P sinh (diL) + cosh (diL)
The photoconductive effect is proportional to the value of Ll averaged
*) Therefore, the capacitive surface effect should he included in a general calculationof the decay such as given in ref. 3.
U) These requirements are superfluous for ·the calculation of the photoconductive effectin cases where the surface effects can be neglected. The denominator in the equations(10) or (11) for s = 0 is 1.+ jW7:, and this obtains quite generally for any form of thesample and distribution of the generation.
(8)
342 B. H. SCHULTZ
over the thickness d of the rod. After some manipulation with hyperbolicfunctions this becomes
(9)
5. Photoconduction as a function of the modulation frequency
For our measurements we are interested in the effect of the simpleharmonic co.mponent in the generation represented by Wo exp(jwt) *).The differential equation and its solution take the same form as for constant
light if L is replaced by the complex quantity LrVl+ jW7:. Inserting thisin the formulae (7), (8) and (9), complicated expressions are found. Approx-imate formulae for the cases dfL~1 and dfL~.l have been worked out.(a) For a thick rod, formula (9) yields
7:WOd exp(jwt)
~ =-----------------a.,1+ jort + DY 1+ jW7:
(10)
in which 7: is the lifetime for volume recombination. The formula is a goodapproximation for dfL ~ 3(1 + yl + W2-c2t-I. For small surface recomhi-nation rates (sL ~ D) the surface has no effect and the a.c. signal fromthe semiconductor varies as (1 + jw-ct1• In this case compensation isattained with a constant R-G combination for all frequencies, (cf. section 2).If, however, the adjustment for compensation is found to depend onthe frequency it can be inferred that sLfD is not a very small number.It has proved possible to deduce both sand 7: from the frequency depend-ence of the compensating admittancies (see section 7 (a)).(b) For a thin rod and low frequencies (9) yields
Wo 7:1 exp(jwt)~=------------
1+ jW7:eff(11)
where1 1 2s-=-+-.
7:eff 7: d
This again is a case where a single relaxation time occurs, and the com-pensating Rand C do not vary with w. For sufficiently thin rods the term2sfd is preponderant, and then the measurement yields the values of the
(12)
*) The effect of the surface harrier capacity is treated in section 5 (c).

ANALYSIS OF THE DECAY OF PHOTOCONDUCTANCE IN GERMANIUM 343
surface re' ,. nbination velocity s 4). The requirement d ~ L for thevalidity of (11) is usually too severe. A closer examination of (9) shows thatfor moderately thin rods and not too high frequencies (11) is a goodapproximátion with a more general 7:eff:
lIs a-{J-=-+- .7:eff 7: d 1+ {Js7:ld
The constants a and (J and l:he frequency up to which (13) is valid are givenin table I.
(13)
TABLE I
dIL W7: a (J
0 - 2 0<1 «su« 2 d2/6£21 ~4 2·16 0·163 ~2 3·32 1·168 ~ 0·4 8·0 4·0
For very thin rods, the relaxation time 7:eff given by (12) is identical withthat for the decay of photoconductance after switching off the light 5). Formoderately thin rods however, where (13) applies, the two problems givedifferent results. If, for instance, s is very large, for a moderately thin rod{Js7:ld can he much larger than unity and (13) gives
(J 1 d27:eff= 7: - = --,
a 12 D
whereas the relaxation time of the decay curve becomes (1/n2)(d2ID). Thishas been used by Many 6), who deduced D from measurements of thetime constant of the decay.(c) Until now the effect of the surface barrier capacity has been left out.According to (6) it is important for germanium of low resistivity and canbe introduced in the formulae by adding an imaginary term to s. Thiscomplicates the results considerably. The most important case is that ofvery thin rods, where the surface is important. Using (6), the completeexpression for LInow becomes instead of (11): ..
7:eff .Wod exp(Jwt)
LI=-------------1+ i=« (1+ G)
(diL ~ 1) (14)
344 B. H. SCHULTZ
where for n-type germanium
. 1 P» n,G= 2- - TO
d ns + ps p
and 'taf! is given by (12). The factor ~T~ is the amplitude of the fust coef-ficient in the Fourier expansion of T'Lt and is equal to unity for very smallinjected concentrations.
The phase cp of Lt follows from (14):
(15)
cp = W'teff (1+ G) . (16)
Thus, the result of the capacitive effect is that the phase is increased. -Experimental evidence for the existence of this effect is given in section
7 (c).
6. Photovoltaic effect
A rectifying contact on the illuminated surface shows a floating potentialwhich, for small injections, is proportional to the concentration zl (0) atthat surface. Measurement of this potential as a function of the frequencycan he made with the same apparatus as used for the photoconductance.For thick rods where diL ~ 2(1 + 11 + W2-r2f-! formula (3) gives
Lt(O)= sL const. exp(jwt) (17)
IJ + 11 + jort + jwB
Here the term jwB represents the capacitive effect of the surface and canhe found with the aid of (6). The information obtained by measurementof this function is not much different from that obtained from the photo-conductance, equation (10), which has already been discussed. For thismeasurement a thick crystal with only one flat surface is needed. Experi-mental results are reported in section 7 (d).
7. Experimental results
(a) Photoconduction, thick samples
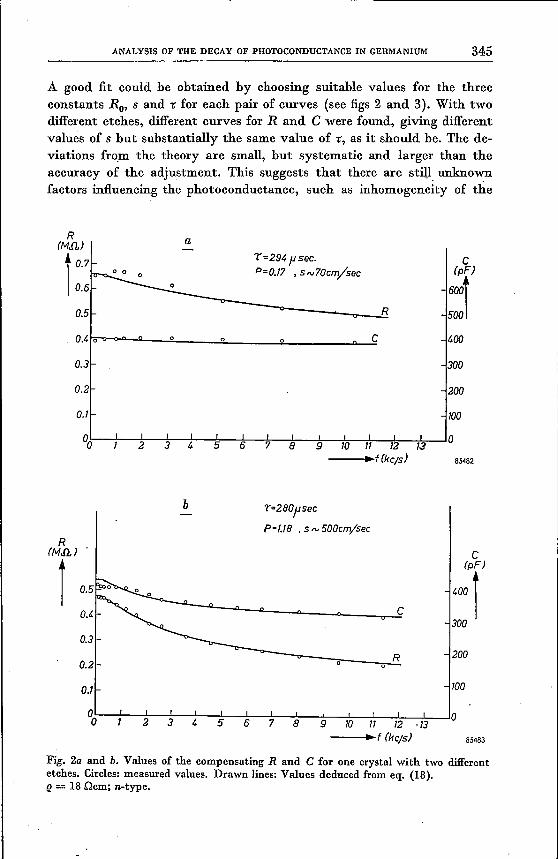
In order to check the method some measurements were made on thick"germanium rods. The thickness was greater than 4L, so that formula (10)
should be applied. Writing 11 + jorc = a + jb, the following frequencydependence is to be expected for the compensating Rand C:
s, 1+ a sLID w-r+ b sLID]i = 1+ sLID ' wCRo = 1+ sLID . (18)
85483
ANALYSIS OF THE DECAY OF PHOTOCONDUCTANCE IN GERMANIUM 345
A good fit could he ohtained by choosing suitahle values for the threeconstants Ro, sand 7: for each pair of curves (see figs 2 and 3). With twodifferent etches, different curves for Rand C were found, giving differentvalues of shut suhstantially the same value of 7:, as it should he. The de-viations from the theory are small, hut systematic and larger than theaccuracy of the adjustment. This suggests that there are still. unknownfactors influencing the photoconductance, such as inhomogeneity of the
100
~~-f--~2~~3--~4---52-~6~-7~~8~-9k-~10'-·1~1--7~2.-·~k-~0.. f(kc/sJ
°0~~--*2--~3--~4--~5~~6~~7~-8~~9~~0~~~~~__j0I 11 12 13.. f (kc/sj
R(M.{).J
i0.70.6a
L =294 P sec.P=0.17 • sN70cm/sec
R0.5
0.4r-<>-<'-''----2.-_--2.. .2...0 --"--..J::C
0.3
0.2
0.1
b i=280psec
P -1.18 ,s rv 500cm/secR
(M.{). )
r0.2 o
0.1
400
300
200
85482
c
c
':1'300
R 200
100
Fig. 2a and b. Values of the compensating Rand C for one crystal with two differentetches. Circles: measured values. Drawn lines: Values deduced from eq, (18).l! = 18 !lcm; n-type.
346 B. H. SCHULTZ
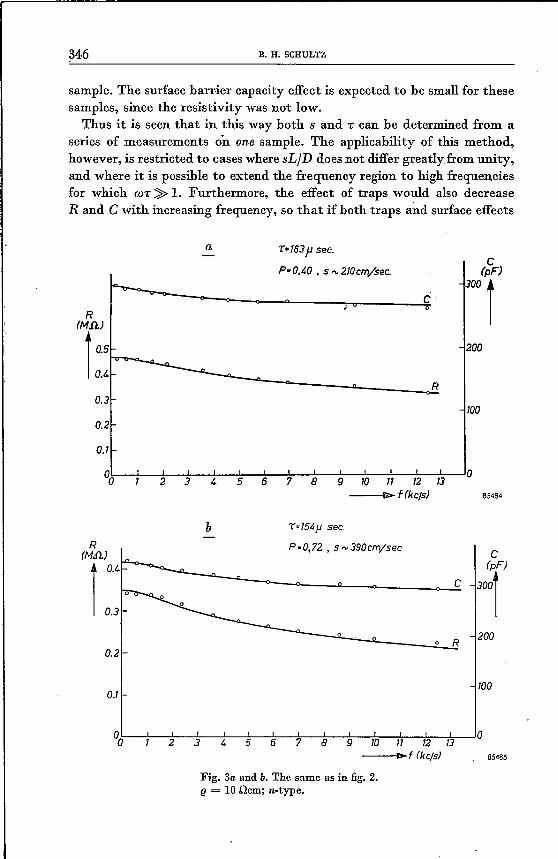
sample. The surface barrier capacity effect is expected to be small for thesesamples, since the resistivity was not low.Thus it is seen that in this way both sand l" can be determined from a
series of measurements on one sample. The applicability of this method,however, is restricted to cases where sLID does not differ greatlyfrom unity,and where it is possible to extend the frequency region to high frequenciesfor which rul"~ 1. Furthermore, the effect of traps would also decreaseRand C with increasing frequency, so that if both traps a~d surface effects
a ,=163J1 sec.P-0,40, s,,-210cm/sec.
0.3
c(pF)
c 3001200
R
1000.2
0.1
°O~-+--~~~~--=-~--=-~--~~~~--~~~O2 3 4 5 6 7 8 9 10 11 12 13-tl> f (kets) 85484
b '·754J1 sec
P-0,72, s",390cm/sec c~rR(MJl)
t0.4
0.3
0.1
c
0.2200
o R
100
°0~-7--~~~-7--~~~~--~~~~--~~~~~02 3 4 5 6 7 8 9 10 11 12 13---t:.~f (kc/sj 85485
Fig. 3a and b. The same as in fig. 2.e = 10 .Gcm; n-type.
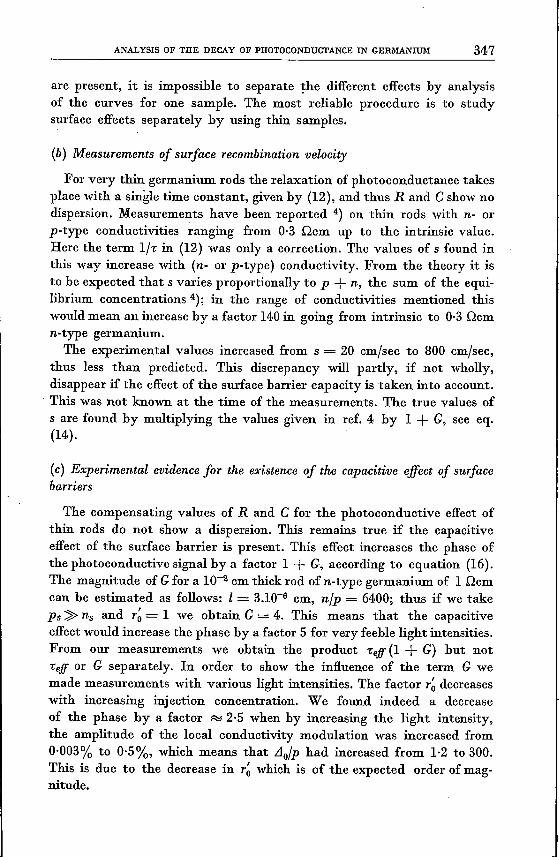
ANALYSIS OF THE DECAY OF PHOTOCONDUCTANCE IN GERMANIUM 347
are present, it is impossible to separate the different effects by analysisof the curves for one sample. The most reliable procedure is to studysurface effects separately by using thin samples.
(b) Measurements of surface recombination velocity
For very thin germanium rods the relaxation of photoconductance takesplace with a single time constant, given by (12), and thus Rand C show nodispersion. Measurements have been reported 4) on thin rods with n- orp-type conductivities ranging from 0·3 Qcm up to the intrinsic value.Here the term 1/7: in (12) was onlya correction. The values of s found inthis way increase with (n- or p-type) conductivity. From the theory it isto be expected that s varies proportionally to p + n, the sum of the equi-librium concentrations 4); in the range of conductivities mentioned thiswould mean an increase by a factor 140 in going from intrinsic to 0·3 Qcmn-type germanium.The experimental values increased from s = 20 cm/sec to 800 cm/sec,
thus less than predicted. This discrepancy will partly, if not wholly,disappear if the effect of the surface barrier capacity is taken into account.This was not known at the time of the measurements. The true values ofs are found by multiplying the values given in ref. 4 by 1 + G, see eq.(14).
(c) Experimental evidence for the existence of the capacitive effect of surfacebarriers
The compensating values of Rand C for the photoconductive effect ofthin rods do not show a dispersion. This remains true if the capacitiveeffect of the surface barrier is present. This effect increases the phase ofthe photoconductive signal by a factor 1 + G, according to equation (16).The magnitude of G for a 10-2 cm thick rod of n-type germanium of 1 Qcmcan be estimated as follows: 1= 3.10-6 cm, nip = 6400; thus if we takeP» ~ ns and r~= 1 we obtain G = 4. This means that the capacitiveeffect would increase the phase by a factor 5 for very feeble light intensities.From our measurements we obtain the product 7:eff (1 + G) but not7:eff or G separately. In order to show the influence of the term G wemade measurements with various light intensities. The factor r~ decreaseswith increasing injection concentration. We found indeed a decreaseof the phase by a factor ~ 2·5 when by increasing the light intensity,the amplitude of the local conductivity modulation was increased from0·003% to 0·5%, which means that .t1o/p had increased from 1·2 to 300.This is due to the decrease in r~ which is of the expected order of mag-nitude.
348 B. H. SCHULTZ
Another proof for the existence of the barrier effect is found by comparingthe amplitudes of the photoconductance at low frequencies for differentsamples. For w.eff~ 1 these should be proportional to .elf, other thingsremaining equal, whereas the phases are given by w.elf (1 + G).
We have compared phases and amplitudes for rods of 1 n cm and 30 ncm.For the rods of 30 ncm G ~ 1, due to the factor nlp; so in this way itwas possible to find 1 + G for the 1-ncm rods. With light intensitiessuch as were used in the series of s-measurements, the factor 1 + Granged betwe~n 1·5 and 2,' in qualitative agreement with the valuesexpected from equation (15). The conclusion is, therefore, that capacitiveeffects of surface barriers are present and should be taken into account byusing expression (6) if time-dependent carrier densities are used, especiallyfor low-conductivity material and feeble injections.
(d) Photovoltaic effectWith point contacts on the illuminated surface, no reproducible results
could be obtained. The frequency dependence of the compensating admit-tances differed widely for different points on the same surface, and did notagree with formula (17). More reproducible results were obtained if therectifying contact was made with a thin layer of gold produced by evapora-tion in vacuo. Whereas in this case the resistance varied in the expectedway, proportionally to the real part of the denominator in (17), the capaci-tance did not, but was larger by a constant amount. This could be attributedto an abnormally large surface capacity effect jwB for the gold-coveredsurface. B would have to be about 100 times larger than the value whichfollows from (6). The conclusion is that the floating potentialof rectifyingcontacts is not a reliable measure for the concentration of injected carriersif these are rapidly varying with time.
Eindhoven, June 1955
REFERENCES
1) D. T. Stevenson and R. J. Keyes, J. appl. Phys. 26, 190-195, 1955.2) W. H. Brattain and J. Bardeen, Bell Syst. tech. J. 32, 1-41, 1952.3) W. van Roosbroeck, J. appl. Phys, 26, 380-391, 1955; J. P. McKelvey and
R. L. Longini, J. appl. Phys. 25, 634-641, 1955.4) B. H. Schultz, Physica 20, 1031-1033, 1954.6) W. Shockley, Electrons and Holes in Semiconductors, Van Nostrand Company, Inc.,
New York, 1950, p. 323.6) A. Many, Physica 20, 985-989, 1954; see also ref. 1.
-..... :.


![Characteristics of ZnO-based semiconductor ceramics doped ... · ferromagnetic and ferroelectric materials [7]. The outer electronic structure of germanium is the same as silicon,](https://img.pdfslide.us/doc/110x75/5f2f12b9a1d1cb2992198a07/characteristics-of-zno-based-semiconductor-ceramics-doped-ferromagnetic-and.jpg)