Embed Size (px)
Citation preview
Analysis of the Community of Learning AnalyticsSadia Nawaz
Purdue University West Lafayette, IN, USA
Farshid Marbouti Purdue University
West Lafayette, IN, USA
Johannes Strobel Purdue University
West Lafayette, IN, USA
ABSTRACT
The trends of the learning analytics community being presented in
this paper are in terms of authors, their affiliation and
geographical location. Thus the most influential authors,
institutes, and countries who have been actively contributing to
this field are brought out. In addition, this paper identifies
collaborations among authors, institutes, and countries. The paper
also tries to explore the research themes followed by the learning
analytics community.
1. DATA AND TOOLS The data that is analyzed in this paper consists of the conference
on Learning Analytics and Knowledge (LAK) 2011–2012,
Educational Data Mining (EDM) conference 2008–2012 and the
Journal of Educational Technology and Society (JETS) special
edition on learning and knowledge analytics. This data was
provided on the Society for Learning Analytics Research
(SoLAR) website in xml format [1]. The xml data converted to
tabular data using an xml to csv convertor [2]. The converted csv
files were then processed and merged using macro programming
in MS Excel. Later, this data was using NodeXL tool – an open
source template for Microsoft® Excel® [3]. It allows the user to
work on different worksheets for different operations such as
„Edges‟ worksheet can be used to compute the inter/intra
collaboration. „Vertices‟ worksheet allows the display and
computation of individual node properties such as degree,
betweenness, centrality etc. Other tools that have been utilized in
this paper include NetDraw [4] and IBM‟s Many-eyes [5].
2. MOTIVATION With increase of attention to interdisciplinary field of Learning
Analytics, scholars from different disciplines such as education,
technology, and social sciences are contributing towards this field
[6]. Different authors with different backgrounds, expertise and
purpose publish and present their work in Learning Analytics
related journals and conferences. To draw a better understanding
of who are top collaborates in the field and which institutes and
countries are more active in creating and disseminating
knowledge, we analyzed the data described in the previous
section.
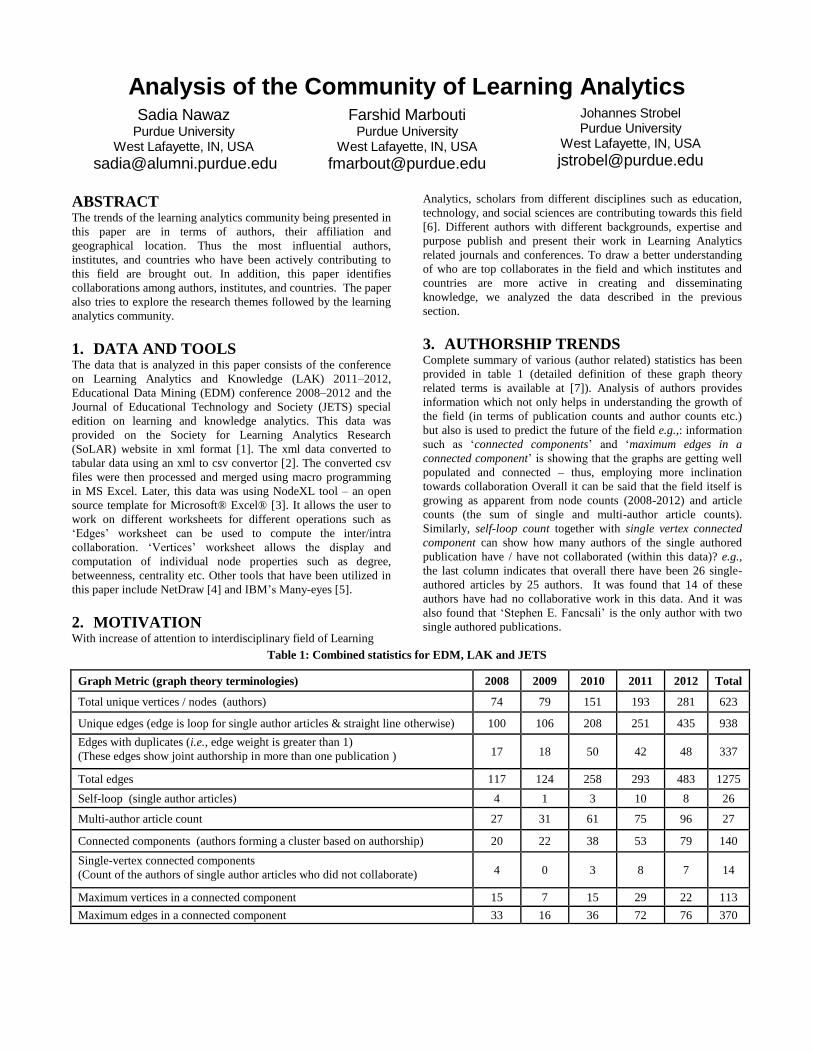
3. AUTHORSHIP TRENDS Complete summary of various (author related) statistics has been
provided in table 1 (detailed definition of these graph theory
related terms is available at [7]). Analysis of authors provides
information which not only helps in understanding the growth of
the field (in terms of publication counts and author counts etc.)
but also is used to predict the future of the field e.g.,: information
such as „connected components‟ and „maximum edges in a
connected component‟ is showing that the graphs are getting well
populated and connected – thus, employing more inclination
towards collaboration Overall it can be said that the field itself is
growing as apparent from node counts (2008-2012) and article
counts (the sum of single and multi-author article counts).
Similarly, self-loop count together with single vertex connected
component can show how many authors of the single authored
publication have / have not collaborated (within this data)? e.g.,
the last column indicates that overall there have been 26 single-
authored articles by 25 authors. It was found that 14 of these
authors have had no collaborative work in this data. And it was
also found that „Stephen E. Fancsali‟ is the only author with two
single authored publications.
Table 1: Combined statistics for EDM, LAK and JETS
Graph Metric (graph theory terminologies) 2008 2009 2010 2011 2012 Total
Total unique vertices / nodes (authors) 74 79 151 193 281 623
Unique edges (edge is loop for single author articles & straight line otherwise) 100 106 208 251 435 938
Edges with duplicates (i.e., edge weight is greater than 1)
(These edges show joint authorship in more than one publication ) 17 18 50 42 48 337
Total edges 117 124 258 293 483 1275
Self-loop (single author articles) 4 1 3 10 8 26
Multi-author article count 27 31 61 75 96 27
Connected components (authors forming a cluster based on authorship) 20 22 38 53 79 140
Single-vertex connected components
(Count of the authors of single author articles who did not collaborate) 4 0 3 8 7 14
Maximum vertices in a connected component 15 7 15 29 22 113
Maximum edges in a connected component 33 16 36 72 76 370

4. COLLABORATION TRENDS Collaboration as defined in Oxford dictionary [8] is the „action of
working with someone to produce something‟ and in current
context it represents co-authorship of an article by two or more
researchers. This term can be extended to institutes and even
countries and hence extended collaboration patterns will be
extracted between and within institutes and countries respectively.
Table 2 shows that there have been 938 pairs of authors who
collaborated just once (this number includes single author articles
- since in that case a self-loop serves as an edge to itself).
Alternatively, it can be stated that 73.57% of all articles have been
written by the authors who have collaborated just once. It could
either mean that new collaborations are forming or that the
authors published just once and then they started working in other
research areas, with other authors or they started targeting other
venues. Therefore, initiatives such as LAK Data challenge will
attract more researchers towards this field and hence may help in
further growth and development of authorship networks.
Table 2: Overall collaboration pattern
Author Pairs Article Counts
1 10
2 6
2 5
10 4
15 3
110 2
938 1
1(10)+2(6)+2(5)+10(4)+15(3)+110(2)+938(1) =1275
Table 3 presents some of the top collaborators e.g., N.T.
Heffernan had been a co-author with J.E. Beck and Z.A. Pardos in
6 articles. Such analysis can help in finding active researchers and
collaborators in this field.
Table 3: Top collaborators based on article count
Author Author Article Count
S. Ventura C. Romero 10
Neil T. Heffernan Joseph E. Beck,
Zachary A. Pardos 6, 6
Arnon Hershkovitz Rafi Nachmias 5
Sujith M. Gowda Ryan S. J. d. Baker 5
5. DIVERSITY Diversity in this context is the count of distinct researchers – a
given author may have worked with. Table 4 aims at identifying
the contributors who have worked with most diverse group of
authors e.g., K.R. Koedinger has worked with 34 distinct authors
and Ryan Baker has worked with 25 distinct authors. We also
extracted the graph of these top contributors (based on degree)
i.e., a graph which includes these top authors and all of their
collaborators; and it was found that this new graph consists of 128
authors (roughly 21% of the total authors). This percentage shows
the significance of the top authors towards EDM, LAK, JETS and
in general towards learning analytics.
Table 4: Top 10 authors with highest degree counts
Author Degree Article Count
Kenneth R. Koedinger 34 17
Ryan S. J. d. Baker 25 11
C. Romero 19 11
Vincent Aleven 18 5
S. Ventura 17 11
Neil T. Heffernan 16 16
Sujith M. Gowda 15 5
Mykola Pechenizkiy 15 7
Arthur C. Graesser 14 4
Jack Mostow 13 12
6. GEOGRAPHICAL LOCATION
Next, the geographical analysis of this dataset is presented which
aims to explore the countries that have been extending this field
especially through contributions to the venues: EDM, LAK and
JETS. There have been contributions from 41 different countries.
For extracting this information, all aliases of a country‟s name
were merged e.g., Netherland, Netherlands, The_Netherlands etc.
were all merged together. The top countries that have had
international collaborations are provided in table 5. Clearly, USA
and UK are on top of the list. To illustrate the collaboration
patterns between countries figure 1 is drawn using „NetDraw‟. In
this figure an edge between two countries depicts the co-
authorship between the researchers from these countries. The edge
width (also represented by a number) shows the strength of such
collaboration. Also, different symbols have been used for different
nodes based on their „betweeness‟ values. „Betweenness
centrality‟ is the “number of times a node acts as a bridge along
the shortest path between two other nodes” [9]. Clearly, USA, UK
and Germany are on top of this list based on degree and centrality
measures. It is apparent that most of the nodes have „betweenness‟
value of zero as depicted with a „+‟ symbol. It indicates the
peripheral nature of these nodes and thus depicts the birth or
growth of this field – in that newer nodes are being added and the
graph is currently sparse. Figure 2 illustrates geographical
diversity of collaborators. The smaller circles show lesser
diversity in terms of collaboration (with researchers from other
countries). Similarly, larger circles are indicative of the countries
whose researchers have more diverse group of co-authors (from
across the world). In this figure a small table at the bottom depicts
the count of papers from each continent. Thus it brings out the
most active region for research in the area of learning analytics.
Clearly, North America and Europe are at the top of this list
(complete geographical mapping is available at [5]).
Table 5: Top international collaborators
Country Degree
USA 11
UK 10
Australia, Germany 6
Netherland 5
Canada, Belgium, Greece, Spain 4

Figure 1: Collaboration in terms of geographical location
Figure 2: Geographical diversity of collaborators

7. AUTHOR AFFILIATION Next, the institutional affiliation of authors was analyzed and it
was found that there have been contributions from 200 different
institutes world-wide. The ranking of the top few institutes in
terms of collaboration with other institutes is provided in table
6. The term degree represents count of unique institutes that a
given institute may have worked with. This term can be
influenced by both the „article counts‟ and the „coauthor
counts‟. Table 7 provides the institutes with highest count of
intra-institute collaboration and table 8 provides the „institute –
pairs‟ that have had highest collaboration. Such analysis is
beneficial to research institutes and organizations so that they
may collaborate and extend further studies in the field of
learning analytics. Figure 3 illustrates trends of collaboration
between institutes.
Table 6: Top institutes with highest counts of distinct
collaborators
Institute Degree
Carnegie Mellon University 20
University of Cordoba 9
Stanford University 8
Fraunhofer Institute for Applied Information Technology 7
Dept. Computer wetenschappen, KU Leuven 7
Worcester Polytechnic Institute 7
Open University of the Netherlands 6
University of Pittsburgh 6
Table 7: Top institutes with highest count of intra-institute
collaboration
Institute Self-loop count
Worcester Polytechnic Institute 116
Carnegie Mellon University 107
Eindhoven University of Technology 36
University of Cordoba 33
University of Memphis 31
Universitat Oberta de Catalunya (UOC) 31
University of North Carolina at Charlotte 20
RWTH Aachen University 16
8. RESEARCH THEMES In order to track the research themes being followed by learning
analytics society and to see their emergence over time, the
authors conducted a keyword based analysis. The information
for this analysis has been extracted from the keyword (subject)
section of the data provided by Society for Learning Analytics
Research (SoLAR) website [1]. However, for initial two years
i.e., 2008-2009 this field is empty, similarly some of the articles
in later years had this field empty. Therefore, it was decided to
use the „title‟ field for the purpose of keyword extraction. The
selection of „title‟ field rather than the „abstract‟ field for the
purpose of keyword extraction relies on an earlier study by the
authors of this paper [10]. Later, Hermetic Word Frequency
Counter (HWFC) software [11] was used to parse out top 30
keywords for each year. Some of the common English keywords
are already ignored by this software, as available in its stop word
list. Other words which are apparent by the nature of the venues
EDM, LAK and JETS were then manually eliminated (since
they would not bring any insightful information for this
analysis) e.g., student, learn, knowledge, education etc. Further
refinement was made to merge varying instances of the same
word such as „visual, visualize, visualization‟ etc. Then, IBM‟s
Many-eyes software utility was used to obtain the Matrix Chart
as provided in figure 4. In this figure top 30 keywords for each
year have been presented. It should be noted that since the count
of articles and venues has also increased over years; therefore,
the relative rank or position of keywords will be discussed rather
than absolute frequency counts. From this figure, it was found
that the usage of some of the keywords such as „visualization,
intelligent, network*‟ is increasing over time. Some keywords
such as „model*, system*, tutor*‟ retain their ranks. The
keywords „online, collaborat*, performance‟ etc. show
fluctuating trends. Similarly, other trends can be interpreted.
The authors further extracted the context of these keywords: it
was found that „visualization co-occurs with data-mining‟,
„intelligent appears with tutoring system‟. The word „online‟ has
a broader class of co-occurring keywords which includes
„learning, education, university, assessment systems, tutoring,
courses, curriculum‟ etc. Interestingly, in 2012 the context
changed to „online communities, interactions and social
learning‟ etc. Due to space restriction further analysis cannot be
provided in this paper.
CONCLUSION In this paper the data of past five years of publications related to
learning analytics are analyzed. The trends show increasing
number of authors and more collaboration between authors as
well as institutes. Geographical analysis of authors shows that
scholars from different countries have been collaborating and
contributing towards this field. Top authors, collaborators, and
institutes are identified in this paper. The authors also attempted
to bring out the research themes followed by the learning
analytics community based on the frequency of the usage of
keywords.
The authors plan to extend this study based on author‟s
disciplinary diversity and on the association between authors
and their explored research areas within learning analytics.
Table 8: Top pairs for inter-institute collaboration
Institute Institute Edge weight
Worcester Polytechnic Institute Carnegie Mellon University 37
Claremont Graduate University University of Memphis 18
University of Belgrade Simon Fraser University 9
Northern Illinois University University of Memphis 9
Hochschule fur Wirtschaft und Recht Hochschule fur Technik und Wirtschaft 8
Beuth Hochschule fur Technik Berlin Hochschule fur Technik und Wirtschaft 8
Universidade Federal de Alagoas Carnegie Mellon University 8
Fraunhofer Institute for Applied Information Technology Saarland University 8
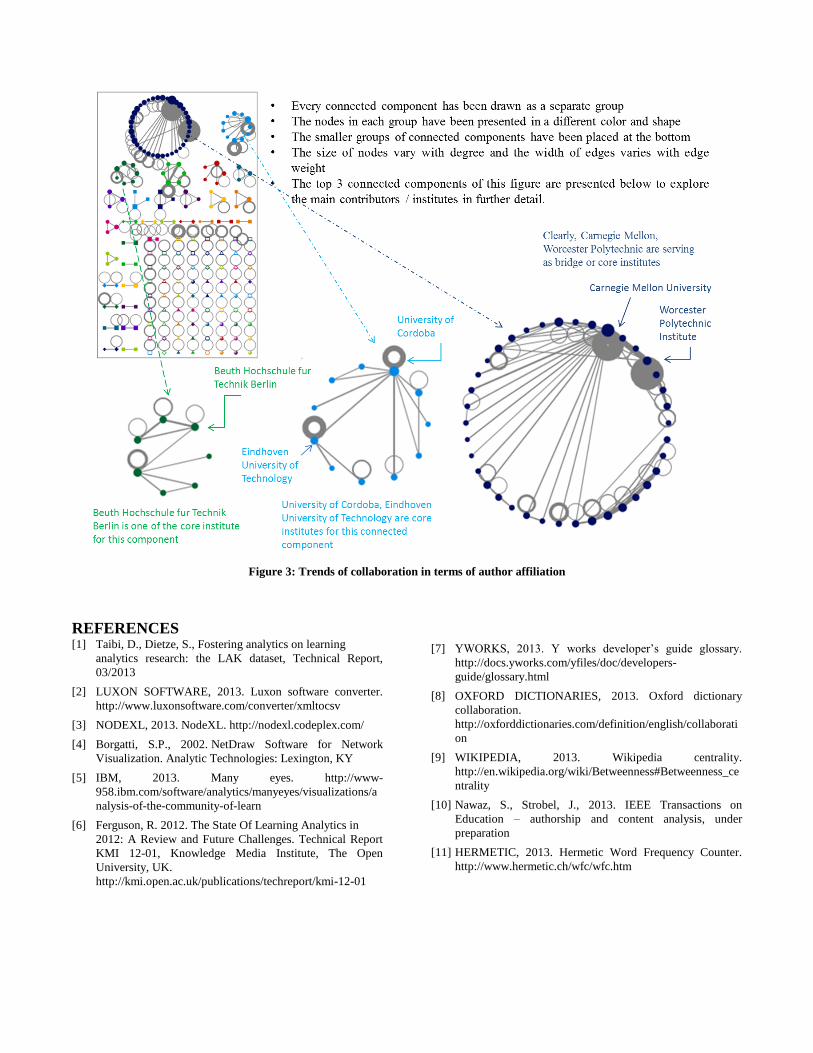
Figure 3: Trends of collaboration in terms of author affiliation
REFERENCES [1] Taibi, D., Dietze, S., Fostering analytics on learning
analytics research: the LAK dataset, Technical Report,
03/2013
[2] LUXON SOFTWARE, 2013. Luxon software converter.
http://www.luxonsoftware.com/converter/xmltocsv
[3] NODEXL, 2013. NodeXL. http://nodexl.codeplex.com/
[4] Borgatti, S.P., 2002. NetDraw Software for Network
Visualization. Analytic Technologies: Lexington, KY
[5] IBM, 2013. Many eyes. http://www-
958.ibm.com/software/analytics/manyeyes/visualizations/a
nalysis-of-the-community-of-learn
[6] Ferguson, R. 2012. The State Of Learning Analytics in
2012: A Review and Future Challenges. Technical Report
KMI 12-01, Knowledge Media Institute, The Open
University, UK.
http://kmi.open.ac.uk/publications/techreport/kmi-12-01
[7] YWORKS, 2013. Y works developer‟s guide glossary.
http://docs.yworks.com/yfiles/doc/developers-
guide/glossary.html
[8] OXFORD DICTIONARIES, 2013. Oxford dictionary
collaboration.
http://oxforddictionaries.com/definition/english/collaborati
on
[9] WIKIPEDIA, 2013. Wikipedia centrality.
http://en.wikipedia.org/wiki/Betweenness#Betweenness_ce
ntrality
[10] Nawaz, S., Strobel, J., 2013. IEEE Transactions on
Education – authorship and content analysis, under
preparation
[11] HERMETIC, 2013. Hermetic Word Frequency Counter.
http://www.hermetic.ch/wfc/wfc.htm

Figure 4: Keyword analysis for research theme extraction