Embed Size (px)
Citation preview

GOVERNMENT OF NCT OF DELHI
ANALYSIS OF THEANALYSIS OF THEANALYSIS OF THEANALYSIS OF THE
BUDGETARY TRANSACTIONS OF BUDGETARY TRANSACTIONS OF BUDGETARY TRANSACTIONS OF BUDGETARY TRANSACTIONS OF
STATE GOVERNMENTSTATE GOVERNMENTSTATE GOVERNMENTSTATE GOVERNMENT
2020202011115555----16161616
DIRECTORATE OF ECONOMICS & STATISTICSDIRECTORATE OF ECONOMICS & STATISTICSDIRECTORATE OF ECONOMICS & STATISTICSDIRECTORATE OF ECONOMICS & STATISTICS
VIKAS BHAWAN-II, 3rd
FLOOR ‘B’ WING,
UPPER BELA ROAD, NEAR METCALF HOUSE,
DELHI- 110054.

GOVERNMENT OF NATIONAL CAPITAL TERRITORY OF DELHIGOVERNMENT OF NATIONAL CAPITAL TERRITORY OF DELHIGOVERNMENT OF NATIONAL CAPITAL TERRITORY OF DELHIGOVERNMENT OF NATIONAL CAPITAL TERRITORY OF DELHI
ANALYSIS OF THE BUDGETARY TRANSACTIONS OF
STATE GOVERNMENT
2015-16
DIRECTORATE OF ECONOMICS & STATISTICS
VIKAS BHAWAN-II, 3rd FLOOR ‘B’ WING, UPPER BELA ROAD, NEAR METCALF HOUSE,
DELHI- 110054.
Tel :23812835, Fax : 23812851, Email : [email protected] Visit our website: www.delhigovt.gov.in

PREFACE
The Present report on Analysis of Budget of Govt. of National Capital Territory
of Delhi is brought out by the Directorate of Economics and Statistics, Delhi as per
the methodology (revised) adopted by the National Accounts Division, Central
Statistics Office, Ministry of Statistics & Programme Implementation, Govt. of India.
In this report, the actual expenditure for the year 2013-14, revised estimates
of expenditure for 2014-15 and budget provisions for 2015-16 of Govt. of National
Capital Territory of Delhi have been reclassified according to economic as well as
purpose categories so as to cull out the extent of capital formation, savings of the
government thereof and its overall contribution to the State Domestic Product.
The ‘Economic Classification’ of the budget reveals the economic magnitude
such as current expenditure, capital expenditure, transfer payments, type of loans
etc., but does not reveal the ultimate object or purpose of the expenditure. Thus,
besides economic classification, the expenditure of the State Government needs to
be classified by the purpose categories viz., Education, Health, Housing, Water
Supply, Sanitation, Welfare and General Services etc. In the present exercise of
Economic-Cum-Purpose Classification of Government Budget Transactions, an
effort has been made to know the Government activities and how expenditure is
distributed among economic categories and estimating Gross State Domestic
Product and its related Economic Aggregates contributed from the Government
Sector.
The strenuous efforts put in by the officers / officials of the State Accounts
Division of the Directorate of Economics & Statistics, Delhi in analyzing the budget
documents, computer applications while processing the data on the software
specially devised by the CSO for Budget analysis and publishing the report, are
highly appreciated.
I hope, this report will be of immense help to the Policy makers, Planners and
Research Scholars interested in the study of budgetary transactions of the Govt. of
N.C.T. of Delhi. It is our constant endeavor to improve the utility of the publication.
Constructive comments and suggestions, if any, for improving the future
publications are welcome.
DELHI ((((Dr. Dr. Dr. Dr. B.K. SHARMAB.K. SHARMAB.K. SHARMAB.K. SHARMA)))) November, 2015 DirectorDirectorDirectorDirector----cumcumcumcum----Special SecretarySpecial SecretarySpecial SecretarySpecial Secretary

TEAM OF OFFICERS ASSOCIATED
WITH THE PREPARATION OF THE REPORT
1. Dr. SHIKHA ANAND : DEPUTY DIRECTOR
2. SH. SHAN-E-ALAM : ASSISTANT DIRECTOR
3. Ms. ANUPAMA : STATISTICAL OFFICER
4. Ms. KAVITA : STATISTICAL ASSISTANT
5. SH. GAURAV VARSHNEY : STATISTICAL ASSISTANT
6. SH. PAWAN KUMAR : STATISTICAL ASSISTANT

CONTENTS
EXECUTIVE SUMMARY i-iv
CHAPTER: 1 INTRODUCTION 1-2
CHAPTER: 2 CONCEPTUAL FRAMEWORK 3-8
PAGE NO.
CHAPTER: 3 BUDGET ANALYSIS 9-23
CHAPTER: 4 PURPOSE –WISE EXPENDITURE OF DELHI
GOVERNMENT (ADMINISTRATIVE DEPARTMENTS) 24-28
STATISTICAL TABLES T.1-T.27
ANNEXURES A-1 to A-4
CHAPTER: 5 A COMPARATIVE OVERVIEW – APPROACHES FOR
EXPENDITURE 29-32

TABLE NO. STATISTICAL TABLES PAGE NO.
2013-14 (Actual)
1 Borrowing Account of Delhi Government T.1
2 Income & Outlay Account T.2
3 Capital Finance Account T.3
4 Estimates of Output of General Government
T.4
5 Estimate of Domestic Product by Industry of Origin and Factor Income
(DCUs)
T.5
6 Industry and Asset wise Capital Formation of General Government
T.6
7 Industry and Asset wise Capital Formation of Departmental Commercial
Undertakings T.7
8 Economic cum Purpose Classification of Delhi Govt. Budget Expenditure T.8-T.9
2014-15 (R.E.)
9 Borrowing Account of Delhi Government T.10
10 Income & Outlay Account T11
11 Capital Finance Account T.12
12 Estimates of Output of General Government
T.13
13 Estimate of Domestic Product by Industry of Origin and Factor Income
(DCUs)
T.14
14 Industry and Asset wise Capital Formation of General Government
T.15
15 Industry and Asset wise Capital Formation of Departmental Commercial
Undertakings T.16
16 Economic cum Purpose Classification of Delhi Govt. Budget Expenditure T.17-T.18
2015-16 (B.E.)
17 Borrowing Account of Delhi Government T.19
18 Income & Outlay Account T.20
19 Capital Finance Account T.21
20 Estimates of Output of General Government
T.22
21 Estimate of Domestic Product by Industry of Origin and Factor Income
(DCUs)
T.23
22 Industry and Asset wise Capital Formation of General Government
T.24
23 Industry and Asset wise Capital Formation of Departmental Commercial
Undertakings T.25
24 Economic cum Purpose Classification of Delhi Govt. Budget Expenditure T.26-T.27

EXECUTIVE
SUMMARY

i
ANALYSIANALYSIANALYSIANALYSIS OF THE BUDGETARY TRANSACTIONSS OF THE BUDGETARY TRANSACTIONSS OF THE BUDGETARY TRANSACTIONSS OF THE BUDGETARY TRANSACTIONS
OFOFOFOF
STATE GOVERNMENTSTATE GOVERNMENTSTATE GOVERNMENTSTATE GOVERNMENT 2012012012015555----16161616
EEXXEECCUUTTIIVVEE SSUUMMMMAARRYY
The following are the main highlights of the analysis of Budget of Government of NCT of
Delhi for the year 2015-16.
A. BUDGETARY RECEIPTS
� The revenue receipts of Delhi Govt. estimated to increase from ` 27980.69 crore in
2013-14 (Actual) to ` 32140.00 crore in 2014-15(RE) and thereafter to ` 38565.00 crore by
2015-16 (BE) there by promising an increase to the tune of nearly 38% during this period
whereas, the increase in revenue receipts during 2013-14(Actual) and 2014-15(RE) were
projected to increase by 15%, while the likely increase during 2014-15(RE) and
2015-16 (BE) is 20%.
� Tax to GSDP ratio of the Delhi Govt. is found to be 6.63% for the year 2013-14 (Actual)
and it was reduced to 6.14% during 2014-15(RE).
� Taxes and interest taken together accounted for more than 94% of revenue receipts during
the year 2013-14(Actual).
B. BUDGETARY EXPENDITURE/OUTLAYS
� Total disbursement of Delhi Govt. was ` 34051.60 crore in 2013-14(Actual) while the
total outlays for 2014-15(RE) and 2015-16 (BE) were to the tune of ` 34790.00 Crore and
` 41129.00 crore respectively.
� Expenditure towards Advances (16.60%), Current Transfers (25.61%), Interest Payment
(8.29%), Compensation to Employees (16.29%) and New Construction (12.28%) taken
together accounted for around 79% of the total. This trend continued during the subsequent
years with some minor deviations.
� The component of Gross expenditure/outlay on compensation to employees has been
` 5547.98 crore, ` 6502.94 crore and ` 7816.49 crore in the years 2013-14 (A/c), 2014-15
(RE) and 2015-16 (BE) respectively.

ii
� The component of Compensation to employees on Education Services was found to be
` 2968.47 crore, ` 3462.89 crore and ` 4275.52 crore in the years 2013-14 (Actual), 2014-
15 (RE) and 2015-16 (BE) respectively.
� The component of Compensation to employees on Medical & Public Health Services was
found to be ` 1061.82 crore, ` 1187.01 crore and ` 1349.95 crore in the years 2013-14
(Actual), 2014-15 (RE) and 2015-16 (BE) respectively.
� Expenditure/Outlay on Purchase of Goods and Services including Maintenance has been
` 3280.57 crore, ` 3697.31 crore and ` 4840.13 crore in the years 2013-14 (A/c), 2014-15
(RE) and 2015-16 (BE) respectively. It was estimated to 0.84% of the GSDP of Delhi at
current prices for the year 2013-14 and 0.82% for the year 2014-15.
� The component of Gross expenditure/Outlay on current transfer including subsidies has
been ` 8721.76 crore, ` 9802.05 crore and ` 11717.53 crore in the years 2013-14 (A/c),
2014-15 (RE) and 2015-16 (BE) respectively. Current Transfers or grants include grants to
aided schools, scholarships and stipends, welfare of the weaker sections of the society,
private institutions, local bodies and autonomous bodies, whereas major chunk of the
expenditure/outlay on subsidies is spent on concessional passes given by the DTC to the
consumers, compensation for meeting deficit of cluster buses and for working deficit and
subsidies paid to the consumers through DISCOMS.
� The component of Gross expenditure/outlay on new construction has been ` 4180.66
crore, ` 4314.45 crore and ` 6379.49 crore in the years 2013-14 (A/c), 2014-15 (RE) and
2015-16 (BE) respectively. New construction work covers all activities connected with
alteration, addition and construction of residential and office buildings, roads and bridges and
other construction works.
� The component of Gross expenditure/outlay on Machinery and Equipments, including
Transport, Information & Communication Technology and Software has been ` 126.29 crore,
` 246.26 crore and ` 436.88 croe in the years 2013-14 (A/c), 2014-15 (RE) and 2015-16
(BE) respectively.
� The component of Gross expenditure/outlay on cultivated assets outlay has been ` 1.61
crore, ` 1.65 crore and ` 2.25 crore in the years 2013-14 (A/c), 2014-15 (RE) and 2015-16
iii
(BE) respectively. It includes plantations, orchards and other cash crops having life for more
than one year.
� The component of Gross expenditure/outlay on Financial Assets has been ` 672.20 crore,
` 864.00 crore and ` 887.99 crore in the years 2013-14 (A/c), 2014-15 (RE) and 2015-16
(BE) respectively. All investments in the share capitals in statutory corporations, cooperative
societies are classified as financial assets. Major chunk of the expenditure/outlay on Financial
Assets is spent on investments in equity capital to MRT Authority, DTC, JVC Power Plant at
Jhajjar, equity for integrated Power development Scheme and Delhi Renewable Energy and
Power companies etc.
� The component of Gross expenditure on Second Hand Assets, Land and Change in Stock
has been ` 132.51 crore, ` 160.80 crore and ` 151.00 crore in the years 2013-14 (A/c), 2014-
15 (RE) and 2015-16 (BE) respectively. The major chunk of the expenditure/outlay under
this component is spent on purchase of land for new bus terminal, new inspection pit and for
power project.
� The component of Gross expenditure/outlay on Capital Transfers has been ` 1569.86
crore, ` 2271.30 crore and ` 2220.55 crore in the years 2013-14 (A/c), 2014-15 (RE) and
2015-16 (BE) respectively. It covers grants to finance the construction of buildings, purchase
of machinery and equipments and for public works, water supply and sewage disposal
schemes etc. They are intended to assist capital formation in other sectors of economy.
� The component of Gross expenditure/outlay on creation of funds has been ` 16.21 crore,
` 40.37 crore and ` 10.00 crore in the years 2013-14 (A/c), 2014-15 (RE) and 2015-16 (BE)
respectively.
� The component of Gross expenditure/outlay on Interest Payments has been ` 2824.29
crore, ` 3074.06 crore and ` 3227.74 crore in the years 2013-14 (A/c), 2014-15 (RE) and
2015-16 (BE) respectively. It comprises expenditure/outlay towards the interest payment to
the Central Govt. on account of loans and advances from the Central Govt.
� The component of Gross expenditure/outlay on Advances to Local Bodies and Others has
been ` 5652.37 crore, ` 2138.06 crore and ` 1673.77 crore in the years 2013-14 (A/c), 2014-
15 (RE) and 2015-16 (BE) respectively. It comprises Loans and Advances along with
special loans to the Delhi Jal Board for sewerage, sanitation and water supply, Loans and

iv
Advances to North East & South DMCs for development works, Loans to the DTC for Road
Transport, loans to DTL for power projects, Loans to Indraprastha Institute of Information
Technology and DSFDC. It also includes loans and advances to the Govt. employees for
House Building, purchase of motor conveyance and purchase of computers etc.
� The component of Gross expenditure/outlay on Repayments of Loans has been ` 1325.29
crore, ` 1676.75 crore and ` 1765.18 crore in the years 2013-14 (A/c), 2014-15 (RE) and
2015-16 (BE) respectively.
C. GROSS SAVINGS
� Delhi Government’s gross savings during 2013-14 were ` 6871.44 crore and the same is
expected to increase to ` 8117.48 crore by the end of 2014-15 as per Revised Estimates and
may progress to ` 10102.27 crore in 2015-16 as per Budget Estimates.
D. PURPOSE-WISE CLASSIFICATION OF EXPENDITURE
� Percentage wise distribution of expenditure reveals that during 2013-14, maximum
expenditure in terms of percentage was incurred on Education (22.48%) followed by
Transport & Communication (17.68%), Electricity, Gas & Steam (15.87%), General
Public Services (12.84%) Housing & Other Community Amenities (9.95%), , Medical &
Public Health (8.20%). Similarly, the dominant share during 2015-16 goes to areas like
Education (30.16%), General Public Services(16.12%), Transport & Communication
(14.26%), Medical & Public Health (10.98) and Housing & other Community Amenities
(8.74%).
E. GROSS CAPITAL FORMATION
� Gross Capital Formation (GCF) is expected to be ` 4562.36 crore during the year 2014-
15, as compared to the amount of actual Gross Capital Formation of ` 4308.56 crore during
2013-14. Keeping budget provisions in view for 2015-16, there is likelihood that Gross
Capital Formation will be ` 6818.62 crore.
⌧⌧⌧

INTRODUCTIONINTRODUCTIONINTRODUCTIONINTRODUCTION
The budget of a government is a summary or plan of the intended revenues and
expenditures of that government for the ensuing fiscal year. In modern industrial economies, the
budget is considered as the key instrument for the execution of economic policies of government.
It also serves as an effective tool for ensuring administrative accountability & legislative control
and above all a source for social audit in the present age of information and public awareness.
Because government budgets aims at economic growth in different sectors of the economy it is a
source of rich information for Economists, Researchers and State Income compilers. Therefore,
budget analysis has come to occupy the centre stage in the process of estimation of State income
of the state.
OBJECTIVE, SCOPE & COVERAGE
Budget Analysis is perceived as a powerful tool to measure and monitor its impact on state
domestic product. It is a process through which aggregates of income and expenditure are culled
out by reclassifying data available from budgetary transactions and there after correlate them to
the major sectors of the economy. At the out set, the reclassified budgetary information of state
government will be integrated with the similar data from other sources on respective sectors for
coming out with necessary outputs for use under the state income accounting. The scope of the
present report is confined to the analysis of Budget of Govt. of NCT of Delhi viz. 2013-14 actual
expenditure, 2014-15 revised estimates and 2015-16 budget estimates.
CLASSIFICATION OF GOVT EXPENDITURE
For the purpose of budget analysis the government expenditure can broadly be classified as under :-
(i) Economic: Economic character of the expenditure like current expenditure, capital
expenditure, loans etc., and
(ii) Purpose: The purpose it is likely to serve, such as, health, education, social
security & welfare services, etc.
Chapter 1

2
The combination of Economic and Purpose Classification, explains how expenditure for a
particular purpose is divided between different economic categories and vice-versa. The adoption
of Economic-cum-Purpose classification during the course of budget analysis gives a meaningful
presentation of the government’s spending and help to draw logical conclusions about the same.
SCHEME OF THE REPORT:
The report is presented in five sections. Conceptual issues have been discussed in Chapter
Two, Chapter Three deals with actual analysis part, while Chapter four deals with purpose-wise
classification along with Gross capital formation. Detailed statistical tables are in Chapter five.
Explanatory notes pertaining to the report are kept at Annexure for the benefit of data users.
⌧⌧⌧

3
CONCEPTUAL FRAME WORKCONCEPTUAL FRAME WORKCONCEPTUAL FRAME WORKCONCEPTUAL FRAME WORK
Budget Analysis is carried out as per the methodology recommended by the Committee on
National Accounts /Regional Accounts System. However, appropriate amendments in the
prescribed methodology were made wherever necessary to suit to the specific needs of analysis of
state budget. The concepts / definitions adopted like nature of accounts viz., Income and
Outlay Account of Administrative Departments, Capital Finance Account of General Government,
Production Account of Departmental Commercial Undertakings and Production Accounts of Govt.
Services nature and coverage of economic and purpose categorization are discussed in detail in
this section.
INCOME AND OUTLAY ACCOUNT OF ADMINISTRATIVE DEPARTMENTS:
This account deals with the current revenue and expenditure of administrative departments.
For the purpose of economic classification, administrative departments shall be taken to mean all
those departments, which are not commercial in nature.
The current expenditure of administrative departments consists of final outlays of
government on current account and there by represent government’s current consumption. The
final outlays include purchase of goods and services and payments towards wages and salaries.
They also include transfer payments like interest, grants, subsidies, scholarships, etc., to the rest of
economy.
The current income that accrues to the government’s exchequer through a variety of taxes,
miscellaneous fees, etc., constitutes receipts to the administration. In addition, government has an
investment income from property and entrepreneurship and also receives revenue grants,
contributions and recoveries from the Union Government and rest of the economy. This current
income is appropriated to meet the current expenditure of administrative departments and the
Chapter 2

4
excess of current receipts over current expenditure therefore denotes the saving of the government
administration and at the outset becomes available for domestic capital formation.
CAPITAL FINANCE ACCOUNT OF GENRAL GOVERNMENT:
This account is concerned with the total capital formation in government administration
and departmental commercial undertakings taken together. It also includes capital transfer
payments as they assist in capital formation in the rest of the economy. The capital expenditure in
government administration and departmental commercial undertakings have been presented
separately whereas the sources of finance are common to both.
PRODUCTION ACCOUNT OF D. C. Us OF DELHI GOVERNMENT:
Departmental Commercial Undertakings (DCUs) may briefly be defined as agencies
engaged in production & distribution of goods and services that are meant for marketing. As a
result these DCUs are expected to function like any commercial organizations and meet most of
their costs from their sale proceeds. However, it does not include independent statutory
corporations and boards set up by the state government and hence are excluded from the purview
of those commercial undertakings included in this Account. This commercial character clearly
distinguishes these departments from other set of administrative departments in government. The
broad areas in which DCUs are engaged/involved include Agriculture (Irrigation), Forests,
Manufacturing/ Milk Supply Schemes/ Printing Presses, Electricity, Transport - (a) Road & Water
(b) Civil Aviation (c) Ports & Light Houses, Communications, Trade & Hotels, Other Services. In
NCT Delhi only irrigation and forests have been considered as DCUs.
The input component of the departmental commercial undertakings is the current
expenditure in terms of wages and salaries, purchase of goods and services, interest, consumption
of fixed capital where as the output being the revenue side of the Account includes commercial
receipts from sale of goods and services, imputed subsidy which otherwise is loss on account of
irrigation and by definition, treated as subsidy and is shown as imputed irrigation charges.

5
PRODUCTION ACCOUNT OF GOVT. SERVICES:
Under this account, gross output is comprised of (i) services produced for own use of
administrative departments (as explained already under the final consumption expenditure of
Income & Outlay Account) and (ii) sale of goods & services, while gross input is inclusive of (i)
Intermediate consumption (ii) Compensation of employees and (iii) Consumption of fixed capital.
ECONOMIC CLASSIFICATION OF ADMINISTRATIVE DEPARTMENTS:
This system of classification is adopted for analysing the economic impact of budgetary
transactions on the rest of the economy. According to this classification current transactions are
distinguished from capital transactions and in both the cases, transactions in goods and services
are separated from transfers. The current transactions of the departmental commercial
undertakings are at par with those of producers, and that of the purely administrative departments
with those of consumers. Current receipts of the former constitute sale proceeds of goods and
services supplied to the rest of the economy while purely administrative departments have little or
no income of their own and largely rely upon the incomes of other sectors to meet their
expenditure. Current expenditure of commercial undertakings, like working expenses of
productive enterprises are intermediate expenses that go to form prices of goods and services
purchased. These are different in character from the current expenditure on wages and salaries
and goods purchased by the administrative departments, which are in the nature of consumption
outlays and represent demand for goods and services for final consumption.
Budget, though divided into revenue and capital head of accounts, many items of revenue
expenditure are included in the capital account and vice versa. The economic classification of
government transactions basically follows the technique of social accounting by grouping of
similar types after eliminating all internal transfers. To illustrate, if revenue account shows certain
transfers to and from the capital account they have to be eliminated as they will have no impact on
the economy. On the contrary, it may be possible that revenue expenditures or capital outlays are
reduced to the extent that they are met by transfers from funds. This deflates the expenditure and
does not give the total expenditure or aggregate demands made by the government on goods and
services available. For a correct appraisal of government demand for goods and services, which

6
could be related to available supplies, revenue and capital expenditure have to be increased by the
amount met from these transfers from the state operated funds.
Reference may also be made to a third type of adjustments made in the classification
scheme. The demands for grants in the budget first show expenditure inclusive of all recoveries
but subsequently recoveries are deducted and only the net figures are shown in the Financial
Statement. For purposes of economic classification, expenditures are shown net of recoveries
from all outside sectors except recoveries, which are in the nature of sale of goods and services.
These recoveries in turn are deducted from the purchase of goods and services of the government.
It is only after reclassification and regrouping on the lines indicated above that it will be
possible to analyze the economic impact of the state government’s budgetary transactions on the
rest of the economy. The term “rest of the economy” refers to all the entities other than the state
government and includes the central government, other state governments, the local bodies,
statutory public undertakings, private commercial and non-commercial corporations or companies
and individuals.
PURPOSE CLASSIFICATION OF ADMINISTRATIVE DEPARTMENTS:
The objective of the purpose classification is to reclassify expenditures in accordance with
the immediate or short-term social needs of the state and it relates only to general government
expenditures excluding departmental commercial undertakings.
The budget is presented under a few standard account heads of the functional character for
example education, health, agriculture, industry, transport etc. However, the expenditures shown
under these account heads need not necessarily be in accordance with the principles of purpose
classification. For instance, expenditures on medical colleges and other educational institutions
are generally shown under account head “medical”, expenditure on youth welfare and cultural
activities are shown under “education” and so on. Further, there can be various account heads,
which pertain to multiple purpose categories such as public works department, community
development, cooperation etc. Thus, expenditure under each of these Account heads is not

7
specific to any purpose category. It becomes, therefore, essential to re classify these heads of
expenditure afresh.
The purpose classification adopted for the present report is in conformity with the United
Nations’ recommended classification of 10 major categories. Following table gives details of the
categories / sub-categories adopted by Delhi State for Purpose Classification:-
Code Major Category Code Sub Category
1 General Public
Services
1.1 General Admn., External Affairs, Public Order &
Safety
1.1.1 Public Order & Safety
1.1.2 Planning & Statistical Activities
1.1.3 General Admn., External Affairs, Public Order &
Safety n.e.c.
1.2 General Research
2 Defence including Civil Defence
3 Education Affairs
and Services
3.1 Administration, Regulation and Research
3.1.1 Primary Education
3.1.2 Secondary Education
3.1.3 Higher Education
3.1.4 Other Educational Administration n.e.c.
3.2 Educational Services
3.2.1 Primary Education
3.2.2 Secondary Education
3.2.3 Higher Education
3.2.4 Educational Services n.e.c.
4 Health Affairs and
Services
4.1 Administration, Regulation and Research
4.1.1 Allopathic
4.1.2 Homeopathic
4.1.3 Ayurvedic
4.1.4 Unani
4.1.5 Other Medical Administration n.e.c.
4.2 Health Services
4.2.1 Allopathic
4.2.2 Homeopathic
4.2.3 Ayurvedic
4.2.4 Unani
4.2.5 Other Medical Services n.e.c.

8
5 Social Security/
Welfare Affairs and
Services
5.1 Social Security Affairs and Services
5.2 Welfare Affairs and Services
5.3 Social Security and Welfare Affairs / Services n.e.c.
6 Housing/Community
Amenities
Affairs/Services
6.1 Housing and Community Services
6.2 Sanitary Affairs and Services
6.3 Housing, Community Amenity Affairs / Services
n.e.c.
7 Cultural,
Recreational /
Religious
Affairs/Services
7.1 Art and Cultural Affairs / Services
7.2 Recreational and Sporting Services
7.3 Tourism Affairs & Services
7.4 Cultural/Recreational /Religious Affairs & Services
n.e.c.
Code Major Category Code Sub Category
8 Economic Affairs
and Services
8.1 General Admn, Regulation, Research and Labour
8.2 Agriculture, Forestry, Fishing and Hunting
8.3 Mining, Manufacturing and Construction
8.4 Electricity, Gas, Steam and Other Sources of Energy
8.4.1 Electricity, Gas and Steam
8.4.2 Atomic Energy
8.4.3 Non-conventional Sources of Energy
8.5 Drinking Water Supply
8.6 Transport and Communication
8.6.1 Road Transport
8.6.2 Water Transport
8.6.3 Air Transport
8.6.4 Transport and Communication n.e.c., Railway
8.7 Other Economic Services n.e.c.
9 Environmental
Protection
9.1 Waste Management
9.2 Waste Water Management
9.3 Prevention & Control of Pollution
9.4 Environmental Research & Education
9.5 Environmental Protection n.e.c.
10 Other Services 10.1 Relief on Calamities
10.2 Other Miscellaneous Services n.e.c.
⌧⌧⌧

9
BUDGET ANALYSIS BUDGET ANALYSIS BUDGET ANALYSIS BUDGET ANALYSIS
This section is devoted to the presentation results of budget analysis of Delhi government budgets
for the years 2013-14, 2014-15 and 2015-16. It is essential to note that whenever reference is made to
2013-14 (A/c) it may mean actual / final where as it denotes revised estimates for 2014-15 (RE) while for
the year 2015-16 (BE) the figures are simply budget estimates. In other words, data of 2014-15 and 2015-
16 are purely provisional and they will get concretized in the coming year.
TOTAL BUDGETARY RECEIPTS:
Monetary receipts displayed in statement No 3.1 includes current income accrued /
estimated to accrue to the government on different accounts like taxes (both Product &
Production), interest, revenue grants, income from DCUs etc., in the year under reference. The
extra budgetary funds that flow into government account either in the form of borrowings from
Union Govt. or mobilized from public debt and recoveries made by govt. or loans / advances
extended in the past, are also clubbed to the revenue receipts to arrive at the gross receipts as such
funds are available for spending in the hands of Government for that year.
The study of pattern of receipts revealed that taxes and interest occupy the dominant
position as both of them taken together accounted for approximately 94% of revenue receipts
during 2013-14. Loans and advances usually help in the balancing act between current revenues
and current outlays. Statement 3.1 reveals that revenue receipts of Delhi Govt. estimated to gallop
from ` 2798069 lakh in 2013-14 to ` 3856500 lakh by 2015-16, while they are expected to
increase by 20% during 2014-15 and 2015-16. Revenue receipts during 2013-14 and 2014-15 are
projected to increase by 15%. Analysis of budgetary revenues will not be complete without the
reference of the expenditure / outlay commitments during the respective years under different
heads and the foregoing analysis will focus on this aspect.
Chapter 3

10
Statement: 3.1 - Distribution of Gross Receipts
S.No. ITEMS 2013-14 (A/c) 2014-15 (RE) 2015-16 (BE)
A. REVENUE RECEIPTS (` Lakh) (` Lakh) (` Lakh)
1 Taxes (Product & Production) 2592674
(92.66)
2768016
(86.12)
3467320
(89.91)
2 Misc. Receipts
(Fine, Fees & Forfeitures)
8967
(0.32)
10280
(0.32)
11346
(0.29)
3 Interest 37935
(1.36)
60400
(1.88)
74000
(1.92) 4 Property Receipts 5641
(0.20)
7521
(0.23)
8026
(0.21)
5 Revenue Grants from GOI 140286
(5.01)
350600
(10.91)
277700
(7.20) 6 Transfer from Non-Govt. 0
(0.00)
0
(0.00)
0
(0.00) 7 Withdrawals from funds 0
(0.00)
0
(0.00)
0
(0.00)
8 Sale of Assets 0
(0.00)
0
(0.00)
0
(0.00) 9 Sale of Goods & Services including
Commercial Receipts
12566
(0.45)
17183
(0.53)
18108
(0.47)
Sub Total (A) 2798069
(100)
3214000
(100)
3856500
(100) B. LOAN & ADVANCES
10 Loan from GOI / Public Debt 416289 120000 103813
11 Recovery of Loan & Advances 80291 61900 38100
Sub Total (B) 496580 181900 141913
GROSS RECEIPTS (A+B) 3294649 3395900 3998413
N.B.: - Figures in parenthesis indicate the percentage to the Revenue Receipts
PERCENTAGE BREAKUP OF REVENUE RECEIPTS
93% 86% 90%
11% 2%2%
1% 7%5%1%1%
1%
0%
20%
40%
60%
80%
100%
2013-14(A/c) 2014-15(RE) 2015-16 (BE)
Year
percentage
percentage
percentage
percentage
Taxes Interest Grants from GOI Others

11
TOTAL DISBURSEMENTS/ OUTLAYS:
The theme or the focus of the budget is visible from the funds allocated or expenditure incurred, as
the case may be, under different economic activities. The unveiling of scheme of budgetary spending
outlines the broad policy framework of the government. Statement 3.2 provides the break-up of
Expenditure/Outlays for the years 2013-14, 2014-15 and 2015-16.
During 2013-14, expenditure towards Advances (16.60%), Current Transfers (25.61%), Interest
Payment (8.29%), Compensation to Employees (16.29%) and New Construction (12.28%) taken together
accounted for around 79% of the total. This trend continued during the subsequent years with some minor
deviations.
The share of Repayment of Loans to Government of India to the total outlay was 3.89% during
2013-14 as against 4.82% during 2014-15 and for 2015-16, it is likely to be 4.29%. In absolute terms,
Delhi Govt. had repaid ` 132529 Lakh in 2013-14 and expected to make payment of ` 167675 Lakh during
2014-15 against its borrowing from Union Government. For 2015-16, `176518 Lakh is proposed to make
Repayment of Loan to Government of India. More details on classification of expenditure are available in
the next paragraphs.
PERCENTAGE BREAKUP OF BUDGET OUTLAY 2015-16 (BE)
4.0715.51
19
33.89
7.85
19.68
Advances New ConstructionsCompensation of Employees Current & capital TransfersInterest Payment Others

12
Statement: 3.2 - Distribution of Gross Expenditure/Outlays
S.No. ITEMS 2013-14 (A/c) 2014-15 (RE) 2015-16 (BE)
(`̀̀̀ Lakh) (`̀̀̀ Lakh) (`̀̀̀ Lakh)
1 Compensation of Employees 554798
(16.29)
650294
(18.69)
781649
(19.00)
2 Purchase of Goods & Services
(including Maintenance and
Transfers in kind)
328057
(9.64)
369731
(10.63)
484013
(11.77)
3 Current transfers including Subsidy 872176
(25.61)
980205
(28.17)
1171753
(28.49)
4 New Construction 418066
(12.28)
431445
(12.40)
637949
(15.51)
5 Machinery & Equipments including
Transport, ICT & Software
12629
(0.37)
24626
(0.71)
43688
(1.06)
6 Cultivated Assets 161
(0.01)
165
(0.00)
225
(0.01)
7 Financial Assets 67220
(1.97)
86400
(2.48)
88799
(2.16)
8 Second Hand Assets, land & Change
in stock
13251
(0.39)
16080
(0.46)
15100
(0.37)
9 Capital Transfers 156986
(4.61)
227130
(6.53)
222055
(5.40)
10 Creation of Funds (Reserve) 1621
(0.05)
4037
(0.12)
1000
(0.02)
11 Interest payment 282429
(8.29)
307406
(8.84)
322774
(7.85)
12 Advances to Local Bodies and Others 565237
(16.60)
213806
(6.15)
167377
(4.07)
13 Repayment of Loan to Central
Government
132529
(3.89)
167675
(4.82)
176518
(4.29)
TOTAL OUTLAY
3405160
(100.00)
3479000
(100.00)
4112900
(100.00)
N.B.:- Figures in parenthesis indicate percentage to the Total Outlay
13
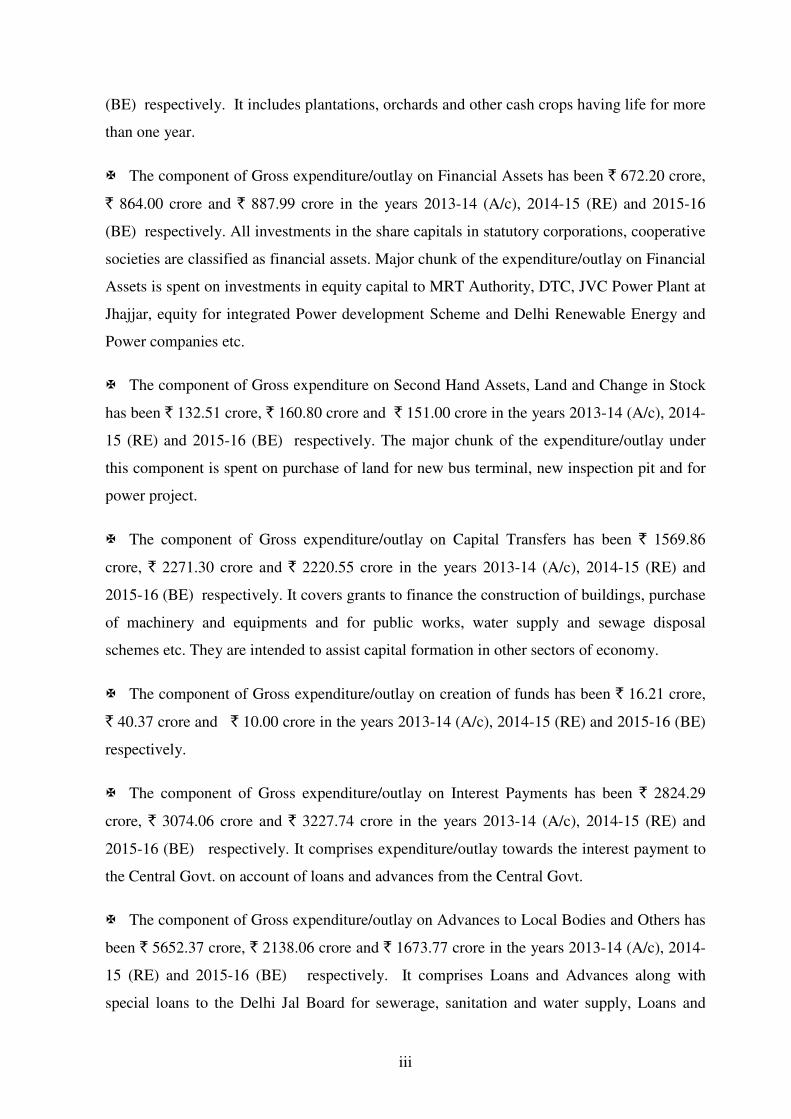
1. Compensation of Employees:
This item comprises expenditure in all forms of remuneration of Government employees such as
salaries, wages, allowances, medical treatment, overtime allowances, LTC, Uniforms/clothing and
honorarium other than traveling and daily allowances.
The component of Gross expenditure has been ` 554798 lakh, ` 650294 lakh and ` 781649 lakh in
the years 2013-14 (A/c), 2014-15 (RE) and 2015-16 (BE) respectively. It is also to be noticed here that the
growth over previous year have been 17.21% in 2014-15 (RE) and 20.20% in 2015-16 (BE).
Compensation of Employees
554798
781649650294
0100000200000300000400000500000600000700000800000900000
2013-14(A/c) 2014-15 (RE) 2015-16 (BE)
Year
`̀̀̀ in
lakh
2. Purchase of Goods and Services including Maintenance and Transfers in kind
This includes all contingent expenditure on items such as office supplies, rent, rates & taxes, fuel
and light, printing, travel expenses, telephone and telegraph charges and other items for current operations
including the expenditure on current repairs and maintenance. Maintenance covers expenditure towards
building, roads, machinery etc. Transfers in kind such as Mid day meal scheme, distribution of nutritious
food and beverages, free supply of books and Stationery to SC students in school are also included here.
Expenditure/Outlay on Purchase of Goods and Services including Maintenance has been
` 328057 lakh, ` 369731 lakh and ` 484013 lakh in the years 2013-14 (A/c), 2014-15 (RE) and 2015-16
(BE) respectively. It is also to be noticed here that the growth over previous year have been 12.70% in
2014-15 (RE) and 30.91% in 2015-16 (BE).
Purchase of Goods and Services
including Maintenance and Transfers in kind
369731484013
328057
0100000200000300000400000500000600000
2013-14(A/c) 2014-15. (RE) 2015-16(BE)
Year
`̀̀̀ i
n l
akh

14
3. Current Transfers including subsidy
Current Transfers or grants include grants to aided schools, scholarships and stipends, welfare of
the weaker sections of the society, private institutions, local bodies and autonomous bodies.
The subsidies are current unrequited payments that government units including non-resident
government units make to enterprises on the basis of the levels of their production activities or the
quantities or value of goods or services which they produce, sell or import. Major chunk of the
expenditure/outlay on subsidies is spent on concessional passes given by the DTC to the consumers,
compensation for meeting deficit of cluster buses and for working deficit and subsidies paid to the
consumers through DISCOMS.
The component of Gross Expenditure/Outlay has been ` 872176 lakh, ` 980205 lakh and
` 1171753 lakh in the years 2013-14 (A/c), 2014-15 (RE) and 2015-16 (BE) respectively. It is also to be
noticed here that the growth over previous year have been 12.39% in 2014-15 (RE) and 19.54% in 2015-16
(BE).
Current Transfers including subsidy
9802051171753
872176
0400000800000
12000001600000
2013-14(A/c) 2014-15 (RE) 2015-16 (BE)
Year
`̀̀̀ i
n l
akh
4. New Constructions
New construction work covers all activities connected with addition & alteration, and construction
of residential and office buildings, roads and bridges and other construction works.
The component of Gross Expenditure/outlay has been ` 418066 lakh, ` 431445 lakh and ` 637949
lakh in the years 2013-14 (A/c), 2014-15 (RE) and 2015-16 (BE) respectively. It is also to be noticed here
that the increase over previous year have been 3.20% in 2014-15 (RE) and 47.86% in 2015-16 (BE).
New Construction
431445637949
418066
0200000400000600000800000
2013-14 (A/c) 2014-15(RE) 2015-16(BE)
Year
`̀̀̀ i
n l
akh

15
5. Machinery and Equipments, including Transport, Information & Communication
Technology equipments and Software
It include expenditure incurred on the purchase of various machinery such as power generating
machinery, agricultural machinery and implements, machinery and equipments and instruments used by
professional men. Transport equipments include expenditure incurred on the purchase of buses, jeeps,
trucks, tractors for road haulage. Software expenditure includes expenditure on software purchased
exclusively or developed in-house. However, the software which is inseparable with the computer such as
operating system and expenditure on Wi-Fi Facilities etc. has to be included in the Information &
Communication Technology equipments.
The component of Gross Expenditure/outlay has been ` 12629 lakh, ` 24626 lakh and ` 43688
lakh in the years 2013-14 (A/c), 2014-15 (RE) and 2015-16 (BE) respectively and have shown a growth of
95% in 2014-15 (RE) and 77.41% in 2015-16 (BE) over previous year.
Machinery and Equipments, including Transport,
Information & Communication Technology equipments and Software
24626
43688
12629
01000020000300004000050000
2013-14 (A/c) 2014-15(RE) 2015-16 (BE)
Year
`̀̀̀ in
lakh
6. Cultivated Assets
It includes plantations, orchards and other cash crops having life for more than one year.
The component of Gross expenditure/outlay has been ` 161 lakh, ` 165 lakh and ` 225 lakh in the
years 2013-14 (A/c), 2014-15 (RE) and 2015-16 (BE) respectively. Cultivated Assets is seen to have
increased d by 2.48% in 2014-15 and 36.36% in 2015-16 (BE) over previous year.
Cultivated Assets
165 225161
0500
1000150020002500
2013-14 (A/c) 2014-15(RE) 2015-16(BE)
Year
`̀̀̀ in
lakh

16
7. Financial Assets
All investments in the share capitals in statutory corporations, cooperative societies are classified
as financial assets. Major chunk of the expenditure/outlay on Financial Assets is spent on investments in
equity capital to MRT Authority, DTC, JVC Power Plant at Jhajjar, equity for integrated Power
development Scheme and Delhi Renewable Energy and Power companies etc.
The component of Gross Expenditure/outlay has been ` 67220 lakh, ` 86400 lakh and ` 88799 lakh
in the years 2013-14 (A/c), 2014-15 (RE) and 2015-16 (BE) respectively. It is also to be noticed here that
the growth over previous year has been 28.53% in 2014-15 and 2.78% in 2015-16.
Financial Assets
86400 8879967220
0
50000
100000
150000
200000
2013-14(A/c) 2014-15 (RE) 2015-16 (BE)
Year
`̀̀̀ i
n l
ak
h
8. Second Hand Assets, Land and Change in Stock
The major part of the Expenditure/Outlay under this component is spent on purchase of land for
new bus terminal, new inspection pit and for power project.
The component of Gross expenditure has been ` 13251 lakh, ` 16080 lakh and ` 15100 lakh in the
years 2013-14 (A/c), 2014-15 (RE) and 2015-16 (BE) respectively. It is also to be noticed here that the
growth over previous year has been 21.35% in 2013-14 and a negative growth of (-)6.09% has been
noticed in 2015-16.
Second Hand Assets, Land and Change in Stock
16080 1510013251
0250050007500
10000125001500017500
2013-14 (A/c) 2014-15(RE) 2015-16 (BE)
Year
`̀̀̀ i
n l
akh

17
9. Capital Transfers
It covers grants to finance the construction of buildings, purchase of machinery and equipments
and for public works, water supply and sewage disposal schemes etc. They are intended to assist capital
formation in other sectors of economy.
The component of Gross Expenditure/Outlay has been ` 156986 lakh, ` 227130 lakh and ` 222055
lakh in the years 2013-14 (A/c), 2014-15 (RE) and 2015-16 (BE) respectively. It is also to be noticed here
that the growth over previous year have been 44.68% in 2014-15 and (-) 2.23% in 2015-16.
Capital Transfers
227130 222055
156986
0
100000
200000
300000
2013-14 (A/c) 2014-15(RE) 2015-16(BE)
Year
`̀̀̀ i
n l
ak
h
10. Creation of Funds (Reserve)
Funds are created by Government to meet the untoward and unforeseen expenditure, relating to
Natural Calamities, Reduction and Avoidance of Debt, Flood Control, Drainage, construction of Roads &
Bridges, Energy & Power, Civil Supplies, Village & Small Industries, Social Security & Welfare etc.
The component of Gross Expenditure/Outlay has been ` 1621 lakh, ` 4037 lakh and ` 1000 lakh
in the years 2013-14 (A/c), 2014-15 (RE) and 2015-16 (BE) respectively. It is also to be noticed here that
the growth over previous year has been 149.04% in 2014-15 and a decline of (-)75.23% has been noticed in
2015-16.
Creation of Funds (Reserve)
403710001621
0
4000
8000
12000
2013-14 (A/c) 2014-15 (RE) 2015-16 (BE)
Year
`̀̀̀ i
n l
akh

18
11. Interest Payment
It comprises expenditure/outlay towards the interest payment to the Central Govt. on account of
loans and advances from the Central Govt.
The component of Gross expenditure/outlay has been ` 282429 lakh, ` 307406 lakh and ` 322774
lakh in the years 2013-14 (A/c), 2014-15 (RE) and 2015-16 (BE) respectively. It is also to be noticed here
that the growth over previous year has been 8.84% in 2014-15 and a growth of 5.00% in 2015-16.
Interest Payment
307406 322774282429
50000
200000
350000
2013-14 (A/c) 2014-15 (RE) 2015-16 (BE)
Year
`̀̀̀ in
la
kh
12. Advances to Local Bodies and Others
It comprises Loans and Advances along with special loans to the Delhi Jal Board for sewerage,
sanitation and water supply, Loans and Advances to North East & South DMCs for development works,
Loans to the DTC for Road Transport, loans to DTL for power projects, Loans to Indraprastha Institute of
Information Technology and DSFDC. It also includes loans and advances to the Govt. employees for
House Building, purchase of motor conveyance and purchase of computers etc.
The component of Gross Expenditure/Outlay has been ` 565237 lakh, ` 213806 lakh and ` 167377
lakh in the years 2013-14 (A/c), 2014-15 (RE) and 2015-16 (BE) respectively. It is also to be noticed
here that the decline over previous year has been (-) 62.17% in 2014-15 and (-) 21.72% in 2015-16.
Advances to Local Bodies and Others
213806 167377
565237
0
200000
400000
600000
2013-14(A/c) 2014-15 (RE) 2015-16 (BE)
Year
`̀̀̀ in
la
kh

19
13. Repayment of loan to Central Government
The component of Gross expenditure/outlay has been ` 132529 lakh, ` 167675 lakh and
` 176518 lakh in the years 2013-14 (A/c), 2014-15 (RE) and 2015-16 (BE) respectively. It is also to be
noticed here that the growth over previous year has been 26.52% in 2014-15 and 5.27% in 2015-16.
Repayment of loan to Central Government
167675 176518
132529
0
50000
100000
150000
200000
2013-14(A/c) 2014-15 (RE) 2015-16 (BE)
Year
`̀̀̀ i
n l
ak
h
32
94
64
9
34
05
16
0
33
95
90
0
34
79
00
0 39
98
41
3
41
12
90
0
0
500000
1000000
1500000
2000000
2500000
3000000
3500000
4000000
4500000
`̀̀̀ i
n l
ak
h
2013-14(A/c) 2014-15 (RE) 2015-16(BE)
Year
BUDGETARY RECEIPTS & OUTLAYS
Receipts Outlay

20
GROSS SAVINGS:
Gross savings of State Govt. comprises of the surplus on current account and provision for
consumption of fixed capital in respect of Administrative Departments. Delhi Govt.’s Gross Savings
during 2013-14 were ` 687144 lakh and the same is expected to reached at ` 1010227 lakh by the end of
2015-16 as per budget estimates.
Statement: 3.3 - Distribution of Gross Savings of Administrative Departments
DELHI GOVT. (AdmnDeptts.) 2013-14(A/c) 2014-15(RE) 2015-16(BE)
S.No. Item
(` Lakh) (` Lakh) (` Lakh)
1 Current Receipts 2785503 3197842 3838782
2 Current Expenditure 2098359 2386094 2828555
3 Surplus on Current A/c (1-2) 687144 811748 1010227
4 Depreciation (CFC) 0 0 0
5 Gross Savings (3+4) 687144 811748 1010227
Current Receipts, Current Expenditure and Gross Savings
27855033197842
3838782
2098359
1010227
2828555
2386094
811748687144
0
1000000
2000000
3000000
4000000
5000000
2013-14 (Ac) 2014-15 (RE) 2015-16(BE)
Year
` ` ` ` i
n l
ak
h
Current Receipts Current Expenditure Gross Savings

21
NET EXTRA BUDGETARY BORROWINGS/LENDINGS:
Statement 3.4 indicates the Net Extra Budgetary Borrowings of the Delhi Government are
` (-) 92296 lakh and ` (-) 120518 lakh for the financial year 2013-14 (A/c) and 2014-15 (RE) respectively.
Net Extra Budgetary Borrowings is likely to touch ` (-) 88495 Lakh in the year 2015-16 (BE).
Statement: 3. 4 - Distribution of Net Extra Budgetary Borrowings / Lending of Delhi
Government (Administrative Deptts.)
S.No. ITEMS
2013-14(A/c) 2014-15(RE) 2015-16(BE)
(`̀̀̀ Lakh) (`̀̀̀ Lakh) (`̀̀̀ Lakh)
1 Capital Expenditure on Fixed Assets 527628 604830 832933
2 Add Net Expenditure on Financial Assets 67220 86400 88799
3 Less Surplus on Current Account 687144 811748 1010227
4 Net Extra Budgetary Receipts(1+2-3) (-) 92296 (-) 120518 (-) 88495
(N.B. : - Positive N.E.B.R. is called Borrowing while Negative is Lending.)
PROFIT/LOSS FROM DCUs:
Net surplus, which indicates financial health of Departmental Commercial Undertakings (viz.
Irrigation and Forestry), is measured in terms of excess of current receipts over operating expenses.
Statement: 3.5 - Distribution of Gross Input – Gross Output of DCUs
S.No. ITEMS
2013-14(A/c) 2014-15(RE) 2015-16(BE)
(`̀̀̀ Lakh) (`̀̀̀ Lakh) (`̀̀̀ Lakh)
1 Compensation of Employees 2005 2466 2764
2 Purchase of Commodities & Services
including maintenance 1260 1303 1459
3 Operating Surplus 0 1025 390
3.1 Interest 0 0 0
3.2 Rent 0 0 0
3.3 Profit 0 1025 390
4 Consumption of Fixed Capital 0 0 0
GROSS INPUT 3265 4794 4613
1 Sales of Goods & Services 907 2561 2061
2 Imputed Subsidy 2358 2233 2552
GROSS OUTPUT 3265 4794 4613

22
Statement 3.5 reveals that short fall in current receipts in comparison to operating expenses is
balanced by imputed subsidy. The burden due to subsidy on account of DCUs is escalating on Delhi Govt.
This is supported by the fact that imputed subsidy in 2013-14, which was ` 2358 lakh had increased to
` 2552 lakh by 2015-16.
2358
2233
2552
2000
2100
2200
2300
2400
2500
2600
` ` ` ` i
n L
ak
hs
2013-14(A/c) 2014-15 (RE) 2015-16 (BE)
Years
Imputed Subsidiy of DCUs
Statement: 3.6 - Distribution of Gross Input/Output of Delhi Government
(Administrative Departments)
S.No. ITEMS 2013-14(A/c) 2014-15(RE) 2015-16(BE)
(`̀̀̀ Lakh) (`̀̀̀ Lakh) (`̀̀̀ Lakh)
1 Purchase of Commodities &
Services including maintenance
287465
(34.21)
317649
(32.90)
436211
(35.90)
2 Compensation of Employees 552793
(65.79)
647828
(67.10)
778885
(64.10)
2.1 Salary & Wages 529202
(62.98)
609890
(63.17)
735973
(60.57)
2.2 Benefits 23562
(2.81)
26382
(2.73)
30457
(2.51)
2.3 Pension 29
(0.00)
11556
(1.20)
12455
(1.02)
3 Consumption of fixed Capital 0
(0.00)
0
(0.00)
0
(0.00)
4 Gross Input (1to3) 840258
(100.00)
965477
(100.00)
1215096
(100.00)
5 Production of Goods & Services 840258 965477 1215096
5.1 Services Produced for own use 828599
(98.61)
950855
(98.49)
1199049
(98.68)
5.2 Sale of Goods & Services 11659
(1.39)
14622
(1.51)
16047
(1.32)
6 Gross Output (5) 840258
(100.00)
965477
(100.00)
1215096
(100.00)
N.B.:- Figures in parenthesis indicate percentage to the Gross Input/Output.

23
PRODUCTION OF GOODS & SERVICES BY DELHI GOVT:
Statement 3.6 gives a detailed account of gross input / output of government services. The gross
output is comprised of (i) services produced for own use of administrative departments of Delhi Govt. and
(ii) sale of goods & services, while gross input is inclusive of (i) purchase of commodities & services
including maintenance, (ii) compensation of employees and (iii) consumption of fixed capital.
It is evident from statement 3.6 that expenditure on account of compensation to employees forms
the major portion of the Gross Input. During 2013-14(A/c), it was to the tune of ` 552793 lakh, in 2014-15
(RE) it was ` 647828 lakh and in 2015-16 (BE) it is expected to be ` 778885 lakh. In terms of percentage
to gross input, it was (65.79%), (67.10%) and (64.10%) respectively for said years. Out of the total value of
services produced major proportion is consumed internally across years.
⌧⌧⌧

24
PURPOSEPURPOSEPURPOSEPURPOSE----WISE EXPENDITURE WISE EXPENDITURE WISE EXPENDITURE WISE EXPENDITURE
OF DELHI GOVERNMENTOF DELHI GOVERNMENTOF DELHI GOVERNMENTOF DELHI GOVERNMENT
(ADMINISTRATIVE DEPARTMENTS) (ADMINISTRATIVE DEPARTMENTS) (ADMINISTRATIVE DEPARTMENTS) (ADMINISTRATIVE DEPARTMENTS)
The entire State Government expenditure is recorded annually in the budget
documents, issued by the State Government. The arrangement in regard to the presentation of
the expenditure in the budget is in according to the requirements of the Legislative Control,
Administrative accountability etc. The purpose of the Government expenditure is of two types,
i.e., to achieve long term and short term goals. Long term expenditure is generally aimed at
tackling the problems of unemployment and overall development of the state and to bring
forth certain fundamental changes in the existing social/ economic/ infrastructure of the
economy. The short term expenditure relates to immediate objectives such as Health,
Education, Social Welfare, Economic Services and Law & Order etc. The aim of the purpose
classification is to classify expenditure in accordance with the immediate and short-term needs
of the state.
Purpose classification is a more useful and meaningful method of presentation of
budget expenditure of Government as it gives a broad understanding of major thrust areas for
the said period.
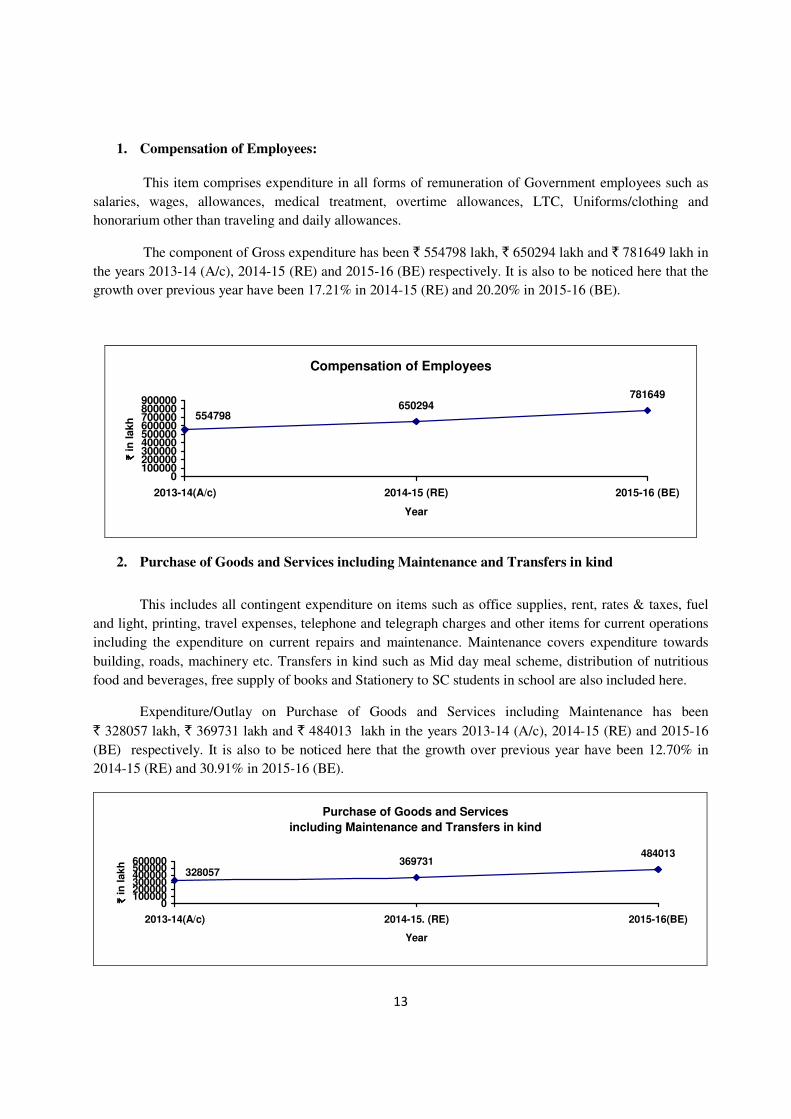
It may be seen from the statement 4.1 that as per economic and purpose classification
of budget expenditure of Administrative Departments of Delhi Government during 2013-14
(A/c), 2014-15 (RE) and 2015-16 (BE), the total expenditure were estimated at
` 2976011 lakh, ` 2983692 lakh and ` 3594882 lakh respectively.
Chapter 4
25
Statement: 4.1 - Purpose Classification of Budget Expenditure of Administrative
Departments of Delhi Government
S.No. Classification 2013-14(A/c) 2014-15 (RE) 2015-16 (BE)
(`̀̀̀ Lakh) (`̀̀̀ Lakh) (`̀̀̀ Lakh)
1. General Public Services 382193
(12.84)
488668
(16.38)
579479
(16.12)
2. Civil Defence 1677
(0.06)
2105
(0.07)
2312
(0.06)
3. Education 668862
(22.48)
758470
(25.42)
1084187
(30.16)
4. Medical & Public Health 243978
(8.20)
344855
(11.56)
394837
(10.98)
5. Social Security & Welfare Services 195398
(6.57)
223295
(7.48)
232789
(6.48)
6. Housing & Other Community
Amenities
296241
(9.95)
257175
(8.62)
314137
(8.74)
7. Cultural, Recreational & Religious
Services
16627
(0.56)
24530
(0.82)
76309
(2.12)
8. Economic Services 1152771
(38.73)
862133
(28.89)
878196
(24.43)
8.1 Gen. Admn./ Regulation/
Research & Labour
6068
(0.20)
5527
(0.18)
7875
(0.22)
8.2 Agriculture, Forestry, Fishing &
Hunting
9540
(0.32)
10129
(0.34)
11943
(0.33)
8.3 Mining, Manufacturing &
Construction
6909
(0.23)
8453
(0.28)
6009
(0.17)
8.4 Electricity, Gas, Steam 472145
(15.87)
136295
(4.57)
210595
(5.86)
8.5 Water Supply
131007
(4.40)
184580
(6.19)
127900
(3.56)
8.6 Transport & Communication 526234
(17.68)
516262
(17.30)
512802
(14.26)
8.7 Other Economic Services 868
(0.03)
887
(0.03)
1072
(0.03)
9. Environmental Protection
2413
(0.08)
2899
(0.10)
2579
(0.07)
10
Other Services 15851
(0.53)
19562
(0.66)
30057
(0.84)
Total (Administrative Deptts.) 2976011
(100.00)
2983692
(100.00)
3594882
(100.00)
N.B.:- Figures in parenthesis indicate percentage to the Total Expenditure.

26
It may be seen from the above statement that during 2013-14, maximum expenditure in terms of
percentage was incurred on Education (22.48%) followed by Transport & Communication (17.68%),
Electricity, Gas & Steam (15.87%), General Public Services (12.84%) Housing & Other Community
Amenities (9.95%), , Medical & Public Health (8.20%). Similarly, the dominant share during 2015-16
goes to areas like Education (30.16%), General Public Services(16.12%), Transport & Communication
(14.26%), Medical & Public Health (10.98) and Housing & other Community Amenities (8.74%).
GROSS CAPITAL FORMATION:
Gross capital formation refers to the aggregate of gross addition to fixed assets and increase in
stock of inventories during a period of account. Fixed assets comprise construction and machinery &
equipments. Here it may be noted that major chunk of the Capital formation is in the form of Construction
activity.
As per Revised Budget estimates for 2014-15, Gross Capital Formation is expected to be
` 456236 lakh as compared to the amount of actual Gross Capital Formation of ` 430856 lakh during
2013-14. Keeping budget provisions in view for 2015-16, there is likelihood that Gross Capital Formation
will be ` 681862 lakh.
430856456236
681862
0
100000
200000
300000
400000
500000
600000
700000
` ` ` ` i
n L
ak
hs
2013-14 (A/c) 2014-15 (RE) 2015-16(BE)
Years
Gross Capital Formation of Delhi Govt.

27
Statement: 4.2 - Gross Capital Formation
S.No Item 2013-14 (A/c) 2014-15 (RE) 2015-16 (BE)
A. Administrative Departments (` Lakh) (` Lakh) (` Lakh)
1 New Capital Formation (Outlay) 430852 456204 681854
1.1 Construction Works 418063 431414 637944
1.2 Plant & Machinery including
Software 11921 23053 42607
1.3 Transport Equipments 707 1572 1078
1.4 Cultivated Assets 161 165 225
2 Net Purchase of Second hand
Assets 0 0 0
3 Change in Stock 0 0 0
4 GCF (Admn.)(1+2+3) 430852 456204 681854
B. Departmental Commercial Undertakings
5 New Capital Formation(Outlay) 4 32 8
5.1 Construction works 3 31 5
5.2 Plant & Machinery including
Software 1 1 3
5.3 Transport Equipments 0 0 0
5.4 Cultivated Assets 0 0 0
6 Net Purchase of Second hand
Assets 0 0 0
7 Change in Stock 0 0 0
8 GCF (DCUs)(5+6+7) 4 32 8
Gross Capital Formation (4+8) 430856 456236 681862

28
A. INDUSTRY –WISE GROSS CAPITAL FORMATION (Administrative Departments) :
It may be seen from the Tables annexed to this report that out of total gross capital formation of
Administrative Departments of the Delhi Govt. of ` 430852 lakh in the year 2013-14 (Actuals),
` 2 lakh, ` 56197 Lakh, ` 38530 Lakh and ` 336123 Lakh has been spent on Construction , Education,
Medical & Public Health and Public Administration industries respectively. During the year 2014-15 (RE),
industry-wise expenditure has been ` 2 lakh, ` 63666 Lakh, ` 65024 Lakh and ` 327506 Lakh on
Construction , Education, Medical & Public Health and Public Administration industries respectively out of
total Gross Capital Formation of ` 456204 Lakh. Like-wise, during the year 2015-16 (BE) the expenditure
is likely to reach at ` 17 lakh, ` 225363 Lakh, ` 82969 Lakh and ` 373505 Lakh on Construction,
Education, Medical and Public Health and Public Administration industries respectively out of total Gross
Capital Formation of ` 681854 Lakh respectively.
B. GROSS CAPITAL FORMATION (Departmental Commercial Undertakings) :
It may be seen from the Tables annexed to this report that expenditure/outlay spent on Gross
Capital Formation of Departmental commercial Undertakings of the Delhi Govt. is only ` 4 Lakh,
` 32 Lakh and ` 8 Lakh in the years 2013-14 (A/c), 2014-15 (RE) and 2015-16 (BE) respectively.
⌧⌧⌧

29
A COMPARATIVE OVERVIEW –
APPROACHES FOR EXPENDITURE
The Directorate of Economics & Statistics (DES), Govt. of Delhi, is preparing purpose-wise
expenditure as per the guidance and methodologies prepared by the National Accounts Division, Central
Statistics Office, Ministry of Statistics & Programme Implementation, Govt of India and are based on
System of National Accountings. On the other hand, budgetary transactions of Govt. of Delhi, is being
prepared taking into consideration the facts that Government accounts are maintained by respective
departments/ministries for purposes of control and accountability. In National Accounts, data for
Government are recast in a form common to all sectors so as to measure and aggregate their production,
income, consumption, capital accumulation & finance and delineate inter-sectoral transactions. A
classification of transactions on outlays using the methodology of Classification of Functions of
Government (CoFoG) as prescribed by the Central Statistics Office, M/o Statistics & Programme
Implementation, Govt of India and Budgetary Transactions of Plan and Non-Plan outlays described in
Budget documents are quite different. While both the approaches depict a different picture, the
methodologies may depart from each other also to a large extent. The illustrations of purpose
classification of Education and Medical & Public Health based on methodology prescribed by the Central
Statistics Office, M/o Statistics & Programme Implementation, Govt of India is given below for elimination
of doubts of the data users:-
Expenditure on education can be split into three groups:
(a) General education provided in schools, colleges, universities, centres of higher research &
learning and other institutions providing specialised trainings.
(b) In-service training or on the job training for the employees deputed by any organisation or office.
(c) Apprenticeship or similar other training in specialised fields organised for persons with the object
of fixing them in employment on the basis of the performance in the training.
In regard to purpose classification, category (a) above is classified as expenditure on Education.
The other two categories are classified into purpose categories in accordance with the character of the
body organising the training.
Chapter 5

30
The medical colleges, and nursing schools are grouped under the category education even though
they are reported under other account heads “Health” etc. The educational activities which are integral
part of other services are, however, grouped along with respective services. Thus, expenditures relating to
police training schools are grouped under police, prisons reformatory schools with jails, training of I.A.S.
are included in general government services. All types of scholarships to students whether paid by the
Department of Education, Department of Social Welfare or any other body etc., grouped under category
education. Expenditure on cultural, recreational and religious activities (including that for NCC, youth
welfare and physical education) are classified under the ‘recreational services ‘. Expenditure in regard to
physical training in the educational institutions, are however, grouped under education.
Hospital and dispensaries are grouped under category ‘health’ but the hospitals attached to
medical colleges are considered as integral part of medical education and therefore they are grouped
under ‘education’ rather than ‘health’. Expenditure incurred on registration of births, deaths,
diseases etc., are considered as expenditure on health research and, therefore, classified under
‘health’. Family planning activities are treated as those relating to welfare services and classified
accordingly.
A. MEDICAL & PUBLIC HEALTH: According to Budgetary Transactions ` 3951.13 crore has to be incurred on Medical & Public
Health Sector, however as per Purpose and Economic Classification, it is to be ` 3948.37 crore during the
year 2015-16 (BE).
The major differences as per two approaches in Medical & Public Health Sector for the year 2015-16
are spelled out as follows:-
(i) BUDGETARY TRANSCATIONS: As per Budgetary Transactions, outlays on Medical & Public Health
also include Forensic Science Lab and Central Jail Hospital. It includes Revenue and Capital as
well as Plan & Non-Plan outlays, but excludes Centrally Sponsored Schemes.
(ii) PURPOSE AND ECONOMIC CLASSIFICATIONS: As per Purpose and Economic Classification, outlays
on Medical & Public Health also includes Centrally Sponsored Schemes, Delhi Institute of
Pharmaceutical Science and Research but excludes contribution to the Employee State
Insurance Corp. and Delhi Arogya Nidhi as it forms part of creation of Fund and thus not
included in any specific purpose. Expenditure on Directorate of Family Welfare has also been
excluded and classified it as Welfare Services.

31
Expenditure on Bio-Waste Management has also been excluded and classified it as the part
of Environment Protection Services. Expenditure on Medical Colleges has been excluded as it
is classified under Education Services. Pensionary Charges has been proportionately allocated
to the Medical & Public Health Services. Only net expenditure on purchase of goods and
services after deducting the receipts portion of Sale of goods and services from the total
expenditure has been included. It also includes Revenue and Capital as well as Plan & Non-
Plan outlays.
B. EDUCATION: According to Budgetary Transactions ` 9800.96 crore has to be incurred on Education
Sector, however as per Purpose and Economic Classification, it is to be ` 10841.87 crore during
the year 2015-16 (BE).
The major differences as per two approaches in Education Sector for the year 2015-16 are
briefed below:-
(iii) BUDGETARY TRANSCATIONS: As per Budgetary Transactions General Education including Higher
Education, Technical Education, assistance to Local Bodies for Primary Education along with
Sports & Youth Services and Art & Cultural Services are included in Education Sector. It
includes Revenue and Capital as well as Plan & Non-Plan outlays, but excludes Centrally
Sponsored Schemes.
(i) PURPOSE AND ECONOMIC CLASSIFICATIONS: As per Purpose and Economic Classification, it
includes General Education including Higher Education, Technical Education along with
Centrally Sponsored Schemes, Medical Colleges, Medical Education, Training and research,
Educational secretariat, Govt Schools for blinds boys, Nursery primary Education for deaf,
Vocational Training, reimbursement of tuition fee, scholarship to SC/ST/OBC, Coaching
Centre, Hostels for SC, Grant in Aid to Hotel Management & catering Training Institute and
assistance to Local Bodies for Primary Education. Pensionary Charges has been
proportionately allocated to the Education Services. Only net expenditure on purchase of
goods and services after deducting the receipts portion of Sale of goods and services from
the total expenditure has been included. But, Sports & Youth Services and Art & Cultural
Services are excluded. It also includes Revenue and Capital as well as Plan & Non-Plan
outlays.

32
We may have a look on the different scenario emerging in the Medical & Public Health and Education
Sectors as a result of two different approaches used i.e. Purpose and Economic Classification and
Budgetary Transactions in Statement 5.1.
Statement 5.1: Comparative Expenditure on Medical & Public Health and Education Sectors
⌧⌧⌧
APPROACH
SECTOR
As per
Methodology of Purpose and
Economic Classification
As per
Budgetary Transactions
A. EDUCATION
2013-14
(A/c)
2014-15
(RE)
2015-16
(BE)
2013-14
(A/c)
2014-15
(RE)
2015-16
(BE)
I. Total Expenditure ( ` crore) 6688.62 7584.7 10841.87 6153.47 6621.12 9800.96
II. Per Capita Expenditure ( in ` ) 3794 4221 5920 3490 3685 5352
III. % to GSDP 1.71 1.68 N.A. 1.57 1.47 N.A
B. MEDICAL & PUBLIC HEALTH
I. Total Expenditure ( ` crore) 2439.78 3448.55 3948.37 2992.08 3944.32 3951.13
II. Per Capita Expenditure( in ` ) 1384 1919 2156 1697 2195 2157
III. % to GSDP 0.62 0.76 N.A. 0.76 0.87 N.A

STATISTICAL
TABLES

Figures in Rs. Lacs
Receipt Expenditure
A. Revenue and Capital Account 2798069 2707394
I. Borrowing at Home
1. Internal Debt 0 0
2. Small Savings, Provident Fund etc. 0 0
3. Other Debt
Total 0 0
Net Receipts (I) 0
II. Borrowing Abroad
1. External Debt 0 0
2. Other Debt
Total 0 0
Net Receipts (II) 0
III. Extra Budgetary Receipts & Adjustments
1. Loans from Government of India 416289 132529
2. Loans and Advances from States Government 80291 565237
3. InterState Settlement 0 0
4. Contingency Fund 0 0
5. Reserve Funds 0 0
6. Deposits & Advances 0 0
7. Suspense and Miscellaneous 0 0
8. Remittances 0 0
9. Cash Balance 0 -110511
10. Funds Revenue Account 0 1621
11. Funds Commercial Account 0
Total 496580 588876
Net Receipts (III) -92296
Check Total excluding Funds 3294649 3294649
Difference (Receipt - Expenditure) 0
Borrowing Account of Delhi Govt. for the Year 2013-14 (Actual)
Table - 1
Items
T.1

Figures in Rs. Lacs
Receipt Expenditure
1. Income from Enterpreneurship
and Property 43576 1. Government Final Consumption Expenditure (GFCE) 867931
1.1 Profits 0 1.1 Compensation of Employees 552793
1.2 Income from Property 43576 a) Wages & Salaries 552764
1.2.1 Net Interest Received 37935 b) Pension 29
a) Public Authorities 34023 1.2 Net Purchases of Goods & Services 275806
i) Centre a) Purchases 218069
ii) States 0 b) Maintenance 69396
iii) Local Authorities 34023 c) Less Sales 11659
b) Foreign 0 1.3 Transfers in kind 39332
c) From other Sectors 3912 1.4 CFC
1.2.2 Other Property Receipts 5641 2. Net Interest Paid to 282429
2. Total Tax Revenue 2592674 2.1 Public Authorities 282429
2.1 Import Duty 0 a) Centre 282429
2.2 Export Duty 0 b) States 0
2.3 Production Taxes 335757 c) Local Authorities 0
2.4 Product Taxes 2256917 2.2 Foreign Agencies 0
2.5 Other Transfers 0 2.3 Others 0
3. Fees & Miscellaneous Receipts 8967 2.4 Less Commercial Interest 0
4. Total Transfers from Public
Authorities 140286 3. Total Subsidies 188088
4.1 Centre 140286 3.1 Production Subsidies 104858
4.2 States 0 3.2 Product Subsidies 83230
4.3 Local Authorities 0 303175
Total Receipts (1+2+3+4) 2785503 4.1 Other Sectors 303175
4.2 Foreign 0
5. Total Inter-Government Transfers 456736
5.1 Current to 383271
a) Centre
b) States 0
c) Local Authorities 383271
5.2 Capital to 73465
a) Centre
b) States 0
c) Local Authorities 73465
6. Total Current Expenditure (1+2+3+4+5) 2098359
8. Surplus on Current Account 687144
Income Outlay Account of Delhi Govt. (Administrative Departments) for the year 2013-14 (Actual)
Table - 2
T. 2
4. Total Current Transfers to (Other than Inter-
Government)

I. Expenditure
Administration
1. Capital Outlay 430852
2. Net Purchase of Physical Assets 13251
2.1 Second Hand Assets 0
2.2 Land 13251
3. Change in Stock 0
3.1 Inventory 0
3.2 Others 0
4. Capital Transfers 83521
4.1 for Capital Formation 83521
4.2 for Others
5. Total (1 to 4) 527624
Enterprises
6. Capital Outlay 4
7. Net Purchase of Physical Assets 0
7.1 Second Hand Assets 0
7.2 Land 0
8. Change in Stock 0
9. Total (6 to 8) 4
Total Expenditure (5 + 9) 527628
II. Receipts
11. Surplus on Current Account 687144
12. Consumption of Fixed Capital 0
13. Foreign Grants 0
14. Net Budgetary Borrowing 0
14.1 At Home 0
14.2 From Abroad 0
15 Other Liabilities -159516
15.1 Net Extra Budgetary Borrowing -92296
15.2 less Net Purchase of Financial Assets 67220
16. Total Receipts (11 to 15) 527628
Capital Finance Account of Delhi Govt. Administration and
Enterprises for the year 2013-14 (Actual)
Table - 3
T.3
Figures in Rs. Lacs

Item Salary Pension Others NDP CFC GDP IC Output
1. Total 529202 29 23562 552793 0 552793 287465 840258
2. Construction (Repaire & Maintenance) 13560 1 273 13834 0 13834 66611 80445
3. Water Supply 0 0 0 0 0 0 0 0
4. Other Services 396081 22 7886 403989 0 403989 92395 496384
I. (a) Education (3.2) 290408 16 6423 296847 0 296847 44417 341264
(b) Medical & Public Health (4.2) 104725 6 1451 106182 0 106182 47869 154051
(c) Sanitaion 0 0 0 0 0 0 0 0
(d) Veterinary Services 948 0 12 960 0 960 109 1069
5. Sub Total (2 to 4) 409641 23 8159 417823 0 417823 159006 576829
6. Public Administration & Defence (1-5) 119561 6 15403 134970 0 134970 128459 263429
Estimates of Output Of General Government For the year 2013-14 (Actual)
Table - 4
Figures in Rs. Lacs
T. 4

Figures in Rs. Lacs
Bm Rm Cm Sa
les
Su
bsi
dy
To
tal
Re
ceip
ts
1. Agriculture (Irrigation) 130 0 0 11 0 0 1084 0 0 0 0 874 351 1225 130 130
2. Forests 1829 46 0 160 0 0 5 0 0 0 0 33 2007 2040 1875 1875
3. Manufacturing 0 0 0 0 0 0 0 0 0 0 0 0 0 0 0 0
4. Electricity 0 0 0 0 0 0 0 0 0 0 0 0 0 0 0 0
5. Services Incidental to Transport 0 0 0 0 0 0 0 0 0 0 0 0 0 0 0 0
6. Civil Aviation 0 0 0 0 0 0 0 0 0 0 0 0 0 0 0 0
7. Road Transport 0 0 0 0 0 0 0 0 0 0 0 0 0 0 0 0
8. Water Transport 0 0 0 0 0 0 0 0 0 0 0 0 0 0 0 0
9. Trade & Hotels 0 0 0 0 0 0 0 0 0 0 0 0 0 0 0 0
10.Other Services 0 0 0 0 0 0 0 0 0 0 0 0 0 0 0 0
11. Total 1959 46 0 171 0 0 1089 0 0 0 0 907 2358 3265 2005 2005
T. 5
Gross
Product
Coomercial Receipts
Estimate of Domestic Product by Industry of Origin and Factor Income (DCUs) for the year 2013-14 (Actual)
Table - 5
Maintenance
Industry Sa
lary
& W
ag
es
Be
ne
fits
Pe
nsi
on
Pu
rch
ase
s
Re
nt
Inte
rest
De
pri
cia
tio
n
Pro
fits
Net
Product

Sl No. Items
Water
Supply
Remediation
& other utility
services
(Sanitation) Construction
Public
Admministration
& Defence Education Health Total
1 2 3 4 5 6 7 8 9
Construction (1+2) 0 0 0 331005 52880 34178 418063
1 Dwelling 0 0 9150 40 0 9190
2 Other Building and Sturcture (2.1+2.2+2.3) 0 0 0 321855 52840 34178 408873
2.1 Non-Residential Building 0 0 34907 52667 34049 121623
2.2 Other Structures 0 0 92019 173 129 92321
2.3 Land Improvement 0 0 0 0 0 0
2.4 Roads & Bridges 0 0 194929 0 0 194929
3 Machinery and Equipment (3.1+3.2+3.3+3.4) 0 0 2 4895 3146 4352 12395
3.1 Transport Equipment 0 0 624 28 55 707
3.2 ICT Equipment 0 0 2 3081 769 175 4027
3.3 Other Machinery and Equipment 0 0 0 1190 2349 4122 7661
3.4 Weapons Systems 0 0 0 0 0 0 0
4 Cultivated Biological Resources (4.1+4.2) 0 0 0 161 0 0 161
4.1 Animal Resources Yielding Repeat Products 0 0 0 0 0 0 0
4.2 Tree, Crop and Plant Resources Yielding Repeat Products 0 0 0 161 0 0 161
5 Intellectual Property Products ( sum of 5.1 to 5.5) 0 0 0 62 171 0 233
5.1 Research and Development 0 0 0 0 0 0 0
5.2 Mineral Exploration and Evaluation 0
5.3 Computer Software and Databases 0 0 0 62 171 0 233
5.4 Entertainment, Literary of Artistic Originals 0
5.5 Other Intellectual Property Products 0 0 0 0 0 0 0
Total New Outlay 0 0 2 336123 56197 38530 430852
Net Purchase of Second Hand Assets 0 0 0 0 0 0 0
Change in Stocks 0 0 0 0 0 0 0
Gross Capital Formation 0 0 2 336123 56197 38530 430852
Industry and Asset wise Capital Formation of General Government for the year 2013-14 (Actual)
Table -6
T. 6

Sl No. Year: 2013-2014(Actual) State: Delhi Crops
Forestry &
Logging
Manufacturing
registered.
Railways
Manufacturing Electricity
Trade &
Repair
Services
Railways
Transport
Road
Transport
Water
Transport
Air
Transport
Services
Incidental to
Transport
Communication
& Services
related to
Broadcasting Total
1 2 3 4 5 6 7 8 9 10 11 12 13 14 15
Construction (1+2) 3 0 0 0 0 0 0 0 0 0 0 0 3
1 Dwelling 0 0 0 0 0 0 0 0 0 0
2 Other Building and Sturcture (2.1+2.2+2.3) 3 0 0 0 0 0 0 0 0 0 0 0 3
2.1 Non-Residential Building 0 0 0 0 0 0 0 0 0 0
2.2 Other Structures 3 0 0 0 0 0 0 0 0 3
2.3 Land Improvement 0 0 0 0 0 0 0 0 0 0
2.4 Roads & Bridges 0 0 0 0 0 0 0 0 0 0
3 Machinery and Equipment (3.1+3.2+3.3+3.4) 0 1 0 0 0 0 0 0 0 0 0 0 1
3.1 Transport Equipment 0 0 0 0 0 0 0 0 0 0
3.2 ICT Equipment 0 1 0 0 0 0 0 0 0 1
3.3 Other Machinery and Equipment 0 0 0 0 0 0 0 0 0 0
3.4 Weapons Systems 0 0 0 0 0 0 0 0 0 0
4 Cultivated Biological Resources (P5.1+P5.2) 0 0 0 0 0 0 0 0 0 0 0 0 0
4.1 Animal Resources Yielding Repeat Products 0 0 0 0 0 0 0 0 0 0
4.2 Tree, Crop and Plant Resources Yielding Repeat Products 0 0 0 0 0 0 0 0 0 0
5 Intellectual Property Products ( sum of P7.1 to P7.5) 0 0 0 0 0 0 0 0 0 0 0 0 0
5.1 Research and Development 0 0 0 0 0 0 0 0 0 0
5.2 Mineral Exploration and Evaluation 0
5.3 Computer Software and Databases 0 0 0 0 0 0 0 0 0 0
5.4 Entertainment, Literary of Artistic Originals 0
5.5 Other Intellectual Property Products 0 0 0 0 0 0 0 0 0 0
Total New Outlay 3 1 0 0 0 0 0 0 0 0 0 0 4
Net Purchase of Second Hand Assets 0 0 0 0 0 0 0 0 0 0
Change in Stocks 0 0 0 0 0 0 0 0 0 0
Gross Capital Formation 3 1 0 0 0 0 0 0 0 0 0 0 4
Industry and Asset wise Capital Formation of DCUs
Table - 7
T. 7

Administrative Deptts. Buildings
Other
Constructions Roads Product Production
(1) (2) (3) (4) (5) (6) (7) (8) (9) (10) (11) (12)
1 General Public Services 98963 42408 26135 0 0 1133 181370 0 0 350009
1.1 General Administration, External affairs, Public Order & Safety 98963 42408 26135 0 0 1133 181370 0 0 350009
1.1.1 Public Order & safety 59899 16969 150 0 0 610 0 0 0 77628
1.1.2 Planning & Statistical Activities 2300 326 0 0 0 0 0 0 0 2626
1.1.3 General Administration, External affairs, Public Order & Safety, n.e.c 36764 25113 25985 0 0 523 181370 0 0 269755
1.2 General Research 0 0 0 0 0 0 0 0 0 0
2 Defence 638 1013 0 0 0 0 0 0 0 1651
3 Education 308256 54723 6 0 0 98995 125602 0 0 587582
3.1 Administration, Regulation & Research 11409 1625 1 0 0 12035 0 0 0 25070
3.2 Education Services n.e.c. 296847 53098 5 0 0 86960 125602 0 0 562512
4 Health Affairs and Services 115375 45003 0 0 0 20463 13246 0 0 194087
4.1 Administration, Regulation and Research 9193 2828 0 0 0 44 0 0 0 12065
4.2 Health Services 106182 42175 0 0 0 20419 13246 0 0 182022
5 Social Security and Welfare Affairs and Services 15940 42706 0 0 0 113435 1941 13513 0 187535
6 Housing and Community Amenity Affairs and Services 634 988 5967 0 0 5800 55983 0 0 69372
7 Cultural, Recreational and Religeous Affairs Services 1757 5592 0 0 0 6755 192 0 0 14296
8 Economic Affairs and Services 7643 47148 0 9 29985 55717 4937 69717 104858 320014
8.1 General Administration, Regulation and Research 2439 362 0 0 0 800 0 0 0 3601
8.2 Agriculture, Forestry, Fishing and Hunting 3553 661 0 9 0 1200 0 0 2358 7781
8.3 Mining, Manufacturing and Construction 808 376 0 0 0 344 0 117 0 1645
8.4 Electricity, Gas, Steam and Other Sources of Energy 53 360 0 0 0 44273 0 62200 0 106886
8.5 Water Supply 0 0 0 0 0 9100 0 0 0 9100
8.6 Transport and Communication 0 45360 0 0 29985 0 4937 7400 102500 190182
8.7 Other Economic Services 790 29 0 0 0 0 0 0 0 819
9 Environmental Protection 259 1241 0 0 0 568 0 0 0 2068
10 Relief on Calamities 3328 4920 0 7294 0 309 0 0 0 15851
552793 245742 32108 7303 29985 303175 383271 83230 104858 1742465
Local Bodies
T. 8
Subsidy
Total
Table - 8
Economic Cum Purpose Classification of Delhi Govt. Budget Expenditure for 2013-14 (Actual)P
urp
ose
Co
de
Current Expenditure
Total
Current Expenditure
Economic Classification
Purpose Classification
Repair & Maintenance
Consumption Expenditure
Compensation
of Employees
Net
Purchase
of Goods
&
Services Non Govt.

Residential
Non
Residential
(13) (14) (15) (16) (17) (18) (19) (20) (21) (22) (23) (24) (25) (26) (27) (28) (29) (30) (31) (32) (33)
1 167 27783 0 5 603 893 15 2696 0 0 0 0 0 0 22 0 0 0 32184 382193
1.1 167 27783 0 5 603 893 15 2696 0 0 0 0 0 0 22 0 0 0 32184 382193
1.1.1 167 11667 0 0 369 851 0 516 0 0 0 0 0 0 16 0 0 0 13586 91214
1.1.2 0 0 0 0 0 0 0 1194 0 0 0 0 0 0 0 0 0 0 1194 3820
1.1.3 0 16116 0 5 234 42 15 986 0 0 0 0 0 0 6 0 0 0 17404 287159
1.2 0 0 0 0 0 0 0 0
2 0 0 0 0 19 7 0 0 0 0 0 0 0 0 0 0 0 0 26 1677
3 40 52806 0 173 28 2636 171 787 0 0 0 0 0 0 3104 21535 0 0 81280 668862
3.1 0 139 0 0 0 287 0 18 0 0 0 0 0 0 6 0 0 0 450 25520
3.2 40 52667 0 173 28 2349 171 769 0 0 0 0 0 0 3098 21535 0 0 80830 643342
4 0 34099 0 129 55 4125 0 237 0 0 0 0 0 0 3505 7741 0 0 49891 243978
4.1 0 50 0 0 0 3 0 62 0 0 0 0 0 0 0 0 0 115 12180
4.2 0 34049 0 129 55 4122 0 175 0 0 0 0 0 0 3505 7741 0 0 49776 231798
5 3440 1042 1595 1595 0 0 0 103 0 0 0 0 0 0 46 0 42 0 7863 195398
6 5543 659 11559 82039 0 0 0 4 0 0 0 6178 0 0 64677 27220 15 28975 226869 296241
7 0 1822 0 112 0 0 0 9 0 0 0 0 0 0 300 88 0 0 2331 16627
8 0 3412 181775 8106 2 0 14 61 161 0 0 7073 0 67220 11847 16881 510205 26000 832757 1152771
8.1 0 2467 0 0 0 0 0 0 0 0 0 0 0 0 0 0 0 0 2467 6068
8.2 0 0 0 1590 2 0 0 6 161 0 0 0 0 0 0 0 0 0 1759 9540
8.3 0 0 0 5000 0 0 4 16 0 0 0 0 0 0 150 0 94 0 5264 6909
8.4 0 0 0 266 0 0 0 0 0 0 0 2134 0 0 20 0 362839 0 365259 472145
8.5 0 0 0 0 0 0 0 0 0 0 0 0 0 0 11677 0 110230 0 121907 131007
8.6 0 945 181775 1250 0 0 0 0 0 0 0 4939 0 67220 0 16881 37042 26000 336052 526234
8.7 0 0 0 0 0 0 10 39 0 0 0 0 0 0 0 0 0 0 49 868
9 0 0 0 162 0 0 33 130 0 0 0 0 0 0 20 0 0 0 345 2413
10 0 0 0 0 0 0 0 0 0 0 0 0 0 0 0 0 0 0 0 15851
Total 9190 121623 194929 92321 707 7661 233 4027 161 0 0 13251 0 67220 83521 73465 510262 54975 1233546 2976011
Ma
chin
ary
Capital Expenditure
Co
mp
ute
r
So
ftw
are
Cu
ltiv
ate
d A
sse
ts
An
ima
l S
tock
Capital Transfer
Se
con
d H
an
d
Ass
ets
Outlay (New)
Ad
va
nce
to
No
n-G
ov
t
Ad
va
nce
s to
Lo
cal
Bo
die
s
Total Capital
Expenditure
Physical Assets
Net Purchase of Assets
Lan
d
Ch
an
ge
in
Sto
ck
Fin
an
cia
l A
sse
ts
T. 9
Purpose
Code
Ro
ad
s
Oth
er
Co
nst
ruct
ion
Tra
nsp
ort
Table - 8 (Contd.)
Economic Cum Purpose Classification of Delhi Govt. Budget Expenditure for 2013-14 (Actual)
To
Others/
Non Govt.
To Local
Bodies
Total
Expenditure
(Current +
Capital)
Info
rma
tio
n a
nd
Co
mm
un
ica
tio
n
Te
chn
olo
gy
ECONOMIC CLASSIFICATION
Buildings

Figures in Rs. Lacs
Receipt Expenditure
A. Revenue and Capital Account 3214000 3097519
I. Borrowing at Home
1. Internal Debt 0 0
2. Small Savings, Provident Fund etc. 0 0
3. Other Debt
Total 0 0
Net Receipts (I) 0
II. Borrowing Abroad
1. External Debt 0 0
2. Other Debt
Total 0 0
Net Receipts (II) 0
III. Extra Budgetary Receipts & Adjustments
1. Loans from Government of India 120000 167675
2. Loans and Advances from States Government 61900 213806
3. InterState Settlement 0 0
4. Contingency Fund 0 0
5. Reserve Funds 0 0
6. Deposits & Advances 0 0
7. Suspense and Miscellaneous 0 0
8. Remittances 0 0
9. Cash Balance 0 -83100
10. Funds Revenue Account 0 4037
11. Funds Commercial Account 0
Total 181900 302418
Net Receipts (III) -120518
Check Total excluding Funds 3395900 3395900
Difference (Receipt - Expenditure) 0
Borrowing Account of Delhi Govt. for the Year 2014-15 (RE)
Table - 9
Items
T.10

1. Income from Enterpreneurship and
Property 68946 1. Government Final Consumption Expenditure (GFCE) 1001634
1.1 Profits 1025 1.1 Compensation of Employees 647828
1.2 Income from Property 67921 a) Wages & Salaries 636272
1.2.1 Net Interest Received 60400 b) Pension 11556
a) Public Authorities 38000 1.2 Net Purchases of Goods & Services 303027
i) Centre a) Purchases 231337
ii) States 0 b) Maintenance 86312
iii) Local Authorities 38000 c) Less Sales 14622
b) Foreign 0 1.3 Transfers in kind 50779
c) From other Sectors 22400 1.4 CFC
1.2.2 Other Property Receipts 7521 2. Net Interest Paid to 307406
2. Total Tax Revenue 2768016 2.1 Public Authorities 307406
2.1 Import Duty 0 a) Centre 307406
2.2 Export Duty 0 b) States 0
2.3 Production Taxes 354516 c) Local Authorities 0
2.4 Product Taxes 2413500 2.2 Foreign Agencies 0
2.5 Other Transfers 0 2.3 Others 0
3. Fees & Miscellaneous Receipts 10280 2.4 Less Commercial Interest 0
4. Total Transfers from Public Authorities 350600 3. Total Subsidies 174129
4.1 Centre 350600 3.1 Production Subsidies 123233
4.2 States 0 3.2 Product Subsidies 50896
4.3 Local Authorities 0 4. Total Current Transfers to (Other than Inter-Government) 368262
Total Receipts (1+2+3+4) 3197842 4.1 Other Sectors 368262
4.2 Foreign 0
5. Total Inter-Government Transfers 534663
5.1 Current to 440047
a) Centre
b) States 0
c) Local Authorities 440047
5.2 Capital to 94616
a) Centre
b) States 0
c) Local Authorities 94616
6. Total Current Expenditure (1+2+3+4+5) 2386094
8. Surplus on Current Account 811748
Income Outlay Account of Delhi Govt. (Administrative Departments) for the year 2014-15 (RE)
Table - 10
Receipt Expenditure
T.11

Figures in Lacs
I. Expenditure
Administration
1. Capital Outlay 456204
2. Net Purchase of Physical Assets 16080
2.1 Second Hand Assets 0
2.2 Land 16080
3. Change in Stock 0
3.1 Inventory 0
3.2 Others 0
4. Capital Transfers 132514
4.1 for Capital Formation 132514
4.2 for Others
5. Total (1 to 4) 604798
Enterprises
6. Capital Outlay 32
7. Net Purchase of Physical Assets 0
7.1 Second Hand Assets 0
7.2 Land 0
8. Change in Stock 0
9. Total (6 to 8) 32
Total Expenditure (5 + 9) 604830
II. Receipts
11. Surplus on Current Account 811748
12. Consumption of Fixed Capital 0
13. Foreign Grants 0
14. Net Budgetary Borrowing 0
14.1 At Home 0
14.2 From Abroad 0
15 Other Liabilities -206918
15.1 Net Extra Budgetary Borrowing -120518
15.2 less Net Purchase of Financial Assets 86400
16. Total Receipts (11 to 15) 604830
Capital Finance Account of Delhi Govt.
Table - 11
Administration and Enterprises for the year 2014-15 (RE)
T. 12

Item Salary Pension Others NDP CFC GDP IC Output
1. Total 609890 11556 26382 647828 0 647828 317649 965477
2. Construction (Repaire & Maintenance) 15060 285 483 15828 0 15828 81165 96993
3. Water Supply 0 0 0 0 0 0 0 0
4. Other Services 448239 8493 9424 466156 0 466156 97036 563192
I. (a) Education (3.2) 332563 6301 7425 346289 0 346289 48695 394984
(b) Medical & Public Health (4.2) 114548 2170 1983 118701 0 118701 48144 166845
(c) Sanitaion 0 0 0 0 0 0 0 0
(d) Veterinary Services 1128 21 16 1165 0 1165 197 1362
5. Sub Total (2 to 4) 463299 8778 9907 481984 0 481984 178201 660185
6. Public Administration & Defence (1-5) 146591 2778 16475 165844 0 165844 139448 305292
Estimates of Output Of General Government For the year 2014-15 (RE)
Table - 12
Figures in Rs. Lacs
T. 1
3

Figures in Rs. Lacs
Bm Rm Cm Sa
les
Su
bsi
dy
To
tal
Re
ceip
ts
1. Agriculture (Irrigation) 332 0 6 38 0 0 1100 0 0 0 1025 2501 0 2501 1363 1363
2. Forests 2006 84 38 159 0 0 6 0 0 0 0 60 2233 2293 2128 2128
3. Manufacturing 0 0 0 0 0 0 0 0 0 0 0 0 0 0 0 0
4. Electricity 0 0 0 0 0 0 0 0 0 0 0 0 0 0 0 0
5. Services Incidental to Transport 0 0 0 0 0 0 0 0 0 0 0 0 0 0 0 0
6. Civil Aviation 0 0 0 0 0 0 0 0 0 0 0 0 0 0 0 0
7. Road Transport 0 0 0 0 0 0 0 0 0 0 0 0 0 0 0 0
8. Water Transport 0 0 0 0 0 0 0 0 0 0 0 0 0 0 0 0
9. Trade & Hotels 0 0 0 0 0 0 0 0 0 0 0 0 0 0 0 0
10.Other Services 0 0 0 0 0 0 0 0 0 0 0 0 0 0 0 0
11. Total 2338 84 44 197 0 0 1106 0 0 0 1025 2561 2233 4794 3491 3491
Sa
lary
& W
ag
es
Be
ne
fits
Pe
nsi
on
Pu
rch
ase
s
Re
nt
Inte
rest
De
pri
cia
tio
n
Pro
fits Net
Product
Gross
Product
Coomercial Receipts
T. 1
4
Estimate of Domestic Product by Industry of Origin and Factor Income (DCUs) for the year 2014-15 (RE)
Table - 13
Maintenance
Industry

Sl No. Items
Water
Supply
Remediation
& other utility
services
(Sanitation) Construction
Public
Admministration
& Defence Education Health Total
1 2 3 4 5 6 7 8 9
Construction (1+2) 0 0 0 318464 57599 55351 431414
1 Dwelling 0 0 10914 40 0 10954
2 Other Building and Sturcture (2.1+2.2+2.3) 0 0 0 307550 57559 55351 420460
2.1 Non-Residential Building 0 0 53356 57549 55051 165956
2.2 Other Structures 0 0 71333 10 300 71643
2.3 Land Improvement 0 0 0 0 0 0
2.4 Roads & Bridges 0 0 182861 0 0 182861
3 Machinery and Equipment (3.1+3.2+3.3+3.4) 0 0 2 8782 5867 9673 24330
3.1 Transport Equipment 0 0 1477 51 44 1572
3.2 ICT Equipment 0 0 2 5159 1953 326 7446
3.3 Other Machinery and Equipment 0 0 0 2146 3863 9303 15312
3.4 Weapons Systems 0 0 0 0 0 0 0
4 Cultivated Biological Resources (4.1+4.2) 0 0 0 165 0 0 165
4.1 Animal Resources Yielding Repeat Products 0 0 0 0 0 0 0
4.2 Tree, Crop and Plant Resources Yielding Repeat Products 0 0 0 165 0 0 165
5 Intellectual Property Products ( sum of 5.1 to 5.5) 0 0 0 95 200 0 295
5.1 Research and Development 0 0 0 0 0 0 0
5.2 Mineral Exploration and Evaluation 0
5.3 Computer Software and Databases 0 0 0 95 200 0 295
5.4 Entertainment, Literary of Artistic Originals 0
5.5 Other Intellectual Property Products 0 0 0 0 0 0 0
Total New Outlay 0 0 2 327506 63666 65024 456204
Net Purchase of Second Hand Assets 0 0 0 0 0 0 0
Change in Stocks 0 0 0 0 0 0 0
Gross Capital Formation 0 0 2 327506 63666 65024 456204
Industry and Asset wise Capital Formation of General Government for the year 2014-15 (RE)
Table -14
T. 1
5

Sl No.
Year: 2014-15 (RE)
Crops
Forestry &
Logging
Manufacturing
registered.
Railways
Manufacturing Electricity
Trade &
Repair
Services
Railways
Transport
Road
Transport
Water
Transport
Air
Transport
Services
Incidental to
Transport
Communication
& Services
related to
Broadcasting Total
1 2 3 4 5 6 7 8 9 10 11 12 13 14 15
Construction (1+2) 31 0 0 0 0 0 0 0 0 0 0 0 31
1 Dwelling 0 0 0 0 0 0 0 0 0 0
2 Other Building and Sturcture (2.1+2.2+2.3) 31 0 0 0 0 0 0 0 0 0 0 0 31
2.1 Non-Residential Building 0 0 0 0 0 0 0 0 0 0
2.2 Other Structures 0 0 0 0 0 0 0 0 0 0
2.3 Land Improvement 0 0 0 0 0 0 0 0 0 0
2.4 Roads & Bridges 0 0 0 0 0 0 0 0 0 0
3 Machinery and Equipment (3.1+3.2+3.3+3.4) 0 1 0 0 0 0 0 0 0 0 0 0 1
3.1 Transport Equipment 0 0 0 0 0 0 0 0 0 0
3.2 ICT Equipment 0 1 0 0 0 0 0 0 0 1
3.3 Other Machinery and Equipment 0 0 0 0 0 0 0 0 0 0
3.4 Weapons Systems 0 0 0 0 0 0 0 0 0 0
4 Cultivated Biological Resources (P5.1+P5.2) 0 0 0 0 0 0 0 0 0 0 0 0 0
4.1 Animal Resources Yielding Repeat Products 0 0 0 0 0 0 0 0 0 0
4.2 Tree, Crop and Plant Resources Yielding Repeat Products 0 0 0 0 0 0 0 0 0 0
5 Intellectual Property Products ( sum of P7.1 to P7.5) 0 0 0 0 0 0 0 0 0 0 0 0 0
5.1 Research and Development 0 0 0 0 0 0 0 0 0 0
5.2 Mineral Exploration and Evaluation 0
5.3 Computer Software and Databases 0 0 0 0 0 0 0 0 0 0
5.4 Entertainment, Literary of Artistic Originals 0
5.5 Other Intellectual Property Products 0 0 0 0 0 0 0 0 0 0
Total New Outlay 31 1 0 0 0 0 0 0 0 0 0 0 32
Net Purchase of Second Hand Assets 0 0 0 0 0 0 0 0 0 0
Change in Stocks 0 0 0 0 0 0 0 0 0 0
Gross Capital Formation 31 1 0 0 0 0 0 0 0 0 0 0 32
Industry and Asset wise Capital Formation of DCUs
Table - 15
T. 1
6

Administrative Deptts. Buildings
Other
Constructions Roads Product Production
(1) (2) (3) (4) (5) (6) (7) (8) (9) (10) (11) (12)
1 General Public Services 122518 63624 30585 0 0 2912 217499 0 0 437138
1.1 General Administration, External affairs, Public Order & Safety 122518 63624 30585 0 0 2912 217499 0 0 437138
1.1.1 Public Order & safety 79007 21801 85 0 0 2240 0 0 0 103133
1.1.2 Planning & Statistical Activities 1243 283 0 0 0 0 0 0 0 1526
1.1.3 General Administration, External affairs, Public Order & Safety, n.e.c 42268 41540 30500 0 0 672 217499 0 0 332479
1.2 General Research 0 0 0 0 0 0 0 0 0 0
2 Defence 795 1164 0 0 0 0 0 0 0 1959
3 Education 359485 60100 12 0 0 115887 128588 0 0 664072
3.1 Administration, Regulation & Research 13195 1819 6 0 0 12797 0 0 0 27817
3.2 Education Services n.e.c. 346290 58281 6 0 0 103090 128588 0 0 636255
4 Health Affairs and Services 129392 47705 0 0 0 68238 15646 0 0 260981
4.1 Administration, Regulation and Research 10669 5888 0 0 0 29 68 0 0 16654
4.2 Health Services 118723 41817 0 0 0 68209 15578 0 0 244327
5 Social Security and Welfare Affairs and Services 19937 61547 0 0 0 123239 2188 4510 0 211421
6 Housing and Community Amenity Affairs and Services 714 1151 7200 0 0 2734 74908 0 0 86707
7 Cultural, Recreational and Religeous Affairs Services 2171 5574 0 0 0 8214 43 0 0 16002
8 Economic Affairs and Services 8732 20049 0 15 39000 45576 1175 46386 123233 284166
8.1 General Administration, Regulation and Research 2634 487 0 0 0 801 0 0 0 3922
8.2 Agriculture, Forestry, Fishing and Hunting 4291 722 0 15 0 702 0 0 2233 7963
8.3 Mining, Manufacturing and Construction 888 899 0 0 0 465 0 208 0 2460
8.4 Electricity, Gas, Steam and Other Sources of Energy 79 538 0 0 0 36467 0 35795 0 72879
8.5 Water Supply 0 0 0 0 0 7140 0 2083 0 9223
8.6 Transport and Communication 0 17406 0 0 39000 1 1175 8300 121000 186882
8.7 Other Economic Services 840 -3 0 0 0 0 0 0 837
9 Environmental Protection 260 1274 0 0 0 537 0 0 2071
10 Relief on Calamities 3824 5306 0 9500 0 925 0 0 19555
647828 267494 37797 9515 39000 368262 440047 50896 123233 1984072
T. 1
7
Subsidy
Total
Table - 16
Economic Cum Purpose Classification of Delhi Govt. Budget Expenditure for 2014-15 (RE)P
urp
ose
Co
de
Current Expenditure
Total
Current Expenditure
Economic Classification
Local Bodies
Purpose Classification
Repair & Maintenance
Consumption Expenditure
Compensation
of Employees
Net
Purchase
of Goods
&
Services Non Govt.

Residential
Non
Residential
(13) (14) (15) (16) (17) (18) (19) (20) (21) (22) (23) (24) (25) (26) (27) (28) (29) (30) (31) (32) (33)
1 250 44270 0 0 853 1629 2 4466 0 0 0 0 0 0 60 0 0 0 51530 488668
1.1 250 44270 0 0 853 1629 2 4466 0 0 0 0 0 0 60 0 0 0 51530 488668
1.1.1 250 18060 0 0 543 1529 0 807 0 0 0 0 0 0 55 0 0 0 21244 124377
1.1.2 0 0 0 0 0 0 0 1639 0 0 0 0 0 0 0 0 0 0 1639 3165
1.1.3 0 26210 0 0 310 100 2 2020 0 0 0 0 0 0 5 0 0 0 28647 361126
1.2 0 0 0 0 0 0 0 0 0 0 0 0 0 0 0 0 0 0 0 0
2 0 0 0 0 14 132 0 0 0 0 0 0 0 0 0 0 0 0 146 2105
3 40 57824 0 10 51 4231 200 2016 0 0 0 0 0 0 3626 23900 2500 0 94398 758470
3.1 0 275 0 0 0 368 0 63 0 0 0 0 0 0 6 0 0 0 712 28529
3.2 40 57549 0 10 51 3863 200 1953 0 0 0 0 0 0 3620 23900 2500 0 93686 729941
4 0 55096 0 300 44 9314 0 423 0 0 0 0 0 0 7893 10804 0 0 83874 344855
4.1 0 50 0 0 0 11 0 97 0 0 0 0 0 0 0 0 0 0 158 16812
4.2 0 55046 0 300 44 9303 0 326 0 0 0 0 0 0 7893 10804 0 0 83716 328043
5 5364 1340 1600 1600 0 0 40 305 0 0 0 0 0 0 5 0 1620 0 11874 223295
6 5300 828 10883 61108 0 0 0 5 0 0 0 0 0 1 42003 35165 25 15150 170468 257175
7 0 3890 0 622 0 1 0 12 0 0 0 0 0 0 1981 22 2000 0 8528 24530
8 0 2708 170378 7903 2 0 33 137 165 0 0 16080 0 86399 76926 24725 191511 1000 577967 862133
8.1 0 1555 0 0 0 0 10 40 0 0 0 0 0 0 0 0 0 0 1605 5527
8.2 0 53 0 1892 2 0 10 44 165 0 0 0 0 0 0 0 0 0 2166 10129
8.3 0 0 0 5810 0 0 3 13 0 0 0 0 0 0 75 0 92 0 5993 8453
8.4 0 0 0 201 0 0 0 0 0 0 0 10000 0 3699 20016 0 29500 0 63416 136295
8.5 0 0 0 0 0 0 0 0 0 0 0 0 0 0 56835 0 118522 0 175357 184580
8.6 0 1100 170378 0 0 0 0 0 0 0 0 6080 0 82700 0 24725 43397 1000 329380 516262
8.7 0 0 0 0 0 0 10 40 0 0 0 0 0 0 0 0 0 0 50 887
9 0 0 0 100 608 0 20 80 0 0 0 0 0 0 20 0 0 0 828 2899
10 0 0 0 0 0 5 0 2 0 0 0 0 0 0 0 0 0 0 7 19562
Total 10954 165956 182861 71643 1572 15312 295 7446 165 0 0 16080 0 86400 132514 94616 197656 16150 999620 2983692
T. 1
8
To
Others/
Non Govt.
To Local
Bodies
Co
mp
ute
r
So
ftw
are
Cu
ltiv
ate
d A
sse
ts
An
ima
l S
tock
Capital Transfer
Se
con
d H
an
d
Ass
ets
Outlay (New)Net Purchase of Assets
Lan
d
Ch
an
ge
in
Sto
ck
Fin
an
cia
l A
sse
tsPurpose
Code
Ro
ad
s
Oth
er
Co
nst
ruct
ion
Tra
nsp
ort
Ma
chin
ary
Capital Expenditure
Total
Expenditure
(Current +
Capital)
Info
rma
tio
n a
nd
Co
mm
un
ica
tio
n
Te
chn
olo
gy
ECONOMIC CLASSIFICATION
Buildings
Table - 16 (Contd.)
Economic Cum Purpose Classification of Delhi Govt. Budget Expenditure for 2014-15 (RE)
Ad
va
nce
to
No
n-G
ov
t
Ad
va
nce
s to
Lo
cal
Bo
die
s
Total Capital
Expenditure
Physical Assets

Figures in Rs. Lacs
Receipt Expenditure
A. Revenue and Capital Account 3856500 3769005
I. Borrowing at Home
1. Internal Debt 0 0
2. Small Savings, Provident Fund etc. 0 0
3. Other Debt
Total 0 0
Net Receipts (I) 0
II. Borrowing Abroad
1. External Debt 0 0
2. Other Debt
Total 0 0
Net Receipts (II) 0
III. Extra Budgetary Receipts & Adjustments
1. Loans from Government of India 103813 176518
2. Loans and Advances from States Government 38100 167377
3. InterState Settlement 0 0
4. Contingency Fund 0 0
5. Reserve Funds 0 0
6. Deposits & Advances 0 0
7. Suspense and Miscellaneous 0 0
8. Remittances 0 0
9. Cash Balance 0 -114487
10. Funds Revenue Account 0 1000
11. Funds Commercial Account 0
Total 141913 230408
Net Receipts (III) -88495
Check Total excluding Funds 3998413 3998413
Difference (Receipt - Expenditure) 0
Borrowing Account of Delhi Govt. for the Year 2015-16 (BE)
Table - 17
Items
T. 19

Receipt Expenditure
1. Income from Enterpreneurship and Property 82416 1. Government Final Consumption Expenditure (GFCE) 1245392
1.1 Profits 390 1.1 Compensation of Employees 778885
1.2 Income from Property 82026 a) Wages & Salaries 766430
1.2.1 Net Interest Received 74000 b) Pension 12455
a) Public Authorities 43000 1.2 Net Purchases of Goods & Services 420164
i) Centre a) Purchases 343386
ii) States 0 b) Maintenance 92825
iii) Local Authorities 43000 c) Less Sales 16047
b) Foreign 0 1.3 Transfers in kind 46343
c) From other Sectors 31000 1.4 CFC
1.2.2 Other Property Receipts 8026 2. Net Interest Paid to 322774
2. Total Tax Revenue 3467320 2.1 Public Authorities 322774
2.1 Import Duty 0 a) Centre 322774
2.2 Export Duty 0 b) States 0
2.3 Production Taxes 458220 c) Local Authorities 0
2.4 Product Taxes 3009100 2.2 Foreign Agencies 0
2.5 Other Transfers 0 2.3 Others 0
3. Fees & Miscellaneous Receipts 11346 2.4 Less Commercial Interest 0
4. Total Transfers from Public Authorities 277700 3. Total Subsidies 314653
4.1 Centre 277700 3.1 Production Subsidies 132552
4.2 States 0 3.2 Product Subsidies 182101
4.3 Local Authorities 0 4. Total Current Transfers to (Other than Inter-Government) 359990
Total Receipts (1+2+3+4) 3838782 4.1 Other Sectors 359990
4.2 Foreign 0
5. Total Inter-Government Transfers 585746
5.1 Current to 499662
a) Centre
b) States 0
c) Local Authorities 499662
5.2 Capital to 86084
a) Centre
b) States 0
c) Local Authorities 86084
6. Total Current Expenditure (1+2+3+4+5) 2828555
8. Surplus on Current Account 1010227
Income Outlay Account of Delhi Govt. (Administrative Departments) for the year 2015-16 (BE)
Table - 18
Figures in Lacs
T. 20

Figures in Lacs
I. Expenditure
Administration
1. Capital Outlay 681854
2. Net Purchase of Physical Assets 15100
2.1 Second Hand Assets 0
2.2 Land 15100
3. Change in Stock 0
3.1 Inventory 0
3.2 Others 0
4. Capital Transfers 135971
4.1 for Capital Formation 135971
4.2 for Others
5. Total (1 to 4) 832925
Enterprises
6. Capital Outlay 8
7. Net Purchase of Physical Assets 0
7.1 Second Hand Assets 0
7.2 Land 0
8. Change in Stock 0
9. Total (6 to 8) 8
Total Expenditure (5 + 9) 832933
II. Receipts
11. Surplus on Current Account 1010227
12. Consumption of Fixed Capital 0
13. Foreign Grants 0
14. Net Budgetary Borrowing 0
14.1 At Home 0
14.2 From Abroad 0
15 Other Liabilities -177294
15.1 Net Extra Budgetary Borrowing -88495
15.2 less Net Purchase of Financial Assets 88799
16. Total Receipts (11 to 15) 832933
Capital Finance Account of Delhi Govt.
Table - 19
Administration and Enterprises for the year 2015-16 (BE)
T.21

Item Salary Pension Others NDP CFC GDP IC Output
1. Total 735973 12455 30457 778885 0 778885 436211 1215096
2. Construction (Repaire & Maintenance) 16573 280 569 17422 0 17422 88982 106404
3. Water Supply 0 0 0 0 0 0 0 0
4. Other Services 543612 9200 11137 563949 0 563949 119586 683535
I. (a) Education (3.2) 411498 6964 9090 427552 0 427552 76786 504338
(b) Medical & Public Health (4.2) 130751 2213 2031 134995 0 134995 42520 177515
(c) Sanitaion 0 0 0 0 0 0 0 0
(d) Veterinary Services 1363 23 16 1402 0 1402 280 1682
5. Sub Total (2 to 4) 560185 9480 11706 581371 0 581371 208568 789939
6. Public Administration & Defence (1-5) 175788 2975 18751 197514 0 197514 227643 425157
Estimates of Output Of General Government For the year 2015-16 (BE)
Table - 20
Figures in Rs. Lacs
T. 2
2

Figures in Rs. Lacs
Bm Rm Cm Sa
les
Su
bsi
dy
To
tal
Re
ceip
ts
1. Agriculture (Irrigation) 355 0 6 50 0 0 1200 0 0 0 390 2001 0 2001 751 751
2. Forests 2288 75 40 202 0 0 7 0 0 0 0 60 2552 2612 2403 2403
3. Manufacturing 0 0 0 0 0 0 0 0 0 0 0 0 0 0 0 0
4. Electricity 0 0 0 0 0 0 0 0 0 0 0 0 0 0 0 0
5. Services Incidental to Transport 0 0 0 0 0 0 0 0 0 0 0 0 0 0 0 0
6. Civil Aviation 0 0 0 0 0 0 0 0 0 0 0 0 0 0 0 0
7. Road Transport 0 0 0 0 0 0 0 0 0 0 0 0 0 0 0 0
8. Water Transport 0 0 0 0 0 0 0 0 0 0 0 0 0 0 0 0
9. Trade & Hotels 0 0 0 0 0 0 0 0 0 0 0 0 0 0 0 0
10.Other Services 0 0 0 0 0 0 0 0 0 0 0 0 0 0 0 0
11. Total 2643 75 46 252 0 0 1207 0 0 0 390 2061 2552 4613 3154 3154
Sa
lary
& W
ag
es
Be
ne
fits
Pe
nsi
on
Pu
rch
ase
s
Re
nt
Inte
rest
De
pri
cia
tio
n
Pro
fits
Net
Product
Gross
Product
Coomercial Receipts
T. 2
3
Estimate of Domestic Product by Industry of Origin and Factor Income (DCUs) for the year 2015-16 (BE)
Table - 21
Maintenance
Industry

Sl No. Items
Water
Supply
Remediation
& other utility
services
(Sanitation) Construction
Public
Admministration
& Defence Education Health Total
1 2 3 4 5 6 7 8 9
Construction (1+2) 0 0 0 349609 216335 72000 637944
1 Dwelling 0 0 12288 0 0 12288
2 Other Building and Sturcture (2.1+2.2+2.3) 0 0 0 337321 216335 72000 625656
2.1 Non-Residential Building 0 0 75537 215725 71700 362962
2.2 Other Structures 0 0 92752 610 300 93662
2.3 Land Improvement 0 0 0 0 0 0
2.4 Roads & Bridges 0 0 169032 0 0 169032
3 Machinery and Equipment (3.1+3.2+3.3+3.4) 0 0 17 23534 8708 10969 43228
3.1 Transport Equipment 0 0 1003 19 56 1078
3.2 ICT Equipment 0 0 17 10674 4160 626 15477
3.3 Other Machinery and Equipment 0 0 0 11857 4529 10287 26673
3.4 Weapons Systems 0 0 0 0 0 0 0
4 Cultivated Biological Resources (4.1+4.2) 0 0 0 225 0 0 225
4.1 Animal Resources Yielding Repeat Products 0 0 0 0 0 0 0
4.2 Tree, Crop and Plant Resources Yielding Repeat Products 0 0 0 225 0 0 225
5 Intellectual Property Products ( sum of 5.1 to 5.5) 0 0 0 137 320 0 457
5.1 Research and Development 0 0 0 0 0 0 0
5.2 Mineral Exploration and Evaluation 0
5.3 Computer Software and Databases 0 0 0 137 320 0 457
5.4 Entertainment, Literary of Artistic Originals 0
5.5 Other Intellectual Property Products 0 0 0 0 0 0 0
Total New Outlay 0 0 17 373505 225363 82969 681854
Net Purchase of Second Hand Assets 0 0 0 0 0 0 0
Change in Stocks 0 0 0 0 0 0 0
Gross Capital Formation 0 0 17 373505 225363 82969 681854
Industry and Asset wise Capital Formation of General Government for the year 2015-16 (BE)
Table -22
T. 2
4

Sl No. Year: 2015-16 (BE) Crops
Forestry &
Logging
Manufacturing
registered.
Railways
Manufacturing Electricity
Trade &
Repair
Services
Railways
Transport
Road
Transport
Water
Transport
Air
Transport
Services
Incidental to
Transport
Communication
& Services
related to
Broadcasting Total
1 2 3 4 5 6 7 8 9 10 11 12 13 14 15
Construction (1+2) 5 0 0 0 0 0 0 0 0 0 0 0 5
1 Dwelling 0 0 0 0 0 0 0 0 0 0
2 Other Building and Sturcture (2.1+2.2+2.3) 5 0 0 0 0 0 0 0 0 0 0 0 5
2.1 Non-Residential Building 0 0 0 0 0 0 0 0 0 0
2.2 Other Structures 0 0 0 0 0 0 0 0 0 0
2.3 Land Improvement 0 0 0 0 0 0 0 0 0 0
2.4 Roads & Bridges 0 0 0 0 0 0 0 0 0 0
3 Machinery and Equipment (3.1+3.2+3.3+3.4) 0 3 0 0 0 0 0 0 0 0 0 0 3
3.1 Transport Equipment 0 0 0 0 0 0 0 0 0 0
3.2 ICT Equipment 0 3 0 0 0 0 0 0 0 3
3.3 Other Machinery and Equipment 0 0 0 0 0 0 0 0 0 0
3.4 Weapons Systems 0 0 0 0 0 0 0 0 0 0
4 Cultivated Biological Resources (P5.1+P5.2) 0 0 0 0 0 0 0 0 0 0 0 0 0
4.1 Animal Resources Yielding Repeat Products 0 0 0 0 0 0 0 0 0 0
4.2 Tree, Crop and Plant Resources Yielding Repeat Products 0 0 0 0 0 0 0 0 0 0
5 Intellectual Property Products ( sum of P7.1 to P7.5) 0 0 0 0 0 0 0 0 0 0 0 0 0
5.1 Research and Development 0 0 0 0 0 0 0 0 0 0
5.2 Mineral Exploration and Evaluation 0
5.3 Computer Software and Databases 0 0 0 0 0 0 0 0 0 0
5.4 Entertainment, Literary of Artistic Originals 0
5.5 Other Intellectual Property Products 0 0 0 0 0 0 0 0 0 0
Total New Outlay 5 3 0 0 0 0 0 0 0 0 0 0 8
Net Purchase of Second Hand Assets 0 0 0 0 0 0 0 0 0 0
Change in Stocks 0 0 0 0 0 0 0 0 0 0
Gross Capital Formation 5 3 0 0 0 0 0 0 0 0 0 0 8
Industry and Asset wise Capital Formation of DCUs
Table - 23
T. 2
5

Administrative Deptts. Buildings
Other
Constructions Roads Product Production
(1) (2) (3) (4) (5) (6) (7) (8) (9) (10) (11) (12)
1 General Public Services 147022 73838 35090 0 0 10230 239090 0 0 505270
1.1 General Administration, External affairs, Public Order & Safety 147022 73838 35090 0 0 10230 239090 0 0 505270
1.1.1 Public Order & safety 94576 38622 90 0 0 2335 0 0 0 135623
1.1.2 Planning & Statistical Activities 1433 642 0 0 0 0 0 0 0 2075
1.1.3 General Administration, External affairs, Public Order & Safety, n.e.c 51013 34574 35000 0 0 7895 239090 0 0 367572
1.2 General Research 0 0 0 0 0 0 0 0 0 0
2 Defence 943 1334 0 0 0 0 0 0 0 2277
3 Education 442811 94427 20 0 0 136439 141318 0 0 815015
3.1 Administration, Regulation & Research 15259 6526 10 0 0 14070 0 0 0 35865
3.2 Education Services n.e.c. 427552 87901 10 0 0 122369 141318 0 0 779150
4 Health Affairs and Services 147746 59463 0 0 0 62940 15991 0 0 286140
4.1 Administration, Regulation and Research 12728 23852 0 0 0 256 68 0 0 36904
4.2 Health Services 135018 35611 0 0 0 62684 15923 0 0 249236
5 Social Security and Welfare Affairs and Services 21783 60248 0 0 0 130476 2188 4505 0 219200
6 Housing and Community Amenity Affairs and Services 863 1282 7500 0 0 2323 99905 0 0 111873
7 Cultural, Recreational and Religeous Affairs Services 2463 56617 0 0 0 8374 170 0 0 67624
8 Economic Affairs and Services 10403 13026 0 15 40000 7401 1000 177596 132552 381993
8.1 General Administration, Regulation and Research 2846 645 0 0 0 1270 0 0 0 4761
8.2 Agriculture, Forestry, Fishing and Hunting 5242 1035 0 15 0 810 0 0 2552 9654
8.3 Mining, Manufacturing and Construction 1143 971 0 0 0 490 0 196 0 2800
8.4 Electricity, Gas, Steam and Other Sources of Energy 166 179 0 0 0 1730 0 144000 0 146075
8.5 Water Supply 0 0 0 0 0 3100 0 25000 0 28100
8.6 Transport and Communication 0 10200 0 0 40000 1 1000 8400 130000 189601
8.7 Other Economic Services 1006 -4 0 0 0 0 0 0 0 1002
9 Environmental Protection 305 1367 0 0 0 607 0 0 0 2279
10 Relief on Calamities 4546 12080 0 10200 0 1200 0 0 0 28026
778885 373682 42610 10215 40000 359990 499662 182101 132552 2419697
Local Bodies
Subsidy
Total
Table - 24
Economic Cum Purpose Classification of Delhi Govt. Budget Expenditure for 2015-16 (BE)P
urp
ose
Co
de
Current Expenditure
Total
Current Expenditure
Economic Classification
T. 2
6
Repair & Maintenance
Consumption Expenditure
Compensation
of Employees
Net
Purchase
of Goods
&
Services Non Govt.
Purpose Classification
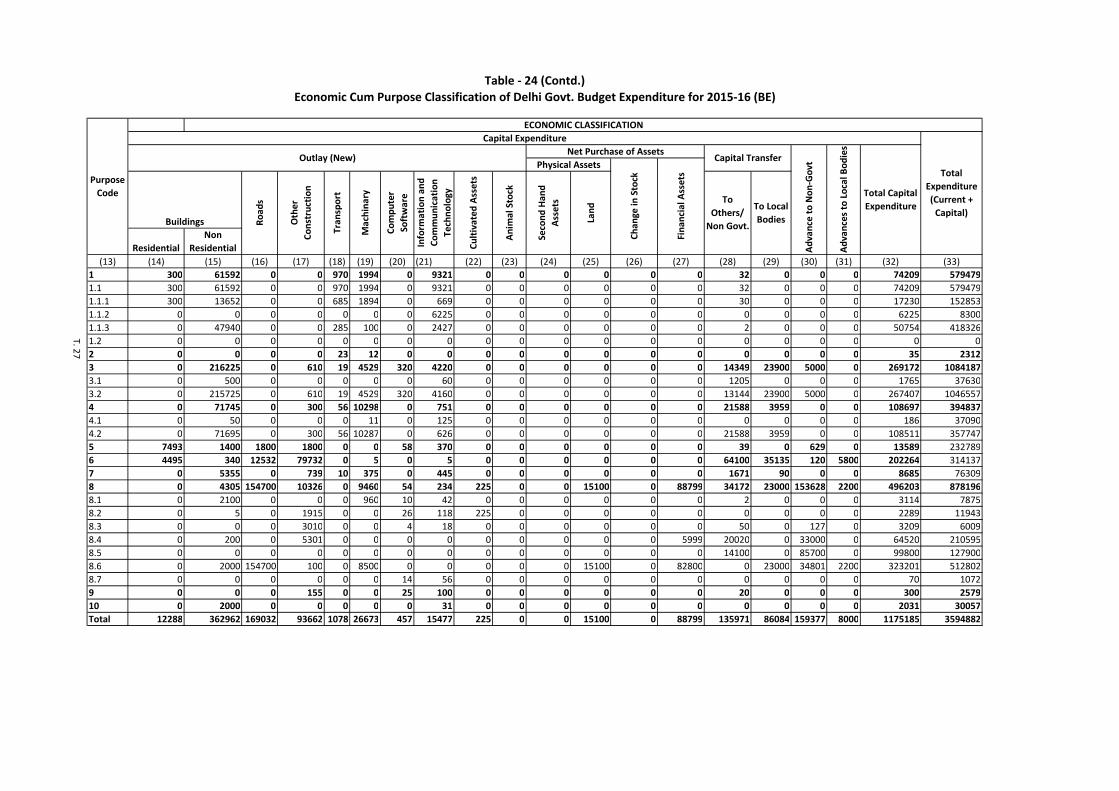
Residential
Non
Residential
(13) (14) (15) (16) (17) (18) (19) (20) (21) (22) (23) (24) (25) (26) (27) (28) (29) (30) (31) (32) (33)
1 300 61592 0 0 970 1994 0 9321 0 0 0 0 0 0 32 0 0 0 74209 579479
1.1 300 61592 0 0 970 1994 0 9321 0 0 0 0 0 0 32 0 0 0 74209 579479
1.1.1 300 13652 0 0 685 1894 0 669 0 0 0 0 0 0 30 0 0 0 17230 152853
1.1.2 0 0 0 0 0 0 0 6225 0 0 0 0 0 0 0 0 0 0 6225 8300
1.1.3 0 47940 0 0 285 100 0 2427 0 0 0 0 0 0 2 0 0 0 50754 418326
1.2 0 0 0 0 0 0 0 0 0 0 0 0 0 0 0 0 0 0 0 0
2 0 0 0 0 23 12 0 0 0 0 0 0 0 0 0 0 0 0 35 2312
3 0 216225 0 610 19 4529 320 4220 0 0 0 0 0 0 14349 23900 5000 0 269172 1084187
3.1 0 500 0 0 0 0 0 60 0 0 0 0 0 0 1205 0 0 0 1765 37630
3.2 0 215725 0 610 19 4529 320 4160 0 0 0 0 0 0 13144 23900 5000 0 267407 1046557
4 0 71745 0 300 56 10298 0 751 0 0 0 0 0 0 21588 3959 0 0 108697 394837
4.1 0 50 0 0 0 11 0 125 0 0 0 0 0 0 0 0 0 0 186 37090
4.2 0 71695 0 300 56 10287 0 626 0 0 0 0 0 0 21588 3959 0 0 108511 357747
5 7493 1400 1800 1800 0 0 58 370 0 0 0 0 0 0 39 0 629 0 13589 232789
6 4495 340 12532 79732 0 5 0 5 0 0 0 0 0 0 64100 35135 120 5800 202264 314137
7 0 5355 0 739 10 375 0 445 0 0 0 0 0 0 1671 90 0 0 8685 76309
8 0 4305 154700 10326 0 9460 54 234 225 0 0 15100 0 88799 34172 23000 153628 2200 496203 878196
8.1 0 2100 0 0 0 960 10 42 0 0 0 0 0 0 2 0 0 0 3114 7875
8.2 0 5 0 1915 0 0 26 118 225 0 0 0 0 0 0 0 0 0 2289 11943
8.3 0 0 0 3010 0 0 4 18 0 0 0 0 0 0 50 0 127 0 3209 6009
8.4 0 200 0 5301 0 0 0 0 0 0 0 0 0 5999 20020 0 33000 0 64520 210595
8.5 0 0 0 0 0 0 0 0 0 0 0 0 0 0 14100 0 85700 0 99800 127900
8.6 0 2000 154700 100 0 8500 0 0 0 0 0 15100 0 82800 0 23000 34801 2200 323201 512802
8.7 0 0 0 0 0 0 14 56 0 0 0 0 0 0 0 0 0 0 70 1072
9 0 0 0 155 0 0 25 100 0 0 0 0 0 0 20 0 0 0 300 2579
10 0 2000 0 0 0 0 0 31 0 0 0 0 0 0 0 0 0 0 2031 30057
Total 12288 362962 169032 93662 1078 26673 457 15477 225 0 0 15100 0 88799 135971 86084 159377 8000 1175185 3594882
To Local
Bodies
Co
mp
ute
r
So
ftw
are
Cu
ltiv
ate
d A
sse
ts
An
ima
l S
tock
Capital Transfer
Se
con
d H
an
d
Ass
ets
Outlay (New)Net Purchase of Assets
Lan
d
Physical Assets
Ch
an
ge
in
Sto
ck
Fin
an
cia
l A
sse
tsPurpose
Code
Ro
ad
s
Oth
er
Co
nst
ruct
ion
Tra
nsp
ort
Ma
chin
ary
Capital Expenditure
To
Others/
Non Govt.
T. 2
7
Total
Expenditure
(Current +
Capital)
Info
rma
tio
n a
nd
Co
mm
un
ica
tio
n
Te
chn
olo
gy
ECONOMIC CLASSIFICATION
Buildings
Table - 24 (Contd.)
Economic Cum Purpose Classification of Delhi Govt. Budget Expenditure for 2015-16 (BE)
Ad
va
nce
to
No
n-G
ov
t
Ad
va
nce
s to
Lo
cal
Bo
die
s
Total Capital
Expenditure

ANNEXURES

ANNEXURE-A1
Abbreviations for Economic Classification of Budget Documents
(Base Year 2011-12)
S. No. SNA Description
Economic
Code Definition
Receipts
1 Capital Transfers Captng Capital Transfers, Non-government/Individuals
2 Commercial Receipts Cr Commercial Receipt
3
Current Transfers
Tc Transfers, Central Government
4 Ts Transfers, State Governments
5 Tl Transfers, Local Authorities
6 Tn Transfers, Non-Profit Institutions
7 Tf Transfers, Foreign Governments
8
Other Receipts
F Withdrawal from Funds
9 Dt Direct Taxes
Txt Product Tax
Txn Production Tax
Txo Other Tax
10 Mr Fees and Miscellaneous Receipts
11 It Indirect Taxes
12 Ssh Sale, Second Hand Assets
13 Sl Sale, Land
14 Sfa Sale, Financial Assets
15 Pension Receipts Pn Pension Contribution
16
Property Income
Into Interests, Non-Government Bodies
17 Intf Interest, Foreign Government/Organisations
18 Intc Interest, Central Government
19 Ints Interests, State Governments
20 Intl Interests, Local Bodies
21 Pr Property Receipts
Expenditure
22
Advances
Ang Advances, Non-government Organisations
23 Af Advances Foreign Countries /Organisations
24 Al Advances, Local Authorities
25
Capital Transfers
Capti Capital Transfers to Individuals
26 Captp Capital Transfers to Private Institutions
27 Capta Capital Transfers to Autonomous Bodies
28 Capts Capital Transfers to State Government
29 Captl Capital Transfers to Local Authorities
30 Captf Capital Transfers to Foreign Countries/Organisations
31
Compensation of
Employees
S Salaries
32 W Wages
33 A Allowances
34 Bcs Social (Cash) Benefits
35 Bco Others (Cash) Benefits
36 Bk Benefits in Kind
37 P1 Pension Payments
38 P2 Employers' Contributions to Pension Fund
39 Current Transfers Ti Transfers to Individuals

40 Tp Transfers to Private Institutions
41 Ta Transfers to Autonomous Bodies
42 Tk Transfers in kind
43 Tc Transfer to Centre
44 Ts Transfer to State
45 Tl Transfer to Local Bodies
46 Tf Transfer to Foreign
47 Financial Assets Pfa Purchase of Financial Assets
48
Gross Capital Formation
Psh Purchase of Second Hand Assets
49 Pl Purchase of Land
50 Stof Change in stock of Food
51 Stoi Change in stock of Inventory
52
Gross Fixed Capital
Formation
Bo Expenditure on Construction of Buildings
Bor Dwellings
Bonr Non-Residential Building & Structure
53 Ro Expenditure on Construction of Road
54 Co Expenditure on Construction of Other Capital
Li Land Improvement
55 Tro Expenditure on Purchase of Transport
56 Mo Expenditure on Purchase of Machinery
57 So Expenditure on Purchase of Software
ICT Information & Communication Technology Equipment
58 Cao Expenditure on acquiring Cultivated Assets
59 Aso Expenditure on acquiring Animal Stock
RnD Research and Development
OIPP Other Intellectual Property Product
60
Intermediate
Consumption
G Purchase of Goods & Services
61 Bm Maintenance of Buildings
62 Rm Maintenance of Roads
63 Cm Maintenance of Other Construction
64
Property Income
Intl Interest to Local Authorities
65 Into Interests to Non-Government Bodies
Intf Interest to Foreign Government/Organisations
Intc Interest to Central Government
Ints Interests to State Governments
Subsidies Sub Subsidies
Subt Product Subsidies
Subn Production Subsidies
For DCUs expenditure, the above economic codes will be written with “D” prefix. Therefore, “S” denotes
salary for administration and “DS” denotes salary for DCU. Similar logic follows for other economic codes
except current/ capital transfers and subsidies. DCUs have some additional economic codes. These codes
have been given below.
Departmental Commercial Undertaking (DCU)
S.
No SNA Description
Economic
Code Definition
1 Gross Capital Formation DCi DCU Change in Stock
2 Property Income Dr Rent, DCU
3 Property Income Dint DCU, Commercial Interest
4 Consumption of Fixed Capital Dp Depreciation
⌧⌧⌧

ANNEXURE-A2
DEFINITIONS OF THE ITEMS USED IN ECONOMIC
CLASSIFICATION
1. Income from Property and Entrepreneurship: This flow records the income
receivable by the State Government from departmental commercial undertakings as
well as the net rent and dividends accruing to it from the ownership of buildings or
financial assets.
2. Direct Taxes: Direct taxes in the SNA include two components, viz. direct taxes on
income and other direct taxes. Direct taxes cover levies by public authorities on
income from employment, property, capital gains or any other source except for social
security contributions. Other direct taxes include levies by public authorities at
regular intervals on the financial assets or total net worth of enterprises, private non-
profit institutions or households. Non-recurrent or occasional levies on these items
are excluded and treated as capital transfers. It would be noted that levies on the
possession and use of goods, for example, motor vehicle licenses are included here
only when paid by household. When paid by producers, they are classified as indirect
taxes.
� Corporate tax
� Taxes on income other than Corporation tax (e.g. Income Tax)
� Hotels receipts tax
� Other taxes on income and expenditure (e.g. Profession Tax)
� Land revenue
� Estate Duty
� Taxes on wealth
� Gift Tax
3. Indirect taxes: Indirect taxes are defined as taxes assessed on producers that are
chargeable to the cost of goods and services produced or sold. They include import
and export duties, excise, sales, entertainment and turnover taxes, real estate and land
taxes unless they are merely administrative devise for collecting income tax), levies
on value added and the employment of labour, motor vehicle driving license, airport
and passport fees when paid by producers.
� Stamps & Registration fees
� Customs
� Union & State Excise
� Sales Tax/ Value Added Tax
� Service Tax
� Taxes on Vehicles
� Taxes on goods & passengers
� Taxes and duties on electricity
� Entertainment tax
� Foreign Travel tax
� Fees under factories & Mines acts

� Import & Export license application
� Patent fees
� Registration of Trade Marks fees
� Registration of Joint Stock companies
� Fees for stamping Weights & Measures.
� Classification of Taxes and Subsidies: As per existing practice in the series of base
year 2004-05, taxes are classified as direct and indirect while Subsidies are classified
as subsidies only. From 2011-12 series onwards taxes/subsidies should be classified
as product/production taxes/subsidies. Production taxes and subsidies will be used to
prepare GVA at basic prices while product tax less subsidy will be added to GVA at
basic price to get GDP at Market Price.
� Production Taxes and Subsidies: Production tax or production subsidy is paid/
received on the factors of production – land, labour or capital, irrespective of the
volume of production. For instance, land revenue and stamp tax are treated as
production taxes, while, the input subsidies to farmers, some mining industries,
dredging subsidies to Kolkata Port Trust etc. have been treated as production
subsidies.
Product Tax/ Product Subsidy: A tax/subsidy on a product is a tax/subsidy that is
payable/receivable per unit of some good or service. Taxes on products consist of
taxes on goods and services that become payable as a result of the production, sale,
transfer, leasing or delivery of those goods or services, or as a result of their use for
own consumption or own capital formation. The tax may be a specific amount of
money per unit of quantity of a good or service or it may be calculated ad valorem as
a specified percentage of the price per unit or value of the goods or services
transacted.
4. Miscellaneous receipts: These receipts are in the nature of fees, fines and
forfeitures.
5. Revenue Transfer: Revenue grants, contributions are mostly from other public
authorities viz. transaction from centre to state or interstate transactions.
6. Compensation of Employees: This item comprises the remuneration of general
government employees such as salaries, wages, allowances and honorarium other than
traveling and daily allowance, contributions to provident fund by the government as
well as all pension payments to government employees are included. 6.1 Salary, Wages & Allowances: This include pay of officers and
establishment, honorarium and allowances other than traveling and daily allowances,
wages to different contractual employees.
6.2 Pension: This include pension payments to government employees as well as
employer’s contributions to the Pension Fund.
6.3 Benefits: Besides payment in cash, there are some items of expenditure,
which are clearly in the nature of payments in kind e.g. cost of liveries and uniforms,
rations supplied to police and defence personnel, etc. Leave encashment, gratuity

payment, contributions to provident fund, leave travel concessions, reimbursement of
medical expenditure, cost of text books to the children of low-paid govt. employees
are also treated as benefits.
7. Goods and Services: This includes all contingent expenditure on contingency such
as office supplies, rent, rates and taxes, fuel and light, printing, travel expenses,
telephone and telegraph charges and other items for current operations less sales by
general government of goods and services to enterprises and households. Whole of
the expenditure on current repairs and maintenance is also included here. Also
included are all payments / charges for services rendered for other agencies /
departments. Strictly speaking, rent paid is one of the factor payments and should be
classified accordingly. But the same is not being done due to non-availability of data.
8. Maintenance is the expenses towards maintenance of buildings, roads, machinery
etc.
9. Benefits: expenditure on social benefits viz., medical and educational e.g. medical
charges and reimbursement of medical expenditure, cost of textbooks to the children
of law-paid govt. employees: Other benefits (Leave Travel Concessions) in cash;.
The items like Compassionate allowance, family pension, leave encashment,
gratuities, commuted value of pension and other retirement benefits currently given
under the account head 2071 are also covered under this category. Payments in kind
e.g., cost of liveries and uniforms: rations supplied to police and defence personnel
etc. are to be treated as Benefits in kind.
10. Interest: Interest payments comprise interest on public debt and other obligations
other than on commercial debt. The interest paid to or received from other public
authorities are to be shown separately. The interest received from departmental
commercial undertakings appears as a payment item in ‘Production Account of
Departmental Commercial Undertakings’. This item, therefore, is deducted from both
interest received and interest paid so that there is no double counting.
11. Subsidies: “Subsidies are current unrequited payments that government units,
including non-resident government units, make to enterprises on the basis of the levels of their production
activities or the quantities or values of the goods or services which they produce, sell or import. They are
receivable by resident producers or importers. In the case of resident producers, they may be designed to
influence their levels of production, the prices at which their outputs are sold or the remuneration of the
institutional units engaged in production. Subsidies have the same impact as negative taxes on production in
so far as their impact on the operating surplus is in the opposite direction to that of taxes on production.”
(Para 7.98, SNA 2008)
“Subsidies are not payable to final consumers; current transfers that
governments make directly to households as consumers are treated as social benefits.
Subsidies also do not include grants that governments may make to enterprises in order to
finance their capital formation or compensate them for damage to their capital assets,
such grants being treated as capital transfers.” (Para 7.99, SNA 2008)
Transfers by general government to public corporations or private industries for investment purposes or
to cover destruction, damage and other losses in capital and working assets are classified as capital transfers
rather than as Subsidies. Most of the times these kinds of transfers to corporations are shown, in budget
documents, as subsidies; but actually they are not. A transfer is to be marked as subsidy only when the transfer is
for compensating the losses incurred by the corporation due to policy of the government. For instance, it is
government policy to boost the agricultural production and provide fertilizer to farmers at affordable prices.
Government has fixed maximum retail price (MRP) of fertilizer. But the cost of production or import of

fertilizer is more than MRP of fertilizer. Now if the manufacturer sells fertilizer at MRP, s/he will incur loses.
This loses (the difference between cost of production and MRP) will be compensated by government as
subsidies. Many times various grants are shown as subsidies in budgets documents. Details of this subsidy item
should be examined first. If the amount is not being given to producers to contain the prices as a government
policy, it should not be marked as subsidy.
Current grants made to non-profit institutions serving households are not to be considered subsidies.
Such payments will be classified as purchases of goods and services or current transfers by general government,
depending on the circumstances and conditions of the given payment. In the case of Departmental Commercial
Undertakings (DCU), losses are treated as imputed subsidies. This imputed subsidy is called implicit subsidy as
it is not directly available in budget documents. This imputed subsidy is added to subsidy (explicit subsidy)
obtained after budget analysis and put in Income and Outlay account of general government as subsidy.
Distinction between subsidies and current transfers is given below:
Sl. No. Subsidy Current Transfers
1 Direct to Producers only Direct to Households
2 Frequent Not frequent
3 To keep prices under control
12. Current Transfers: Current transfers or grants paid may be classified under three
main categories. Firstly, these can be to other Governments like Central Government,
State Governments and Local Authorities, secondly to the rest of the world (Foreign)
and thirdly to other sectors including households (grants to aided schools,
scholarships and stipends, welfare of the weaker sections of the society), private
institutions and autonomous bodies.
13. Capital Transfers: Capital transfers cover grants to finance the construction of
buildings, purchase of machinery and equipment and for public works, water supply
and sewage disposal schemes etc. Capital transfers are intended to assist capital
formation in other sectors of economy.
14. Saving on Current Account is derived as the balancing item on the current account
of government administration, i.e. surplus of current receipts over current expenditure.
15. Gross Fixed Capital Formation represents the gross value of the goods, which are
added to the domestic capital stocks during a year. It comprises the expenditure on
the acquisition as well as own account production of fixed assets. This also include
‘renewals and replacements’ as well. The gross fixed capital formation has been
classified into:
15.1 Buildings: Buildings include all expenditure on new construction and major
alternations to residential and non-residential buildings during the year. It includes
construction costs of the buildings together with cost of external and internal fixtures
during the year.
15.2 Other Construction: include expenditure works on power and irrigation
projects, flood control, forest clearance, land reclamation, water supply and sanitation
etc.
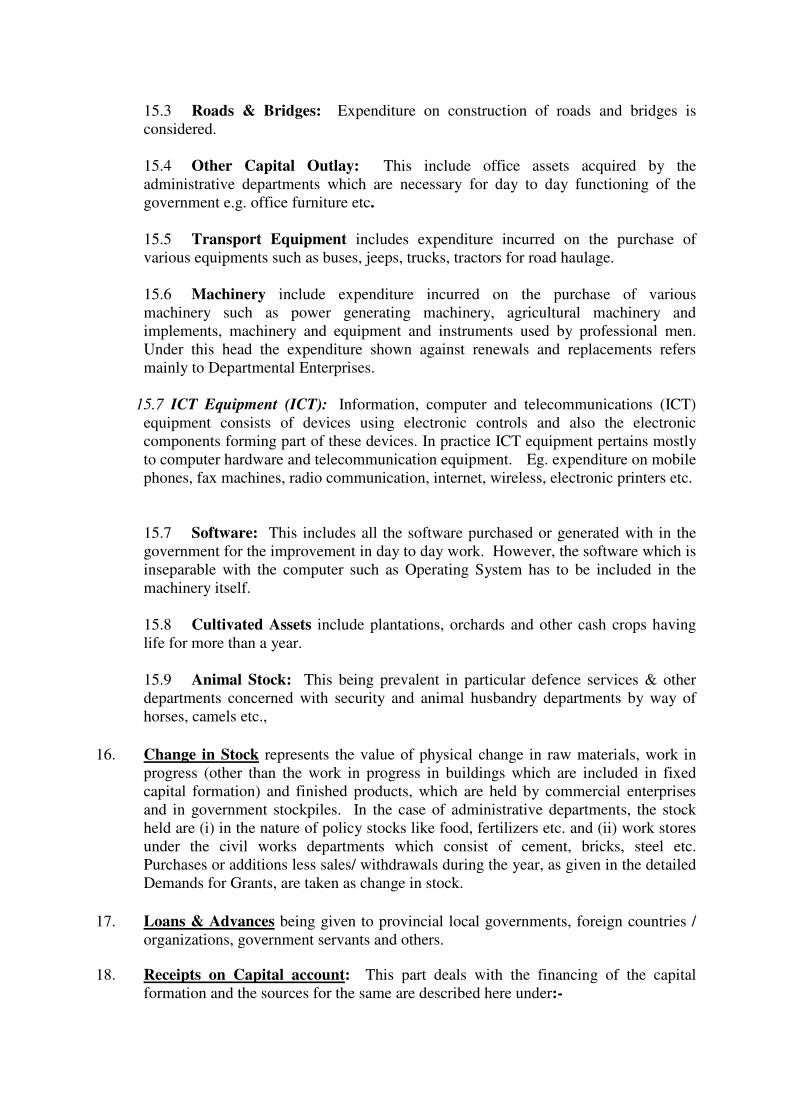
15.3 Roads & Bridges: Expenditure on construction of roads and bridges is
considered.
15.4 Other Capital Outlay: This include office assets acquired by the
administrative departments which are necessary for day to day functioning of the
government e.g. office furniture etc.
15.5 Transport Equipment includes expenditure incurred on the purchase of
various equipments such as buses, jeeps, trucks, tractors for road haulage.
15.6 Machinery include expenditure incurred on the purchase of various
machinery such as power generating machinery, agricultural machinery and
implements, machinery and equipment and instruments used by professional men.
Under this head the expenditure shown against renewals and replacements refers
mainly to Departmental Enterprises.
15.7 ICT Equipment (ICT): Information, computer and telecommunications (ICT)
equipment consists of devices using electronic controls and also the electronic
components forming part of these devices. In practice ICT equipment pertains mostly
to computer hardware and telecommunication equipment. Eg. expenditure on mobile
phones, fax machines, radio communication, internet, wireless, electronic printers etc.
15.7 Software: This includes all the software purchased or generated with in the
government for the improvement in day to day work. However, the software which is
inseparable with the computer such as Operating System has to be included in the
machinery itself.
15.8 Cultivated Assets include plantations, orchards and other cash crops having
life for more than a year.
15.9 Animal Stock: This being prevalent in particular defence services & other
departments concerned with security and animal husbandry departments by way of
horses, camels etc.,
16. Change in Stock represents the value of physical change in raw materials, work in
progress (other than the work in progress in buildings which are included in fixed
capital formation) and finished products, which are held by commercial enterprises
and in government stockpiles. In the case of administrative departments, the stock
held are (i) in the nature of policy stocks like food, fertilizers etc. and (ii) work stores
under the civil works departments which consist of cement, bricks, steel etc.
Purchases or additions less sales/ withdrawals during the year, as given in the detailed
Demands for Grants, are taken as change in stock.
17. Loans & Advances being given to provincial local governments, foreign countries /
organizations, government servants and others.
18. Receipts on Capital account: This part deals with the financing of the capital
formation and the sources for the same are described here under:-

(a.) Savings: The savings on current account is directly taken from Income and
Outlay Account.
(b.) Net Borrowings: Items like internal debt, small savings, provident fund etc.
are included here.
(c.)Other Liabilities: All investments in the share capitals or statutory corporations,
cooperative societies are classified as financial assets and are shown against other
liabilities as a negative figure. Also included are the extra- budgetary receipts like
loans from Government of India, inter state debt settlements, contingency fund,
deposits and advances, suspense remittances and cash balances etc. Besides like
famine relief fund, road fund etc. maintained by state Govt. are also covered here.
⌧⌧⌧

ANNEXURE-A3
ILLUSTRATION OF PURPOSE CLASSIFICATION OF SOME
IMPORTANT ITEMS
Expenditure on general administration is of two types viz.
(i) Expenditure on administrative work related to various purpose categories like
education, health, defence, agriculture, industries etc.
(ii) Expenditure on general administration of the government as a whole like department
of personnel, administration reforms, home external affairs, police, jails, justice, etc.
Both the types of administrative or secretariat expenditure are given in the budget.
For our purposes, the expenditures related to type (ii) are shown under the general
administration and those related to type (i) are shown under the related purpose categories. It
might be pointed out that expenditure on administration for some states is not available for
each department separately. In such cases, it was found difficult to allocate them to
appropriate purpose categories. Under the circumstances, an attempt was made to split the
expenditure by purpose categories on the basis of the proportion obtained from the adjoining
states.
Expenditure on education can be split into three groups :
(a) General education provided in schools, colleges, universities, centres of higher
research & learnings and other institutions providing specialised trainings.
(b) In-service training or on the job training for the employees deputed by any
organisation or office.
(c) Apprenticeship or similar other training in specialised fields organised for persons
with the object of fixing them in employment on the basis of the performance in the
training
In regard to purpose classification, category (a) above is classified as expenditure on
education. The other two categories are classified into purpose categories in accordance with
the character of the body organising the training.
The medical colleges, and nursing schools are grouped under the category education
even though they are reported under other account heads “Health” etc. The educational
activities which are integral part of other services are, however, grouped alongwith
respective services. Thus, expenditures relating to police training schools are grouped under
police, prisons reformatory schools with jails, training of I.A.S. are included in general
government services. All types of scholarships to students whether paid by the Department of
Education, Department of Social Welfare or any other body etc., grouped under category
education. Expenditure on cultural, recreational and religious activities (including that for
NCC, youth welfare and physical education ) are classified under the ‘ recreational services ‘.
Expenditure in regard to physical training in the educational institutions, are however,
grouped under education.
Hospital and dispensaries are grouped under category ‘health’ but the hospitals
attached to medical colleges are considered as integral part of medical education and
therefore they are grouped under ‘education’ rather than ‘health’. Expenditure incurred

on registration of births, deaths, diseases etc., are considered as expenditure on health
research and, therefore, classified under ‘health’. Family planning activities are treated as
those relating to welfare services and classified accordingly.
The expenditure relating to account heads ‘Rural Development’, ‘Community
Development’, ‘National Extension Services’, etc. have been broken, to the extent possible,
on the basis of information provided in the budget. The overhead expenditure on the specific
general expenditure relating to those account heads are classified under category housing and
community amenities.
The expenditure on P.W.D. are also split up and classified under different categories
according to the nature of offices for which construction has been done. Thus, expenditure
on construction of school buildings is classified under the category ‘education’ hospital
buildings under ‘health’ and general government office buildings under ‘ general government
services’. If an office building is constructed for a definite purpose, say for defence
headquarters, University Grants Commission, National Museum, etc. then they are classified
under relevant purpose category and not under general government services. Expenditure on
residential quarters for employees (including their controlling office i.e. Estate Office) is
classified under the category ‘ housing and community amenities’ irrespective of the fact that
whether the accommodations are for school teachers or for hospital doctors. The overhead
expenditure of establishment has been distributed to related purpose categories based on
some norms.
Cooperation in general is classified under the category ‘Other Economic Services’.
But expenditure for cooperative societies serving particular economic activity is classified
under that category. All India Radio is classified as recreational and cultural service.
However, the expenditure relating to the news division of All India Radio has been separated
out and grouped under ‘General government services’.
Expenditures incurred on publicity relates to various purposes like family planning,
improved agricultural products, tourism, etc. Thus, the expenditures are put under various
purpose categories according to the nature of the service. But expenditures incurred in regard
to Press Information Bureau and Directorate of Information and Publicity, which serve all the
departments of the government are classified under ‘ general government services’.
Refugees relief is a typical item and has been grouped under the category relief
operation along with famine relief, flood relief, drought relief etc. Expenditures under this
head are also meant for some specific types of services such as medical, housing, education
etc. Such expenditures are attributed to specific purposes for which they are spent. Those,
which cannot be attributed to specific purposes are classified under relief operation.
⌧⌧⌧

ANNEXURE-A4
BRIEF COVERAGE UNDER VARIOUS PURPOSE CATEGORIES
1. GENERAL PUBLIC SERVICES
General Administration, External Affairs, Public Order and Safety
1.1.1 Public Order & Safety: Organs to maintain internal order viz., expenditure on
Ministry of Home Affairs, Police Department including Traffic Police, Fire
Protection. This includes expenditure on prisons, jails, lockups and other places of
detention and correction/ reformatory schools, Intelligence department, district and
sub-divisional establishments, Judicial system viz.: expenditure on Ministry of Law,
Law Courts, administrative tribunals registration of legal titles of properties. This
includes expenditure on general legal tribunals, transfer payments for legal aid to
households and private non-profit institutions. Operation of regular and auxiliary
police forces, of port, border and Coast guards.
1.1.2 Planning & Statistical Activities: Planning Commission, Central Statistical
Organization, State Statistical Bureaus, etc. including Administration and operation of
overall economic and social planning. But excludes services connected with a
specific function (to be classified according to function).
1.1.3 General Administration, External Affairs, Public Order and Safety n.e.c.:
Organs of government viz., expenditure on President, Governors including their staff,
library research and other facilities, District and Sub-divisional establishments,
Parliament and state Legislature including expenditure for Ministries (pay,
allowances, TA, expenditure on elections).
Offices serving the government as a whole viz., expenditure of Department of
Personnel, Financial affairs and fiscal administration viz; expenditure on Ministry of
Finance i.e., Department of Revenue, Department of Expenditure, cost of collection of
taxes and revenue like Income Tax Department, Customs Departments, Excise
Department, Land Revenue, Department of Land Record Survey and Settlements (but
not consolidation on holdings) expenditures on Audit Department. This also includes
gold control administration, national saving schemes, state lotteries, etc.
This also includes expenditure on operation and maintenance of government
buildings, control of general pool government quarters (but not construction of
quarters), printing and stationery, expenditure pertaining to all departments, purchase
and disposal office serving all the departments (i.e. DGS&D), publicity and
publication departments serving whole of the government (i.e. D.A.V.P., Publication
Departments Division, Press Information Bureau, Audio Visual Scheme in case of
Delhi it is Dte. Of Information and Publcitiy) Central Motor Vehicles pools etc.
Permanent and ad-hoc commissions on behalf of General Administration viz.,
expenditure on Pay Commission, Inter-State water disputes, etc.
Foreign policy viz. expenditure of External Affairs and its offices abroad
including libraries and attached cells/ units located in foreign countries. Aid to
foreign countries and U.N. bodies viz., all expenditure on foreign economic aid and
contribution to international bodies other than military alliances and organizations.

This includes expenditure on broadcasting services and other means of information
directed to foreign countries like overseas communication services, expenditure
on libraries and other cultural activities conducted abroad, all grants and loans in kind
and cash as economic aid to foreign countries including its controlling departments,
expenditure on technical assistance to foreign countries etc.
1.2 General Research
Institutions and organizations engaged in basic and general research and
promotions of such research and in general scientific knowledge and endeavors. This
covers expenditure of the Department of Science and Technology, Department of
Electronics, Institute of Economic Growth, anthropological and botanical and
zoological surveys (but not gardens), archaeological departments, National Archives
(but excluding archaeological gardens), Standing Commission for Scientific and
Technical Terminology, preparation of encyclopedia, grants to American Studies and
Research Centre, India International Centre, Ford and Rockefeller Foundations, etc.
2. CIVIL DEFENCE / DEFENCE
Central administration and research in connection with activities carried on for
defence purposes namely, expenditure on Ministry of Defence, Defence
Science Organization, Defence Production units.
Military viz., all types of expenditures for armed forces, army, navy and air
force, their recruitment equipment moving, feeding, clothing, medical aid, housing
including quarters for their family members, military construction, inspection,
transport and storage, expenditure on military schools and Border Security Force, etc.
Civil Defence viz training of civil defence personnel and expenditure on
Home Guards.
Military aid to other countries i.e., expenditure for providing military aid to
other countries, military alliances, contribution to international military organizations
or groups.
3. EDUCATION AFFAIRS AND SERVICES
Each of the categories (3.1 or 3.2) are sub-divided into the following four
minor groups and they are self explanatory.
3.1 Administration, regulation and research
Administration of Ministries or central departments of education i.e.,
expenditure of the Department of Education, Directorate of Education, etc.
General regulation and promotion of school system, institutions of higher
learning and adult and other educational activities i.e., expenditure on Board of
Higher Secondary Education, University Grants Commission.
Research into objectives, organization, administration and methodology of all
types of education i.e., grants to National Council of Educational Research and

Training, Commission to study educational system, expenditure on production of text
books, collection of educational statistics etc.
3.1.1 Primary Education Affairs
3.1.2 Secondary Education Affairs
3.1.3 Higher Secondary and University Education Affairs
3.1.4 Education Affairs n.e.c.
3.2 Schools, Universities & Institutions including subsidiary services
Educational services i.e., all types of expenditure for primary and secondary
schools, colleges, universities, technical training institutes like medical colleges and
schools (including attached hospitals) nursing colleges/ schools, veterinary
colleges / schools, engineering colleges, art schools / colleges, music colleges and
schools etc. This includes all expenditure on education for backward classes, adult
education, education for displaced persons’, non-custodians type schools for deaf,
dumb and blind. Items of expenditure like introduction of Hindi in Universities,
development of Sanskrit education, Central Institute of Fisheries Education, Marine
Engineering training school etc., are also included. Expenditure on custodian type
schools for deaf, dumb and blind is however, excluded and grouped under welfare
services (class-5). Expenditures for development of any language like development
of Sanskrit, development of Hindi etc. are also excluded and classified as cultural
services (class-7).
Scholarships for education and research i.e. all types of scholarships for study
in schools, colleges, universities or for research in any subject in India or abroad
including payment of maintenance allowances for students doing research or study.
(This does not include maintenance allowance for in service trainees).
Loans or grants for education i.e. grants to Universities, colleges, schools,
educational institutions or to individuals.
Subsidiary educational services i.e. expenditure for mid-day meals for
students, free transport to attend schools, colleges etc. or free supply of test books or
any other facilities to attract attendance in schools.
3.2.1 Primary Education Services
3.2.2 Secondary Education Services
3.2.3 Higher Secondary and University Education Services
3.2.4 Educational Services n.e.c.
4. HEALTH AFFAIRS AND SERVICES
Each of the categories (4.1 or 4.2) are sub-divided into the following five
minor groups and they are self explanatory.
4.1 Administration, Regulation and Research
Administration of Ministries and central departments for health i.e.
expenditure of Department of Health.
Administration of national health schemes i.e., expenditure for medical
insurance schemes.
Expenditure for regulation of hospital, medical and dental clinics, doctors,
dentists, nurses and mid-wives. This includes expenditure of Directorate of Health
Services, expenditure for drug control, Central Drug Control, Central Drug
Laboratory, etc.
Medical, dental and health research i.e. expenditure on and grants to research
institutes like All India Institute of Medical Sciences, National Institute of
Communicable diseases, All India Institute of Physical Medicine and Rehabilitation,
Institute of Public Health etc.
Registration of information on vital events, diseases i.e., expenditure for
registration of births and deaths, expenditure for collection, analysis and research on
vital statistics. This includes a part (vital statistics) of the office of the Registrar
General.
4.1.1 Allopathic
4.1.2 Homeopathic
4.1.3 Ayurvedic
4.1.4 Unani
4.1.5 Other Medical Services
4.2 Hospitals, clinics and other health services
Hospitals and dispensaries, all expenditure on hospitals, dispensaries, health
clinics including insane asylums and care of mentally defective persons. These
include expenditure on drugs supplied, provisions of appliances, cost of construction
and maintenance of hospitals, dispensaries and their development. Expenditure on
CGHS and ESI are also included here. Veterinary hospitals were also covered here
till the base year 2004-05. However, Veterinary Hospitals are now covered within
purpose code 8.2 i.e.
Medical and health schemes i.e., expenditure on drugs and appliances of
National Health Scheme or programme for immunization, vaccination-and other
expenditure for eradication of epidemic diseases like Malaria Central Programming
Filaria Control Programme etc.
Loans and grants for medical or health purposes to private hospitals, clinics,
health centres, other bodies and individual doctors.
4.2.1 Allopathic
4.2.2 Homeopathic
4.2.3 Ayurvedic
4.2.4 Unani
4.2.5 Other Medical Services

5. WELFARE AFFAIRS AND SERVICES
5.1 Social welfare services include
Administration i.e., expenditure of Department of Social Welfare, Department
of Family Planning etc.
Public relief i.e. expenditure on civil supply or rationing systems, subsidies
food scheme etc.
Child welfare services i.e., Expenditure for child and mothers care, maternity
benefits, child welfare clinics Institutions / homes for child and mother like maternity
homes, orphanages etc.
Care of aged, disabled persons i.e., expenditure and grants to institutions for
care of aged and other helpless persons blind, dumb and deaf, women home etc.
Family Welfare Services, i.e., expenditure on family planning family guardians and
widows allowances, applied nutrition programme.
Other welfare services i.e. payment of pensions to freedom fighters, territorial
and political – persons, unspecified and general expenditure on welfare of backward
classes, grants loans etc., to institutions organizations engaged in welfare activities
like Red Cross Society and contributions for unspecified charitable purposes.
5.2 Social Security Affairs and Services
Expenditure on unemployment benefits, old age pensions, accident injury and
sickness compensation and other benefits, to compensate loss in income. This
includes expenditure on personal injuries, compensation insurance schemes, state
insurance schemes, grants to Life Insurance Corporation etc.
6. HOUSING AND COMMUNITY AMENITIES AFFAIRS AND SERVICES
6.1 Housing and community services
Administration, regulation of standards and Promotion of activities and
facilities in respect of housing and community development urban and rural renewals.
This includes expenditure of Ministry of Work and Housing, Deptt. Of Community
Development.
Housing and related slum clearance activities expenditure for Provision,
assistance or support of residential house building activities, cost of acquisition of
land for housing or urban development, loans to individuals or Organization for
construction of residential houses, expenditure of the departments engaged in
mortgage and financing for residential buildings, the liabilities of which are solely to
the government.
Town and country Planning i.e. all types of expenditure for planning and
development of towns, colonies etc. This includes loans / grants to town and country
planning Organization, Delhi Development Authority, Metropolitan Development
Organization, expenditure for development of border areas, expenditure of National
Building Organization etc.
Community facilities i.e., expenditure on community development schemes
(general and unspecific items), national extension schemes, local development works
etc.
6.2 Sanitary affairs services
Urban and rural renewal and municipal amenities i.e. all types of expenditure
for collection and disposal of garbage, refuse, development and maintenance of
sewerage and drainage system, street cleaning smoke regulation etc.
6.3 Housing and Community Amenities affairs and services n.e.c.
Administration, operation or support of activities such as formulation,
administration, coordination and monitoring of overall policies, plans, programmes
and budgets relating to Housing and Community Amenities affairs and services;
preparation and enforcement of legislation and standards relating to Housing and
Community Amenities affairs and services; production and dissemination of general
information, technical documentation and statistics relating to Housing and
Community Amenities affairs and services.
7. CULTURAL, RECREATIONAL AND RELIGIOUS AFFAIRS AND
SERVICES
7.1 Art & Cultural Affairs Services
Administration and Central departments concerning with culture, recreation
and religion i.e., expenditure of Department of Culture, Cultural and literary activities
i.e. expenditure including grants/loans for studies of civilization, language, literature,
libraries etc. This includes loans/ grants for and to central Institute of Indian
Languages, children banks in-regional languages, National Book Fair, expenditure for
prizes for writers for best books, development of Sanskrit Language, development of
Hindi Language and other states languages (under development of Hindi following
are excluded: Commission for Scientific and Technical Terminology, preparation of
Hindi Encyclopedia, translations of manuals and forms in Hindi, correction of Hindi
text Books, opening of Hindi departments in colleges and Universities). Religious
services i.e., grants for religious purpose including repairs and maintenance of ancient
temples, contribution to religious Institutions and for memorial of religious leaders
like Guru Nanak Birth Anniversary, Dussehra Exhibitions.
7.2 Recreational and Sporting Services
Directorate of Physical Education and Sports, Ministry of Information and
Broadcasting, Recreational organs i.e. expenditure on All India Radio (excluding
news division) film production, film censor departments, T.V. Programme, Songs and
Drama Division, organization in film festival, grants/ loans to organization of
Institution engaged in research and production of film, drama like National School of
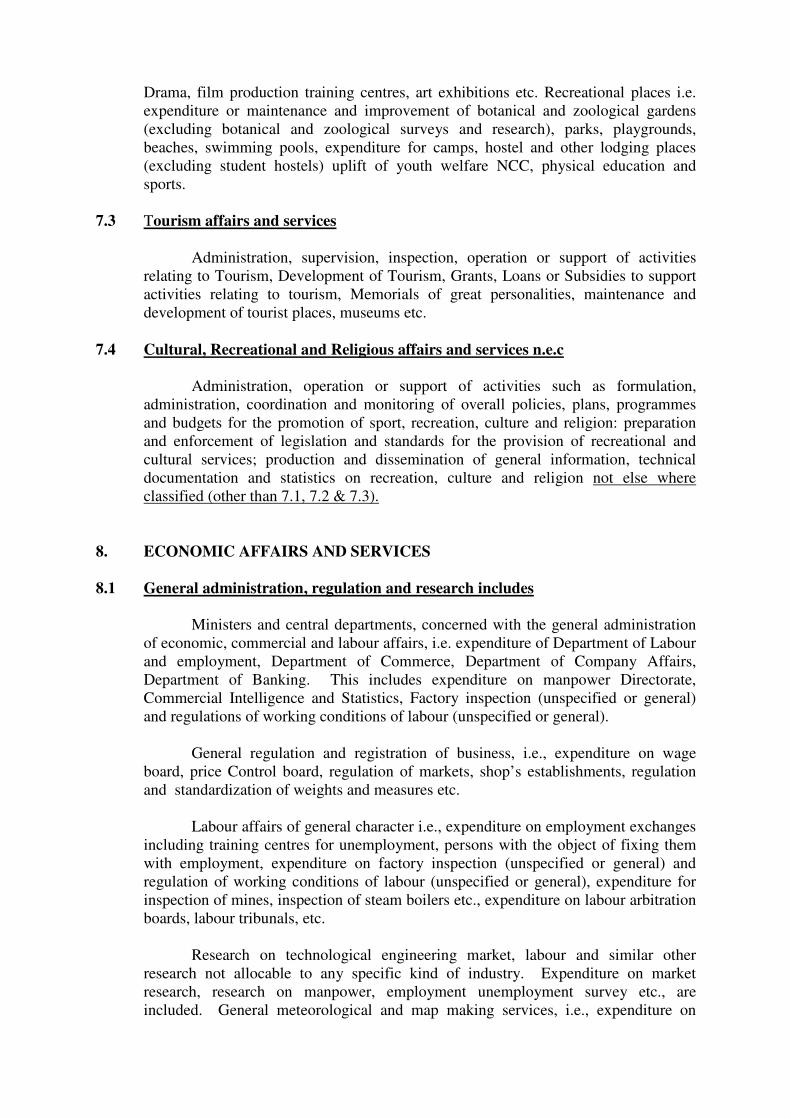
Drama, film production training centres, art exhibitions etc. Recreational places i.e.
expenditure or maintenance and improvement of botanical and zoological gardens
(excluding botanical and zoological surveys and research), parks, playgrounds,
beaches, swimming pools, expenditure for camps, hostel and other lodging places
(excluding student hostels) uplift of youth welfare NCC, physical education and
sports.
7.3 Tourism affairs and services
Administration, supervision, inspection, operation or support of activities
relating to Tourism, Development of Tourism, Grants, Loans or Subsidies to support
activities relating to tourism, Memorials of great personalities, maintenance and
development of tourist places, museums etc.
7.4 Cultural, Recreational and Religious affairs and services n.e.c
Administration, operation or support of activities such as formulation,
administration, coordination and monitoring of overall policies, plans, programmes
and budgets for the promotion of sport, recreation, culture and religion: preparation
and enforcement of legislation and standards for the provision of recreational and
cultural services; production and dissemination of general information, technical
documentation and statistics on recreation, culture and religion not else where
classified (other than 7.1, 7.2 & 7.3).
8. ECONOMIC AFFAIRS AND SERVICES
8.1 General administration, regulation and research includes
Ministers and central departments, concerned with the general administration
of economic, commercial and labour affairs, i.e. expenditure of Department of Labour
and employment, Department of Commerce, Department of Company Affairs,
Department of Banking. This includes expenditure on manpower Directorate,
Commercial Intelligence and Statistics, Factory inspection (unspecified or general)
and regulations of working conditions of labour (unspecified or general).
General regulation and registration of business, i.e., expenditure on wage
board, price Control board, regulation of markets, shop’s establishments, regulation
and standardization of weights and measures etc.
Labour affairs of general character i.e., expenditure on employment exchanges
including training centres for unemployment, persons with the object of fixing them
with employment, expenditure on factory inspection (unspecified or general) and
regulation of working conditions of labour (unspecified or general), expenditure for
inspection of mines, inspection of steam boilers etc., expenditure on labour arbitration
boards, labour tribunals, etc.
Research on technological engineering market, labour and similar other
research not allocable to any specific kind of industry. Expenditure on market
research, research on manpower, employment unemployment survey etc., are
included. General meteorological and map making services, i.e., expenditure on

meteorological departments and centres including weather forecasting, expenditure on
National Atlas and Thematic Mapping Organization, Surveyor India etc.
8.2 Agriculture, forestry, fishing and hunting
Administration, regulation and research i.e., expenditure on Ministry of Food
and Agriculture, I.C.A.R.
Development of Agriculture, i.e., expenditure on Agricultural farms,
implementation of improved method of agricultural practices including its
demonstration, exhibitions, publicity, etc. distribution and control of seeds and
fertilizers, storing facilities for agricultural produce, marketing of agricultural
produce, expenditure on agricultural price support schemes, expenditure on grow
more food scheme. This also includes expenditure on improvement of conditions of
agricultural labourer, development of jute, cotton, tea plantation, sericulture and other
cash crops.
Development and use of soil, i.e., expenditure on soil conservation, irrigation
and drainage of lands, reclamation of wastelands, land settlement, etc. This also
includes consolidation on holding, flood control measures, settlement of land
disputes.
Forest, i.e., expenditure on preservation of wild life, etc., forest fire protection
services and hunting.
Livestock and animal husbandry, i.e., research on animal husbandry,
development of animal husbandry and livestock, expenditure on poultry farms, fodder
development schemes and research on it, expenditure for development of milk
production, wool production, etc. (expenditure on manufacturing, grading and
processing of wool, etc. are excluded).
Fishing, i.e., expenditure for production of fish both inland and coastal,
development of fisheries and research on it, mechanization of fish catching station,
construction and improvement of fish landing station, expenditure for fish nurseries,
fish preservation and cold storage for fish. This also includes improvement of
working conditions of fishermen, contribution to fishermen cooperative societies.
8.3 Mining, Manufacturing and Construction
Administration, regulation and research, i.e. expenditure on Ministry of
Industry, Ministry of steel and Mines, Ministry of Petroleum and Chemicals,
expenditure on geological survey, Commission for Oil & Natural gas, Indian
Standards Institute.
Mining, i.e., expenditure for promotion, investment grants, subsidies and other
assistance for extraction of coal, petroleum, natural gas and other mineral ores,
expenditure for development of mines and working conditions of mines including
labour welfare activities.
Manufacturing, i.e., expenditure for promotion, investment, grants, subsidies,
and other assistance for industrial development including village and small scale

industries. This also includes Khadi Industries and marketing of Khadi and Village
Industrial products.
Building and construction industries, i.e., expenditure for promotion,
development of building materials, etc
8.4 Electricity, gas, steam and Atomic Energy
8.4.1 Electricity, Gas and Steam
Expenditure on promotion, regulation, research, investment grants, subsidies
and other assistance for generation, transmission, and distribution of electric power,
gas, steam, heat etc. This includes loans and advance to bodies like State Electricity
Boards, etc. (Subsidies given for consumption of electric power for the benefit of a
particular industry say Khadi Industry, is excluded from here and taken into account
in that industry).
8.4.2 Atomic Energy
Administration and research, i.e. expenditure of Department of Atomic
Energy. Expenditure on Atomic Energy Commission, Atomic Energy Research and
Nuclear Schemes, Space Research Programmes like Thumba Equatorial Rocket
Launching Stations. Grants and donations to scientific societies and institutes.
8.4.3 Non-conventional Sources of Energy
Administration, supervision, inspection, operation or support of Non-
conventional Sources of Energy viz., solar energy, wind energy etc.,
Grants, loans or subsidies to support the operation, construction, maintenance or
upgrading of such energy systems.
8.5 Drinking Water Supply
Expenditure on promotion, regulation, research investment grants, subsidies
and other assistance for storing, purification and distribution of water, development of
tanks and other water reservoirs in the rural areas, digging of wells in the rural areas
for drinking purposes. (Tube wells and other water resources for irrigation purposes
are excluded).
8.6 Transportation and Communication
8.6.1 Road Transport Highways, roads, bridges and tunnels, i.e.. expenditure for
construction, repairs, maintenance and other outlays for highways, roads, bridges and
tunnels, development and regulation of car part and other type of parking places,
terminal facilities for bus, trucks, etc. (Bridges, tunnels, car parks, highways etc;, for
which tolls are charged excluded).
8.6.2 Water Transport Waterways and other navigation, i.e., expenditure including
assistance, loans, etc. to commercial enterprises for promoting, providing for and
maintaining facilities for inland and coastal waterways, regulation and control of
waterways. This includes expenditure for dredging of canals, rivers, lakes including

construction and operation of light houses, buoys and other navigational aids,
construction, maintenance and operation of docks, harbours and port facilities,
expenditure for protection of sea coast, river coast and canal banks. (Canals, harbors
and ports which are operated by commercial enterprises are excluded).
8.6.3 Air transport and other communications, i.e., expenditure as investment, grant,
subsidies and other assistance for transport, railways, post and telegraphs,
telecommunication services. This includes expenditure on overseas communication
services, rope ways etc.,
8.6.4 Transport & Communication n.e.c.
8.7 Other Economic Services
Storage and warehousing, i.e., expenditure for promotion, regulation, research
and other outlays for storage and warehousing of general character (storage for
specific items are grouped in appropriate category of that item).
Trade activity, i.e. expenditure for promotion, regulation research and other
outlays for trade, promotion activity like Ministry of Foreign Trade, Export
Promotion Directorate, Trade Development Authority, Directorate of Commercial
Publicity, loss on government trading, Trade Commissioner etc.
Cooperative activity, i.e. expenditure for promotion, regulation, research and
other outlays, assistance, loans etc. for cooperative activities of general character.
This includes expenditure of office for registration and control of cooperative
societies, development of cooperative movement in the country. (Cooperative activity
on specific field will be classified in the category according to the field of activity).
9. ENVIRONMENTAL PROTECTION
9.1 Waste Management
Administration, supervision, inspection, operation or support of waste
collection, treatment and disposal systems.
Grants, loans or subsidies to support the operation, construction, maintenance
or upgrading of such systems.
9.2 Waste Water Management
Administration, supervision, inspection, operation or support of sewage
systems and waste water management.
Grants, loans or subsidies to support the operation, construction, maintenance
or upgrading of such systems.
9.3 Prevention and Control of Pollution
Administration, supervision, inspection, operation or support of activities
relating to pollution abatement and control.

Grants, loans or subsidies to support activities relating to pollution abatement
and control.
9.4 Environmental Research & Education
Administration and operation of government agencies engaged in applied
research and experimental development relating to environmental protection.
Grants, loans or subsidies to support applied research and experimental
development relating to environmental protection undertaken by non-government
bodies.
9.5 Environmental Protection n.e.c.
Administration, supervision, inspection, operation or support of activities such
as formulation, administration, coordination and monitoring of overall policies, plans,
programmes and budgets for the promotion of environmental protection, preparation
and enforcement of legislation and standards for the provision of environmental
protection services; production and dissemination of general information, technical
documentation and statistics on environmental protection.
10. OTHER SERVICES
10.1 Relief on calamities
Flood relief, drought relief and relief work on other disasters and calamities.
(Expenditure on specific purpose like education, health, etc., incurred under these
heads are excluded and classified under concerned categories).
Refugee relief and rehabilitation, i.e., expenditure of the Department of
Rehabilitation, feeding and other expenditure on refugees, management of camps,
grants/ loans to refugees for business, etc.
10.2 Other Miscellaneous Services
Other outlays, not elsewhere classified i.e., expenditure for payment of
compensation on zamindari abolition, grants to Bharat Sevak Samaj etc., Also include
are the imputed banking charges at All-India level.
⌧⌧⌧