Embed Size (px)
Citation preview
Proceeding 2nd Sriwijaya Economics, Accounting and Business Conference 2016
ISBN 979-587-627-91 101
ANALYSIS OF THE ACCURACY OF BANKRUPTCY
PREDICTION WITH GROVER ALTMAN Z-SCORE, SPRINGATE,
ZMIJEWSKI, AND OHLSON MODEL ON MANUFACTURING
COMPANIES LISTED IN JAKARTA ISLAMIC INDEX
(Case Study at PT. Indofood CBP Sukses Makmur, Tbk)
Halkadri Fitra1)
1)
1)
Economic Faculty, Universitas Negeri Padang
ABSTRACT
The purpose of this study was to determine the accuracy of the use of
bankruptcy prediction model includes Grover Model, Altman Z-score
model, Springate Model, Zmijewski Model and Ohlson Model in predicting
corporate bankruptcies PT. Indofood CBP Sukses Makmur, Tbk, which is
one of the companies listed in the Jakarta Islamic Index (JII). This type of
research is classified as descriptive quantitative comparative data collection
techniques used are documentation method of secondary data such as the
statement of financial position, income statement, statement of changes in
equity, cash flow statements, notes to the financial statements and the
market value of equity ranging from 2010 to 2015. The results showed that
all models : Grover Model, Altman Z-score Model, Springate Model,
Zmijewski Model and Ohlson Model provides predictive results stating that
PT. Indofood CBP Sukses Makmur, Tbk is not bankrupt. Based on the
research results and condition of the company are still listed in the Indonesia
Stock Exchange and the Jakarta Islamic Index, it can be concluded that the
model used in this study have the accuracy for predicting corporate
bankruptcies.
Keywords: bankruptcy prediction, Grover, Altman Z-Score, Springate, Zmijewski,
Ohlson
BACKGROUND
A healthy company is the hope of all parties so that all efforts should be done
for survival. Instead bankruptcy is a word so feared by the parties related to the
company such as management companies, owners, creditors and government so that
they will make every effort to avoid it. For that attempt to predict the bankruptcy of the
company since its inception has been the fair thing to do.
The financial report is a report describing the financial condition and results of
operations of a company at a certain time or a certain period of time (Harahap; 2009)
became one of the tools that can be used to predict corporate bankruptcy. It is also in
Proceeding 2nd Sriwijaya Economics, Accounting and Business Conference 2016
ISBN 979-587-627-91 102
accordance with the opinion of Fahmi (2013: 2) which states that the financial report is
an information describing the financial condition of a company, and further information
can be used as an overview of the company's financial performance.
The use of financial statements for predicting bankruptcy of companies is
already widely used by experts thus creating various bankruptcy prediction model.
Grover, Altman Z-Score, Springate, Zmijewski and Ohlson Model is an analytical
models bankruptcy frequently used and is known for its accuracy in determining fairly
accurate prediction of bankruptcy and how relatively easy. The fifth model is
operationalized through a comparison of the financial ratios to get the final result of
bankruptcy prediction. All these models have their advantages and disadvantages of
each in the determination of the model. Some research has been done related to the
accuracy of the use of Model Predicts Bankruptcy for such Hastuti (2015), Christianti
(2013), Wulandari, et al (2014), Jayanti and Rustiana (2014), explains that the use of
prediction models of bankruptcy is very important to do
Formulation of Problem
Based on the research background, the formulation of the problem in this
research are:
a. How the accuracy of prediction of bankruptcy PT. Indofood CBP Sukses
Makmur, Tbk based Grover Model?
b. How the accuracy of prediction of bankruptcy PT. Indofood CBP Sukses
Makmur, Tbk based Altman Z-Score Model?
c. How the accuracy of prediction of bankruptcy PT. Indofood CBP Sukses
Makmur, Tbk based Springate Model?
d. How the accuracy of prediction of bankruptcy PT. Indofood CBP Sukses
Makmur, Tbk based Zmijewski Model?
e. How the accuracy of prediction of bankruptcy PT. Indofood CBP Sukses
Makmur, Tbk based Ohlson Model?
Research Purposes
Based on the formulation of the problem, then the purpose of this research are:
a. To determine the accuracy of the predicted bankruptcy of PT. Indofood CBP
Sukses Makmur, Tbk based Grover Model
b. To determine the accuracy of the predicted bankruptcy of PT. Indofood CBP
Sukses Makmur, Tbk based Altman Z-Score Model
c. To determine the accuracy of the predicted bankruptcy of PT. Indofood CBP
Sukses Makmur, Tbk based Springate Model
d. To determine the accuracy of the predicted bankruptcy of PT. Indofood CBP
Sukses Makmur, Tbk based Zmijewski Model
e. To determine the accuracy of the predicted bankruptcy of PT. Indofood CBP
Sukses Makmur, Tbk based Ohlson Model
LITERATURE STUDY
Jakarta Islamic Index (JII)
Jakarta Islamic Index (JII), is one of the existing index in the Indonesia Stock
Exchange (BEI) using 30 issuers included in Shari'ah criteria selected by the Islamic
Shari'a and includes stocks that have large capitalization and high liquidity. The Islamic
Proceeding 2nd Sriwijaya Economics, Accounting and Business Conference 2016
ISBN 979-587-627-91 103
principles of which prohibit a company whose shares are listed for the conduct of
business activity on the basis of gambling, speculation, conducting conventional
banking system, produce or trade food / drinks are forbidden, providing goods / services
that damage morale and health. Criteria shares are included in the category of sharia is :
a. Do not perform business activities which contradict Islamic sharia
b. No trade is not accompanied by the delivery of goods / services and trade with
supply and demand false
c. Do not exceed the following financial ratios
1) Total interest-based debt compared with total equity of not more than
82% (interest-based debt compared with total equity of not more than
45%: 55%)
2) Total interest and other lawful income does not compare to total income
(revenue) not more than 10%
Shares included JII amounted to 30 and will be evaluated every six months
based on financial statements, market capitalization, and Islamic principles held.
Financial Statements
The financial statements portray the financial condition and results of operations
of a company at a certain time or a certain period of time (Harahap, 2009). Also
according Soemarso (2010), states that the financial statements are statements that Sare
designed for decision makers, especially parties outside the company, regarding the
financial position and results of operations of the company. Meanwhile, according to
PSAK No. 1 Paragraph 7 (Revised 2009), defines the financial statements are a
structured representation of the financial position and financial performance of an
entity.
The objective of financial statements is to provide information regarding the
financial position, financial performance and cash flows of an entity that is useful for
the majority of reports among users in making economic decisions. The financial
statements also show the results of management accountability for the use of resources
entrusted to them. According to PSAK No. 1 Paragraph 7 (Revised 2009), "in order to
achieve the objective of financial statements, financial statements provide information
about an entity that includes: assets, liabilities, equity, revenues and expenses, including
gains and losses, contributions from and distributions to owners in it is the owner and
cash flows ". That information, along with other information contained in the notes to
the financial statements, to help users report in predicting future cash flows and in
particular, the timing and certainty of obtaining cash and cash equivalents
Bankruptcy
According Mamduh (2008; 638), the notion of bankruptcy can be seen from
the approach flow and the stock approach. Using a stock, the company can be declared
bankrupt if total liabilities exceed its total assets. While the approach cash flow, the
company would go bankrupt if it can not generate sufficient cash flow. From the point
of view of the stock, the company can be declared bankrupt although it may still
generate sufficient cash flow, or have good prospects in the future.
For companies that go public bankruptcy of the company is very sensitive,
because companies that go public should be ready to implement all the obligations by
the capital markets. Definition of bankruptcy by Yani (2004: 153) is a condition when
the company has insufficient funds to run its business. A company can be said to be
Proceeding 2nd Sriwijaya Economics, Accounting and Business Conference 2016
ISBN 979-587-627-91 104
bankrupt, if you have some indicators as revealed by Surjanto (2003: 184), a mark that
can be seen if a company experienced difficulties in running the business, among others:
a. Sales or revenues have decreased significantly.
b. The decline in earnings and cash flow from operations.
c. The decline in total assets.
d. Stock market prices declined significantly.
e. Fallibility in the industry, or high risk.
f. Young company, the company of his young age generally experience difficulties
in the early years of operation, so that if not supported by strong capital
resources will be able to experience serious financial difficulties and ended with
bankruptcy.
g. Significant cuts in dividends.
In law, the term bankruptcy is identified with insolvent. According to Law No. 4
of 1998, which was renewed by Act No. 37 of 2004 on bankruptcy and suspension of
payment obligation, declared a bankruptcy is a situation where an institution is declared
by a court decision if the debtor has two or more creditors and did not pay at least one
debt that has matured and could be charged.
Delisting According to the Decision of the Board Jakarta Stock Exchange Inc. Number:
Kep-308 / BEJ / 07-2004 concerning Rule Number II concerning the delisting (delisted)
and recording back (relisting) shares in the stock is a delisting is the elimination of the
effects of the list of securities listed on exchange so that these effects can not be traded
on exchanges
Grover Model
Grover Model is a model created by designing and reassessment of the model
of the Altman Z-Score. Jeffrey S. Grover using a sample in accordance with the model
of the Altman Z-score in 1968, adding thirteen new financial ratios. Samples used as
many as 70 companies to 35 companies that went bankrupt and 35 companies that are
not bankrupt in 1982 until 1996. Grover formula is as follows :
Score = 1,650X1 + 3,404X3 – 0,016ROA + 0,057
X1 = Working capital/Total assets
X3 = Earnings before interest and taxes/Total assets
ROA = net income/total assets
Grover Model categorizes companies into insolvency with a score less than or
equal to -0.02 (Z ≤ -0.02). While the value for the companies that fall within the state is not broke is greater than or equal to 0.01 (Z ≥ 0.01).
Altman Z-Score Model Altman Z-Score Model is a multivariate formula used to measure the financial
health of a company. Altman found five types of financial ratios that can be combined
Proceeding 2nd Sriwijaya Economics, Accounting and Business Conference 2016
ISBN 979-587-627-91 105
to see the difference between a company that went bankrupt and were not bankrupt.
Discriminant function discovered by Altman Z are as follows: (Weston & Copeland,
2008: 255):
Z= 1,2X1 + 1,4X2 + 3,3X3 + 0,6X4 + 0,999X5
Z = bankrupcy index
X1 = working capital / total asset
X2 = retained earnings / total asset
X3 = earning before interest and taxes / total asset
X4 = market value of equity / book value of total debt
X5 = sales / total asset
With the following criteria:
a. If the value of Z <1.81, then including a bankrupt company.
b. If the value 1.81 <Z <2.99 can not be determined whether the company is
healthy or bankruptcy).
c. If the value of Z> 2.99 then include companies that are not bankrupt.
Based on the results of research conducted, the Altman Z Score Altman method
of use, it has reached 95% accuracy when using the data one year before financial
distress.
Springate Model Springate has formulated bankruptcy prediction model in 1978. In its
formulation, Springate using the same method with Altman, namely Multiple
Discriminant Analysis (MDA). At first model of the S-Score consists of 19 financial
ratios popular. After going through the same test performed Altman, Springate choose
to use four ratios that can reliably distinguish between companies that went bankrupt
and were not bankrupt. The resulting model is as follows (Hadi 2008 in Bayu, 2014):
S = 1.03A + 3.07B + 0.66C + 0.4D
S= Bankrupcy index
A= Working Capital / Total Asset
B= Earning Before Interest and Tax /Total Asset
C= Earning Before Tax / Current Liabilities
D= Sales / total asset
With the following criteria:
a. if the value of S <0.862, the indication of companies face a serious threat
of bankruptcy (bankruptcy),
b. if the value of S> 0,862 then it shows the company in a sound financial
condition and have no problems with finances (not insolvent).
Research that has been done by this method has been used a sample of companies
Different asset value. Botheras (1979) tested this model on 50 companies whose assets
exceeded an average of US $ 2.5 million and found the accuracy rate of 88%. Sands
(1980) tested this model at 24 companies on average assets of US $ 63.4 million and
found the accuracy rate of 83.3%.
Proceeding 2nd Sriwijaya Economics, Accounting and Business Conference 2016
ISBN 979-587-627-91 106
Zmijewski Model
Zmijewski (1984) using a ratio analysis, measuring the performance leverage,
profitability, and liquidity of an enterprise to model predictions. Zmijewski using
analysis applied to 40 companies that have gone bankrupt and 800 companies that still
survive at that time. The model successfully developed by Zmijewski namely
(Margaretta Fanny and Sylvia Saputra, 2005: 4):
X = -4,3 - 4,5X1 + 5,7X2 – 0,004X3
X = bankrupcy index
X1 = ROA (Return on Asset)
X2 = Leverage (Debt Ratio)
X3 = Likuiditas (Current Ratio)
With the assessment criteria:
a. if the score obtained a company from bankruptcy prediction model exceeds 0, the
company predicted the potential bankruptcy.
b. if a company has a score that is less than 0 then the company predicted no
potential for bankruptcy.
Zmijewski (1984) have measured the accuracy of the model itself, and gain
accuracy value of 94.9%
Ohlson Model
Ohlson using logistic analysis to develop a bankruptcy prediction model with
nine independent variables. The ratio used is the leverage ratio, liquidity, and
profitability based on the sample of 105 companies went bankrupt and in 2058 the
company is not bankrupt (Grice and Dugan, 2003:79). Logit model is a further
development of the linear probability model that explains that the logit model analysis
used to estimate the probability of a phenomenon by reducing the weaknesses found in
the linear probability.
Bankruptcy prediction research conducted by Ohlson (1980: 114) using
multivariate models were built to have 9 variables consist of several financial ratios and
dummy variables. Y-Score equation is formulated as follows (Ohlson, 1980: 117-118):
Y-Score = -1,32 - 0,407X1 + 6,03X2 – 1,43X3 + 0,0757X4 – 2,37X5 – 1,83X6
+0,285X7 – 1,72X8 – 0,521X9
X1 = SIZE (LOG total assets/GNP level index)
X2 = Total liabilities/total assets
X3 = Working capital/total assets
X4 = Current liabilities/current assets
X5 = 1 if total liabilities >total assets; 0 otherwise
X6 = Net income/total assets
X7 = Cash flow from operations/total liabilities
X8 = 1 if net income negatif; 0 otherwise
X9 = (NIt – NIt-1) / (NIt + NIt-1), NIt is net income for this period
Proceeding 2nd Sriwijaya Economics, Accounting and Business Conference 2016
ISBN 979-587-627-91 107
Ohlson (1980) stated that this model has the optimal cutoff point at a value of
0.38. Ohlson chose this cutoff because of these values, the number of errors can be
minimized. The purpose of this cutoff is that companies that have a value of Y-Score
more than 0.38 means the company predicted bankruptcy. Conversely, if the value of
the company Y-Score of less than 0.38, the company predicted without bankruptcy.
Net Working Capital to Total Asset This ratio is the ratio between the net working capital (current assets minus
current liabilities) divided by total assets shows the company's ability to generate net
working capital of the overall total assets. Negative net working capital were likely to
face problems in covering short-term liabilities due to the unavailability of sufficient
liquid assets to cover those obligations conversely, companies with net working capital
is positive rarely face difficulties in meeting their obligations
Retained Earnings to Total Assets This ratio is the ratio between retained earnings to total assets is useful to
measure the cumulative benefit of the lifetime of companies that demonstrate the power
of income. This ratio indicates the company's ability to generate retained earnings of the
total assets of the company. Retained earnings is an undistributed profits to
shareholders. In other words, the retained earnings shows how much revenue a company
that is not paid out as dividends to shareholders
Earning Before Interest and Tax to Total Asset This ratio is the ratio between earnings before interest and taxes (EBIT) to total
assets indicate the company's ability to generate profits from the company's assets,
before interest payments and taxes
Market Value of Equity to Book Value of Debt This ratio is the ratio between the market value of equity and book value of debt
shows the company's ability to meet the obligations of the market value of equity
(common stock). The market value of the equity itself is obtained by multiplying the
number of outstanding common shares at the market price per share of common stock.
The book value of debt is obtained by summing current liabilities with long-term
liabilities
Sales / Total Asset
This ratio is the ratio between the total sales / revenue with total assets indicate
whether the company generates sufficient business volume compared to investment in
total assets. This ratio reflects the overall management efficiency in the use of corporate
assets to generate sales in order to make a profit.
Earning Before Tax / Current Liabilities
This ratio is the ratio between earning before taxes (EBT) by total current
liabilities, which indicates the company's ability to generate profit from short-term debt
prior to the payment of taxes
ROA (Return on Asset)
This ratio is the ratio between net profit and total assets of companies that
demonstrate the company's ability to generate profits with the use of assets
Proceeding 2nd Sriwijaya Economics, Accounting and Business Conference 2016
ISBN 979-587-627-91 108
Debt Ratio
This ratio is the ratio between total debt to total assets owned by the company
and shows the composition of the company's debts. This ratio can also be interpreted
from the total amount of assets owned by the company how much sourced from debt
Current Ratio
This ratio shows the ratio between current assets compared to current liabilities,
and shows the company's ability to cope with short-term debt to total current assets held
Gross Domestic Product
Gross domestic product (GDP) is the market value of all goods and services
produced by a country in a given period. GDP is one method for calculating the national
income. Gross Domestic Product (GDP) is the total production of goods and services
produced by the production units in an area at a particular time. Gross Domestic Product
(GDP) is a gauge of economic growth in which gauges economic growth is GDP, GDP
per capita and income per hour Work. As a gauge of economic growth in GDP has the
formula in finding GDP and GDP also has four components as follows:
a. Household consumption
b. Investation
c. government consumption
d. Net exports, which is the difference of total exports and imports
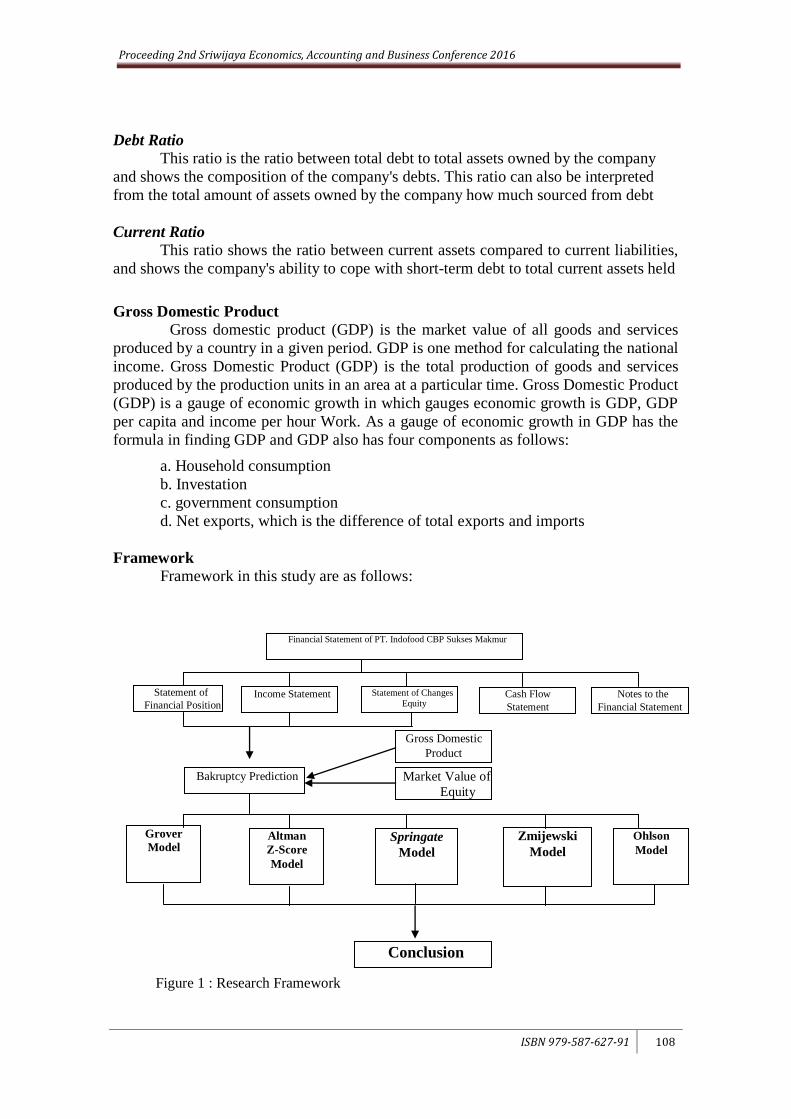
Framework
Framework in this study are as follows:
Financial Statement of PT. Indofood CBP Sukses Makmur
Statement of
Financial Position Income Statement Statement of Changes
Equity Cash Flow
Statement
Notes to the
Financial Statement
Market Value of
Equity
Bakruptcy Prediction
Grover
Model
Springate
Model
Zmijewski
Model
Conclusion
Figure 1 : Research Framework
Gross Domestic
Product
Altman
Z-Score
Model
Ohlson
Model
Proceeding 2nd Sriwijaya Economics, Accounting and Business Conference 2016
ISBN 979-587-627-91 109
RESEARCH METHODS
Research Approach
The research approach used in this study is a comparative research approach that
compares the models Grover, Altman Z-score, Springate, Zmijewski and Ohlson to
predict bankruptcy on PT. Indofood CBP Sukses Makmur, Tbk
Object and Subject Research
Subjects used is PT. Indofood CBP Sukses Makmur, Tbk, which has conducted
an Initial Public Offering (IPO) at the Indonesian Stock Exchange on 07 October 2010.
Type of Data
By way of acquiring it, this study uses secondary data from 2010 to 2015.
Secondary data in this study is the statement of financial position, income statement,
statement of changes in equity / retained earnings / retained earnings, cash flow
statements, notes to the financial statements and the value market capitalization and
Gross Domestic Product (GDP) based on current prices
Data Collection Technique
In this research, data collection techniques used is the method of documentation to
record and explore corporate data with the main source of financial statements (balance
sheet, income statement and statement of changes in equity / retained earnings / retained
earnings, cash flow statements, notes to the financial statements ) in 2010 to 2015 from
the Indonesia Stock Exchange (www.idx.co.id) while the market capitalization value
data sourced from http://www.sahamok.com. Then to the data of Gross Domestic
Product Based on current prices is obtained from the Central Statistics Agency through
its official website http://www.bps.go.id
Data Analysis Technique
Data analysis techniques in this study are:
a. Calculating the value of Model Grover, Altman Z-Score, Springate, Zmijewski
and Ohlson
b. Comparing the model results with actual reality of the condition of the company
RESEARCH RESULT AND DISCUSSION
Research Result
Grover Model
Based Grover Model, then obtained the following results :
Proceeding 2nd Sriwijaya Economics, Accounting and Business Conference 2016
ISBN 979-587-627-91 110
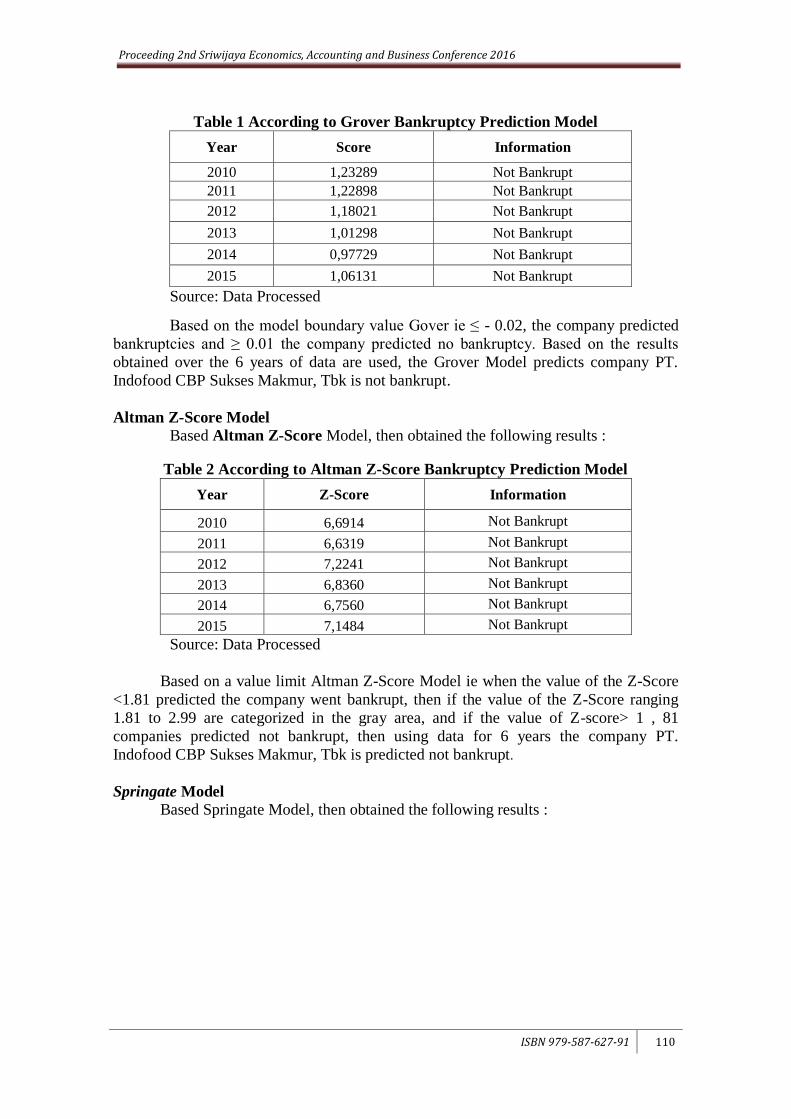
Table 1 According to Grover Bankruptcy Prediction Model
Year Score Information
2010 1,23289 Not Bankrupt
2011 1,22898 Not Bankrupt
2012 1,18021 Not Bankrupt
2013 1,01298 Not Bankrupt
2014 0,97729 Not Bankrupt
2015 1,06131 Not Bankrupt
Source: Data Processed
Based on the model boundary value Gover ie ≤ - 0.02, the company predicted
bankruptcies and ≥ 0.01 the company predicted no bankruptcy. Based on the results
obtained over the 6 years of data are used, the Grover Model predicts company PT.
Indofood CBP Sukses Makmur, Tbk is not bankrupt.
Altman Z-Score Model
Based Altman Z-Score Model, then obtained the following results :
Table 2 According to Altman Z-Score Bankruptcy Prediction Model
Year Z-Score Information
2010 6,6914 Not Bankrupt
2011 6,6319 Not Bankrupt
2012 7,2241 Not Bankrupt
2013 6,8360 Not Bankrupt
2014 6,7560 Not Bankrupt
2015 7,1484 Not Bankrupt
Source: Data Processed
Based on a value limit Altman Z-Score Model ie when the value of the Z-Score
<1.81 predicted the company went bankrupt, then if the value of the Z-Score ranging
1.81 to 2.99 are categorized in the gray area, and if the value of Z-score> 1 , 81
companies predicted not bankrupt, then using data for 6 years the company PT.
Indofood CBP Sukses Makmur, Tbk is predicted not bankrupt.
Springate Model
Based Springate Model, then obtained the following results :
Proceeding 2nd Sriwijaya Economics, Accounting and Business Conference 2016
ISBN 979-587-627-91 111
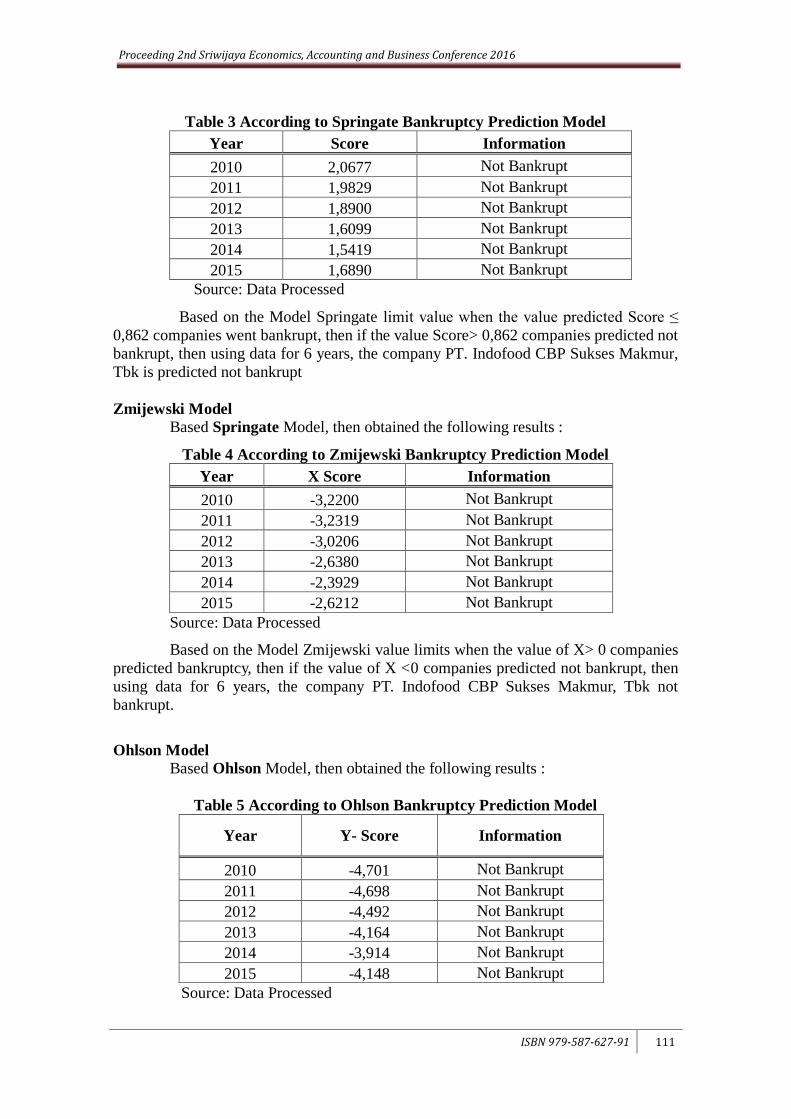
Table 3 According to Springate Bankruptcy Prediction Model
Year Score Information
2010 2,0677 Not Bankrupt
2011 1,9829 Not Bankrupt
2012 1,8900 Not Bankrupt
2013 1,6099 Not Bankrupt
2014 1,5419 Not Bankrupt
2015 1,6890 Not Bankrupt
Source: Data Processed
Based on the Model Springate limit value when the value predicted Score ≤
0,862 companies went bankrupt, then if the value Score> 0,862 companies predicted not
bankrupt, then using data for 6 years, the company PT. Indofood CBP Sukses Makmur,
Tbk is predicted not bankrupt
Zmijewski Model
Based Springate Model, then obtained the following results :
Table 4 According to Zmijewski Bankruptcy Prediction Model
Year X Score Information
2010 -3,2200 Not Bankrupt
2011 -3,2319 Not Bankrupt
2012 -3,0206 Not Bankrupt
2013 -2,6380 Not Bankrupt
2014 -2,3929 Not Bankrupt
2015 -2,6212 Not Bankrupt
Source: Data Processed
Based on the Model Zmijewski value limits when the value of X> 0 companies
predicted bankruptcy, then if the value of X <0 companies predicted not bankrupt, then
using data for 6 years, the company PT. Indofood CBP Sukses Makmur, Tbk not
bankrupt.
Ohlson Model
Based Ohlson Model, then obtained the following results :
Table 5 According to Ohlson Bankruptcy Prediction Model
Year Y- Score Information
2010 -4,701 Not Bankrupt
2011 -4,698 Not Bankrupt
2012 -4,492 Not Bankrupt
2013 -4,164 Not Bankrupt
2014 -3,914 Not Bankrupt
2015 -4,148 Not Bankrupt
Source: Data Processed
Proceeding 2nd Sriwijaya Economics, Accounting and Business Conference 2016
ISBN 979-587-627-91 112
Based on a model Ohlson limit value if the value of the Y-score > 0.38 predicted
the company went bankrupt, then if the value of the Y-score < 0.38 predicted the
company is not bankrupt, then using data for 6 years the company PT. Indofood CBP
Sukses Makmur, Tbk is predicted not bankrupt
Discussion Research
PT. Indofood CBP Sukses Makmur, Tbk listed on the Indonesia Stock Exchange
since 07 October 2010. As in the period June-November 2016 the company's shares are
still listed on the Jakarta Islamic Index (JII), so it is still categorized as shares listed on
the Indonesia Stock Exchange that meet the terms and criteria of the shari'ah.
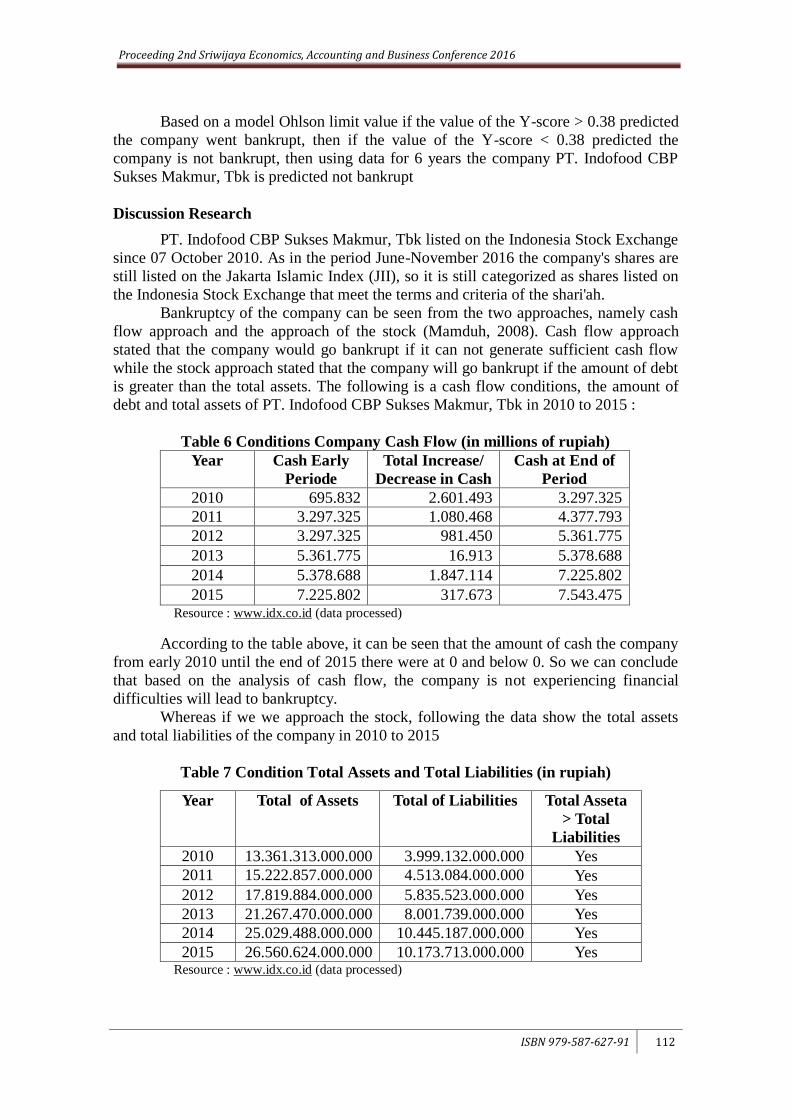
Bankruptcy of the company can be seen from the two approaches, namely cash
flow approach and the approach of the stock (Mamduh, 2008). Cash flow approach
stated that the company would go bankrupt if it can not generate sufficient cash flow
while the stock approach stated that the company will go bankrupt if the amount of debt
is greater than the total assets. The following is a cash flow conditions, the amount of
debt and total assets of PT. Indofood CBP Sukses Makmur, Tbk in 2010 to 2015 :
Table 6 Conditions Company Cash Flow (in millions of rupiah)
Year Cash Early
Periode
Total Increase/
Decrease in Cash
Cash at End of
Period
2010 695.832 2.601.493 3.297.325
2011 3.297.325 1.080.468 4.377.793
2012 3.297.325 981.450 5.361.775
2013 5.361.775 16.913 5.378.688
2014 5.378.688 1.847.114 7.225.802
2015 7.225.802 317.673 7.543.475 Resource : www.idx.co.id (data processed)
According to the table above, it can be seen that the amount of cash the company
from early 2010 until the end of 2015 there were at 0 and below 0. So we can conclude
that based on the analysis of cash flow, the company is not experiencing financial
difficulties will lead to bankruptcy.
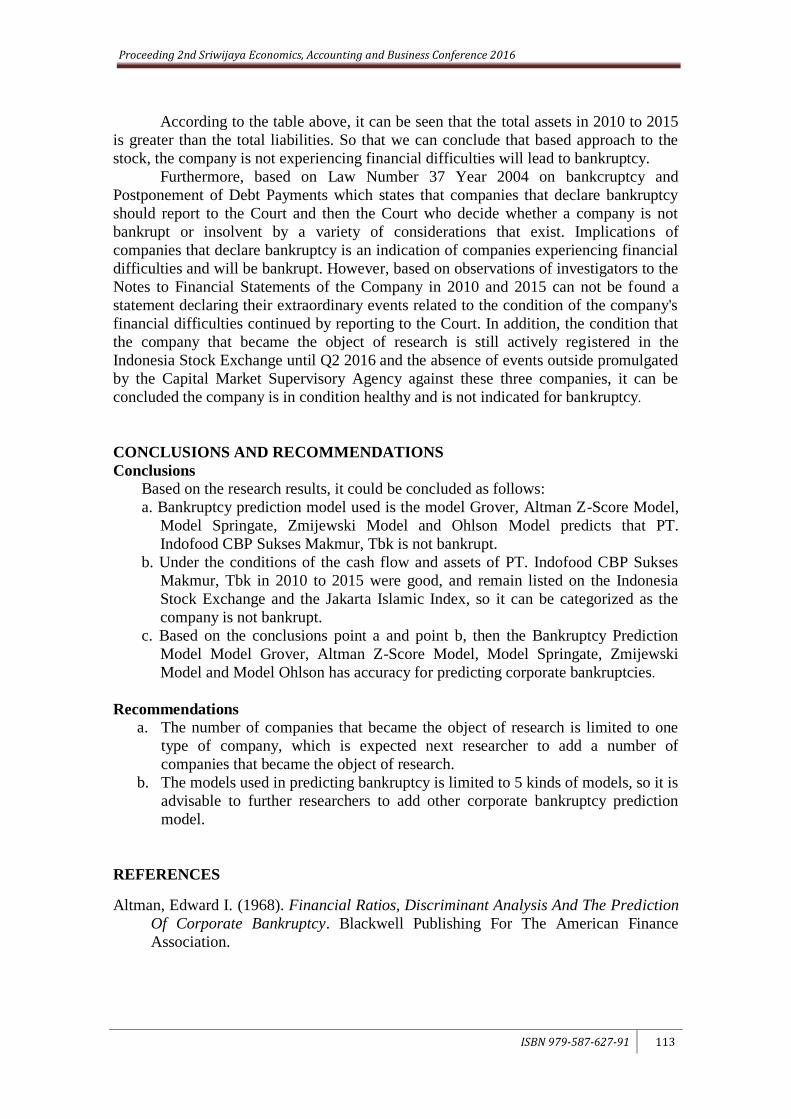
Whereas if we we approach the stock, following the data show the total assets
and total liabilities of the company in 2010 to 2015
Table 7 Condition Total Assets and Total Liabilities (in rupiah)
Year Total of Assets Total of Liabilities Total Asseta
> Total
Liabilities
2010 13.361.313.000.000 3.999.132.000.000 Yes
2011 15.222.857.000.000 4.513.084.000.000 Yes
2012 17.819.884.000.000 5.835.523.000.000 Yes
2013 21.267.470.000.000 8.001.739.000.000 Yes
2014 25.029.488.000.000 10.445.187.000.000 Yes
2015 26.560.624.000.000 10.173.713.000.000 Yes Resource : www.idx.co.id (data processed)
Proceeding 2nd Sriwijaya Economics, Accounting and Business Conference 2016
ISBN 979-587-627-91 113
According to the table above, it can be seen that the total assets in 2010 to 2015
is greater than the total liabilities. So that we can conclude that based approach to the
stock, the company is not experiencing financial difficulties will lead to bankruptcy.
Furthermore, based on Law Number 37 Year 2004 on bankcruptcy and
Postponement of Debt Payments which states that companies that declare bankruptcy
should report to the Court and then the Court who decide whether a company is not
bankrupt or insolvent by a variety of considerations that exist. Implications of
companies that declare bankruptcy is an indication of companies experiencing financial
difficulties and will be bankrupt. However, based on observations of investigators to the
Notes to Financial Statements of the Company in 2010 and 2015 can not be found a
statement declaring their extraordinary events related to the condition of the company's
financial difficulties continued by reporting to the Court. In addition, the condition that
the company that became the object of research is still actively registered in the
Indonesia Stock Exchange until Q2 2016 and the absence of events outside promulgated
by the Capital Market Supervisory Agency against these three companies, it can be
concluded the company is in condition healthy and is not indicated for bankruptcy.
CONCLUSIONS AND RECOMMENDATIONS
Conclusions
Based on the research results, it could be concluded as follows:
a. Bankruptcy prediction model used is the model Grover, Altman Z-Score Model,
Model Springate, Zmijewski Model and Ohlson Model predicts that PT.
Indofood CBP Sukses Makmur, Tbk is not bankrupt.
b. Under the conditions of the cash flow and assets of PT. Indofood CBP Sukses
Makmur, Tbk in 2010 to 2015 were good, and remain listed on the Indonesia
Stock Exchange and the Jakarta Islamic Index, so it can be categorized as the
company is not bankrupt.
c. Based on the conclusions point a and point b, then the Bankruptcy Prediction
Model Model Grover, Altman Z-Score Model, Model Springate, Zmijewski
Model and Model Ohlson has accuracy for predicting corporate bankruptcies.
Recommendations
a. The number of companies that became the object of research is limited to one
type of company, which is expected next researcher to add a number of
companies that became the object of research.
b. The models used in predicting bankruptcy is limited to 5 kinds of models, so it is
advisable to further researchers to add other corporate bankruptcy prediction
model.
REFERENCES
Altman, Edward I. (1968). Financial Ratios, Discriminant Analysis And The Prediction
Of Corporate Bankruptcy. Blackwell Publishing For The American Finance
Association.
Proceeding 2nd Sriwijaya Economics, Accounting and Business Conference 2016
ISBN 979-587-627-91 114
.................... (1983). Corporate Financial Distress: A Complete Guide to Predicting,
Avoiding and Dealing with Bankruptcy (Wiley Finance). JohnWiley & Sons:New
Jersey Canada.
Bayu, Stevanus Aditya. (2014). Perbandingan Model Prediksi Kebangkrutan
Perusahaan Publik (Model Altman, Springate Dan, Ohlson). Tesis, Universitas
Atma Jaya Yogyakarta, Yogyakarta
Christianti, Ari. (2013). Akurasi Prediksi Financial Distress: Perbandingan Model
Altman Dan Ohlson. Jurnal Ekonomi & Bisnis (JEB). STIE YKPN Yogyakarta.
Fahmi, Irham. (2013). Analisis Laporan Keuangan. Bandung: Alfabeta.
Grice, J. Stephen, Jr & Dugan. M.T. (2003). Re-Estimations of The Zmijewski and
Ohlson Bankruptcy Prediction Models. Journal of Advance in Accounting,20: 77-
93
Harahap, Sofyan Syafri. (2009). Analisis Kritis Atas Laporan Keuangan. Jakarta: Raja
Grafindo Persada
Hastuti, Rini Tri. (2015). Analisis Komparasi Model Prediksi Financial Distress
Altman, Springate, Grover Dan Ohlson Pada Perusahaan Manufaktur Yang
Terdaftar Di Bursa Efek Indonesia Periode 2011-2013. Jurnal Ekonomi/Volume
XX, No. 03, November 2015: 446-462.
IDX Yearly, 2010, 2011, 2012, 2013, 2014, 2015
Ikatan Akuntansi Indonesia. (2009). ED PSAK No. 01 (Revisi 2009). Jakarta . Salemba
Empat..
Indonesian Capital Market Directory, 2012, 2013, 2014, 2015
Jayanti, Queenaria dan Rustiana.(2014). Analisis tingkat akurasi Model-model prediksi
kebangkrutan Untuk memprediksi voluntary Auditor Switching. http://e-journal.
uajy. ac. id/ 6178/ 1/jurnal.pdf
Keputusan Direksi PT. Bursa Efek Jakarta Nomor : Kep-308/BEJ/07-2004 tentang
Peraturan Nomor I-I Tentang Penghapusan Pencatatan (Delisting) dan Pencatatan
Kembali (Relisting)
Mamduh, M. Hanafi. 2008. Manajemen Keuangan, Edisi 1, Cetakan
Kedua.Yogyakarta:BPFE
Margaretta, Fanny dan Sylvia Saputra. (2005). Opini Audit Going Concern: Kajian
Berdasarkan Model Prediksi Kebangkrutan, Pertumbuhan Perusahaan, dan
Reputasi Kantor Akuntan Publik (Studi pada Emiten BEJ).
Ohlson, J. (1980). Financial Ratios and The Probabilistic Prediction of Bankruptcy. Journal
of Accounting Research, Vol. 18, No. 1, page 109-131.
Soemarso S.R. (2010). Akuntansi : Suatu Pengantar , Cetakan Keempat, Jakarta :
Salemba Empat
Suharman, H. (2007). Analisis Risiko Keuangan untuk Memprediksi Tingkat Kegagalan
Usaha Bank. Jurnal Imiah ASET, Vol. 9, No. 1 Februari
Proceeding 2nd Sriwijaya Economics, Accounting and Business Conference 2016
ISBN 979-587-627-91 115
Surjanto, R. L. (2003). Financial Performance Analyzing . PT. Gramedia: Jakarta.
Undang-Undang Republik Indonesia Nomor 4 Tahun 1998 Tentang Kepailitan Dan
Penundaan Kewajiban Pembayaran Utang
Undang-Undang Republik Indonesia Nomor 37 Tahun 2004 Tentang Kepailitan Dan
Penundaan Kewajiban Pembayaran Utang
Yani, W. (2004). Seri Hukum Bisnis Kepailitan. Jakarta: PT. Raja Grafindo Persada.
Weston. J. Fred dan Copeland, Thomas E. (2008). Manajemen Keuangan Edisi
Kesembilan, Penerjemah : Jaka Wasana. Jakarta : Bina Rupa Aksara
Wulandari, Veronita et al, (2014), Analysis Of Comparison Financial Distress Prediction
Models Altman, Springate, Ohlson , Fulmer, CA-Score and Zmijewski, (Empiric
Study On Listed Food And Beverages Firms In Indonesia Stock Exchange Period
2010-2012). JOM FEKON Vol. 1 No. 2 Oktober 2014.
www.bps.go.id
www.idx.co.id ( 28 Agustus 2015)
www.sahamok.com (1 September 2015)
Zmijewski, M. E. (1984). Methodological Issues Related to the Estimation of Financial Distress
Prediction Models. Journal of Accounting Research 24 (Supplement): 59 - 82