Embed Size (px)
Citation preview

© Monitoring Analytics 2014 | www.monitoringanalytics.com
Analysis of the
2016/2017 RPM Base Residual Auction
The Independent Market Monitor for PJM
April 18, 2014

© Monitoring Analytics 2014 | www.monitoringanalytics.com 1
Introduction
This report, prepared by the Independent Market Monitor for PJM (IMM or MMU),
reviews the functioning of the tenth Reliability Pricing Model (RPM) Base Residual
Auction (BRA) (for the 2016/2017 Delivery Year) and responds to questions raised by
PJM members and market observers about that auction. The MMU prepares a report for
each RPM Auction.
This report addresses, explains and quantifies the basic market outcomes. This report
also addresses and quantifies the impact on market outcomes of: the Short-Term
Resource Procurement Target; Demand Resources (DR); the definition of Demand
Resource products; Avoidable Project Investment Recovery Rate (APIR) changes related
to environmental regulations; and capacity imports.
Conclusions and Recommendations
The capacity market is, by design, always tight in the sense that total supply is generally
only slightly larger than demand. While the market may be long at times, that is not the
equilibrium state. Capacity in excess of demand is not sold and, if it does not earn or
does not expect to earn adequate revenues in future capacity markets, or in other
markets, or does not have value as a hedge, may be expected to retire. The demand for
capacity includes expected peak load plus a reserve margin, and points on the Variable
Resource Requirement (VRR) curve exceed peak load plus the reserve margin. Thus, the
reliability goal is to have total supply equal to or slightly above the demand for capacity.
The level of purchased demand under RPM has generally exceeded expected peak load
plus the target reserve margin, resulting in reserve margins that exceed the target.
Demand is almost entirely inelastic because the market rules require loads to purchase
their share of the system capacity requirement. The level of elasticity incorporated in the
RPM demand curve, called the Variable Resource Requirement (VRR) curve, is not
adequate to modify this conclusion. The result is that any supplier that owns more
capacity than the typically small difference between total supply and the defined
demand is individually pivotal and therefore has structural market power. Any supplier
that, jointly with two other suppliers, owns more capacity than the difference between
supply and demand either in aggregate or for a local market is jointly pivotal and
therefore has structural market power.
The market design for capacity leads, almost unavoidably, to structural market power in
the capacity market. The capacity market is unlikely ever to approach a competitive
market structure in the absence of a substantial and unlikely structural change that
results in much greater diversity of ownership. Market power is and will remain
endemic to the existing structure of the PJM Capacity Market. Nonetheless a competitive
outcome can be assured by appropriate market power mitigation rules. Detailed market
power mitigation rules are included in the PJM Open Access Transmission Tariff (OATT
or Tariff). This represents a significant advance over the prior capacity market design.

© Monitoring Analytics 2014 | www.monitoringanalytics.com 2
Reliance on the RPM design for competitive outcomes means reliance on the market
power mitigation rules. Attenuation of those rules would mean that market participants
would not be able to rely on the competitiveness of the market outcomes. However, the
market power rules are not perfect and, as a result, competitive outcomes require
continued improvement of the rules and ongoing monitoring of market participant
behavior and market performance.
In the capacity market, as in other markets, market power is the ability of a market
participant to increase the market price above the competitive level or to decrease the
market price below the competitive level. In order to evaluate whether actual prices
reflect the exercise of market power, it is necessary to evaluate whether market offers are
consistent with competitive offers.
The MMU verified the reasonableness of offer data and calculated the derived offer caps
based on submitted data; calculated unit net revenues; reviewed requests for exceptions
to the Minimum Offer Price Rule (MOPR); reviewed offers for Planned Generation
Capacity Resources; verified capacity exports; verified offers based on opportunity costs;
verified the reasons for MW not offered; verified the maximum sell offer Equivalent
Demand Forced Outage Rates (EFORds); verified clearing prices based on the demand
(VRR) curves and the minimum resource requirements; and verified that the market
structure tests were applied correctly.1 All participants in the RTO, MAAC, PSEG, and
ATSI RPM markets failed the three pivotal supplier (TPS) test. The result was that offer
caps were applied to all sell offers for Existing Generation Capacity Resources when the
Capacity Market Seller did not pass the test, the submitted sell offer exceeded the
defined offer cap, and the submitted sell offer, absent mitigation, would have resulted in
a higher market clearing price.2 3 The offer caps are designed to reflect the marginal cost
1 Attachment A reviews why the MMU calculation of clearing prices differs slightly from
PJM’s calculation of clearing prices and includes recommendations for improving the market
clearing algorithm.
2 Prior to November 1, 2009, existing DR and EE resources were subject to market power
mitigation in RPM Auctions. See 129 FERC ¶ 61,081 (2009) at P 30.
3 Effective January 31, 2011, the RPM rules related to market power mitigation were changed,
including revising the definition for Planned Generation Capacity Resource and creating a
new definition for Existing Generation Capacity Resource for purposes of the must-offer
requirement and market power mitigation, and treating a proposed increase in the capability
of a Generation Capacity Resource the same in terms of mitigation as a Planned Generation
Capacity Resource. See 134 FERC ¶ 61,065 (2011).

© Monitoring Analytics 2014 | www.monitoringanalytics.com 3
of capacity. Based on the data and this review, the MMU concludes that the results of
the 2016/2017 RPM Base Residual Auction were competitive.
Nonetheless, there are significant issues with the RPM market design which have
significant consequences for market outcomes.
In particular, the MMU recommends that the use of the 2.5 percent demand adjustment
(Short-Term Resource Procurement Target) be terminated immediately. The MMU
recommends the enforcement of a consistent definition of capacity resource. The MMU
recommends that the requirement to be a physical resource be enforced and enhanced.
The requirement to be a physical resource should apply at the time of auctions and
should also constitute a commitment to be physical in the relevant delivery year. The
requirement to be a physical resource should be applied to all resource types, including
planned generation, demand resources and imports.4 5 The MMU recommends that the
definition of demand side resources be modified in order to ensure that such resources
are full substitutes for and provide the same value in the Capacity Market as generation
resources. Both the Limited and the Extended Summer DR products should be
eliminated and the restrictions on the availability of Annual DR should be eliminated in
order to ensure that the DR product has the same unlimited obligation to provide
capacity year round as Generation Capacity Resources. The MMU recommends that the
net revenue calculation used by PJM to calculate the net CONE VRR parameter reflect
the actual flexibility of units in responding to price signals rather than using assumed
fixed operating blocks that are not a result of actual unit limitations.6 7 The result of
reflecting the actual flexibility is higher net revenues, which affect the parameters of the
RPM demand curve and market outcomes. The MMU recommends that the rule
requiring that relatively small proposed increases in the capability of a Generation
Capacity Resource be treated as planned for purposes of mitigation and exempted from
offer capping be removed. The MMU recommends that, as part of the MOPR unit
specific standard of review, all projects be required to use the same basic modeling
4 See Comments of the Independent Market Monitor for PJM. Docket No. ER14-503-000.
(December 20, 2013).
5 See “Analysis of Replacement Capacity for RPM Commitments: June 1, 2007 to June 1, 2013,”
<http://www.monitoringanalytics.com/reports/Reports/2013/IMM_Report_on_Capacity_Repl
acement_Activity_2_20130913.pdf> (September 13, 2013).
6 See PJM Interconnection, L.L.C., Docket No. ER12-513 (December 1, 2011) (“Triennial
Review”).
7 See the 2012 State of the Market Report for PJM, Volume II, Section 6, Net Revenue.

© Monitoring Analytics 2014 | www.monitoringanalytics.com 4
assumptions. That is the only way to ensure that projects compete on the basis of actual
costs rather than on the basis of modeling assumptions.8
The MMU recommends two changes to the RPM solution methodology related to make-
whole payments and the iterative reconfiguration of the VRR curve.9 The MMU
recommends changing the RPM solution methodology to explicitly incorporate the cost
of make-whole payments in the objective function. The MMU also recommends
changing the RPM solution methodology to define variables for the nesting relationships
in the BRA optimization model directly rather than employing the current iterative
approach, in order to improve the efficiency and stability.
Results
The shape of the demand curve, the VRR curve, had a significant impact on the outcome
of the auction. As a result of the downward sloping VRR demand curve, more capacity
cleared in the market than would have cleared with a vertical demand curve equal to the
reliability requirement. As shown in Table 6, the 159,159.7 MW of cleared resources for
the entire RTO, which represented a reserve margin of 21.5 percent not considering
Fixed Resource Requirement (FRR) load, resulted in net excess of 7,185.4 MW over the
reliability requirement of 166,127.5 MW.
The Short-Term Resource Procurement Target had a significant impact on the auction
results. The removal of 2.5 percent of demand significantly reduced the clearing prices
and quantities for all the RPM LDA markets. The clearing quantities of Annual
Resources, including generation and DR, were reduced as a result of the 2.5 percent
demand reduction. Based on actual auction clearing prices and quantities and make-
8 See 143 FERC ¶ 61,090 (2013) (“We encourage PJM and its stakeholders to consider, for
example, whether the unit-specific review process would be more effective if PJM requires
the use of common modeling assumptions for establishing unit-specific offer floors while, at
the same time, allowing sellers to provide support for objective, individual cost advantages.
Moreover, we encourage PJM and its stakeholders to consider these modifications to the unit-
specific review process together with possible enhancements to the calculation of Net
CONE.”); see also, Comments of the Independent Market Monitor for PJM, Docket No. ER13-
535-001 (March 25, 2013); Complaint of the Independent Market Monitor for PJM v.
Unnamed Participant, Docket No. EL12-63-000 (May 1, 2012); Motion for Clarification of the
Independent Market Monitor for PJM, Docket No. ER11-2875-000, et al. (February 17, 2012);
Protest of the Independent Market Monitor for PJM, Docket No. ER11-2875-002 (June 2, 2011);
Comments of the Independent Market Monitor for PJM, Docket Nos. EL11-20 and ER11-2875
(March 4, 2011).
9 For more details on these recommendations, see Attachment A.

© Monitoring Analytics 2014 | www.monitoringanalytics.com 5
whole MW, total RPM market revenues for the 2016/2017 RPM Base Residual Auction
were $5,513,237,849. If the VRR curves had not been reduced by the Short-Term
Resource Procurement Target, total RPM market revenues for the 2016/2017 RPM Base
Residual Auction would have been $6,894,277,704, an increase of $1,381,039,855, or 25
percent, compared to the actual results. The use of the Short-Term Resource
Procurement Target resulted in a 20 percent reduction in RPM revenues for the
2016/2017 Base Residual Auction.
The inclusion of inferior demand side products in the auction also had a significant
impact on the auction results. Based on actual auction clearing prices and quantities,
total RPM market revenues for the 2016/2017 RPM Base Residual Auction were
$5,513,237,849. If only generation and Annual DR were offered in the 2016/2017 RPM
Base Residual Auction, total RPM market revenues for the 2016/2017 RPM Base Residual
Auction would have been $10,141,586,456, an increase of $4,628,348,607, or 84 percent,
compared to the actual results. The inclusion of the Limited and Extended Summer DR
products resulted in a 46 percent reduction in RPM revenues for the 2016/2017 Base
Residual Auction.
The combination of the Short-Term Resource Procurement Target and inferior demand
side products had a significant impact on the auction results. Based on actual auction
clearing prices and quantities and make-whole MW, total RPM market revenues for the
2016/2017 RPM Base Residual Auction were $5,513,237,849. If the VRR curves had not
been reduced by the Short-Term Resource Procurement Target and only generation and
Annual DR were offered in the 2016/2017 RPM Base Residual Auction, total RPM market
revenues for the 2016/2017 RPM Base Residual Auction would have been
$15,834,365,769, an increase of $10,321,127,920, or 187 percent, compared to the actual
results. The use of the Short-Term Resource Procurement Target together with the
inclusion of the Limited and Extended Summer DR products resulted in a 65 percent
reduction in RPM revenues for the 2016/2017 RPM Base Residual Auction.
The inclusion of sell offers for Demand Resources had a significant impact on the
auction results. Based on actual auction clearing prices and quantities and make-whole
MW, total RPM market revenues for the 2016/2017 RPM Base Residual Auction were
$5,513,237,849. If there were no offers for DR in the 2016/2017 RPM Base Residual
Auction, total RPM market revenues for the 2016/2017 RPM Base Residual Auction
would have been $15,630,600,107, an increase of $10,117,362,259, or 184 percent,
compared to the actual results. The inclusion of Demand Resources resulted in a 65
percent reduction in RPM revenues for the 2016/2017 RPM Base Residual Auction.
The inclusion of sell offers for Annual DR alone had a significant impact on the auction
results. Based on actual auction clearing prices and quantities and make-whole MW,
total RPM market revenues for the 2016/2017 RPM Base Residual Auction were
$5,513,237,849. If only generation and Annual DR were offered in the 2016/2017 RPM

© Monitoring Analytics 2014 | www.monitoringanalytics.com 6
Base Residual Auction, total RPM market revenues for the 2016/2017 RPM Base Residual
Auction would have been $10,141,586,456. If there were no offers for DR in the 2016/2017
RPM Base Residual Auction, total RPM market revenues for the 2016/2017 RPM Base
Residual Auction would have been $15,630,600,107, an increase of $5,489,013,652, or 54
percent, compared to the results with only Annual DR. The inclusion of sell offers for
Annual DR alone resulted in a 35 percent reduction in RPM revenues for the 2016/2017
RPM Base Residual Auction compared to the revenues without any DR products.
This is the best measure of the competitive impact of DR on the RPM market. The
Annual DR product definition is the only one consistent with being a capacity resource.
Assuming that the DR meets appropriate measurement and verification standards and
that the DR was offered with the intention of providing physical resources, competition
from the Annual DR product resulted in a 35 percent reduction of payments for
capacity. This demonstrates that Annual DR had a significant impact on market
outcomes and resulted in the displacement of generation resources. Thus, even when the
DR product is limited to the Annual DR product, DR has a significant and appropriate
competitive impact on capacity market outcomes. As in prior BRAs, Extended Summer
and Limited DR products also had a significant impact in the 2015/2016 BRA, but those
impacts resulted from badly defined and inferior products.
The level of DR products that buy out of their positions after the BRA however suggests
that the impact of DR on generation investment incentives needs to be carefully
considered and the rules governing the requirement to be a physical resource are
enforced.10 If DR displaces new generation resources in BRAs, but then buys out of the
position prior to the delivery year, this means potentially replacing new entry
generation resources at the high end of the supply curve with other capacity resources
available in incremental auctions. This would suppress the price of capacity in the BRA
compared to competitive result because it permits the shifting of demand from the BRA
to the incremental auctions, which is inconsistent with the must offer, must buy rules
governing the BRA.
The inclusion of investments based on environmental regulation compliance, including
the EPA’s Mercury and Air Toxics Standards (MATS) rules and the National Emissions
Standards for Hazardous Air Pollutants (NESHAP) for stationary reciprocating internal
combustion engines (RICE) rules and the NJ High Electric Demand Day (HEDD) Rule,
had a significant impact on the auction results. Of the 13,081.7 MW of uncleared offers
10 See “Analysis of Replacement Capacity for RPM Commitments: June 1, 2007 to June 1, 2013”
<http://www.monitoringanalytics.com/reports/Reports/2013/IMM_Report_on_Capacity_Repl
acement_Activity_2_20130913.pdf> (September 13, 2013).

© Monitoring Analytics 2014 | www.monitoringanalytics.com 7
for generation resources, 5,333.8 MW were offers for resources including costs associated
with environmental regulation compliance that were not previously included in APIR.
Based on actual auction clearing prices and quantities and make-whole MW, total RPM
market revenues for the 2016/2017 RPM Base Residual Auction were $5,513,237,849. If
the APIR associated with the pending environmental regulations which had not been
previously submitted were removed, total RPM market revenues for the 2016/2017 RPM
Base Residual Auction would have been $5,310,133,190, a reduction of $203,104,659, or
3.7 percent, compared to the total based on actual results. The impact of including
environmental compliance costs in APIR was to increase total market revenues by
$203,104,659, or 3.8 percent.
The inclusion of capacity imports in the 2016/2017 had a significant impact on the
auction results. Based on actual auction clearing prices and quantities and make-whole
MW, total RPM market revenues for the 2016/2017 RPM Base Residual Auction were
$5,513,237,849. If offers for external generation were reduced by 25 percent, total RPM
market revenues for the 2016/2017 RPM Base Residual Auction would have been
$6,150,779,857, an increase of $637,542,008, or 12 percent, compared to the actual results.
The impact of including 75 percent of the offers for external generation resources was to
decrease total market revenues by $637,542,008, or 10 percent. If offers for external
generation were reduced by 75 percent, total RPM market revenues for the 2016/2017
RPM Base Residual Auction would have been $7,814,811,849, an increase of
$2,301,574,000, or 42 percent, compared to the actual results. The impact of including 25
percent of the offers for external generation resources was to decrease total market
revenues by $2,301,574,000, or 29 percent.
If offers for external generation resources without firm transmission were excluded, total
RPM market revenues for the 2016/2017 RPM Base Residual Auction would have been
$6,810,335,209, an increase of $1,297,097,360, or 24 percent, compared to the actual
results. The impact of including external generation resources with only firm
transmission was to decrease total market revenues by $1,297,097,360, or 19 percent. The
impact of increased imports is comparatively high in the RTO because all imports are
considered to be imports to the RTO. If offers for external generation resources without
firm transmission were excluded, the RTO clearing price for Limited Resources would
have increased to $90.00 per MW-day, and the clearing quantity would have increased
to 10,186.8 MW. The RTO clearing price for Extended Summer and Annual Resources
would have increased to $95.00 per MW-day, and the clearing quantity would have
increased to 158,512.2 MW.
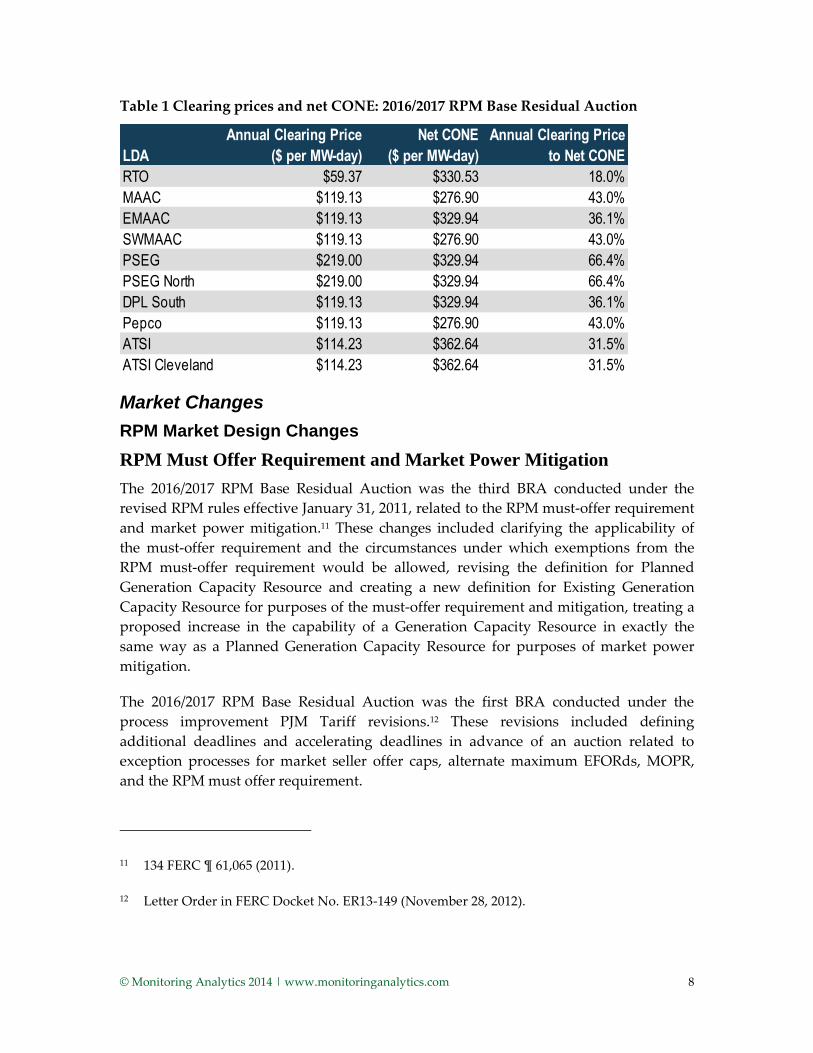
Clearing Prices
Table 1 shows the clearing prices for Annual Resources in the 2016/2017 BRA by LDA
compared to the corresponding net Cost of New Entry (CONE) values. The clearing
prices for Annual Resources were less than net CONE for every Locational
Deliverability Area (LDA).
© Monitoring Analytics 2014 | www.monitoringanalytics.com 8
Table 1 Clearing prices and net CONE: 2016/2017 RPM Base Residual Auction
Market Changes
RPM Market Design Changes
RPM Must Offer Requirement and Market Power Mitigation
The 2016/2017 RPM Base Residual Auction was the third BRA conducted under the
revised RPM rules effective January 31, 2011, related to the RPM must-offer requirement
and market power mitigation.11 These changes included clarifying the applicability of
the must-offer requirement and the circumstances under which exemptions from the
RPM must-offer requirement would be allowed, revising the definition for Planned
Generation Capacity Resource and creating a new definition for Existing Generation
Capacity Resource for purposes of the must-offer requirement and mitigation, treating a
proposed increase in the capability of a Generation Capacity Resource in exactly the
same way as a Planned Generation Capacity Resource for purposes of market power
mitigation.
The 2016/2017 RPM Base Residual Auction was the first BRA conducted under the
process improvement PJM Tariff revisions.12 These revisions included defining
additional deadlines and accelerating deadlines in advance of an auction related to
exception processes for market seller offer caps, alternate maximum EFORds, MOPR,
and the RPM must offer requirement.
11 134 FERC ¶ 61,065 (2011).
12 Letter Order in FERC Docket No. ER13-149 (November 28, 2012).
LDA
Annual Clearing Price
($ per MW-day)
Net CONE
($ per MW-day)
Annual Clearing Price
to Net CONE
RTO $59.37 $330.53 18.0%
MAAC $119.13 $276.90 43.0%
EMAAC $119.13 $329.94 36.1%
SWMAAC $119.13 $276.90 43.0%
PSEG $219.00 $329.94 66.4%
PSEG North $219.00 $329.94 66.4%
DPL South $119.13 $329.94 36.1%
Pepco $119.13 $276.90 43.0%
ATSI $114.23 $362.64 31.5%
ATSI Cleveland $114.23 $362.64 31.5%

© Monitoring Analytics 2014 | www.monitoringanalytics.com 9
MOPR
There have been two changes to the RPM Minimum Offer Price Rule (MOPR) effective
for recent auctions.
Effective April 12, 2011, the RPM Minimum Offer Price Rule (MOPR) was changed.13
The changes to the MOPR included updating the calculation of the net Cost of New
Entry (CONE) for combined cycle (CC) and combustion turbine (CT) plants, increasing
the percentage value used in the screen to 90 percent for CC and CT plants, eliminating
the net-short requirement as a prerequisite for applying the MOPR, eliminating the
impact screen, revising the process for reviewing proposed exceptions to the defined
minimum sell offer price, and clarifying which resources are subject to the MOPR along
with the duration of mitigation.
The 2015/2016 RPM Base Residual Auction was the second BRA conducted under the
revised MOPR and the first conducted under the subsequent FERC orders related to the
MOPR, including clarification on the duration of mitigation, which resources are subject
to MOPR, and the MOPR review process.14
Effective May 3, 2013, the RPM Minimum Offer Price Rule (MOPR) was changed again.15
The changes to the MOPR included establishing Competitive Entry and Self Supply
Exemptions while also retaining the unit specific exemption process for those that do not
qualify for the Competitive Entry or Self Supply Exemptions; changing the applicability
of MOPR to include only combustion turbine, combined cycle, integrated gasification
combined cycle (IGCC) technologies while excluding units primarily fueled with landfill
gas or cogeneration units which are certified or self-certified as Qualifying Facilities
(QFs); changing the applicability to increases in installed capacity of 20.0 MW or more
combined for all units at a single point of interconnection to the Transmission System;
changing the applicability to include the full capability of repowering of plants based on
combustion turbine, combined cycle, IGCC technology; increasing the screen from 90
percent to 100 percent of the applicable net CONE values; and broadening the region
subject to MOPR to the entire RTO from constrained LDAs only.
13 135 FERC ¶ 61,022 (2011).
14 135 FERC ¶ 61,022 (2011), order on reh’g, 137 FERC ¶ 61,145 (2011), order on compliance, 139
FERC ¶ 61,011, order on compliance, 140 FERC ¶ 61,123.
15 143 FERC ¶ 61,090 (2013).

© Monitoring Analytics 2014 | www.monitoringanalytics.com 10
ACR
The default Avoidable Cost Rate (ACR) escalation method which had been
recommended by the MMU was approved and became effective on February 5, 2013, for
the 2016/2017 and subsequent Delivery Years.16 17 18 The default ACRs for the 2016/2017
Delivery Year were 9.5 percent lower than the values would have been if the calculation
method had remained the same.
The FERC Order also approved updates to the base default ACR values and
consolidation of the ACR technology classifications, which become effective for the
2017/2018 and subsequent Delivery Years. The default ACR values for the 2016/2017
Delivery Year were calculated by applying the applicable annual rate of change in the
Handy-Whitman Index value to update the base values through 2012/2013 for which
data were available and applying the most recent ten year annual average rate of change
in the Handy-Whitman Index to recalculate the default ACR values for 2013/2014
through 2015/2016 prior to estimating the default ACR values for the 2016/2017 Delivery
Year.
Gross CONE
Effective January 20, 2013, the gross CONE values for the 2015/2016 Delivery Year were
updated as part of a Settlement Agreement.19 Between triennial review periods, the gross
CONE values for delivery years subsequent to 2015/2016 are determined by escalating
the base values using the most recent twelve month change in the Handy-Whitman
Index.
Demand Resource Rules
Effective January 31, 2013, a third test for determining the Limited DR Reliability Target
was implemented to ensure that the probability of requiring an interruption of longer
16 For more details on the default ACR calculation issue, see “Analysis of the 2013/2014 RPM
Base Residual Auction Revised and Updated,” pp. 6-9
<http://www.monitoringanalytics.com/reports/Reports/2010/Analysis_of_2013_2014_RPM_B
ase_Residual_Auction_20090920.pdf> (September 20, 2010).
17 PJM Interconnection, L.L.C., Docket No. ER13-529 (December 7, 2012) at 19.
18 142 FERC ¶ 61,092 (2013).
19 142 FERC ¶ 61,079 (2013).

© Monitoring Analytics 2014 | www.monitoringanalytics.com 11
than six hours, which is the maximum duration of an interruption for a Limited DR
product, is minimal.20
Effective with the 2014/2015 Delivery Year, the RPM market design incorporated Annual
and Extended Summer DR product types, in addition to the previously established
Limited DR product type.21 Each DR product type is subject to a defined period of
availability, a maximum number of interruptions, and a maximum duration of
interruptions. The RPM rule changes related to DR product types also include the
establishment of a maximum level of Limited DR and a maximum level of Extended
Summer DR cleared in the auction, which are defined as a Minimum Annual Resource
Requirement and a Minimum Extended Summer Resource Requirement for the PJM
region as a whole and LDAs for which a separate VRR curve is established.22 Annual
Resources include generation resources, Annual DR, and EE.
The Minimum Resource Requirements are targets established by PJM to ensure that a
sufficient amount of Annual Resources are procured in order to address reliability
concerns with the Extended Summer and Limited DR products and to ensure that a
sufficient amount of Annual Resources and Extended Summer Resources are procured
in order to address reliability concerns with the Limited DR product. The reliability risk
associated with relying on either the Extended Summer or Limited DR products results
from the fact that reliability must be maintained in all 8,760 hours per year while these
resources are required to respond for only a limited number of hours when needed for
reliability. The Minimum Annual Resource Requirement is the minimum amount of
capacity that PJM will seek to procure from Annual Resources in order to maintain
reliability based on a PJM analysis of the probability of needing Limited DR resources.23
The Minimum Extended Summer Resource Requirement is the minimum amount of
capacity that PJM will seek to procure from Annual Resources and Extended Summer
DR. In other words, there is a maximum level of Limited DR and a maximum level of
Extended Summer DR that PJM will purchase to meet reliability requirements, because
additional purchases of these products is not consistent with reliability based on a PJM
analysis of the probability of needing Limited DR resources when they are not available.
20 143 FERC ¶ 61,076 (2013).
21 134 FERC ¶ 61,066 (2011).
22 The LDAs for which Minimum Resource Requirements are established was subsequently
revised. See 135 FERC ¶ 61,102 (2011).
23 See PJM filing initiating FERC Docket No. ER13-486-000 (November 30, 2012).

© Monitoring Analytics 2014 | www.monitoringanalytics.com 12
The maximum level of Limited and Extended Summer DR is the difference between the
minimum level of Annual Resources and the VRR curve.
As part of the definition of the new DR products effective with the 2014/2015 Delivery
Year, coupled DR sell offers were defined. Coupled DR sell offers are linked sell offers
for a Demand Resource that is able to provide more than one of the three DR product
types. For example, a DR offer based on a single facility could be offered as Annual,
Extended Summer and Limited simultaneously in a coupled offer. Only Demand
Resources of different product types may be coupled, and the Capacity Market Seller
must specify a sell offer price of at least $0.01 per MW-day more for the less limited DR
product type within a coupled segment group.
PJM’s auction clearing mechanism will result in a higher price for Annual Resources if
the MW of Annual Resources that would otherwise clear the auction, including all
resources, are less than the Minimum Annual Resource Requirement that PJM requires
for reliability. In that case the auction clearing mechanism will select Annual Resources
that are more expensive than the clearing price that would otherwise result in order to
procure the defined Minimum Annual Resource Requirement. PJM’s auction clearing
mechanism will also result in a higher price for Extended Summer Resources if the MW
of Extended Summer Resources that would otherwise clear the auction are less than the
Minimum Extended Summer Resource Requirement that PJM requires for reliability. In
that case the auction clearing mechanism will select Extended Summer Resources that
are more expensive than the clearing price that would otherwise result in order to
procure the defined Minimum Extended Summer Resource Requirement.
This result is also described as procuring the Annual or Extended Summer Resources
out of merit order because the minimum resource requirements are binding constraints.
In cases where one or both of the minimum resource requirements bind, resources
selected to meet the minimum requirements will receive a price adder to the system
marginal price, in addition to any locational price adders needed to resolve locational
constraints.
Capacity Market Sellers must establish credit if offering any Planned Capacity Resource,
Qualified Transmission Upgrade, or an external resource without firm transmission in
an RPM Auction. Effective with the 2014/2015 Delivery Year, the RPM market design
also included the implementation of credit limited offers, which allow a Capacity
Market Seller to specify a Maximum Post-Auction Credit Exposure (MPCE) in dollars
for a planned resource using a non-coupled offer type.24 25 Capacity Market Sellers
24 Letter Order issued in Docket No. ER11-2913-000 (April 13, 2011).

© Monitoring Analytics 2014 | www.monitoringanalytics.com 13
utilizing coupled sell offers cannot use the MPCE option. The intent of credit limited
offers is to allow Capacity Market Sellers to better manage their credit requirement by
specifying the maximum amount of credit they are willing to incur and to provide the
service of determining the maximum cleared MW given the MPCE limit. For DR, 20
percent of MW offered used MPCE while for Energy Efficiency (EE) resources, eight
percent of MW offered used MPCE.
Under the new rule incorporating the ability to set an MPCE, the RPM market clearing
process must yield a solution where no resource’s Post-Auction Credit Exposure (PCE)
exceeds its MPCE for credit limited offers. The Post-Auction Credit Rate is a function of
the resource clearing price. As a result, the RPM Auction must be solved iteratively until
no MPCE violations exist.
Effective with the 2012/2013 Delivery Year, the RPM credit rate prior to the posting of
the BRA results is equal to the greater of $20 per MW-day or 30 percent of the LDA net
Cost of New Entry times the number of days in the delivery year, and the RPM credit
rate after posting the BRA results is the greater of $20 per MW-day or 20 percent of the
LDA resource clearing price for the relevant product type times the number of days in
the delivery year.26 The MPCE option permits participants to offer capacity when they
could not otherwise offer capacity based on an uncertain RPM credit rate that could vary
with clearing prices.
Effective January 31, 2012, the 2.5 percent holdback is not subtracted from the Minimum
Annual and Extended Summer Resource Requirements.27 The first auction affected was
the 2015/2016 BRA. The prior rule required that the Short-Term Resource Procurement
Target, or 2.5 percent holdback, be subtracted from all product types including Annual,
Extended Summer and Limited DR. Under the old rule, in the case where either the
Minimum Annual Resource Requirement or Minimum Extended Summer Resource
Requirement were binding, the maximum amount of Limited DR would be procured in
the Base Residual Auction, leaving none to be procured in Incremental Auctions for the
relevant delivery year. Under the new rule, the entire 2.5 percent is subtracted from the
amount of Limited DR procured in the BRA, assuming either the Minimum Annual
Resource Requirement or Minimum Extended Summer Resource Requirement is
binding. For example in the 2015/2016 BRA, applying the Short-Term Resource
25 PJM. “Manual 18: PJM Capacity Market,” Revision 19 (June 1, 2013), p. 71-72.
26 PJM. “Manual 18: PJM Capacity Market,” Revision 19 (June 1, 2013), p. 71.
27 138 FERC ¶ 61,062 (2012).

© Monitoring Analytics 2014 | www.monitoringanalytics.com 14
Procurement Target reduced the amount of Limited DR procured by 4,069.4 MW, which
is equal to 2.5 percent of 162,777.4, the demand adjusted for FRR.
Preliminary Market Structure Screen
The preliminary market structure screen (PMSS) was eliminated effective December 17,
2012.28 The 2016/2017 RPM Base Residual Auction was the first BRA held after the PMSS
was eliminated.
Other Changes Affecting Supply and Demand
The East Kentucky Power Cooperative (EKPC) Zone, which integrated into PJM on June
1, 2013, was included in RPM for the first time in the 2016/2017 RPM Base Residual
Auction.
On December 16, 2011, the U.S. Environmental Protection Agency (EPA) issued its
Mercury and Air Toxics Standards rule (MATS), a final rule setting maximum
achievable control technology (MACT) emissions standards for hazardous air pollutants
(HAP) from coal‐ and oil‐fired electric utility steam generating units, pursuant to section
112(d) of the Clean Air Act.29 The rule requires compliance by April 16, 2015 with the
possibility of one year extensions being granted to individual generation owners.30
The State of New Jersey has separately addressed NOX emissions on peak energy days
with a rule that defines peak energy usage days, referred to as High Electric Demand
Days or HEDD.31 The rule implements performance standards on May 1, 2015, just prior
to the commencement of the 2015/2016 Delivery Year.
Prior to the 2016/2017 RPM Base Residual Auction, the PJM Markets and Reliability
(MRC) approved DR plan enhancements, which were meant to standardize the
information requirements for offering planned DR into BRAs, increase the likelihood
that offers were based on physical assets and reduce the level of speculative offers. A
28 Letter Order issued in Docket No. ER13-149 (November 28, 2012).
29 National Emission Standards for Hazardous Air Pollutants from Coal- and Oil-fired Electric Utility
Steam Generating Units and Standards of Performance for Fossil-Fuel-Fired Electric Utility,
Industrial-Commercial-Institutional, and Small Industrial-Commercial-Institutional Steam
Generating Units, EPA Docket No. EPA-HQ-OAR-2009-0234, 77 Fed. Reg. 9304 (February 16,
2012).
30 Id. at 9465.
31 N.J.A.C. § 7:27–19.

© Monitoring Analytics 2014 | www.monitoringanalytics.com 15
group of Curtailment Service Providers (CSPs) filed a complaint with FERC on April 3,
2013, and FERC granted the complaint on April 19, 2013.32 Although not in place for the
2016/2017 BRA, the discussion and approval of the DR plan enhancements in the PJM
stakeholder process could have resulted in a reduction in speculative DR offered
compared to the prior BRA.
MMU Methodology
The MMU reviewed the following inputs to and results of the 2016/2017 RPM Base
Residual Auction: 33
Offer Cap. Verified that the avoidable costs, opportunity costs and net revenues
used to calculate offer caps were reasonable and properly documented;
Net Revenues. Calculated actual unit-specific net revenue from PJM energy and
ancillary service markets for each PJM Generation Capacity Resource for the period
from 2010 through 2012;
Minimum Offer Price Rule (MOPR). Reviewed unit specific, competitive entry, and
self supply requests for exceptions to the MOPR;34
Mitigation of Planned Generation Capacity Resources. Reviewed sell offers for
Planned Generation Capacity Resources to determine if consistent with levels
specified in Tariff;
Exported Resources. Verified that Generation Capacity Resources exported from
PJM had firm external contracts or made documented and reasonable opportunity
cost offers;
32 See 143 FERC ¶ 61,061 (2013).
33 Unless otherwise specified, all volumes and prices are in terms of unforced capacity (UCAP),
which is calculated as installed capacity (ICAP) times (1-EFORd) for generation resources
and as ICAP times the Demand Resource Factor and the Forecast Pool Requirement (FPR) for
Demand Resources and Energy Efficiency Resources. The EFORd values in this report are the
EFORd values used in the 2016/2017 RPM Base Residual Auction.
34 As FERC responded to PJM’s filing for MOPR revisions in Dockets Nos. ER13-535-000 and
ER13-535-001 on May 2, 2013, which was after the MOPR related deadlines, MOPR exception
requests for the 2016/2017 RPM Base Residual Auction were reviewed under both the
effective and proposed MOPR at that time.
© Monitoring Analytics 2014 | www.monitoringanalytics.com 16
Excused Resources. Reviewed exceptions to the RPM must offer requirement;
Maximum EFORd. Verified that the sell offer EFORd levels were less than or equal
to the greater of the one-year EFORd or the five-year EFORd for the period ending
September 30, 2012 or reviewed requests for alternate maximum EFORds;
Clearing Prices. Verified that the auction clearing prices were accurate, based on
submitted offers,35 the Variable Resource Requirement (VRR) curves, and the
Minimum Resource Requirements;
Market Structure Test. Verified that the market power test was properly defined
using the TPS test, that offer caps were properly applied and that the TPS test results
were accurate.
Market Structure Tests
As shown in Table 2, all participants in the RTO, MAAC, PSEG and ATSI RPM markets
failed the TPS test.36 The result was that offer caps were applied to all sell offers for
Existing Generation Capacity Resources when the Capacity Market Seller did not pass
the test, the submitted sell offer exceeded the defined offer cap, and the submitted sell
offer, absent mitigation, would have increased the market clearing price. Market power
mitigation was applied to 50 Generation Capacity Resources, including 4,587.6 MW in
the 2016/2017 RPM Base Residual Auction. All other offers were competitive.
In applying the market structure test, the relevant supply for the RTO market includes
all supply from generation resources offered at less than or equal to 150 percent of the
RTO cost-based clearing price.37 The relevant supply for the constrained LDA markets
includes the incremental supply from generation resources inside the constrained LDAs
which was offered at a price higher than the unconstrained clearing price for the parent
LDA market and less than or equal to 150 percent of the cost-based clearing price for the
constrained LDA. The relevant demand consists of the incremental MW needed in the
LDA to relieve the constraint.
35 Attachment A reviews why the MMU calculation of auction outcomes differs slightly from
PJM’s calculation of auction outcomes.
36 See the 2012 State of the Market Report for PJM (March 14, 2013), Volume II, Section 2, “Energy
Market,” and the MMU Technical Reference for PJM Markets, at “Three Pivotal Supplier Test”
for a more detailed discussion of market structure tests.
37 Effective November 1, 2009, DR and EE resources are not included in the TPS test. See 129
FERC ¶ 61,081 (2009) at P 31.

© Monitoring Analytics 2014 | www.monitoringanalytics.com 17
Table 2 presents the results of the TPS test and the one pivotal supplier test. A
generation owner or owners are pivotal if the capacity of the owners’ generation
facilities is needed to meet the demand for capacity. The results of the TPS are measured
by the Residual Supply Index (RSI3). The RSIx is a general measure that can be used with
any number of pivotal suppliers. The TPS test uses three pivotal suppliers. The subscript
denotes the number of pivotal suppliers included in the test. If the RSIx is less than or
equal to 1.0, the supply owned by the specific generation owner, or owners, is needed to
meet market demand and the generation owners are pivotal suppliers with a significant
ability to influence market prices. If the RSIx is greater than 1.0, the supply of the specific
generation owner or owners is not needed to meet market demand and those generation
owners have a reduced ability to unilaterally influence market price.38
MAAC/EMAAC/SWMAAC/DPL South/Pepco are presented together because EMAAC,
SWMAAC, DPL South, and Pepco were modeled but were not constrained LDAs in this
auction.
Table 2 RSI Results: 2016/2017 RPM Base Residual Auction39
Offer Caps
The defined Generation Capacity Resource owners were required to submit ACR or
opportunity cost data to the MMU by 120 days prior to the 2016/2017 RPM Base
Residual Auction.40 Market power mitigation measures are applied to Existing
Generation Capacity Resources such that the sell offer is set equal to the defined offer
38 The market definition used for the TPS test includes all offers with costs less than or equal to
1.50 times the clearing price. The appropriate market definition to use for the one pivotal
supplier test includes all offers with costs less than or equal to 1.05 times the clearing price.
See the MMU Technical Reference for PJM Markets, at “Three Pivotal Supplier Test” for
additional discussion.
39 The RSI shown is the lowest RSI in the market.
40 The deadline for data submission changed from two months prior to the auction to 120 days
prior to the auction, effective December 17, 2012, by letter order in FERC Docket No. ER13-
149 (November 28, 2012).
RSI1 1.05 RSI3
Total
Participants
Failed RSI3
Participants
RTO 0.78 0.59 110 110
MAAC/EMAAC/SWMAAC/DPL South/Pepco 0.56 0.38 6 6
PSEG/PSEG North 0.00 0.00 1 1
ATSI/ATSI Cleveland 0.00 0.00 1 1

© Monitoring Analytics 2014 | www.monitoringanalytics.com 18
cap when the Capacity Market Seller fails the market structure test for the auction, the
submitted sell offer exceeds the defined offer cap, and the submitted sell offer, absent
mitigation, would increase the market clearing price.41 For RPM Base Residual Auctions,
offer caps are defined as avoidable costs less PJM market revenues or opportunity costs.
Avoidable costs are the costs that a generation owner would not incur if the generating
unit did not operate for one year, in particular the delivery year.42 In the calculation of
avoidable costs, there is no presumption that the unit would retire as the alternative to
operating, although that possibility could be reflected if the owner documented that
retirement was the alternative. Avoidable costs may also include annual capital recovery
associated with investments required to maintain a unit as a Generation Capacity
Resource, termed Avoidable Project Investment Recovery (APIR). Avoidable cost based
offer caps are defined to be net of revenues from all other PJM markets and unit-specific
bilateral contracts. Capacity resource owners could provide ACR data by providing their
own unit-specific data or by selecting the default ACR values. The specific components
of avoidable costs are defined in the PJM Tariff.43
The opportunity cost option allows Capacity Market Sellers to input a documented price
available in a market external to PJM, subject to export limits. If the relevant RPM
market clears above the opportunity cost, the Generation Capacity Resource is sold in
the RPM market. If the opportunity cost is greater than the clearing price and the
Generation Capacity Resource does not clear in the RPM market, it is available to sell in
the external market.
The MMU calculated offer caps for 638 generation resources, of which 491 were based
on the technology specific default (proxy) ACR values.44 No generation resources elected
to use the retirement ACR in the 2016/2017 BRA. The default ACR values for the
2016/2017 Delivery Year were calculated by applying the applicable annual rate of
change in the Handy-Whitman Index value to update the base values through 2012/2013
for which data were available and applying the most recent ten year annual average rate
of change in the Handy-Whitman Index to recalculate the default ACR values for
41 OATT Attachment DD § 6.5.
42 OATT Attachment DD § 6.8 (b).
43 OATT Attachment DD § 6.8 (a).
44 Four generation resources had both ACR based and opportunity cost based offer caps
calculated, and 25 generation resources had uncapped planned uprates along with ACR
based offer caps calculated for the existing portion.

© Monitoring Analytics 2014 | www.monitoringanalytics.com 19
2013/2014 through 2015/2016 prior to estimating the default ACR values for the
2016/2017 Delivery Year.45
Unit-specific offer caps were calculated for 139 generation resources (11.6 percent)
including 138 generation resources (11.5 percent) with an Avoidable Project Investment
Recovery Rate (APIR) component and one generation resource (0.1 percent) without an
APIR component. Owners submitted unit-specific cost data, the MMU calculated net
revenue data for these units, and the MMU calculated the unit-specific offer caps based
on that data. Of the 1,199 generation resources offered, 31 Planned Generation Capacity
Resources had uncapped offers, 15 generation resources had planned uprates with
uncapped offers plus default ACR based offer caps calculated for the existing portion of
the units, 11 generation resources had planned uprates with uncapped offers plus price
taker status for the existing portion of the units, while the remaining 519 generation
resources were price takers.46
As shown in Table 4, the weighted average gross ACR for units with APIR ($352.84 per
MW-day) and the weighted-average offer caps, net of net revenues, for units with APIR
($180.23 per MW-day) decreased from the 2015/2016 BRA values of $401.95 per MW-day
and $246.63 per MW-day, due primarily to lower weighted average gross ACRs for
combined cycle, combustion turbine, oil and gas steam units, and
subcritical/supercritical coal units.
The APIR component added an average of $191.19 per MW-day to the ACR value of the
APIR units compared to $238.79 per MW-day in the 2015/2016 BRA.47 48 The highest
APIR for a technology ($236.99 per MW-day) was for subcritical/supercritical coal units.
45 The default Avoidable Cost Rate (ACR) escalation method which had been recommended by
the MMU was approved and became effective on February 5, 2013 for the 2016/2017 and
subsequent Delivery Years. See 142 FERC ¶ 61,092 (2013).
46 Planned Generation Capacity Resources are subject to different market power mitigation
rules than Existing Generation Capacity Resources. For RPM rules on mitigation, see OATT
Attachment DD § 6.5 (a) (ii). For the definition of Planned Generation Capacity Resource, see
“Reliability Assurance Agreement Among Load Serving Entities in the PJM Region”, Section
1.70.
47 The net revenue offset for an individual unit could exceed the corresponding ACR. In that
case, the offer cap would be zero.
48 The 138 resources which had an APIR component submitted $1.8 billion for capital projects
associated with 27,384.2 MW of UCAP.

© Monitoring Analytics 2014 | www.monitoringanalytics.com 20
The maximum APIR effect ($773.08 per MW-day) is the maximum amount by which an
offer cap was increased by APIR.
Offer caps for units without an APIR component, including units for which the default
value was selected, decreased from $17.86 per MW-day to $16.07 per MW-day due
primarily to lower weighted-average gross ACRs and higher weighted-average net
revenues for units without an APIR component.49
Table 3 ACR statistics: 2016/2017 RPM Base Residual Auction
49 The default ACR values include an average APIR of $1.39 per MW-day compared to $1.48
per MW-day in the 2015/2016 BRA.
Offer Cap/Mitigation Type
Number of Generation
Resources Offered
Percent of Generation
Resources Offered
Default ACR 471 39.3%
ACR data input (APIR) 138 11.5%
ACR data input (non-APIR) 1 0.1%
Opportunity cost 8 0.7%
Default ACR and opportunity cost 5 0.4%
Uncapped planned uprates and default ACR 15 1.3%
Uncapped planned uprates and opportunity cost 0 0.0%
Uncapped planned uprates and price taker 11 0.9%
Uncapped planned generation resources 31 2.6%
Existing generation resources as price takers 519 43.3%
Total Generation Capacity Resources offered 1,199 100.0%

© Monitoring Analytics 2014 | www.monitoringanalytics.com 21
Table 4 APIR statistics: 2016/2017 RPM Base Residual Auction50 51
Generation Capacity Resource Changes
As shown in Table 3, offers were submitted for 1,199 generation resources in the
2016/2017 RPM Base Residual Auction compared to 1,168 generation resources offered
in the 2015/2016 RPM Base Residual Auction, or a net increase of 31 generation
resources. This was a result of 99 additional generation resources offered offset by 68
fewer generation resources offered.
The 99 additional generation resources offered consisted of 36 new resources (4,900.8
MW), 29 additional resources imported (3,026.3 MW), 18 East Kentucky Power
Cooperative (EKPC) integration resources not offered in the 2015/2016 BRA (2,537.3
MW), nine resources that were excused and not offered in the 2015/2016 BRA (1,033.9
MW), three repowered resources (920.2 MW), two resources that were previously
50 The weighted-average offer cap can be positive even when the weighted-average net
revenues are higher than the weighted-average ACR because the unit-specific offer caps are
never less than zero. On a unit basis, if net revenues are greater than ACR the offer cap is
zero.
51 For reasons of confidentiality, the APIR statistics do not include opportunity cost based offer
cap data.
Combined
Cycle
Combustion
Turbine
Oil or Gas
Steam
Subcritical/
Supercritical
Coal Other Total
Non-APIR units
ACR $42.11 $33.46 $78.32 $215.57 $75.69 $102.23
Net revenues $194.19 $56.23 $42.33 $208.04 $228.59 $150.24
Offer caps $4.80 $7.64 $36.43 $29.03 $4.63 $16.07
APIR units
ACR $52.48 $93.23 $188.80 $432.72 $53.20 $352.84
Net revenues $72.50 $17.49 $16.68 $222.52 $62.15 $177.14
Offer caps $13.92 $79.12 $167.29 $213.88 $5.91 $180.23
APIR $14.45 $57.71 $64.90 $236.99 $23.01 $191.19
Maximum APIR effect $773.08
Weighted-Average ($ per MW-day UCAP)

© Monitoring Analytics 2014 | www.monitoringanalytics.com 22
entirely FRR committed (168.3 MW), one reactivated resource (17.6 MW), and one
additional resource resulting from the disaggregation of an RPM resource.52
The 36 new Generation Capacity Resources consisted of 11 diesel resources (36.1 MW),
nine solar resources (32.1 MW), eight combined cycle resources (4,597.2 MW), five wind
resources (54.3 MW), two CT resources (159.3 MW), and one steam unit (21.8 MW). In
addition, there were new generation resources that were not offered in to the auction
because they were either exported or entirely committed to FRR for the 2016/2017
Delivery Year: one wind resource (12.8 MW) and one diesel resource (5.3 MW).
The 68 fewer generation resources offered consisted of 33 additional resources excused
from offering (1,706.0 MW), 28 deactivated resources (1,389.6 MW), three fewer
resources resulting from aggregation of RPM resources, two additional resources
committed fully to FRR (28.7 MW), and two Planned Generation Capacity Resources not
offered (934.8 MW). In addition, there were the following retirements of resources that
were either exported, excused, or committed to an FRR capacity plan in the 2015/2016
BRA: 25 steam units (2,207.1 MW) and 13 CT resources (245.0 MW). Table 5 shows
Generation Capacity Resources for which deactivation requests have been submitted
which affected supply between the 2015/2016 BRA and the 2016/2017 BRA.
52 Unless otherwise specified, all volumes and prices are in terms of UCAP.
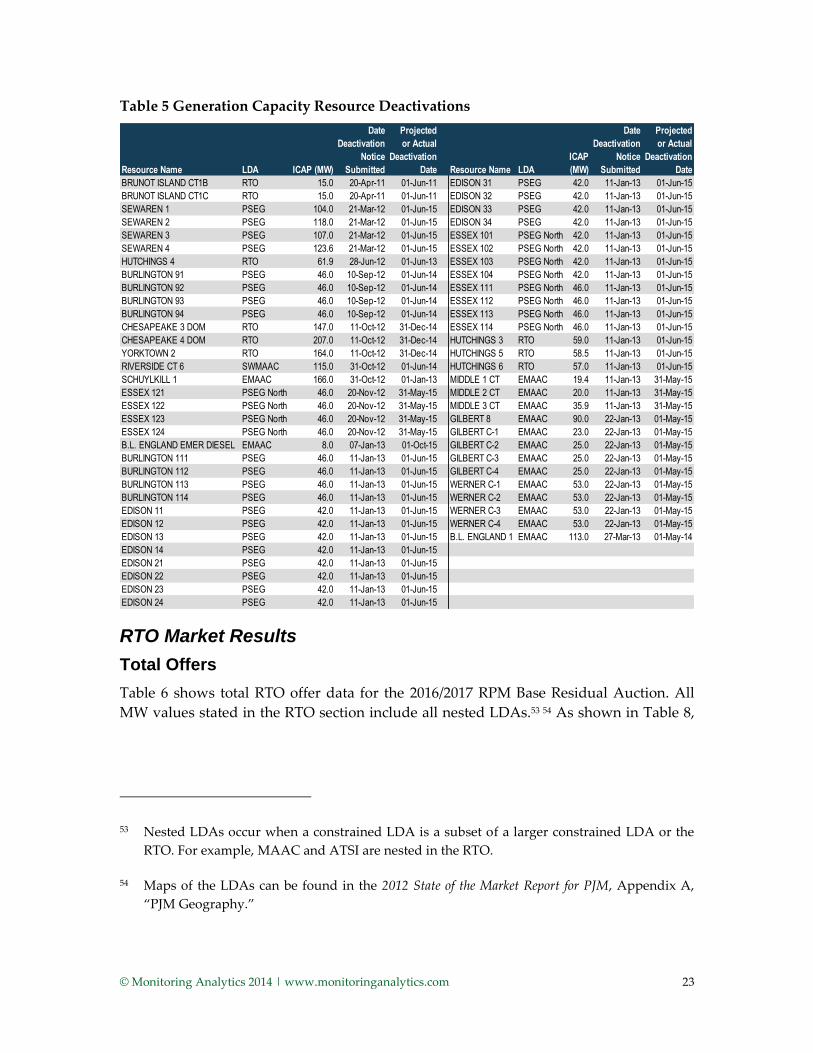
© Monitoring Analytics 2014 | www.monitoringanalytics.com 23
Table 5 Generation Capacity Resource Deactivations
RTO Market Results
Total Offers
Table 6 shows total RTO offer data for the 2016/2017 RPM Base Residual Auction. All
MW values stated in the RTO section include all nested LDAs.53 54 As shown in Table 8,
53 Nested LDAs occur when a constrained LDA is a subset of a larger constrained LDA or the
RTO. For example, MAAC and ATSI are nested in the RTO.
54 Maps of the LDAs can be found in the 2012 State of the Market Report for PJM, Appendix A,
“PJM Geography.”
Resource Name LDA ICAP (MW)
Date
Deactivation
Notice
Submitted
Projected
or Actual
Deactivation
Date Resource Name LDA
ICAP
(MW)
Date
Deactivation
Notice
Submitted
Projected
or Actual
Deactivation
Date
BRUNOT ISLAND CT1B RTO 15.0 20-Apr-11 01-Jun-11 EDISON 31 PSEG 42.0 11-Jan-13 01-Jun-15
BRUNOT ISLAND CT1C RTO 15.0 20-Apr-11 01-Jun-11 EDISON 32 PSEG 42.0 11-Jan-13 01-Jun-15
SEWAREN 1 PSEG 104.0 21-Mar-12 01-Jun-15 EDISON 33 PSEG 42.0 11-Jan-13 01-Jun-15
SEWAREN 2 PSEG 118.0 21-Mar-12 01-Jun-15 EDISON 34 PSEG 42.0 11-Jan-13 01-Jun-15
SEWAREN 3 PSEG 107.0 21-Mar-12 01-Jun-15 ESSEX 101 PSEG North 42.0 11-Jan-13 01-Jun-15
SEWAREN 4 PSEG 123.6 21-Mar-12 01-Jun-15 ESSEX 102 PSEG North 42.0 11-Jan-13 01-Jun-15
HUTCHINGS 4 RTO 61.9 28-Jun-12 01-Jun-13 ESSEX 103 PSEG North 42.0 11-Jan-13 01-Jun-15
BURLINGTON 91 PSEG 46.0 10-Sep-12 01-Jun-14 ESSEX 104 PSEG North 42.0 11-Jan-13 01-Jun-15
BURLINGTON 92 PSEG 46.0 10-Sep-12 01-Jun-14 ESSEX 111 PSEG North 46.0 11-Jan-13 01-Jun-15
BURLINGTON 93 PSEG 46.0 10-Sep-12 01-Jun-14 ESSEX 112 PSEG North 46.0 11-Jan-13 01-Jun-15
BURLINGTON 94 PSEG 46.0 10-Sep-12 01-Jun-14 ESSEX 113 PSEG North 46.0 11-Jan-13 01-Jun-15
CHESAPEAKE 3 DOM RTO 147.0 11-Oct-12 31-Dec-14 ESSEX 114 PSEG North 46.0 11-Jan-13 01-Jun-15
CHESAPEAKE 4 DOM RTO 207.0 11-Oct-12 31-Dec-14 HUTCHINGS 3 RTO 59.0 11-Jan-13 01-Jun-15
YORKTOWN 2 RTO 164.0 11-Oct-12 31-Dec-14 HUTCHINGS 5 RTO 58.5 11-Jan-13 01-Jun-15
RIVERSIDE CT 6 SWMAAC 115.0 31-Oct-12 01-Jun-14 HUTCHINGS 6 RTO 57.0 11-Jan-13 01-Jun-15
SCHUYLKILL 1 EMAAC 166.0 31-Oct-12 01-Jan-13 MIDDLE 1 CT EMAAC 19.4 11-Jan-13 31-May-15
ESSEX 121 PSEG North 46.0 20-Nov-12 31-May-15 MIDDLE 2 CT EMAAC 20.0 11-Jan-13 31-May-15
ESSEX 122 PSEG North 46.0 20-Nov-12 31-May-15 MIDDLE 3 CT EMAAC 35.9 11-Jan-13 31-May-15
ESSEX 123 PSEG North 46.0 20-Nov-12 31-May-15 GILBERT 8 EMAAC 90.0 22-Jan-13 01-May-15
ESSEX 124 PSEG North 46.0 20-Nov-12 31-May-15 GILBERT C-1 EMAAC 23.0 22-Jan-13 01-May-15
B.L. ENGLAND EMER DIESEL EMAAC 8.0 07-Jan-13 01-Oct-15 GILBERT C-2 EMAAC 25.0 22-Jan-13 01-May-15
BURLINGTON 111 PSEG 46.0 11-Jan-13 01-Jun-15 GILBERT C-3 EMAAC 25.0 22-Jan-13 01-May-15
BURLINGTON 112 PSEG 46.0 11-Jan-13 01-Jun-15 GILBERT C-4 EMAAC 25.0 22-Jan-13 01-May-15
BURLINGTON 113 PSEG 46.0 11-Jan-13 01-Jun-15 WERNER C-1 EMAAC 53.0 22-Jan-13 01-May-15
BURLINGTON 114 PSEG 46.0 11-Jan-13 01-Jun-15 WERNER C-2 EMAAC 53.0 22-Jan-13 01-May-15
EDISON 11 PSEG 42.0 11-Jan-13 01-Jun-15 WERNER C-3 EMAAC 53.0 22-Jan-13 01-May-15
EDISON 12 PSEG 42.0 11-Jan-13 01-Jun-15 WERNER C-4 EMAAC 53.0 22-Jan-13 01-May-15
EDISON 13 PSEG 42.0 11-Jan-13 01-Jun-15 B.L. ENGLAND 1 EMAAC 113.0 27-Mar-13 01-May-14
EDISON 14 PSEG 42.0 11-Jan-13 01-Jun-15
EDISON 21 PSEG 42.0 11-Jan-13 01-Jun-15
EDISON 22 PSEG 42.0 11-Jan-13 01-Jun-15
EDISON 23 PSEG 42.0 11-Jan-13 01-Jun-15
EDISON 24 PSEG 42.0 11-Jan-13 01-Jun-15

© Monitoring Analytics 2014 | www.monitoringanalytics.com 24
total internal RTO unforced capacity (UCAP) decreased 3,709.2 MW (1.8 percent) from
204,557.3 MW in the 2015/2016 RPM BRA to 200,848.1 MW.55
When comparing UCAP MW levels from one auction to another, two variables, capacity
modifications and EFORd changes, need to be considered. The net internal capacity
change attributable to capacity modifications can be determined by holding the EFORd
level constant at the prior auction’s level. The EFORd effect is the measure of the net
internal capacity change attributable to EFORd changes and not capacity modifications.
The 3,709.2 MW increase in internal capacity was a result of net generation capacity
modifications (cap mods) (2,895.9 MW), net DR capacity changes (-10,690.1 MW), net EE
modifications (262.5 MW), the EFORd effect due to lower sell offer EFORds (1,039.0
MW), the DR and EE effect due to a higher Load Management UCAP conversion factor
(47.8 MW), and the integration of the EKPC Zone (2,735.7 MW).56
The net generation capacity modifications reflect new and reactivated generation,
deactivations, and cap mods to existing generation. Total internal RTO unforced
capacity includes all Generation Capacity Resources, Demand Resources, and Energy
Efficiency Resources that qualified as PJM Capacity Resources for the 2016/2017 RPM
Base Residual Auction, excluding external units, and also includes owners’
modifications to installed capacity (ICAP) ratings which are permitted under the PJM
Reliability Assurance Agreement (RAA) and associated manuals.57 The ICAP of a unit
may only be reduced through a cap mod if the capacity owner does not intend to restore
the reduced capability by the end of the planning period following the planning period
55 The maximum capacity within a coupled Demand Resource group was included in the
internal capacity values and capacity changes reported.
56 The UCAP value of a load management product is equal to the ICAP value multiplied by the
Demand Resource (DR) Factor and the Forecast Pool Requirement (FPR). For the 2015/2016
BRA, this conversion factor was 0.955*1.0859 = 1.0370. For the 2016/2017 BRA, this factor was
0.955*1.0902 = 1.0411. The DR Factor is designed to reflect the difference in losses that occur
on the distribution system between the meter where demand is measured and the
transmission system. The FPR multiplier is designed to recognize the fact that when demand
is reduced by one MW, the system does not need to procure that MW or the associated
reserve. See “Reliability Assurance Agreement Among Load Serving Entities in the PJM
Region”, Schedule 6, Section B. See also PJM. “Manual 20: PJM Resource Adequacy
Analysis,” Revision 05 (February 1, 2013), p. 13-15.
57 See “Reliability Assurance Agreement Among Load Serving Entities in the PJM Region,”
Schedule 9.

© Monitoring Analytics 2014 | www.monitoringanalytics.com 25
in question.58 Otherwise the owner must take an outage, as appropriate, if the owner
cannot provide energy consistent with the ICAP of the unit. Capacity, DR plan changes,
and EE modifications were the result of owner reevaluation of the capabilities of their
generation, DR and EE, at least partially in response to the incentives and penalties
contained in RPM.
After accounting for FRR committed resources and for imports, total RPM capacity was
194,324.1 MW compared to 194,126.5 MW in the 2015/2016 RPM Base Residual
Auction.59 FRR volumes decreased by 360.8 MW, and imports increased by 3,546.0 MW.
Of the 7,491.5 MW of imports, 447.8 MW were committed to an FRR capacity plan and
7,493.7 MW were offered in the auction, of which all 7,482.7 MW cleared. Of the cleared
imports, 4,723.1 MW (63.1 percent) were from MISO. RPM capacity was reduced by
exports of 1,211.6 MW, a decrease of 2.6 MW from the 2015/2016 RPM Base Residual
Auction. Of total exports, 674.0 MW (55.6 percent) were to the NYISO and 537.6 MW
(44.4 percent) were to MISO.
In addition, RPM capacity was reduced by 1,451.1 MW of Planned Generation Capacity
Resources which were not subject to the RPM must offer requirement and by 3,620.6
MW which were excused from the RPM must offer requirement, a decrease of 3,659.9
MW from the 2015/2016 RPM Base Residual Auction. The excused Existing Generation
Capacity Resources were the result of plans for retirement (3,555.3 MW), significant
physical operational restrictions (15.8 MW), and the resource being considered existing
for purposes of the RPM must offer requirement and mitigation only because it cleared
an RPM Auction in a prior delivery year but is unable to achieve full commercial
operation prior to the delivery year (49.5 MW).60 Subtracting 2,225.4 MW of FRR
optional volumes not offered, an increase of 2,066.5 MW from the 2015/2016 RPM Base
Residual Auction, and 1,435.4 MW of DR and EE not offered, resulted in 184,380.0 MW
that were available to be offered in the RPM Auction, an increase of 5,792.3 MW from
58 PJM. “Manual 21: Rules and Procedures for Determination of Generating Capability,”
Revision 09 (May 1, 2010), p. 11. The manual states “the end of the next Delivery Year.”
59 The FRR alternative allows a load serving entity (LSE), subject to certain conditions, to avoid
direct participation in the RPM Auctions. The LSE is required to submit an FRR capacity plan
to satisfy the unforced capacity obligation for all load in its service area.
60 See OATT Attachment M-Appendix § II.C.4 for the reasons to qualify for an exception to the
RPM must offer requirement.

© Monitoring Analytics 2014 | www.monitoringanalytics.com 26
the 2015/2016 RPM Base Residual Auction.61 62 After accounting for the above, 0.0 MW
were not offered in the RPM Auction.
Offered MW increased 5,792.3 MW from 178,587.7 MW to 184,380.0 MW, while the
overall RTO Reliability Requirement adjusted for FRR obligations, from which the
demand curve is developed, increased 3,350.1 MW from 162,777.4 MW to 166,127.5
MW.63 The RTO Reliability Requirement adjusted for FRR obligations is calculated as the
RTO forecast peak load times the Forecast Pool Requirement (FPR), less FRR UCAP
obligations. The FPR is calculated as (1+Installed Reserve Margin) times (1-Pool Wide
Average EFORd), where the Installed Reserve Margin (IRM) is the level of installed
capacity needed to maintain an acceptable level of reliability.64 The 3,350.1 MW increase
in the RTO Reliability Requirement adjusted for FRR obligations from the 2015/2016
RPM Base Residual Auction was a result of a 202.0 MW decrease in the FRR obligation
and a 3,148.1 MW increase in the RTO Reliability Requirement not adjusted for FRR,
shifting the RTO market demand curve to the right. The forecast peak load expressed in
terms of installed capacity increased 2,244.0 MW from the 2015/2016 RPM Base Residual
Auction to 165,412.0 MW. The 3,148.1 MW increase in the RTO Reliability Requirement
was a result of a 2,436.8 MW increase in the forecast peak load in UCAP terms holding
the FPR constant at the 2015/2016 level and a 711.3 MW increase attributable to the
change in the FPR.
Minimum DR Requirements
PJM’s auction clearing mechanism will result in a higher price for Extended Summer
Resources if the MW of Extended Summer Resources that would otherwise clear the
auction are less than the Minimum Extended Summer Resource Requirement that PJM
requires for reliability. In that case the auction clearing mechanism will select Extended
Summer Resources that are more expensive than the clearing price that would otherwise
61 FRR entities are allowed to offer in the RPM Auction excess volumes above their FRR
quantities, subject to a sales cap amount. The 2,225.4 MW are a combination of excess
volumes included in the sales cap amount which were not offered in the auction and
volumes above the sales cap amount which were not permitted to offer in the auction.
62 Unoffered DR and EE MW include PJM approved DR plans and EE modifications that were
not offered in the auction.
63 The maximum capacity within a coupled Demand Resource group was included in the
offered capacity values reported.
64 PJM. “Reliability Assurance Agreement Among Load Serving Entities in the PJM Region,”
Schedule 4.1.<http://www.pjm.com/~/media/documents/agreements/raa.ashx>

© Monitoring Analytics 2014 | www.monitoringanalytics.com 27
result in order to procure the defined minimum resource requirements for the Extended
Summer product. This is referred as the Minimum Extended Summer Resource
Requirement being a binding constraint. Similarly, PJM’s auction clearing mechanism
will result in a higher price for Annual Resources if the MW of Annual Resources that
would otherwise clear the auction are less than the Minimum Annual Resource
Requirement that PJM requires for reliability. In that case the auction clearing
mechanism will select Annual Resources that are more expensive than the clearing price
that would otherwise result in order to procure the defined minimum resource
requirements for the Annual Resources. This is referred as the Minimum Annual
Resource Requirement being a binding constraint.
The Minimum Extended Summer Resource Requirement and the Minimum Annual
Resource Requirement were not binding constraints for the RTO in the 2016/2017 BRA.
As shown in Figure 1, the resource clearing price for Limited, Extended Summer, and
Annual Resources for the RTO was $59.37 per MW-day.
Clearing Results
The Net Load Price that load serving entities (LSEs) will pay is equal to the Final Zonal
Capacity Price less the final Capacity Transfer Rights (CTR) credit rate.65 As shown in
Table 6, the preliminary Net Load Price is $59.37 per MW-day in the RTO.
As shown in Table 6, the cleared and make-whole MW of 169,159.7 for the entire RTO,
which represented a reserve margin of 21.5 percent, resulted in net excess of 7,185.4 MW
over the reliability requirement of 166,127.5 MW (Installed Reserve Margin (IRM) of 15.6
percent). 66, 67 Net excess increased 1,329.5 MW from the net excess of 5,855.9 MW in the
2015/2016 RPM Base Residual Auction. As shown in Figure 1, the downward sloping
VRR demand curve resulted in a clearing price for Limited, Extended Summer, and
Annual Resources of $59.37 per MW-day.
65 Effective with the 2012/2013 Delivery Year, Final Zonal Capacity Prices and the final CTR
credit rate are determined after the final Incremental Auction.
66 Prior to the 2012/2013 Delivery Year, net excess under RPM was calculated as cleared
capacity plus make-whole MW less the reliability requirement plus ILR. For the 2012/2013
Delivery Year and beyond, net excess under RPM is calculated as cleared capacity plus make-
whole MW less the reliability requirement plus the Short-Term Resource Procurement
Target.
67 The IRM increased from 15.4 percent in the 2015/2016 RPM Base Residual Auction to 15.6
percent in the 2016/2017 RPM Base Residual Auction.
© Monitoring Analytics 2014 | www.monitoringanalytics.com 28
If the market clears on a nonflexible supply segment, a sell offer that specifies a
minimum block MW value greater than zero, the Capacity Market Seller will be
assigned make-whole MW equal to the difference between the sell offer minimum block
MW and the sell offer cleared MW quantity if that solution to the market clearing
minimizes the cost of satisfying the reliability requirements across the PJM region.68 The
make-whole payment for partially cleared resources equals the make-whole MW times
the clearing price. A more efficient solution could include not selecting a nonflexible
segment from a lower priced offer and accepting a higher priced sell offer that does not
include a minimum block MW requirement.69 The market results in the 2016/2017 BRA
did not include make-whole MW and payments resulting from partially cleared
resources. Make-whole MW and payments can also occur for resources electing the New
Entry Price Adjustment (NEPA) or Multi-Year Pricing Option.70 71 In the two subsequent
BRAs, if a qualifying resource does not clear, the process specified in the Tariff is
triggered, and the resource is awarded a make-whole payment.72 The market results in
the 2016/2017 BRA did not include make-whole MW or payments related to NEPA or
Multi-Year Pricing Option.
Table 9 shows cleared MW by zone and fuel source. Of the 168,716.0 MW offered for
generation resources, 155,634.3 MW cleared (92.2 percent). Of the 169,159.7 cleared MW
in the entire RTO, 25,551.2 MW (15.1 percent) cleared in Dominion, followed by 25,346.3
MW in ComEd (15.0 percent) and 15,576.0 MW (9.2 percent) in AEP. Of the 155,634.3
cleared MW for generation resources in the entire RTO, 60,207.4 MW (38.7 percent) were
gas resources, followed by 46,681.1 MW (30.0 percent) from coal resources and 30,801.1
MW (19.8 percent) from nuclear resources.
The 15,220.3 MW uncleared MW in the entire RTO were the result of offer prices which
exceeded the clearing prices. Of the 15,220.3 uncleared MW in the entire RTO, 39.5 MW
were EE offers, 2,099.1 MW were DR offers, and the remaining 13,081.7 MW were
generation offers. Table 10 presents details on the generation offers that did not clear. Of
the 13,081.7 MW of uncleared generation offers, 7,448.0 MW (56.9 percent) were for
generation resources greater than 40 years old, and 5,633.7 MW (43.1 percent) were for
68 OATT Attachment DD § 5.14 (b).
69 OATT Attachment DD § 5.12 (a).
70 OATT Attachment DD § 5.14 (c) (2).
71 OATT Attachment DD § 6.8 (a).
72 OATT Attachment DD § 5.14 (c) (2) (ii).

© Monitoring Analytics 2014 | www.monitoringanalytics.com 29
generation resources less than or equal to 40 years old. Of the 13,081.7 MW of uncleared
offers for generation resources, 10,545.1 MW were offers for resources including costs
associated with environmental regulation compliance that were not previously included
in APIR.
Table 11 shows the auction results for the prior two delivery years for the generation
resources that did not clear some or all MW in the 2016/2017 BRA. Of the 56 generation
resources that did not clear 13,081.7 MW in the 2016/2017 BRA, 15 of those generation
resources did not clear 5,301.5 MW in RPM Auctions for the 2015/2016 Delivery Year. Of
those 15 generation resources that did not clear MW in RPM Auctions for the 2016/2017
and 2015/2016 Delivery Years, three of those generation resources did not clear 272.0
MW in RPM Auctions for the 2014/2015 Delivery Year. Thus, 5,301.5 MW of capacity did
not clear in two sequential auctions, but only 272.0 MW did not clear in three sequential
auctions.
Constraints in RPM Markets: CETO/CETL
Since the ability to import energy and capacity in LDAs may be limited by the existing
transmission capability, a load deliverability analysis is conducted for each LDA.73 The
first step in this process is to determine the transmission import requirement in to an
LDA, called the Capacity Emergency Transfer Objective (CETO). This value, expressed
in unforced megawatts, is the transmission import capability required for each LDA to
meet the area reliability criterion of loss of load expectation of one occurrence in 25 years
when the LDA is experiencing a localized capacity emergency.
The second step is to determine the transmission import limit for an LDA, called the
Capacity Emergency Transfer Limit (CETL), which is also expressed in unforced
megawatts. The CETL is the ability of the transmission system to deliver energy into the
LDA when it is experiencing the localized capacity emergency used in the CETO
calculation.
If CETL is less than CETO, transmission upgrades are planned under the Regional
Transmission Expansion Planning (RTEP) Process. However, if transmission upgrades
cannot be built prior to a delivery year to increase the CETL value, locational constraints
could result under RPM, causing locational price differences.74
73 PJM. “Manual 14B: PJM Region Transmission Planning Process, Attachment C: PJM
Deliverability Testing Methods,” Revision 24 (June 5, 2013), p. 52. Manual 14B indicates that
all “electrically cohesive load areas” are tested.
74 PJM. “Manual 18: PJM Capacity Market,” Revision 19 (June 1, 2013), p. 10.

© Monitoring Analytics 2014 | www.monitoringanalytics.com 30
Under the Tariff, PJM determines, in advance of each BRA, whether defined Locational
Deliverability Areas (LDAs) will be modeled in the auction. Effective with the 2012/2013
Delivery Year, an LDA will be modeled as a potentially constrained LDA for a delivery
year if the Capacity Emergency Transfer Limit (CETL) is less than 1.15 times the
Capacity Emergency Transfer Objective (CETO), such LDA had a locational price adder
in one or more of the three immediately preceding BRAs, or such LDA is determined by
PJM in a preliminary analysis to be likely to have a locational price adder based on
historic offer price levels. The rules also provide that starting with the 2012/2013
Delivery Year, EMAAC, SWMAAC, and MAAC LDAs will be modeled as potentially
constrained LDAs regardless of the results of the above three tests.75 In addition, PJM
may establish a constrained LDA even if it does not qualify under the above tests if PJM
finds that “such is required to achieve an acceptable level of reliability.”76 A reliability
requirement, a Variable Resource Requirement (VRR) curve, a Minimum Annual
Resource Requirement, and a Minimum Extended Summer Resource Requirement are
established for each modeled LDA.
Table 12 shows the CETL and CETO values used in the 2016/2017 study compared to the
2015/2016 values. The increase in CETL for the ATSI LDA is mainly due to several RTEP
projects developed since the 2015/2016 BRA study to alleviate reliability concerns.77 The
ATSI Cleveland LDA was modeled for the first time in the 2016/2017 BRA, because it is a
sub-region of the ATSI LDA and shares the same reliability concerns associated with
significant generation retirements.
The Price Impacts of Constraints in the RPM Market
As is the case in locational energy markets, transmission constraints in the PJM capacity
markets affect clearing prices both by increasing prices in constrained areas and
decreasing prices in unconstrained areas. Conversely, removing constraints reduces
prices in constrained areas and increases prices in unconstrained areas. The impact on
total market revenues depends on the relative sizes of the various markets as well as the
shapes of the supply and demand curves in the various markets.
75 Prior to the 2012/2013 Delivery Year, an LDA with a CETL less than 1.05 times CETO was
modeled as a constrained LDA in RPM. No additional criteria were used in determining
modeled LDAs.
76 OATT Attachment DD § 5.10 (a) (ii).
77 See PJM “2016/2017 RPM Base Residual Auction Planning Period Parameters”
<http://www.pjm.com/~/media/markets-ops/rpm/rpm-auction-info/2016-2017-planning-
period-parameters-report.ashx> (February 1, 2013).
© Monitoring Analytics 2014 | www.monitoringanalytics.com 31
There were three locationally binding constraints in the 2016/2017 BRA which resulted
in demand clearing in locationally constrained LDAs which did not clear in the RTO
market. The result was to shift the demand curve in the RTO market to the left along the
upwardly sloping supply curve and to reduce the price in the RTO market. The price
impact is the result both of the size of the shift of the demand curve and the slope of the
supply curve. The larger the shift in the demand curve and the steeper the slope of the
supply curve, the greater the price impact.
Nested LDAs occur when a constrained LDA is a subset of a larger constrained LDA or
the RTO. The supply and demand curves for nested LDAs can be presented in two
different ways to illustrate the market clearing dynamic. The supply curves in the
graphs in this report, unless otherwise noted, show the total internal supply of the LDA,
including all nested LDAs and not including CETL MW. The demand curve is reduced
by the CETL and by the MW that cleared incrementally in the constrained, nested LDAs.
Composition of the Steeply Sloped Portion of the Supply Curve
Table 13 shows the composition of the offers on the steeply sloped portion of the total
RTO supply curve from $35.00 per MW-day up to and including the highest offer of
$722.64 per MW-day. Offers for DR and EE resources were 19.7 percent of the offers
greater than $35.00 per MW-day. Offers for subcritical/supercritical coal units, combined
cycles, oil or gas steam, and combustion turbines made up 80.2 percent of the offers
greater than $35.00 per MW-day.
Short-Term Resource Procurement Target (2.5 Percent Shift in Demand Curve)
Effective for the 2012/2013 Delivery Year, ILR was eliminated. Prior to this, PJM
subtracted the ILR forecast from the reliability requirement. Under the current rules,
application of the Short-Term Resource Procurement Target means that 2.5 percent of
the reliability requirement is removed from the demand curve. The stated rationale is
that this provides for short lead time resource procurement in incremental auctions for
the given delivery year. For the 2016/2017 BRA, the 2.5 percent reduction resulted in the
removal of 4,153.2 MW from the RTO demand curve. For comparison purposes, in the
2011/2012 BRA, removal of the ILR forecast from the reliability requirement resulted in a
reduction in demand of 1,593.8 MW, or 1.2 percent of the reliability requirement of
130,658.7 MW.
Table 14 shows the results if the demand curves had not been reduced by the Short-
Term Resource Procurement Target and everything else had remained the same. All
binding constraints would have remained the same, except that the ATSI Minimum
Extended Summer Resource Requirement would not have been binding. The RTO
clearing price for Limited, Extended Summer, and Annual Resources would have
increased to $85.71 per MW-day, and the clearing quantity would have increased to
© Monitoring Analytics 2014 | www.monitoringanalytics.com 32
172,886.9 MW. The MAAC clearing price for Limited, Extended Summer, and Annual
Resources would have increased to $130.00 per MW-day, and the clearing quantity
would have increased to 68,088.6 MW. The ATSI clearing price for Limited, Extended
Summer, and Annual Resources would have increased to $122.97 per MW-day, and the
clearing quantity would have increased to 8,979.2 MW.
The conclusion is that the removal of 2.5 percent of demand significantly reduced the
clearing prices and quantities for all the RPM LDA markets. The clearing quantities of
Annual Resources, including generation and Annual DR, were reduced as a result of the
2.5 percent demand reduction.
Based on actual auction clearing prices and quantities and make-whole MW, total RPM
market revenues for the 2016/2017 RPM Base Residual Auction were $5,513,237,849. If
the VRR curves had not been reduced by the Short-Term Resource Procurement Target,
total RPM market revenues for the 2016/2017 RPM Base Residual Auction would have
been $6,894,277,704, an increase of $1,381,039,855, or 25 percent, compared to the actual
results. The use of the Short-Term Resource Procurement Target resulted in a 20 percent
reduction in RPM revenues for the 2016/2017 Base Residual Auction.
The MMU recommends that the use of the 2.5 percent demand adjustment be
terminated immediately.78 The 2.5 percent demand reduction is a barrier to entry in the
capacity market for both new generation capacity and new DR capacity. The logic of
reducing demand in a market design that looks three years forward, to permit other
resources to clear in incremental auctions, is not supportable and has no basis in
economics. There are tradeoffs in using a one year forward or a three year forward
design, but the design should be implemented on a consistent basis. Removing a portion
of demand affects prices at the margin, which is where the critical signal to the market is
determined. The proposal to eliminate the Short Term Resource Procurement Target is
not counter to the interests of DR. Most DR clears in the BRA where prices have been
substantially higher than in the incremental auctions. Price suppression is a barrier to
the entry of new Demand Resources in exactly the same way that it is a barrier to the
entry of new generation resources. In the 2016/2017 BRA, the result of reducing demand
by 2.5 percent was to reduce prices in the eastern part of PJM and to reduce the quantity
of capacity purchased in the eastern part of PJM. The result was also to significantly
reduce the clearing price for the RTO market and reducing total payments to capacity by
a significant amount. The 2.5 percent offset was added to permit DR to clear in
incremental auctions. It was not added to counter persistent forecast errors. Forecast
78 See also the Protest of the Independent Market Monitor for PJM, Docket No. ER12-513 (December
22, 2011).

© Monitoring Analytics 2014 | www.monitoringanalytics.com 33
errors should be addressed directly and explicitly for all PJM forecasts. It is essential that
PJM use the same forecasts for capacity markets and for transmission planning to ensure
the long term consistency of RTEP and RPM. To effectively use a lower forecast for
capacity in RPM by reducing demand by an arbitrary 2.5 percent would result in biasing
the overall market results in favor of transmission rather than generation solutions to
reliability issues.
Demand Side Resources in RPM
There are two categories of demand side products included in the RPM market design
for the 2016/2017 BRA:79 80
Demand Resources (DR). Interruptible load resource that is offered in an RPM
Auction as capacity and receives the relevant LDA or RTO resource clearing price.
Energy Efficiency (EE) Resources. Load resources that are offered in an RPM
Auction as capacity and receive the relevant LDA or RTO resource clearing price. An
EE Resource is a project designed to achieve a continuous (during peak periods)
reduction in electric energy consumption during peak periods that is not reflected in
the peak load forecast for the delivery year for which the Energy Efficiency Resource
is proposed, and that is fully implemented at all times during the relevant delivery
year, without any requirement of notice, dispatch, or operator intervention.81 The
peak period definition for the EE Resource type is even more limited than Limited
DR, including only the period from the hour ending 1500 and the hour ending 1800
from June through August, excluding weekends and federal holidays. The EE
Resource type was eligible to be offered in RPM Auctions starting with the 2012/2013
Delivery Year and in incremental auctions in the 2011/2012 Delivery Year.82
79 Effective June 1, 2007, the PJM Active Load Management (ALM) program was replaced by
the PJM Load Management (LM) program. Under ALM, providers had received a MW credit
which offset their capacity obligation. With the introduction of LM, qualifying load
management resources can be offered in RPM Auctions as capacity resources and receive the
clearing price.
80 Interruptible load for reliability (ILR) is an interruptible load resource that is not offered into
the RPM Auction, but receives the final zonal ILR price determined after the second
incremental auction. The ILR product was eliminated as of the 2012/2013 Delivery Year.
81 “Reliability Assurance Agreement Among Load Serving Entities in the PJM Region,”
Schedule 6, Section M.
82 Letter Order in Docket No. ER10-366-000 (January 22, 2010).

© Monitoring Analytics 2014 | www.monitoringanalytics.com 34
Effective with the 2014/2015 Delivery Year, there are three types of Demand Resource
products incorporated in the RPM market design:83 84
Annual DR. Demand Resource that is required to be available on any day in the
relevant delivery year for an unlimited number of interruptions. Annual DR is
required to be capable of maintaining each interruption for at least ten hours during
the hours of 10:00 a.m. to 10:00 p.m. EPT for the period May through October and
6:00 a.m. to 9:00 p.m. EPT for the period November through April.
Extended Summer DR. Demand Resource that is required to be available on any
day from June through October and the following May in the relevant delivery year
for an unlimited number of interruptions. Extended Summer DR is required to be
capable of maintaining each interruption for at least ten hours during the hours of
10:00 a.m. to 10:00 p.m. EPT.
Limited DR. Demand Resource that is required to be available on weekdays not
including NERC holidays during the period of June through September in the
relevant delivery year for up to 10 interruptions. Limited DR is required to be
capable of maintaining each interruption for at least six hours during the hours of
12:00 p.m. to 8:00 p.m. EPT.
Table 15 shows offered and cleared capacity from Demand Resources and Energy
Efficiency Resources in the 2016/2017 RPM Base Residual Auction compared to the
2015/2016 RPM Base Residual Auction. Offers for DR decreased from 19,956.3 MW in the
2015/2016 BRA to 14,507.2 MW in the 2016/2017 BRA, a decrease of 5,449.1 or 27.3
percent.
Table 16 shows offered and cleared MW for Demand Resources by LDA and
offer/product type in the 2016/2017 RPM Base Residual Auction. Of the 5,911.9 MW of
non-coupled DR offers, 4,387.9 MW were for the Limited DR product. Of the possible
DR coupling scenarios, the most frequently used was the Annual, Extended Summer,
and Limited DR coupling group, with from 3,000 to 6,000 MW of DR offered this way.
The fact that most offers were coupled provides evidence that suppliers are willing to
offer a DR product that is almost comparable to generation resources in that it does not
have such significant limitations on availability and that they will offer it at a higher
price, reflecting the fact that such a product has higher costs.
83 134 FERC ¶ 61,066 (2011).
84 “Reliability Assurance Agreement Among Load Serving Entities in the PJM Region,” Article
1. <http://www.pjm.com/~/media/documents/agreements/raa.ashx>
© Monitoring Analytics 2014 | www.monitoringanalytics.com 35
Table 17 shows the weighted average prices for DR by LDA and offer/product type. As
would be expected, given their relative values, for the coupled DR offers, the offers for
Annual DR were greater than the offers for Extended Summer DR which were greater
than the offers for Limited DR. In addition, the Capacity Market Seller must specify a
sell offer price of at least $0.01 per MW-day more for the less limited DR product type
within a coupled segment group.
In the absence of data on the marginal cost of providing DR and EE, it is difficult to
determine whether such resources are offered at levels equal to, greater than or less than
marginal cost. If such resources are offered at prices in excess of marginal cost, the result
would be prices greater than competitive levels. If such resources are offered at prices
less than marginal cost, the result would be prices less than competitive levels. Both
potential outcomes are of significant concern. The RPM rules exempt DR and EE
resources from market power mitigation.
Impact of Inferior DR Product Types
Effective for the 2014/2015 Delivery Year, the RPM market design incorporates Annual
and Extended Summer DR product types, in addition to the previously established
Limited DR product type. Each DR product type is subject to a defined period of
availability, maximum number of interruptions, and maximum duration of
interruptions. The Limited DR and the Extended Summer DR product types are both
inferior to Generation Capacity Resources, because the obligation to deliver associated
with both product types is inferior to the obligation to deliver associated with
Generation Capacity Resources. Generation resources are obligated to provide capacity
every hour of the year if called.
Table 18 shows the results if only generation and Annual DR were offered in the
2016/2017 RPM Base Residual Auction, that is all offers for Extended Summer and
Limited DR products, including those within coupled DR offers, were excluded from
supply. All offers for Annual DR were included in supply, including those in non-
coupled and coupled DR offers. The ATSI import limit would not have been binding.
The RTO clearing price would have increased to $153.74 per MW-day, and the clearing
quantity would have decreased to 167,254.1 MW. The MAAC clearing price would have
increased to $175.00 per MW-day, and the clearing quantity would have decreased to
65,915.3. The PSEG clearing price would have increased to $277.10 per MW-day, and the
clearing quantity would have decreased to 6,200.6 MW. The ATSI clearing price would
have increased to $153.74 per MW-day, and the clearing quantity would have increased
to 9,943.2 MW.
Based on actual auction clearing prices and quantities and make-whole MW, total RPM
market revenues for the 2016/2017 RPM Base Residual Auction were $5,513,237,849. If
only generation and Annual DR were offered in the 2016/2017 RPM Base Residual
Auction, total RPM market revenues for the 2016/2017 RPM Base Residual Auction

© Monitoring Analytics 2014 | www.monitoringanalytics.com 36
would have been $10,141,586,456, an increase of $4,628,348,607, or 84 percent, compared
to the actual results. The inclusion of the Limited and Extended Summer DR products
resulted in a 46 percent reduction in RPM revenues for the 2016/2017 Base Residual
Auction.
While competition from demand side resources improves the functioning of the market,
that is not the result if the demand side resources are not comparable to other capacity
resources. The purpose of demand side participation in RPM is to provide a mechanism
for end-use customers to avoid paying the capacity market clearing price in return for
agreeing to not use capacity when it is needed by customers who have paid for capacity.
The fact that customers providing Limited DR only have to agree to interrupt ten times
per year for a maximum of six hours per interruption represents a flaw in the design of
the program. There is no reason to believe that the customers who pay for capacity will
need the capacity used by participating LM customers only ten times per year or a
maximum of 60 hours per year or only during defined summer hours. In fact, it can be
expected that the probability of needing that capacity will increase with the amount of
MW that participating LM customers clear in the RPM Auctions. This limitation means
that the demand side resources sold in the RPM Auctions are of less value than
generation capacity. As a result, demand side resources could make lower offers than
they would if they offered a comparable resource.
Given the significant impact of demand side resources on the RPM market outcomes,
the MMU recommends that the definition of demand side resources be modified in
order to ensure that such resources provide the same value in the capacity market as
generation resources. Both the Limited and the Extended Summer DR products should
be eliminated in order to ensure that the DR product has the same unlimited obligation
to provide capacity year round as Generation Capacity Resources. As an example, if a
single demand side site could not interrupt more than ten times per year, a Curtailment
Service Provider (CSP) could bundle multiple demand sites to provide unlimited
interruptions. The cost of providing bundled sites would be expected to be greater than
a single site and the offer price of such resources would also be expected to be greater.
Such a modification would help ensure that demand side resources contribute to the
competitiveness of capacity markets rather than suppressing the price below the
competitive level.
Impact of Short-Term Resource Procurement Target and Inferior DR
Product Types
Table 19 shows the results if the VRR curves had not been reduced by the Short-Term
Resource Procurement Target and only generation and Annual DR were offered in the
2016/2017 RPM Base Residual Auction and everything else had remained the same. The
ATSI import limit would not have been binding. The RTO clearing price would have
increased to $243.46 per MW-day, and the clearing quantity would have increased to
169,457.4 MW. The MAAC clearing price would have increased to $266.49 per MW-day,

© Monitoring Analytics 2014 | www.monitoringanalytics.com 37
and the clearing quantity would have slightly increased to 66,546.8 MW. The PSEG
clearing price would have increased to $360.37 per MW-day, and the clearing quantity
would have increased to 6,318.2 MW. The ATSI clearing price would have increased to
$243.46 per MW-day, and the clearing quantity would have increased to 10,329.4 MW.
Based on actual auction clearing prices and quantities and make-whole MW, total RPM
market revenues for the 2016/2017 RPM Base Residual Auction were $5,513,237,849. If
the VRR curves had not been reduced by the Short-Term Resource Procurement Target
and only generation and Annual DR were offered in the 2016/2017 RPM Base Residual
Auction, total RPM market revenues for the 2016/2017 RPM Base Residual Auction
would have been $15,834,365,769, an increase of $10,321,127,920, or 187 percent,
compared to the actual results. The use of the Short-Term Resource Procurement Target
together with the inclusion of the Limited and Extended Summer DR products resulted
in a 65 percent reduction in RPM revenues for the 2016/2017 RPM Base Residual
Auction.
Impact of All DR
Table 20 shows the results if there were no offers for DR in the 2016/2017 RPM Base
Residual Auction and everything else had remained the same. The RTO clearing price
would have increased to $243.79 per MW-day, and the clearing quantity would have
decreased to 165,296.7 MW. The MAAC clearing price would have increased to $279.22
per MW-day, and the clearing quantity would have decreased to 64,723.0 MW. The
PSEG clearing price would have increased to $317.17 per MW-day, and the clearing
quantity would have decreased to 6,132.9 MW. The ATSI import limit would not have
been a binding constraint.
Based on actual auction clearing prices and quantities and make-whole MW, total RPM
market revenues for the 2016/2017 RPM Base Residual Auction were $5,513,237,849. If
there were no offers for DR in the 2016/2017 RPM Base Residual Auction, total RPM
market revenues for the 2016/2017 RPM Base Residual Auction would have been
$15,630,600,107, an increase of $10,117,362,259, or 184 percent, compared to the actual
results. The inclusion of Demand Resources resulted in a 65 percent reduction in RPM
revenues for the 2016/2017 Base Residual Auction.
These impacts combine the appropriate competitive impact of Annual DR with the price
suppressing impacts of the Limited and Summer Unlimited DR products.
Impact of Annual DR
The inclusion of sell offers for Annual DR alone had a significant impact on the auction
results. Based on actual auction clearing prices and quantities and make-whole MW,
total RPM market revenues for the 2016/2017 RPM Base Residual Auction were
$5,513,237,849. If only generation and Annual DR were offered in the 2016/2017 RPM
Base Residual Auction, total RPM market revenues for the 2016/2017 RPM Base Residual

© Monitoring Analytics 2014 | www.monitoringanalytics.com 38
Auction would have been $10,141,586,456. If there were no offers for DR in the 2016/2017
RPM Base Residual Auction, total RPM market revenues for the 2016/2017 RPM Base
Residual Auction would have been $15,630,600,107, an increase of $5,489,013,652, or 54
percent, compared to the results with only Annual DR. The inclusion of sell offers for
Annual DR alone resulted in a 35 percent reduction in RPM revenues for the 2016/2017
RPM Base Residual Auction compared to the revenues without any DR products.
This is the best measure of the competitive impact of DR on the RPM market. The
Annual DR product definition is the only one consistent with being a capacity resource.
Assuming that the DR meets appropriate measurement and verification standards and
that the DR was offered with the intention of providing physical resources, competition
from the Annual DR product resulted in a 35 percent reduction of payments for
capacity. This demonstrates that Annual DR had a significant impact on market
outcomes and resulted in the displacement of generation resources. Thus, even when the
DR product is limited to the Annual DR product, DR has a significant and appropriate
competitive impact on capacity market outcomes. As in prior BRAs, Extended Summer
and Limited DR products also had a significant impact in the 2015/2016 BRA, but those
impacts resulted from badly defined and inferior products.
Impact of Environmental Regulation Compliance
On December 16, 2011, the U.S. Environmental Protection Agency (EPA) issued its
Mercury and Air Toxics Standards rule (MATS), a final rule setting maximum
achievable control technology (MACT) emissions standards for hazardous air pollutants
(HAP) from coal‐ and oil‐fired electric utility steam generating units, pursuant to section
112(d) of the Clean Air Act.85 The rule requires compliance by April 16, 2015.86
The State of New Jersey has separately addressed NOX emissions on peak energy days
with a rule that defines peak energy usage days, referred to as High Electric Demand
Days or HEDD.87 The rule implements performance standards on May 1, 2015, just prior
to the commencement of the 2015/2016 Delivery Year.
85 National Emission Standards for Hazardous Air Pollutants from Coal- and Oil-fired Electric Utility
Steam Generating Units and Standards of Performance for Fossil-Fuel-Fired Electric Utility,
Industrial-Commercial-Institutional, and Small Industrial-Commercial-Institutional Steam
Generating Units, EPA Docket No. EPA-HQ-OAR-2009-0234, 77 Fed. Reg. 9304 (February 16,
2012).
86 Id. at 9465.
87 N.J.A.C. § 7:27–19.

© Monitoring Analytics 2014 | www.monitoringanalytics.com 39
Table 21 shows the results if the APIR associated with environmental regulation
compliance, which were not previously submitted, were removed. All binding
constraints would have remained the same. The RTO clearing price for Limited,
Extended Summer, and Annual Resources would have decreased to $55.00 per MW-day,
and the clearing quantity would have remained the same at 169,159.7 MW, with some
shifting between product types. The MAAC clearing price for Limited, Extended
Summer, and Annual Resources would have decreased to $116.00 per MW-day, and the
clearing quantity would have increased to 66,581.8 MW. The PSEG clearing price and
quantity would have remained the same. The ATSI clearing price for Limited Resources
would have slightly increased to $95.89 per MW-day, and the clearing quantity would
have decreased slightly to 1,001.4 MW.88 The ATSI clearing price for Extended Summer
and Annual Resources would have remained the same at $114.23 per MW-day, and the
clearing quantity would have remained the same, with some shifting between product
types.
Based on actual auction clearing prices and quantities and make-whole MW, total RPM
market revenues for the 2016/2017 RPM Base Residual Auction were $5,513,237,849. If
the APIR associated with the pending environmental regulations which were not
previously submitted were removed, total RPM market revenues for the 2016/2017 RPM
Base Residual Auction would have been $5,310,133,190, a reduction of $203,104,659, or
3.7 percent, compared to the total based on actual results. The impact of including
environmental compliance costs in APIR was to increase total market revenues by
$203,104,659, or 3.8 percent.
Capacity Imports
Generation external to the PJM region is eligible to be offered into an RPM Auction if it
meets specific requirements.89 90 Firm transmission service must be acquired from all
external transmission providers between the unit and border of PJM and generation
deliverability into PJM must be demonstrated prior to the start of the delivery year. In
order to demonstrate generation deliverability into PJM, external generators must obtain
firm point-to-point transmission service on the PJM OASIS from the PJM border into the
88 The difference in the ATSI clearing price may be attributable to differences between the PJM
and MMU calculation of auction outcomes. Attachment A reviews why the MMU calculation
of auction outcomes differs slightly from PJM’s calculation of auction outcomes.
89 See “Reliability Assurance Agreement Among Load Serving Entities in the PJM Region”,
Schedule 9 & 10. <http://www.pjm.com/~/media/documents/agreements/raa.ashx>
90 See PJM. “Manual 18: PJM Capacity Market”, Revision 19 (June 1, 2013), pp. 39-41 & p. 59-60.

© Monitoring Analytics 2014 | www.monitoringanalytics.com 40
PJM transmission system or by obtaining network external designated transmission
service. In the event that transmission upgrades are required to establish deliverability,
those upgrades must be completed by the start of the delivery year. The following are
also required: the external generating unit must be in the resource portfolio of a PJM
member; twelve months of NERC/GADs unit performance data must be provided to
establish an EFORd; the net capability of each unit must be verified through winter and
summer testing; a letter of non-recallability must be provided to assure PJM that the
energy and capacity from the unit is not recallable to any other balancing authority.
All external generation resources that have an RPM commitment or FRR capacity plan
commitment or that are designated as replacement capacity must be offered in the PJM
Day-Ahead Market.91
Planned External Generation Capacity Resources are eligible to be offered into an RPM
Auction if they meet specific requirements.92 93 Planned External Generation Capacity
Resources are proposed Generation Capacity Resources, or a proposed increase in the
capability of an Existing Generation Capacity Resource, that is located outside the PJM
region; participates in the generation interconnection process of a balancing authority
external to PJM; is scheduled to be physically and electrically interconnected to the
transmission facilities of such balancing authority on or before the first day of the
delivery year for which the resource is to be committed to satisfy the reliability
requirements of the PJM Region; and is in full commercial operation prior to the first
day of the delivery year.94 An External Generation Capacity Resource becomes an
Existing Generation Capacity Resource as of the earlier of the date that interconnection
service commences or the resource has cleared an RPM Auction for a prior delivery
year.95
91 OATT, Schedule 1, Section 1.10.1A.
92 See “Reliability Assurance Agreement Among Load Serving Entities in the PJM Region”,
Section 1.69A. <http://www.pjm.com/~/media/documents/agreements/raa.ashx>
93 See PJM. “Manual 18: PJM Capacity Market”, Revision 19 (June 1, 2013), pp. 42-43.
94 Prior to January 31, 2011, capacity modifications to existing generation capacity resources
were not considered planned generation capacity resources. See 134 FERC ¶ 61,065 (2011).
95 Effective January 31, 2011, the RPM rules related to market power mitigation were changed,
including revising the definition for Planned Generation Capacity Resource for purposes of
the must-offer requirement and market power mitigation. See 134 FERC ¶ 61,065 (2011).

© Monitoring Analytics 2014 | www.monitoringanalytics.com 41
Impact of Imports
Table 22 shows the results if import offers for external generation resources in the
2016/2017 RPM Base Residual Auction were reduced by 25 percent. All binding
constraints would have remained the same, except that the RTO Minimum Extended
Summer Resource Requirement would have been a binding constraint. The RTO
clearing price for Limited Resources would have increased to $77.51 per MW-day, and
the clearing quantity would have increased to 10,399.5 MW. The RTO clearing price for
Extended Summer and Annual Resources would have increased to $77.82 per MW-day,
and the clearing quantity would have decreased to 158,512.2 MW. The MAAC clearing
price for Limited Resources would have decreased slightly to $119.12 per MW-day, and
the clearing quantity would have decreased to 4,238.1 MW. The MAAC clearing price
for Extended Summer and Annual Resources would have increased to $119.43 per MW-
day, and the clearing quantity would have increased to 62,308.0 MW. The PSEG clearing
price for Limited Resources would have decreased slightly to $218.69 per MW-day, and
the clearing quantity would have remained the same at 550.4 MW. The PSEG clearing
price for Extended Summer and Annual Resources would have remained the same at
$219.00 per MW-day, and the clearing quantity would have increased slightly to 5,748.7
MW. The ATSI clearing price for Limited Resources would have increased to $95.71 per
MW-day, and the clearing quantity would have decreased slightly to 1,001.6 MW. The
ATSI clearing price for Extended Summer and Annual Resources would have remained
the same at $114.23 per MW-day, and the clearing quantity would have remained the
same at 7,668.1 MW with some shifting between product types.
Based on actual auction clearing prices and quantities and make-whole MW, total RPM
market revenues for the 2016/2017 RPM Base Residual Auction were $5,513,237,849. If
offers for external generation were reduced by 25 percent, total RPM market revenues
for the 2016/2017 RPM Base Residual Auction would have been $6,150,779,857, an
increase of $637,542,008, or 12 percent, compared to the actual results. The impact of
including 75 percent of the offers for external generation resources was to decrease total
market revenues by $637,542,008, or 10 percent.
Table 22 shows the results if offers for external generation resources in the 2016/2017
RPM Base Residual Auction were reduced by 75 percent. The RTO Minimum Extended
Summer Resource Requirement would have been a binding constraint. The MAAC and
ATSI import limits would not have been binding constraints. The RTO clearing price for
Limited Resources would have increased to $117.18 per MW-day, and the clearing
quantity would have decreased to 9,537.9 MW. The RTO clearing price for Extended
Summer and Annual Resources would have increased to $124.00 per MW-day, and the
clearing quantity would have decreased to 158,512.2 MW. The PSEG clearing price for
Limited Resources would have decreased to $212.18 per MW-day, and the clearing
quantity would have decreased to 443.6 MW. The PSEG clearing price for Extended

© Monitoring Analytics 2014 | www.monitoringanalytics.com 42
Summer and Annual Resources would have remained the same at $219.00 per MW-day,
and the clearing quantity would have increased to 5,866.5 MW.
Based on actual auction clearing prices and quantities and make-whole MW, total RPM
market revenues for the 2016/2017 RPM Base Residual Auction were $5,513,237,849. If
offers for external generation were reduced by 75 percent, total RPM market revenues
for the 2016/2017 RPM Base Residual Auction would have been $7,814,811,849, an
increase of $2,301,574,000, or 42 percent, compared to the actual results. The impact of
including 25 percent of the offers for external generation resources was to decrease total
market revenues by $2,301,574,000, or 29 percent.
Of the 7,493.7 MW offered for external generation resources in the 2016/2017 RPM Base
Residual Auction, 2,694.7 MW or 36.0 percent did not have firm transmission at the time
of the auction.96 Table 22 shows the results if offers for external generation resources in
the 2016/2017 RPM Base Residual Auction without firm transmission were excluded. All
binding constraints would have remained the same, except that the RTO Minimum
Extended Summer Resource Requirement would have been a binding constraint. The
RTO clearing price for Limited Resources would have increased to $90.00 per MW-day,
and the clearing quantity would have increased to 10,186.8 MW. The RTO clearing price
for Extended Summer and Annual Resources would have increased to $95.00 per MW-
day, and the clearing quantity would have increased to 158,512.2 MW. The MAAC
clearing price for Limited Resources would have decreased slightly to $119.12 per MW-
day, and the clearing quantity would have decreased to 4,203.9 MW. The MAAC
clearing price for Extended Summer and Annual Resources would have increased to
$124.12 per MW-day, and the clearing quantity would have increased to 62,342.7 MW.
The PSEG clearing price for Limited Resources would have decreased to $214.00 per
MW-day, and the clearing quantity would have remained the same at 550.4 MW. The
PSEG clearing price for Extended Summer and Annual Resources would have remained
the same at $219.00 per MW-day, and the clearing quantity would have increased
slightly to 5,749.0 MW. The ATSI clearing price for Limited Resources would have
decreased to $90.00 per MW-day, and the clearing quantity would have decreased
slightly to 1,002.4 MW. The ATSI clearing price for Extended Summer and Annual
Resources would have remained the same at $114.23 per MW-day, and the clearing
quantity would have remained the same at 7,668.1 MW with some shifting between
product types.
96 The analysis of the impact of capacity import was revised from the IMM Capacity
Deliverability presentation in Docket No. AD12-16, which can be accessed at:
<http://www.monitoringanalytics.com/reports/Presentations/2013/IMM_FERC_Capacity_Deliverabil
ity_20130620.pdf>.

© Monitoring Analytics 2014 | www.monitoringanalytics.com 43
Based on actual auction clearing prices and quantities and make-whole MW, total RPM
market revenues for the 2016/2017 RPM Base Residual Auction were $5,513,237,849. If
offers for external generation resources without firm transmission were excluded, total
RPM market revenues for the 2016/2017 RPM Base Residual Auction would have been
$6,810,335,209, an increase of $1,297,097,360, or 24 percent, compared to the actual
results. The impact of including external generation resources with only firm
transmission was to decrease total market revenues by $1,297,097,360, or 19 percent.

© Monitoring Analytics 2014 | www.monitoringanalytics.com 44
Tables and Figures for RTO Market
Table 6 RTO offer statistics: 2016/2017 RPM Base Residual Auction
ICAP (MW) UCAP (MW)
Percent of
Available
ICAP
Percent of
Available
UCAP
Generation capacity 192,570.5 183,246.8
DR capacity 15,639.1 16,282.2
EE capacity 1,268.5 1,319.1
Total internal RTO capacity 209,478.1 200,848.1
FRR (15,576.6) (14,465.5)
Imports 8,412.2 7,941.5
RPM capacity 202,313.7 194,324.1
Exports (1,218.8) (1,211.6)
FRR optional (2,592.5) (2,225.4)
Excused Existing Generation Capacity Resources (4,389.0) (3,620.6)
Unoffered Planned Generation Capacity Resources (1,541.3) (1,451.1)
Unoffered DR and EE (1,380.1) (1,435.4)
Available 191,192.0 184,380.0 100.0% 100.0%
Generation offered 176,145.3 168,716.0 92.1% 91.5%
DR offered 13,932.9 14,507.2 7.3% 7.9%
EE offered 1,112.6 1,156.8 0.6% 0.6%
Total offered 191,190.8 184,380.0 100.0% 100.0%
Unoffered Existing Generation Capacity Resources 1.2 0.0 0.0% 0.0%
Cleared in RTO 162,028.8 87.9%
Cleared in LDAs 7,130.9 3.9%
Total cleared 169,159.7 91.7%
Make-whole 0.0 0.0%
Uncleared generation 13,081.7 7.1%
Uncleared DR 2,099.1 1.1%
Uncleared EE 39.5 0.0%
Total uncleared 15,220.3 8.3%
Reliability requirement 166,127.5
Total cleared plus make-whole 169,159.7
Short-Term Resource Procurement Target 4,153.2
Net excess/(deficit) 7,185.4
Resource clearing price for Limited Resources ($ per MW-day) $59.37
Resource clearing price for Extended Summer Resources ($ per MW-day) $59.37
Resource clearing price for Annual Resources ($ per MW-day) $59.37
Preliminary zonal capacity price ($ per MW-day) $59.37 A
Base zonal CTR credit rate ($ per MW-day) $0.00 B
Preliminary net load price ($ per MW-day) $59.37 A-B

© Monitoring Analytics 2014 | www.monitoringanalytics.com 45
Table 7 Capacity modifications (ICAP): 2016/2017 RPM Base Residual Auction97
97 Only cap mods and EE mods that had a start date on or before June 1, 2016 and DR plans for
the 2016/2017 Base Residual Auction are included.
RTO MAAC PSEG ATSI
Generation increases 7,407.1 3,526.8 143.6 806.5
Generation decreases (5,130.5) (3,188.8) (375.1) (217.0)
Capacity modifications net increase/(decrease) 2,276.6 338.0 (231.5) 589.5
DR increases 5,739.8 2,007.2 204.2 770.2
DR decreases (16,066.5) (8,254.6) (1,156.1) (1,535.7)
DR net increase/(decrease) (10,326.7) (6,247.4) (951.9) (765.5)
EE increases 603.8 221.6 10.9 199.1
EE decreases (351.9) (80.8) (7.6) (73.7)
EE modifications increase/(decrease) 251.9 140.8 3.3 125.4
EKPC generation 2,746.0
EKPC DR 132.1
EKPC EE 0.0
Net internal capacity increase/(decrease) (4,920.1) (5,768.6) (1,180.1) (50.6)
ICAP (MW)

© Monitoring Analytics 2014 | www.monitoringanalytics.com 46
Table 8 Capacity modifications (UCAP): 2016/2017 RPM Base Residual Auction
RTO MAAC PSEG ATSI
Generation increases 7,189.0 3,392.9 135.6 819.5
Generation decreases (4,293.1) (2,735.1) (329.1) (144.7)
Capacity modifications net increase/(decrease) 2,895.9 657.8 (193.5) 674.8
DR increases 5,971.7 2,087.8 212.5 801.6
DR decreases (16,661.8) (8,560.0) (1,199.1) (1,593.0)
DR net increase/(decrease) (10,690.1) (6,472.2) (986.6) (791.4)
EE increases 626.9 229.1 11.1 207.4
EE decreases (364.4) (83.5) (7.9) (76.4)
EE modifications increase/(decrease) 262.5 145.6 3.2 131.0
Net capacity/DR/EE modifications increase/(decrease) (7,531.7) (5,668.8) (1,176.9) 14.4
EFORd effect 1,039.0 575.2 (0.6) (101.8)
DR and EE effect 47.8 18.4 2.1 5.1
EKPC generation 2,598.2
EKPC DR 137.5
EKPC EE 0.0
Net internal capacity increase/(decrease) (3,709.2) (5,075.2) (1,175.4) (82.3)
UCAP (MW)

© Monitoring Analytics 2014 | www.monitoringanalytics.com 47
Table 9 Cleared MW by zone and resource type/fuel source: 2016/2017 RPM Base
Residual Auction98
Table 10 Uncleared generation offers by technology type and age: 2016/2017 RPM
Base Residual Auction
98 Resources that operate at or above 500 kV may be physically located in a zonal LDA but are
modeled in the parent LDA. For example, 3,433.2 MW of the 9,731.8 cleared MW in the PSEG
Zone were modeled and cleared in the EMAAC LDA.
Zone DR EE Coal Gas Hydroelectric Nuclear Oil Solar Solid Waste Wind Total
AECO 172.3 1.7 444.8 1,717.8 0.0 0.0 176.7 13.3 0.0 0.0 2,526.6
AEP 1,377.2 118.7 6,051.3 7,751.8 74.6 0.0 0.0 0.0 0.0 202.4 15,576.0
AP 684.6 14.4 3,772.7 2,344.5 120.6 0.0 0.0 12.7 0.0 133.7 7,083.2
ATSI 1,811.9 196.6 2,337.7 2,120.9 0.0 2,034.6 170.5 0.0 0.0 0.0 8,672.2
BGE 936.6 124.9 1,937.2 573.0 0.0 1,681.7 647.1 0.0 55.8 0.0 5,956.3
ComEd 1,236.2 426.7 4,241.4 9,004.4 0.0 9,914.6 197.6 0.0 0.0 325.4 25,346.3
DAY 246.8 12.9 2,671.1 1,333.1 108.7 0.0 57.0 0.6 0.0 0.0 4,430.2
DEOK 304.4 5.2 2,394.3 73.6 0.0 0.0 256.4 0.0 0.0 0.0 3,033.9
DLCO 143.1 4.3 636.2 145.7 0.0 1,763.2 13.8 0.0 0.0 0.0 2,706.3
Dominion 1,120.6 28.4 5,090.8 10,429.0 3,398.3 3,575.5 1,695.0 3.2 210.4 0.0 25,551.2
DPL 439.5 21.2 400.4 3,068.5 0.0 0.0 920.0 2.3 0.0 0.0 4,851.9
EKPC 133.1 0.0 1,743.6 724.7 129.9 0.0 0.0 0.0 0.0 0.0 2,731.3
EXT 0.0 0.0 4,051.7 2,914.4 472.3 12.3 0.0 0.0 0.0 32.0 7,482.7
JCPL 222.7 4.9 0.0 2,815.0 387.6 592.3 167.0 14.7 8.9 0.0 4,213.1
Met-Ed 313.6 10.4 112.6 2,061.5 18.4 768.3 222.8 0.0 75.6 0.0 3,583.2
PECO 531.1 11.5 8.1 2,580.5 1,629.0 4,569.4 760.5 1.0 97.1 0.0 10,188.2
PENELEC 431.5 9.9 4,310.2 1,033.1 491.3 0.0 66.8 0.0 40.4 145.4 6,528.6
Pepco 663.9 83.5 2,327.9 1,584.1 0.0 0.0 1,384.6 0.0 49.7 0.0 6,093.7
PPL 998.2 30.2 3,256.2 3,369.3 703.5 2,467.6 1,987.8 5.7 12.8 31.6 12,862.9
PSEG 630.7 11.9 892.9 4,562.5 0.5 3,421.6 11.6 36.3 163.8 0.0 9,731.8
RECO 10.1 0.0 0.0 0.0 0.0 0.0 0.0 0.0 0.0 0.0 10.1
Total 12,408.1 1,117.3 46,681.1 60,207.4 7,534.7 30,801.1 8,735.2 89.8 714.5 870.5 169,159.7
Cleared UCAP (MW)
Technology Type
Less Than or Equal
to 40 Years Old
Greater than 40
Years Old Total
Combined cycle 2,117.3 0.0 2,117.3
Combustion turbine 246.1 72.1 318.2
Oil or gas steam 777.1 134.1 911.2
Subcritical/supercritical coal 2,493.2 7,241.8 9,735.0
Other 0.0 0.0 0.0
Total 5,633.7 7,448.0 13,081.7
Uncleared UCAP (MW)

© Monitoring Analytics 2014 | www.monitoringanalytics.com 48
Table 11 Uncleared generation resources in multiple auctions
Table 12 PJM LDA CETL and CETO Values: 2015/2016 and 2016/2017 RPM Base
Residual Auctions
Table 13 Offers greater than $35.00 per MW-day on total RTO supply curve: 2016/2017
RPM Base Residual Auction99
99 For uncleared coupled DR offers, the offer with the lowest sell offer price within a coupled
Demand Resource group was assumed in the offered capacity values reported.
Technology
Uncleared
UCAP (MW)
Number of
Resources
Uncleared
UCAP (MW)
Number of
Resources
Uncleared
UCAP (MW)
Number of
Resources
Combined cycle 2,117.3 7 670.6 1 0.0 0
Combustion turbine 318.2 15 0.0 0 0.0 0
Oil or gas steam 911.2 7 57.3 2 56.5 2
Subcritical/supercritical coal 9,735.0 27 4,573.6 12 215.5 1
Other 0.0 0 0.0 0 0.0 0
Total 13,081.7 56 5,301.5 15 272.0 3
2016/2017
2015/2016 Results
for Same Set of Resources
2014/2015 Results
for Same Set of Resources
CETL to CETO CETL to CETO
LDA CETO CETL Ratio CETO CETL Ratio MW Percentage MW Percentage
MAAC 100.0 6,156.0 6156% 5,220.0 6,495.0 124% 5,120.0 5,120% 339.0 6%
EMAAC 3,860.0 9,177.0 238% 6,140.0 8,916.0 145% 2,280.0 59% (261.0) (3%)
SWMAAC 4,720.0 8,373.0 177% 5,840.0 8,786.0 150% 1,120.0 24% 413.0 5%
PSEG 4,600.0 6,220.0 135% 6,450.0 6,581.0 102% 1,850.0 40% 361.0 6%
PSEG North 2,240.0 2,972.0 133% 2,450.0 2,936.0 120% 210.0 9% (36.0) (1%)
DPL South 1,510.0 1,822.0 121% 1,580.0 1,901.0 120% 70.0 5% 79.0 4%
Pepco 3,380.0 6,522.0 193% 2,730.0 6,846.0 251% (650.0) (19%) 324.0 5%
ATSI 5,280.0 5,417.8 103% 5,390.0 7,881.0 146% 110.0 2% 2,463.2 45%
ATSI Cleveland NA NA NA 3,800.0 5,245.0 138% NA NA NA NA
2015/2016 2016/2017 Change
CETO CETL
Technology/Resource Type Offered UCAP (MW) Percent of Offers
Subcritical/supercritical coal 14,384.7 50.5%
Demand Resource coupled 4,476.9 15.7%
Combined cycle 3,225.8 11.3%
Oil or gas steam 2,953.2 10.4%
Combustion turbine 2,284.7 8.0%
Demand Resource non-coupled 1,093.8 3.8%
Other generation 43.8 0.2%
Energy Efficiency Resource 41.7 0.1%
Total 28,504.6 100.0%

© Monitoring Analytics 2014 | www.monitoringanalytics.com 49
Table 14 Impact of Short-Term Resource Procurement Target: 2016/2017 RPM Base
Residual Auction
LDA Product Type
Clearing Prices
($ per MW-day)
Cleared UCAP
(MW)
Clearing Prices
($ per MW-day)
Cleared UCAP
(MW)
RTO Limited $59.37 9,849.5 $85.71 11,299.8
Extended Summer $59.37 2,470.0 $85.71 1,987.8
Annual $59.37 156,840.2 $85.71 159,599.3
MAAC Limited $119.13 4,264.3 $130.00 4,610.9
Extended Summer $119.13 1,053.4 $130.00 851.3
Annual $119.13 61,228.7 $130.00 62,626.4
PSEG Limited $219.00 550.4 $239.90 593.6
Extended Summer $219.00 61.8 $239.90 22.2
Annual $219.00 5,686.4 $239.90 5,936.4
ATSI Limited $94.45 1,004.1 $122.97 1,311.1
Extended Summer $114.23 799.3 $122.97 519.2
Annual $114.23 6,868.8 $122.97 7,148.9
Actual Auction ResultsNo Short-Term Resource
Procurement Target Reduction

© Monitoring Analytics 2014 | www.monitoringanalytics.com 50
Table 15 DR and EE statistics by LDA: 2015/2016 and 2016/2017 RPM Base Residual
Auctions100 101
100 The maximum capacity within a coupled Demand Resource group was assumed in the
offered capacity values reported.
101 ATSI Cleveland was not a modeled LDA in the 2015/2016 BRA.
LDA Resource Type
Offered
ICAP (MW)
Offered
UCAP (MW)
Cleared
UCAP (MW)
Offered
ICAP (MW)
Offered
UCAP (MW)
Cleared
UCAP (MW) MW Percentage MW Percentage MW Percentage
RTO DR 19,243.6 19,956.3 14,832.8 13,932.9 14,507.2 12,408.1 (5,310.7) (27.6%) (5,449.1) (27.3%) (2,424.7) (16.3%)
RTO EE 907.8 940.3 922.5 1,112.6 1,156.8 1,117.3 204.8 22.6% 216.5 23.0% 194.8 21.1%
MAAC DR 8,835.9 9,163.3 6,648.7 5,477.4 5,703.5 5,350.2 (3,358.5) (38.0%) (3,459.8) (37.8%) (1,298.5) (19.5%)
MAAC EE 229.1 237.2 222.6 318.5 330.9 310.1 89.4 39.0% 93.7 39.5% 87.5 39.3%
EMAAC DR 3,736.6 3,874.9 2,610.4 2,069.5 2,155.0 2,006.4 (1,667.1) (44.6%) (1,719.9) (44.4%) (604.0) (23.1%)
EMAAC EE 48.9 50.5 42.2 62.1 64.1 51.2 13.2 27.0% 13.6 26.9% 9.0 21.3%
SWMAAC DR 2,212.6 2,295.2 2,009.1 1,588.1 1,653.8 1,600.5 (624.5) (28.2%) (641.4) (27.9%) (408.6) (20.3%)
SWMAAC EE 154.2 159.8 159.4 200.3 208.6 208.4 46.1 29.9% 48.8 30.5% 49.0 30.7%
DPL South DR 127.2 131.9 86.3 119.1 124.0 105.7 (8.1) (6.4%) (7.9) (6.0%) 19.4 22.5%
DPL South EE 0.0 0.0 0.0 0.7 0.7 0.6 0.7 NA 0.7 NA 0.6 NA
PSEG DR 1,043.2 1,081.9 796.1 610.9 636.5 630.7 (432.3) (41.4%) (445.4) (41.2%) (165.4) (20.8%)
PSEG EE 11.6 11.9 10.7 14.6 14.9 11.9 3.0 25.9% 3.0 25.2% 1.2 11.2%
PSEG North DR 353.3 366.5 263.3 218.8 228.2 226.6 (134.5) (38.1%) (138.3) (37.7%) (36.7) (13.9%)
PSEG North EE 3.4 3.5 3.1 4.1 4.1 3.1 0.7 20.6% 0.6 17.1% 0.0 0.0%
Pepco DR 931.7 966.4 867.4 656.4 683.8 663.9 (275.3) (29.5%) (282.6) (29.2%) (203.5) (23.5%)
Pepco EE 54.2 56.2 55.8 80.3 83.7 83.5 26.1 48.2% 27.5 48.9% 27.7 49.6%
ATSI DR 1,965.7 2,038.5 1,763.7 1,844.7 1,920.7 1,811.9 (121.0) (6.2%) (117.8) (5.8%) 48.2 2.7%
ATSI EE 46.5 48.1 44.9 191.2 198.9 196.6 144.7 311.2% 150.8 313.5% 151.7 337.9%
ATSI Cleveland DR NA NA NA 473.4 492.8 468.7 NA NA NA NA NA NA
ATSI Cleveland EE NA NA NA 50.8 52.8 52.6 NA NA NA NA NA NA
Offered ICAP Offered UCAP Cleared UCAP
2015/2016 BRA 2016/2017 BRA Change

© Monitoring Analytics 2014 | www.monitoringanalytics.com 51
Table 16 Offered and cleared DR by LDA and offer/product type: 2016/2017 RPM Base
Residual Auction
LDA Offer Type Product Type(s) Annual
Extended
Summer Limited Annual
Extended
Summer Limited
RTO Non-coupled Annual 90.3 0.0 0.0 88.6 0.0 0.0
RTO Non-coupled Extended Summer 0.0 1,433.7 0.0 0.0 1,433.7 0.0
RTO Non-coupled Limited 0.0 0.0 4,387.9 0.0 0.0 4,210.5
RTO Coupled Annual and Extended Summer 0.0 0.0 0.0 0.0 0.0 0.0
RTO Coupled Annual and Limited 0.0 0.0 0.0 0.0 0.0 0.0
RTO Coupled Extended Summer and Limited 0.0 1,853.4 2,111.0 0.0 246.5 1,258.8
RTO Coupled Annual, Extended Summer, and Limited 2,995.6 6,147.7 6,044.3 0.0 789.8 4,380.2
MAAC Non-coupled Annual 33.2 0.0 0.0 32.5 0.0 0.0
MAAC Non-coupled Extended Summer 0.0 663.9 0.0 0.0 663.9 0.0
MAAC Non-coupled Limited 0.0 0.0 1,417.7 0.0 0.0 1,402.0
MAAC Coupled Annual and Extended Summer 0.0 0.0 0.0 0.0 0.0 0.0
MAAC Coupled Annual and Limited 0.0 0.0 0.0 0.0 0.0 0.0
MAAC Coupled Extended Summer and Limited 0.0 764.1 900.3 0.0 9.1 856.2
MAAC Coupled Annual, Extended Summer, and Limited 1,507.6 2,529.8 2,448.6 0.0 380.4 2,006.1
PSEG Non-coupled Annual 18.5 0.0 0.0 18.5 0.0 0.0
PSEG Non-coupled Extended Summer 0.0 0.0 0.0 0.0 0.0 0.0
PSEG Non-coupled Limited 0.0 0.0 257.7 0.0 0.0 257.7
PSEG Coupled Annual and Extended Summer 0.0 0.0 0.0 0.0 0.0 0.0
PSEG Coupled Annual and Limited 0.0 0.0 0.0 0.0 0.0 0.0
PSEG Coupled Extended Summer and Limited 0.0 75.3 97.4 0.0 0.7 96.8
PSEG Coupled Annual, Extended Summer, and Limited 157.8 239.8 239.1 0.0 61.1 195.9
ATSI Non-coupled Annual 8.5 0.0 0.0 8.5 0.0 0.0
ATSI Non-coupled Extended Summer 0.0 152.5 0.0 0.0 152.5 0.0
ATSI Non-coupled Limited 0.0 0.0 496.8 0.0 0.0 413.9
ATSI Coupled Annual and Extended Summer 0.0 0.0 0.0 0.0 0.0 0.0
ATSI Coupled Annual and Limited 0.0 0.0 0.0 0.0 0.0 0.0
ATSI Coupled Extended Summer and Limited 0.0 248.9 258.6 0.0 237.4 12.4
ATSI Coupled Annual, Extended Summer, and Limited 245.0 886.7 826.7 0.0 409.4 577.8
Offered UCAP (MW) Cleared UCAP (MW)

© Monitoring Analytics 2014 | www.monitoringanalytics.com 52
Table 17 Weighted-average sell offer prices for DR by LDA and offer/product type:
2016/2017 RPM Base Residual Auction
LDA Offer Type Product Type(s) Annual
Extended
Summer Limited
RTO Non-coupled Annual $21.67
RTO Non-coupled Extended Summer $5.36
RTO Non-coupled Limited $27.95
RTO Coupled Annual and Extended Summer
RTO Coupled Annual and Limited
RTO Coupled Extended Summer and Limited $74.08 $60.11
RTO Coupled Annual, Extended Summer, and Limited $79.35 $64.95 $46.89
MAAC Non-coupled Annual $55.47
MAAC Non-coupled Extended Summer $0.84
MAAC Non-coupled Limited $38.99
MAAC Coupled Annual and Extended Summer
MAAC Coupled Annual and Limited
MAAC Coupled Extended Summer and Limited $84.47 $66.52
MAAC Coupled Annual, Extended Summer, and Limited $77.69 $63.17 $40.99
PSEG Non-coupled Annual $90.89
PSEG Non-coupled Extended Summer
PSEG Non-coupled Limited $27.18
PSEG Coupled Annual and Extended Summer
PSEG Coupled Annual and Limited
PSEG Coupled Extended Summer and Limited $79.74 $65.29
PSEG Coupled Annual, Extended Summer, and Limited $85.18 $70.24 $56.78
ATSI Non-coupled Annual $0.00
ATSI Non-coupled Extended Summer $0.00
ATSI Non-coupled Limited $44.50
ATSI Coupled Annual and Extended Summer
ATSI Coupled Annual and Limited
ATSI Coupled Extended Summer and Limited $64.36 $56.67
ATSI Coupled Annual, Extended Summer, and Limited $61.32 $48.28 $32.27
Weighted-Average ($ per MW-day UCAP)

© Monitoring Analytics 2014 | www.monitoringanalytics.com 53
Table 18 Impact of DR product types: 2016/2017 RPM Base Residual Auction
Table 19 Impact of Short Term Resource Procurement Target and DR product types:
2016/2017 RPM Base Residual Auction
LDA Product Type
Clearing Prices
($ per MW-day)
Cleared UCAP
(MW)
Clearing Prices
($ per MW-day)
Cleared UCAP
(MW)
RTO Limited $59.37 9,849.5
Extended Summer $59.37 2,470.0
Annual $59.37 156,840.2 $153.74 167,254.1
MAAC Limited $119.13 4,264.3
Extended Summer $119.13 1,053.4
Annual $119.13 61,228.7 $175.00 65,915.3
PSEG Limited $219.00 550.4
Extended Summer $219.00 61.8
Annual $219.00 5,686.4 $277.10 6,200.6
ATSI Limited $94.45 1,004.1
Extended Summer $114.23 799.3
Annual $114.23 6,868.8 $153.74 9,943.2
Actual Auction Results Annual Resources Only
LDA Product Type
Clearing Prices
($ per MW-day)
Cleared UCAP
(MW)
Clearing Prices
($ per MW-day)
Cleared UCAP
(MW)
RTO Limited $59.37 9,849.5
Extended Summer $59.37 2,470.0
Annual $59.37 156,840.2 $243.46 169,457.4
MAAC Limited $119.13 4,264.3
Extended Summer $119.13 1,053.4
Annual $119.13 61,228.7 $266.49 66,546.8
PSEG Limited $219.00 550.4
Extended Summer $219.00 61.8
Annual $219.00 5,686.4 $360.37 6,318.2
ATSI Limited $94.45 1,004.1
Extended Summer $114.23 799.3
Annual $114.23 6,868.8 $243.46 10,329.4
Actual Auction Results
No Short-Term Resource
Procurement Target Reduction
and Annual Resources Only

© Monitoring Analytics 2014 | www.monitoringanalytics.com 54
Table 20 Impact of DR: 2016/2017 RPM Base Residual Auction
Table 21 Impact of environmental regulations: 2016/2017 RPM Base Residual Auction
LDA Product Type
Clearing Prices
($ per MW-day)
Cleared UCAP
(MW)
Clearing Prices
($ per MW-day)
Cleared UCAP
(MW)
RTO Limited $59.37 9,849.5
Extended Summer $59.37 2,470.0
Annual $59.37 156,840.2 $243.79 165,296.7
MAAC Limited $119.13 4,264.3
Extended Summer $119.13 1,053.4
Annual $119.13 61,228.7 $279.22 64,723.0
PSEG Limited $219.00 550.4
Extended Summer $219.00 61.8
Annual $219.00 5,686.4 $317.17 6,132.9
ATSI Limited $94.45 1,004.1
Extended Summer $114.23 799.3
Annual $114.23 6,868.8 $243.79 9,879.7
Actual Auction Results No Offers for DR
LDA Product Type
Clearing Prices
($ per MW-day)
Cleared UCAP
(MW)
Clearing Prices
($ per MW-day)
Cleared UCAP
(MW)
RTO Limited $59.37 9,849.5 $55.00 9,967.2
Extended Summer $59.37 2,470.0 $55.00 2,310.1
Annual $59.37 156,840.2 $55.00 156,882.4
MAAC Limited $119.13 4,264.3 $116.00 4,402.5
Extended Summer $119.13 1,053.4 $116.00 893.7
Annual $119.13 61,228.7 $116.00 61,285.6
PSEG Limited $219.00 550.4 $219.00 586.8
Extended Summer $219.00 61.8 $219.00 25.4
Annual $219.00 5,686.4 $219.00 5,686.4
ATSI Limited $94.45 1,004.1 $95.89 1,001.4
Extended Summer $114.23 799.3 $114.23 799.1
Annual $114.23 6,868.8 $114.23 6,869.0
Actual Auction ResultsRemove APIR Associated with
Environmental Regulations
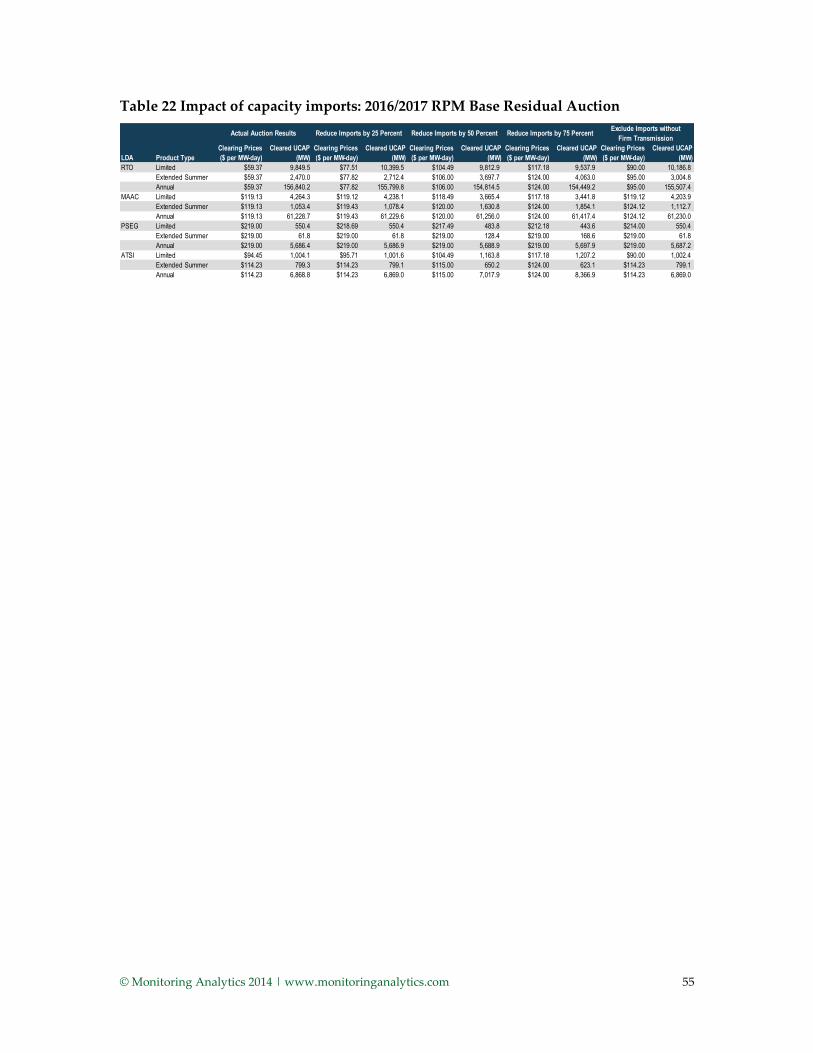
© Monitoring Analytics 2014 | www.monitoringanalytics.com 55
Table 22 Impact of capacity imports: 2016/2017 RPM Base Residual Auction
LDA Product Type
Clearing Prices
($ per MW-day)
Cleared UCAP
(MW)
Clearing Prices
($ per MW-day)
Cleared UCAP
(MW)
Clearing Prices
($ per MW-day)
Cleared UCAP
(MW)
Clearing Prices
($ per MW-day)
Cleared UCAP
(MW)
Clearing Prices
($ per MW-day)
Cleared UCAP
(MW)
RTO Limited $59.37 9,849.5 $77.51 10,399.5 $104.49 9,812.9 $117.18 9,537.9 $90.00 10,186.8
Extended Summer $59.37 2,470.0 $77.82 2,712.4 $106.00 3,697.7 $124.00 4,063.0 $95.00 3,004.8
Annual $59.37 156,840.2 $77.82 155,799.8 $106.00 154,814.5 $124.00 154,449.2 $95.00 155,507.4
MAAC Limited $119.13 4,264.3 $119.12 4,238.1 $118.49 3,665.4 $117.18 3,441.8 $119.12 4,203.9
Extended Summer $119.13 1,053.4 $119.43 1,078.4 $120.00 1,630.8 $124.00 1,854.1 $124.12 1,112.7
Annual $119.13 61,228.7 $119.43 61,229.6 $120.00 61,256.0 $124.00 61,417.4 $124.12 61,230.0
PSEG Limited $219.00 550.4 $218.69 550.4 $217.49 483.8 $212.18 443.6 $214.00 550.4
Extended Summer $219.00 61.8 $219.00 61.8 $219.00 128.4 $219.00 168.6 $219.00 61.8
Annual $219.00 5,686.4 $219.00 5,686.9 $219.00 5,688.9 $219.00 5,697.9 $219.00 5,687.2
ATSI Limited $94.45 1,004.1 $95.71 1,001.6 $104.49 1,163.8 $117.18 1,207.2 $90.00 1,002.4
Extended Summer $114.23 799.3 $114.23 799.1 $115.00 650.2 $124.00 623.1 $114.23 799.1
Annual $114.23 6,868.8 $114.23 6,869.0 $115.00 7,017.9 $124.00 8,366.9 $114.23 6,869.0
Actual Auction Results Reduce Imports by 25 Percent Reduce Imports by 50 Percent Reduce Imports by 75 PercentExclude Imports without
Firm Transmission

© Monitoring Analytics 2014 | www.monitoringanalytics.com 56
Figure 1 RTO market supply/demand curves: 2016/2017 RPM Base Residual Auction102
103 104
102 The supply curves presented in this report have all been smoothed using a statistical
technique that fits a smooth curve to the underlying supply curve data while ensuring that
the point of intersection between supply and demand curves is at the market clearing price.
The supply curve includes all offered MW while the prices on the supply curve reflect the
smoothing method. The final points on the supply curves generally do not match the price of
the highest price offer as a result of the statistical fitting technique, while the MW do match.
The smoothed curves are provided consistent with a FERC decision related to the release of
RPM data. See, e.g., Motions to Cease and Desist and for Shortened Answer Period of the
Independent Market Monitor for PJM (March 25, 2010) and Answer of PJM Interconnection,
L.L.C. to Motion to Cease and Desist (March 30, 2010), filed in Docket No. ER09-1063-000, -
003.
103 For uncleared coupled DR offers, the offer with the lowest sell offer price within a coupled
Demand Resource group was assumed in graphing the supply curve. The VRR curve
excludes incremental demand which cleared in MAAC, PSEG, and ATSI.
104 The Minimum Extended Summer Resource Requirement and the Minimum Annual Resource
Requirement were not binding constraints in RTO in the 2016/2017 RPM Base Residual
Auction.
$0
$100
$200
$300
$400
$500
$600
0 20,000 40,000 60,000 80,000 100,000 120,000 140,000 160,000 180,000 200,000
$ pe
r M
W-d
ay
Capacity (Unforced MW)
Variable Resource Requirement
Annual, Extended Summer, and Limited Supply
Annual, Extended Summer, and Limited Clearing Price

© Monitoring Analytics 2014 | www.monitoringanalytics.com 57
MAAC Market Results
Table 23 shows total MAAC offer data for the 2016/2017 RPM Base Residual Auction. All
MW values stated in the MAAC section include all LDAs nested within MAAC. Total
internal MAAC unforced capacity of 74,717.9 MW includes all Generation Capacity
Resources, Demand Resources, and Energy Efficiency Resources that qualified as PJM
Capacity Resources, excludes external units, and also includes owners’ modifications to
ICAP ratings (cap mods). As shown in Table 8, MAAC unforced internal capacity
decreased 5,075.2 MW from 79,793.1 MW in the 2015/2016 BRA as a result of net
generation capacity modifications (657.8 MW), net DR modifications (-6,472.2 MW), and
net EE modifications (145.6 MW), the EFORd effect due to lower sell offer EFORds (575.2
MW), and the DR and EE effect due to a higher Load Management UCAP conversion
factor (18.4 MW).
All imports offered in the auction from areas external to PJM are modeled as supply in
the RTO, so total MAAC RPM capacity was the same as the internal capacity of 74,717.9
MW.105 RPM capacity was reduced by 674.0 MW of exports, 677.0 MW of Planned
Generation Capacity Resources which were not subject to the RPM must offer
requirement, and 1,397.7 MW excused from the RPM must offer requirement. The
excused Existing Generation Capacity Resources were the result of plans for retirement
(1,381.9 MW) and significant physical operational restrictions (15.8 MW). Subtracting
361.7 MW of DR and EE not offered resulted in available unforced capacity in MAAC of
71,607.5 MW.106 After accounting for the above exceptions, 0.0 MW in MAAC were not
offered in the RPM Auction.
The MAAC LDA import limit was a binding constraint in the 2016/2017 BRA. Of the
66,546.4 MW cleared in MAAC, 61,003.6 MW were cleared in the RTO before MAAC
became constrained. Once the constraint was binding, based on the 6,495.0 MW CETL
value, only the incremental supply located in MAAC was available to meet the
incremental demand in the LDA. Of the incremental supply, 5,542.8 MW cleared, which
resulted in a clearing price for Limited, Extended Summer, and Annual Resources of
$119.13 per MW-day, as shown in Figure 2. The clearing price was determined by the
intersection of the incremental supply and VRR Curve.
The Minimum Extended Summer Resource Requirement and Minimum Annual
Resource Requirement were not binding constraints for MAAC in the 2016/2017 BRA,
105 PJM. “Manual 18: PJM Capacity Market,” Revision 19 (June 1, 2013), p. 41.
106 Unoffered DR and EE MW include PJM approved DR and EE modifications that were not
offered in the auction.

© Monitoring Analytics 2014 | www.monitoringanalytics.com 58
and as a result Extended Summer and Annual Resources in MAAC received a clearing
price of $119.13 per MW-day.
Table and Figures for MAAC
Table 23 MAAC offer statistics: 2016/2017 RPM Base Residual Auction
ICAP (MW) UCAP (MW)
Percent of
Available
ICAP
Percent of
Available
UCAP
Generation capacity 70,834.4 68,321.8
DR capacity 5,774.7 6,012.0
EE capacity 369.9 384.1
Total internal MAAC capacity 76,979.0 74,717.9
FRR 0.0 0.0
Imports 0.0 0.0
RPM capacity 76,979.0 74,717.9
Exports (674.0) (674.0)
FRR optional 0.0 0.0
Excused Existing Generation Capacity Resources (1,514.8) (1,397.7)
Unoffered Planned Generation Capacity Resources (710.5) (677.0)
Unoffered DR and EE (348.7) (361.7)
Available 73,731.0 71,607.5 100.0% 100.0%
Generation offered 67,933.9 65,573.1 92.1% 91.6%
DR offered 5,477.4 5,703.5 7.4% 8.0%
EE offered 318.5 330.9 0.4% 0.5%
Total offered 73,729.8 71,607.5 100.0% 100.0%
Unoffered 1.2 0.0 0.0% 0.0%
Cleared in RTO 61,003.6 85.2%
Cleared in MAAC 4,606.4 6.4%
Cleared in PSEG 936.4 1.3%
Total cleared 66,546.4 92.9%
Make-whole 0.0 0.0%
Reliability requirement 72,299.0
Total cleared plus make-whole 66,546.4
CETL 6,495.0
Total Resources 73,041.4
Short-Term Resource Procurement Target 1,664.7
Net excess/(deficit) 2,407.1
Resource clearing price for Limited Resources ($ per MW-day) $119.13
Resource clearing price for Extended Summer Resources ($ per MW-day) $119.13
Resource clearing price for Annual Resources ($ per MW-day) $119.13
Preliminary zonal capacity price ($ per MW-day) $119.13 A
Base zonal CTR credit rate ($ per MW-day) $0.24 B
Preliminary net load price ($ per MW-day) $118.89 A-B

© Monitoring Analytics 2014 | www.monitoringanalytics.com 59
Figure 2 MAAC market supply/demand curves: 2016/2017 RPM Base Residual
Auction107 108
PSEG LDA Market Results
Table 24 shows total PSEG LDA offer data for the 2016/2017 RPM Base Residual
Auction. Total internal PSEG LDA unforced capacity of 8,343.1 MW includes all
Generation Capacity Resources, Demand Resources, and Energy Efficiency Resources
that qualified as PJM Capacity Resources, excludes external units, and also includes
owners’ modifications to ICAP ratings. As shown in Table 8, PSEG LDA unforced
internal capacity decreased 1,175.4 MW from 9,518.5 MW in the 2015/2016 BRA as a
107 For uncleared coupled DR offers, the offer with the lowest sell offer price within a coupled
Demand Resource group was assumed in graphing the supply curve. The VRR curve is
reduced by the CETL.
108 The Minimum Extended Summer Resource Requirement and the Minimum Annual Resource
Requirement were not binding constraints in MAAC in the 2016/2017 RPM Base Residual
Auction.
$0
$100
$200
$300
$400
$500
0 10,000 20,000 30,000 40,000 50,000 60,000 70,000 80,000
$ pe
r M
W-d
ay
Capacity (Unforced MW)
Variable Resource Requirement
Annual, Extended Summer, and Limited Supply
Annual, Extended Summer, and Limited Clearing Price

© Monitoring Analytics 2014 | www.monitoringanalytics.com 60
result of net generation capacity modifications (-193.5 MW), net DR modifications (-986.6
MW), and net EE modifications (3.2 MW), the EFORd effect due to higher sell offer
EFORds (-0.6 MW), and the DR and EE effect due to a higher Load Management UCAP
conversion factor (2.1 MW).
All imports offered in the auction from areas external to PJM are modeled as supply in
the RTO, so total PSEG LDA RPM capacity was the same as the internal capacity of
8,343.1 MW. There were no exports from PSEG LDA. RPM capacity was reduced by
161.4 MW of Planned Generation Capacity Resources which were not subject to the RPM
must offer requirement and 1,381.9 MW excused from the RPM must offer requirement.
The excused Existing Generation Capacity Resources were the result of plans for
retirement (1,381.9 MW). Subtracting 15.5 MW of DR and EE not offered resulted in
available unforced capacity in PSEG LDA of 6,784.3 MW.109 After accounting for these
exceptions, all capacity resources in PSEG were offered in the RPM Auction.
The PSEG LDA import limit was a binding constraint in the 2015/2016 BRA. Of the
6,298.6 MW cleared in PSEG LDA, 5,163.7 MW were cleared in the RTO and an
additional 198.5 MW cleared in MAAC before PSEG LDA became constrained. Once the
constraint was binding, based on the 6,581.0 MW CETL value, only the incremental
supply located in PSEG LDA was available to meet the incremental demand in the LDA.
Of the incremental supply, 936.4 MW cleared, which resulted in a clearing price for
Limited, Extended Summer, and Annual Resources of $219.00 per MW-day, as shown in
Figure 3. The clearing price was determined by the intersection of the incremental
supply and VRR curve.
The Minimum Annual Resource Requirement and Minimum Annual Resource
Requirement were not binding constraints for PSEG LDA in the 2016/2017 BRA, and as a
result Extended Summer and Annual Resources in PSEG LDA received a clearing price
of $219.00 per MW-day.
109 Unoffered DR and EE MW include PJM approved DR and EE modifications that were not
offered in the auction.

© Monitoring Analytics 2014 | www.monitoringanalytics.com 61
Table and Figures for PSEG LDA
Table 24 PSEG LDA offer statistics: 2016/2017 RPM Base Residual Auction
ICAP (MW) UCAP (MW)
Percent of
Available
ICAP
Percent of
Available
UCAP
Generation capacity 8,076.4 7,676.2
DR capacity 625.9 651.7
EE capacity 14.9 15.2
Total internal PSEG capacity 8,717.2 8,343.1
FRR 0.0 0.0
Imports 0.0 0.0
RPM capacity 8,717.2 8,343.1
Exports 0.0 0.0
FRR optional 0.0 0.0
Excused Existing Generation Capacity Resources (1,492.6) (1,381.9)
Unoffered Planned Generation Capacity Resources (178.0) (161.4)
Unoffered DR and EE (15.3) (15.5)
Available 7,031.3 6,784.3 100.0% 100.0%
Generation offered 6,405.8 6,132.9 91.1% 90.4%
DR offered 610.9 636.5 8.7% 9.4%
EE offered 14.6 14.9 0.2% 0.2%
Total offered 7,031.3 6,784.3 100.0% 100.0%
Unoffered 0.0 0.0 0.0% 0.0%
Cleared in RTO 5,163.7 76.1%
Cleared in MAAC 198.5
Cleared in PSEG 936.4 13.8%
Total cleared 6,298.6 89.9%
Make-whole 0.0 0.0%
Reliability requirement 12,870.0
Total cleared plus make-whole 6,298.6
CETL 6,581.0
Total Resources 12,879.6
Short-Term Resource Procurement Target 288.9
Net excess/(deficit) 298.5
Resource clearing price for Limited Resources ($ per MW-day) $219.00
Resource clearing price for Extended Summer Resources ($ per MW-day) $219.00
Resource clearing price for Annual Resources ($ per MW-day) $219.00
Preliminary zonal capacity price ($ per MW-day) $219.00 A
Base zonal CTR credit rate ($ per MW-day) $41.39 B
Preliminary net load price ($ per MW-day) $177.61 A-B

© Monitoring Analytics 2014 | www.monitoringanalytics.com 62
Figure 3 PSEG LDA market supply/demand curves: 2016/2017 RPM Base Residual
Auction110 111
ATSI Market Results
Table 25 shows total ATSI offer data for the 2016/2017 RPM Base Residual Auction. Total
internal ATSI unforced capacity of 14,325.2 MW includes all Generation Capacity
Resources, Demand Resources, and Energy Efficiency Resources that qualified as PJM
Capacity Resources, excludes external units, and also includes owners’ modifications to
ICAP ratings. As shown in Table 8, ATSI unforced internal capacity decreased 82.3 MW
from 14,407.5 MW in the 2015/2016 BRA as a result of net generation capacity
110 For uncleared coupled DR offers, the offer with the lowest sell offer price within a coupled
Demand Resource group was assumed in graphing the supply curve. The VRR curve is
reduced by the CETL.
111 The Minimum Extended Summer Resource Requirement and the Minimum Annual Resource
Requirement were not binding constraints in PSEG in the 2016/2017 RPM Base Residual
Auction.
$0
$100
$200
$300
$400
$500
$600
0 1,000 2,000 3,000 4,000 5,000 6,000 7,000 8,000
$ pe
r M
W-d
ay
Capacity (Unforced MW)
Variable Resource Requirement
Annual, Extended Summer, and Limited Supply
Annual, Extended Summer, and Limited Clearing Price

© Monitoring Analytics 2014 | www.monitoringanalytics.com 63
modifications (674.8 MW), net DR modifications (-791.4 MW), and net EE modifications
(131.0 MW), the EFORd effect due to higher sell offer EFORds (-101.8 MW), and the DR
and EE effect due to a higher Load Management UCAP conversion factor (5.1 MW).
All imports offered in the auction from areas external to PJM are modeled as supply in
the RTO, so total ATSI RPM capacity was the same as the internal capacity of 14,325.2
MW. There were no exports from ATSI. RPM capacity was reduced by 773.4 MW of
Planned Generation Capacity Resources which were not subject to the RPM must offer
requirement and 632.0 MW excused from the RPM must offer requirement. The excused
Existing Generation Capacity Resources were the result of plans for retirement (632.0
MW). Subtracting 128.5 MW of DR and EE not offered, resulted in available unforced
capacity in ATSI of 12,791.3 MW.112 After accounting for these exceptions, all capacity
resources in ATSI were offered in the RPM Auction.
The ATSI LDA import limit was a binding constraint in the 2016/2017 BRA. Of the
8,672.2 MW cleared in ATSI, 7,084.1 MW were cleared in the RTO before ATSI became
constrained. Once the constraint was binding, based on the 7,881.0 MW CETL value,
only the incremental supply located in ATSI was available to meet the incremental
demand in the LDA. Of the incremental supply, 1,588.1 MW cleared, which resulted in a
clearing price for Limited Resources of $94.45 per MW-day, as shown in Figure 4. The
clearing price was determined by the intersection of the incremental supply and VRR
curve.
PJM’s auction clearing mechanism will also result in a higher price for Extended
Summer Resources if the MW of Extended Summer Resources that would otherwise
clear the auction are less than the Minimum Extended Summer Resource Requirement
that PJM requires for reliability. In that case the auction clearing mechanism will select
Extended Summer Resources that are more expensive than the clearing price that would
otherwise result in order to procure the defined minimum resource requirements for the
Extended Summer product. This is referred as the Minimum Extended Summer
Resource Requirement being a binding constraint.
The Minimum Extended Summer Resource Requirement was a binding constraint for
ATSI in the 2016/2017 BRA, and as a result Extended Summer Resources in ATSI
received a clearing price of $114.23 per MW-day. The Minimum Annual Resource
Requirement was not a binding constraint in the 2016/2017 BRA, and as a result Annual
Resources in ATSI received a clearing price of $114.23 per MW-day
112 Unoffered DR and EE MW include PJM approved DR and EE modifications that were not
offered in the auction.
© Monitoring Analytics 2014 | www.monitoringanalytics.com 64
Table and Figure for ATSI
Table 25 ATSI offer statistics: 2016/2017 RPM Base Residual Auction
ICAP (MW) UCAP (MW)
Percent of
Available
ICAP
Percent of
Available
UCAP
Generation capacity 12,746.1 12,077.1
DR capacity 1,958.4 2,038.9
EE capacity 200.9 209.2
Total internal ATSI capacity 14,905.4 14,325.2
FRR 0.0 0.0
Imports 0.0 0.0
RPM capacity 14,905.4 14,325.2
Exports 0.0 0.0
FRR optional 0.0 0.0
Excused Existing Generation Capacity Resources (727.0) (632.0)
Unoffered Planned Generation Capacity Resources (830.0) (773.4)
Unoffered DR and EE (123.4) (128.5)
Available 13,225.0 12,791.3 100.0% 100.0%
Generation offered 11,189.1 10,671.7 84.6% 83.4%
DR offered 1,844.7 1,920.7 13.9% 15.0%
EE offered 191.2 198.9 1.4% 1.6%
Total offered 13,225.0 12,791.3 100.0% 100.0%
Unoffered 0.0 0.0 0.0% 0.0%
Cleared in RTO 7,084.1 55.4%
Cleared in ATSI 1,588.1 12.4%
Total cleared 8,672.2 67.8%
Make-whole 0.0 0.0%
Reliability requirement 16,255.0
Total cleared plus make-whole 8,672.2
CETL 7,881.0
Total Resources 16,553.2
Short-Term Resource Procurement Target 362.4
Net excess/(deficit) 660.6
Resource clearing price for Limited Resources ($ per MW-day) $94.45
Resource clearing price for Extended Summer Resources ($ per MW-day) $114.23
Resource clearing price for Annual Resources ($ per MW-day) $114.23
Preliminary zonal capacity price ($ per MW-day) $104.48 A
Base zonal CTR credit rate ($ per MW-day) $13.94 B
Preliminary net load price ($ per MW-day) $90.54 A-B

© Monitoring Analytics 2014 | www.monitoringanalytics.com 65
Figure 4 ATSI market supply/demand curves: 2016/2017 RPM Base Residual
Auction113 114
113 For uncleared coupled DR offers, the offer with the lowest sell offer price within a coupled
Demand Resource group was assumed in graphing the supply curve. The VRR curve is
reduced by the CETL.
114 The Minimum Annual Resource Requirement was not a binding constraint in ATSI in the
2016/2017 RPM Base Residual Auction.
$0
$100
$200
$300
$400
$500
$600
0 2,000 4,000 6,000 8,000 10,000 12,000 14,000
$ pe
r M
W-d
ay
Capacity (Unforced MW)
Variable Resource Requirement
Limited Supply and Uncleared Annual and Extended Summer Supply
Limited Clearing Price
Minimum Extended Summer Resource Requirement
Annual and Extended Summer Supply
Annual and Extended Summer Clearing Price

© Monitoring Analytics 2014 | www.monitoringanalytics.com 66
Attachment A Clearing Algorithm for RPM Base Residual Auction
The actual clearing of the RPM Base Residual Auction uses a mixed integer optimization
algorithm. The purpose of the algorithm is to minimize the cost of procuring unforced
capacity given all applicable requirements and constraints, including transmission limits
between LDAs, restrictions on coupled sell offers and restrictions specified in credit
limited offers.115 The optimization algorithm calculates clearing prices, which are
derived from the shadow prices of the binding minimum resource requirements.
In the BRA, the locational requirement to purchase capacity takes the form of a
downward sloping piece-wise linear demand curve called the Variable Resource
Requirement (VRR) curve. The VRR curve defines the maximum price for a given level
of capacity procurement within each of the constrained LDAs. In the nested LDA
structure, the capacity procured towards meeting a child LDA’s Variable Resource
Requirement also satisfies the nested parent LDA’s Variable Resource Requirement. A
part of the capacity procured for the parent LDA may be transferred to the child LDA up
to the defined Capacity Emergency Transfer Limit (CETL) between the parent LDA and
the child LDA. For a child LDA, when a CETL constraint binds and limits imports from
the parent LDA, higher priced offers that would not clear in an unconstrained market
are required to meet demand in the child LDA. The result is a constrained price for the
child LDA which is higher than the price for the parent LDA. Accordingly, the shadow
price associated with this constraint, called the locational price adder, should accurately
account for the additional cost of meeting the internal requirement for capacity.
Implementing this constraint for a nested LDA structure, while preserving the linearity
of the optimization problem, poses a particular computational challenge.
The RPM algorithm co-optimizes the cost of procuring a child LDA’s and the parent
LDA’s capacity to meet their respective Variable Resource Requirements. Since the
capacity procured for the child LDA jointly satisfies its own and its parent LDA’s VRR,
the parent LDA’s VRR curve needs to be reconfigured to take into account the child
LDA’s cleared capacity. Any such reconfiguration may result in a different solution for
the child LDA. In the RPM algorithm, the mixed integer optimization problem is solved
iteratively, where after every iteration, the parent LDAs’ VRR curves are reconfigured to
reflect their respective child LDAs’ cleared capacity. The process is repeated until an
equilibrium point is reached. The method preserves the mixed integer feature of the
115 OATT Attachment DD § 5.12(a).

© Monitoring Analytics 2014 | www.monitoringanalytics.com 67
optimization problem while allowing for incorporation of the minimum resource
requirements. Under this approach, the price adders are directly obtained as shadow
prices of the import limit constraints. Accordingly, the price adders for annual and
extended summer resources are obtained from the shadow prices associated with the
respective binding minimum resource requirement constraints.
In the BRA, Capacity Market Sellers are allowed to specify a minimum bound for the
unforced capacity on the resource offered into the auction. If any such inflexible offers
emerge as marginal or close to being marginal, the RPM algorithm relaxes the minimum
bound on those offers and re-solves the optimization, thus allowing those offers to clear
below the specified lower bound. In the BRA, any resource that cleared below their
specified minimum bound receives a make whole payment for the shortfall between the
minimum bound and the unconstrained cleared MW, at the clearing price. The
alternative to clearing an inflexible offer may result in clearing of higher priced offers to
satisfy the applicable resource requirements. The RPM algorithm explicitly compares
solutions with make-whole against solutions without make-whole payments to arrive at
the optimal solution.
Possible Reasons for Differences between PJM and MMU Solutions
It is possible for the MMU’s solution to the BRA optimization problem to differ from
PJM’s solution although these differences are usually small. The following are some of
the reasons which may contribute to the difference between the MMU’s solution and
PJM’s solution:
1. Optimization Tolerance: All mixed integer programming solvers use numerical
methods to determine the optimal solution. These methods are of finite arithmetic
precision. Therefore, the search path and eventually the final solution depend on the
chosen tolerance levels. In general, tighter tolerance levels are associated with longer
computational times. One of the tolerance criteria used by mixed integer
programming solvers is specified as a limit on the execution time. It is possible for
solutions to diverge slightly, even with identical resource limit criteria, due to
differences in the speed of the computers on which the solver is run.
2. Algorithm: The solution approach involves iteratively solving a mixed integer
problem to locate the optimal solution given all the applicable business rules. The
tolerance of the criteria used to evaluate feasible solutions in the iterative approach is
also likely to affect the final solution. PJM did not provide the MMU with all the
tolerances of all the criteria used to clear the market.
3. Non-unique solution: It is possible for the BRA optimization problem to have non-
unique solutions. Identical inputs could result in slightly different solutions with
exactly the same objective value within the chosen tolerance levels.

© Monitoring Analytics 2014 | www.monitoringanalytics.com 68
Comparison of PJM and MMU Solutions
The results of the 2016/2017 RPM Base Residual Auction conducted by PJM were
replicated using the MMU’s approach. The total MW cleared for every nested LDA
using the MMU’s algorithm is within 0.015 percent of the corresponding total MW
cleared under PJM’s method. The clearing prices using the MMU’s approach are within
1.5 percent of the corresponding clearing prices under PJM’s method.
Recommendations
The MMU recommends two changes to the RPM solution methodology that address
make-whole payments and the iterative reconfiguration of the VRR curve. These
changes will result in a simpler approach to the optimization problem, which will
improve the stability, transparency, and manageability of the RPM market clearing.
The RPM solution method does not explicitly include the cost of make-whole payments
in its objective function. Instead, the model handles inflexible offers as part of an
iterative process and make-whole payments are determined at the end. Because the
additional make-whole payments are excluded from the optimization objective function,
the model does not optimally balance the system to accommodate the extra cost and the
extra MW of make-whole payments as part of the optimization. The MMU recommends
changing the RPM solution methodology to explicitly incorporate the cost of make-
whole payments in the objective function. The model would be able to choose the lower
cost option of an inflexible offer and a higher priced flexible offer. The MMU’s testing
has shown that the proposed approach solves as fast and results in a better solution
defined by overall system benefit.
PJM’s RPM model maintains a nested LDA structure, in which the capacity procured
towards meeting a child LDA’s VRR also satisfies the nested parent LDA’s VRR. To
respect this relationship, the mixed integer optimization problem is solved iteratively,
where after every iteration, the parent LDAs’ VRR curves are reconfigured to reflect
their respective child LDAs’ cleared capacity. The process is repeated until a
convergence point, based on the difference in cleared capacity for each LDA from one
iteration to the next, is reached. The purpose of the iterative approach is to jointly
optimize the cost of procuring a child LDA’s and the parent LDA’s capacity to meet their
respective VRRs. However, the joint optimization can be accomplished more efficiently
with a simultaneous rather than an iterative approach by defining variables for the
nesting relationships. The MMU recommends changing the RPM solution methodology
to define variables for the nesting relationships in the BRA optimization model directly
rather than employing the current iterative approach, in order to improve the efficiency
and stability of the solution.

© Monitoring Analytics 2014 | www.monitoringanalytics.com 69
Illustration of BRA Clearing Algorithm
The objective function in the auction optimization algorithm is to maximize the area
between the RTO VRR curve and the supply curve while simultaneously satisfying the
LDA import limits and minimum resource requirements. The objective ensures that the
total cost of procurement is minimized while the highest offer cleared, bounded by the
VRR curve, sets the clearing price. The auction clearing process is equivalent to choosing
the price and quantity that maximize total welfare, where the VRR curve is the demand
curve and capacity offers are the supply curve.
Figure 5 and Figure 6 show an example child VRR and parent VRR curves. To illustrate
the price formation in the BRA, two example scenarios are presented. In the first
scenario, a higher CETL is assumed between the parent LDA and the child LDA. In the
second scenario, a lower CETL is assumed between the parent LDA and the child LDA.
All other offers and parameters are identical in the two scenarios. In both scenarios, only
one type of resource and only one requirement are considered.116
Figure 7 and Figure 8 illustrate the solution for the first scenario. Only 189.1 MW of the
available 300 MW CETL is utilized. Therefore the CETL constraint is non-binding and
out of merit offers are not needed to meet the child LDA’s Variable Resource
Requirement. The marginal clearing price for both the parent and child LDA is $120.00.
Figure 9 and Figure 10 illustrate the solution for the second scenario. The only difference
between first and second scenarios is that the CETL is 150 MW in the second scenario
compared to 300 MW in the first scenario. The solution shows that the entire 150 MW
available is utilized by the child LDA to import capacity from the parent LDA. Out of
merit, higher price offers, relative to the ones cleared for the parent LDA, are needed to
meet the Variable Resource Requirement of the child LDA. The shadow price of the
binding CETL constraint, $13.30 per MW-day, reflects the tradeoff between a clearing a
resource from child LDA against clearing a resource from the parent LDA. The marginal
clearing prices of the parent LDA and the child LDA are $106.70 and $120.00 per MW-
day respectively.
116 For simplicity, the minimum annual resource requirement and minimum summer extended
resource requirement constraints are not included.

© Monitoring Analytics 2014 | www.monitoringanalytics.com 70
Figure 5 Variable Resource Requirement Curve: Child LDA
Figure 6 Nested Variable Resource Requirement Curve: Parent LDA
$0
$50
$100
$150
$200
0 200 400 600 800 1,000 1,200 1,400 1,600
$ pe
r M
W-d
ay
Capacity (Unforced MW)
$0
$50
$100
$150
$200
0 200 400 600 800 1,000 1,200 1,400 1,600
$ pe
r M
W-d
ay
Capacity (Unforced MW)

© Monitoring Analytics 2014 | www.monitoringanalytics.com 71
Figure 7 Optimal solution for scenario 1: Child LDA
Figure 8 Optimal solution for scenario 1: Parent LDA
$0
$50
$100
$150
$200
0 200 400 600 800 1,000 1,200 1,400 1,600
$ pe
r M
W-d
ay
Capacity (Unforced MW)
Imports from parent LDA(189.1 MW out of available 300 MW CETL)
Clearing Price: $120.00
$0
$50
$100
$150
$200
0 200 400 600 800 1,000 1,200 1,400 1,600
$ pe
r M
W-d
ay
Capacity (Unforced MW)
Child LDA's cleared VRR, net of imports
Clearing Price: $120.00

© Monitoring Analytics 2014 | www.monitoringanalytics.com 72
Figure 9 Optimal solution for scenario 2: Child LDA
Figure 10 Optimal solution for scenario 2: Parent LDA
$0
$50
$100
$150
$200
0 200 400 600 800 1,000 1,200 1,400 1,600
$ pe
r M
W-d
ay
Capacity (Unforced MW)
Imports from parent LDA(150 MW out of available 150 MW CETL)
Clearing Price: $120.00
$0
$50
$100
$150
$200
0 200 400 600 800 1,000 1,200 1,400 1,600
$ pe
r M
W-d
ay
Capacity (Unforced MW)
Child LDA's cleared VRR, net of imports
Clearing Price: $106.70


![Laundry Care Plus Added-value commercial machines · Max. spin speed [max. rpm] 1400 g-factor/residual moisture [%] 526/49 Electrical connection 1N AC 230V, 50 Hz, 13 A • Water](https://img.pdfslide.us/doc/110x75/5f49e6b96a20492b4c022ecd/laundry-care-plus-added-value-commercial-machines-max-spin-speed-max-rpm-1400.jpg)