Embed Size (px)
Citation preview
Copyright © 2015 By S&C Messina. All Rights Reserved.
Analysis of the 1965 Berkshire Hathaway Shareholder Letter
• Financial & Valuation Summary • 1965 – The Times They Are a-Changin' • Yet, Some Things Never Change • The 1965 Shareholder Letter
1. New Representation of Earnings Power 2. Earnings Finally Positive, But Not All Roses 3. Liquidity, Liquidity, Liquidity 4. Outlook 5. Financials 6. Public Filings
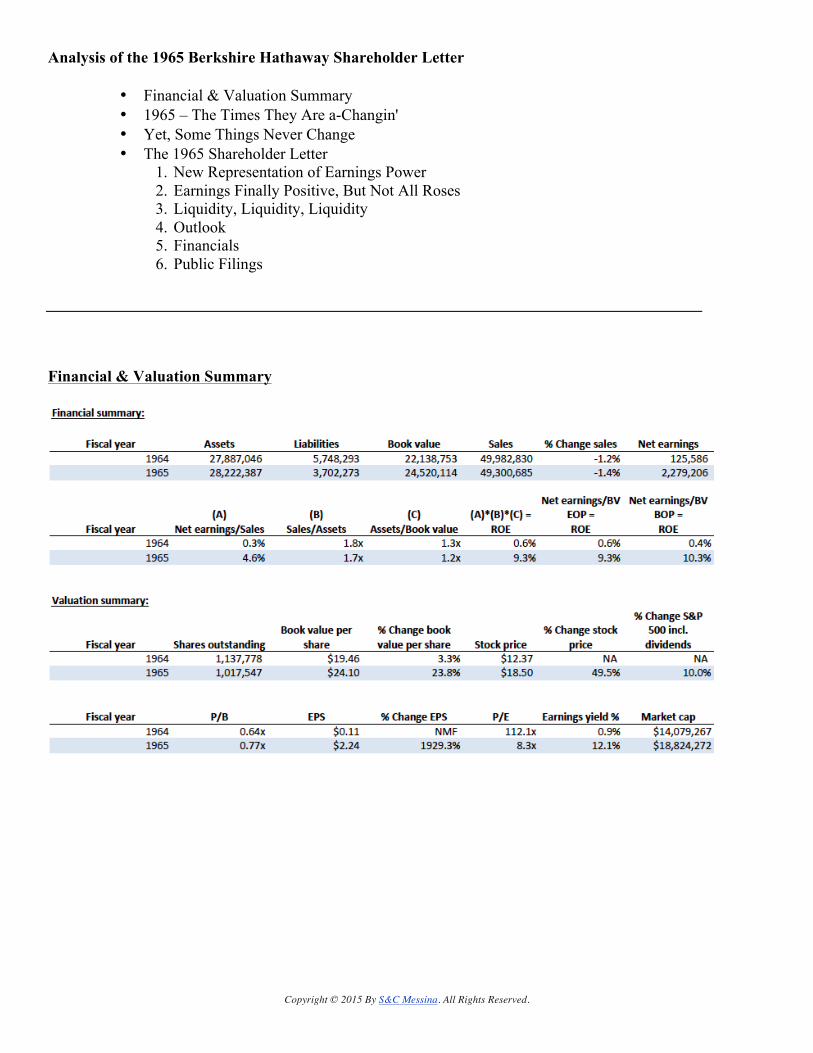
Financial & Valuation Summary
Copyright © 2015 by S&C Messina. All Rights Reserved. 2
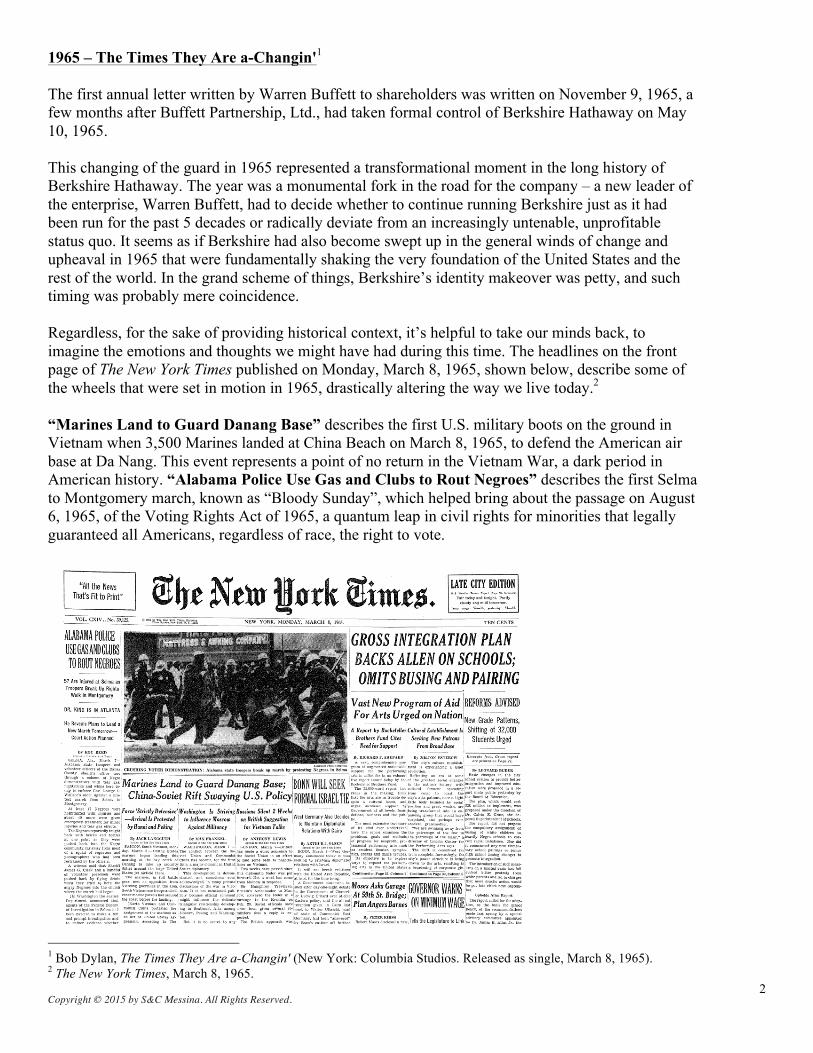
1965 – The Times They Are a-Changin'1 The first annual letter written by Warren Buffett to shareholders was written on November 9, 1965, a few months after Buffett Partnership, Ltd., had taken formal control of Berkshire Hathaway on May 10, 1965. This changing of the guard in 1965 represented a transformational moment in the long history of Berkshire Hathaway. The year was a monumental fork in the road for the company – a new leader of the enterprise, Warren Buffett, had to decide whether to continue running Berkshire just as it had been run for the past 5 decades or radically deviate from an increasingly untenable, unprofitable status quo. It seems as if Berkshire had also become swept up in the general winds of change and upheaval in 1965 that were fundamentally shaking the very foundation of the United States and the rest of the world. In the grand scheme of things, Berkshire’s identity makeover was petty, and such timing was probably mere coincidence. Regardless, for the sake of providing historical context, it’s helpful to take our minds back, to imagine the emotions and thoughts we might have had during this time. The headlines on the front page of The New York Times published on Monday, March 8, 1965, shown below, describe some of the wheels that were set in motion in 1965, drastically altering the way we live today.2 “Marines Land to Guard Danang Base” describes the first U.S. military boots on the ground in Vietnam when 3,500 Marines landed at China Beach on March 8, 1965, to defend the American air base at Da Nang. This event represents a point of no return in the Vietnam War, a dark period in American history. “Alabama Police Use Gas and Clubs to Rout Negroes” describes the first Selma to Montgomery march, known as “Bloody Sunday”, which helped bring about the passage on August 6, 1965, of the Voting Rights Act of 1965, a quantum leap in civil rights for minorities that legally guaranteed all Americans, regardless of race, the right to vote.
1 Bob Dylan, The Times They Are a-Changin' (New York: Columbia Studios. Released as single, March 8, 1965). 2 The New York Times, March 8, 1965.
Copyright © 2015 by S&C Messina. All Rights Reserved. 3
Yet, Some Things Never Change
Even though the world may have been brewing with uncertainty and upheaval similar to that which filled the air in 1965, when going through the annual letters to Berkshire Hathaway shareholders, our method of understanding the insurance and float generation strategy of Berkshire will mirror that of Buffett’s approach when analyzing potential investments. That is, we won’t pre-occupy ourselves with distractions occurring on the macro stage in a given year. We will take a bottoms-up approach by focusing on the fundamentals of Berkshire itself. Buffett elaborates on this bottoms-up approach in the 1994 shareholder letter and directly references the Vietnam War that had rapidly escalated in 1965, 30 years earlier:
We will continue to ignore political and economic forecasts, which are an expensive distraction for many investors and businessmen. Thirty years ago, no one could have foreseen the huge expansion of the Vietnam War, wage and price controls, two oil shocks, the resignation of a president, the dissolution of the Soviet Union, a one-day drop in the Dow of 508 points, or treasury bill yields fluctuating between 2.8% and 17.4%. But, surprise - none of these blockbuster events made the slightest dent in Ben Graham's investment principles. Nor did they render unsound the negotiated purchases of fine businesses at sensible prices. Imagine the cost to us, then, if we had let a fear of unknowns cause us to defer or alter the deployment of capital. Indeed, we have usually made our best purchases when apprehensions about some macro event were at a peak. Fear is the foe of the faddist, but the friend of the fundamentalist.3 [emphasis added]
When looking at Berkshire itself, while we will be using Ben Graham’s investment principles and Charlie Munger’s approach of buying fine businesses at sensible prices, we will be applying this bottoms-up approach on capital flows going in the opposite direction. In other words, Ben Graham and Charlie Munger are talking about your money going out to pay for future cash flows coming in. We will be exploring other people’s money coming in to pay for future cash flows going out (i.e. insurance premiums coming in to fund claims payments going out; other forms of float). Graham and Munger’s concepts still apply; margin of safety between the price paid and value received and the power of compounding are just as applicable when analyzing other people’s money coming in to pay for future cash flows going out. Since the first insurance company is not acquired until 1967, we won’t be delving into this latter concept until our analysis of the 1967 annual letter. But for now, let’s dive into the 1965 shareholder letter. The 1965 Shareholder Letter The 1965 shareholder letter is only one page, so it’s very short. But there are some interesting themes that stand out. 1. New Representation of Earnings Power Immediately in the first sentence of the letter, there is something a little odd. The comparable net earnings figure from the prior year, 1964, was changed: 3 Warren E. Buffett, 1994 Chairman’s Letter (Berkshire Hathaway 1994 Annual Report: 1995).
Copyright © 2015 by S&C Messina. All Rights Reserved. 4
The fiscal year ended October 2, 1965, resulted in net earnings of $2,279,206 as compared to net earnings of $125,586 for the prior year.4
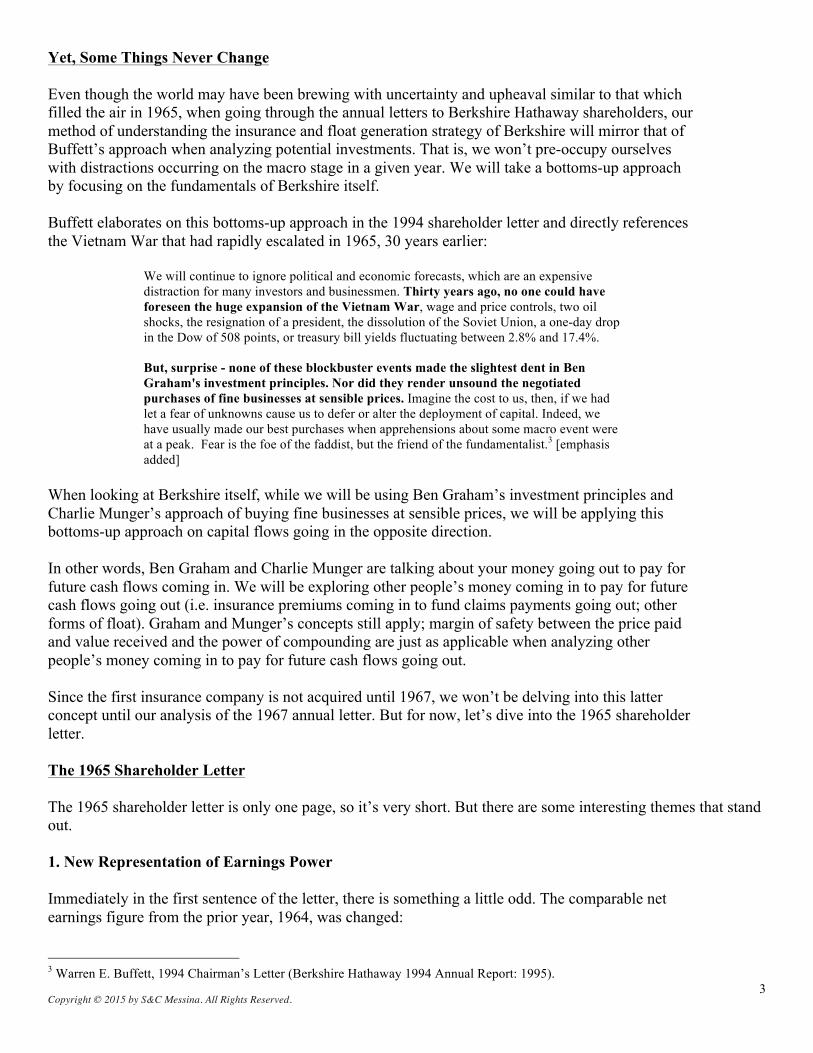
Net earnings for 1964 were reported as $125,586 in the 1965 shareholder letter. However, if we look at the 1964 shareholder letter, as shown below, the net earnings figure for Berkshire when it was run under previous management was reported higher at $175,586.
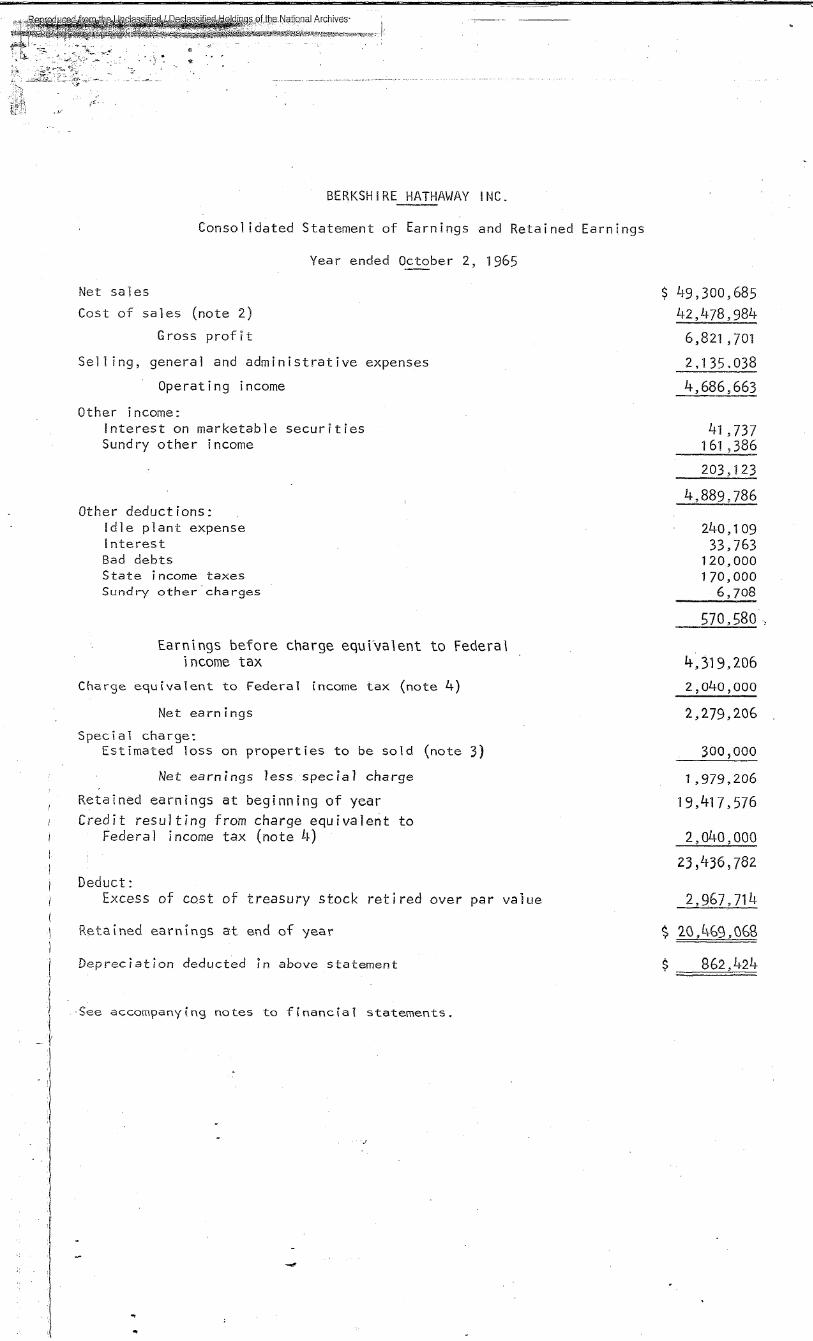
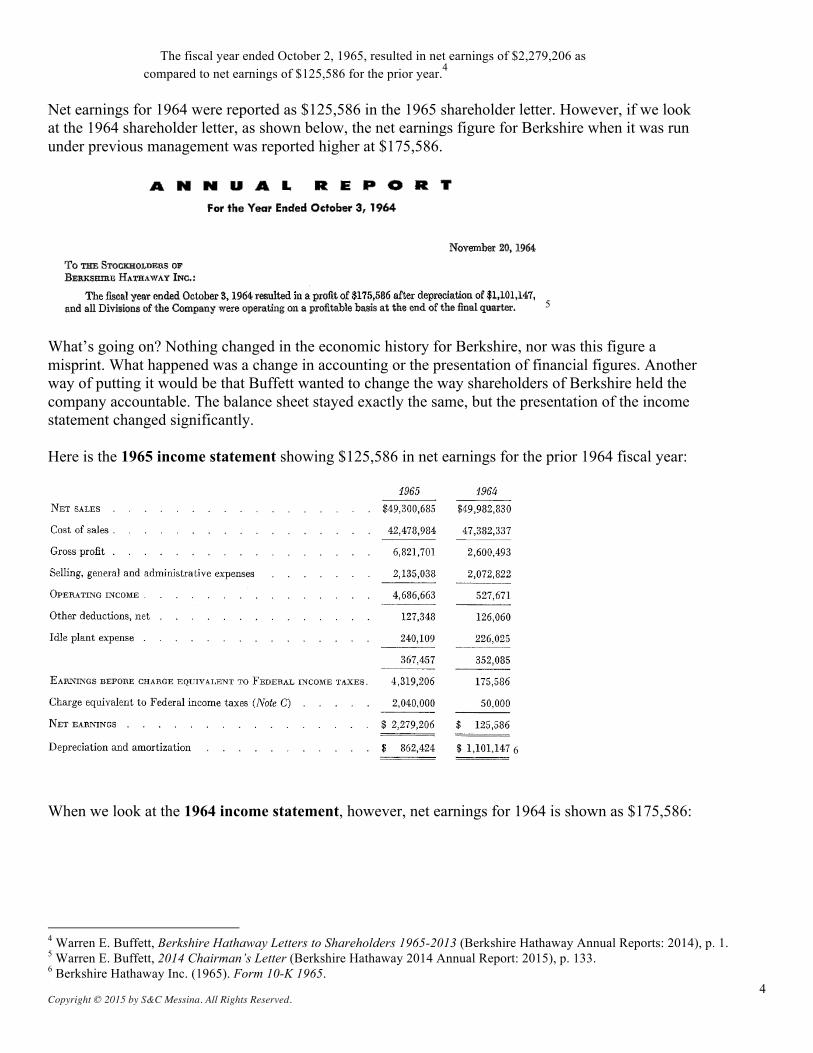
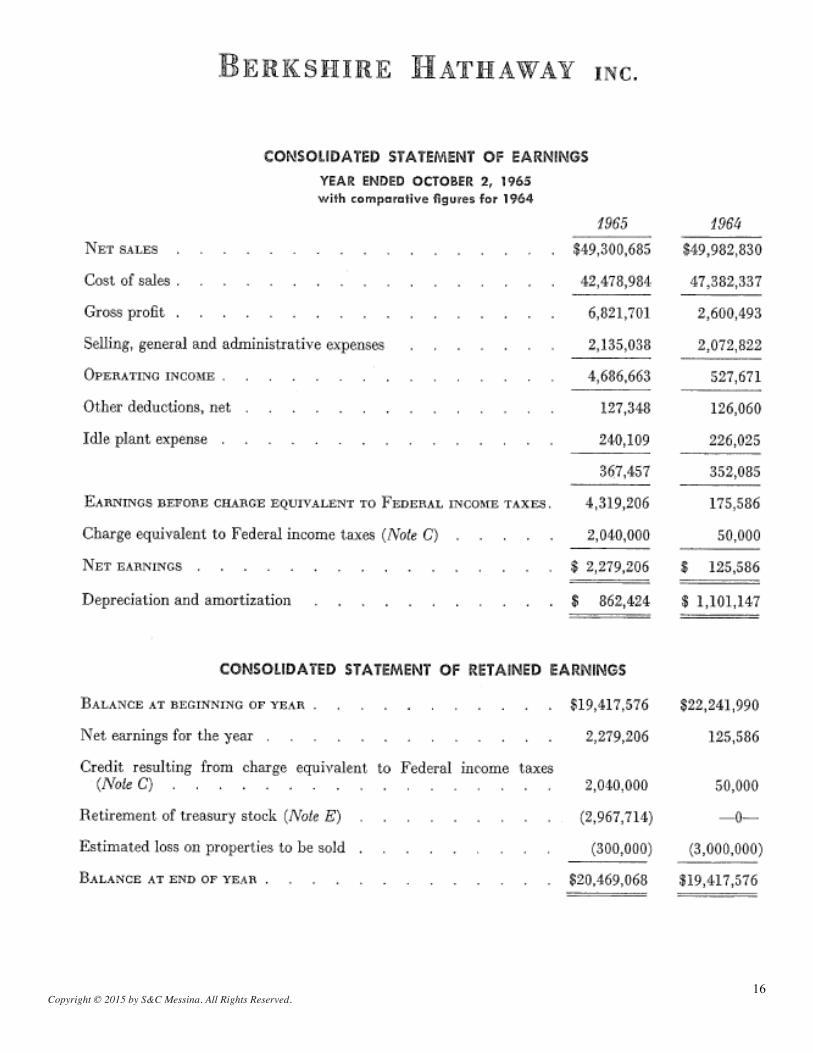
5 What’s going on? Nothing changed in the economic history for Berkshire, nor was this figure a misprint. What happened was a change in accounting or the presentation of financial figures. Another way of putting it would be that Buffett wanted to change the way shareholders of Berkshire held the company accountable. The balance sheet stayed exactly the same, but the presentation of the income statement changed significantly. Here is the 1965 income statement showing $125,586 in net earnings for the prior 1964 fiscal year:
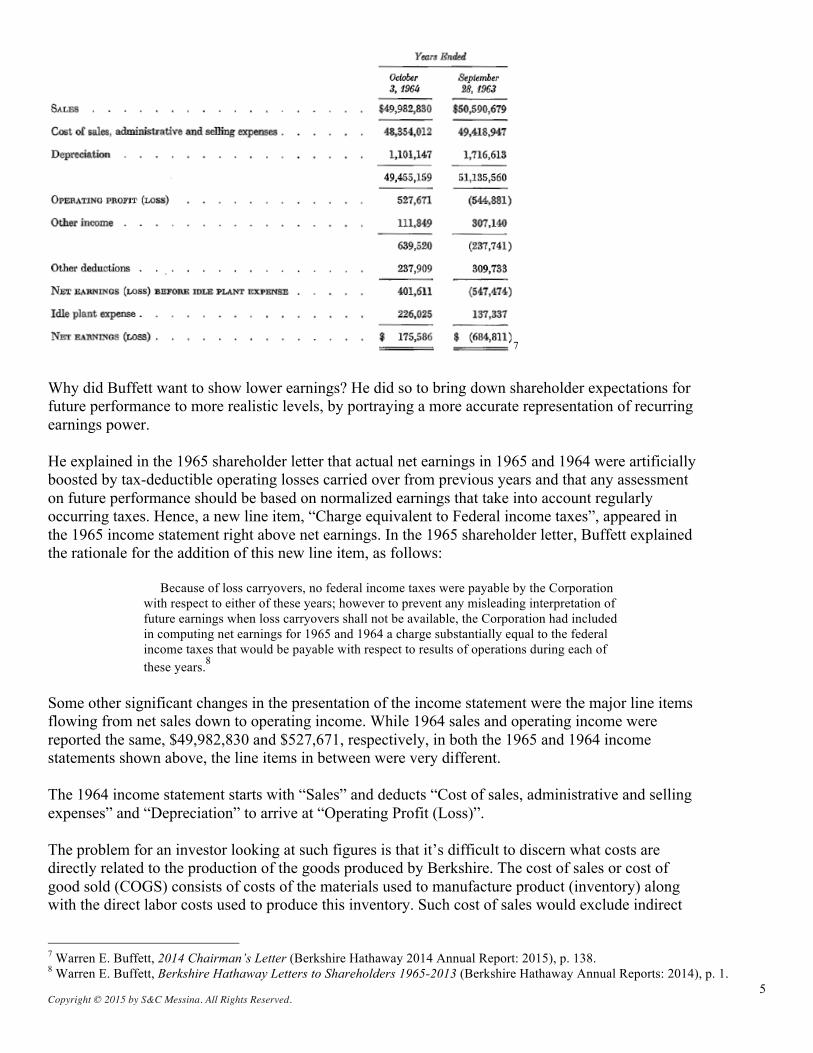
6 When we look at the 1964 income statement, however, net earnings for 1964 is shown as $175,586:
4 Warren E. Buffett, Berkshire Hathaway Letters to Shareholders 1965-2013 (Berkshire Hathaway Annual Reports: 2014), p. 1. 5 Warren E. Buffett, 2014 Chairman’s Letter (Berkshire Hathaway 2014 Annual Report: 2015), p. 133. 6 Berkshire Hathaway Inc. (1965). Form 10-K 1965.
Copyright © 2015 by S&C Messina. All Rights Reserved. 5
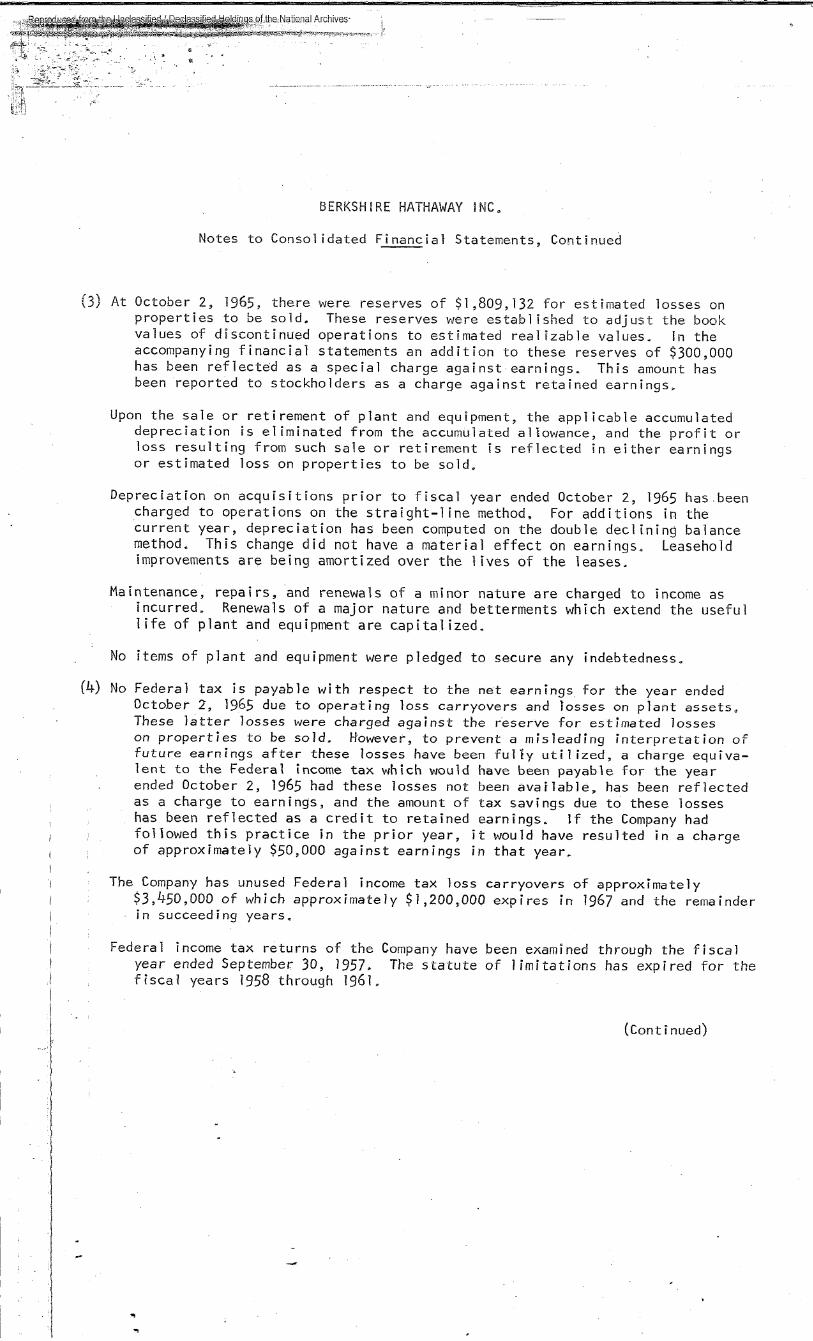
7 Why did Buffett want to show lower earnings? He did so to bring down shareholder expectations for future performance to more realistic levels, by portraying a more accurate representation of recurring earnings power. He explained in the 1965 shareholder letter that actual net earnings in 1965 and 1964 were artificially boosted by tax-deductible operating losses carried over from previous years and that any assessment on future performance should be based on normalized earnings that take into account regularly occurring taxes. Hence, a new line item, “Charge equivalent to Federal income taxes”, appeared in the 1965 income statement right above net earnings. In the 1965 shareholder letter, Buffett explained the rationale for the addition of this new line item, as follows:
Because of loss carryovers, no federal income taxes were payable by the Corporation with respect to either of these years; however to prevent any misleading interpretation of future earnings when loss carryovers shall not be available, the Corporation had included in computing net earnings for 1965 and 1964 a charge substantially equal to the federal income taxes that would be payable with respect to results of operations during each of these years.8
Some other significant changes in the presentation of the income statement were the major line items flowing from net sales down to operating income. While 1964 sales and operating income were reported the same, $49,982,830 and $527,671, respectively, in both the 1965 and 1964 income statements shown above, the line items in between were very different. The 1964 income statement starts with “Sales” and deducts “Cost of sales, administrative and selling expenses” and “Depreciation” to arrive at “Operating Profit (Loss)”. The problem for an investor looking at such figures is that it’s difficult to discern what costs are directly related to the production of the goods produced by Berkshire. The cost of sales or cost of good sold (COGS) consists of costs of the materials used to manufacture product (inventory) along with the direct labor costs used to produce this inventory. Such cost of sales would exclude indirect
7 Warren E. Buffett, 2014 Chairman’s Letter (Berkshire Hathaway 2014 Annual Report: 2015), p. 138. 8 Warren E. Buffett, Berkshire Hathaway Letters to Shareholders 1965-2013 (Berkshire Hathaway Annual Reports: 2014), p. 1.
Copyright © 2015 by S&C Messina. All Rights Reserved. 6
expenses such as distribution costs and sales force and advertising costs. The 1964 income statement, however, lumps all these direct and indirect expenses together, making the calculation of gross profit difficult. Under Buffett, the 1965 income statement, as shown above, fixed this problem by presenting costs more transparently. It starts with “Net Sales” and deducts “Cost of sales”, resulting in “Gross profit”, from which “Selling, general and administrative expenses” is then deducted to arrive at “Operating Income”. This is a much more transparent way of presenting the operating performance of Berkshire, as investors can assess how well management is managing costs directly related to the manufacturing of its goods and whether revenues from the sales of such goods are resulting in a sufficient gross profit. Furthermore, it also enables investors to more easily assess how well the company is managing its selling, general and administrative (SG&A) expenses, which are not directly related to the manufacturing of the core products. 2. Earnings Finally Positive, But Not All Roses In addition to adjusting net earnings downward with normalized taxes, Buffett poured even more realism on the parade for investors. In the 1965 letter, he implied that even though net earnings in 1964 and 1965 were finally positive for the first time since 1960, thus increasing total shareholders’ equity or book value, such positive contributions to book value don’t take into account losses suffered from the disposal of assets related to the closing of two major plants. He wrote in the 1965 shareholder letter:
The fiscal year ended October 2, 1965, resulted in net earnings of $2,279,206 as compared to net earnings of $125,586. These net earnings do not reflect any nonrecurring losses incurred on the disposal of assets due to the permanent closing of the King Philip Plants A and E in Fall River, Massachusetts, as such losses have been charged to a reserve previously established for such purpose.9
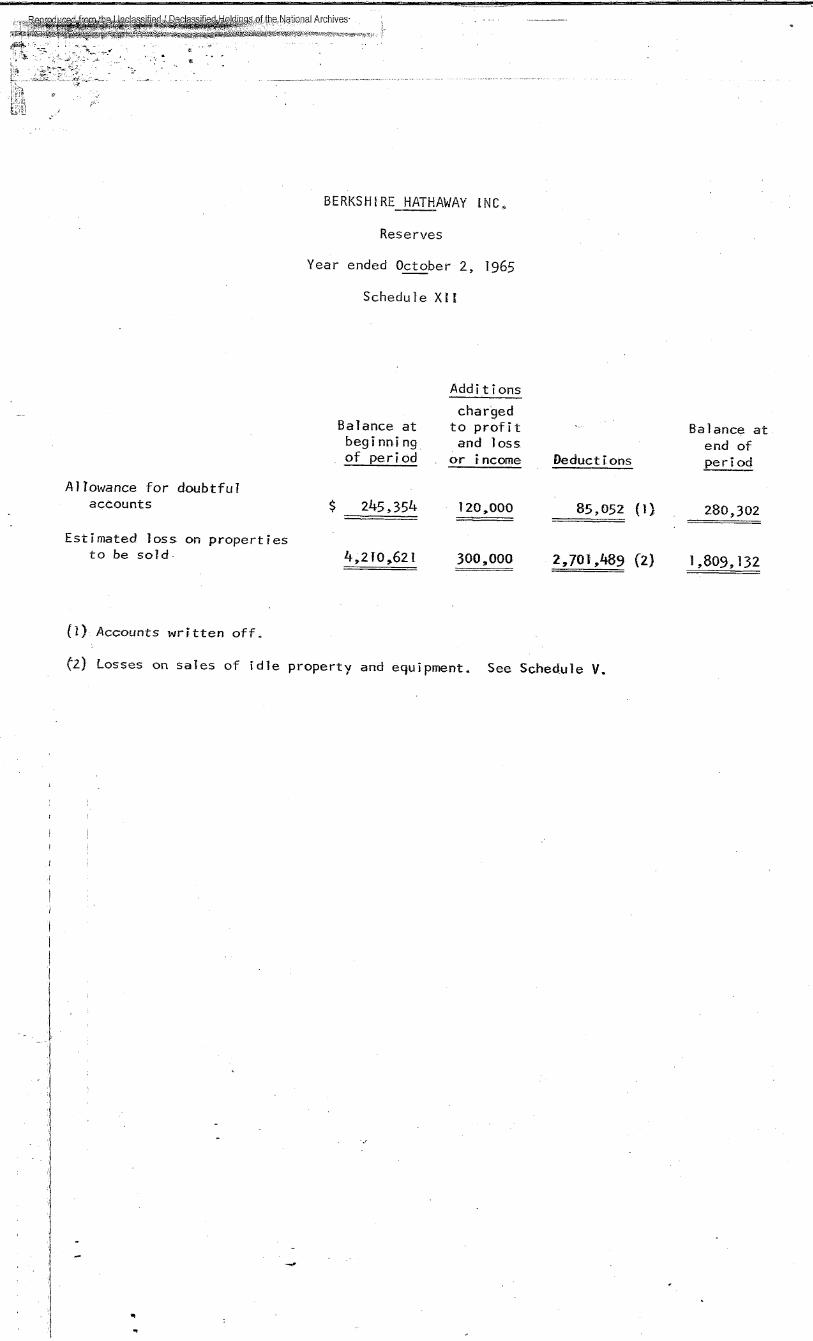
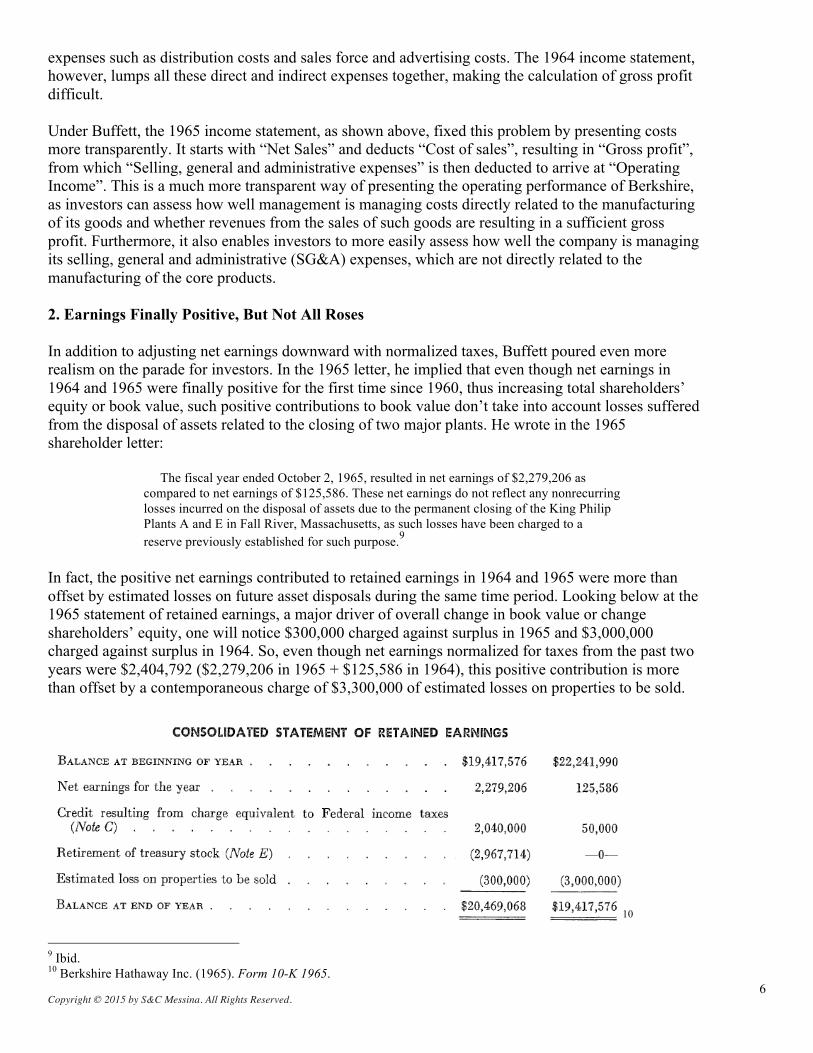
In fact, the positive net earnings contributed to retained earnings in 1964 and 1965 were more than offset by estimated losses on future asset disposals during the same time period. Looking below at the 1965 statement of retained earnings, a major driver of overall change in book value or change shareholders’ equity, one will notice $300,000 charged against surplus in 1965 and $3,000,000 charged against surplus in 1964. So, even though net earnings normalized for taxes from the past two years were $2,404,792 ($2,279,206 in 1965 + $125,586 in 1964), this positive contribution is more than offset by a contemporaneous charge of $3,300,000 of estimated losses on properties to be sold.
10 9 Ibid. 10 Berkshire Hathaway Inc. (1965). Form 10-K 1965.
Copyright © 2015 by S&C Messina. All Rights Reserved. 7
The $3,000,000 charge incurred in 1964 was specifically designated to cover estimated losses stemming from the disposal of King Philip E Division, the liquidation of which began in 1964.11 However, this poses an interesting timing issue because, as per the 1965 shareholder letter, a major chunk of this asset disposal occurred in the following 1965 fiscal year. So to which fiscal year should the $3,000,000 charge belong? Such are the frequent shortcomings of accounting and managerial reporting of financials, be it during 1965 or today. Buffett elaborates on this King Philip E Division liquidation in the 1965 shareholder letter, as follows:
A major portion of the machinery at King Philip Plant E Division has been sold. We expect to dispose of the remaining portion of this plant during the current [1966] fiscal year. This will complete the liquidation of our unprofitable plants. The proposed sale of the King Philip E Division will make it necessary to provide storage for raw cotton and grey cloth for the King Philip D Division at the Hathaway Division Plant C (former Langshaw Mill). Plans are underway to accomplish this within the current [1966] fiscal year.12
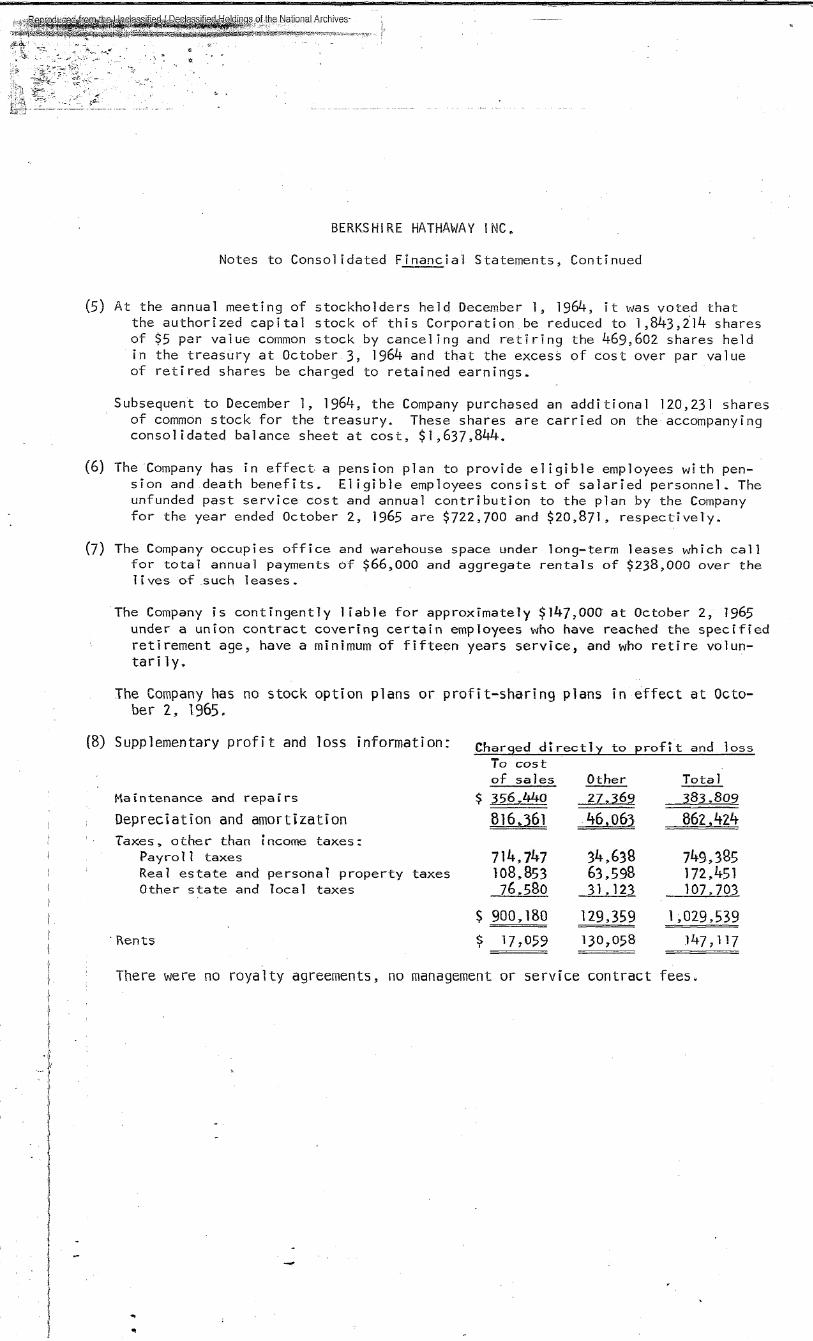
While it’s a comfort that these estimated losses on properties to be sold are deemed non-recurring, the fact that such significant charges are not shown on the income statement is a reminder that simply looking at the earnings report or income statement can be an incomplete or misleading representation of a company’s performance. This was one of the reasons why Ben Graham was focused so heavily on the balance sheet, as a balance sheet’s snapshot in time was less prone to similar, habitual beautification by management of a reporting period’s operating figures (i.e. income statement). On the flip side, simply looking at the income statement would not have allowed investors to recognize $2,967,714 was spent in 1965 in share repurchases, resulting in a decline in the number of shares outstanding, a positive for shareholders all else being equal. 3. Liquidity, Liquidity, Liquidity Two ways to generate more cash on the balance sheet are to better manage balance sheet items such as working capital and to increase cash flows via higher operating margins. Both of these were achieved in 1965. Buffett goes into the balance sheet and the income statement improvements achieved during the year in the 1965 shareholder letter:
During 1965 raw material, stock in process and cloth inventories were decreased by $1,411,967 and bank loans of $2,500,000 were paid off. Also, during the year, the Corporation purchased 120,231 of its own shares, leaving a total of 1,017,547 shares outstanding at the end of the fiscal year. The Corporation made a substantial reduction in its overhead costs during the fiscal year just ended. Approximately $811,812 was invested by the Corporation during the year in the purchase of new machinery in a continuing effort to reduce costs and to improve quality. This program will continue during the current [1966] fiscal year.13
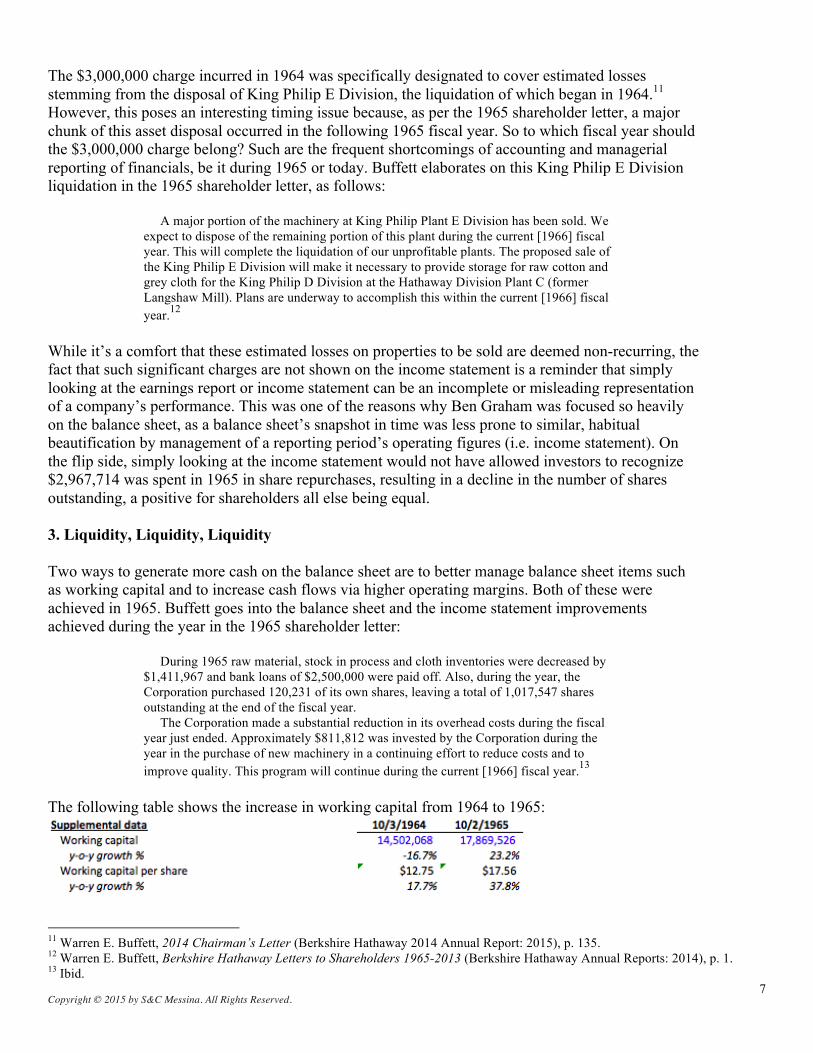
The following table shows the increase in working capital from 1964 to 1965:
11 Warren E. Buffett, 2014 Chairman’s Letter (Berkshire Hathaway 2014 Annual Report: 2015), p. 135. 12 Warren E. Buffett, Berkshire Hathaway Letters to Shareholders 1965-2013 (Berkshire Hathaway Annual Reports: 2014), p. 1. 13 Ibid.
Copyright © 2015 by S&C Messina. All Rights Reserved. 8
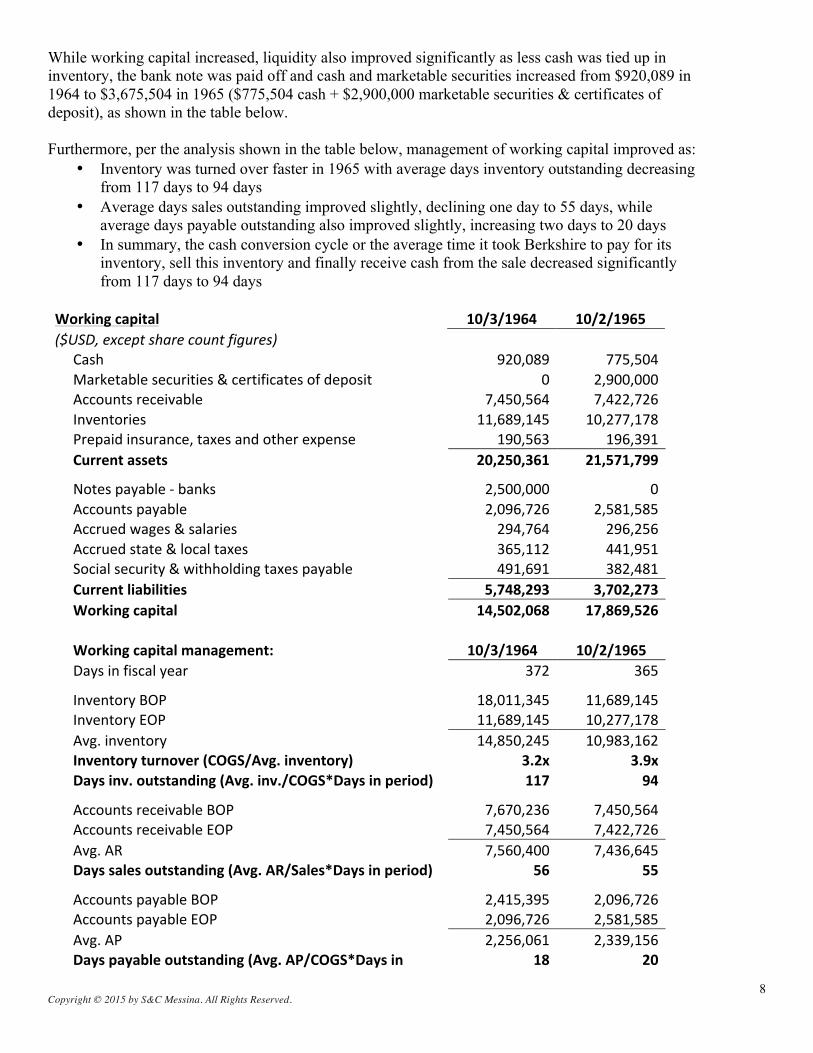
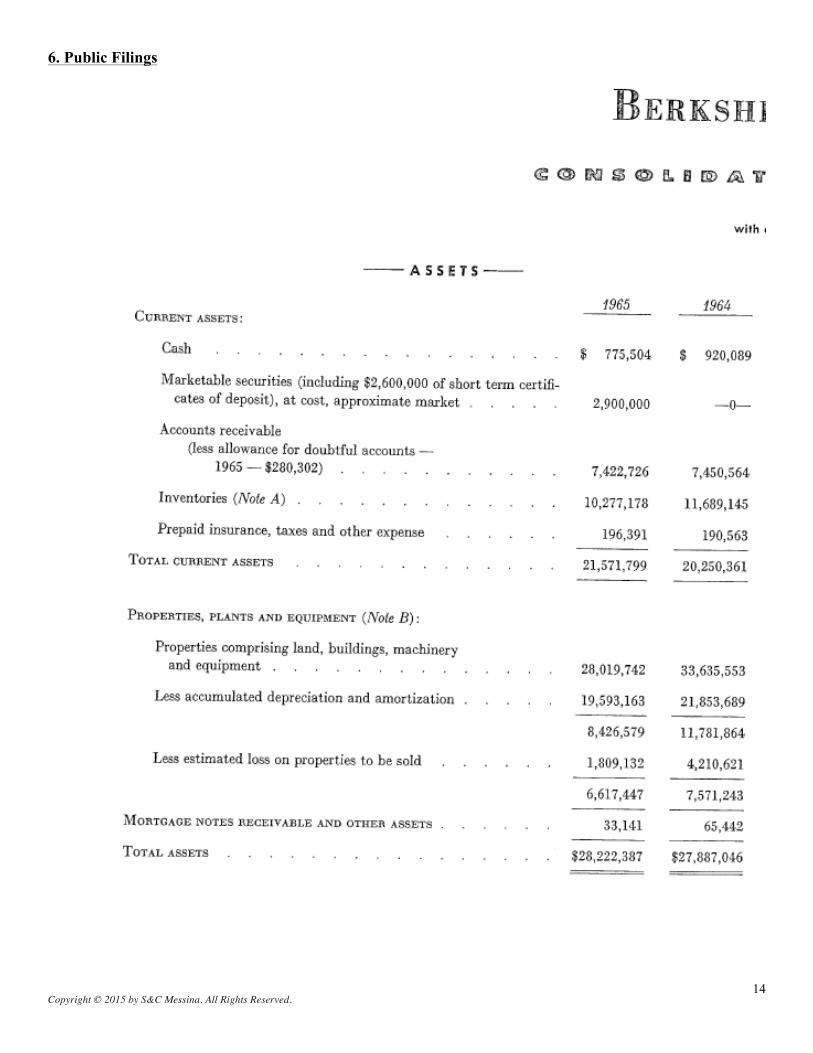
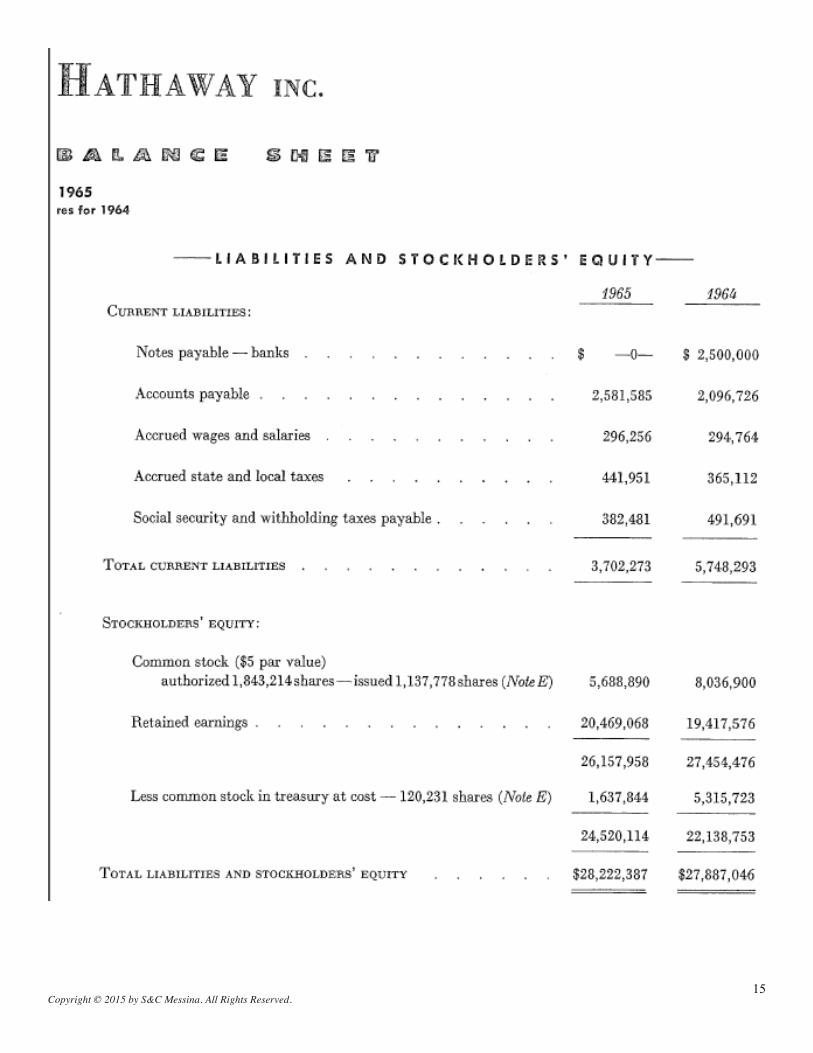
While working capital increased, liquidity also improved significantly as less cash was tied up in inventory, the bank note was paid off and cash and marketable securities increased from $920,089 in 1964 to $3,675,504 in 1965 ($775,504 cash + $2,900,000 marketable securities & certificates of deposit), as shown in the table below. Furthermore, per the analysis shown in the table below, management of working capital improved as:
• Inventory was turned over faster in 1965 with average days inventory outstanding decreasing from 117 days to 94 days
• Average days sales outstanding improved slightly, declining one day to 55 days, while average days payable outstanding also improved slightly, increasing two days to 20 days
• In summary, the cash conversion cycle or the average time it took Berkshire to pay for its inventory, sell this inventory and finally receive cash from the sale decreased significantly from 117 days to 94 days
Working capital 10/3/1964 10/2/1965 ($USD, except share count figures)
Cash 920,089 775,504
Marketable securities & certificates of deposit 0 2,900,000
Accounts receivable 7,450,564 7,422,726
Inventories 11,689,145 10,277,178
Prepaid insurance, taxes and other expense 190,563 196,391
Current assets 20,250,361 21,571,799
Notes payable -‐ banks 2,500,000 0
Accounts payable 2,096,726 2,581,585
Accrued wages & salaries 294,764 296,256
Accrued state & local taxes 365,112 441,951
Social security & withholding taxes payable 491,691 382,481
Current liabilities 5,748,293 3,702,273
Working capital 14,502,068 17,869,526
Working capital management: 10/3/1964 10/2/1965
Days in fiscal year 372 365
Inventory BOP 18,011,345 11,689,145
Inventory EOP 11,689,145 10,277,178
Avg. inventory 14,850,245 10,983,162
Inventory turnover (COGS/Avg. inventory) 3.2x 3.9x
Days inv. outstanding (Avg. inv./COGS*Days in period) 117 94
Accounts receivable BOP 7,670,236 7,450,564
Accounts receivable EOP 7,450,564 7,422,726
Avg. AR 7,560,400 7,436,645
Days sales outstanding (Avg. AR/Sales*Days in period) 56 55
Accounts payable BOP 2,415,395 2,096,726
Accounts payable EOP 2,096,726 2,581,585
Avg. AP 2,256,061 2,339,156
Days payable outstanding (Avg. AP/COGS*Days in 18 20
Copyright © 2015 by S&C Messina. All Rights Reserved. 9
period)
Cash conversion cycle (DIO+DSO-‐DPO) 155 129 As per the 1965 shareholder letter, only four divisions located at two sites are continuing to be operated by Berkshire as of the end of 1965 fiscal year-end:
1. King Phillip Plant D in Warren, Rhode Island; 2. Hathaway Synthetic, Box Loom and Home Fabrics Divisions in New Bedford, Massachusetts.14
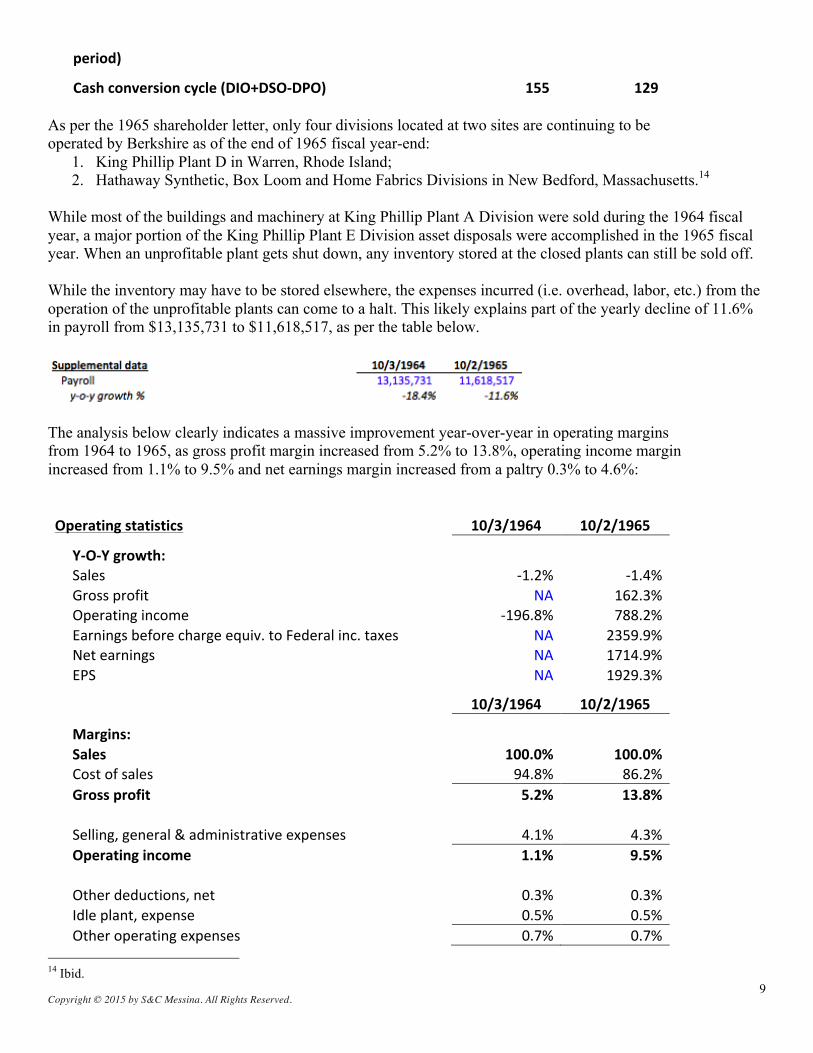
While most of the buildings and machinery at King Phillip Plant A Division were sold during the 1964 fiscal year, a major portion of the King Phillip Plant E Division asset disposals were accomplished in the 1965 fiscal year. When an unprofitable plant gets shut down, any inventory stored at the closed plants can still be sold off. While the inventory may have to be stored elsewhere, the expenses incurred (i.e. overhead, labor, etc.) from the operation of the unprofitable plants can come to a halt. This likely explains part of the yearly decline of 11.6% in payroll from $13,135,731 to $11,618,517, as per the table below.
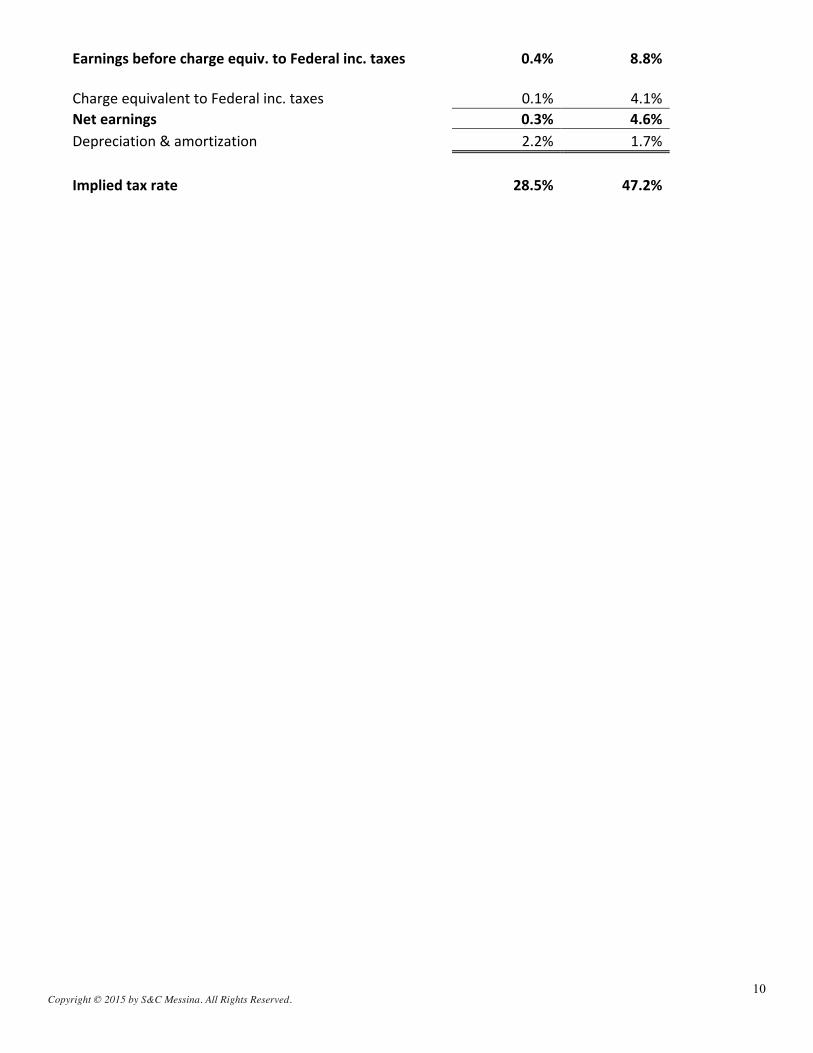
The analysis below clearly indicates a massive improvement year-over-year in operating margins from 1964 to 1965, as gross profit margin increased from 5.2% to 13.8%, operating income margin increased from 1.1% to 9.5% and net earnings margin increased from a paltry 0.3% to 4.6%: Operating statistics 10/3/1964 10/2/1965
Y-‐O-‐Y growth:
Sales -‐1.2% -‐1.4%
Gross profit NA 162.3%
Operating income -‐196.8% 788.2%
Earnings before charge equiv. to Federal inc. taxes NA 2359.9%
Net earnings NA 1714.9%
EPS NA 1929.3%
10/3/1964 10/2/1965
Margins:
Sales 100.0% 100.0%
Cost of sales 94.8% 86.2%
Gross profit 5.2% 13.8%
Selling, general & administrative expenses 4.1% 4.3%
Operating income 1.1% 9.5%
Other deductions, net 0.3% 0.3%
Idle plant, expense 0.5% 0.5%
Other operating expenses 0.7% 0.7%
14 Ibid.
Copyright © 2015 by S&C Messina. All Rights Reserved. 10
Earnings before charge equiv. to Federal inc. taxes 0.4% 8.8%
Charge equivalent to Federal inc. taxes 0.1% 4.1%
Net earnings 0.3% 4.6%
Depreciation & amortization 2.2% 1.7%
Implied tax rate 28.5% 47.2%
Copyright © 2015 by S&C Messina. All Rights Reserved. 11
4. Outlook Seabury Stanton resigned as a director and President, with Kenneth V. Chace elected by the board as successor. John K. Stanton resigned as director and as Treasurer and Clerk with Harold V. Banks elected as the new Treasurer and Clerk. This was perhaps the coldest send-off one might expect in a public statement regarding the termination of a long-standing director and President, whose family had owned and operated the business for decades. While acknowledging “fifty years of service” given by Seabury Stanton, there is nothing close to a “thank you” or other semblance of gratitude. This send-off is in stark comparison to the expression only a few lines later of “thanks to all the employees of the Corporation whose loyal cooperation and efforts have helped to make this year successful.”15 The 1965 fiscal year ended with significant backlogs of unfilled order at all divisions, and management expects the coming 1966 fiscal year to continue to be profitable. Interestingly, the 1965 letter ends with the names of Chairman of the Board Malcolm G. Chace, Jr., and President Kenneth V. Chace appearing at the bottom. However, the compilation of letters compiled in Berkshire Hathaway Letters to Shareholders, 2013, denotes the 1965 letter as a “[Letter written by Warren E. Buffett]”.16
15 Warren E. Buffett, Berkshire Hathaway Letters to Shareholders 1965-2013 (Berkshire Hathaway Annual Reports: 2014), p. 1. 16 Ibid.
Copyright © 2015 by S&C Messina. All Rights Reserved. 12
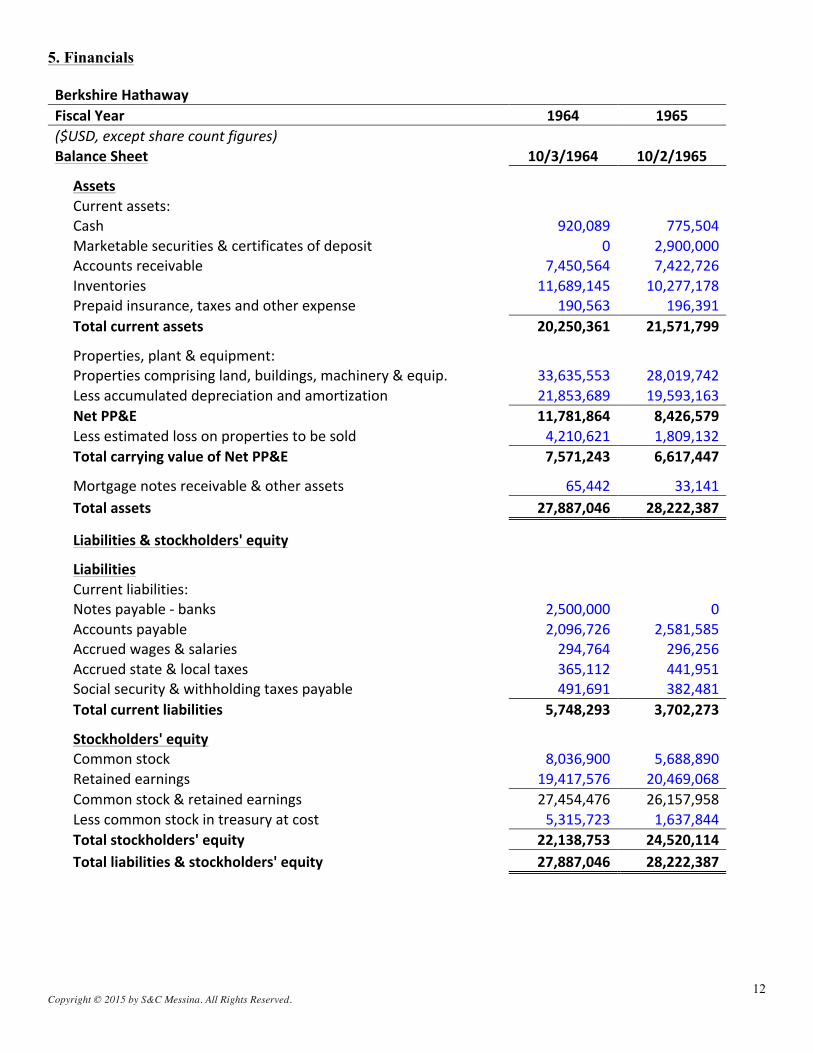
5. Financials Berkshire Hathaway 372 365 Fiscal Year 1964 1965 ($USD, except share count figures)
Balance Sheet 10/3/1964 10/2/1965
Assets
Current assets:
Cash 920,089 775,504
Marketable securities & certificates of deposit 0 2,900,000
Accounts receivable 7,450,564 7,422,726
Inventories 11,689,145 10,277,178
Prepaid insurance, taxes and other expense 190,563 196,391
Total current assets 20,250,361 21,571,799
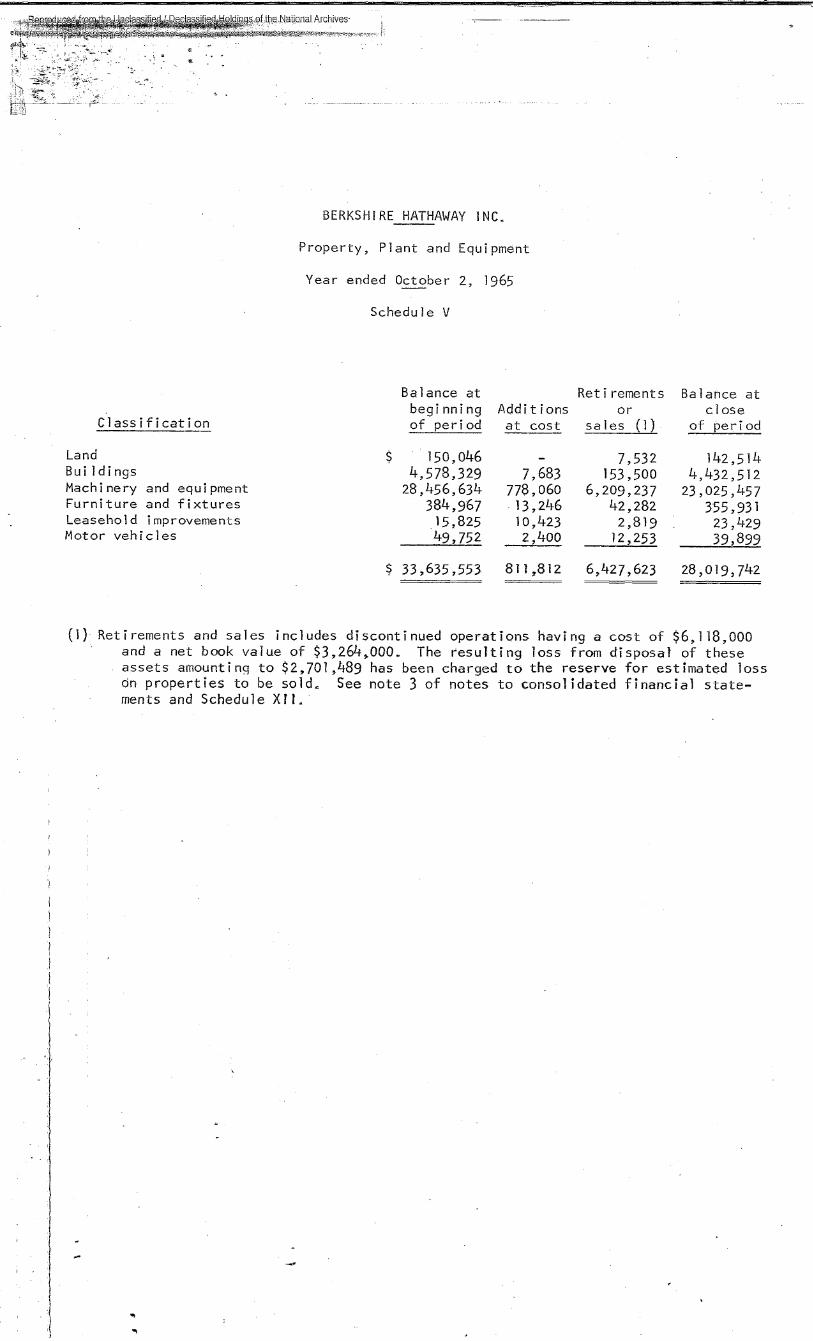
Properties, plant & equipment:
Properties comprising land, buildings, machinery & equip. 33,635,553 28,019,742
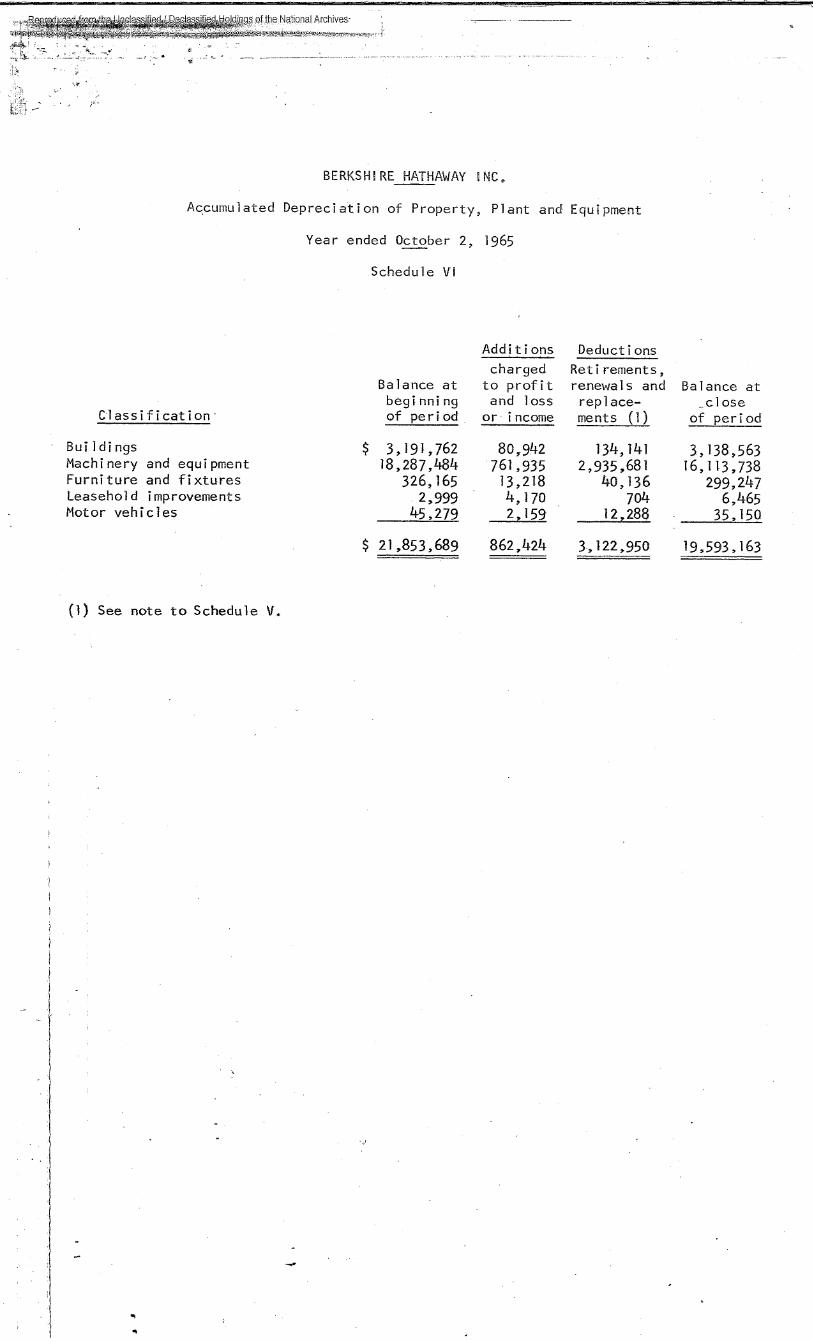
Less accumulated depreciation and amortization 21,853,689 19,593,163
Net PP&E 11,781,864 8,426,579
Less estimated loss on properties to be sold 4,210,621 1,809,132
Total carrying value of Net PP&E 7,571,243 6,617,447
Mortgage notes receivable & other assets 65,442 33,141
Total assets 27,887,046 28,222,387
Liabilities & stockholders' equity
Liabilities
Current liabilities:
Notes payable -‐ banks 2,500,000 0
Accounts payable 2,096,726 2,581,585
Accrued wages & salaries 294,764 296,256
Accrued state & local taxes 365,112 441,951
Social security & withholding taxes payable 491,691 382,481
Total current liabilities 5,748,293 3,702,273
Stockholders' equity
Common stock 8,036,900 5,688,890
Retained earnings 19,417,576 20,469,068
Common stock & retained earnings 27,454,476 26,157,958
Less common stock in treasury at cost 5,315,723 1,637,844
Total stockholders' equity 22,138,753 24,520,114
Total liabilities & stockholders' equity 27,887,046 28,222,387
Copyright © 2015 by S&C Messina. All Rights Reserved. 13
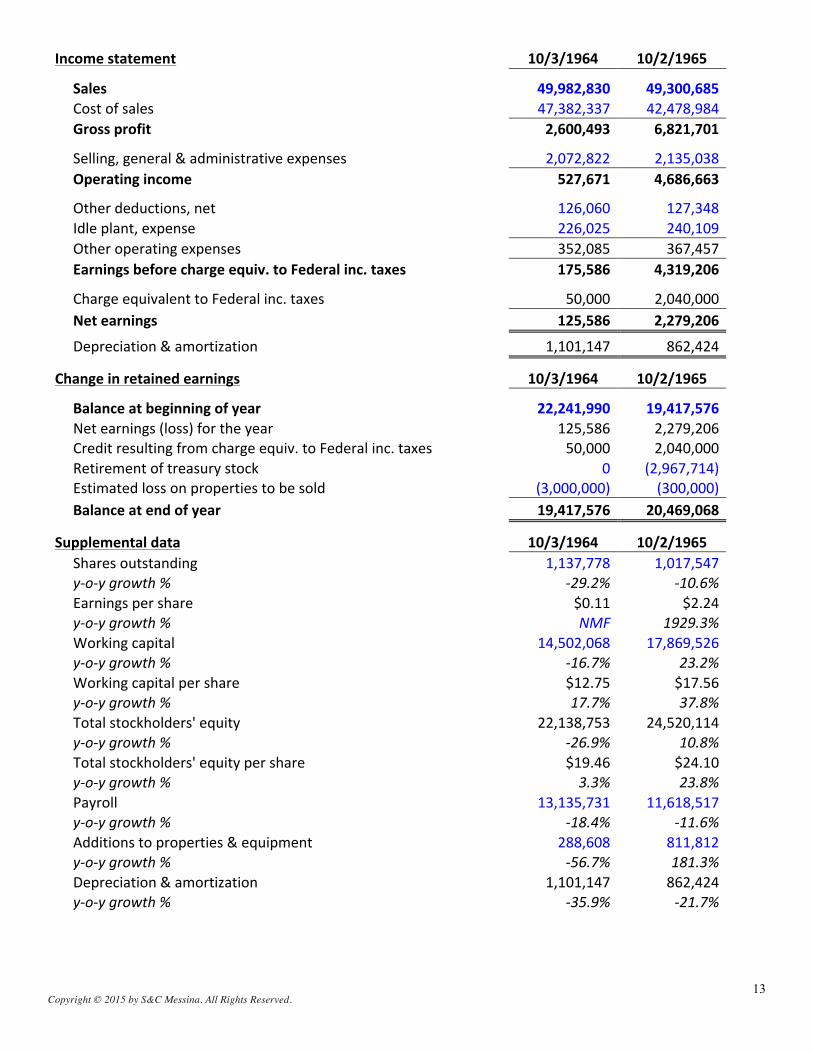
Income statement 10/3/1964 10/2/1965
Sales 49,982,830 49,300,685
Cost of sales 47,382,337 42,478,984
Gross profit 2,600,493 6,821,701
Selling, general & administrative expenses 2,072,822 2,135,038
Operating income 527,671 4,686,663
Other deductions, net 126,060 127,348
Idle plant, expense 226,025 240,109
Other operating expenses 352,085 367,457
Earnings before charge equiv. to Federal inc. taxes 175,586 4,319,206
Charge equivalent to Federal inc. taxes 50,000 2,040,000
Net earnings 125,586 2,279,206
Depreciation & amortization 1,101,147 862,424
Change in retained earnings 10/3/1964 10/2/1965
Balance at beginning of year 22,241,990 19,417,576
Net earnings (loss) for the year 125,586 2,279,206
Credit resulting from charge equiv. to Federal inc. taxes 50,000 2,040,000
Retirement of treasury stock 0 (2,967,714)
Estimated loss on properties to be sold (3,000,000) (300,000)
Balance at end of year 19,417,576 20,469,068
Supplemental data 10/3/1964 10/2/1965
Shares outstanding 1,137,778 1,017,547
y-‐o-‐y growth % -‐29.2% -‐10.6%
Earnings per share $0.11 $2.24
y-‐o-‐y growth % NMF 1929.3%
Working capital 14,502,068 17,869,526
y-‐o-‐y growth % -‐16.7% 23.2%
Working capital per share $12.75 $17.56
y-‐o-‐y growth % 17.7% 37.8%
Total stockholders' equity 22,138,753 24,520,114
y-‐o-‐y growth % -‐26.9% 10.8%
Total stockholders' equity per share $19.46 $24.10
y-‐o-‐y growth % 3.3% 23.8%
Payroll 13,135,731 11,618,517
y-‐o-‐y growth % -‐18.4% -‐11.6%
Additions to properties & equipment 288,608 811,812
y-‐o-‐y growth % -‐56.7% 181.3%
Depreciation & amortization 1,101,147 862,424
y-‐o-‐y growth % -‐35.9% -‐21.7%
Copyright © 2015 by S&C Messina. All Rights Reserved. 14
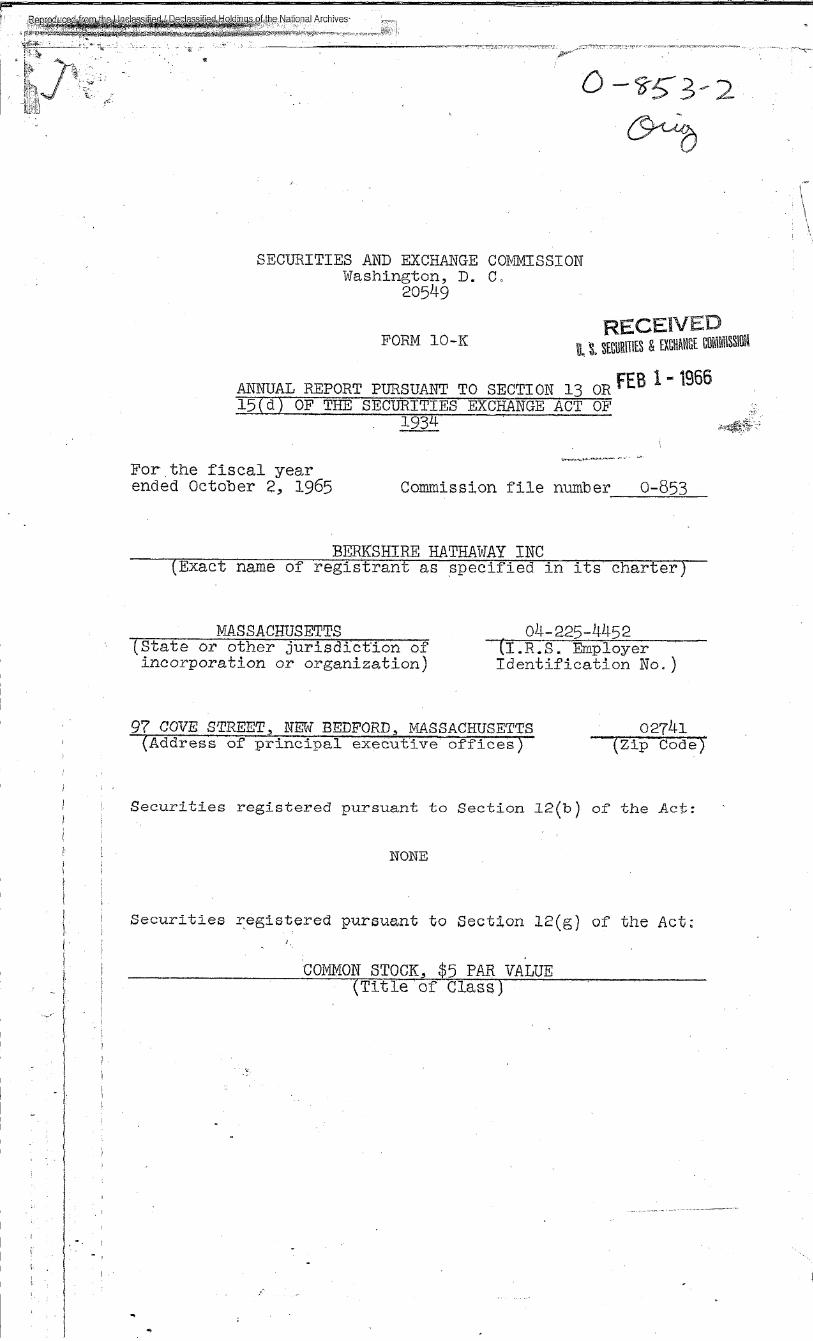
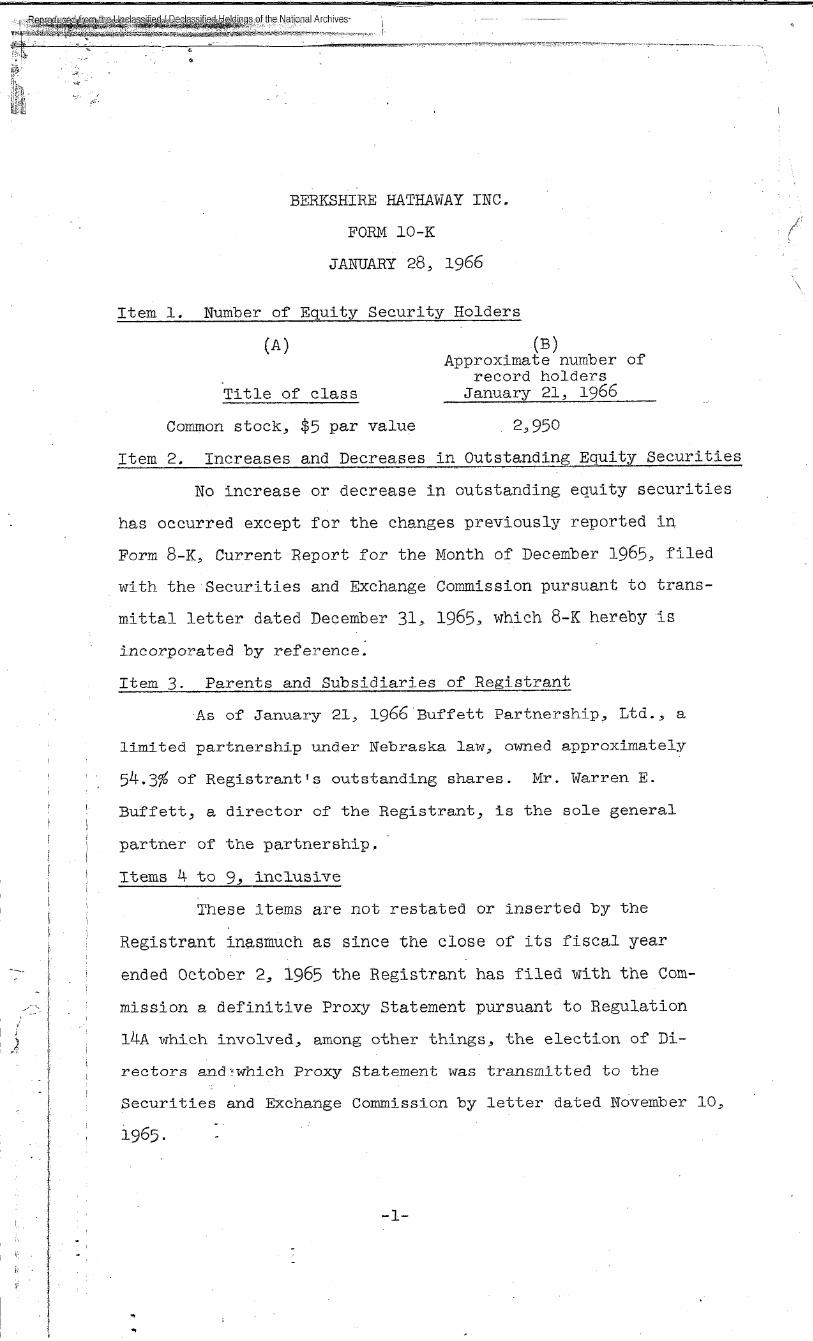
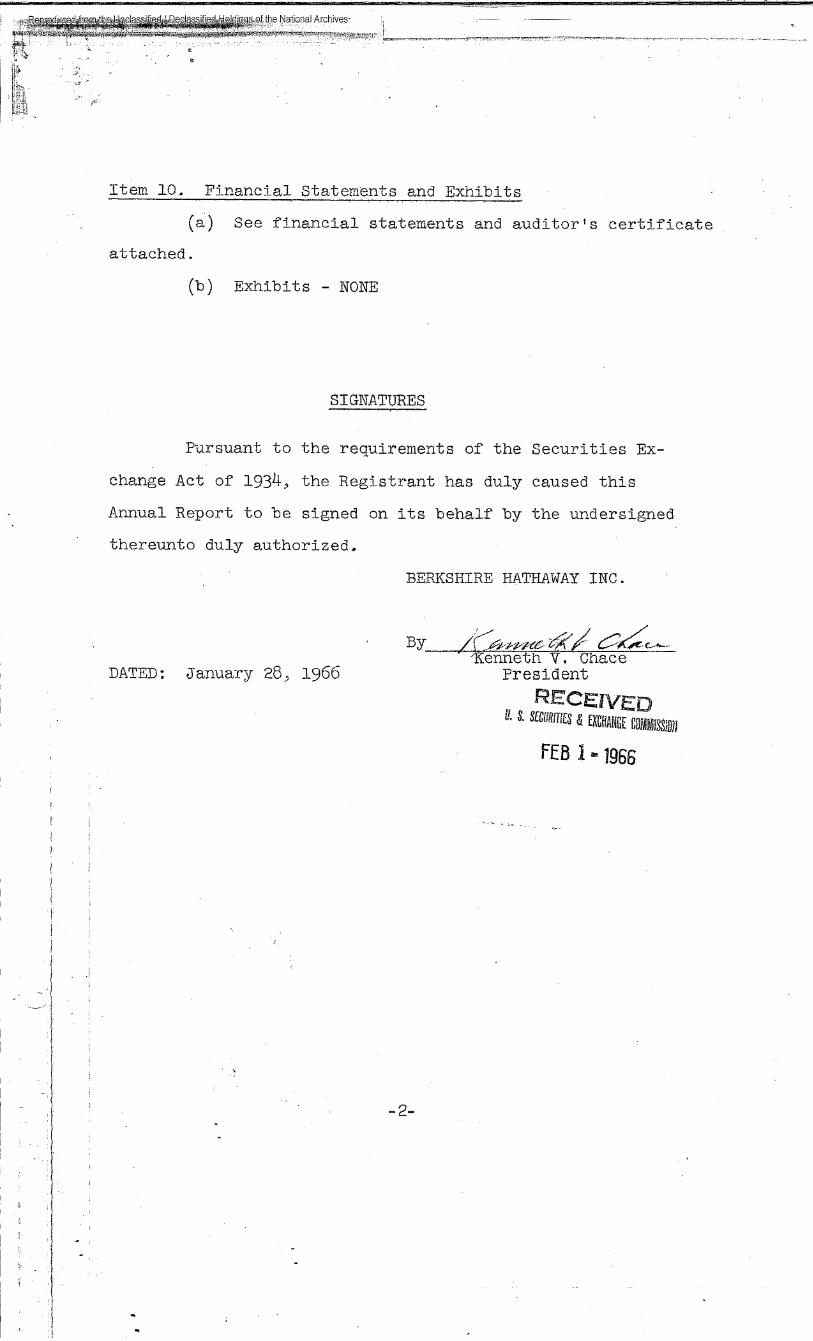
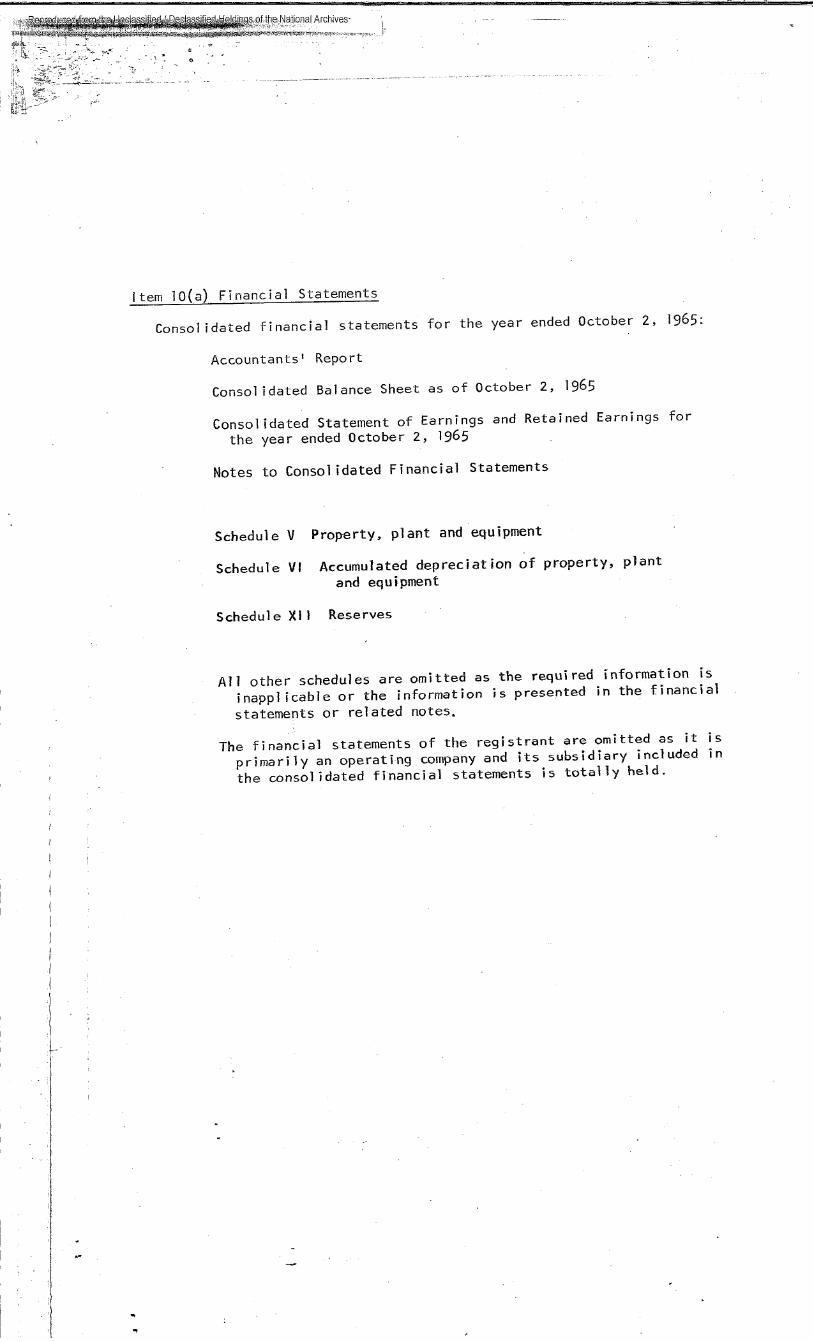
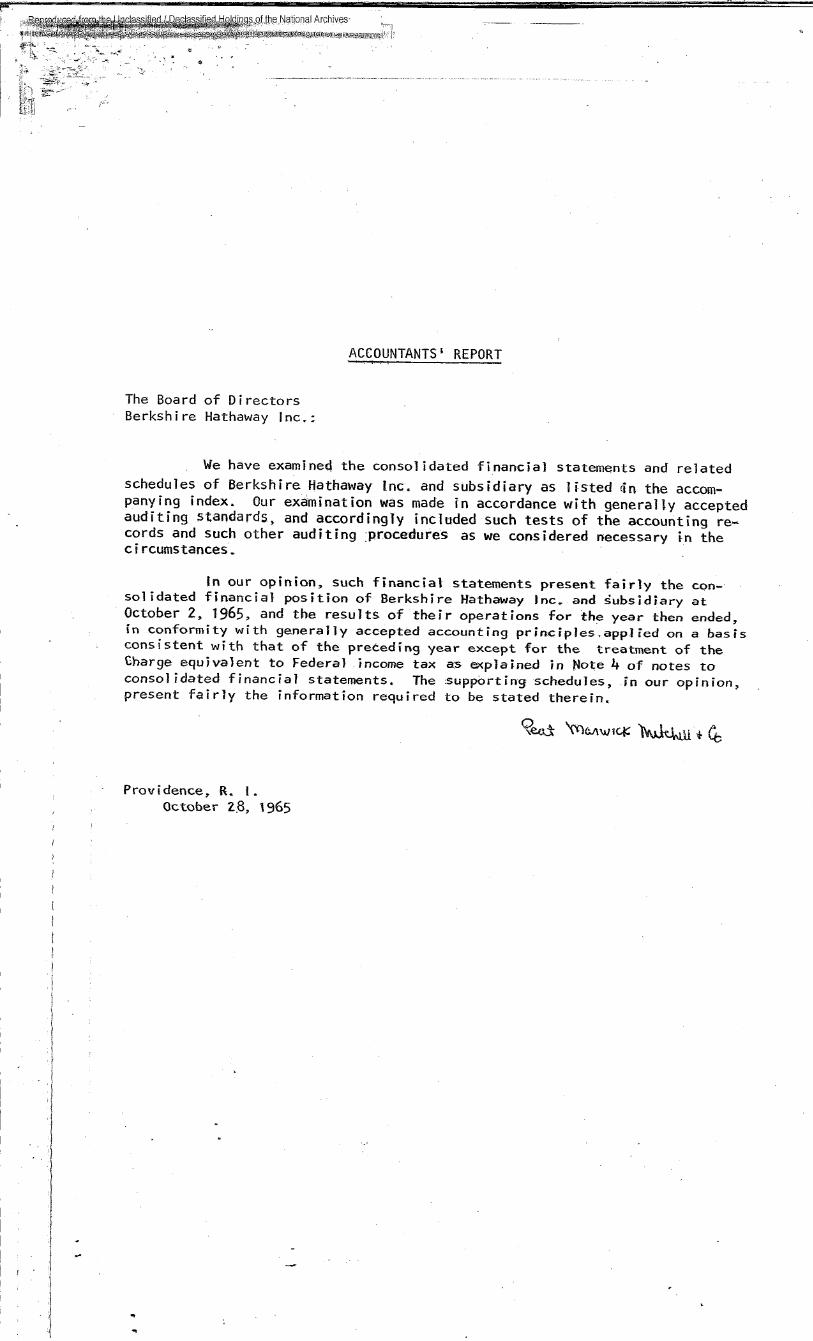
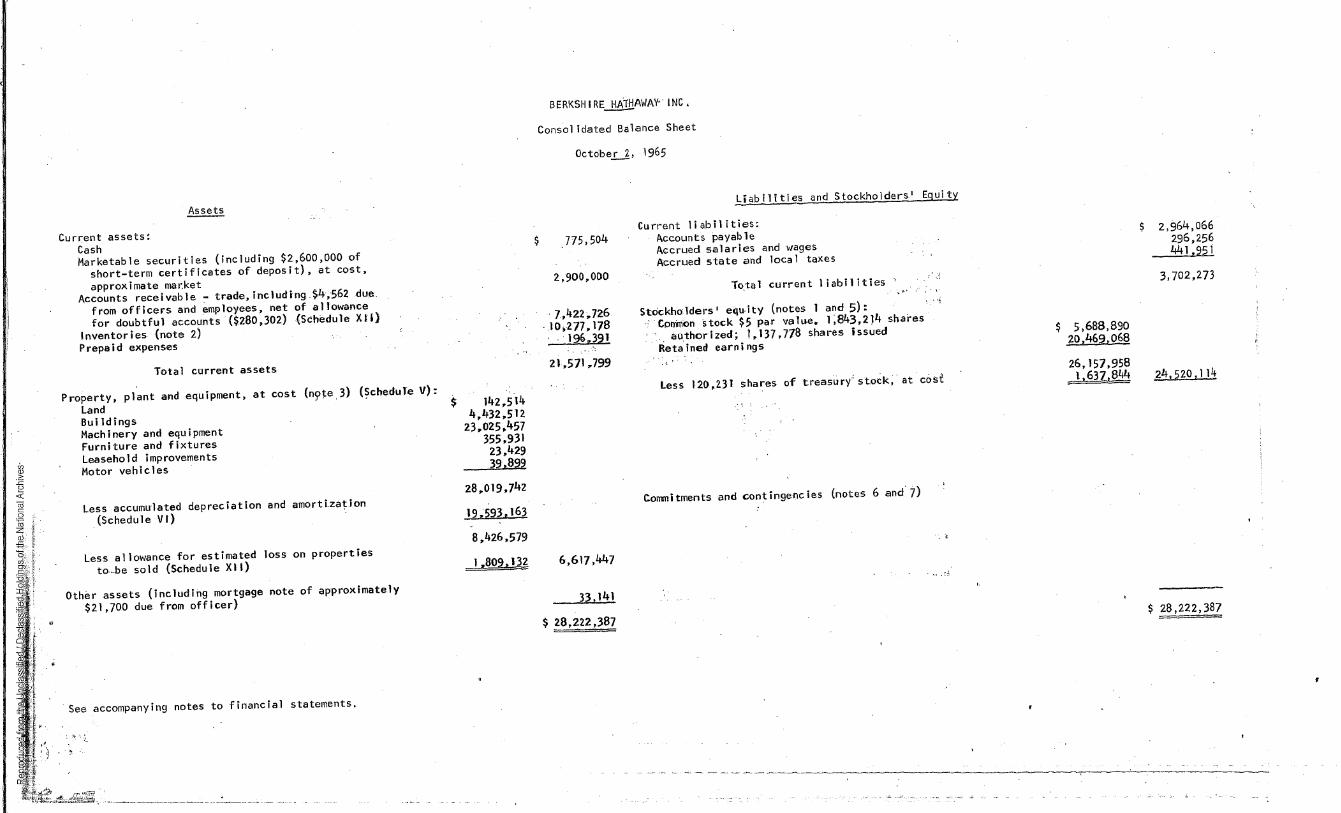
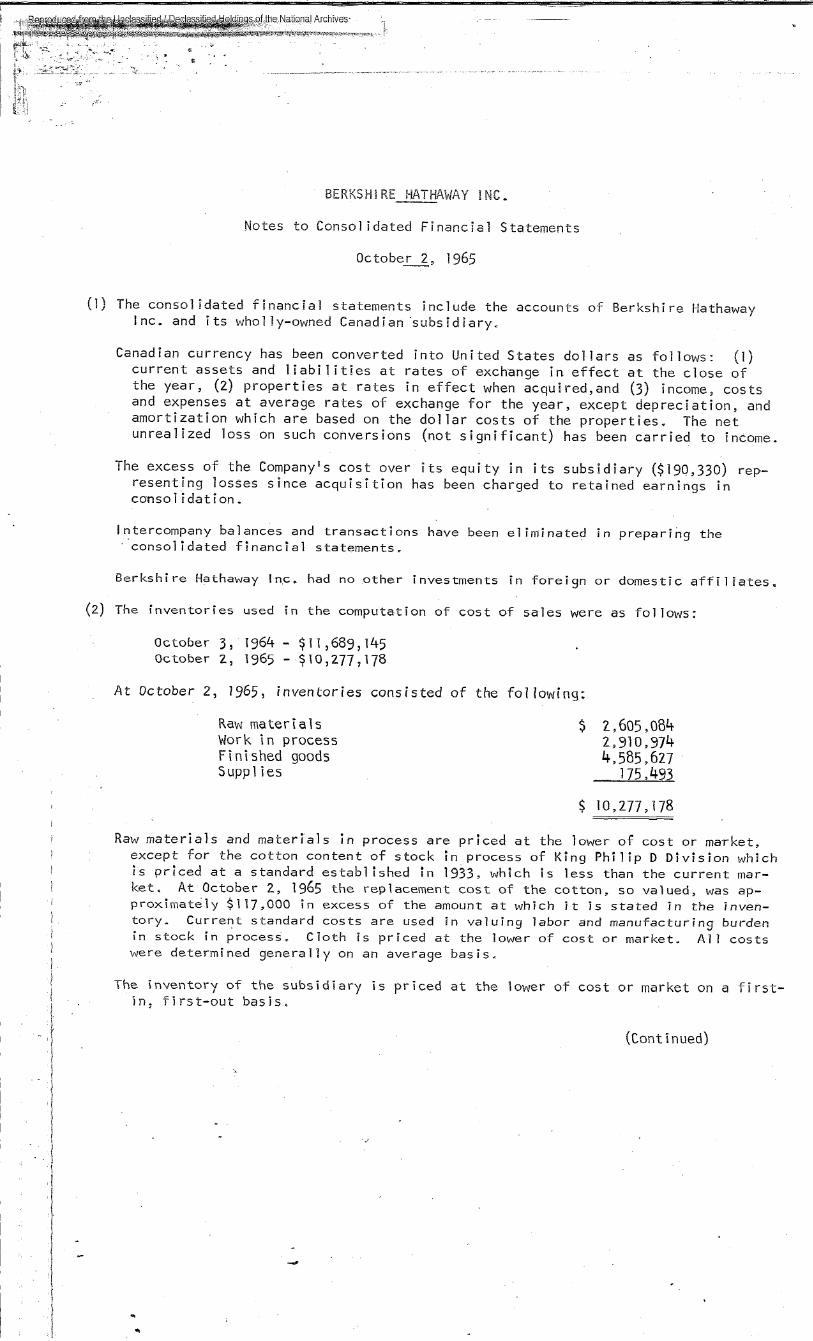
6. Public Filings
Copyright © 2015 by S&C Messina. All Rights Reserved. 15
Copyright © 2015 by S&C Messina. All Rights Reserved. 16