Embed Size (px)
Citation preview
6/28/2012
Analysis of Telecom SectorAt Cholamandalam Securities
MASTER IN MANAGEMENT STUDIES
(MMS)
UNIVERSITY OF MUMBAI
SUBMITTED TOGURUNANAK INSTITUTE OF
MANAGEMENT STUDIES
UNDER THE GUIDANCE OF
ANANTHANARAYANA J
SUBMITTED BY
NILESH J NAVI

2
Acknowledgement “Gratitude is the hardest of emotions to express and often does not find adequate ways to convey the entire one feels.”
Summer training is the one of the important part of MMS course, which has helped me to learn a lot of experiences which will be beneficial in my succeeding career.
For this with an ineffable sense of gratitude I take this opportunity to express my deep sense of indebtedness to Respected Dr. Vidya Hatangadi, Director of the Gurunanak Institute of Management Studies, who has provided me an opportunity to learn the corporate culture during my MMS course. At the same time I want to thanks all my faculty members.
I am also very much thankful to Mr.Ananthanarayan J, AVP institutional Sales, Cholamandalam Securities, for his interest, constructive appreciation, persistent encouragement and untiring guidance throughout the development of the project. It has been my great privilege to work under his inspiring guidance.
Further I would also like to extend my sincere ‘Thanks’ to Mr. Riken Mehta, Branch Equity Manager, for his valuable guidance, suggestions and outstanding mentorship. I am also thankful to Mr. Girish Patil for extending support & guidance. I would have never been able to complete my project without the enormous help extended by the whole staff of Cholamandalam Securities.
3
Declaration
I, Nilesh J Navi, Student of 3rd Semester (MMS (Finance)), Roll no. 36, Gurunanak Institute of Management Studies, Matunga declare that the project on “EQUITY ANALYSIS OF THE TELECOM SECTOR is the result of my own effort and it is based on data collected and guidance given to me.
I have prepared this project during my Summer Internship from 2nd May 2012 and the same was completed on 30th June 2012. This report is correct to my knowledge and so far has not been published anywhere else.
NILESH J NAVI

4
TABLE OF CONTENTS
S.No CHAPTERS PAGE. NO.
CHAPTER – 1: INTRODUCTION
1.1 Sectorial Analysis 6
1.2 Fundamental Analysis 20
1.3 Company Profile 25
1.4 Telecom Company Profile 32
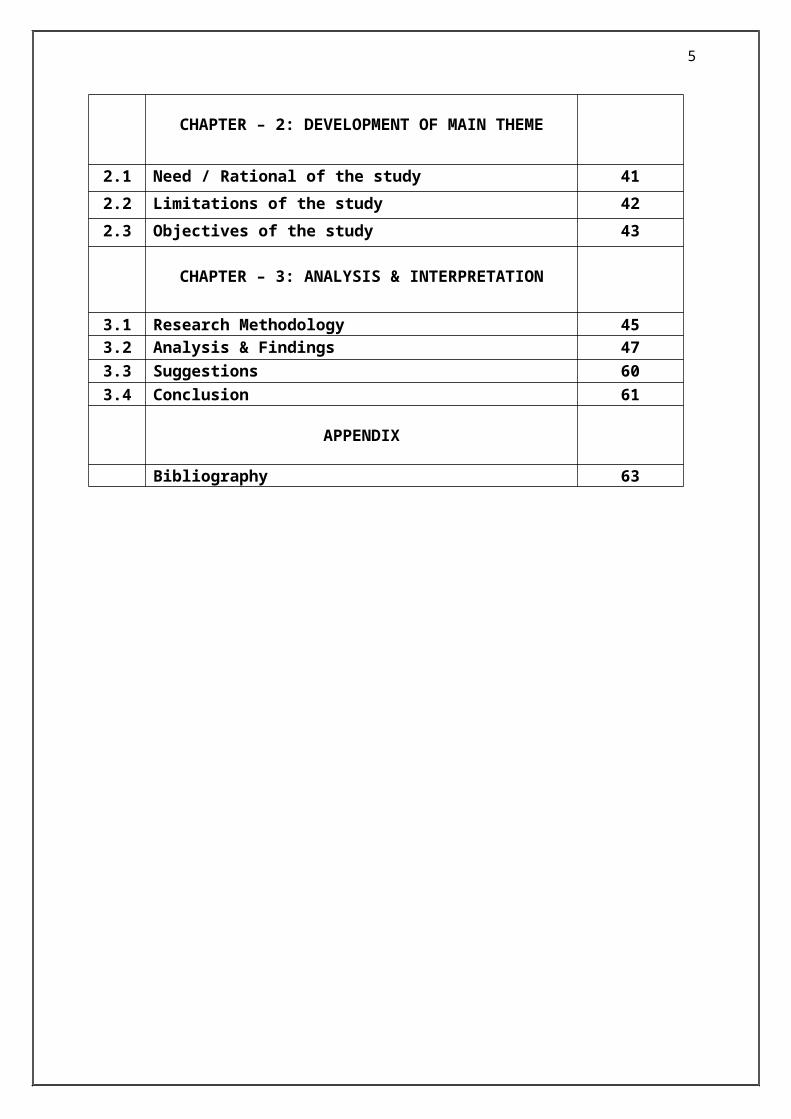
CHAPTER – 2: DEVELOPMENT OF MAIN THEME
2.1 Need / Rational of the study 41
2.2 Limitations of the study 42
2.3 Objectives of the study 43
CHAPTER – 3: ANALYSIS & INTERPRETATION
3.1 Research Methodology 453.2 Analysis & Findings 473.3 Suggestions 603.4 Conclusion 61
APPENDIX
Bibliography 63
5
CHAPTER 1
INTRODUCTION

6
EXECUTIVE SUMMARY
The field of equity research is very vast and one has to look into various aspects of the functioning of the company to get to any conclusion about the possible performance of the company in the market. Investors like warren buffet made a fortune out of investments in the stock market, which is quiet impossible without proper research about the companies. The field of equity research is full of challenges. It is your door to fame, fortune and, above all, professional challenge. In a world that is shrinking in size due to information technology and blurring boundaries between nations, the stock market (or the equities market), which is considered to be in its infant stage, is all set to grow in size.
The project on “Analysis of Telecom Sector” was carried out in Cholamandalam Investment & Finance Co. Ltd, a very well known company in the field of stock broking and capital market services sector. The duration of the project was two months i.e. from 2nd May 2012 to 30th June 2012. These two months were not only limited to learning and devoting time towards equity research but it also provided an insight on what various services such broking houses provide and what efforts are required to manage such organizations.
The reason behind choosing this project is that it provides hands on experience with what goes on in the stock market on a day-to-day basis. Some value investors only look at present assets/earnings and don't place any value on future growth. Other value investors base strategies completely around the estimation of future growth and cash flows. Despite the different methodologies, it all comes back to trying to buy something for less than it is worth. The project initiated with understanding the mannerisms of the stock market trading followed by the dynamics of the telecom sector. Some of the major players in Telecom sector were then chosen for further analysis. These companies were further studied in detail with respect to their financials and fundamental aspects.
7
OVERVIEW OF THE INDIAN SECURITIES MARKET
Introduction:-
The Indian security market, considered one of the most promising emerging markets, is among the top eight markets of the world. The stock exchange, Mumbai, which was established in 1875 as “The native Share and stock broker Association” (a voluntary non-profit making association), has evolved over the years into its present status as the premier Stock Exchange in the Country. At present 24 stock exchanges provide facilities for trading securities. Securities markets provide a common platform for transfer of fund from the person who has excess funds to those who need them. Securities market is regulated by the Securities & Exchange Board of India (SEBI).
Component of Security Market
The major components of the securities market are listed below:
Securities-Shares, Bonds, Debentures, Futures, options, Mutual Fund Units Intermediaries-Brokers, Sub brokers, Custodians, Share transfers agents, Merchant
Bankers Issuer of Securities-Companies, Bodies corporate, Government, Financial Institutions,
Foreign Institutional investors Market Regulators-SEBI, RBI, (to some extent), Department of Company Affairs

8
TELECOM SECTOR IN INDIAN ECONOMY
India, emerging as a major player:
In 1975, the Department of Telecom (DoT) was separated from P&T. DoT was responsible for telecom services in entire country until 1985 when Mahanagar Telephone Nigam Limited (MTNL) was carved out of DoT to run the telecom services of Delhi and Mumbai. In 1990s the telecom sector was opened up by the Government for private investment as a part of Liberalisation-Privatization-Globalization policy. Therefore, it became necessary to separate the Government's policy wing from its operations wing.
The Government of India corporatised the operations wing of DoT on October 01, 2000 and named it as Bharat Sanchar Nigam Limited (BSNL). Many private operators, such as Reliance India Mobile, Tata Telecom, Hutch, BPL, Bharti, Idea etc., successfully entered the high potential Indian telecom market.
Growth of mobile technology:
India has become one of the fastest growing mobile markets in the world [2]. The mobile services were commercially launched in August 1995 in India. In the initial 5-6 years the average monthly subscribers additions were around 0.05 to 0.1 million only and the total mobile subscribers base in December 2002 stood at 10.5 millions. However, after the number of proactive initiatives taken by regulator and licensor, the monthly mobile subscriber additions increased to around 2 million per month in the year 2003-04 and 2004-05.
Although mobile telephones followed the New Telecom Policy 1994, growth was tardy in the early years because of the high price of handsets as well as the high tariff structure of mobile telephones. The New Telecom Policy in 1999, the industry heralded several pro consumer initiatives. Mobile subscriber additions started picking up. The number of mobile phones added throughout the country in 2003 was 16 million, followed by 22 millions in 2004, 32 million in 2005 and 65 million in 2006 and over 100 million by mid of 2007. The only countries with more mobile phones than India with 156.31 million mobile phones are China – 408 million and USA – 185 million.
India has opted for the use of both the GSM (global system for mobile communications) and CDMA (code-division multiple access) technologies in the mobile sector. In addition to landline and mobile phones, some of the companies also provide the WLL service.
The mobile tariffs in India have also become lowest in the world. A new mobile connection can be activated with a monthly commitment of US$ 5 only. In 2005 alone 32 million handsets were sold in India. The data reveals the real potential for growth of the Indian mobile market.
9
NEW DEVELOPMENTS IN TELECOMMUNICATIONS SECTOR
Launch of MNP services Proposed telecommunications infrastructure policy Approach towards green telecommunications Proposed telecommunications equipment manufacturing policy New National Telecommunications Policy Update on lawful interception Comment
This update sets out some of the recent significant developments and proposed developments in the Indian telecommunications sector. All such developments and policy initiatives are aimed at making the sector more beneficial, for both service providers and consumers in India.
1. Launch of MNP services
Mobile number portability (MNP) services were launched in India on January 20 2011. MNP permits mobile phone users to change their service providers without having to forgo their numbers. To make use of the MNP service, a customer must pay a maximum of Rs19 to the new operator for 'porting' the number. The customer must send a text message from the existing phone to 1900. Based on this, a unique porting code will be sent by the existing service provider to the customer. The customer must then file an application with the new service provider mentioning the code for transferring the connection. A subscriber is eligible to make a request for porting his or her number provided that a period of 90 days has expired from:
The date of activation of his or her mobile connection in the case of a mobile number not ported earlier; or
From the date of activation of his or her mobile number after its last porting, in the case of a mobile number which has been ported earlier.
2. Proposed telecommunications infrastructure policy
On April 13 2011 the Telecom Regulatory Authority of India (TRAI) released its recommendations on telecommunications infrastructure policy. At present, India does not have a policy for ensuring the growth and deployment of an efficient telecommunications infrastructure. The TRAI has formulated recommendations based on a consultation process. This recommendation suggests, among other things, that:
the telecommunications infrastructure be treated as an essential infrastructure; infrastructure provider-1 (IP-1) companies be brought under the unified licence; telecommunications infrastructure provider companies be extended tax benefits; and
10
IP-1 companies be permitted to install and share active networks (limited to antenna, feeder cable, Node B, Radio Access Network and transmission systems), provided that they are brought under the proposed unified licensing regime.
3. Approach towards green telecommunications
On April 12 2011 the TRAI released its recommendations on the approach towards green telecommunications. With the increasing pervasiveness of mobile phones and the widespread adoption of information and communications technology (ICT) worldwide, the ICT sector is expected to contribute around 3% of global greenhouse gas emissions by 2020. While globally the telecommunications sector contributes around 0.7% of greenhouse gas emissions, the corresponding figure in India is 1%. While this might appear insignificant in absolute terms, the rapid growth of telecommunications envisaged over the next decade calls for an effort to contain and reduce its carbon footprint. Carbon emissions in the telecommunications sector are mainly from three areas - network operations, equipment manufacturing and waste disposal.
Among other things, the TRAI suggested that measures to make the telecommunications sector more environmentally friendly should be an integral part of the proposed National Telecom Policy. At least 50% of rural towers and 33% of urban towers should be powered by hybrid power (a combination of renewable energy technologies and grid power) by 2015, while all rural towers and 50% of urban towers should be hybrid-powered by 2020. By 2015, all products, equipment and services in the telecommunications network should be assessed for energy and performance and certified with a 'green passport', including an energy consumption rating (ECR), and an 'energy passport'.
The Telecommunications Engineering Centre (TEC) should be the nodal centre, which will certify telecommunications products, equipment and services on the basis of ECR ratings. The TEC can either appoint independent certifying agencies under its guidance or certify them through its quality assurance teams. The TEC must also prepare and issue an ECR document delineating the specifics of the test procedures and the measurement methodology used.
By 2015, all mobile phones must be free of brominates, chlorinated compounds and antimony trioxide in accordance with the E-waste (Management and Handling) Rules 2010 proposed by the Ministry of Environment and Forests, to be followed by all telecommunications manufacturers, as and when notified. All mobile manufacturers and distributors must place collection bins at appropriate places for the collection of e-waste, including mobile phones, batteries and chargers. All service providers must declare the carbon footprint of their network operations to the TRAI, in the prescribed format.

11
4. Proposed telecommunications equipment manufacturing policy
On April 12 2011 the TRAI also released its recommendations on telecommunications equipment manufacturing policy. These recommendations outline:
Policy targets; Measures to achieve these targets; A plan of action; The financial implications of the measures proposed; and The benefits of the policy.
The proposed policy aims to enhance the share of domestically manufactured products. They can be either Indian manufactured products (IMPs) or Indian products (IPs), based on where the IP rights reside. Under the proposal, domestically manufactured products will be given preferential market access, to the extent of the percentages indicated for them. All government licensees are required to give preference to an IP or IMP (in that order) before accessing low value-added products or imported products. Under the recommendations, all domestic manufacturers with an annual turnover of less than Rs10 billion will receive a subsidy for equity capital and working capital for a period of five years, at a rate of 6% for IP manufacturers and 3% for IMP manufacturers. The recommendations also propose a variety of fiscal incentives for domestically manufactured products.
5. New National Telecommunications Policy
The first National Telecommunications Policy (NTP) was announced by the government in 1994, when there were around 8 million telecommunications lines.(1) The 1994 NTP defined certain important objectives, including:
The availability of telephone on demand; The provision of basic telecommunications services at affordable and reasonable prices
and at world standards; and The promotion of India's emergence as a major manufacturing base and exporter of
telecommunications equipment.
Private sector participation was also invited, with licences issued to 14 operators in the private sector. In 1999 a new NTP was announced that further opened up the telecommunications sector for private sector participation. Key objectives of the 1999 NTP included:
Availability of affordable and effective access to telecommunications; Creation of a modern and efficient telecommunications infrastructure; Transformation of the telecommunications sector into a more competitive sector; and Enhanced efficiency and transparency in spectrum management.
12
The telecommunications sector has since witnessed drastic growth - by September 30 2010 the total telephone subscriber base had reached 723.28 million.(2) As a consequence, the minister of communications and information technology recently announced plans for a 2011 NTP. Consultations will be held with stakeholders to formulate a clear and transparent telecommunications regime covering:
Licensing; Spectrum allocation; Tariffs and pricing; Flexibility within licences; Spectrum sharing; Spectrum trading; and Mergers and acquisitions.
The minister also added that three elements - revenue for the government, affordable services to users and robust growth of the sector - would be the base on which the new telecommunications policy would be built.
6. Update on lawful interception
On October 18 2011 the Department of Telecommunication issued a public notice directed at all persons and companies that have imported, procured or possess equipment or sub-systems for the monitoring, interception or surveillance of communication. Such persons must inform the department of the details of such equipment within 60 days of publication of the notice, to the relevant telecommunications enforcement, resource and monitoring cells of the Department of Telecommunications.
The notice makes it clear that the government has the power to order the interception of telegraph messages (i.e., any communication sent by telegraph or given to a telegraph officer to be sent by telegraph or to be delivered) under the Telegraph Act 1885, in the interest of the sovereignty or integrity of India, the security of the state, friendly relations with foreign states or public order, or for preventing incitement to the commission of an offence. The Telegraph Act defines 'telegraph' as:
"any appliance, instrument, material or apparatus used or capable of use for transmission or reception of signs, signals, writing, images and sounds or intelligence of any nature by wire, visual or other electro-magnetic emissions, Radio waves or Hertzian waves, galvanic, electric or magnetic means".
7. Comment
Driven by various policy initiatives, the Indian telecommunications sector has witnessed a complete transformation in the last decade. It has achieved phenomenal growth during the last few years and is poised to take a big leap in the future.

13
HISTORY OF INDIAN TELECOMMUNICATIONIndia is the world’s fastest growing industry in the world in terms of number of wireless connections after China, with 811.59 million mobile phone subscribers.According to the world telecommunications industry, India will have 1.200 billion mobile subscribers by 2013.
Furthermore, projections by several leading global consultancies indicate that the total number of subscribers in India will exceed the total subscriber count in the China by 2013.
So how Telecommunication started in India??
Well Postal means of communication was the only mean communication until the year 1850. In 1850 experimental electric telegraph started for first time in India between Calcutta (Kolkata) and Diamond Harbor (southern suburbs of Kolkata, on the banks of the Hooghly River).
In 1851, it was opened for the use of the British East India Company. Subsequently construction of telegraph started throughout India. A separate department was opened to the public in 1854. Dr.William O’Shaughnessy, who pioneered the telegraph and telephone in India, belonged to the Public Works Department, and worked towards the development of telecom. Calcutta or the-then Kolkata was chosen as it was the capital of British India.In early1881, Oriental Telephone Company Limited of England opened telephone exchanges at Calcutta (Kolkata), Bombay (Mumbai), Madras (Chennai) and Ahmedabad. On the 28th January 1882 the first formal telephone service was established with a total of 93 subscribers.From the year 1902 India drastically changes from cable telegraph to wireless telegraph, radio telegraph, radio telephone, trunk dialing. Trunk dialing used in India for more than a decade, were system allowed subscribers to dial calls with operator assistance. Later moved to digital microwave, optical fiber, satellite earth station. During British period all major cities and towns in India were linked with telephones.
So who was looking after Telecom??
In the year 1975 Department of Telecom (DoT) was responsible for telecom services in entire country after separation from Indian Post & Telecommunication. Decade later Mahanagar Telephone Nigam Limited (MTNL) was chipped out of DoT to run the telecom services of Delhi and Mumbai.
In 1990s the telecom sector was opened up by the Government for private investment. In1995 TRAI (Telecom Regulatory Authority of India) was setup. This reduced the interference of Government in deciding tariffs and policy making. The Government of India corporatized the operations wing of DoT in 2000 and renamed Department of Telecom as Bharat Sanchar Nigam Limited (BSNL).
In last 10 years many private operator’s especially foreign investors successfully entered the high potential Indian telecom market. Globally acclaimed operators like Telenor, NTT Docomo, Vodafone, Sistema, SingTel, Maxis, Etisalat invested in India mobile operators.

14
Wireless Communication
Pager ServicesPager communication successful launched in India in the year 1995. Pagers were looked upon as devices that offered the much needed mobility in communication, especially for businesses. Motorola was a major player with nearly 80 per cent of the market share. The other companies included Mobilink, Pagelink, BPL, Usha Martin telecom and Easy call. Pagers were generally worn on the belt or carried in the pocket.
The business peaked in 1998 with the subscriber base reaching nearly 2 million. However, the number dropped to less than 500,000 in 2002. The pager companies in India were soon struggling to maintain their business. While 2-way pagers could have buffered the fall, the pager companies were not in a position to upgrade their infrastructure to improve the ailing market. The Indian Paging Services Association was unable to support the industry.Pager companies in India also offered their services in regional languages also. However, the end had begun already. By 2002, Motorola stops making or servicing pagers. When mobile phones were commercially launched in India, the pager had many advantages to boast. Pagers were smaller, had a longer battery life and were considerably cheaper. However, the mobile phones got better with time and continuously upgraded themselves.
Mobile CommunicationFirst mobile telephone service on non-commercial basis started in India on 48th Independence Day at country’s capital Delhi. The first cellular call was made in India on July 31st, 1995 over Modi Telstra’s MobileNet GSM network of Kolkata. Later mobile telephone services are divided into multiple zones known as circles. Competition has caused prices to drop and calls across India are one of the cheapest in the world.
Most of operator follows GSM mobile system operate under 900MHz bandwidth few recent players started operating under 1800MHz bandwidth. CDMA operators operate under 800Mhz band, they are first to introduce EVDO based high speed wireless data services via USB dongle. In spite of this huge growth Indian telecom sector is hit by severe spectrum crunch, corruption by India Govt. officials and financial troubles.
In 2008, India entered the 3G arena with the launch of 3G enabled Mobile and Data services by Government owned MTNL and BSNL. Later from November 2010 private operator’s started to launch their services.
Broadband communicationAfter US, Japan, India stands in third largest Internet users of which 40% of Internet used via mobile phones. India ranks one of the lowest provider of broadband speed as compared countries such as Japan, India and Norway. Minimum broadband speed of 256kbit/s but speed above 2Mbits is still in a nascent stage.
Year 2007 had been declared as “Year of Broadband” in India. Telco’s based on ADSL/VDSL in India generally have speeds up to 24Mbit max while those based on newer Optical Fiber technology offer up to 100Mbits in some plans Fiber-optic communication (FTTx). Broadband growth has been plagued by many problems. Complicated tariff structure, metered billing, High charges for right of way, Lack of domestic content, non implementation of Local-loop unbundling have all resulted in hindrance to the growth of broadband.

15
Next Generation Network (NGN)Next Generation Networks, multiple access networks can connect customers to a core network based on IP technology. These access networks include fiber optics or coaxial cable networks connected to fixed locations or customers connected through Wi-Fi as well as to 3G networks connected to mobile users.
As a result, in the future, it would be impossible to identify whether the next generation network is a fixed or mobile network and the wireless access broadband would be used both for fixed and mobile services. It would then be futile to differentiate between fixed and mobile networks both fixed and mobile users will access services through a single core network. Cloud based data services are expected to come.
Indian SatellitesIndia has launched more than 50 satellites of various types, since its first attempt in 1975. The organization responsible for Indian satellites is the Indian Space Research Organization (ISRO). Most Satellites have been launched from various vehicles, including American, Russian, European satellite-launch rockets, and the U.S. Space Shuttle. First Indian satellite Aryabhata on 19th April 1975, later Bhaskara, Rohini, INSAT, Edusat, IRS, GSAT, Kalpana, Cartosat, IMS, Chandrayaan, ResourceSat, RiSat, AnuSat, etc.
Well guys this is how telecom Industry is growing in India, hope to see India far ahead of other countries in near future.
16
INDIAN TELECOM INDUSTRY
CURRENT SCENARIOS
If I look two years back, a mobile user would never have imagined that two years down the line he could be talking to someone on an STD call at a tariff quite less than that of local calls! This has happened and we all are witnessing it.
The competition in present Indian market has never been so intense as it is now, no matter if the operator is incumbent or a newbie, we can hear about the launch of new tariff plans, easy recharge vouchers, free minutes calling and more exclusive services almost on daily basis and still feel that a lot more is yet to come. It seems that one day an ideal mobile user will be confused about what plan to choose among the countless options available. Anyway that day seems to be near and we all are going to witness that but what our eyes are witnessing right now is the punch line “Why can’t your mobile operator count in seconds?”
Have you ever gone through this suchlike? If ‘Yes’ then you would be reading about none other than TATA DOCOMO.
During its early launch, some conceptions were held that would TATA flourish with its GSM network or not? There are still so many GSM operators in India would TATA be able to make a mark among this huge set of competition? Yet it has proved its mark by achieving a milestone – 5 lakh subscribers in Tamil Nadu circle, barely a month after the launch of its service.
The launch of new tariff plans which captured every talking mouth and it’s 1p/sec or the launch of “Diet SMS”, wherein the company will levy charges only for the characters sent in the short message under the scheme Diet-SMS. Moreover its website is showing us how much we can save by getting per sec pulse scenario amazing!!! Also the launch of ‘Pay Per Call’ plan by TATA INDICOM thrived the telecom industry as the way by any CDMA operator has done, till now.
All this again resulted in the permanent setting of a per-second pulse and lesser tariffs by other GSM/CDMA operators too – AIRCEL & MTS. The recently released data of net telecom subscribers added in the month of August released by COAI, shows a steady decline in the count of new GSM subscribers. The expert says that it was quite expected – we can have a look at the number of new GSM subscribers being added month on month: 10.8 million (March 2009), 9.89 million (July 2009) and 9.74 million (August 2009).
The questions still arise: Whether these trends can pose a threat to upcoming Telecom operators who have yet to start their operations or in future time something else is to be seen! Whether is it about the total number of subscriber base or new subscribers added by an
17
operator in August, AIRTEL is maintaining its position at no 1 spot. IDEA, AIRCEL & RELIANCE GSM have shown a steady growth in net % gain in comparison with previous month, with IDEA Cellular showing 0.03% gain, Aircel has 0.18% and Reliance GSM 0.02% gain all the way.
The dates for the 3G auction have been announced and Mobile Number Portability (MNP) declared to hit the country in December 2009, but the future talks / presumptions remain the same about MNP. “Will subscribers start jumping from existing incumbent operator to newbie’s giving more lucrative plans” and the mentioned point feels quite debatable, I have been asked many a times about my views on the same so I just want to share with all our esteemed reader of TELECOM TALK what my guess would be: the most use of MNP will be done amongst the youth segment and that too for getting group plans free/CUGs more low tariff’s, and mostly for those who calls to any one number particularly the most and want that they must pay the less they can.
Secondly MNP would be a thought for that person who is frustrated with his over-busy network during peak hours and daily ridicules the network, because of what use is a cell phone indeed if one cannot make an urgent call at his desired time. The same thought applies for a person who has to often roam out of his home network and he’ too once again becomes a victim of network not supporting him fully when in roaming or charges which are way too high!
Another factor affecting MNP will be “Word of mouth’” – yes and quite obviously there are very less people who read telecom articles & news. If one’s friend tells the other that he is getting N number of benefits in his or her plan given by this network and if plans are really affable this type of “Word of mouth” will generally influence an ideal customer to think about MNP. The fifth genre comes of ‘Operator loyal customers’ who are using a particular operator for years and don’t face network hazards often and are quite happy with the services, mostly this segment comprises of post-paid customers. This genre will be least prone to MNP. These were some of the scenarios related to MNP and there could be many had any one talked about the shifting of co-corporate connections in name of MNP if not then also give a thought.
So Operators hold your subscribers firmly, provide them with good network coverage, lucrative plans etc. because the only thing which was previously holding a dissatisfied subscriber was the retention of the same ’10digit mobile number’ and now he’s about to get the privilege of shifting to the rosiest garden available in the telecom sphere!All Our TELECOM TALK reader are invited to share their views freely on the current Indian telecom scenarios ‘healthy & beneficial discussions Not just lame comments please share your valuable views.
18
TELECOM COMPANY – COST ANALYSIS
After discussing the revenue aspects of telecom service providers, let us now understand the major cost heads for these companies. These cost heads can be broken up into regulated and non-regulated costs. Entry fee, access deficit charge and license fee are regulated. On the other hand, sales, general and administrative (SG&A) and employee expenses are non-regulated in nature.
Entry fee:
The companies providing national and international long distance (NLD and ILD) services are required to pay a flat entry fee of Rs 25 m each (from earlier fees of Rs 1,000 m and Rs 250 m respectively). These fees are to be paid to the central government for obtaining a license for providing these services.
Access deficit charge:
The government also collects from the cellular operators an access deficit charge. The charge payable is 1.5% percent of non-rural annual gross revenue (AGR) of the telecom service providers and the amount collected is used to subsidise the telecom service provided by BSNL in rural areas.
License fees:
Telecom companies are required to pay an annual license fee of 6% of their AGR to the Government of India. Licenses offered to the telecom players are for a limited period of time and these are required to be renewed on expiry.
SG&A expenses:
Telecom companies incur expenditure in the form of advertisement costs for enhancing their visibility and also to make their brand more appealing to the consumers. Expenses are also incurred on customer acquisition and on maintenance of telecom equipment and network.
Personnel expenditure:
These are costs incurred for maintaining the staff for executing the telecom companies' marketing strategies, for general administrative purposes, for maintenance and repair of telecom infrastructure, and customer relationship management in call centres.
Apart from these operating costs, telecom companies also incur cost for servicing debt and tax payments. Telecom is an operating leverage play (indicates that each new subscriber will come at a higher profitability than the previously added subscriber), and, as such, the benefits of faster subscriber addition are directly seen on companies' improving operating profitability (as fixed costs are apportioned over a larger subscriber base).
19
NEW TELECOM POLICYIn the spotlight is the upcoming new telecom policy. Early signs pointed to a policy that will charge additional fees for licences and spectrum restrict mergers and acquisitions and impose limitations on companies, such as a curb on sharing spectrum between operators. It was quite contradictory to the early discourse from the telecom ministry that Kapil Sibal took over.
Yet the new policy is unlikely to come out before the second half of 2012 given the large number of stakeholders. Till then, companies will bide their time and survive on incremental moves rather than any major strategic corporate action, said Ajay Srinivasan, head of industry research at CRISIL. The sector is hopeful that the long-awaited reform will make it profitable again, issuing a universal license, rather than separating the country into 22 different circles or service areas.
The industry expects a clearer statement on spectrum and licence charges. After paying a hefty Rs 51,000 crore for 3G airwaves the private sector telecom companies also expect increased charges on the current voice calling technology they are using.
Nilangshu Katriar, partner in the Indian arm of Ernst & Young Global, said charges on additional spectrum, clarity on terms of license renewal, and terms of spectrum trading will be essential elements of the policy that will govern the future interest of investors in the sector.
The government, seeing the success of the auction of 3G spectrums, has set targets on revenue from telecom companies, including fees from auctioning new airwaves in the 700 MHz frequency. However, operators say bidding for spectrum is not likely to beat that of the 3G auction. Vodafone India chief Marten Pieters said that the 3G spectrum bids them would have been half had there been four available slots instead of three.
"I wish they stop squeezing the sector like a lemon and take a more moderate view keeping in mind companies need to generate returns," said a senior official at one of the top three Indian telecom operators.
Ballooning debt from 3G licence fees, high interest rates and a lending freeze on the sector since the outbreak of the 2G scam have brought expansion and investments from telecom companies in India to a near standstill. Companies have been consolidating and providing 3G services in areas where they see highest revenue opportunity, such as metro cities.
20
FUNDAMENTAL
ANALYSIS
Fundamental analysis refers to the study of the core underlying elements that influence the economy of a particular entity. It is a method of study that attempts to predict
21
price action and market trends by analyzing economic indicators, government policy and societal factors (to name just a few elements) within a business cycle framework.
I. ECONOMIC ANALYSIS:
POLITICO-ECONOMIC ANALYSIS:
No industry or company can exist in isolation. It may have splendid managers and a tremendous product. However, its sales and its costs are affected by factors, some of which are beyond its control - the world economy, price inflation, taxes and a host of others. It is important, therefore, to have an appreciation of the politico-economic factors that affect an industry and a company.
II. INDUSTRY ANALYSISThe importance of industry analysis is now dawning on the Indian investor as never before.
1. BARRIER TO ENTRY
New entrants increase the capacity in an industry and the inflow of funds. The question that arises is how easy is it to enter an industry?
There are some barriers to entry:
a) Economies of scale
b) Product differentiation
c) Capital requirement
d) Government policy
2. THE THREAT OF SUBSTITUTION
New inventions are always taking place and new and better products replace existing ones. An industry that can be replaced by substitutes or is threatened by substitutes is normally an industry one must be careful of investing in. An industry where this occurs constantly is the packaging industry -bottles replaced by cans, cans replaced by plastic bottles, and the like. To ward off the threat of substitution, companies often have to spend large sums of money in advertising and promotion.
3. BARGAINING POWER OF THE BUYERS
22
In an industry where buyers have control, i.e. in a buyer's market, buyers are constantly forcing prices down, demanding better services or higher quality and this often erodes profitability.
4. BARGAINING POWER FOR THE SUPPLIERS
An industry unduly controlled by its suppliers is also under threat.
5. RIVALRY AMONG COMPETITORS
Rivalry among competitors can cause an industry great harm. This occurs mainly by price cuts, heavy advertising, additional high cost services or offers, and the like.
III. COMPANY ANALYSIS:
At the final stage of fundamental analysis, the investor analyzes the company. This analysis has two thrusts:
How has the company performed vis-à-vis other similar companies?
And
How has the company performed in comparison to earlier years?
It is imperative that one completes the politico economic analysis and the industry analysis before a company is analyzed because the company's performance at a period of time is to an extent a reflection of the economy, the political situation and the industry. What does one look at when analyzing a company?
The different issues regarding a company that should be examined are:
The Management The Company The Annual Report Ratios
THE MANAGEMENT:

23
The single most important factor one should consider when investing in a company and one often never considered is its management. In India management can be broadly divided in two types:
Family Management Professional Management
THE COMPANY:
An aspect not necessarily examined during an analysis of fundamentals is the company. A company may have made losses consecutively for two years or more and one may not wish to touch its shares - yet it may be a good company and worth purchasing into. There are several factors one should look at.
THE ANNUAL REPORT:
The primary and most important source of information about a company is its Annual Report. By law, this is prepared every year and distributed to the shareholders. Annual Reports are usually very well presented. A tremendous amount of data is given about the performance of a company over a period of time.
The Annual Report is broken down into the following specific parts:
A) The Director's Report,
B) The Auditor's Report,
C) The Financial Statements, and
D) The Schedules and Notes to the Accounts.
RATIOS:
Ratios express mathematically the relationship between performance figures and/or assets/liabilities in a form that can be easily understood and interpreted. No single ratio tells the complete story. Ratios can be broken down into four broad categories:
Profit and Loss Ratios
24
These show the relationship between two items or groups of items in a profit and loss account or income statement.
Balance Sheet RatiosThese deal with the relationship in the balance sheet such as:
1. Current assets to current liabilities.
2. Liabilities to net worth.
Balance Sheet and Profit and Loss Account Ratios.These relate an item on the balance sheet to another in the profit and loss account such as:
1. Earnings to shareholder's funds.
2. Net income to assets employed.
Financial Statements and Market RatiosThese are normally known as market ratios and are arrived at by relative financial figures to market prices:
1. Market value to earnings and
2. Book value to market value.
(a) Market value
(b) Earnings
(c) Profitability
The major ratios that are considered:
(i) Market value
(ii) Price- earnings ratio
(iii) Market-to-book ratio
(iv) Earnings
(v) Earnings per share
(vi) Dividend per share
25
COMPANY OVERVIEW
“CHOLAMANDALAM SECURITIES LTD”
“CHOLAMANDALAM SECURITIES LTD”
26
Cholamandalam Investment and Finance Company Ltd (CIFCL) was incorporated in 1978 with initially offering asset finance through leasing and hire purchase to corporates and then to retail customers. It has since evolved itself into a large, composite financial services organization. Today, Cholamandalam Investment and Finance Company Ltd (CIFCL) offers stock broking, mutual fund and investment advisory services through its subsidiaries. The basic tenet of their values is a strict adherence to ethics and a responsibility to all those who come within its corporate ambit - customers, shareholders, employees and society
Products offered
VEHICLE FINANCEHOME EQUITY LOANSCORPORATE MORTGAGEGOLD LOANSSECURITIESDISTRIBUTION SERVICES
27
Vehicle financeChola Vehicle Finance offers finance for a large variety of vehicles through a wide range of products. It includes products from small commercial vehicles to Light and Heavy Commercial Vehicles and from Multi Utility Vehicles to tractors and cars. They offer finance for both new and used vehicles.
Home equity loansIt provides home equity loans at affordable rates. It provides loans from 10 lakhs to 5 crores depending on the needs. Longer tenure loans for easy repayment. They also provide fast track approvals and special products for self-employed.
Corporate mortgage financeThe Corporate mortgage finance division caters primarily to Corporate, Promoters, High Net worth Individuals and Retail investors. The acceptable collaterals are listed Equity shares, Mutual Fund units, Add Gold ETFs, Property in nature of commercial/residential space and other assets.
Gold loansInnovative strategies representing their philosophy of safety, trust and transparency is provided to the gold loan customers. Chola also intends to be part of the financial inclusion strategy by serving customers who are bereft of banking services.
SecuritiesCholamandalam Securities is a registered Member of NSE and BSE since 1995 and a depository participant in National Securities Depository Ltd (NSDL) and Central Depository Services Ltd (CDSL). The company offers its clients a complete package in broking services, with an on-line and off line trading platform, enabling prompt customer service. The company provides advisory services to its select client base, through responsive research and scientific market analysis. The company also created a Mutual Fund Service System (MFSS), enabling Mutual Fund and Equity transactions through a single window
Distribution servicesCholamandalam Distribution Services provides wealth management services to its 2,000 plus client base. As part of its growth initiatives, the division has created sectoral , client servicing groups, to handle Portfolio spreads in Mutual Funds, Corporate Deposits, Infrastructure Bonds, Share Trading and other fee based financial products. Educational loans and facilitation of real estate transactions are the other financial services here. To enlarge the scope of its operations, the company entered into cross sell tie-ups with the Group companies, accessing a large and captive client base.
Net profit (in Rupees Billions)

28
00.20.40.60.8
11.21.41.61.8
2
0.590.42
0.15
0.620000000000001
1.72
YEAR
2008 2009 2010 2011 2012
Revenue from each segment (Year ended March 2012)
Financial99.21%
Distribution0.50%
Broking0.28%
Majority of the revenues came from the financial services put together. Broking contributes to 0.28% and distribution service contributes to 0.50%.
MANAGEMENT

29
Cholamandalam Investment and Finance Company Ltd (CIFCL), in its efforts to pursue principles of corporate governance, have the following management team.
Mr. M B N Rao ChairmanMr. N Srinivasan Vice-ChairmanMr. Vellayan Subbiah Managing DirectorMr Kaushik Banerjee President Asset FinanceMr. Rohit Phadke Sr. Vice President & Business Head-Home Equity
Mr. Arul Selvan, Sr. Vice President & Chief Financial Officer
SHARE HOLDING PATTERN
Promoters62%
Other institu-tional
and in-dividual
in-vestors
9%
29%
International finance corporation
CHOLAMANDALAM SECURITIES LIMITED

30
It was started in 1994 and is a subsidiary of Cholamandalam investment and finance limited. It provides broking services to HNIs and Institutional Investors It is present across 11 metro’s and mini metro’s Strong dealing team with state of art technology E- broking facilities
It is a registered member of the National stock exchange (NSE) and Bombay stock exchange (BSE) since 1995 and a depository participant in National Securities Depository Ltd (NSDL) and Central Depository Services Ltd (CDSL).
Revenue since 5 years (Rs in Million)
0
50
100
150
200
250206
137 132101
63
YEAR
2008 2009 2010 2011 2012
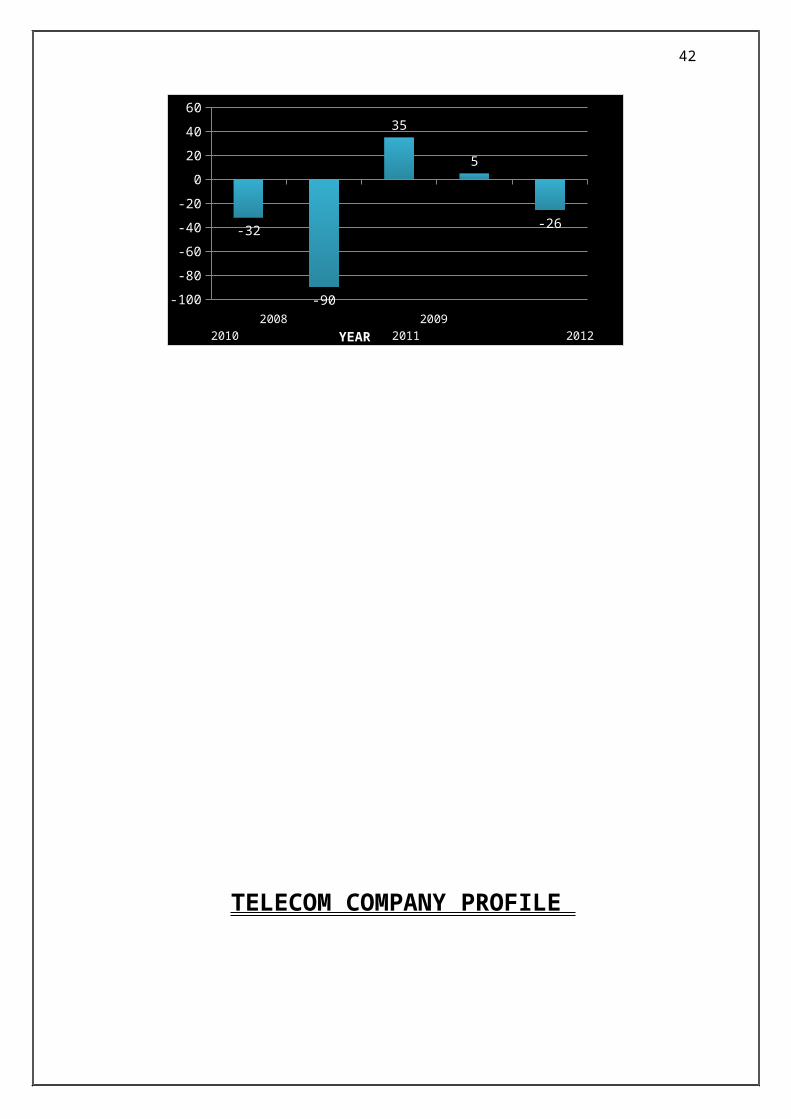
Profit before tax (Rs in Millions)
-100
-80
-60
-40
-20
0
20
40
60
-32
-90
35
5
-26
YEAR 2008 2009 2010 2011 2012

31
TELECOM COMPANY PROFILE
32
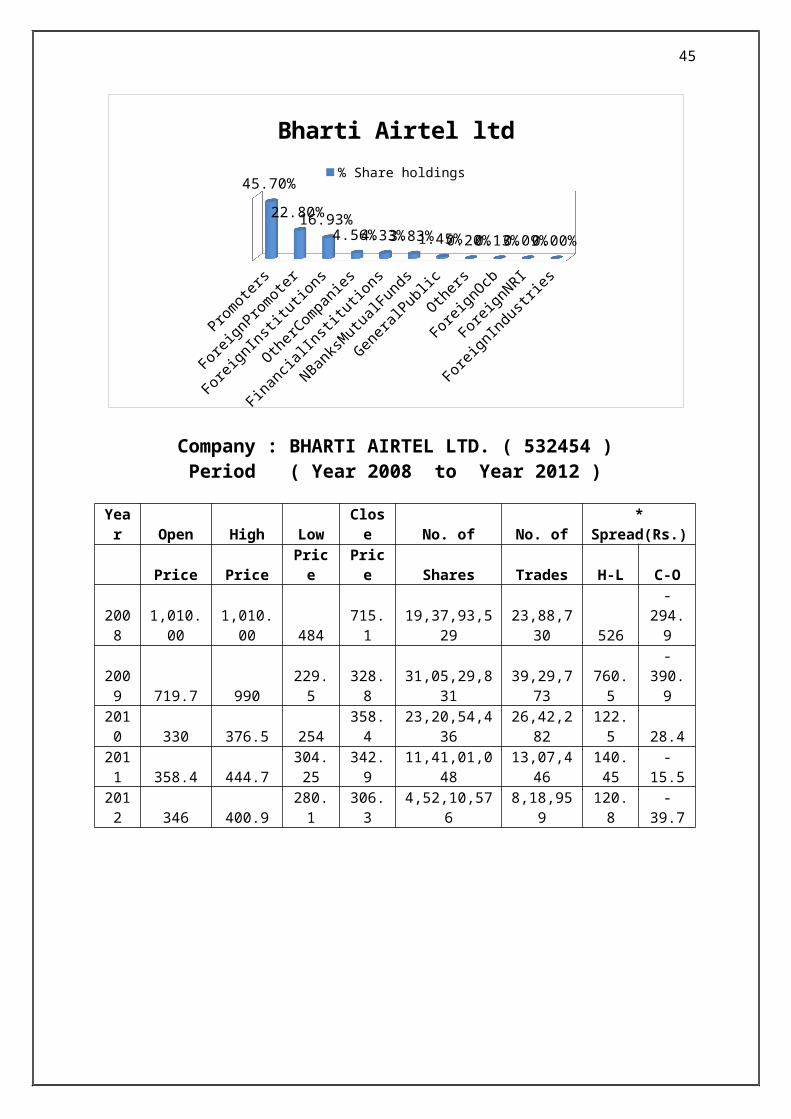
BHARTI AIRTEL
Bharti Airtel Limited is a leading integrated telecommunications company with operations in 20 countries across Asia and Africa. Headquartered in New Delhi, India, the company ranks amongst the top 5 mobile service providers globally in terms of subscribers. In India, the company's product offerings include 2G, 3G and 4G services, fixed line, high speed broadband through DSL, IPTV, DTH, enterprise services including national & international long distance services to carriers. In the rest of the geographies, it offers 2G, 3G mobile services. Bharti Airtel had over 246 million customers across its operations at the end of February 2012.
Highlights Airtel brings the 4G revolution to Bengaluru Airtel forays into mobile advertising Airtel announces all new affordable tariffs for 3G customers Bharti Airtel and Axis Bank announce strategic alliance for financial inclusion National Telecom Awards 2012 acknowledges Bharti Airtel's network strength Bharti
Airtel announces its fourth quarter and full year ended March 31, 2012 on May 2, 2012.
Shareholding pattern - Bharti Airtel Ltd. Holder's Name No of Shares % Share HoldingPromoters 1735453890 45.70%Foreign Promoter 865673286 22.80%Foreign Institutions 642750737 16.93%Other Companies 173105810 4.56%Financial Institutions 164470503 4.33%N Banks/Mutual Funds 145295224 3.83%General Public 54993607 1.45%Others 7457739 0.20%Foreign Ocb 5082710 0.13%Foreign NRI 3246535 0.09%Foreign Industries 55 0.00%
33
Promoters
ForeignPromoter
ForeignInsti
tutions
OtherCompan
ies
Financia
lInsti
tutions
NBanksM
utualFunds
Genera
lPublic
Others
ForeignOcb
ForeignNRI
ForeignIndustr
ies
45.70%
22.80%16.93%
4.56% 4.33% 3.83% 1.45% 0.20% 0.13% 0.09% 0.00%
Bharti Airtel ltd% Share holdings
Company : BHARTI AIRTEL LTD. ( 532454 ) Period ( Year 2008 to Year 2012 )
Year Open High Low Close No. of No. of * Spread(Rs.) Price Price Price Price Shares Trades H-L C-O
2008 1,010.00 1,010.00 484 715.1 19,37,93,529 23,88,730 526 -294.92009 719.7 990 229.5 328.8 31,05,29,831 39,29,773 760.5 -390.92010 330 376.5 254 358.4 23,20,54,436 26,42,282 122.5 28.42011 358.4 444.7 304.25 342.9 11,41,01,048 13,07,446 140.45 -15.52012 346 400.9 280.1 306.3 4,52,10,576 8,18,959 120.8 -39.7
2008 2009 2010 2011 20120.00
200.00
400.00
600.00
800.00
1,000.00
1,200.00
Open PriceHigh PriceLow PriceClose Price

34
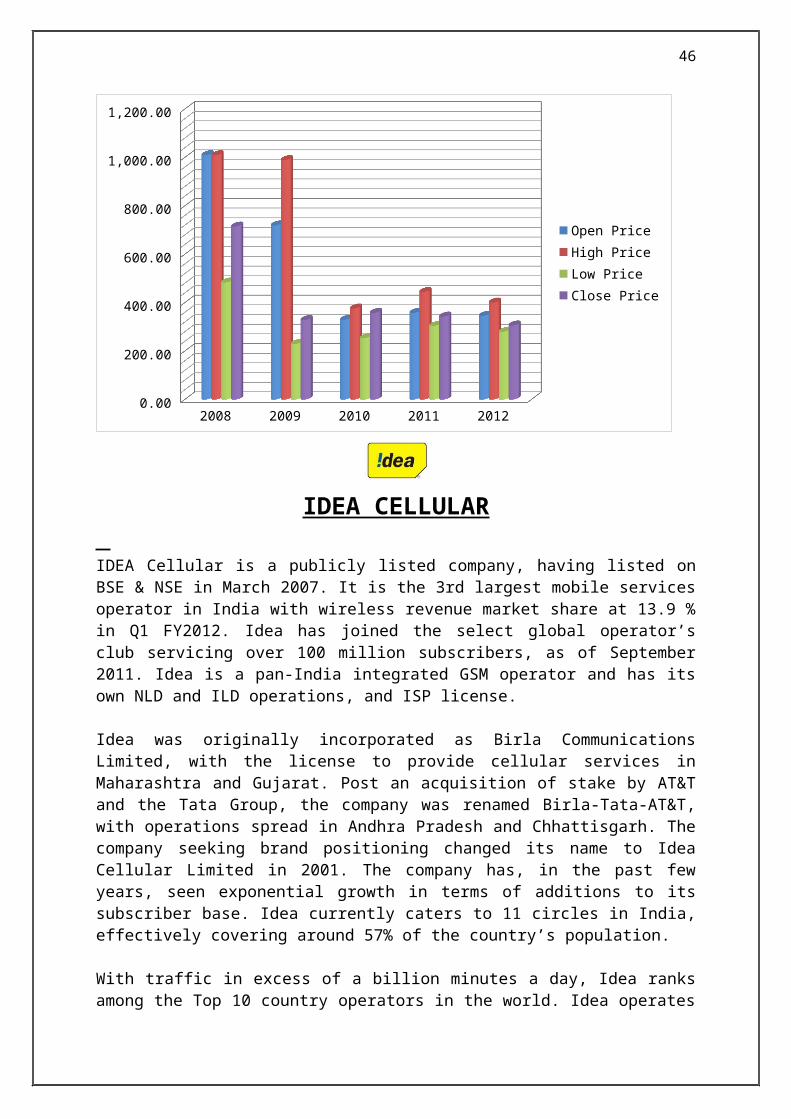
IDEA CELLULAR IDEA Cellular is a publicly listed company, having listed on BSE & NSE in March 2007. It is the 3rd largest mobile services operator in India with wireless revenue market share at 13.9 % in Q1 FY2012. Idea has joined the select global operator’s club servicing over 100 million subscribers, as of September 2011. Idea is a pan-India integrated GSM operator and has its own NLD and ILD operations, and ISP license.
Idea was originally incorporated as Birla Communications Limited, with the license to provide cellular services in Maharashtra and Gujarat. Post an acquisition of stake by AT&T and the Tata Group, the company was renamed Birla-Tata-AT&T, with operations spread in Andhra Pradesh and Chhattisgarh. The company seeking brand positioning changed its name to Idea Cellular Limited in 2001. The company has, in the past few years, seen exponential growth in terms of additions to its subscriber base. Idea currently caters to 11 circles in India, effectively covering around 57% of the country’s population.
With traffic in excess of a billion minutes a day, Idea ranks among the Top 10 country operators in the world. Idea operates across all 22 service areas with 2G services, and 3G services are being progressively rolled out to cover over 3,000 towns by FY 2012.
Idea has a network of over 70,000 cell sites covering the entire length and breadth of the country. Idea has over 3,000 Service Centres servicing Idea subscribers across the country, including 450 special Experience Zones for 3G promotion. Idea’s service delivery platform is ISO 9001:2008 certified, making it the only operator in the country to have this standard certification for all 22 service areas and the corporate office. Idea’s strong growth in the Indian telephony market comes from its deep penetration in non-urban & rural markets. It has the highest share of rural subscribers as a percentage of total subscribers, amongst other GSM players. In fact, 2 out of every 3 new Idea subscribers come from rural/ semi-urban India. Idea is the winner of ‘The Emerging Company of the Year Award’ at The Economic Times Corporate Excellence Awards 2009. IDEA Cellular also received the prestigious Avaya Global Connect Award for being the ‘Most Customer Responsive Company’ in the Telecom sector in the year 2010. The company has received several other national and international recognitions for its path-breaking innovations in mobile telephony products & services. It won the GSM Association Award for ‘Best Billing and Customer Care Solution’ for 2 consecutive years. It was awarded ‘Mobile Operator of the Year Award – India’ for 2007 and 2008 at the Annual Asian Mobile News Awards. IDEA Cellular is an Aditya Birla Group Company, India’s first truly multinational corporation. The group operates in 33 countries, and is anchored by more than 132,000 employees belonging to 42 nationalities.

35
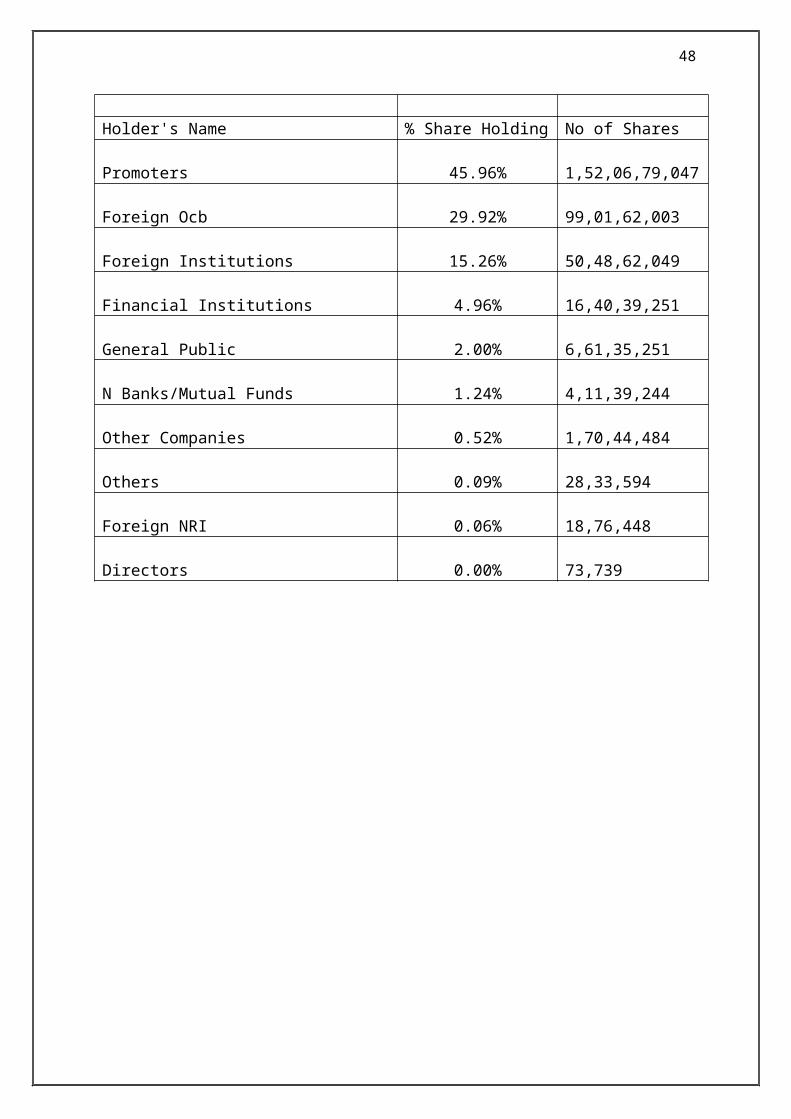
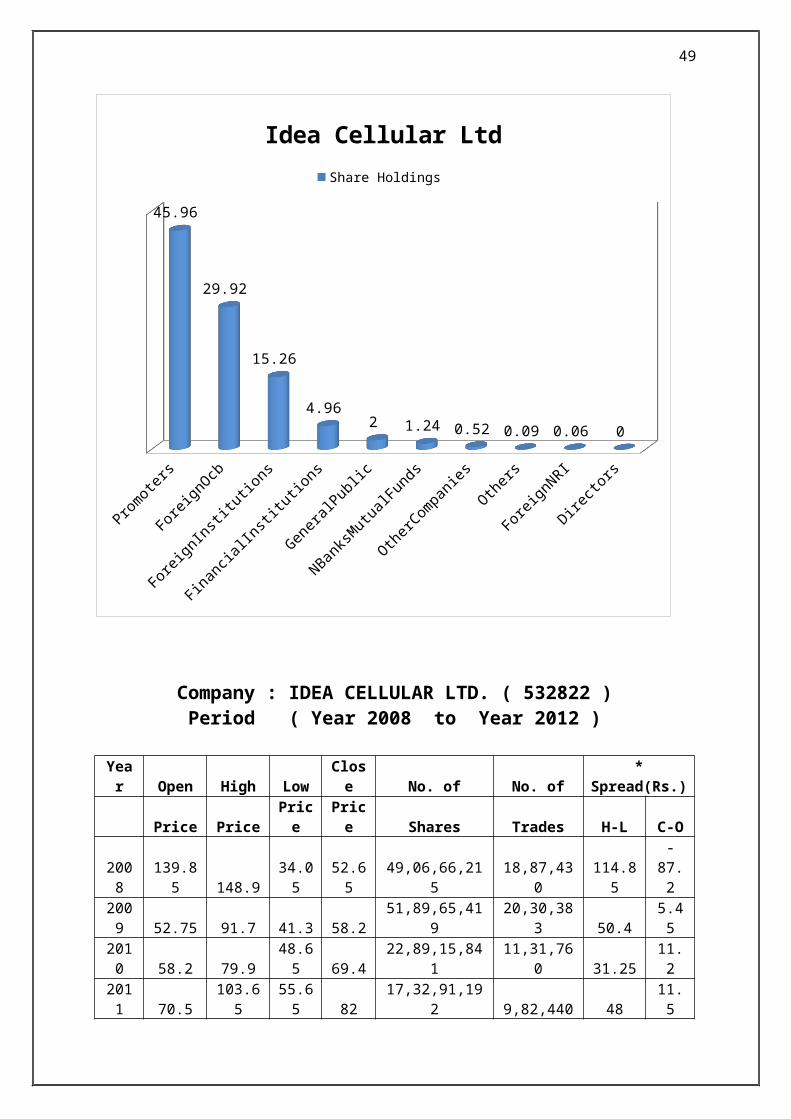
Shareholding pattern - Idea Cellular Ltd.
Holder's Name % Share Holding No of SharesPromoters 45.96% 1,52,06,79,047 Foreign Ocb 29.92% 99,01,62,003 Foreign Institutions 15.26% 50,48,62,049 Financial Institutions 4.96% 16,40,39,251 General Public 2.00% 6,61,35,251 N Banks/Mutual Funds 1.24% 4,11,39,244 Other Companies 0.52% 1,70,44,484 Others 0.09% 28,33,594 Foreign NRI 0.06% 18,76,448 Directors 0.00% 73,739
Promoters
ForeignOcb
ForeignInsti
tutions
Financia
lInsti
tutions
Genera
lPublic
NBanksM
utualFunds
OtherCompan
ies
Others
ForeignNRI
Directo
rs
45.96
29.92
15.26
4.962 1.24 0.52 0.09 0.06 0
Idea Cellular LtdShare Holdings

36
Company : IDEA CELLULAR LTD. ( 532822 ) Period ( Year 2008 to Year 2012 )
Year Open High Low Close No. of No. of * Spread(Rs.) Price Price Price Price Shares Trades H-L C-O
2008 139.85 148.9 34.05 52.65 49,06,66,215 18,87,430 114.85 -87.22009 52.75 91.7 41.3 58.2 51,89,65,419 20,30,383 50.4 5.452010 58.2 79.9 48.65 69.4 22,89,15,841 11,31,760 31.25 11.22011 70.5 103.65 55.65 82 17,32,91,192 9,82,440 48 11.52012 82.2 102.15 71.2 74.15 4,72,15,196 3,24,698 30.95 -8.05
2008 2009 2010 2011 20120
20
40
60
80
100
120
140
160
Open PriceHigh Pricelow PriceClose Price
37
RELIANCE COMMUNICATIONSReliance Communications Ltd. (commonly called RCOM) is an Indian broadband and telecommunications company headquartered in Navi Mumbai, India. RCOM is the world's 16th largest mobile phone operator with over 150 million subscribers. Established on 2004, a subsidiary of the Reliance Group. The company has five segments: Wireless segment includes wireless operations of the company; broadband segment includes broadband operations of the company; Global segment include national long distance and international long distance operations of the company and the wholesale operations of its subsidiaries; Investment segment includes investment activities of the Group companies, and Other segment consists of the customer care activities and direct-to-home (DTH) activities. Reliance Communications is notorious for its actions against freedom of speech getting sites like vimeo blocked by its sister concern [Reliance Entertainment].
Main subsidiaries1. Reliance Telecommunication Limited (RTL)
In July 2007, the company announced it was buying US-based managed ethernet and application delivery services company Yipes Enterprise Services for a cash amount of 1200 crore (the equivalent of US$300 million). The deal was announced of the overseas acquisition, the Reliance group has amalgamated the United States-based Flag Telecom for $210 million (roughly 950 crore). RTL operates in Madhya Pradesh, West Bengal, Himachal Pradesh, Orissa, Bihar, Assam, Kolkata and Northeast, offering GSM services.
2. Reliance Tech Services
Reliance Tech Services is the IT wing of Reliance Anil Dhirubhai Ambani group. It provides IT consultancy, business process outsourcing and software development for Reliance Communications and other ADA group companies. It provides services to industry sectors such as telecommunications, financial services, utilities, entertainment, infrastructure, BPO operations and health care.
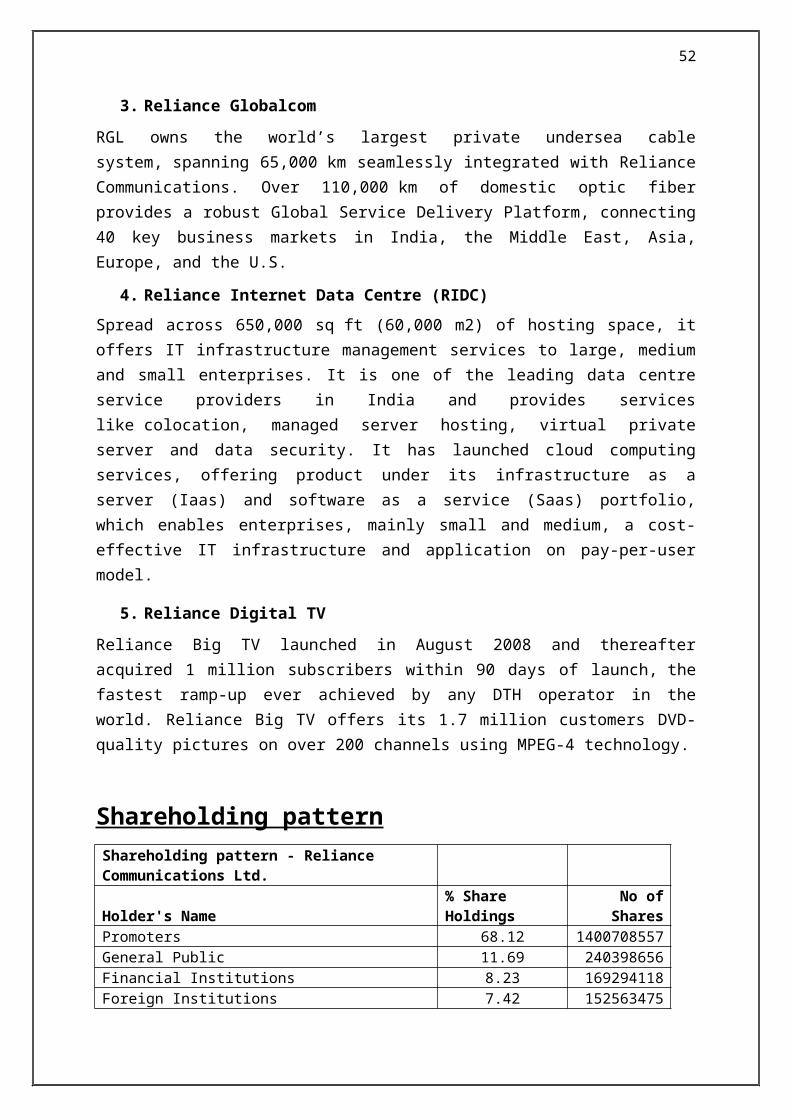
3. Reliance Globalcom
RGL owns the world’s largest private undersea cable system, spanning 65,000 km seamlessly integrated with Reliance Communications. Over 110,000 km of domestic optic fiber provides a robust Global Service Delivery Platform, connecting 40 key business markets in India, the Middle East, Asia, Europe, and the U.S.
4. Reliance Internet Data Centre (RIDC)Spread across 650,000 sq ft (60,000 m2) of hosting space, it offers IT infrastructure management services to large, medium and small enterprises. It is one of the leading data centre service providers in India and provides services like colocation, managed server hosting, virtual private server and data security. It has launched cloud computing services,

38
offering product under its infrastructure as a server (Iaas) and software as a service (Saas) portfolio, which enables enterprises, mainly small and medium, a cost-effective IT infrastructure and application on pay-per-user model.
5. Reliance Digital TV
Reliance Big TV launched in August 2008 and thereafter acquired 1 million subscribers within 90 days of launch, the fastest ramp-up ever achieved by any DTH operator in the world. Reliance Big TV offers its 1.7 million customers DVD-quality pictures on over 200 channels using MPEG-4 technology.
Shareholding patternShareholding pattern - Reliance Communications Ltd. Holder's Name % Share Holdings No of SharesPromoters 68.12 1400708557General Public 11.69 240398656Financial Institutions 8.23 169294118Foreign Institutions 7.42 152563475Other Companies 2.75 56473974N Banks/Mutual Funds 1.08 22261355Foreign NRI 0.66 13641243Central Govt 0.05 984211
Promoters
Genera
lPublic
Financia
lInsti
tutions
ForeignInsti
tutions
OtherCompan
ies
NBanksM
utualFunds
ForeignNRI
Centra
lGovt
68.12
11.69 8.23 7.422.75 1.080.6600000000000050.05
Reliance Communication% Share Holdings

39
Company : RELIANCE COMMUNICATIONS LTD. ( 532712 ) Period ( Year 2008 to Year 2012 )
Year Open High Low Close No. of No. of * Spread(Rs.) Price Price Price Price Shares Trades H-L C-O
2008 749.7 844 148.6 227.25 63,73,56,180 96,17,115 695.4 -522.452009 228 359 131.35 172.9 79,47,52,129 91,41,946 227.65 -55.12010 175.9 204.75 119.75 145.1 38,20,41,993 35,16,053 85 -30.82011 147.15 149.9 61 69.85 55,55,12,570 35,81,293 88.9 -77.32012 70.5 109.7 60 62.5 36,75,39,046 20,35,022 49.7 -8
2008 2009 2010 2011 20120
100
200
300
400
500
600
700
800
900
Open PriceHigh PriceLow PriceClose Price

40
CHAPTER – 2: DEVELOPMENT OF MAIN THEME

41
RATIONALE FOR THE STUDY
In an industry plagued with scepticism and a stock market increasingly difficult to predict and contend with, if one looks hard enough there may still be a genuine aid for the Day Trader and Short Term Investor.
The price of a security represents a consensus. It is the price at which one person agrees to buy and another agrees to sell. The price at which an investor is willing to buy or sell depends primarily on his expectations. If he expects the security's price to rise, he will buy it; if the investor expects the price to fall, he will sell it. These simple statements are the cause of a major challenge in forecasting security prices, because they refer to human expectations. As we all know firsthand, humans expectations are neither easily quantifiable nor predictable.
If prices are based on investor expectations, then knowing what a security should sell for (i.e., fundamental analysis) becomes less important than knowing what other investors expect it to sell for. That's not to say that knowing what a security should sell for isn't important--it is. But there is usually a fairly strong consensus of a stock's future earnings that the average investor cannot disprove
Fundamental analysis and technical analysis can co-exist in peace and complement each other. Since all the investors in the stock market want to make the maximum profits possible, they just cannot afford to ignore either fundamental or technical analysis.
Each investment alternative has its own strengths and weaknesses. Some options seek to achieve superior returns (like equity), but with corresponding higher risk. Other provide safety (like PPF) but at the expense of liquidity and growth. Other options such as FDs offer safety and liquidity, but at the cost of return. Mutual funds seek to combine the advantages of investing in arch of these alternatives while dispensing with the shortcomings.
Indian stock market is semi-efficient by nature and, is considered as one of the most respected stock markets, where information is quickly and widely disseminated, thereby allowing each security’s price to adjust rapidly in an unbiased manner to new information so that, it reflects the nearest investment value. And mainly after the introduction of electronic trading system, the information flow has become much faster.
But sometimes, in developing countries like India, sentiments play major role in price movements, or say, fluctuations, where investors find it difficult to predict the future with certainty. Some of the events affect economy as a whole, while some events are sector specific. Even in one particular sector, some companies or major market player are more sensitive to the event. So, the new investors taking exposure in the market should be well aware about the maximum potential loss, i.e. Value at risk.
42
SCOPE OF THE STUDY
The scope of this project is limited to only one sector i.e. telecom (service provider) sector. This project is concerned with only one sector of companies in the stock market. The project does not extend its scope to any other sector of companies.
Also, the project is concerned with only two companies from among the major players in the Telecom sector i.e. Bharti Airtel Limited and Videsh Sanchar Nigam Limited (VSNL).
LIMITATIONS
While conducting the research I was unable to collect data from primary source which I feel would have had a bearing on the outcome of the research. Through interviews with the concerned authorities I could have got first hand information about the company and this could have certainly given me a broader perspective on the company’s future plans.
Future changes are largely unpredictable; more so when the economic and business environment is buffeted by frequent winds of change. In an environment characterized by discontinuities, the past record proves to be a poor guide to future performance.
The market behavior if irrational may give rise to – under-valuations for extended periods; over-valuations from unjustified optimism and misplaced enthusiasm for unreasonable lengths of time. The slow correction of under or over valuation poses a threat to the analysis.
OBJECTIVE OF THE STUDY

43
To analyze the telecom industry and find the future growth opportunities.
To carry out the company analysis of the selected companies and to suggest whether they are a viable investment option.
Looking at the historical performance data of the company and estimate the future performance of stocks. Looking at this information to gain an insight of the company’s future performance. It is a method of evaluating a security by attempting to measure its future performance by examining related economic, financial and other qualitative and quantitative factors. To estimate a value that an investor can compare with the securities current price and figure out what sort of position to take with that security.

44
CHAPTER – 3:
ANALYSIS
&
INTERPRETATION
45
RESEARCH METHODOLOGY
Research is often described as an active, diligent and systematic process of inquiry aimed at discovering, interpreting and revising facts. This intellectual investigation produces a greater understanding of events, behaviour or theories and makes practical applications through laws and theories. The term research is also used to describe a collection of information about a particular subject, and is usually associated with science and scientific method.
BASIC RESEARCH:
Basic research is also called as fundamental or pure research. Its primary objective is the advancement of knowledge and the theoretical understanding of the relations among the variables. It is exploratory and often driven by researcher’s curiosity or interest. It is conducted without any practical end in mind. Basic research often lays down the foundation for further applied research.
APPLIED RESEARCH:
Applied research is done to solve specific, practical questions. Its primary objective is not to gain knowledge for its own sake. It is usually descriptive in nature. It is almost always done on the basis of basic research. As far as equity research is concerned there are two types of research methods that are followed:
o Fundamental analysiso Technical analysis
Financial statement analysis is the biggest part of Fundamental analysis also known as quantitative analysis, it involves looking at historical performance data to estimate the future performance of stocks whereas Technical analysis does not care one bit about the value of the company, it is only interested in the price movements of the company s share in the market. This project deals with the fundamental analysis aspect of the equity research. This project has tried to look into the details of the financial statements of the companies, the environment surrounding the telecom sector, the latest developments in this regard.
46
DATA COLLECTION:
o Primary data for a project is the first hand information regarding the project being studied. In this regard the primary data for this project would be getting the necessary information from the company management by an interview, telephonic conversation or direct mail.
o Secondary data for a project would be the collection of information that has a bearing on the outcome of the project from secondary sources like news, press releases, internet etc.
o The data collected for this project is from a secondary source. The data was complied with the help of sources like News articles, Internet, Capitaline software. In this research, primary data could not be gathered as the company officials could not be contacted for a one to one interview or a telephonic interview.
47
Analysis
Stock Price Movement
With Sensex
48
BHARTI AIRTEL LTD
IDEA CELLULAR
49
RELIANCE COMMUNICATIONS
All

50
BHARTI AIRTEL LTD
Dividends Declared
Announcement Date Effective Date Dividend Type Dividend (%)02-05-2012 Final 20%05-05-2011 17-08-2011 Final 20%28-04-2010 18-08-2010 Final 20%29-04-2009 24-07-2009 Final 20%
Ratio analysisRatios M12 M11 M10 M09 M08EBITDA Ratio 0.33 0.32 0.34 0.36 0.37Net Profit Ratio 0.14 0.13 0.19 0.22 0.25Debt-Equity Ratio 6.26 6.27 2.65 4.06 3.46Current Ratio 0.82 0.72 0.72 0.59 0.49Earnings Per Share 8.30 7.21 9.71 21.24 23.40Return on Equity (%) 1.57 1.44 1.94 2.12 2.34Return on Capital Employed (%) - 9.72 21.39 25.30 25.05
1. EBITDA Ratio: This ratio has always been decreasing from the previous year. At present it is slightly more than the previous year.
2. Net Profit Ratio: This ratio has always been decreasing from the previous year. At present it is slightly more than the previous year.
3. Debt to Equity Ratio:Ratio has always been low and at present is slightly more than its previous year. On the whole the company uses very little debt financing.
4. Current Ratio:Current ratio of this company is improving year by year. 2:1 is the slandered accepted by the company’s norm. This company is showing the around 1:1 ratio, which is quite satisfactory.
5. Earnings per Shares:This ratio is now improved by 1 %, and now it is at 8.30 per share.
6. Return on equity:This ratio has been decreasing significantly.
51
7. Return on capital employed:Return on capital employed has been decreased in last two years.
Cash flow from operation
Particulars Mar '11 Mar '10 Mar '09 Mar '08 Mar '07Net Profit Before Tax 8725.8 10699.25 8161.54 6972.54 4601.37Net Cash From Operating Activities 13215.4 12692.63 11853.15 10459.85 8107.95Net Cash (used in)/from Investing Activities -19075 -10601.66 -10894.38 -11648.41 -7975.05Net Cash (used in)/from Financing Activities 5646.5 -2539.32 -672 898.03 340.13Net (decrease)/increase In Cash and Cash Equivalents -213.1 -448.35 286.77 -290.53 473.03Opening Cash & Cash Equivalents 341.5 789.88 503.31 793.47 307.43Closing Cash & Cash Equivalents 128.4 341.53 790.08 502.94 780.46
2007 2008 2009 2010 2011
780.46
502.94
790.08
341.53
128.4
Cash Flow from operation Cash Flow from operation
52
Balance sheet
Particular Mar ' 11 Mar ' 10 Mar ' 09 Mar ' 08 Mar ' 07 Sources of funds Owner's fund Equity share capital 1,898.80 1,898.77 1,898.24 1,897.91 1,895.93Share application money 278.6 186.09 116.22 57.63 30Preference share capital - - - - -
Reserves & surplus 41,932.1034,650.1
9 25,627.38 18,283.82 9,515.21Loan funds Secured loans 17.1 39.43 51.73 52.42 266.45Unsecured loans 11,880.40 4,999.49 7,661.92 6,517.92 5,044.36
Total 56,007.0041,773.9
7 35,355.48 26,809.71 16,751.95 Uses of funds Fixed assets
Gross block 61,437.5044,212.5
3 37,266.70 28,115.65 26,509.93Less : revaluation reserve 2.1 2.13 2.13 2.13 2.13
Less : accumulated depreciation 20,736.7016,187.5
6 12,253.34 9,085.00 7,204.30
Net block 40,698.7028,022.8
4 25,011.23 19,028.52 19,303.51Capital work-in-progress 6,497.60 1,594.74 2,566.67 2,751.08 2,375.82
Investments 11,813.0015,773.3
2 11,777.76 10,952.85 705.82Net current assets Current assets, loans & advances 13,730.10 9,225.08 10,466.63 8,439.38 5,406.81
Less : current liabilities & provisions 16,732.4012,842.0
0 14,466.89 14,362.33 11,042.67Total net current assets -3,002.30 -3,616.92 -4,000.26 -5,922.95 -5,635.86Miscellaneous expenses not written - - 0.09 0.2 2.66
Total 56,007.0041,773.9
7 35,355.48 26,809.71 16,751.95 Notes:
Book value of unquoted investments 11,708.0011,619.9
5 9,898.56 9,379.62 580.43Market value of quoted investments 105.1 4,216.67 1,887.76 1,574.29 125.85Contingent liabilities 49,771.40 3,921.50 4,104.25 7,140.59 7,615.04Number of equity sharesoutstanding (Lacs) 37975.3 37975.3 18982.4 18979.07 18959.34

53
IDEA CELLULAR
Ratio analysis
Ratios 2012 2011 2010 2009 2008EBITDA Ratio 0.22 0.20 0.25 0.28 0.34Net Profit Ratio 0.03 0.05 0.09 0.10 0.16Debt-Equity Ratio 3.06 3.20 1.98 2.44 2.47Current Ratio 0.67 0.62 0.96 1.39 0.60Interest Cover 1.93 4.64 6.66 3.38 5.02Earnings Per Share 1.74 2.56 3.19 3.25 3.96Return on Equity (%) 0.17 0.26 0.32 0.33 0.40Return on Capital Employed (%) - 5.72 8.99 8.17 16.91
1. EBITDA Ratio: As per the given table it is clear that the earnings before interest, tax, and depreciation went on decreasing side but after 2011 it again back on track.
2. Net Profit Ratio:Every year sales has gone up by more than 25 % so that Net profit ratio decreases Y-o-Y. And the ratio in 2008 (0.16) reached to (0.03) in 2012.
3. Debt to Equity Ratio:This ratio indicates the relationship between loan funds and net worth of the company, which is known as 'gearing’. Being equity constant this ratio is fluctuating Y-o-Y. For the year ended 2012 this ratio is 3.06.
4. Current Ratio:Current liability of the company increased from 2008 to 2012. On the other hand the Current asset of the company is fluctuating every year. The current ratio for the year 2012 is 0.67.
5. Interest Cover:An interest cover of 2 times is considered reasonable by financial institutions. In 2012 the company reached to 1.93 times of interest cover which is good for the company.
6. Earnings per Shares:

54
Due to heavy depreciation the PAT came down in last 3 years, so that the earnings per shares were decreased gradually.
7. Return on equity:As compared to previous year, every next year return on equity came down. 0.17 is the preset return on equity.
8. Return on capital employed:This ratio is low from last five years. And decreasing every year.
Cash flow from operation Particulars Mar '12 Mar '11 Mar '10 Mar '09 Mar '08
Net Profit Before Tax 576.54 844.6 1053.66 1001.21 1044.36Net Cash From Operating Activities 3055.01 4500.7 1985.14 1863.74 2502.22Net Cash (used in)/from Investing Activities -4366.35 -7644.44
-2095.94
-7655.36
-5956.18
Net Cash (used in)/from Financing Activities 57.75 3314.83
-2530.57 7639 2131.29
Net (decrease)/increase In Cash and Cash Equivalents -1253.58 171
-2641.38 1847.37
-1322.67
Opening Cash & Cash Equivalents 1383.61 280.44 2921.82 497.06 1819.73Closing Cash & Cash Equivalents 130.03 451.54 280.44 2344.43 497.06
2008 2009 2010 2011 20120
500
1000
1500
2000
2500
Cash flow from operation

55
Balance sheetParticular Mar ' 11 Mar ' 10 Mar ' 09 Mar ' 08 Mar ' 07 Sources of funds Owner's fund Equity share capital 3,303.27 3,299.84 3,100.10 2,635.36 2,592.86Share application money 47.81 44.45 18.23 3.76 -Preference share capital - - - - -Reserves & surplus 8,979.62 8,112.95 8,176.09 906.91 -413.71Loan funds Secured loans 7,760.04 5,988.61 5,564.93 5,454.43 3,539.77Unsecured loans 2,797.42 537.81 2,014.43 1,060.33 710.74
Total 22,888.1617,983.6
5 18,873.78 10,060.79 6,429.66Uses of funds Fixed assets
Gross block 28,938.7522,834.4
0 15,562.75 12,791.22 8,229.61Less : revaluation reserve - - - - -Less : accumulated depreciation 9,807.13 7,907.34 4,739.86 3,123.83 2,637.18
Net block 19,131.6214,927.0
6 10,822.89 9,667.39 5,592.43Capital work-in-progress 3,594.05 462.58 1,721.82 941.13 506.52Investments 2,572.81 2,755.13 4,928.81 569.93 13.83Net current assets Current assets, loans & advances 3,906.64 4,290.41 4,994.96 1,674.14 2,550.93Less : current liabilities & provisions 6,316.96 4,451.52 3,594.69 2,791.81 2,234.05Total net current assets -2,410.32 -161.12 1,400.27 -1,117.67 316.88Miscellaneous expenses not written - - - - -
Total 22,888.1617,983.6
5 18,873.78 10,060.79 6,429.66 Notes: Book value of unquoted investments 2,572.81 2,755.13 2,724.62 569.93 13.83Market value of quoted - - 1,634.32 - -
56
investmentsContingent liabilities 3,409.89 1,960.75 2,279.41 2,308.87 1,236.57Number of equity shares outstanding (Lacs) 33032.72 32998.38 31000.95 26353.61 25928.61
Reliance Communications
Dividends Declared
Announcement Date
Effective Date
Dividend Type
Dividend (%) Remarks
28-05-2012 Final 5%
31-05-2011 15-09-2011 Final 10%Rs.0.50 per
share(10%)Dividend17-05-2010 13-09-2010 Final 17% 24-07-2009 04-08-2009 Interim 16% 30-04-2008 19-09-2008 Final 15% AGM
30-04-2007 05-07-2007 Final 10% AGM
Ratio Analysis
Ratios 2011 2010 2009 2008EBITDA Ratio 0.12 0.19 0.38 0.32Net Profit Ratio -0.04 0.02 0.19 0.13Debt-Equity Ratio 30.48 23.72 29.95 19.66Current Ratio 1.84 2.17 2.73 1.65Earnings Per Share -4.16 2.32 23.27 12.53Return on Equity (%) -0.83 0.46 4.65 2.51
1. EBITDA Ratio: This ratio has always been low and at present is slightly more than its previous year.
2. Net Profit Ratio:At present this ratio is negative due to the loss in the organization.
3. Debt to Equity Ratio:

57
There is a fluctuation in this ratio as they are using fluctuating debt every year.
4. Current Ratio:This ratio has been maintained around 1.84 indicating a good ability to meet its short term obligations.
5. Earnings per Shares:It has decreased significantly from the previous years.
6. Return on equity:It has decreased significantly from the previous years. And now it is standing negative at (-0.83).
Cash flow from operation
Particulars Mar '11 Mar '10 Mar '09 Mar '08 Mar '07Net Profit Before Tax -859.51 619.47 4815.07 2604.09 2420.85Net Cash From Operating Activities 725.56 1043.88 1884.87 2982.8 10469.12Net Cash (used in)/from Investing Activities -2800.94 4339.32 -7650.54 -11263.9 -4883.86Net Cash (used in)/from Financing Activities 5807.12 -5868.66 6405.25 6234.75 4645.92Net (decrease)/increase In Cash and Cash Equivalents 3731.74 -485.46 639.58 -2046.32 10231.18Opening Cash & Cash Equivalents 81.47 567.64 205.57 2240.4 -10162.7Closing Cash & Cash Equivalents 3813.21 82.18 845.15 192.66 68.45
2007 2008 2009 2010 2011
68.45 192.66
845.15
82.18
3813.21
Cash flow from operationCash flow from operation
58
Balance sheet Particular Mar ' 11 Mar ' 10 Mar ' 09 Mar ' 08 Mar ' 07 Sources of funds Owner's fund Equity share capital 1,032.01 1,032.01 1,032.01 1,032.01 1,022.31Share application money - - - - -Preference share capital - - - - -Reserves & surplus 47,112.47 49,466.88 50,658.31 23,808.02 19,503.23Loan funds Secured loans 15,226.02 3,000.00 3,000.00 950 5,113.57Unsecured loans 16,226.72 21,478.28 27,903.61 19,336.43 9,454.27Total 79,597.22 74,977.17 82,593.93 45,126.46 35,093.38 Uses of funds Fixed assets Gross block 40,904.17 39,838.17 37,941.15 21,576.32 20,625.82Less : revaluation reserve - - - - -Less : accumulated depreciation 12,063.27 9,225.69 6,533.38 4,688.69 2,527.37Net block 28,840.90 30,612.48 31,407.77 16,887.63 18,098.45Capital work-in-progress 9,907.66 1,683.52 3,643.86 7,117.56 2,185.60Investments 32,102.13 31,898.60 31,364.75 13,844.14 5,434.43Net current assets Current assets, loans & advances 19,153.82 20,005.94 25,543.01 18,515.29 20,107.04Less : current liabilities & provisions 10,407.29 9,223.37 9,365.46 11,238.16 10,732.14Total net current assets 8,746.53 10,782.57 16,177.55 7,277.13 9,374.90Miscellaneous expenses not written - - - - -Total 79,597.22 74,977.17 82,593.93 45,126.46 35,093.38 Notes: Book value of unquoted investments 32,101.85 31,898.31 31,364.63 13,844.14 5,434.43Market value of quoted investments 0.28 0.29 0.12 - -

59
Contingent liabilities 1,958.61 3,274.83 6,555.82 4,392.73 3,781.30Number of equity sharesoutstanding (Lacs) 20640.27 20640.27 20640.27 20640.27 20446.15
SUGGESTIONS
&
CONCLUSION

60
SUGGESTIONS
Volatile markets are characterized by wide price fluctuations and heavy trading. They often result from an imbalance of trade orders is one direction, wide price fluctuations are a daily occurrence on the world's stock markets as investors react to economic business and political events. Market watchers see high volatility as a sign of investor nervousness which, in the counter-initiative world of market, is of course bullish
The present study on the simple moving average model applied on selected company's scripts would help the investors to take investment decision. It is suggested that the investors can invest in the shares that shows a definitive signal of buy or sell decisions. The investors can invest in the companies which are recovering out of either over brought or oversold condition since there might be a definite trend reversal in those stocks. It is also advised for the investors to hold the stock which keep fluctuating unless until the stock follows definite bearish or bullish trend. And also the investor can make investment not only following a particular indicator but by confirming the signal with several indicators for better returns.
CONCLUSION
Company Market Cap
P/E (TTM)
P/BV (TTM)
EV/EBIDTA
ROE ROCE D/E

61
(Rs. in Cr.) (x) (x) (x) (%) (%) (x)
Bharti Airtel1,16,318.0
4 20.3 2.35 11.13 19.1 18.5 0.21Idea Cellular 24,540.16 43.62 1.9 9.57 4.6 8.2 0.64Rel. Comm. 12,900.13 82.24 0.27 31.54 -2.5 -0.6 0.57
By Observing the above table my suggestion is…..
Buy & Hold Bharti Airtel for short term. Hold All the Reliance Communications stocks. Sell All the Idea Cellular stocks.
Strong growth in subscriber base, increasing non voice revenues and lowering fixed cost per unit, the Indian telecom service sector is set to report buoyant growth in revenues and profitability in the short to medium term.
There are two key drivers for the growth in this business. First, the enhanced capability of the Company to deliver services on a global basis is attracting new customers and opening up new markets. Second, there is significant growth in the existing customers' businesses globally.
Bharti Airtel, one of the major players in the telecom service provider industry has attained a significant market share in the country with its widespread network, huge subscriber base and quality service. Also, the company to make its presence felt all across the globe is spreading its wings to international markets.
In India most of the industries require huge amount of investments. Funds are raised mostly through the issue of share. An investor is satisfied from the reasonable return from investment in shares.
Speculation involves higher risks to get return on the other hand investment involves no such risks and returns will be fair. An investor can succeed in his investment only when he is able to select the right shares.
The investors should keenly watch the situations like market price, economy, company progress, returns, and the risk involved in a share before taking decision on a particular share. This study will help the investors know the behavior of share prices and thus can succeed.

62
APPENDIX
63
Bibliography
www.bseindia.com
www.nseindia.com
www.wikipedia.com
http://telecomtalk.info
http://www.topnews.in/business-news/telecom-sector
http://www.investarindia.com
www.cholamandalam.com
www.financialtimes.com
www.moneycontrol.com
www.yahooindiafinance.com
www.equitymaster.com
http://economictimes.indiatimes.com
REFERENCES
Economic survey 2011-12
Principles of corporate finance – Brealey and Myers
Financial management- Prasanna Chandra
Economic times