Embed Size (px)
Citation preview
Analysis of statistics 2015
January 2016
ECHR – Analysis of Statistics 2015
2/60
Table of Contents Overview of the Court’s statistics in 2015 .............................................................................................. 4
A. Number of new applications ...................................................................................................... 4 B. Applications disposed of judicially and pending applications .................................................... 4 C. Processing of applications .......................................................................................................... 4
1. Pre-allocation .......................................................................................................................... 4 2. Inadmissibility or strike out decisions .................................................................................... 4 3. Communicated applications ................................................................................................... 5 4. Judgments ............................................................................................................................... 5 5. Requests for interim measures (Rule 39 of the Rules of Court) ............................................. 5
D. Priority policy ............................................................................................................................. 5
General information ............................................................................................................................... 6 Number of applications allocated to a judicial formation ................................................................ 7 Processing of applications ................................................................................................................ 9
Country-specific information ................................................................................................................ 14 Albania ............................................................................................................................................ 14 Andorra ........................................................................................................................................... 15 Armenia .......................................................................................................................................... 16 Austria ............................................................................................................................................. 17 Azerbaijan ....................................................................................................................................... 18 Belgium ........................................................................................................................................... 19 Bosnia and Herzegovina.................................................................................................................. 20 Bulgaria ........................................................................................................................................... 21 Croatia ............................................................................................................................................. 22 Cyprus ............................................................................................................................................. 23 Czech Republic ................................................................................................................................ 24 Denmark ......................................................................................................................................... 25 Estonia ............................................................................................................................................ 26 Finland ............................................................................................................................................ 27 France ............................................................................................................................................. 28 Georgia ............................................................................................................................................ 29 Germany ......................................................................................................................................... 30 Greece ............................................................................................................................................. 31 Hungary ........................................................................................................................................... 32 Iceland ............................................................................................................................................. 33 Ireland ............................................................................................................................................. 34 Italy ................................................................................................................................................. 35 Latvia ............................................................................................................................................... 36 Liechtenstein ................................................................................................................................... 37 Lithuania ......................................................................................................................................... 38 Luxembourg .................................................................................................................................... 39 Malta ............................................................................................................................................... 40
ECHR – Analysis of Statistics 2015
3/60
Republic of Moldova ....................................................................................................................... 41 Monaco ........................................................................................................................................... 42 Montenegro .................................................................................................................................... 43 Netherlands .................................................................................................................................... 44 Norway ............................................................................................................................................ 45 Poland ............................................................................................................................................. 46 Portugal ........................................................................................................................................... 47 Romania .......................................................................................................................................... 48 Russian Federation ......................................................................................................................... 49 San Marino ...................................................................................................................................... 50 Serbia .............................................................................................................................................. 51 Slovakia ........................................................................................................................................... 52 Slovenia ........................................................................................................................................... 53 Spain ............................................................................................................................................... 54 Sweden ........................................................................................................................................... 55 Switzerland ..................................................................................................................................... 56 “The former Yugoslav Republic of Macedonia” .............................................................................. 57 Turkey ............................................................................................................................................. 58 Ukraine ............................................................................................................................................ 59 United Kingdom .............................................................................................................................. 60
ECHR – Analysis of Statistics 2015
4/60
Overview of the Court’s statistics in 2015 The Court’s statistics for 2015 disclose like last year a lower number of incoming cases allocated to a judicial formation. This is partly the result of a new approach to Rule 47 of the Rules of Court, which determines what applicants are required to do for their application to be allocated for judicial decision. However, there is also an indication of a falling off in demand with a lower number of cases coming into the system and in particular a lower number of applications allocated to the Single Judge. This has helped the Court to reduce the stock of pending cases since the number of applications disposed of exceeds the volume of incoming cases.
The backlog of inadmissible cases has been eliminated which explains the decrease in the number of applications decided by the Single judge. As the Court focuses on other categories of cases, productivity will tend to remain more stable, with fluctuations depending on when large groups of cases are processed and adjudicated. This change of focus is reflected in the increase in the number of applications in those other categories (I to V) which were communicated or decided by judgment or decision. 9,999 more such applications were processed in 2015 than in 2014.
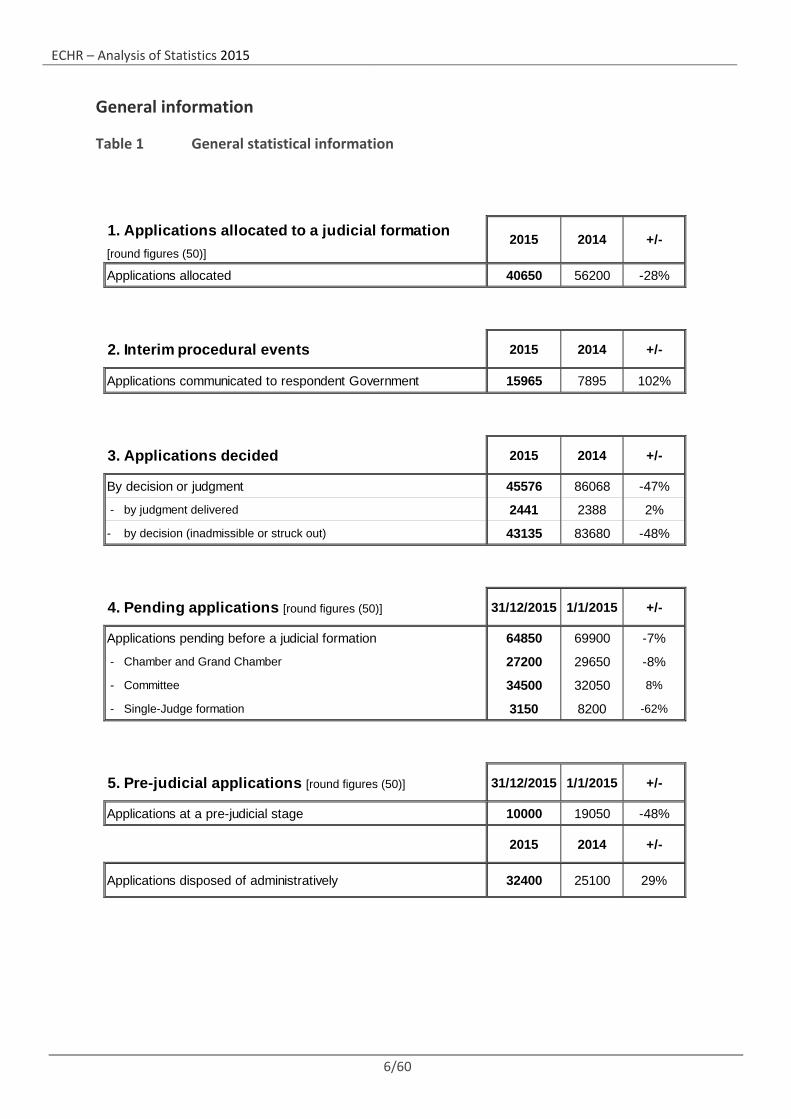
A. Number of new applications In 2015 40,650 applications were allocated to a judicial formation, an overall decrease of 28% compared with 2014 (56,200). 27,050 of these were identified as Single-Judge cases likely to be declared inadmissible (a decrease of 40% in relation to 2014). 13,600 were identified as probable Chamber or Committee cases (a decrease of 19%). It is the second year in a row that the number of allocated cases has decreased (- 15% in 2014).
B. Applications disposed of judicially and pending applications 45,576 applications were disposed of judicially, a decrease of 47% in relation to 2014 (86,068). The number of cases disposed of exceeded those allocated by more than 4,900 (i.e. a monthly surplus of around 400). As a result, the stock of allocated applications pending before the Court decreased over the year, by 7% from 69,900 to 64,850.
C. Processing of applications
1. Pre-allocation
As at 31 December 2015 the number of applications pending at this pre-judicial stage stood at 10,000, a decrease of 48% in relation to the same date the previous year (19,050). The number of applications disposed of administratively in 2015 was 32,400, an increase of 29%. 45% of these files were disposed of under Rule 47.
2. Inadmissibility or strike out decisions
In 2015 43,135 applications were declared inadmissible or struck out of the list of cases by a Single Judge, a Committee or a Chamber, a 48% decrease compared with 2014 (83,680).
The Single-Judge formation decided 36,314 cases in 2015, a decrease of 54% compared with 2014 (78,664).
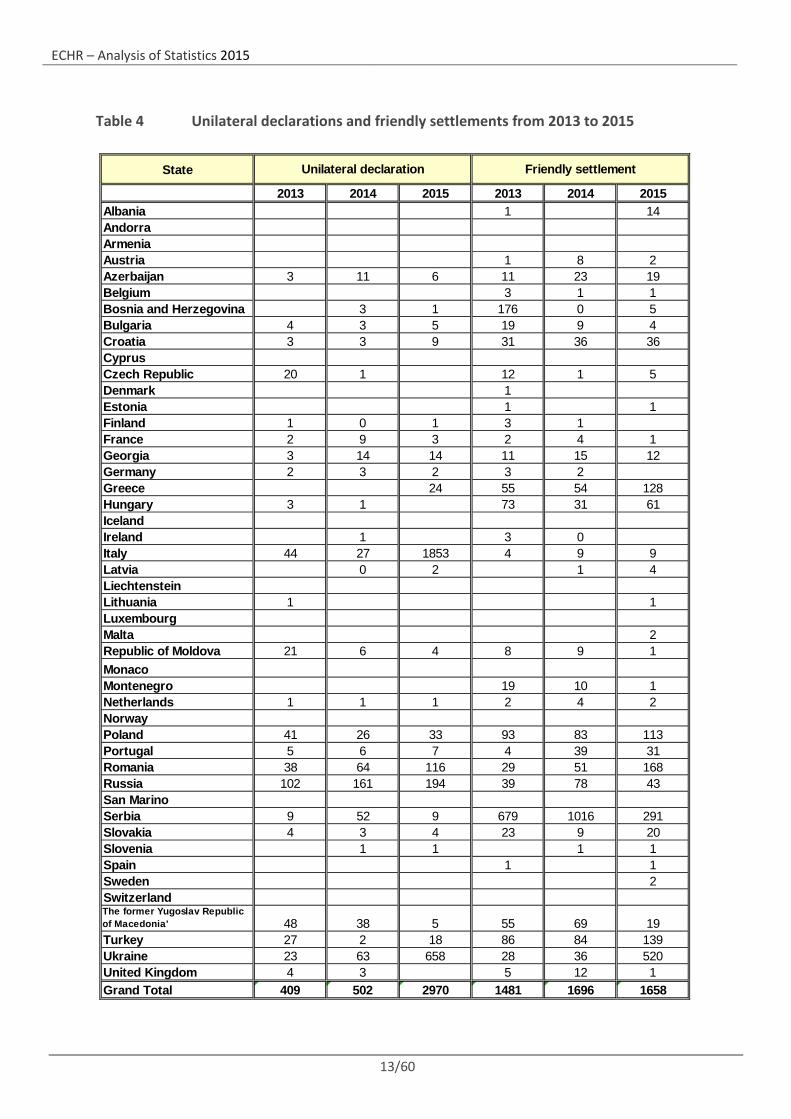
The number of applications struck out by a Chamber or a Committee, in a decision or a judgment, following a friendly settlement or a unilateral declaration, increased by 111% in 2015 (4,628 compared to 2,198 in 2014). Friendly settlements (1,658) decreased by 2% (1,696 in 2014) and unilateral declarations were multiplied by almost six (2,970 compared to 502 in 2014).
The remainder of the applications were either declared inadmissible by a Chamber or a Committee or struck out by these formations on other grounds.
ECHR – Analysis of Statistics 2015
5/60
3. Communicated applications
Where an application is not on its face inadmissible, it is communicated to the respondent Government. In 2015 15,965 applications were communicated (an increase of 102% compared to 2014 when 7,895 applications were communicated).
4. Judgments
Judgments were delivered in respect of 2,441 applications (compared with 2,388 in 2014 – an increase of 2%). A significant proportion of these applications were joined with the result that the number of judgments actually delivered was 823, a decrease of 8%. 177 judgments (in respect of 1,589 applications) were adopted by a three-judge Committee formation. These judgments accounted for 65% of the applications decided by a judgment (59% in 2014).
5. Requests for interim measures (Rule 39 of the Rules of Court)
The total number of decisions on interim measures (1,458) decreased by 25% compared with 2014 (1,939). The Court granted requests for interim measures in 161 cases (a decrease of 25% compared with 216 in 2014) and dismissed them in 630 cases (19% less than the 782 in 2014). The remainder fell outside the scope of Rule 39 of the Rules of Court. 39% of the requests granted are linked to the conflict in Ukraine.
D. Priority policy 1 The essence of this policy is to concentrate more resources on the most important cases, namely the cases falling within the top three categories (“priority applications”). At 31 December 2015 there were 11,490 applications in these categories.
The number of priority applications dealt with at different stages of the procedure in 2015 increased by 10% compared to 2014. 37% more priority applications were communicated to the respondent Governments in comparison with 2014. The number of priority applications declared inadmissible or struck out of the list of cases by a Chamber or Committee decreased by 35%. The number of priority applications struck out following a friendly settlement or a unilateral declaration decreased from 326 in 2014 to 302 in 2015. The number of priority applications giving rise to a judgment increased by 11% in 2015.
1 An explanation of the Court’s priority policy can be found on the Court’s internet site http://www.echr.coe.int/Documents/Priority_policy_ENG.pdf
ECHR – Analysis of Statistics 2015
6/60
General information
Table 1 General statistical information
40650 56200 -28%
2015 2014 +/-
15965 7895 102%
2015 2014 +/-
45576 86068 -47%
2441 2388 2%
43135 83680 -48%
31/12/2015 1/1/2015 +/-
64850 69900 -7%
27200 29650 -8%
34500 32050 8%
3150 8200 -62%
31/12/2015 1/1/2015 +/-
10000 19050 -48%
2015 2014 +/-
32400 25100 29%
- by judgment delivered
1. Applications allocated to a judicial formation 2015 2014 +/-[round figures (50)]
Applications allocated
2. Interim procedural events
Applications communicated to respondent Government
3. Applications decided
By decision or judgment
5. Pre-judicial applications [round figures (50)]
Applications at a pre-judicial stage
Applications disposed of administratively
- by decision (inadmissible or struck out)
4. Pending applications [round figures (50)]
Applications pending before a judicial formation
- Chamber and Grand Chamber
- Committee
- Single-Judge formation
ECHR – Analysis of Statistics 2015
7/60
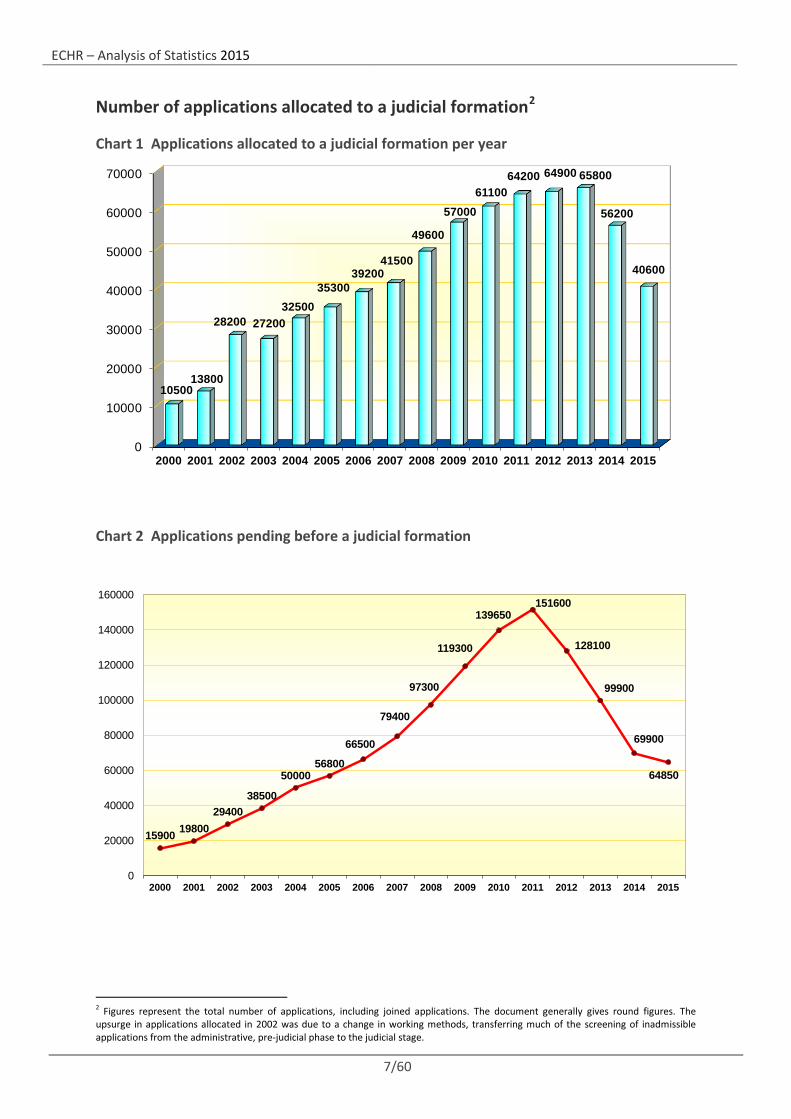
Number of applications allocated to a judicial formation2
Chart 1 Applications allocated to a judicial formation per year
Chart 2 Applications pending before a judicial formation
2 Figures represent the total number of applications, including joined applications. The document generally gives round figures. The upsurge in applications allocated in 2002 was due to a change in working methods, transferring much of the screening of inadmissible applications from the administrative, pre-judicial phase to the judicial stage.
0
10000
20000
30000
40000
50000
60000
70000
2000 2001 2002 2003 2004 2005 2006 2007 2008 2009 2010 2011 2012 2013 2014 2015
1050013800
28200 2720032500
3530039200
41500
49600
5700061100
64200 64900 65800
56200
40600
15900 1980029400
38500
5000056800
66500
79400
97300
119300
139650151600
128100
99900
69900
64850
0
20000
40000
60000
80000
100000
120000
140000
160000
2000 2001 2002 2003 2004 2005 2006 2007 2008 2009 2010 2011 2012 2013 2014 2015
ECHR – Analysis of Statistics 2015
8/60
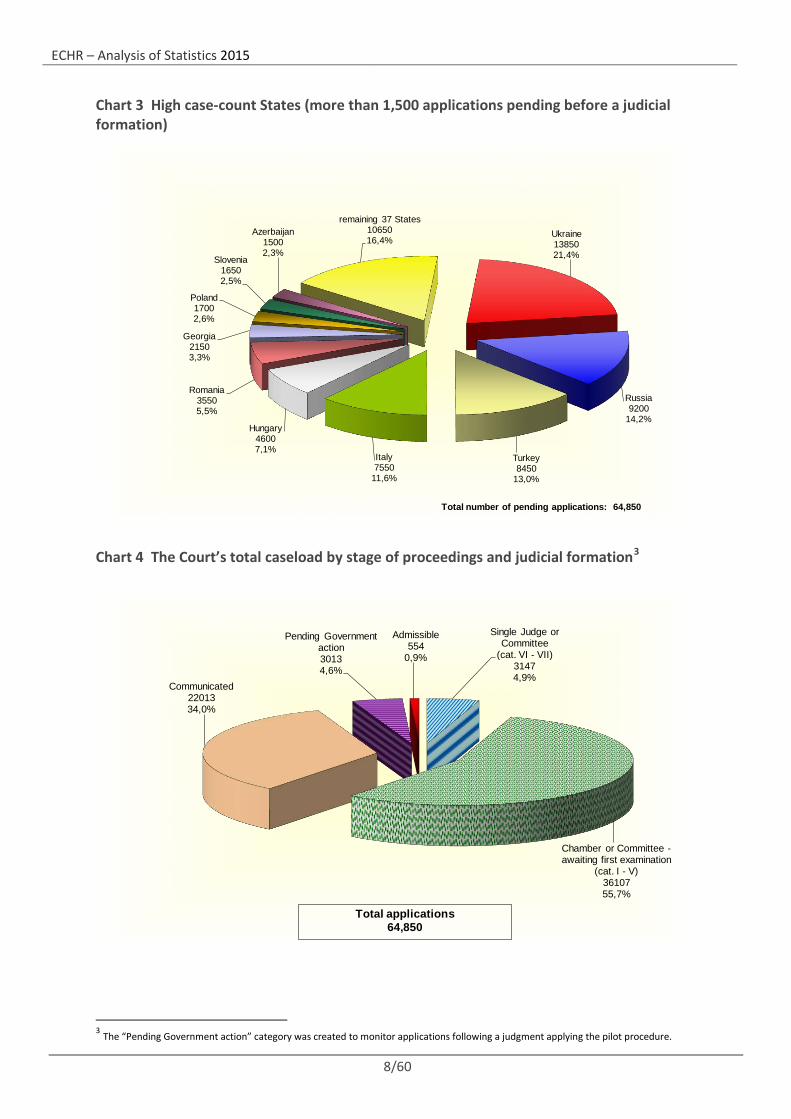
Chart 3 High case-count States (more than 1,500 applications pending before a judicial formation)
Chart 4 The Court’s total caseload by stage of proceedings and judicial formation3
3 The “Pending Government action” category was created to monitor applications following a judgment applying the pilot procedure.
Ukraine1385021,4%
Russia9200
14,2%
Turkey8450
13,0%
Italy7550
11,6%
Hungary46007,1%
Romania35505,5%
Georgia21503,3%
Poland17002,6%
Slovenia16502,5%
Azerbaijan15002,3%
remaining 37 States1065016,4%
Total number of pending applications: 64,850
Single Judge or Committee
(cat. VI - VII)31474,9%
Chamber or Committee -awaiting first examination
(cat. I - V)3610755,7%
Communicated2201334,0%
Pending Government action30134,6%
Admissible554
0,9%
Total applications64,850
ECHR – Analysis of Statistics 2015
9/60
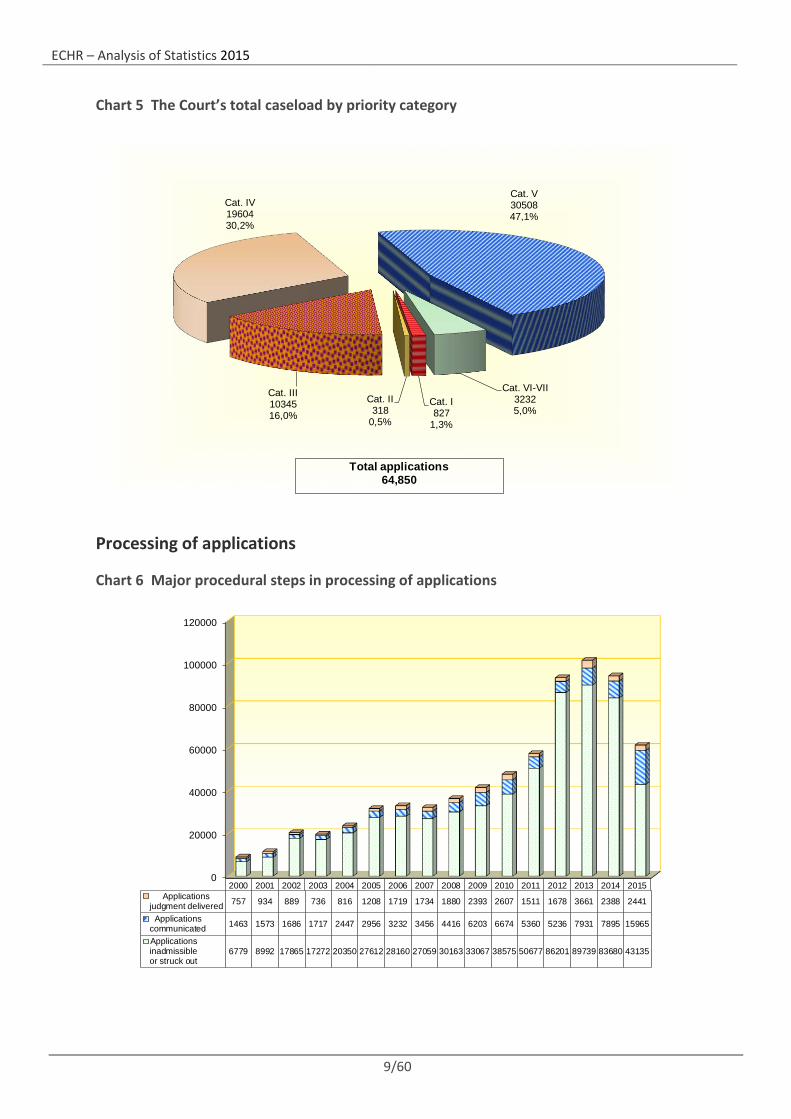
Chart 5 The Court’s total caseload by priority category
Processing of applications
Chart 6 Major procedural steps in processing of applications
Cat. I827
1,3%
Cat. II318
0,5%
Cat. III1034516,0%
Cat. IV1960430,2%
Cat. V3050847,1%
Cat. VI-VII32325,0%
Total applications64,850
0
20000
40000
60000
80000
100000
120000
2000 2001 2002 2003 2004 2005 2006 2007 2008 2009 2010 2011 2012 2013 2014 2015Applications
judgment delivered 757 934 889 736 816 1208 1719 1734 1880 2393 2607 1511 1678 3661 2388 2441
Applicationscommunicated 1463 1573 1686 1717 2447 2956 3232 3456 4416 6203 6674 5360 5236 7931 7895 15965
Applicationsinadmissibleor struck out
6779 8992 17865 17272 20350 27612 28160 27059 30163 33067 38575 50677 86201 89739 83680 43135
ECHR – Analysis of Statistics 2015
10/60
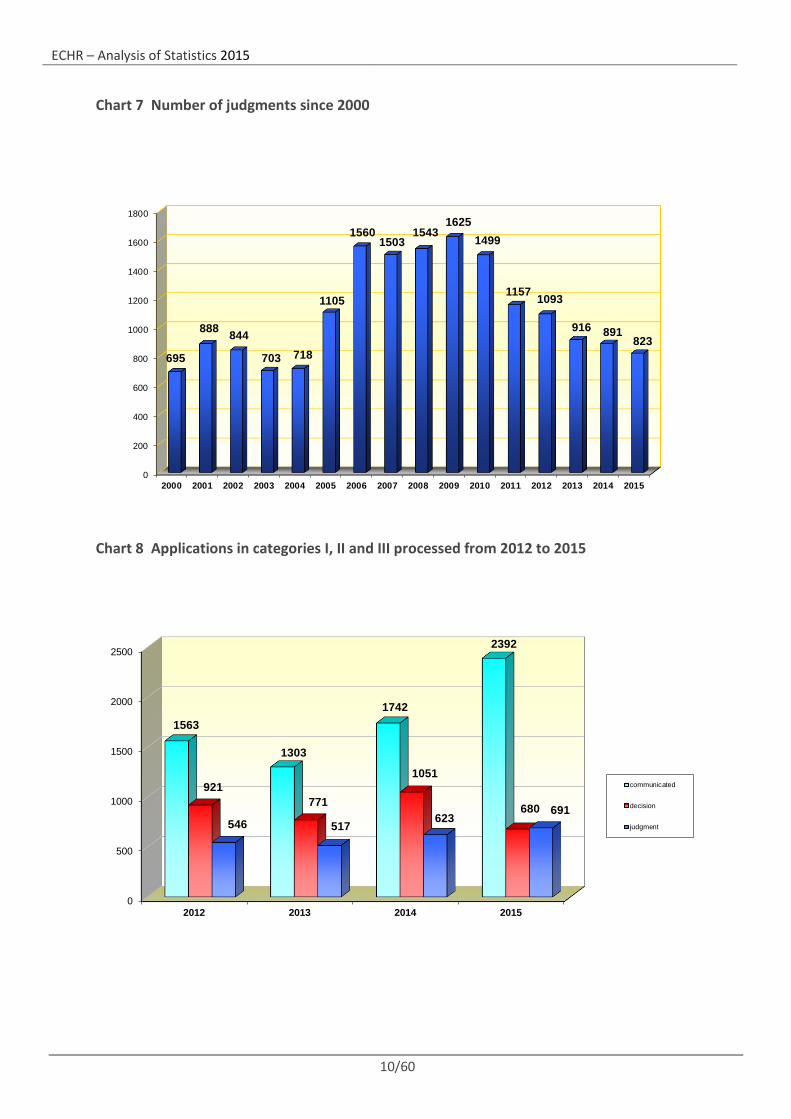
Chart 7 Number of judgments since 2000
Chart 8 Applications in categories I, II and III processed from 2012 to 2015
0
200
400
600
800
1000
1200
1400
1600
1800
2000 2001 2002 2003 2004 2005 2006 2007 2008 2009 2010 2011 2012 2013 2014 2015
695
888 844
703 718
1105
15601503
15431625
1499
1157 1093
916 891823
0
500
1000
1500
2000
2500
2012 2013 2014 2015
1563
1303
1742
2392
921771
1051
680546 517
623691
communicated
decision
judgment
ECHR – Analysis of Statistics 2015
11/60
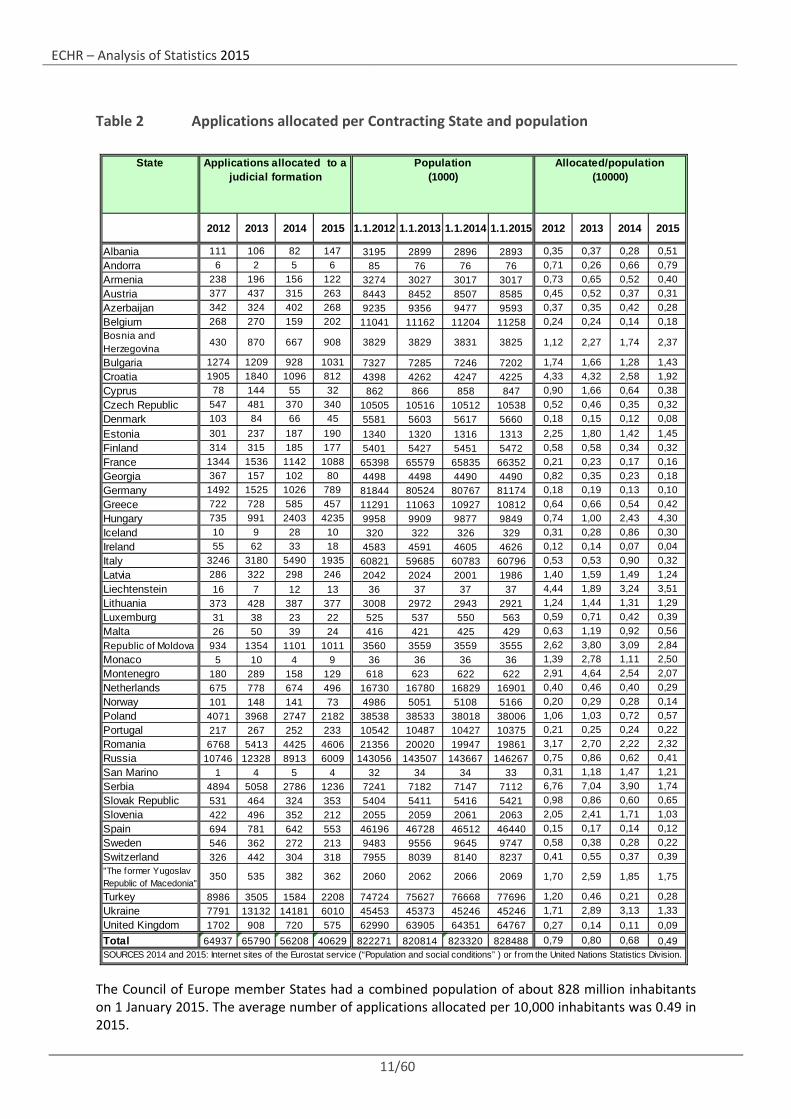
Table 2 Applications allocated per Contracting State and population
The Council of Europe member States had a combined population of about 828 million inhabitants on 1 January 2015. The average number of applications allocated per 10,000 inhabitants was 0.49 in 2015.
State
2012 2013 2014 2015 1.1.2012 1.1.2013 1.1.2014 1.1.2015 2012 2013 2014 2015
Albania 111 106 82 147 3195 2899 2896 2893 0,35 0,37 0,28 0,51Andorra 6 2 5 6 85 76 76 76 0,71 0,26 0,66 0,79Armenia 238 196 156 122 3274 3027 3017 3017 0,73 0,65 0,52 0,40Austria 377 437 315 263 8443 8452 8507 8585 0,45 0,52 0,37 0,31Azerbaijan 342 324 402 268 9235 9356 9477 9593 0,37 0,35 0,42 0,28Belgium 268 270 159 202 11041 11162 11204 11258 0,24 0,24 0,14 0,18Bosnia and Herzegovina
430 870 667 908 3829 3829 3831 3825 1,12 2,27 1,74 2,37
Bulgaria 1274 1209 928 1031 7327 7285 7246 7202 1,74 1,66 1,28 1,43Croatia 1905 1840 1096 812 4398 4262 4247 4225 4,33 4,32 2,58 1,92Cyprus 78 144 55 32 862 866 858 847 0,90 1,66 0,64 0,38Czech Republic 547 481 370 340 10505 10516 10512 10538 0,52 0,46 0,35 0,32Denmark 103 84 66 45 5581 5603 5617 5660 0,18 0,15 0,12 0,08Estonia 301 237 187 190 1340 1320 1316 1313 2,25 1,80 1,42 1,45Finland 314 315 185 177 5401 5427 5451 5472 0,58 0,58 0,34 0,32France 1344 1536 1142 1088 65398 65579 65835 66352 0,21 0,23 0,17 0,16Georgia 367 157 102 80 4498 4498 4490 4490 0,82 0,35 0,23 0,18Germany 1492 1525 1026 789 81844 80524 80767 81174 0,18 0,19 0,13 0,10Greece 722 728 585 457 11291 11063 10927 10812 0,64 0,66 0,54 0,42Hungary 735 991 2403 4235 9958 9909 9877 9849 0,74 1,00 2,43 4,30Iceland 10 9 28 10 320 322 326 329 0,31 0,28 0,86 0,30Ireland 55 62 33 18 4583 4591 4605 4626 0,12 0,14 0,07 0,04Italy 3246 3180 5490 1935 60821 59685 60783 60796 0,53 0,53 0,90 0,32Latvia 286 322 298 246 2042 2024 2001 1986 1,40 1,59 1,49 1,24Liechtenstein 16 7 12 13 36 37 37 37 4,44 1,89 3,24 3,51Lithuania 373 428 387 377 3008 2972 2943 2921 1,24 1,44 1,31 1,29Luxemburg 31 38 23 22 525 537 550 563 0,59 0,71 0,42 0,39Malta 26 50 39 24 416 421 425 429 0,63 1,19 0,92 0,56Republic of Moldova 934 1354 1101 1011 3560 3559 3559 3555 2,62 3,80 3,09 2,84Monaco 5 10 4 9 36 36 36 36 1,39 2,78 1,11 2,50Montenegro 180 289 158 129 618 623 622 622 2,91 4,64 2,54 2,07Netherlands 675 778 674 496 16730 16780 16829 16901 0,40 0,46 0,40 0,29Norway 101 148 141 73 4986 5051 5108 5166 0,20 0,29 0,28 0,14Poland 4071 3968 2747 2182 38538 38533 38018 38006 1,06 1,03 0,72 0,57Portugal 217 267 252 233 10542 10487 10427 10375 0,21 0,25 0,24 0,22Romania 6768 5413 4425 4606 21356 20020 19947 19861 3,17 2,70 2,22 2,32Russia 10746 12328 8913 6009 143056 143507 143667 146267 0,75 0,86 0,62 0,41San Marino 1 4 5 4 32 34 34 33 0,31 1,18 1,47 1,21Serbia 4894 5058 2786 1236 7241 7182 7147 7112 6,76 7,04 3,90 1,74Slovak Republic 531 464 324 353 5404 5411 5416 5421 0,98 0,86 0,60 0,65Slovenia 422 496 352 212 2055 2059 2061 2063 2,05 2,41 1,71 1,03Spain 694 781 642 553 46196 46728 46512 46440 0,15 0,17 0,14 0,12Sweden 546 362 272 213 9483 9556 9645 9747 0,58 0,38 0,28 0,22Switzerland 326 442 304 318 7955 8039 8140 8237 0,41 0,55 0,37 0,39"The former Yugoslav Republic of Macedonia"
350 535 382 362 2060 2062 2066 2069 1,70 2,59 1,85 1,75
Turkey 8986 3505 1584 2208 74724 75627 76668 77696 1,20 0,46 0,21 0,28Ukraine 7791 13132 14181 6010 45453 45373 45246 45246 1,71 2,89 3,13 1,33United Kingdom 1702 908 720 575 62990 63905 64351 64767 0,27 0,14 0,11 0,09Total 64937 65790 56208 40629 822271 820814 823320 828488 0,79 0,80 0,68 0,49SOURCES 2014 and 2015: Internet sites of the Eurostat service (“Population and social conditions” ) or from the United Nations Statistics Division.
Applications allocated to a judicial formation
Population (1000)
Allocated/population(10000)
ECHR – Analysis of Statistics 2015
12/60
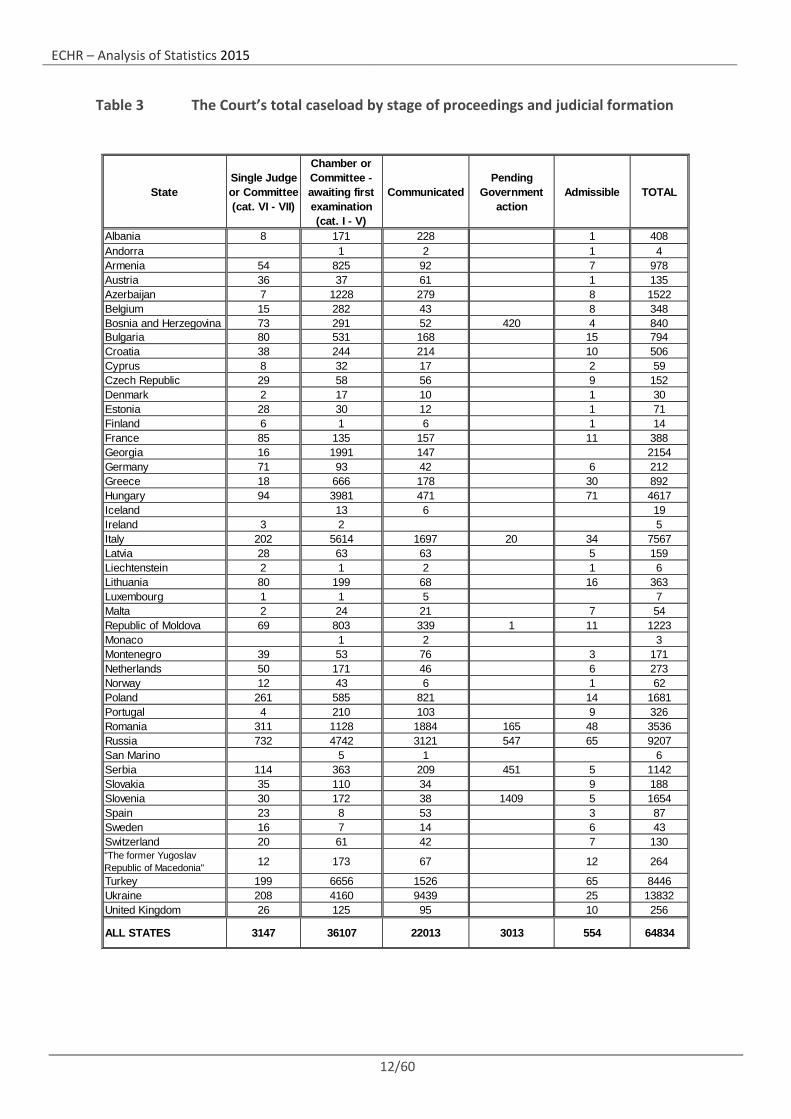
Table 3 The Court’s total caseload by stage of proceedings and judicial formation
StateSingle Judge or Committee (cat. VI - VII)
Chamber or Committee - awaiting first examination (cat. I - V)
CommunicatedPending
Government action
Admissible TOTAL
Albania 8 171 228 1 408Andorra 1 2 1 4Armenia 54 825 92 7 978Austria 36 37 61 1 135Azerbaijan 7 1228 279 8 1522Belgium 15 282 43 8 348Bosnia and Herzegovina 73 291 52 420 4 840Bulgaria 80 531 168 15 794Croatia 38 244 214 10 506Cyprus 8 32 17 2 59Czech Republic 29 58 56 9 152Denmark 2 17 10 1 30Estonia 28 30 12 1 71Finland 6 1 6 1 14France 85 135 157 11 388Georgia 16 1991 147 2154Germany 71 93 42 6 212Greece 18 666 178 30 892Hungary 94 3981 471 71 4617Iceland 13 6 19Ireland 3 2 5Italy 202 5614 1697 20 34 7567Latvia 28 63 63 5 159Liechtenstein 2 1 2 1 6Lithuania 80 199 68 16 363Luxembourg 1 1 5 7Malta 2 24 21 7 54Republic of Moldova 69 803 339 1 11 1223Monaco 1 2 3Montenegro 39 53 76 3 171Netherlands 50 171 46 6 273Norway 12 43 6 1 62Poland 261 585 821 14 1681Portugal 4 210 103 9 326Romania 311 1128 1884 165 48 3536Russia 732 4742 3121 547 65 9207San Marino 5 1 6Serbia 114 363 209 451 5 1142Slovakia 35 110 34 9 188Slovenia 30 172 38 1409 5 1654Spain 23 8 53 3 87Sweden 16 7 14 6 43Switzerland 20 61 42 7 130"The former Yugoslav Republic of Macedonia" 12 173 67 12 264
Turkey 199 6656 1526 65 8446Ukraine 208 4160 9439 25 13832United Kingdom 26 125 95 10 256
ALL STATES 3147 36107 22013 3013 554 64834
ECHR – Analysis of Statistics 2015
13/60
Table 4 Unilateral declarations and friendly settlements from 2013 to 2015
State
2013 2014 2015 2013 2014 2015Albania 1 14AndorraArmeniaAustria 0 1 8 2Azerbaijan 3 11 6 11 23 19Belgium 0 3 1 1Bosnia and Herzegovina 3 1 176 0 5Bulgaria 4 3 5 19 9 4Croatia 3 3 9 31 36 36CyprusCzech Republic 20 1 12 1 5Denmark 1Estonia 1 1Finland 1 0 1 3 1France 2 9 3 2 4 1Georgia 3 14 14 11 15 12Germany 2 3 2 3 2Greece 0 24 55 54 128Hungary 3 1 73 31 61IcelandIreland 1 3 0Italy 44 27 1853 4 9 9Latvia 0 2 1 4LiechtensteinLithuania 1 1LuxembourgMalta 2Republic of Moldova 21 6 4 8 9 1MonacoMontenegro 0 19 10 1Netherlands 1 1 1 2 4 2NorwayPoland 41 26 33 93 83 113Portugal 5 6 7 4 39 31Romania 38 64 116 29 51 168Russia 102 161 194 39 78 43San MarinoSerbia 9 52 9 679 1016 291Slovakia 4 3 4 23 9 20Slovenia 1 1 1 1Spain 1 1Sweden 2SwitzerlandThe former Yugoslav Republic of Macedonia' 48 38 5 55 69 19Turkey 27 2 18 86 84 139Ukraine 23 63 658 28 36 520United Kingdom 4 3 5 12 1Grand Total 409 502 2970 1481 1696 1658
Unilateral declaration Friendly settlement
ECHR – Analysis of Statistics 2015
14/60
Country-specific information
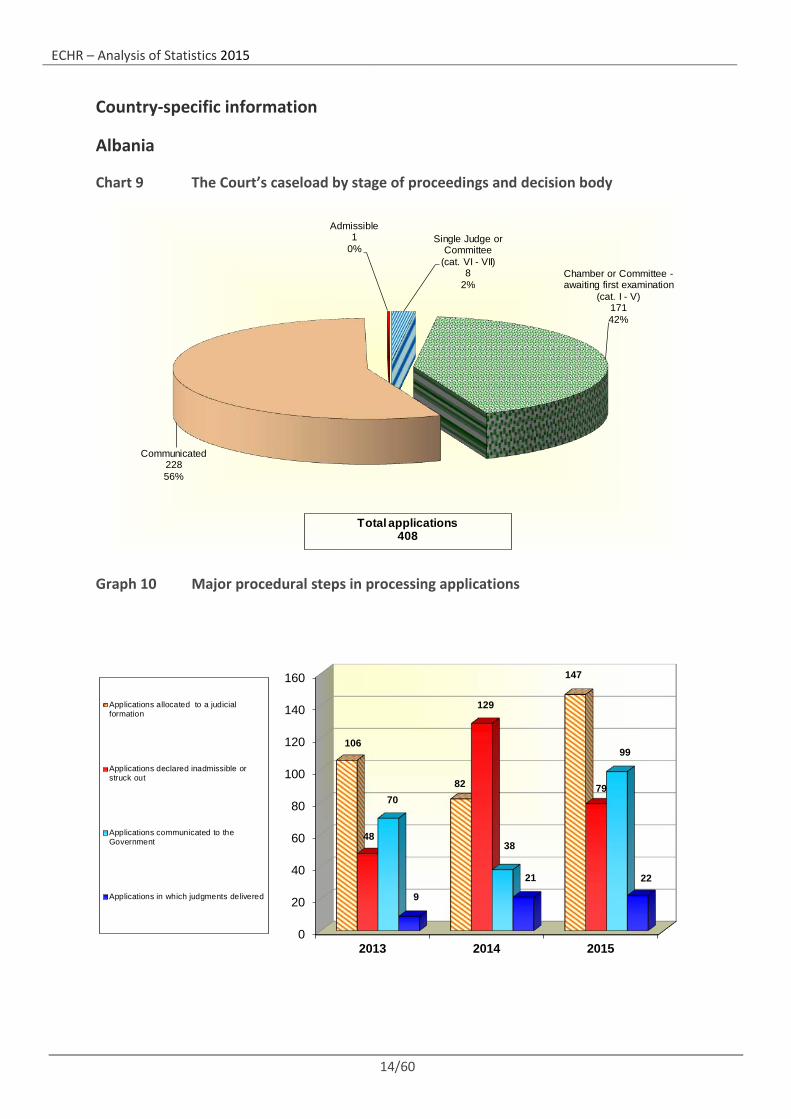
Albania
Chart 9 The Court’s caseload by stage of proceedings and decision body
Graph 10 Major procedural steps in processing applications
Single Judge or Committee
(cat. VI - VII)8
2%Chamber or Committee -awaiting first examination
(cat. I - V)17142%
Communicated22856%
Admissible1
0%
Total applications408
0
20
40
60
80
100
120
140
160
2013 2014 2015
106
82
147
48
129
7970
38
99
9
21 22
Applications allocated to a judicialformation
Applications declared inadmissible orstruck out
Applications communicated to theGovernment
Applications in which judgments delivered
ECHR – Analysis of Statistics 2015
15/60
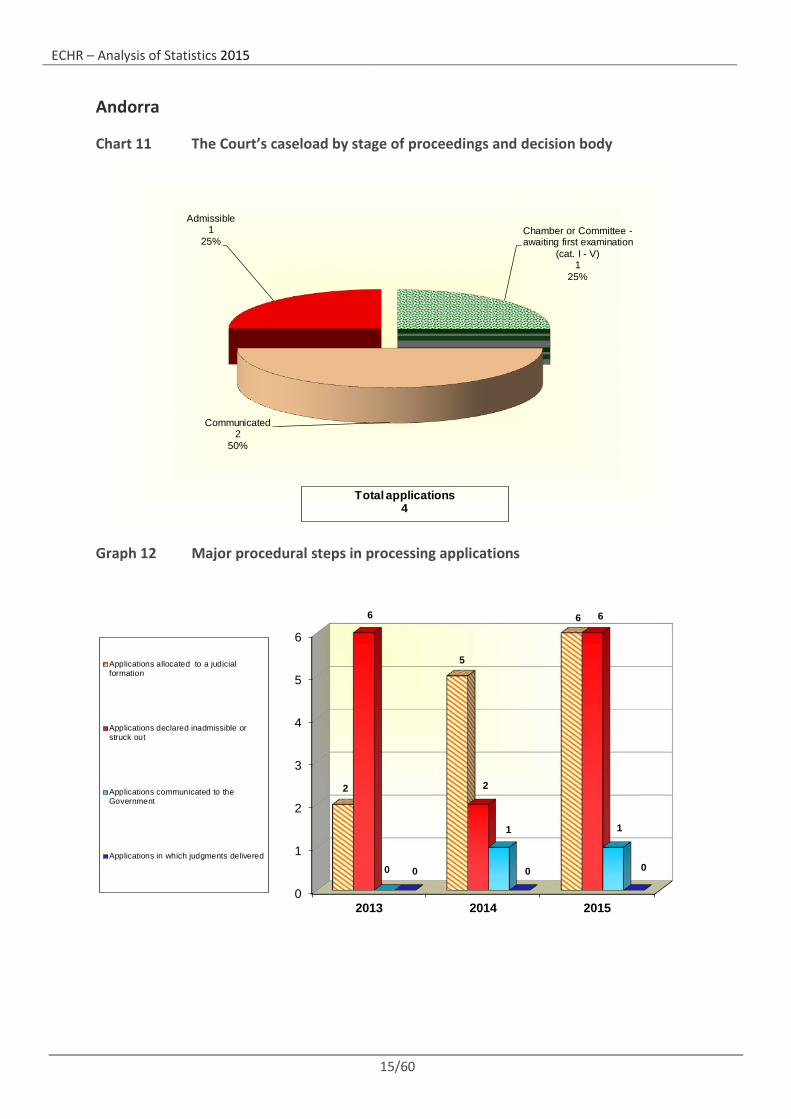
Andorra
Chart 11 The Court’s caseload by stage of proceedings and decision body
Graph 12 Major procedural steps in processing applications
Chamber or Committee -awaiting first examination
(cat. I - V)1
25%
Communicated2
50%
Admissible1
25%
Total applications4
0
1
2
3
4
5
6
2013 2014 2015
2
5
66
2
6
0
1 1
0 0 0
Applications allocated to a judicialformation
Applications declared inadmissible orstruck out
Applications communicated to theGovernment
Applications in which judgments delivered
ECHR – Analysis of Statistics 2015
16/60
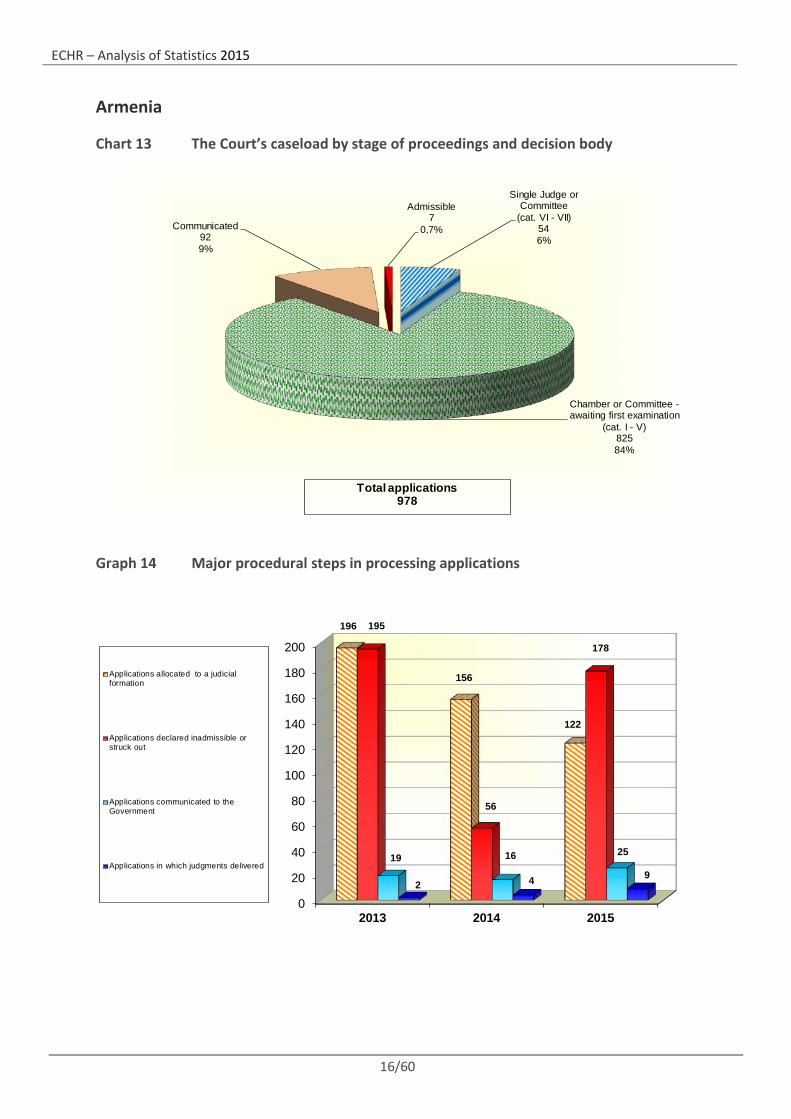
Armenia
Chart 13 The Court’s caseload by stage of proceedings and decision body
Graph 14 Major procedural steps in processing applications
Single Judge or Committee
(cat. VI - VII)546%
Chamber or Committee -awaiting first examination
(cat. I - V)82584%
Communicated929%
Admissible7
0,7%
Total applications978
0
20
40
60
80
100
120
140
160
180
200
2013 2014 2015
196
156
122
195
56
178
19 16 25
2 4 9
Applications allocated to a judicialformation
Applications declared inadmissible orstruck out
Applications communicated to theGovernment
Applications in which judgments delivered
ECHR – Analysis of Statistics 2015
17/60
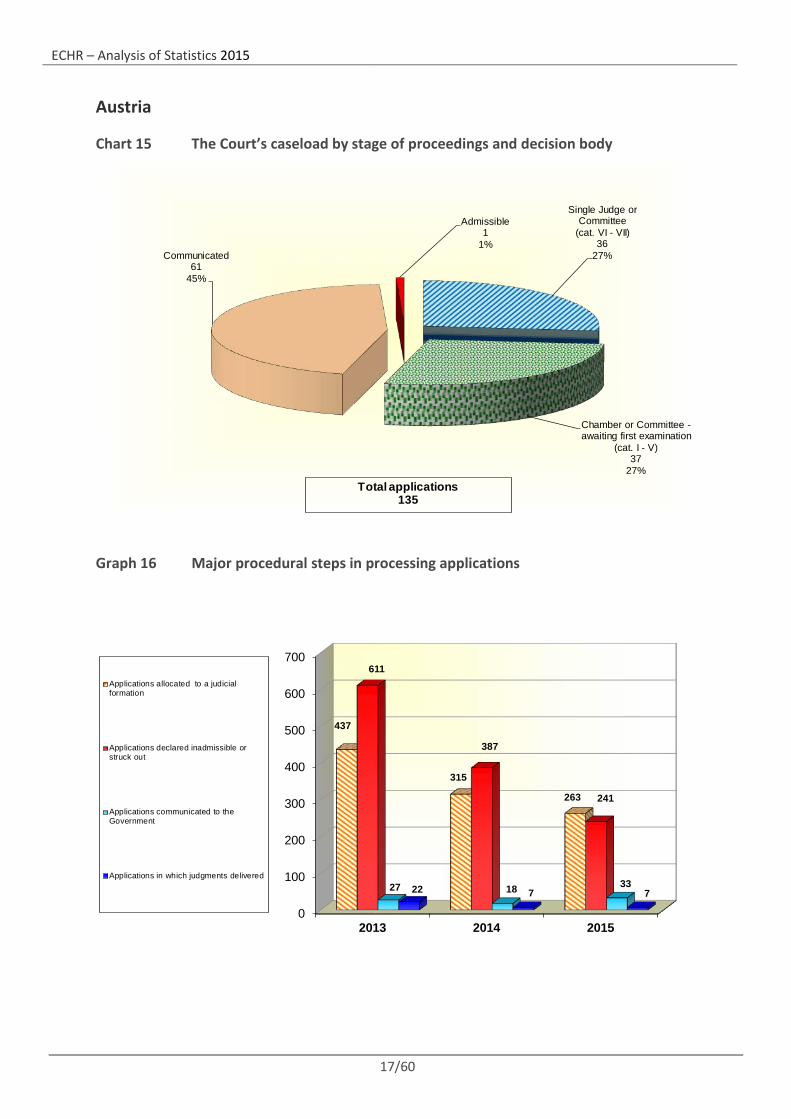
Austria
Chart 15 The Court’s caseload by stage of proceedings and decision body
Graph 16 Major procedural steps in processing applications
Single Judge or Committee
(cat. VI - VII)36
27%
Chamber or Committee -awaiting first examination
(cat. I - V)37
27%
Communicated61
45%
Admissible1
1%
Total applications135
0
100
200
300
400
500
600
700
2013 2014 2015
437
315
263
611
387
241
27 18 3322 7 7
Applications allocated to a judicialformation
Applications declared inadmissible orstruck out
Applications communicated to theGovernment
Applications in which judgments delivered
ECHR – Analysis of Statistics 2015
18/60
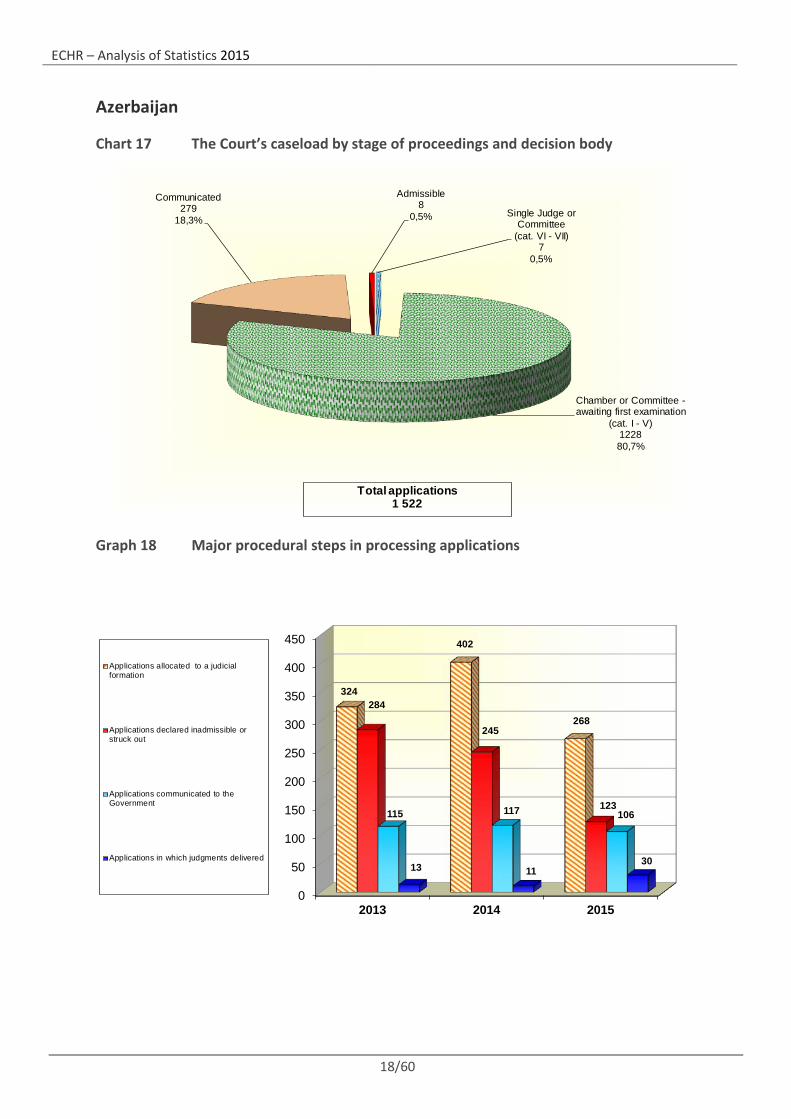
Azerbaijan
Chart 17 The Court’s caseload by stage of proceedings and decision body
Graph 18 Major procedural steps in processing applications
Single Judge or Committee
(cat. VI - VII)7
0,5%
Chamber or Committee -awaiting first examination
(cat. I - V)122880,7%
Communicated279
18,3%
Admissible8
0,5%
Total applications1 522
0
50
100
150
200
250
300
350
400
450
2013 2014 2015
324
402
268284
245
123115 117 106
13 1130
Applications allocated to a judicialformation
Applications declared inadmissible orstruck out
Applications communicated to theGovernment
Applications in which judgments delivered
ECHR – Analysis of Statistics 2015
19/60
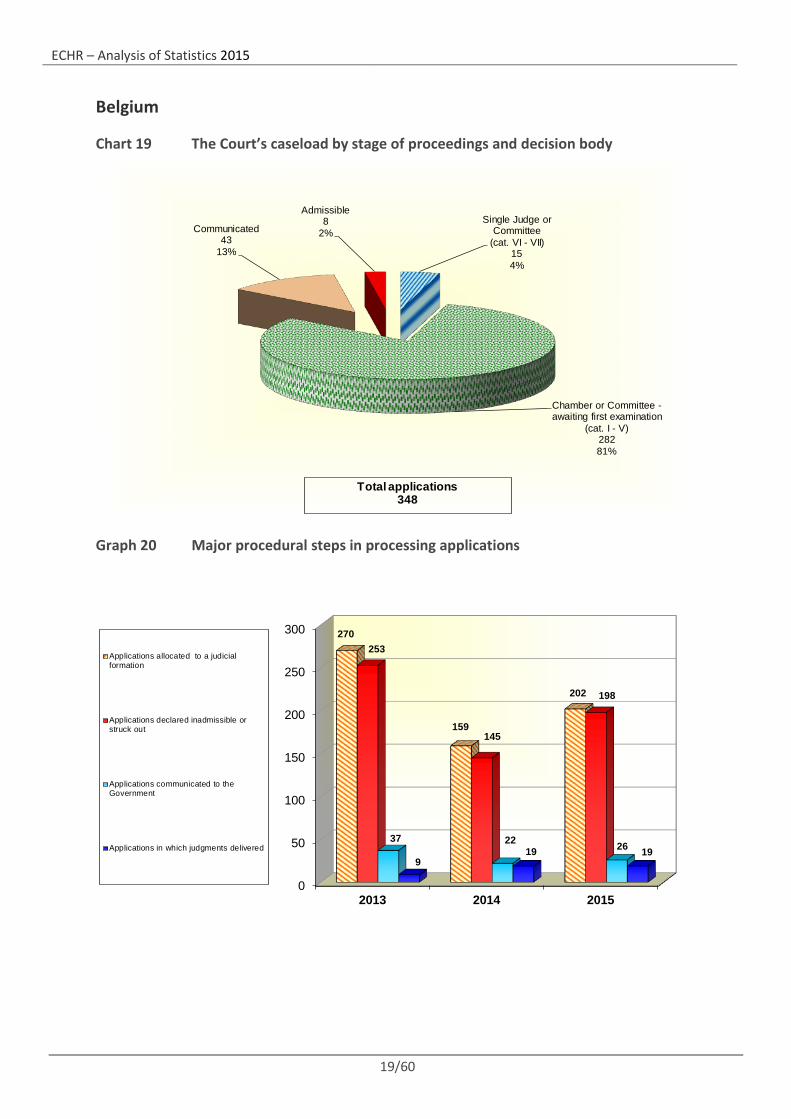
Belgium
Chart 19 The Court’s caseload by stage of proceedings and decision body
Graph 20 Major procedural steps in processing applications
Single Judge or Committee
(cat. VI - VII)154%
Chamber or Committee -awaiting first examination
(cat. I - V)28281%
Communicated43
13%
Admissible8
2%
Total applications348
0
50
100
150
200
250
300
2013 2014 2015
270
159
202
253
145
198
37 22 269
19 19
Applications allocated to a judicialformation
Applications declared inadmissible orstruck out
Applications communicated to theGovernment
Applications in which judgments delivered
ECHR – Analysis of Statistics 2015
20/60
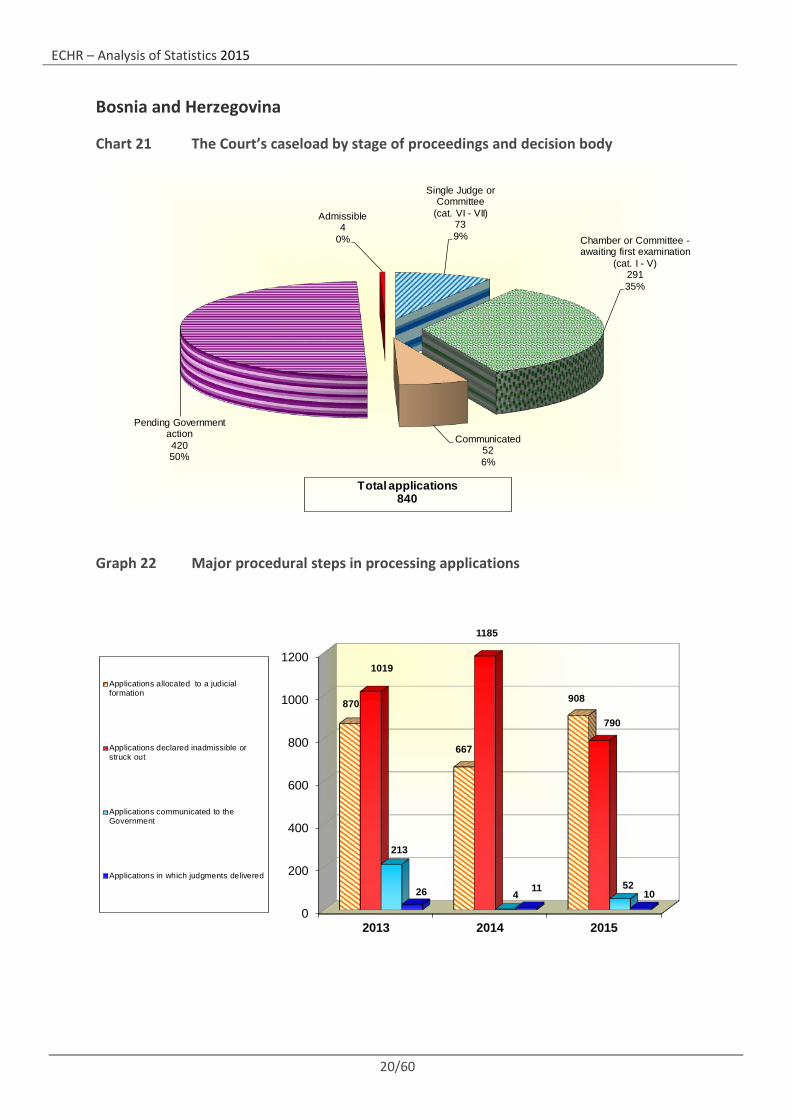
Bosnia and Herzegovina
Chart 21 The Court’s caseload by stage of proceedings and decision body
Graph 22 Major procedural steps in processing applications
Single Judge or Committee
(cat. VI - VII)739% Chamber or Committee -
awaiting first examination (cat. I - V)
29135%
Communicated526%
Pending Government action42050%
Admissible4
0%
Total applications840
0
200
400
600
800
1000
1200
2013 2014 2015
870
667
908
1019
1185
790
213
45226 11 10
Applications allocated to a judicialformation
Applications declared inadmissible orstruck out
Applications communicated to theGovernment
Applications in which judgments delivered
ECHR – Analysis of Statistics 2015
21/60
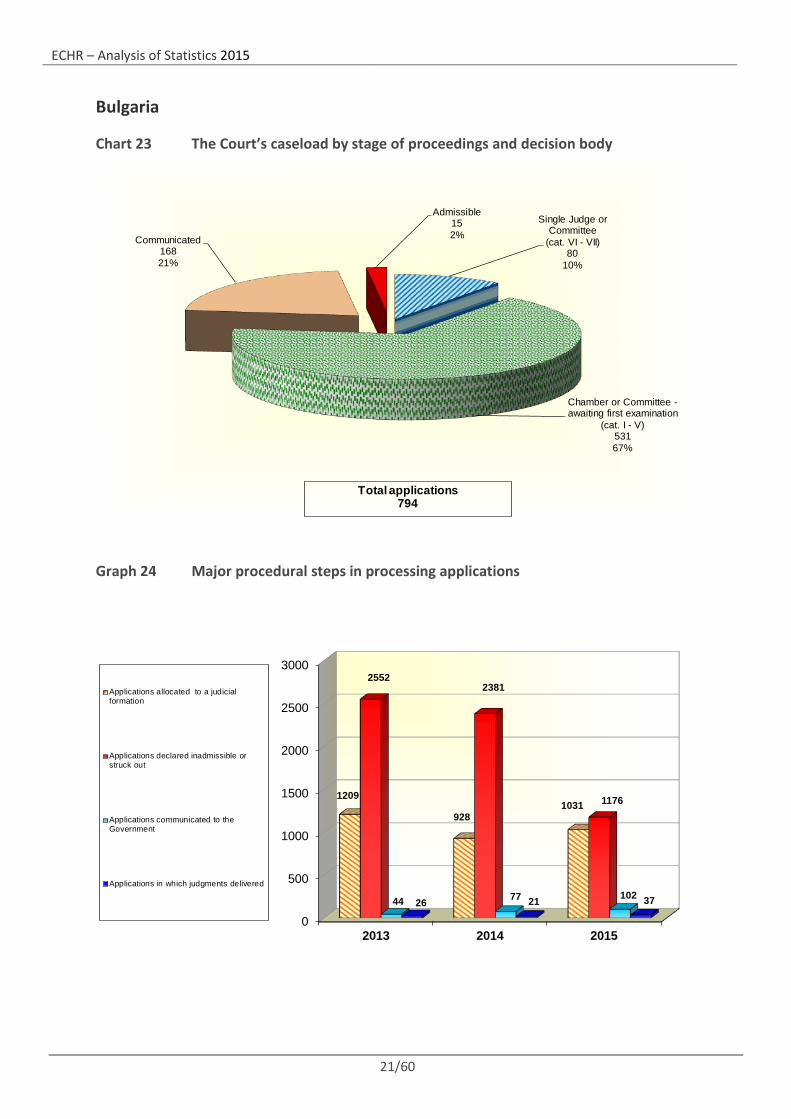
Bulgaria
Chart 23 The Court’s caseload by stage of proceedings and decision body
Graph 24 Major procedural steps in processing applications
Single Judge or Committee
(cat. VI - VII)80
10%
Chamber or Committee -awaiting first examination
(cat. I - V)53167%
Communicated16821%
Admissible152%
Total applications794
0
500
1000
1500
2000
2500
3000
2013 2014 2015
1209
9281031
25522381
1176
44 77 10226 21 37
Applications allocated to a judicialformation
Applications declared inadmissible orstruck out
Applications communicated to theGovernment
Applications in which judgments delivered
ECHR – Analysis of Statistics 2015
22/60
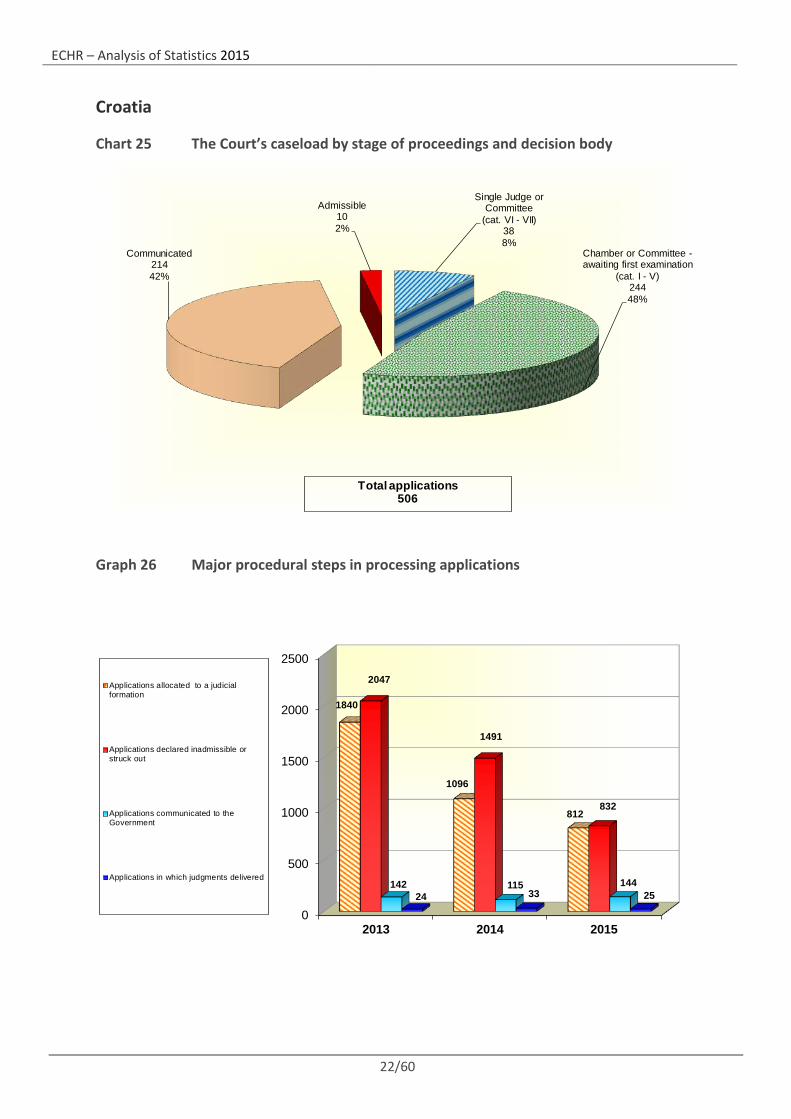
Croatia
Chart 25 The Court’s caseload by stage of proceedings and decision body
Graph 26 Major procedural steps in processing applications
Single Judge or Committee
(cat. VI - VII)388%
Chamber or Committee -awaiting first examination
(cat. I - V)24448%
Communicated21442%
Admissible102%
Total applications506
0
500
1000
1500
2000
2500
2013 2014 2015
1840
1096
812
2047
1491
832
142 115 14424 33 25
Applications allocated to a judicialformation
Applications declared inadmissible orstruck out
Applications communicated to theGovernment
Applications in which judgments delivered
ECHR – Analysis of Statistics 2015
23/60
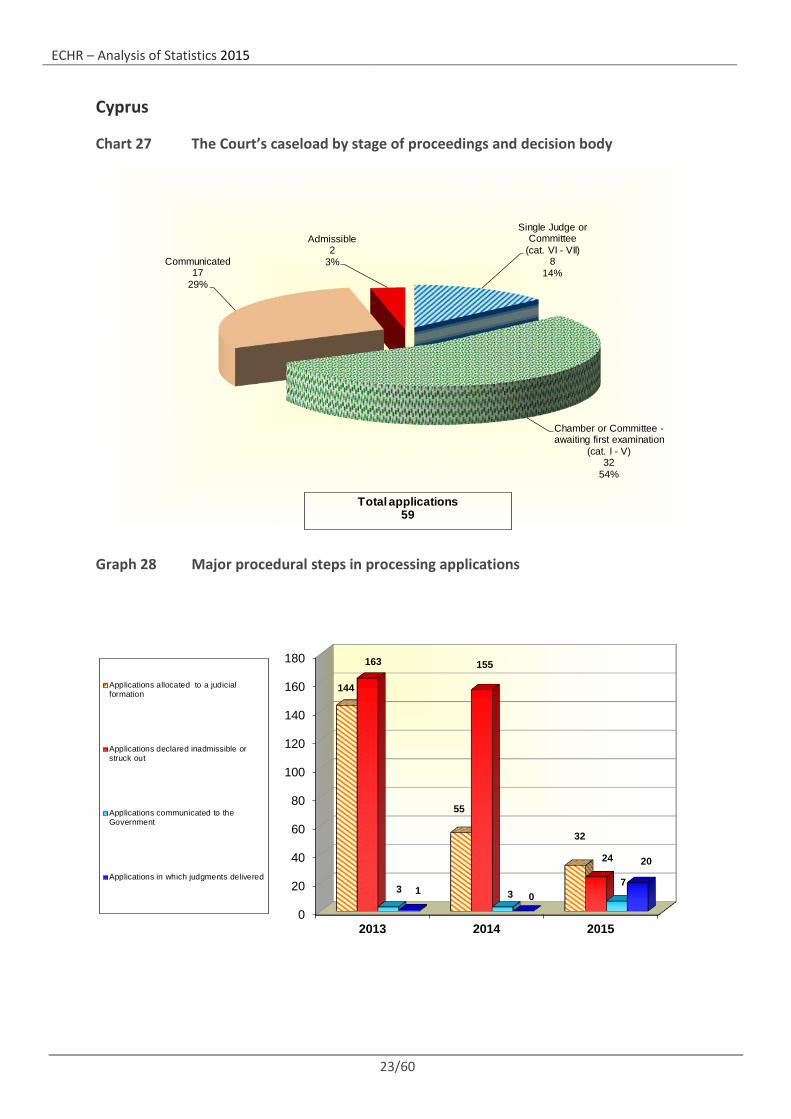
Cyprus
Chart 27 The Court’s caseload by stage of proceedings and decision body
Graph 28 Major procedural steps in processing applications
Single Judge or Committee
(cat. VI - VII)8
14%
Chamber or Committee -awaiting first examination
(cat. I - V)32
54%
Communicated17
29%
Admissible2
3%
Total applications59
0
20
40
60
80
100
120
140
160
180
2013 2014 2015
144
55
32
163 155
24
3 37
1 0
20
Applications allocated to a judicialformation
Applications declared inadmissible orstruck out
Applications communicated to theGovernment
Applications in which judgments delivered
ECHR – Analysis of Statistics 2015
24/60
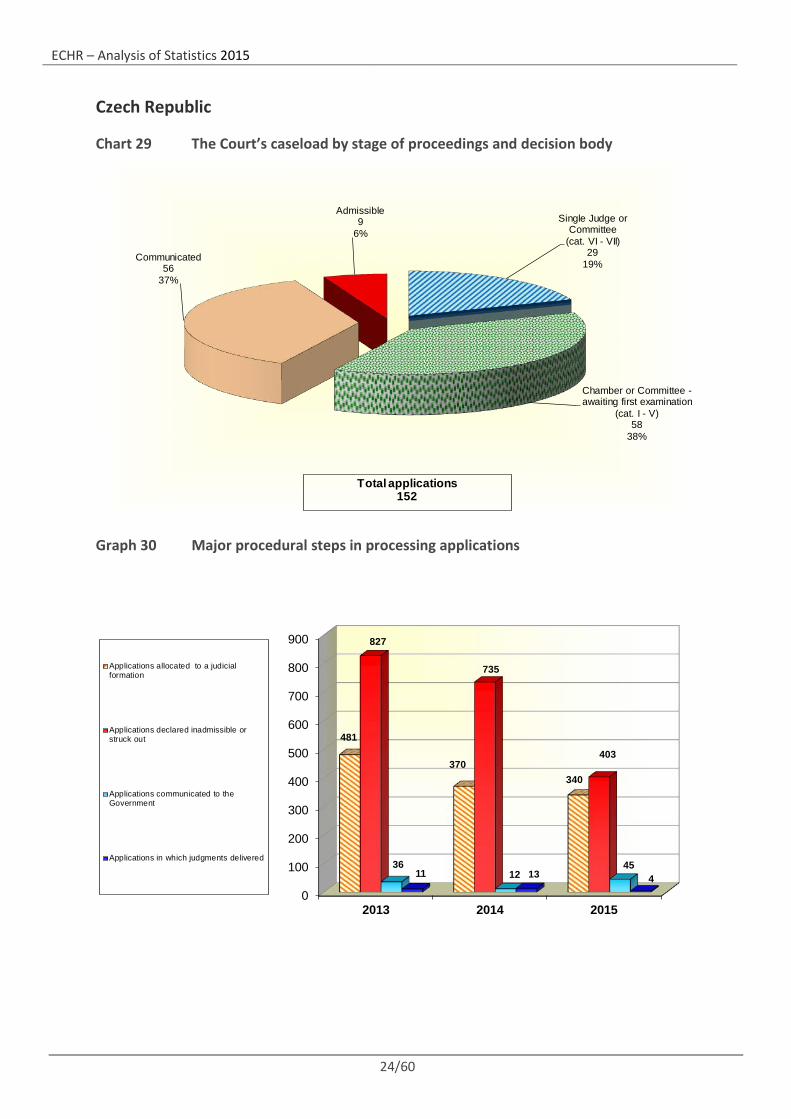
Czech Republic
Chart 29 The Court’s caseload by stage of proceedings and decision body
Graph 30 Major procedural steps in processing applications
Single Judge or Committee
(cat. VI - VII)29
19%
Chamber or Committee -awaiting first examination
(cat. I - V)58
38%
Communicated56
37%
Admissible9
6%
Total applications152
0
100
200
300
400
500
600
700
800
900
2013 2014 2015
481
370340
827
735
403
3612
4511 13 4
Applications allocated to a judicialformation
Applications declared inadmissible orstruck out
Applications communicated to theGovernment
Applications in which judgments delivered

ECHR – Analysis of Statistics 2015
25/60
Denmark
Chart 31 The Court’s caseload by stage of proceedings and decision body
Graph 32 Major procedural steps in processing applications
Single Judge or Committee
(cat. VI - VII)2
7%
Chamber or Committee -awaiting first examination
(cat. I - V)17
57%
Communicated10
33%
Admissible1
3%
Total applications30
0
10
20
30
40
50
60
70
80
90
2013 2014 2015
84
66
45
88
60
48
6 500 2 0
Applications allocated to a judicialformation
Applications declared inadmissible orstruck out
Applications communicated to theGovernment
Applications in which judgments delivered
ECHR – Analysis of Statistics 2015
26/60
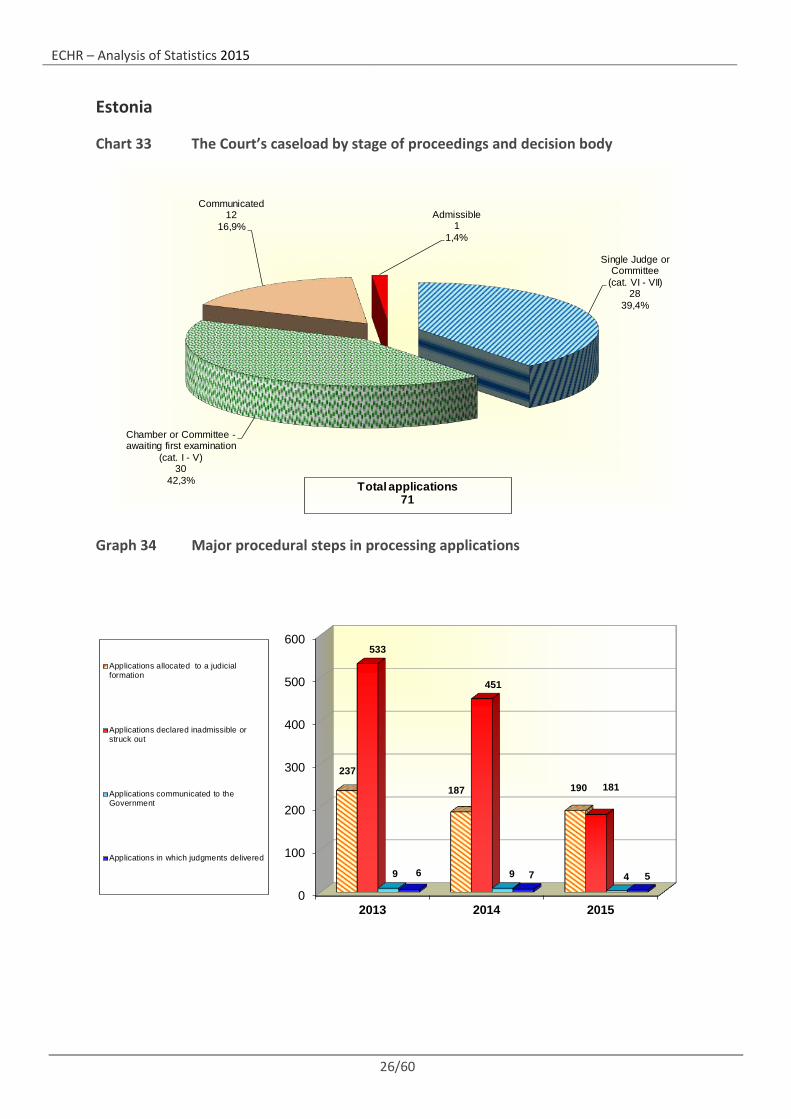
Estonia
Chart 33 The Court’s caseload by stage of proceedings and decision body
Graph 34 Major procedural steps in processing applications
Single Judge or Committee
(cat. VI - VII)28
39,4%
Chamber or Committee -awaiting first examination
(cat. I - V)30
42,3%
Communicated12
16,9%Admissible
11,4%
Total applications71
0
100
200
300
400
500
600
2013 2014 2015
237
187 190
533
451
181
9 9 46 7 5
Applications allocated to a judicialformation
Applications declared inadmissible orstruck out
Applications communicated to theGovernment
Applications in which judgments delivered
ECHR – Analysis of Statistics 2015
27/60
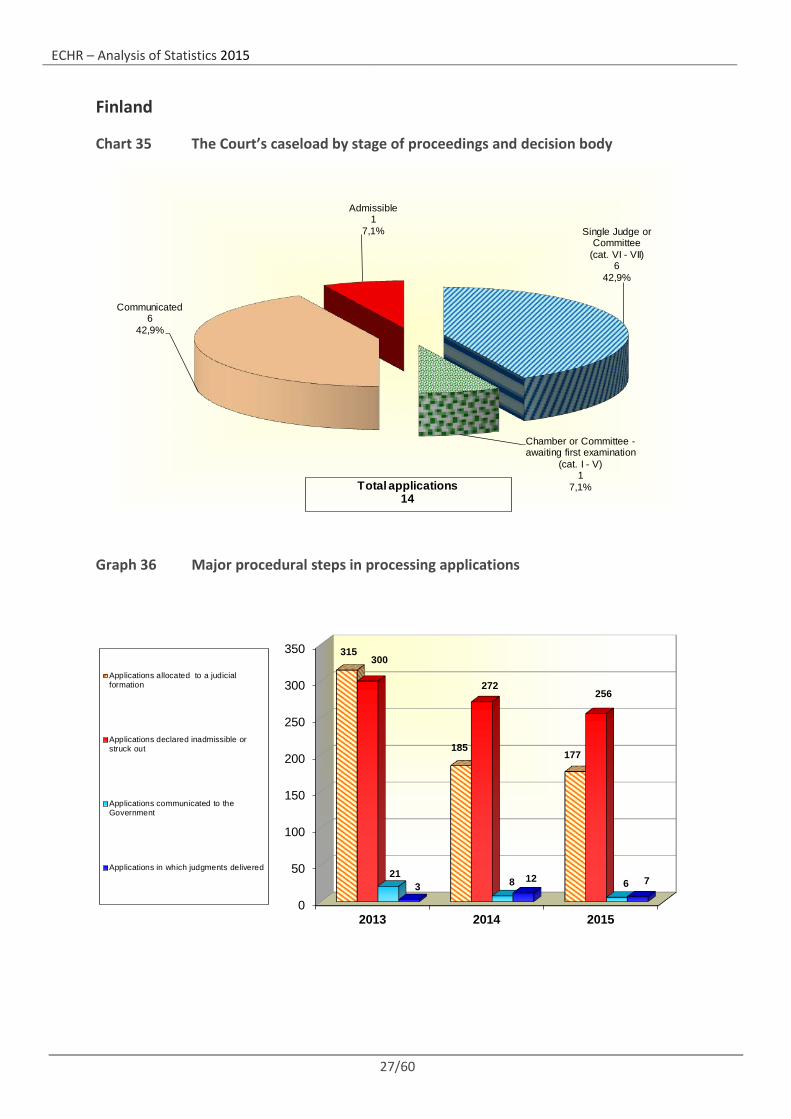
Finland
Chart 35 The Court’s caseload by stage of proceedings and decision body
Graph 36 Major procedural steps in processing applications
Single Judge or Committee
(cat. VI - VII)6
42,9%
Chamber or Committee -awaiting first examination
(cat. I - V)1
7,1%
Communicated6
42,9%
Admissible1
7,1%
Total applications14
0
50
100
150
200
250
300
350
2013 2014 2015
315
185177
300
272256
218 63
12 7
Applications allocated to a judicialformation
Applications declared inadmissible orstruck out
Applications communicated to theGovernment
Applications in which judgments delivered
ECHR – Analysis of Statistics 2015
28/60
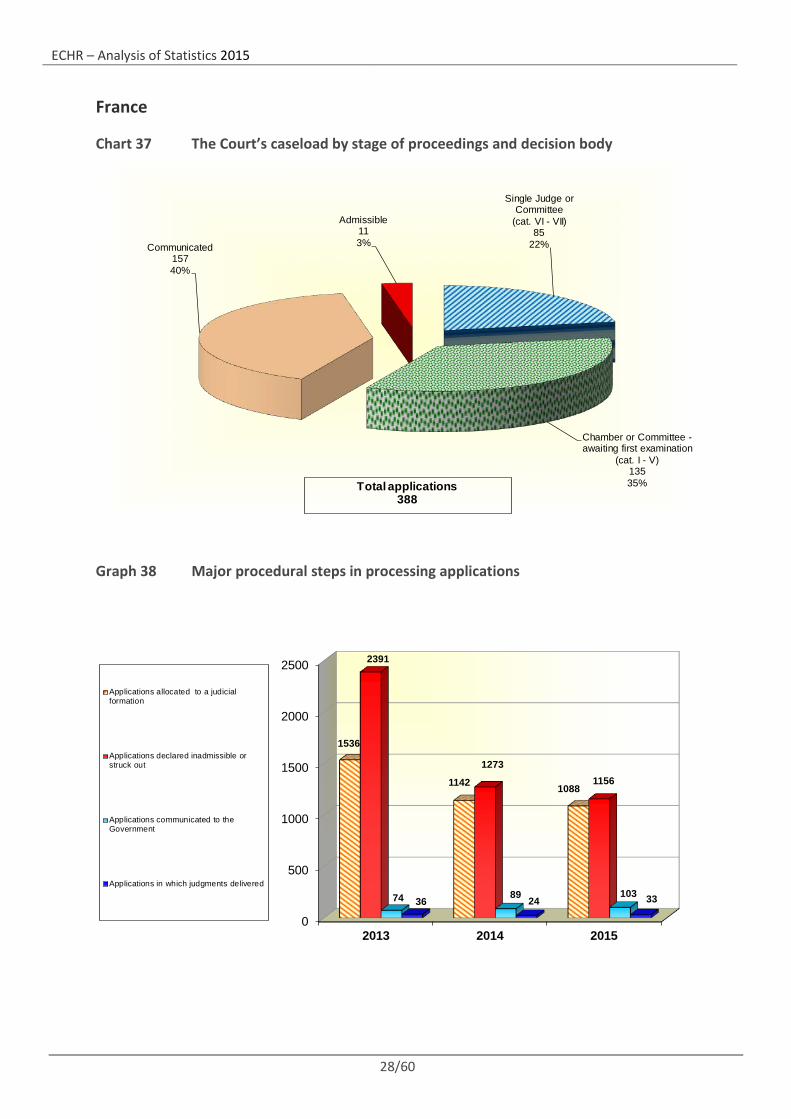
France
Chart 37 The Court’s caseload by stage of proceedings and decision body
Graph 38 Major procedural steps in processing applications
Single Judge or Committee
(cat. VI - VII)85
22%
Chamber or Committee -awaiting first examination
(cat. I - V)13535%
Communicated15740%
Admissible113%
Total applications388
0
500
1000
1500
2000
2500
2013 2014 2015
1536
1142 1088
2391
12731156
74 89 10336 24 33
Applications allocated to a judicialformation
Applications declared inadmissible orstruck out
Applications communicated to theGovernment
Applications in which judgments delivered
ECHR – Analysis of Statistics 2015
29/60
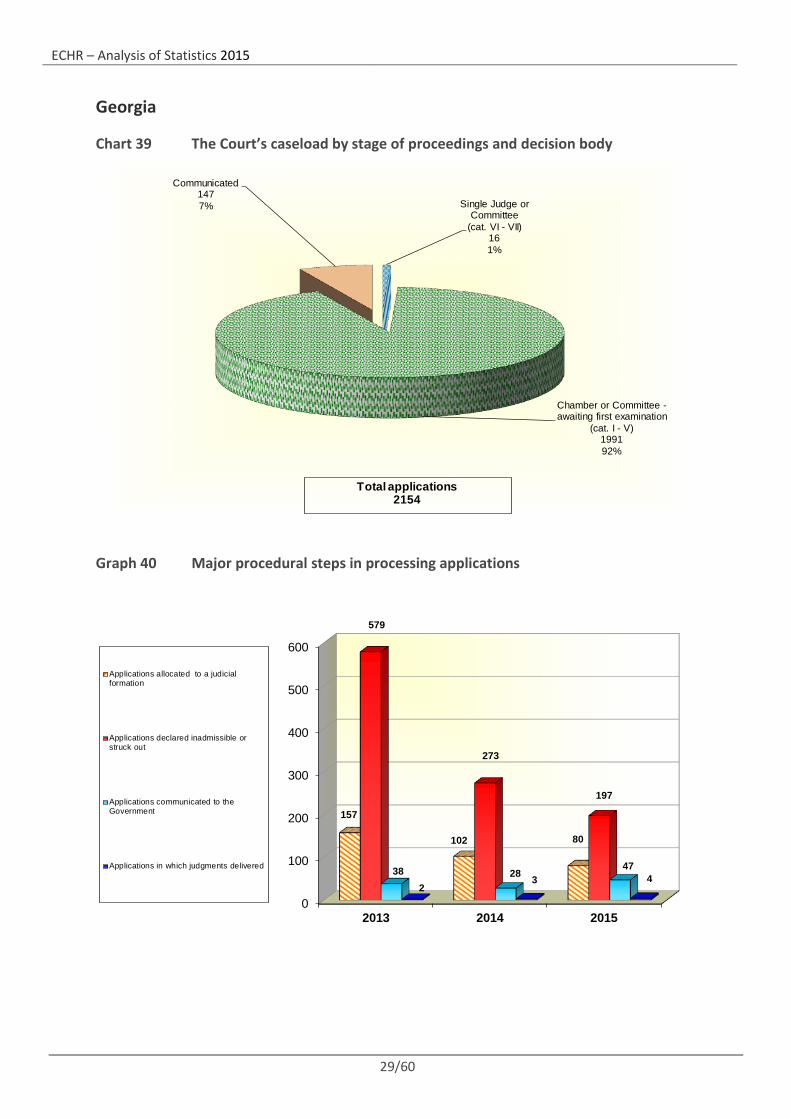
Georgia
Chart 39 The Court’s caseload by stage of proceedings and decision body
Graph 40 Major procedural steps in processing applications
Single Judge or Committee
(cat. VI - VII)161%
Chamber or Committee -awaiting first examination
(cat. I - V)199192%
Communicated1477%
Total applications2154
0
100
200
300
400
500
600
2013 2014 2015
157
102 80
579
273
197
38 2847
23 4
Applications allocated to a judicialformation
Applications declared inadmissible orstruck out
Applications communicated to theGovernment
Applications in which judgments delivered
ECHR – Analysis of Statistics 2015
30/60
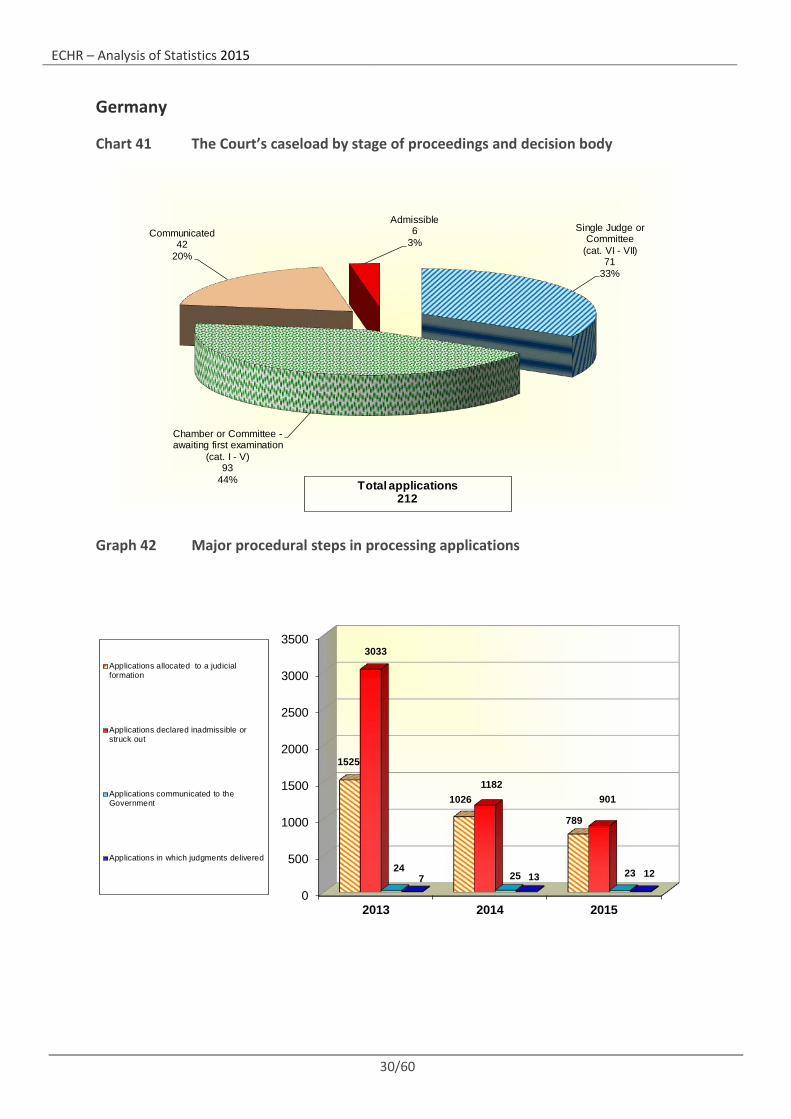
Germany
Chart 41 The Court’s caseload by stage of proceedings and decision body
Graph 42 Major procedural steps in processing applications
Single Judge or Committee
(cat. VI - VII)71
33%
Chamber or Committee -awaiting first examination
(cat. I - V)93
44%
Communicated42
20%
Admissible6
3%
Total applications212
0
500
1000
1500
2000
2500
3000
3500
2013 2014 2015
1525
1026
789
3033
1182901
2425 237 13 12
Applications allocated to a judicialformation
Applications declared inadmissible orstruck out
Applications communicated to theGovernment
Applications in which judgments delivered
ECHR – Analysis of Statistics 2015
31/60
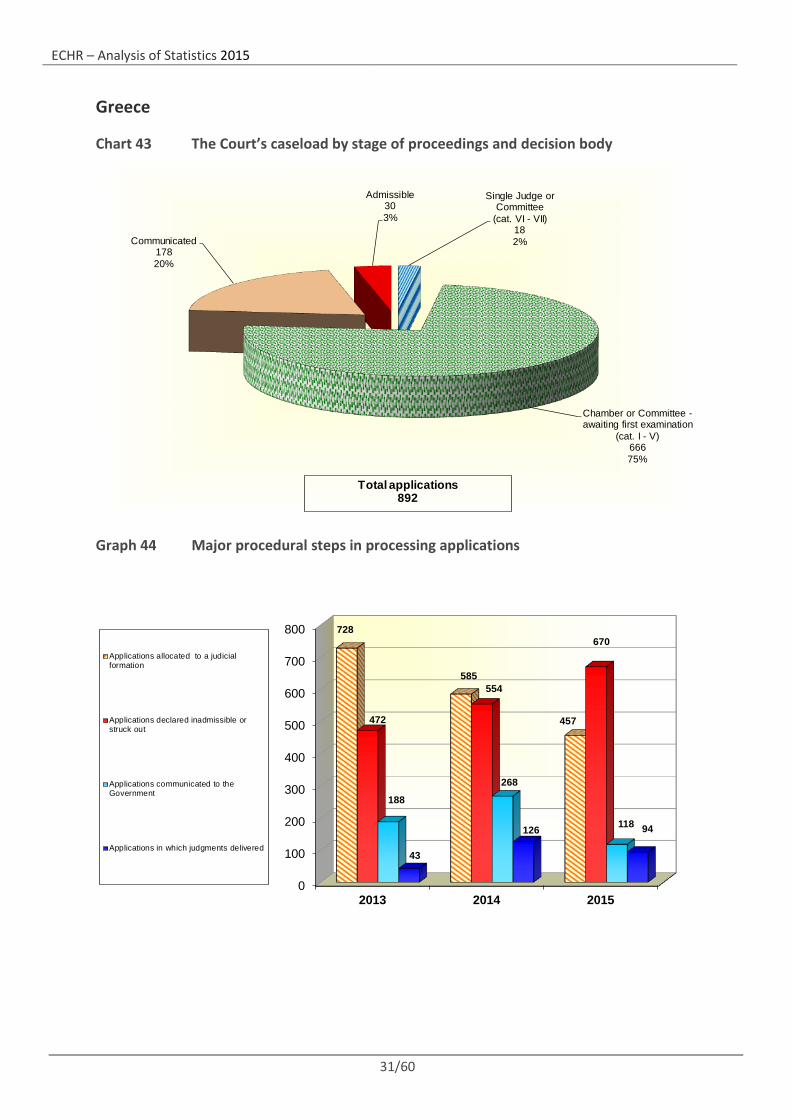
Greece
Chart 43 The Court’s caseload by stage of proceedings and decision body
Graph 44 Major procedural steps in processing applications
Single Judge or Committee
(cat. VI - VII)182%
Chamber or Committee -awaiting first examination
(cat. I - V)66675%
Communicated17820%
Admissible303%
Total applications892
0
100
200
300
400
500
600
700
800
2013 2014 2015
728
585
457472
554
670
188
268
118
43
126 94
Applications allocated to a judicialformation
Applications declared inadmissible orstruck out
Applications communicated to theGovernment
Applications in which judgments delivered
ECHR – Analysis of Statistics 2015
32/60
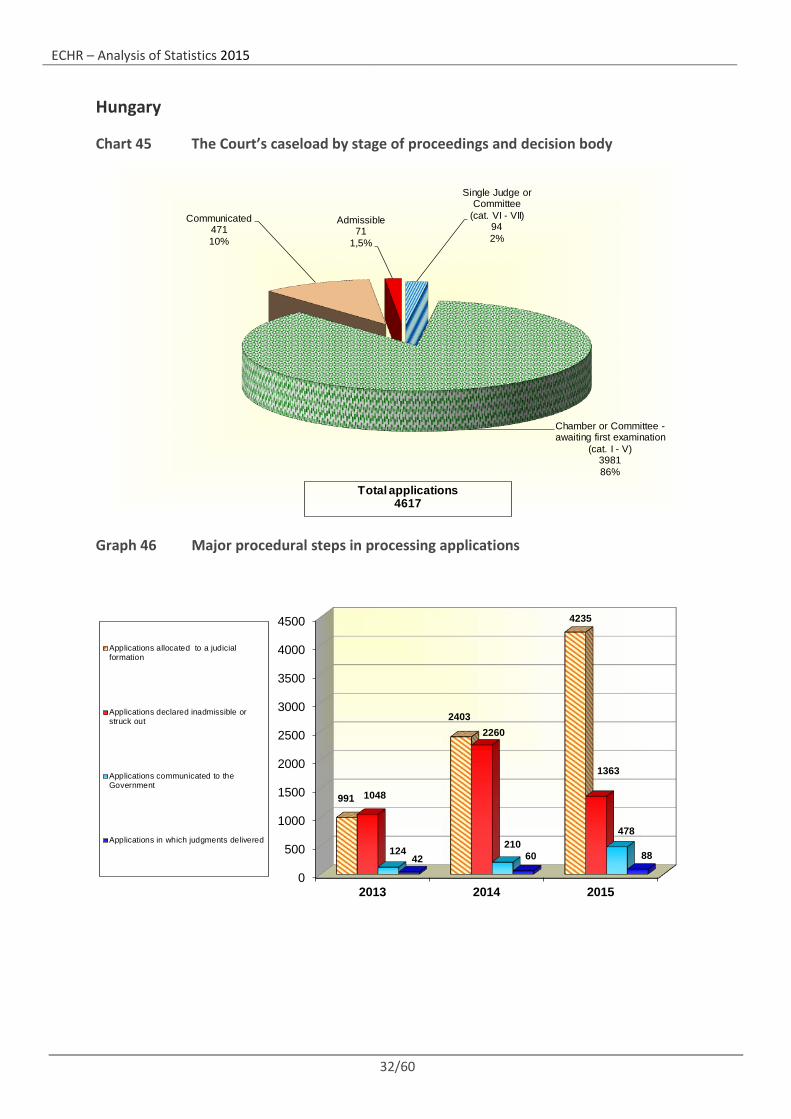
Hungary
Chart 45 The Court’s caseload by stage of proceedings and decision body
Graph 46 Major procedural steps in processing applications
Single Judge or Committee
(cat. VI - VII)942%
Chamber or Committee -awaiting first examination
(cat. I - V)398186%
Communicated47110%
Admissible71
1,5%
Total applications4617
0
500
1000
1500
2000
2500
3000
3500
4000
4500
2013 2014 2015
991
2403
4235
1048
2260
1363
124 210478
42 60 88
Applications allocated to a judicialformation
Applications declared inadmissible orstruck out
Applications communicated to theGovernment
Applications in which judgments delivered
ECHR – Analysis of Statistics 2015
33/60
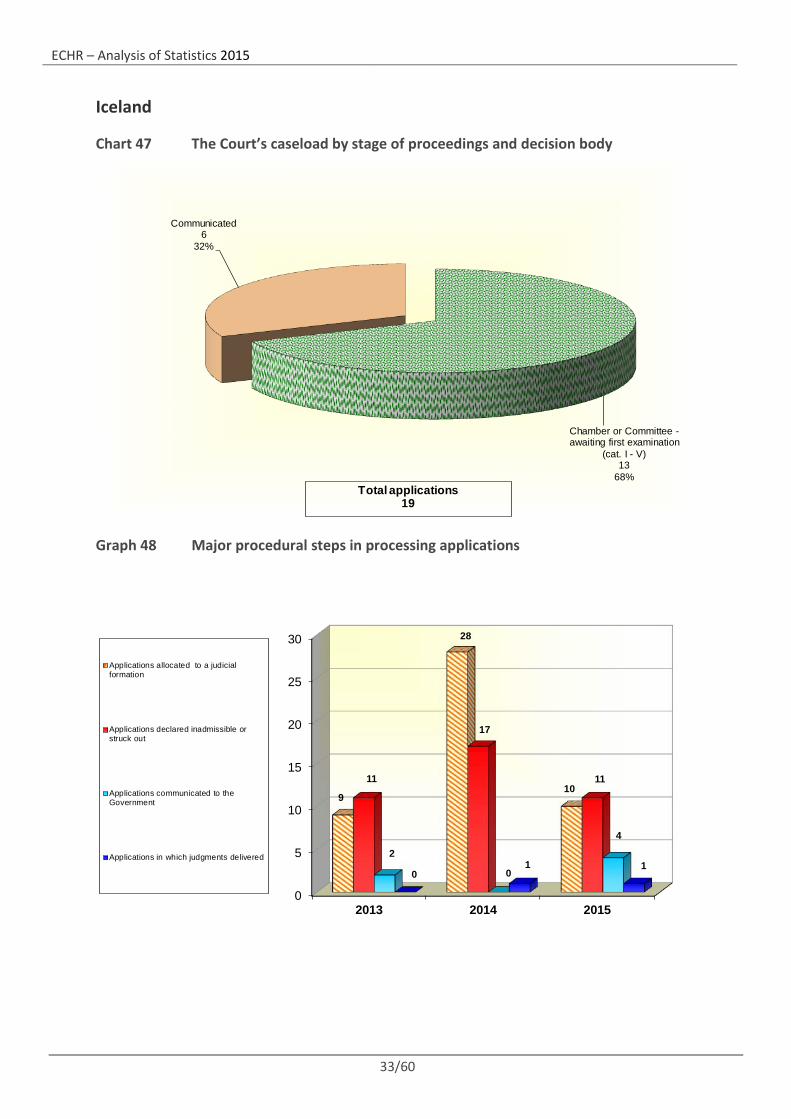
Iceland
Chart 47 The Court’s caseload by stage of proceedings and decision body
Graph 48 Major procedural steps in processing applications
Chamber or Committee -awaiting first examination
(cat. I - V)13
68%
Communicated6
32%
Total applications19
0
5
10
15
20
25
30
2013 2014 2015
9
28
1011
17
11
2
0
4
01 1
Applications allocated to a judicialformation
Applications declared inadmissible orstruck out
Applications communicated to theGovernment
Applications in which judgments delivered
ECHR – Analysis of Statistics 2015
34/60
Ireland
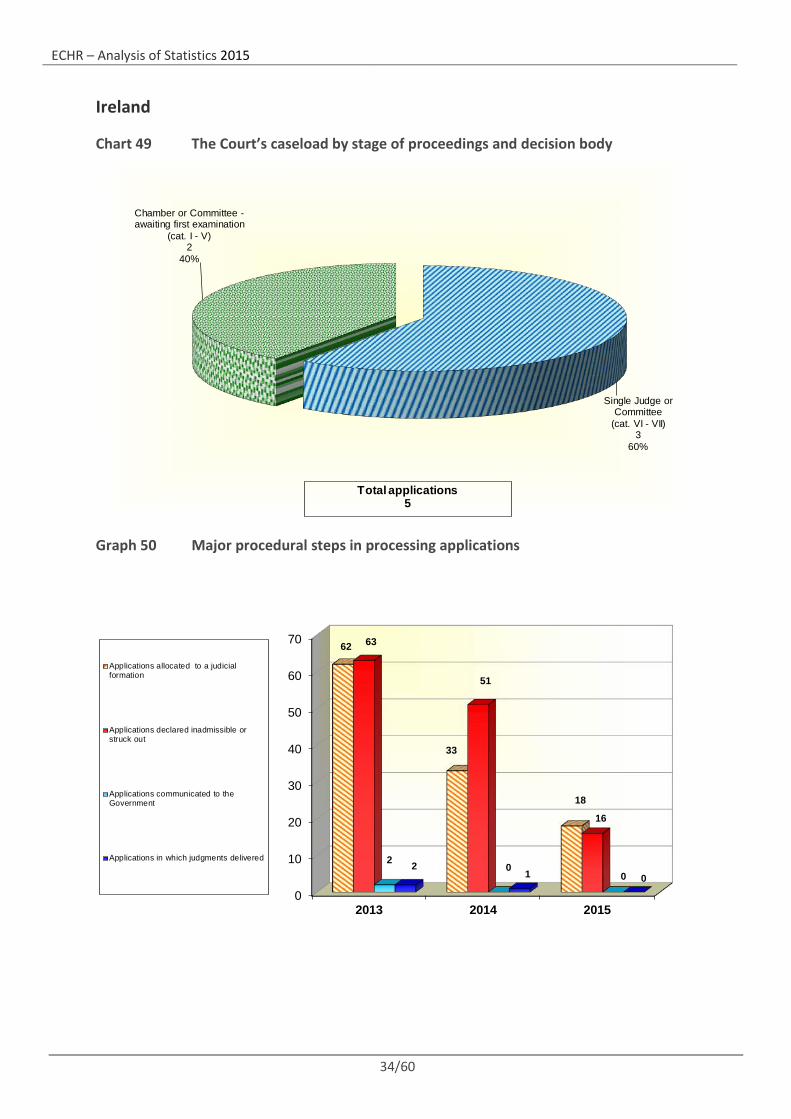
Chart 49 The Court’s caseload by stage of proceedings and decision body
Graph 50 Major procedural steps in processing applications
Single Judge or Committee
(cat. VI - VII)3
60%
Chamber or Committee -awaiting first examination
(cat. I - V)2
40%
Total applications5
0
10
20
30
40
50
60
70
2013 2014 2015
62
33
18
63
51
16
20
02
1 0
Applications allocated to a judicialformation
Applications declared inadmissible orstruck out
Applications communicated to theGovernment
Applications in which judgments delivered
ECHR – Analysis of Statistics 2015
35/60
Italy
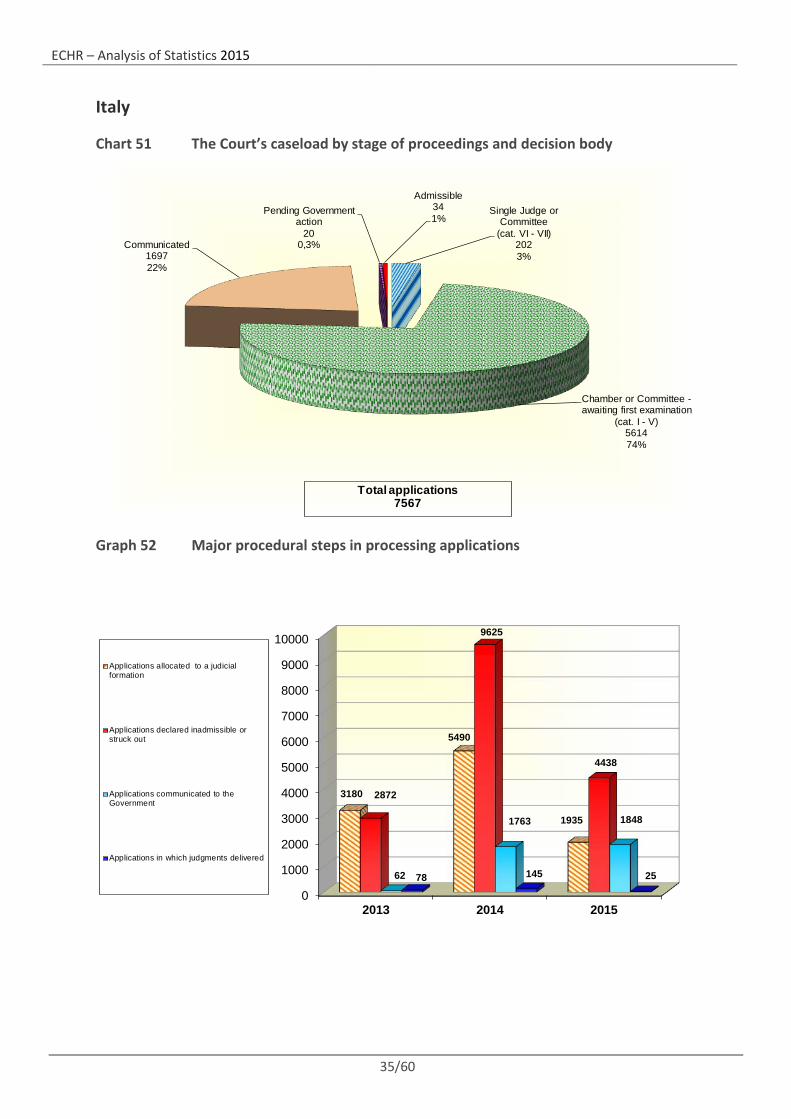
Chart 51 The Court’s caseload by stage of proceedings and decision body
Graph 52 Major procedural steps in processing applications
Single Judge or Committee
(cat. VI - VII)2023%
Chamber or Committee -awaiting first examination
(cat. I - V)561474%
Communicated169722%
Pending Government action
200,3%
Admissible341%
Total applications7567
0
1000
2000
3000
4000
5000
6000
7000
8000
9000
10000
2013 2014 2015
3180
5490
1935
2872
9625
4438
62
1763 1848
78 145 25
Applications allocated to a judicialformation
Applications declared inadmissible orstruck out
Applications communicated to theGovernment
Applications in which judgments delivered
ECHR – Analysis of Statistics 2015
36/60
Latvia
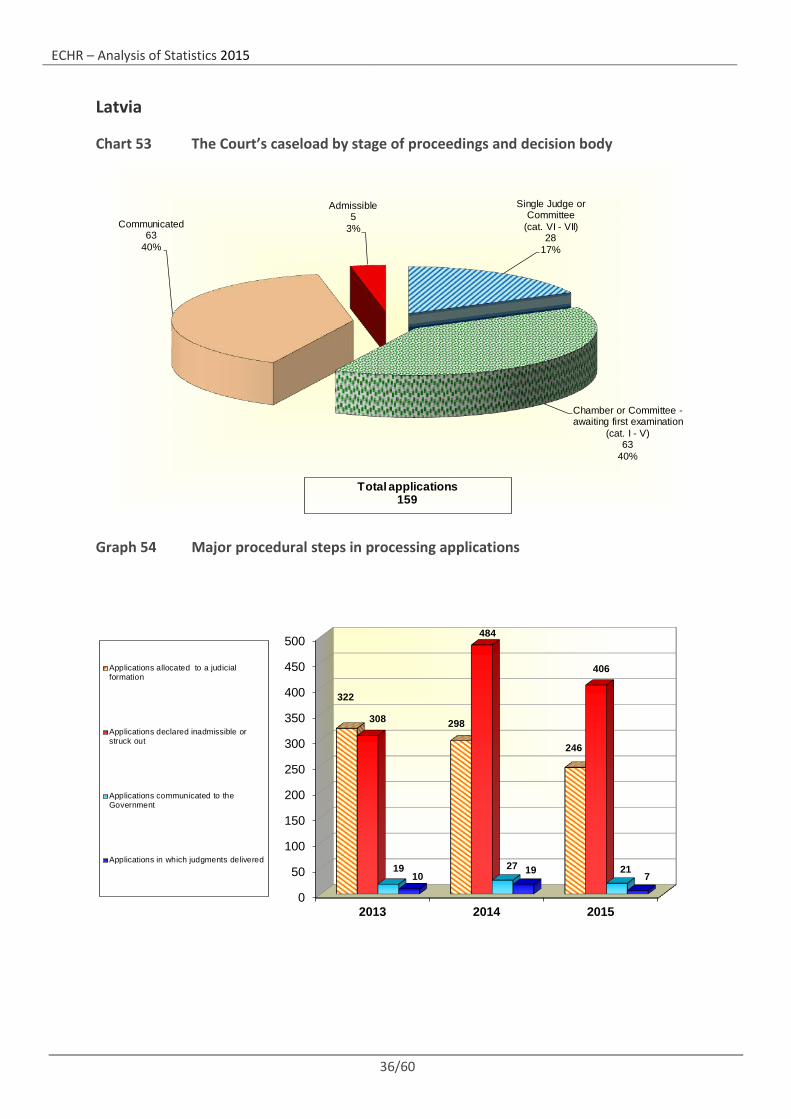
Chart 53 The Court’s caseload by stage of proceedings and decision body
Graph 54 Major procedural steps in processing applications
Single Judge or Committee
(cat. VI - VII)28
17%
Chamber or Committee -awaiting first examination
(cat. I - V)63
40%
Communicated63
40%
Admissible5
3%
Total applications159
0
50
100
150
200
250
300
350
400
450
500
2013 2014 2015
322
298
246
308
484
406
19 27 2110 19 7
Applications allocated to a judicialformation
Applications declared inadmissible orstruck out
Applications communicated to theGovernment
Applications in which judgments delivered
ECHR – Analysis of Statistics 2015
37/60
Liechtenstein
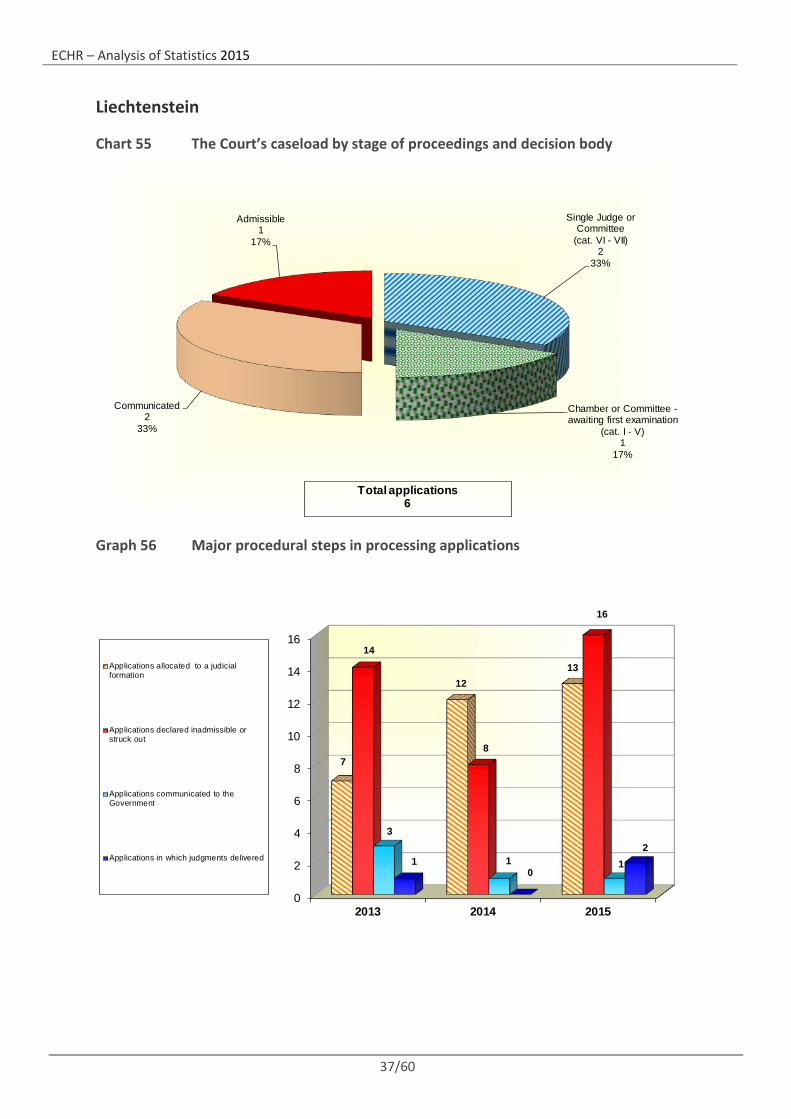
Chart 55 The Court’s caseload by stage of proceedings and decision body
Graph 56 Major procedural steps in processing applications
Single Judge or Committee
(cat. VI - VII)2
33%
Chamber or Committee -awaiting first examination
(cat. I - V)1
17%
Communicated2
33%
Admissible1
17%
Total applications6
0
2
4
6
8
10
12
14
16
2013 2014 2015
7
1213
14
8
16
3
1 110
2
Applications allocated to a judicialformation
Applications declared inadmissible orstruck out
Applications communicated to theGovernment
Applications in which judgments delivered
ECHR – Analysis of Statistics 2015
38/60
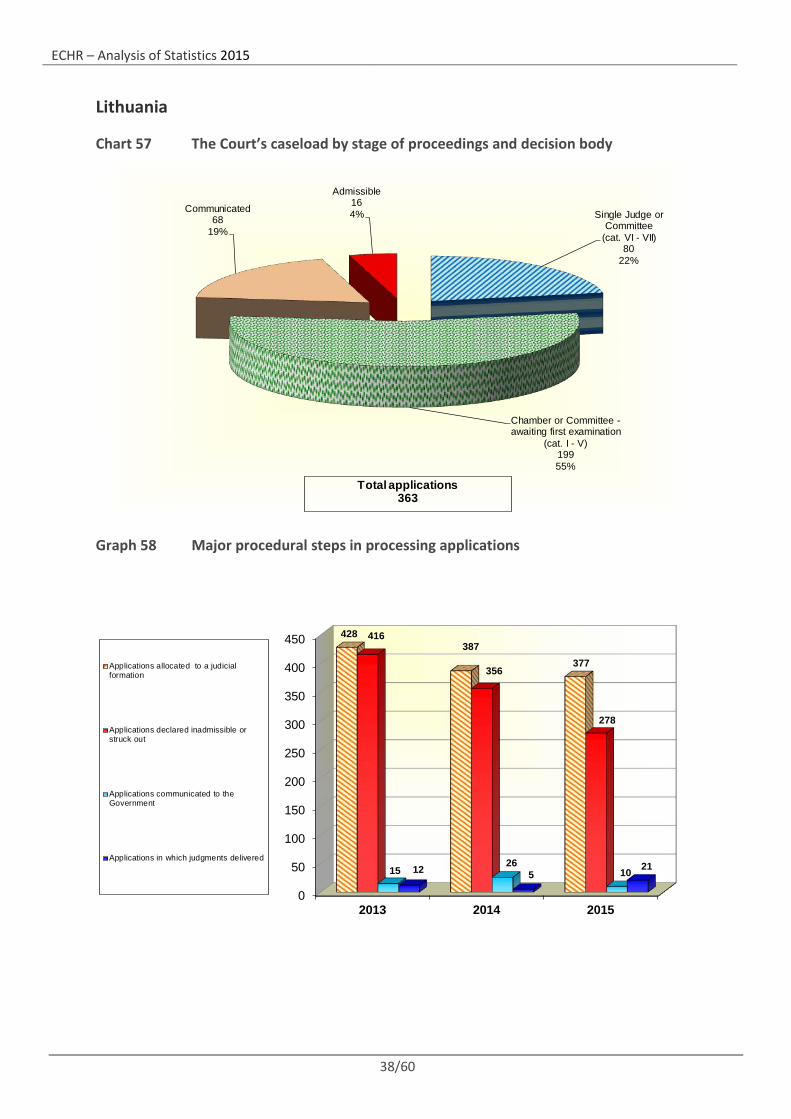
Lithuania
Chart 57 The Court’s caseload by stage of proceedings and decision body
Graph 58 Major procedural steps in processing applications
Single Judge or Committee
(cat. VI - VII)80
22%
Chamber or Committee -awaiting first examination
(cat. I - V)19955%
Communicated68
19%
Admissible164%
Total applications363
0
50
100
150
200
250
300
350
400
450
2013 2014 2015
428387
377
416
356
278
1526
1012 521
Applications allocated to a judicialformation
Applications declared inadmissible orstruck out
Applications communicated to theGovernment
Applications in which judgments delivered
ECHR – Analysis of Statistics 2015
39/60
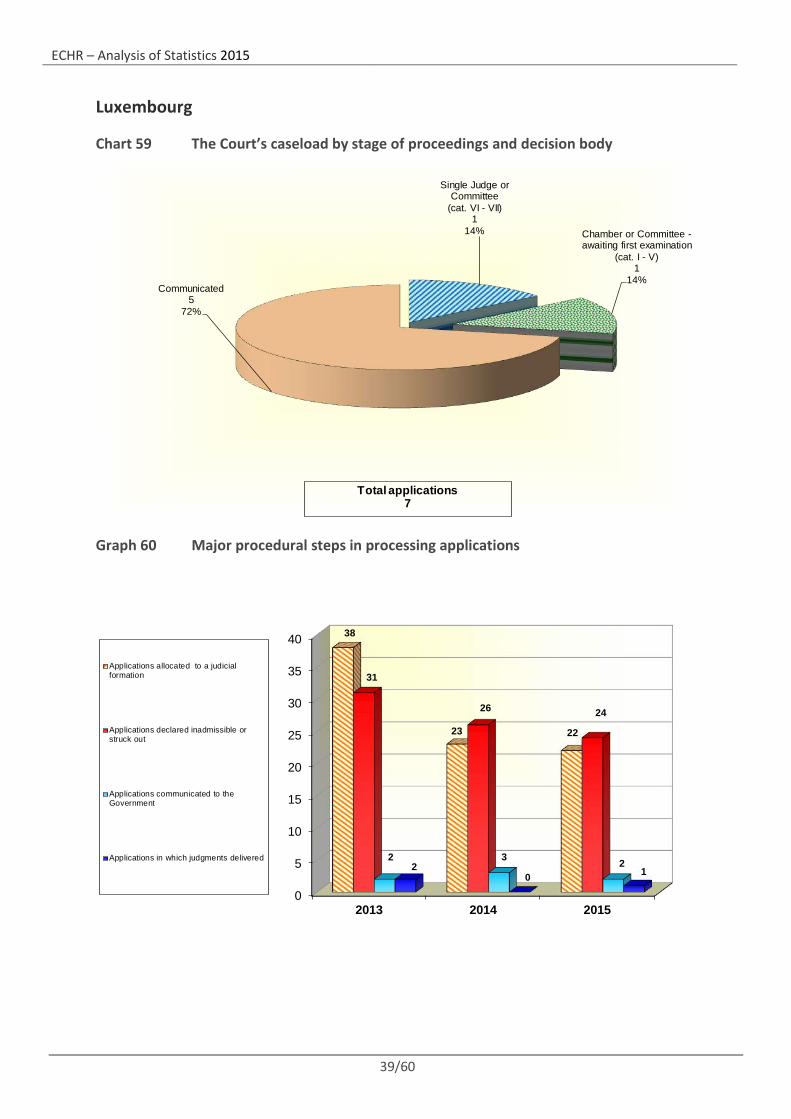
Luxembourg
Chart 59 The Court’s caseload by stage of proceedings and decision body
Graph 60 Major procedural steps in processing applications
Single Judge or Committee
(cat. VI - VII)1
14% Chamber or Committee -awaiting first examination
(cat. I - V)1
14%Communicated
572%
Total applications7
0
5
10
15
20
25
30
35
40
2013 2014 2015
38
23 22
31
26 24
2 3 220 1
Applications allocated to a judicialformation
Applications declared inadmissible orstruck out
Applications communicated to theGovernment
Applications in which judgments delivered
ECHR – Analysis of Statistics 2015
40/60
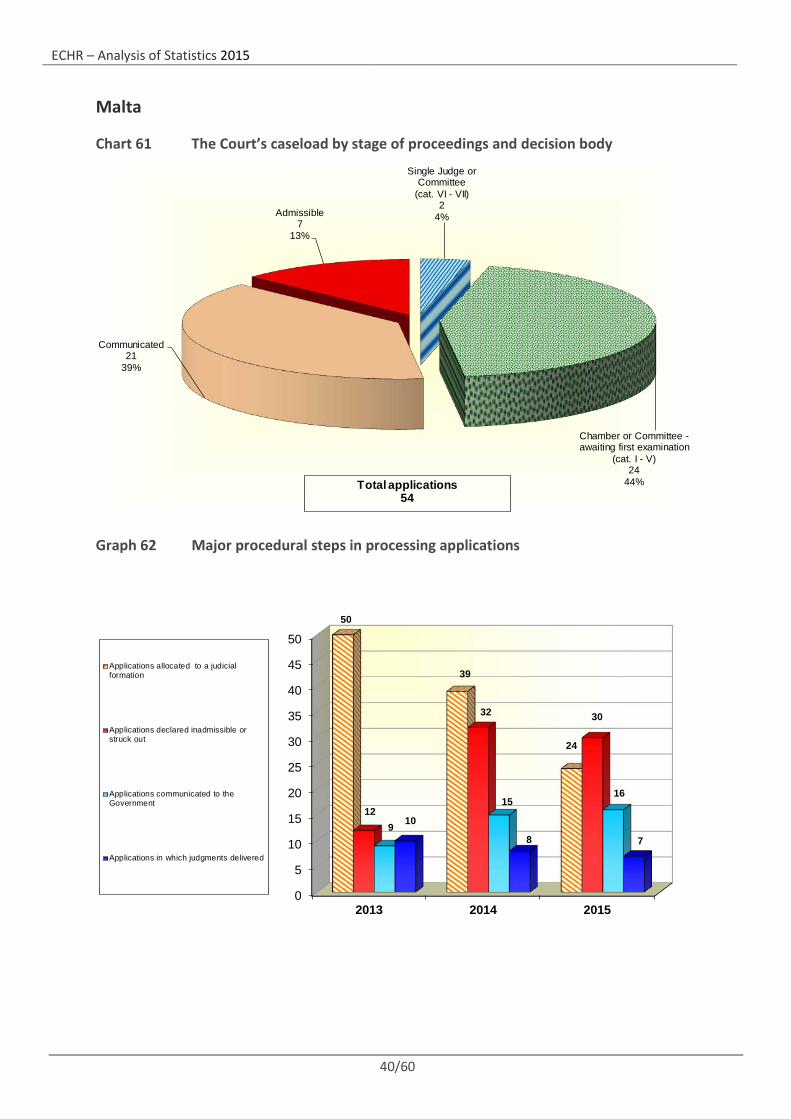
Malta
Chart 61 The Court’s caseload by stage of proceedings and decision body
Graph 62 Major procedural steps in processing applications
Single Judge or Committee
(cat. VI - VII)2
4%
Chamber or Committee -awaiting first examination
(cat. I - V)24
44%
Communicated21
39%
Admissible7
13%
Total applications54
0
5
10
15
20
25
30
35
40
45
50
2013 2014 2015
50
39
24
12
32 30
9
1516
10
8 7
Applications allocated to a judicialformation
Applications declared inadmissible orstruck out
Applications communicated to theGovernment
Applications in which judgments delivered
ECHR – Analysis of Statistics 2015
41/60
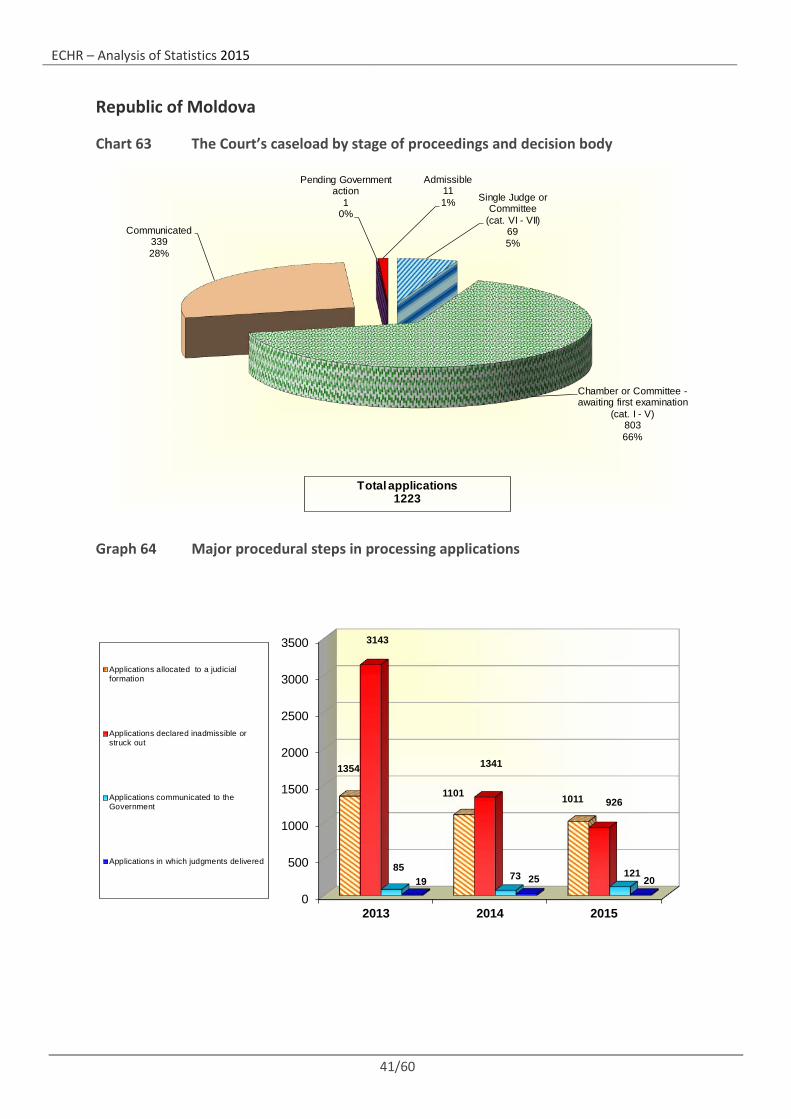
Republic of Moldova
Chart 63 The Court’s caseload by stage of proceedings and decision body
Graph 64 Major procedural steps in processing applications
Single Judge or Committee
(cat. VI - VII)695%
Chamber or Committee -awaiting first examination
(cat. I - V)80366%
Communicated33928%
Pending Government action
10%
Admissible111%
Total applications1223
0
500
1000
1500
2000
2500
3000
3500
2013 2014 2015
1354
1101 1011
3143
1341
926
8573 121
19 25 20
Applications allocated to a judicialformation
Applications declared inadmissible orstruck out
Applications communicated to theGovernment
Applications in which judgments delivered
ECHR – Analysis of Statistics 2015
42/60
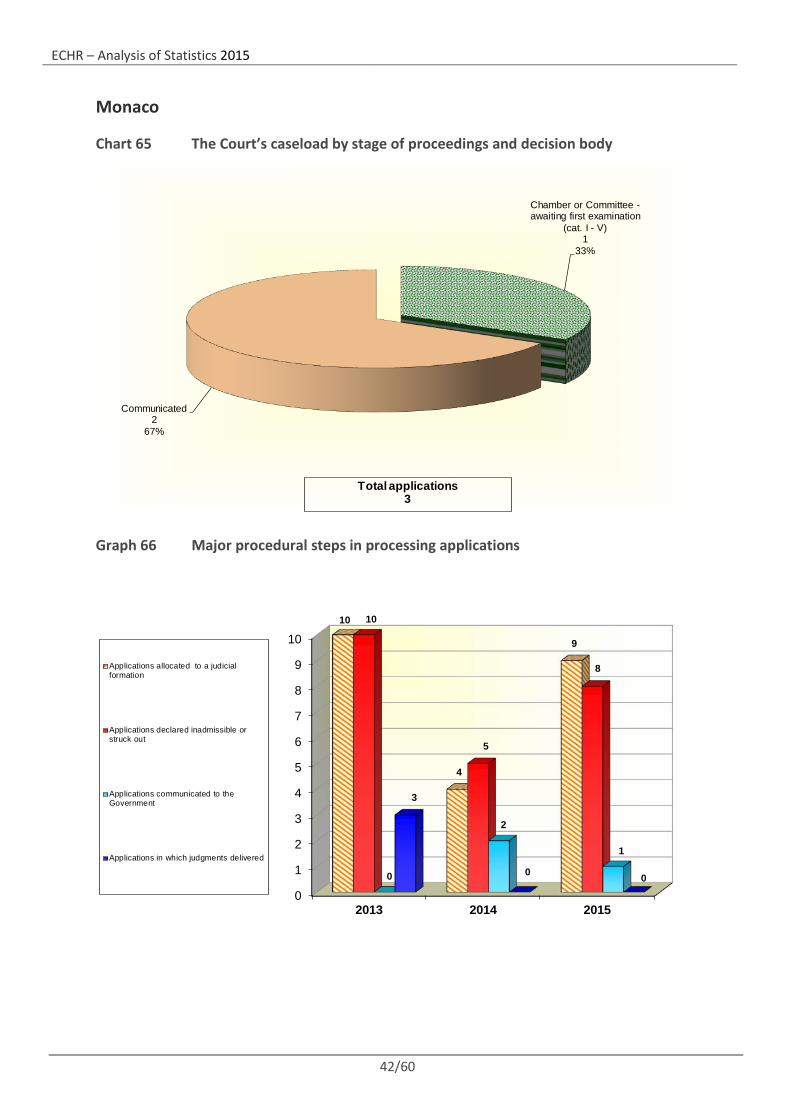
Monaco
Chart 65 The Court’s caseload by stage of proceedings and decision body
Graph 66 Major procedural steps in processing applications
Chamber or Committee -awaiting first examination
(cat. I - V)1
33%
Communicated2
67%
Total applications3
0
1
2
3
4
5
6
7
8
9
10
2013 2014 2015
10
4
9
10
5
8
0
2
1
3
0 0
Applications allocated to a judicialformation
Applications declared inadmissible orstruck out
Applications communicated to theGovernment
Applications in which judgments delivered
ECHR – Analysis of Statistics 2015
43/60
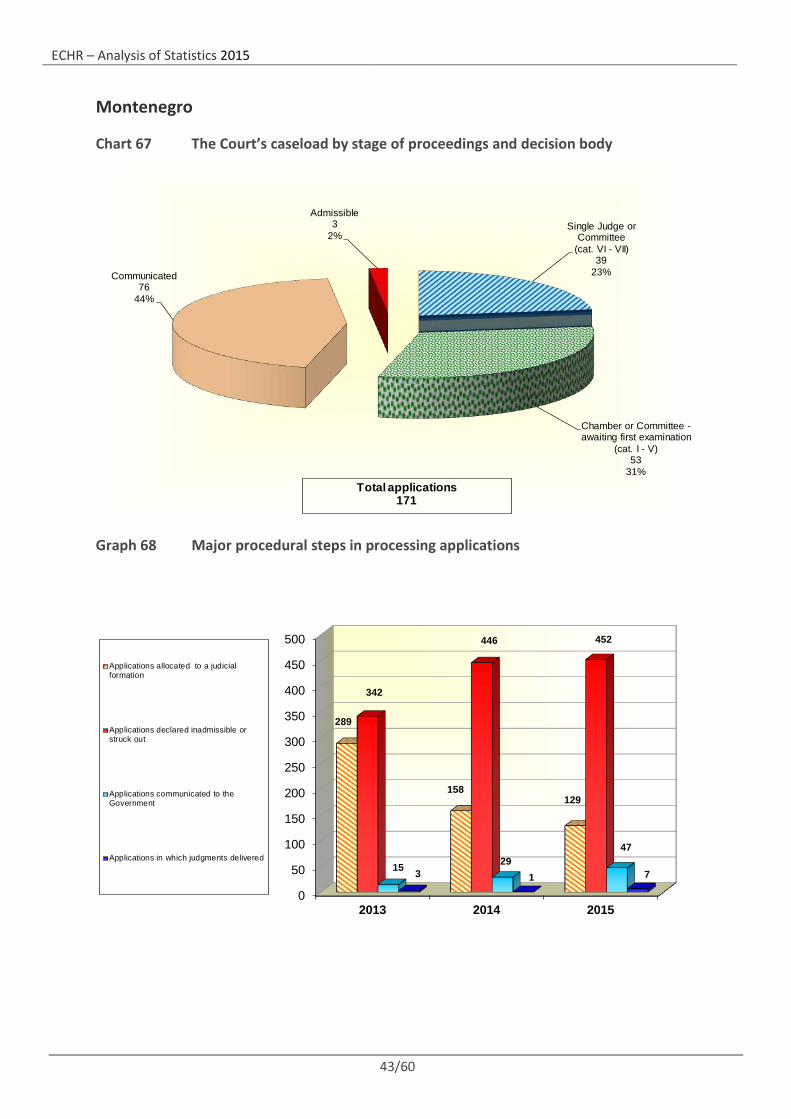
Montenegro
Chart 67 The Court’s caseload by stage of proceedings and decision body
Graph 68 Major procedural steps in processing applications
Single Judge or Committee
(cat. VI - VII)39
23%
Chamber or Committee -awaiting first examination
(cat. I - V)53
31%
Communicated76
44%
Admissible3
2%
Total applications171
0
50
100
150
200
250
300
350
400
450
500
2013 2014 2015
289
158129
342
446 452
15 2947
3 1 7
Applications allocated to a judicialformation
Applications declared inadmissible orstruck out
Applications communicated to theGovernment
Applications in which judgments delivered
ECHR – Analysis of Statistics 2015
44/60
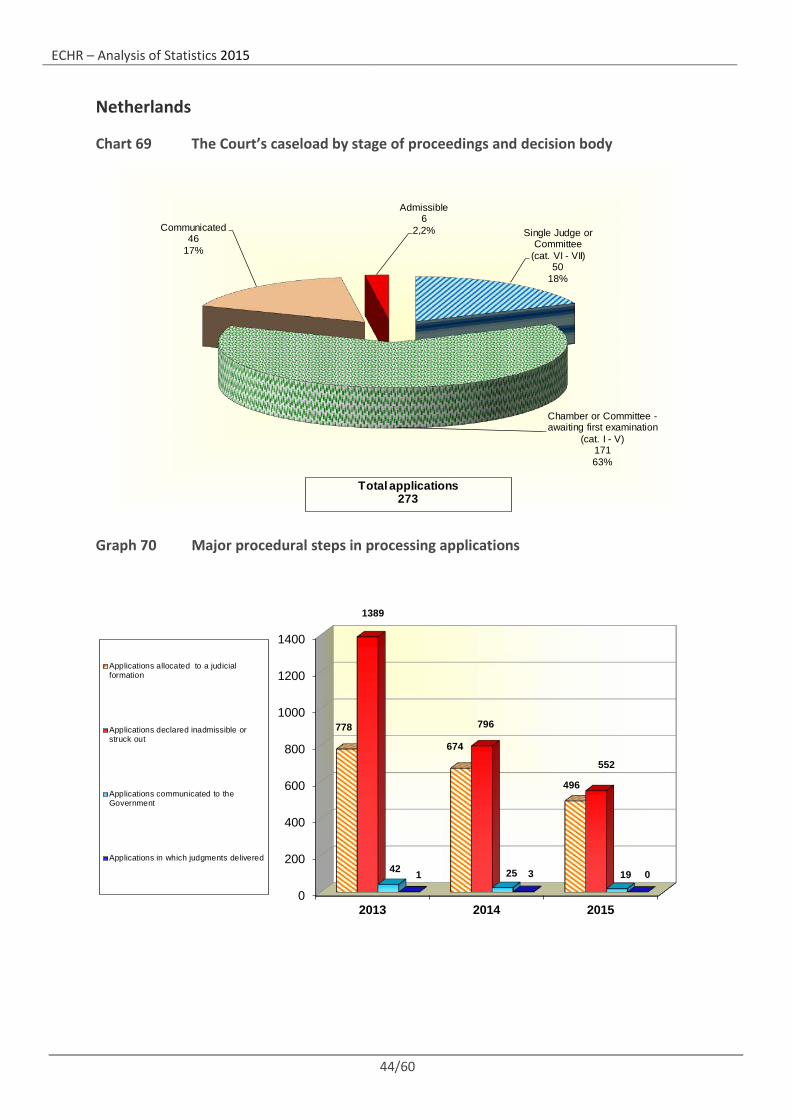
Netherlands
Chart 69 The Court’s caseload by stage of proceedings and decision body
Graph 70 Major procedural steps in processing applications
Single Judge or Committee
(cat. VI - VII)50
18%
Chamber or Committee -awaiting first examination
(cat. I - V)17163%
Communicated46
17%
Admissible6
2,2%
Total applications273
0
200
400
600
800
1000
1200
1400
2013 2014 2015
778
674
496
1389
796
552
42 25 191 3 0
Applications allocated to a judicialformation
Applications declared inadmissible orstruck out
Applications communicated to theGovernment
Applications in which judgments delivered
ECHR – Analysis of Statistics 2015
45/60
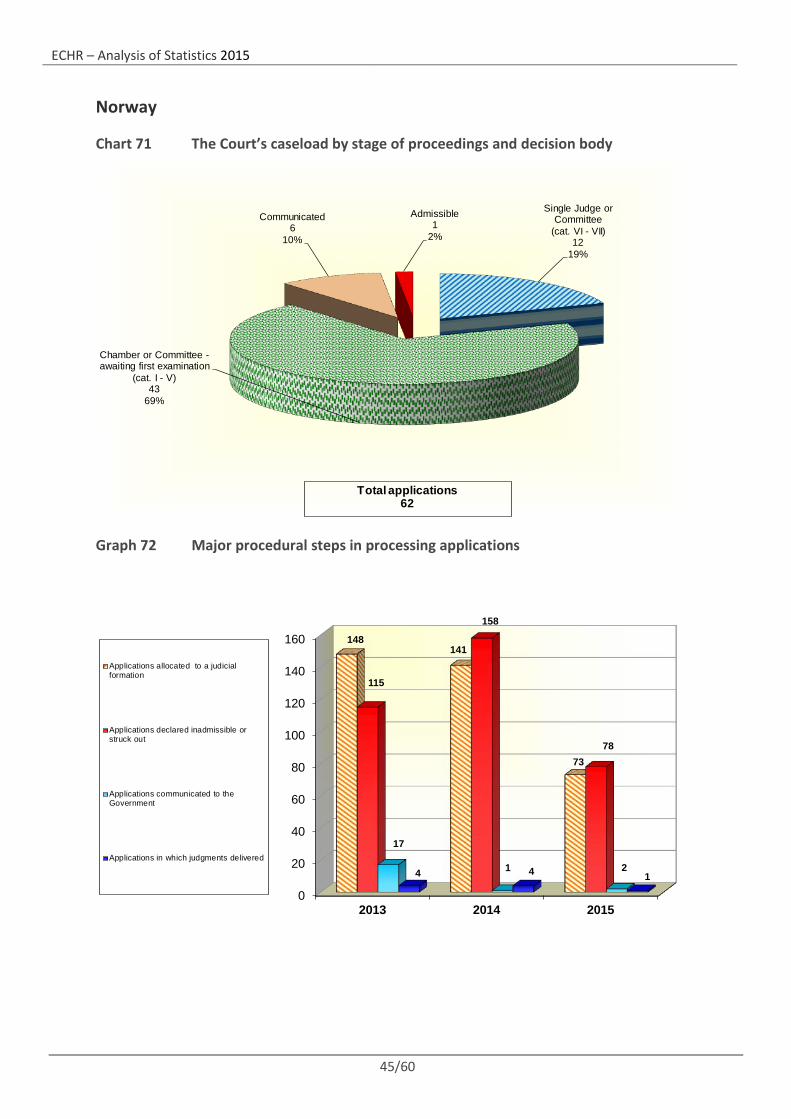
Norway
Chart 71 The Court’s caseload by stage of proceedings and decision body
Graph 72 Major procedural steps in processing applications
Single Judge or Committee
(cat. VI - VII)12
19%
Chamber or Committee -awaiting first examination
(cat. I - V)43
69%
Communicated6
10%
Admissible1
2%
Total applications62
0
20
40
60
80
100
120
140
160
2013 2014 2015
148141
73
115
158
78
17
1 24 4 1
Applications allocated to a judicialformation
Applications declared inadmissible orstruck out
Applications communicated to theGovernment
Applications in which judgments delivered
ECHR – Analysis of Statistics 2015
46/60
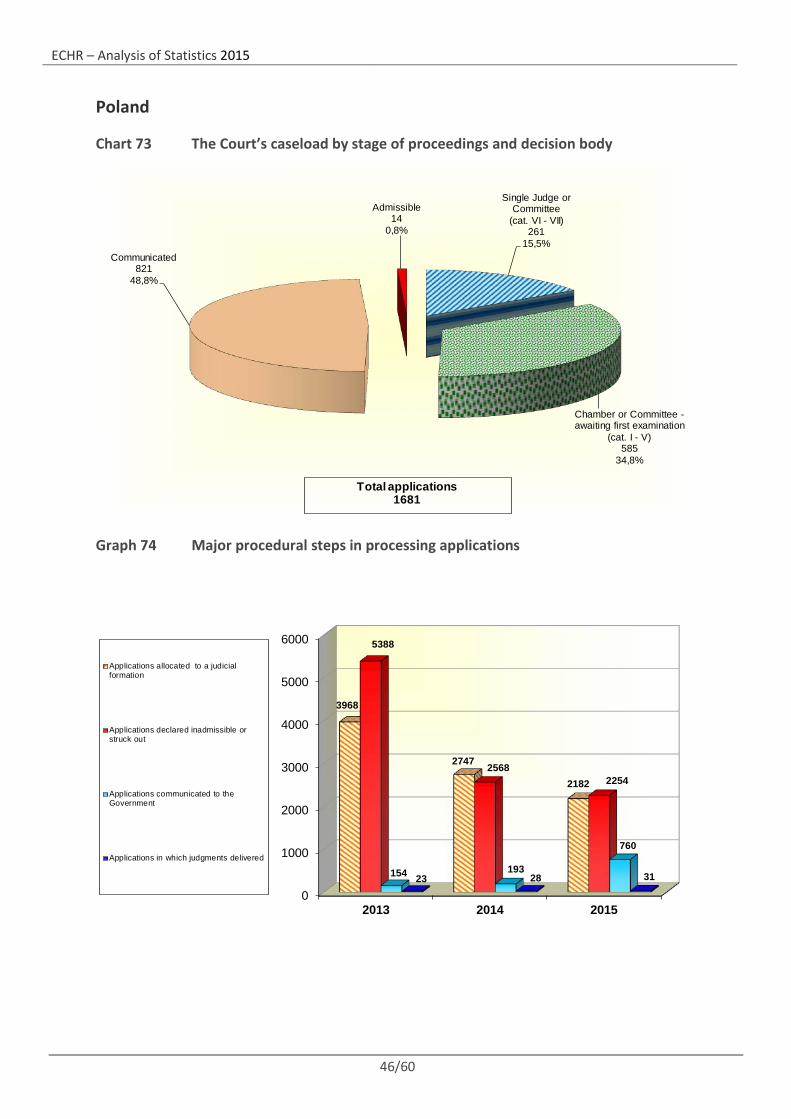
Poland
Chart 73 The Court’s caseload by stage of proceedings and decision body
Graph 74 Major procedural steps in processing applications
Single Judge or Committee
(cat. VI - VII)261
15,5%
Chamber or Committee -awaiting first examination
(cat. I - V)585
34,8%
Communicated821
48,8%
Admissible14
0,8%
Total applications1681
0
1000
2000
3000
4000
5000
6000
2013 2014 2015
3968
2747
2182
5388
25682254
154 193
760
23 28 31
Applications allocated to a judicialformation
Applications declared inadmissible orstruck out
Applications communicated to theGovernment
Applications in which judgments delivered
ECHR – Analysis of Statistics 2015
47/60
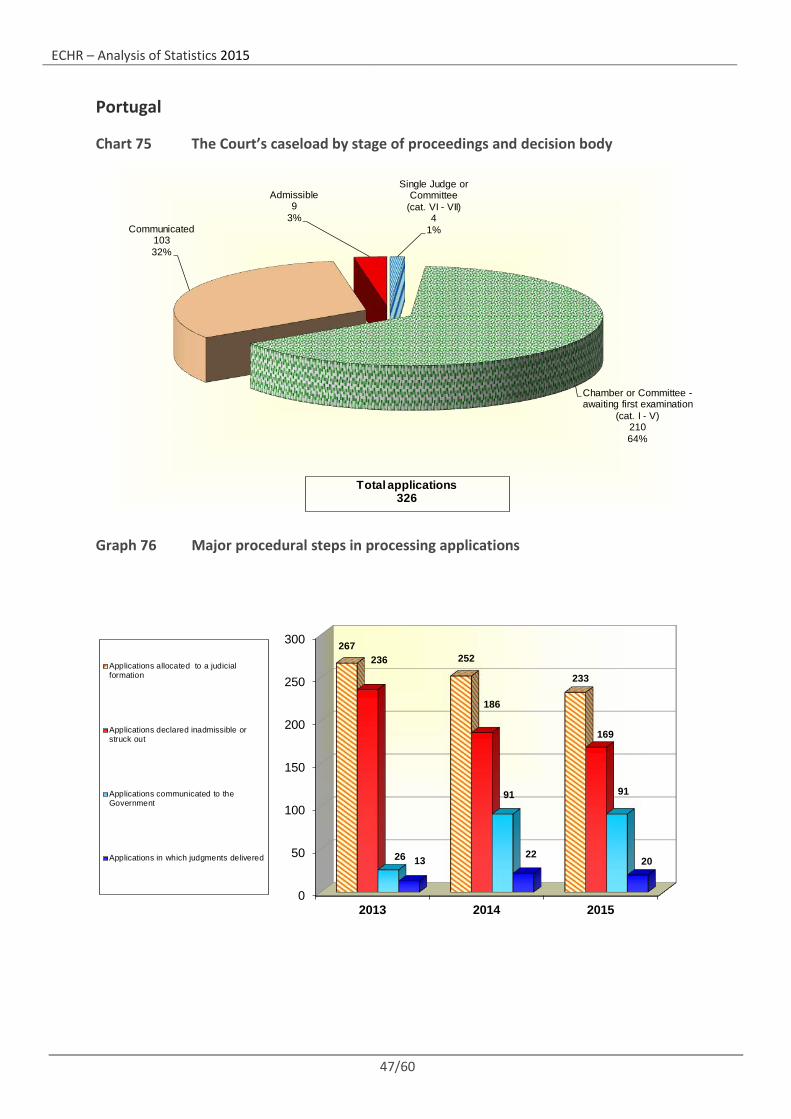
Portugal
Chart 75 The Court’s caseload by stage of proceedings and decision body
Graph 76 Major procedural steps in processing applications
Single Judge or Committee
(cat. VI - VII)4
1%
Chamber or Committee -awaiting first examination
(cat. I - V)21064%
Communicated10332%
Admissible9
3%
Total applications326
0
50
100
150
200
250
300
2013 2014 2015
267252
233
236
186
169
26
91 91
13 2220
Applications allocated to a judicialformation
Applications declared inadmissible orstruck out
Applications communicated to theGovernment
Applications in which judgments delivered
ECHR – Analysis of Statistics 2015
48/60
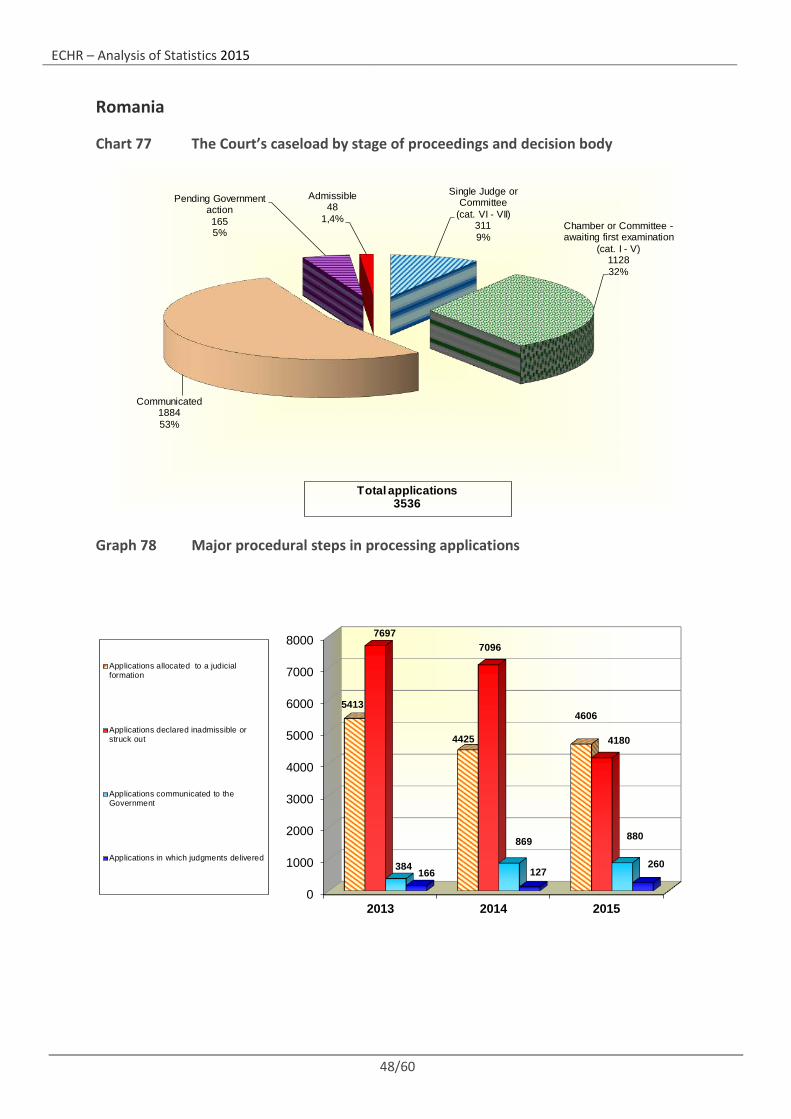
Romania
Chart 77 The Court’s caseload by stage of proceedings and decision body
Graph 78 Major procedural steps in processing applications
Single Judge or Committee
(cat. VI - VII)3119%
Chamber or Committee -awaiting first examination
(cat. I - V)112832%
Communicated188453%
Pending Government action1655%
Admissible48
1,4%
Total applications3536
0
1000
2000
3000
4000
5000
6000
7000
8000
2013 2014 2015
5413
4425
4606
76977096
4180
384
869 880
166 127260
Applications allocated to a judicialformation
Applications declared inadmissible orstruck out
Applications communicated to theGovernment
Applications in which judgments delivered
ECHR – Analysis of Statistics 2015
49/60
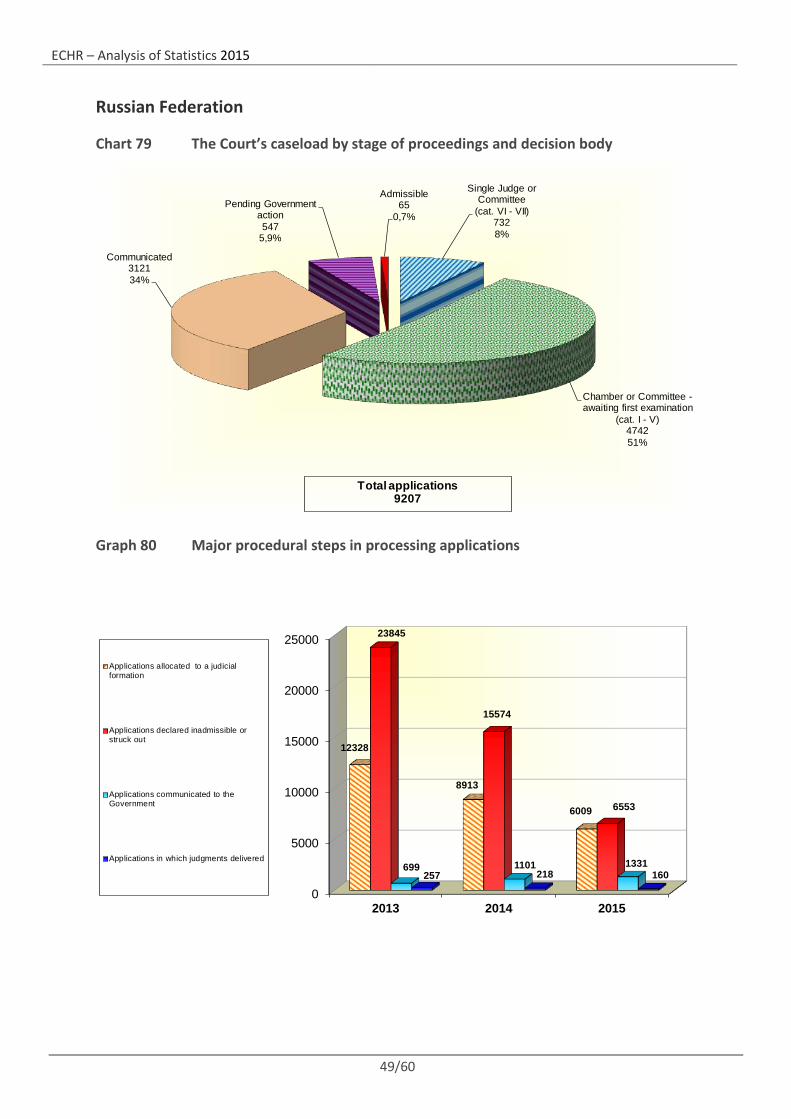
Russian Federation
Chart 79 The Court’s caseload by stage of proceedings and decision body
Graph 80 Major procedural steps in processing applications
Single Judge or Committee
(cat. VI - VII)7328%
Chamber or Committee -awaiting first examination
(cat. I - V)474251%
Communicated312134%
Pending Government action547
5,9%
Admissible65
0,7%
Total applications9207
0
5000
10000
15000
20000
25000
2013 2014 2015
12328
8913
6009
23845
15574
6553
699 1101 1331257 218 160
Applications allocated to a judicialformation
Applications declared inadmissible orstruck out
Applications communicated to theGovernment
Applications in which judgments delivered
ECHR – Analysis of Statistics 2015
50/60
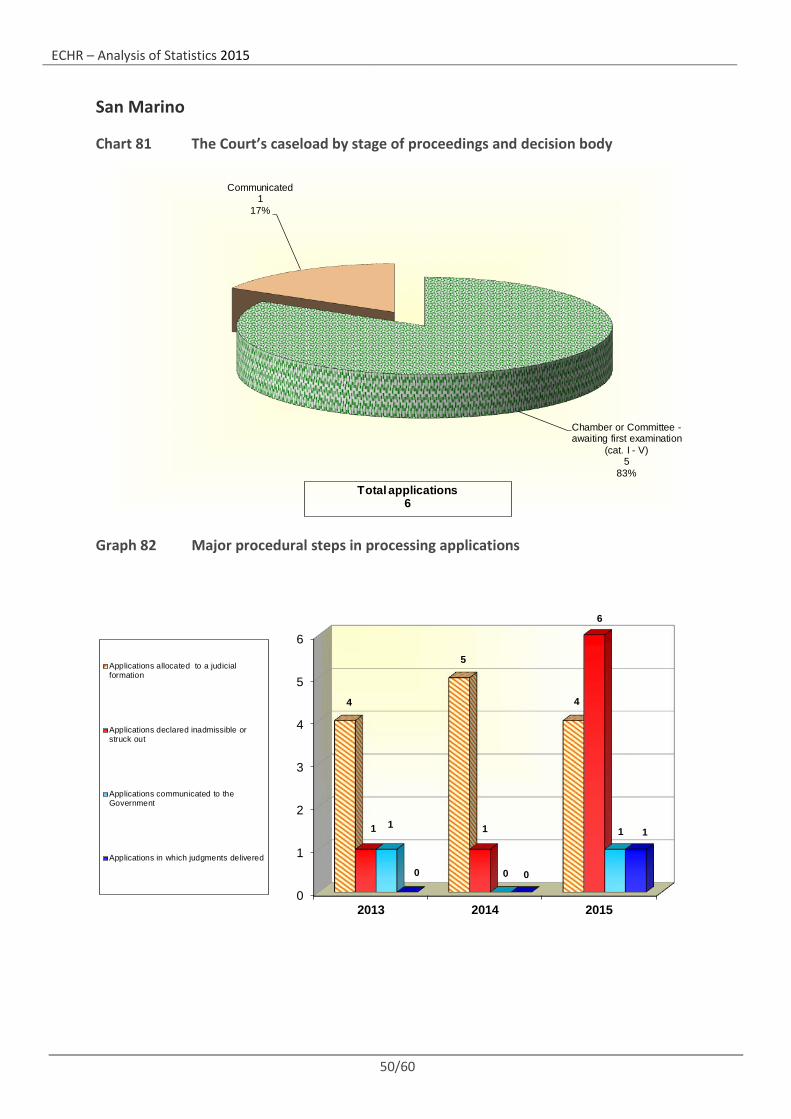
San Marino
Chart 81 The Court’s caseload by stage of proceedings and decision body
Graph 82 Major procedural steps in processing applications
Chamber or Committee -awaiting first examination
(cat. I - V)5
83%
Communicated1
17%
Total applications6
0
1
2
3
4
5
6
2013 2014 2015
4
5
4
1 1
6
1
0
1
0 0
1
Applications allocated to a judicialformation
Applications declared inadmissible orstruck out
Applications communicated to theGovernment
Applications in which judgments delivered
ECHR – Analysis of Statistics 2015
51/60
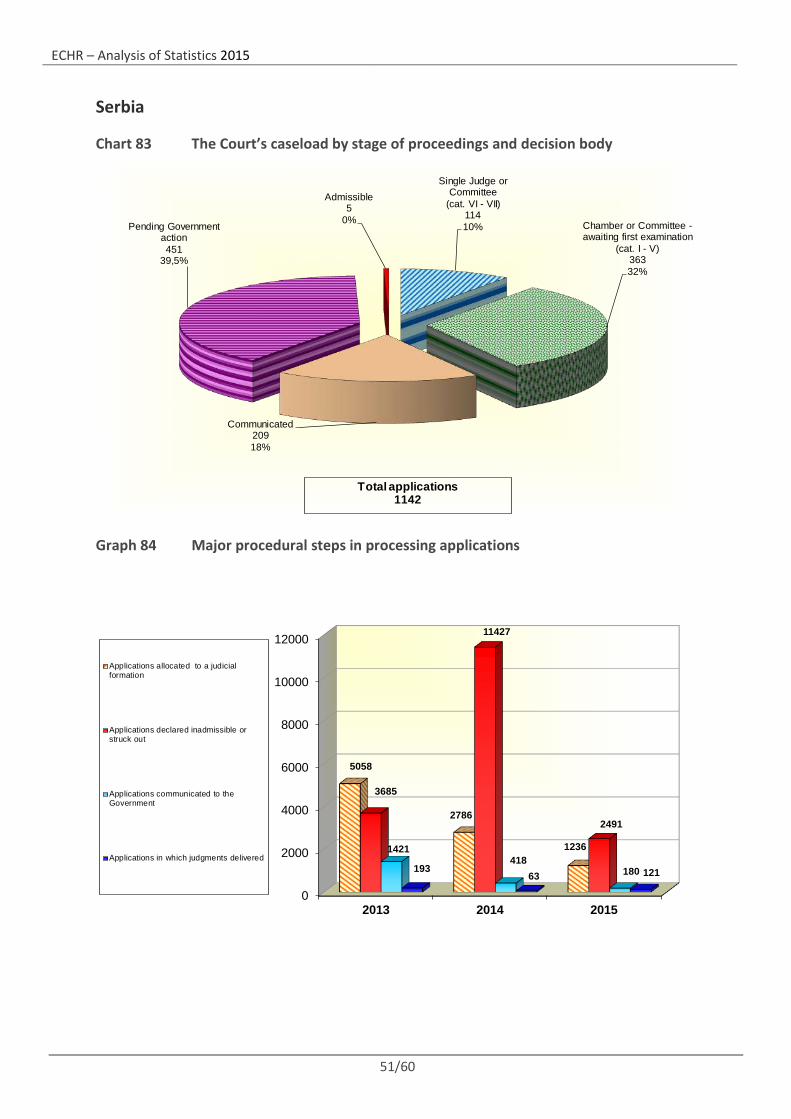
Serbia
Chart 83 The Court’s caseload by stage of proceedings and decision body
Graph 84 Major procedural steps in processing applications
Single Judge or Committee
(cat. VI - VII)11410% Chamber or Committee -
awaiting first examination (cat. I - V)
36332%
Communicated20918%
Pending Government action451
39,5%
Admissible5
0%
Total applications1142
0
2000
4000
6000
8000
10000
12000
2013 2014 2015
5058
2786
1236
3685
11427
2491
1421418
18019363 121
Applications allocated to a judicialformation
Applications declared inadmissible orstruck out
Applications communicated to theGovernment
Applications in which judgments delivered
ECHR – Analysis of Statistics 2015
52/60
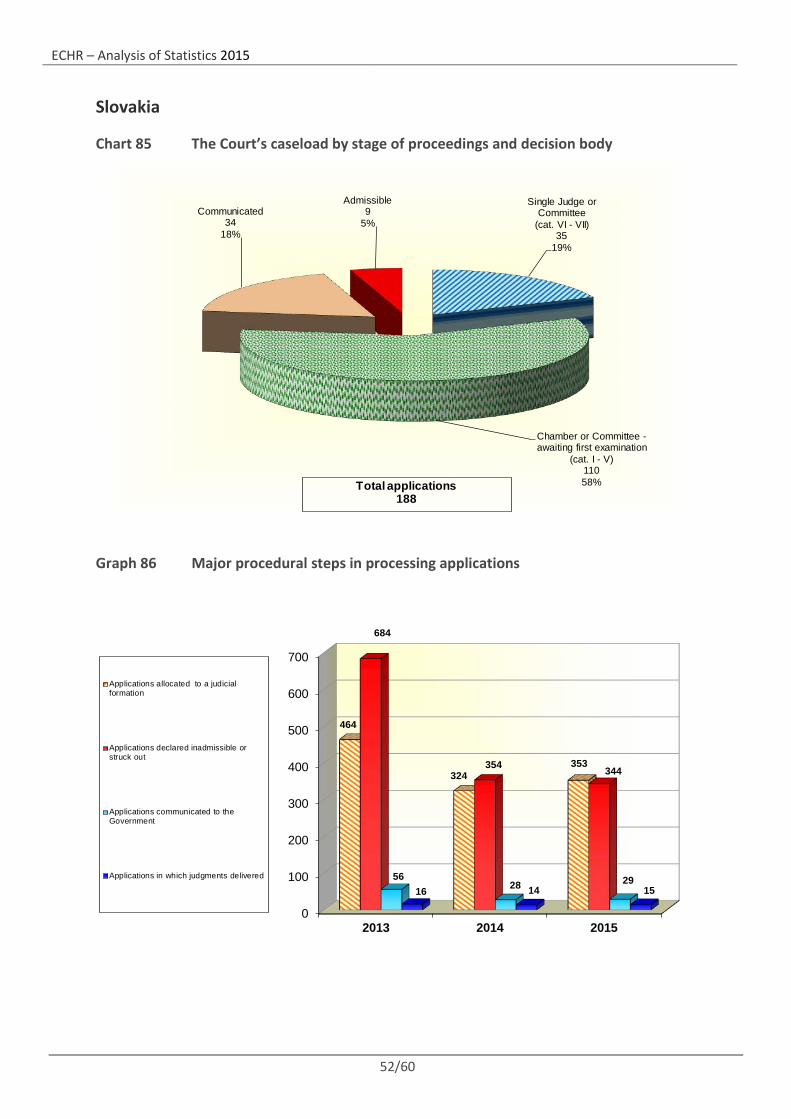
Slovakia
Chart 85 The Court’s caseload by stage of proceedings and decision body
Graph 86 Major procedural steps in processing applications
Single Judge or Committee
(cat. VI - VII)35
19%
Chamber or Committee -awaiting first examination
(cat. I - V)11058%
Communicated34
18%
Admissible9
5%
Total applications188
0
100
200
300
400
500
600
700
2013 2014 2015
464
324353
684
354 344
5628 29
16 14 15
Applications allocated to a judicialformation
Applications declared inadmissible orstruck out
Applications communicated to theGovernment
Applications in which judgments delivered
ECHR – Analysis of Statistics 2015
53/60
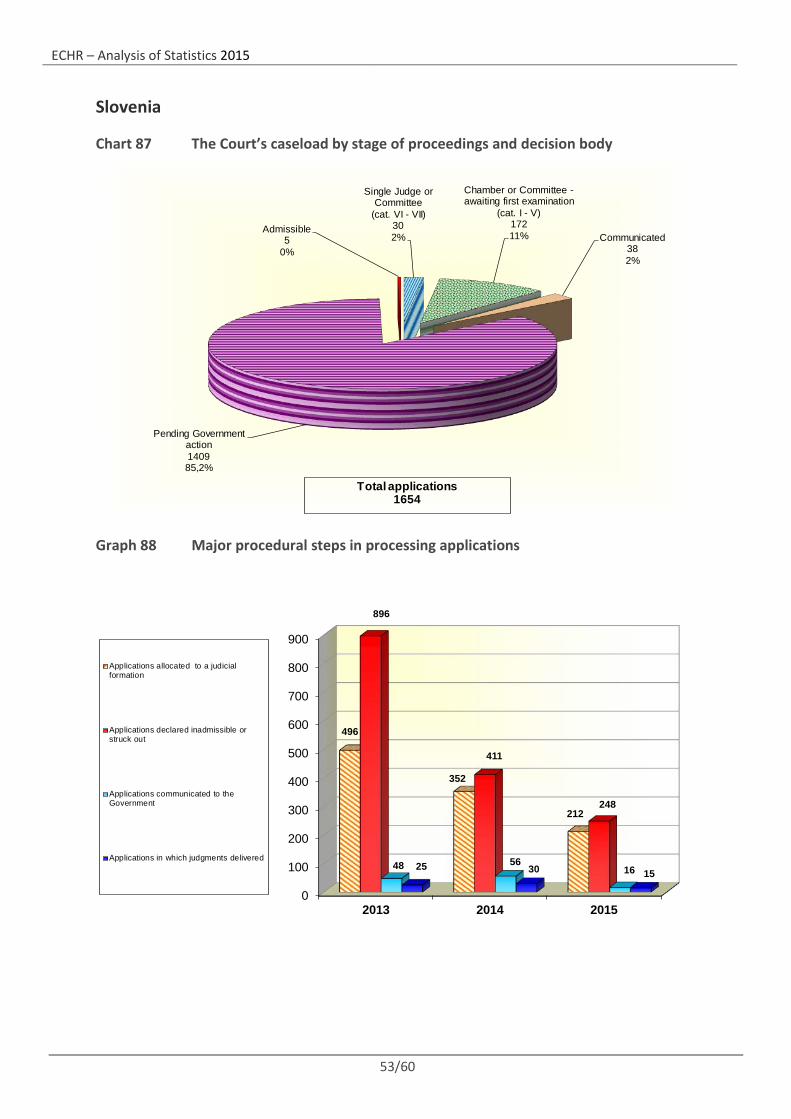
Slovenia
Chart 87 The Court’s caseload by stage of proceedings and decision body
Graph 88 Major procedural steps in processing applications
Single Judge or Committee
(cat. VI - VII)302%
Chamber or Committee -awaiting first examination
(cat. I - V)17211% Communicated
382%
Pending Government action140985,2%
Admissible5
0%
Total applications1654
0
100
200
300
400
500
600
700
800
900
2013 2014 2015
496
352
212
896
411
248
48 561625 30 15
Applications allocated to a judicialformation
Applications declared inadmissible orstruck out
Applications communicated to theGovernment
Applications in which judgments delivered
ECHR – Analysis of Statistics 2015
54/60
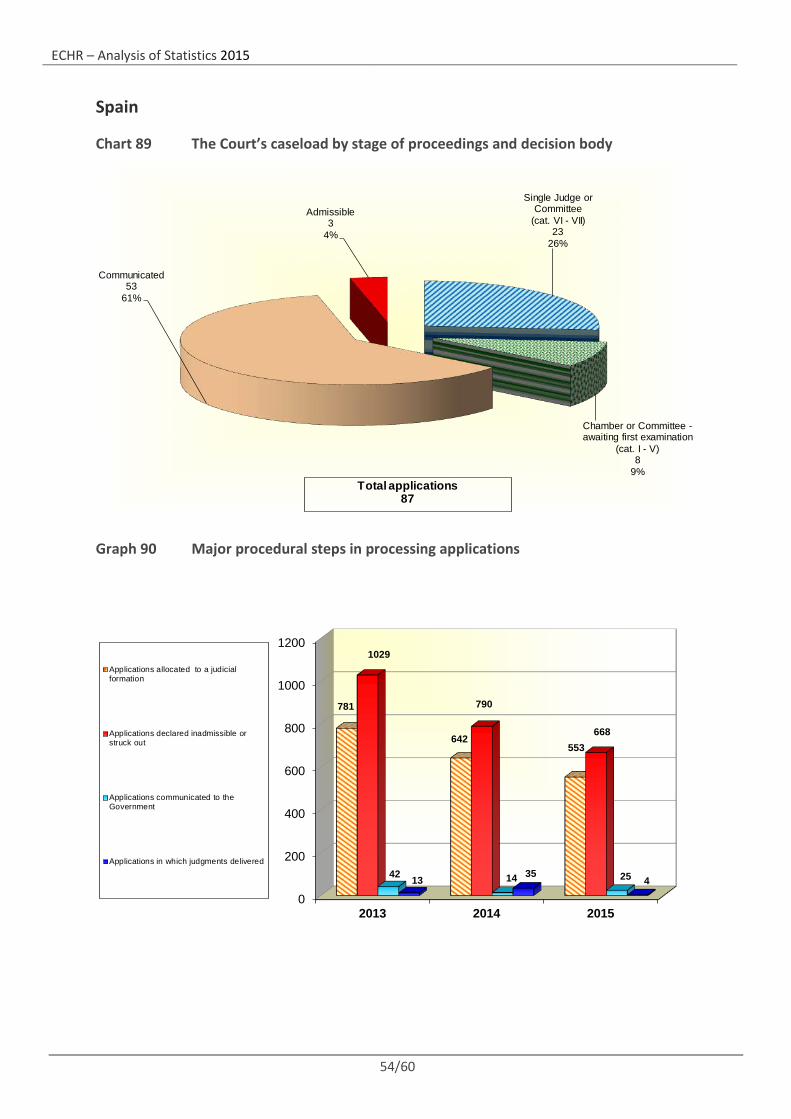
Spain
Chart 89 The Court’s caseload by stage of proceedings and decision body
Graph 90 Major procedural steps in processing applications
Single Judge or Committee
(cat. VI - VII)23
26%
Chamber or Committee -awaiting first examination
(cat. I - V)8
9%
Communicated53
61%
Admissible3
4%
Total applications87
0
200
400
600
800
1000
1200
2013 2014 2015
781
642553
1029
790
668
42 14 2513 354
Applications allocated to a judicialformation
Applications declared inadmissible orstruck out
Applications communicated to theGovernment
Applications in which judgments delivered
ECHR – Analysis of Statistics 2015
55/60
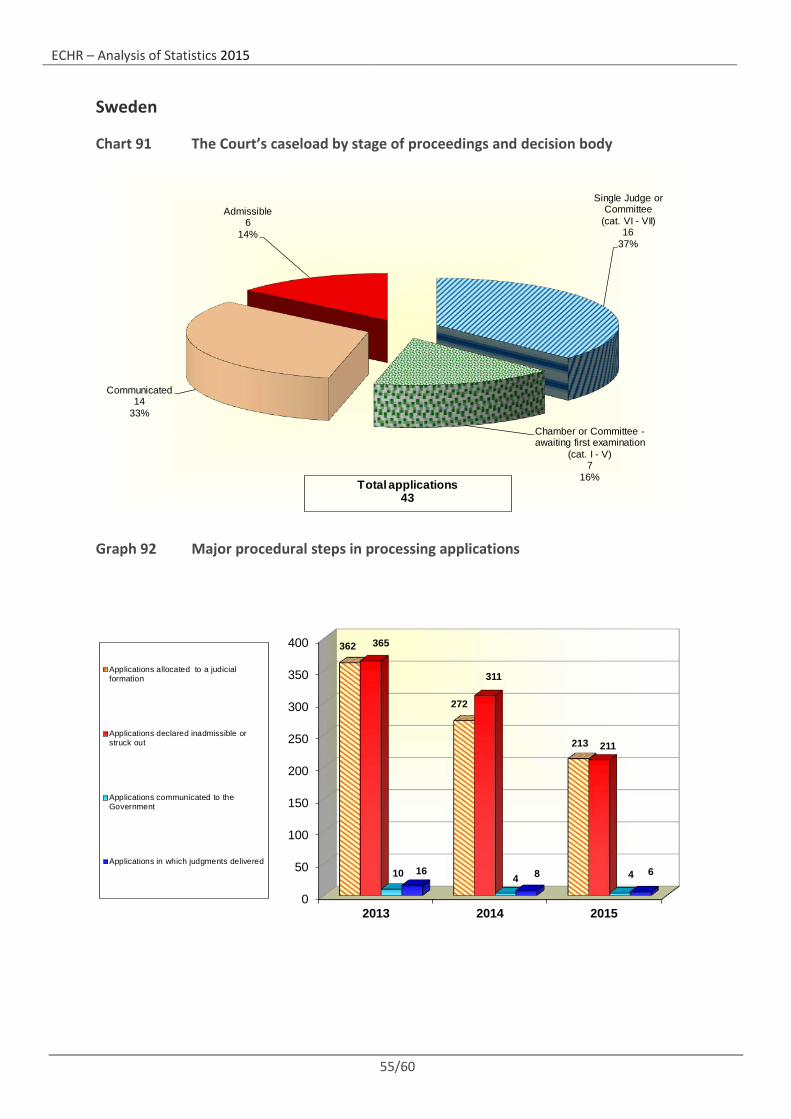
Sweden
Chart 91 The Court’s caseload by stage of proceedings and decision body
Graph 92 Major procedural steps in processing applications
Single Judge or Committee
(cat. VI - VII)16
37%
Chamber or Committee -awaiting first examination
(cat. I - V)7
16%
Communicated14
33%
Admissible6
14%
Total applications43
0
50
100
150
200
250
300
350
400
2013 2014 2015
362
272
213
365
311
211
10 4 416 8 6
Applications allocated to a judicialformation
Applications declared inadmissible orstruck out
Applications communicated to theGovernment
Applications in which judgments delivered
ECHR – Analysis of Statistics 2015
56/60
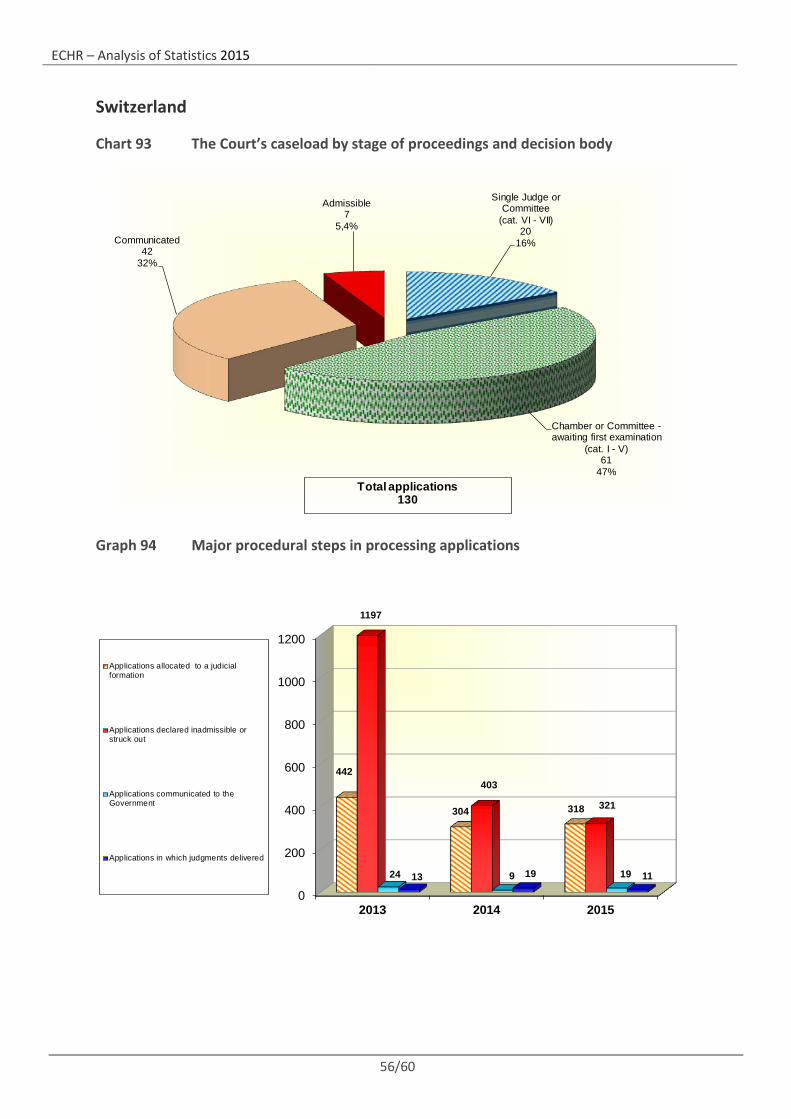
Switzerland
Chart 93 The Court’s caseload by stage of proceedings and decision body
Graph 94 Major procedural steps in processing applications
Single Judge or Committee
(cat. VI - VII)20
16%
Chamber or Committee -awaiting first examination
(cat. I - V)61
47%
Communicated42
32%
Admissible7
5,4%
Total applications130
0
200
400
600
800
1000
1200
2013 2014 2015
442
304 318
1197
403
321
24 9 1913 19 11
Applications allocated to a judicialformation
Applications declared inadmissible orstruck out
Applications communicated to theGovernment
Applications in which judgments delivered
ECHR – Analysis of Statistics 2015
57/60
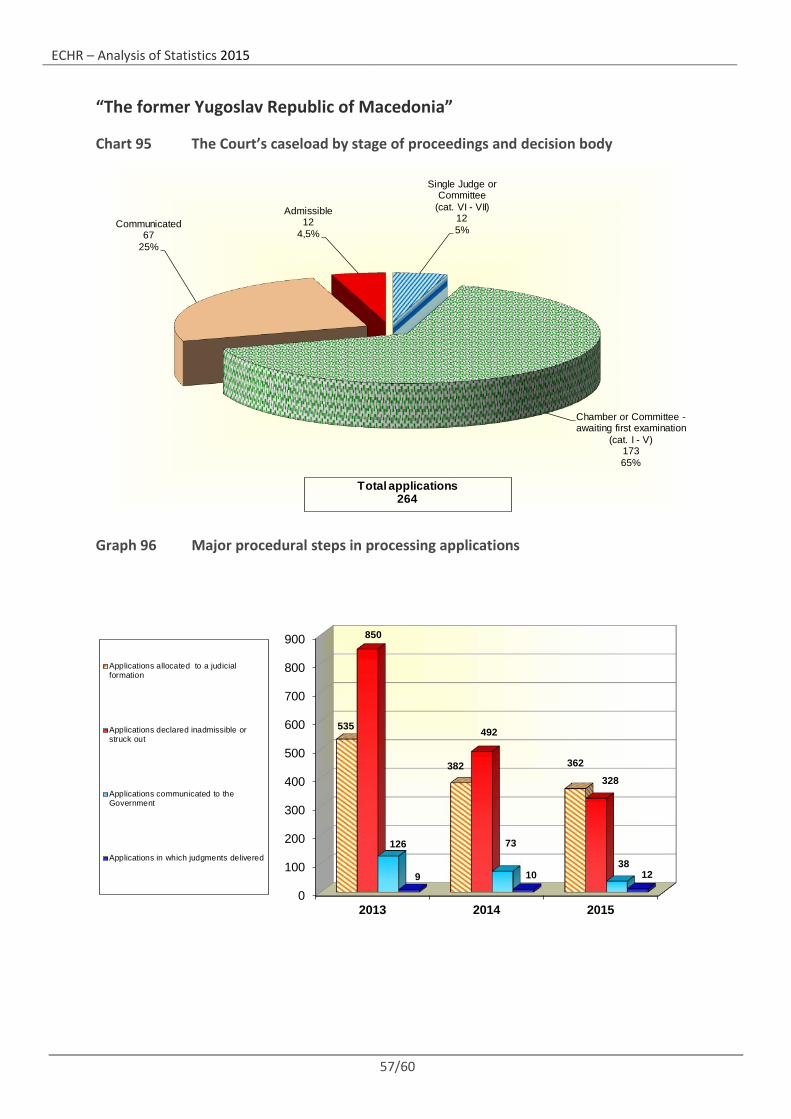
“The former Yugoslav Republic of Macedonia”
Chart 95 The Court’s caseload by stage of proceedings and decision body
Graph 96 Major procedural steps in processing applications
Single Judge or Committee
(cat. VI - VII)125%
Chamber or Committee -awaiting first examination
(cat. I - V)17365%
Communicated67
25%
Admissible12
4,5%
Total applications264
0
100
200
300
400
500
600
700
800
900
2013 2014 2015
535
382 362
850
492
328
126 73
389 10 12
Applications allocated to a judicialformation
Applications declared inadmissible orstruck out
Applications communicated to theGovernment
Applications in which judgments delivered
ECHR – Analysis of Statistics 2015
58/60
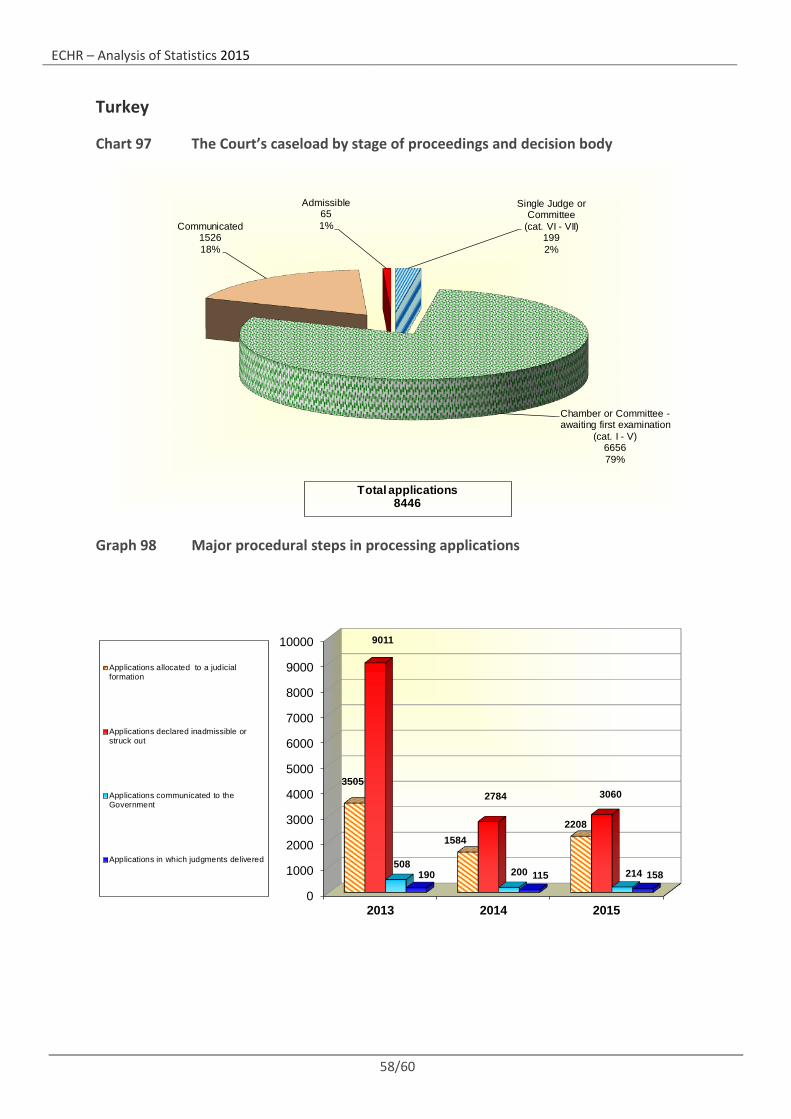
Turkey
Chart 97 The Court’s caseload by stage of proceedings and decision body
Graph 98 Major procedural steps in processing applications
Single Judge or Committee
(cat. VI - VII)1992%
Chamber or Committee -awaiting first examination
(cat. I - V)665679%
Communicated152618%
Admissible651%
Total applications8446
0
1000
2000
3000
4000
5000
6000
7000
8000
9000
10000
2013 2014 2015
3505
15842208
9011
2784 3060
508200 214190 115 158
Applications allocated to a judicialformation
Applications declared inadmissible orstruck out
Applications communicated to theGovernment
Applications in which judgments delivered
ECHR – Analysis of Statistics 2015
59/60
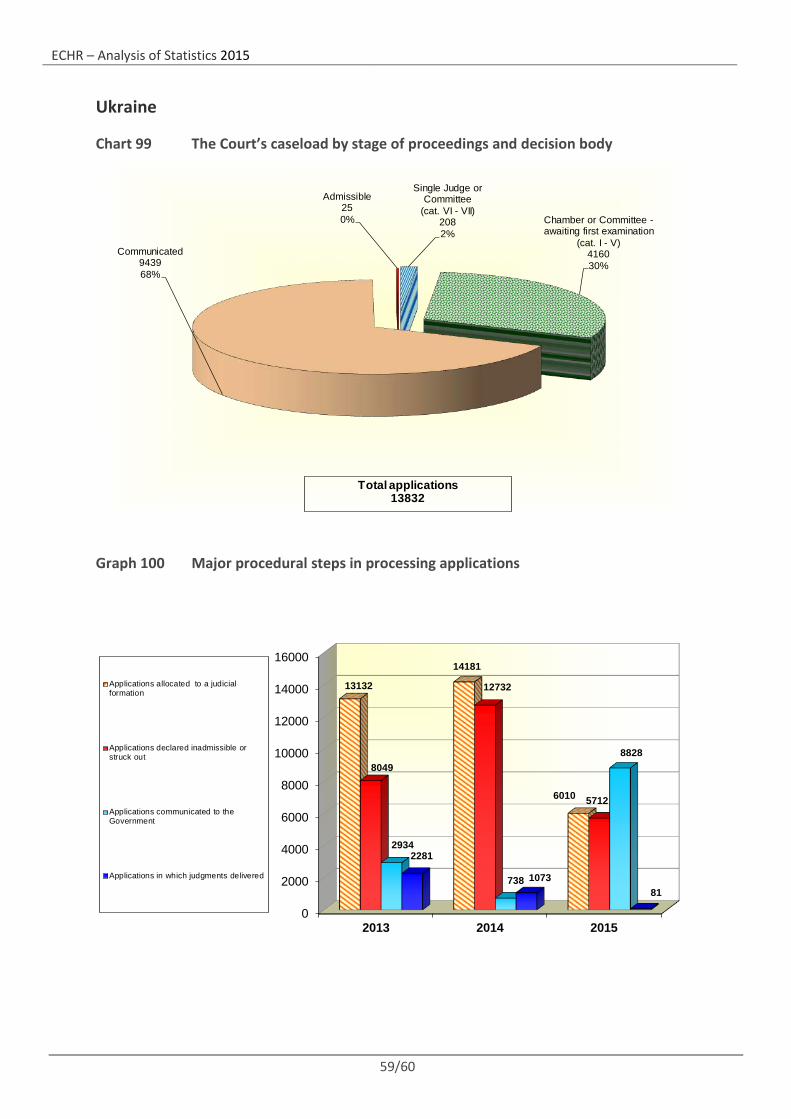
Ukraine
Chart 99 The Court’s caseload by stage of proceedings and decision body
Graph 100 Major procedural steps in processing applications
Single Judge or Committee
(cat. VI - VII)2082%
Chamber or Committee -awaiting first examination
(cat. I - V)416030%
Communicated943968%
Admissible250%
Total applications13832
0
2000
4000
6000
8000
10000
12000
14000
16000
2013 2014 2015
13132
14181
6010
8049
12732
5712
2934
738
8828
2281
107381
Applications allocated to a judicialformation
Applications declared inadmissible orstruck out
Applications communicated to theGovernment
Applications in which judgments delivered
ECHR – Analysis of Statistics 2015
60/60
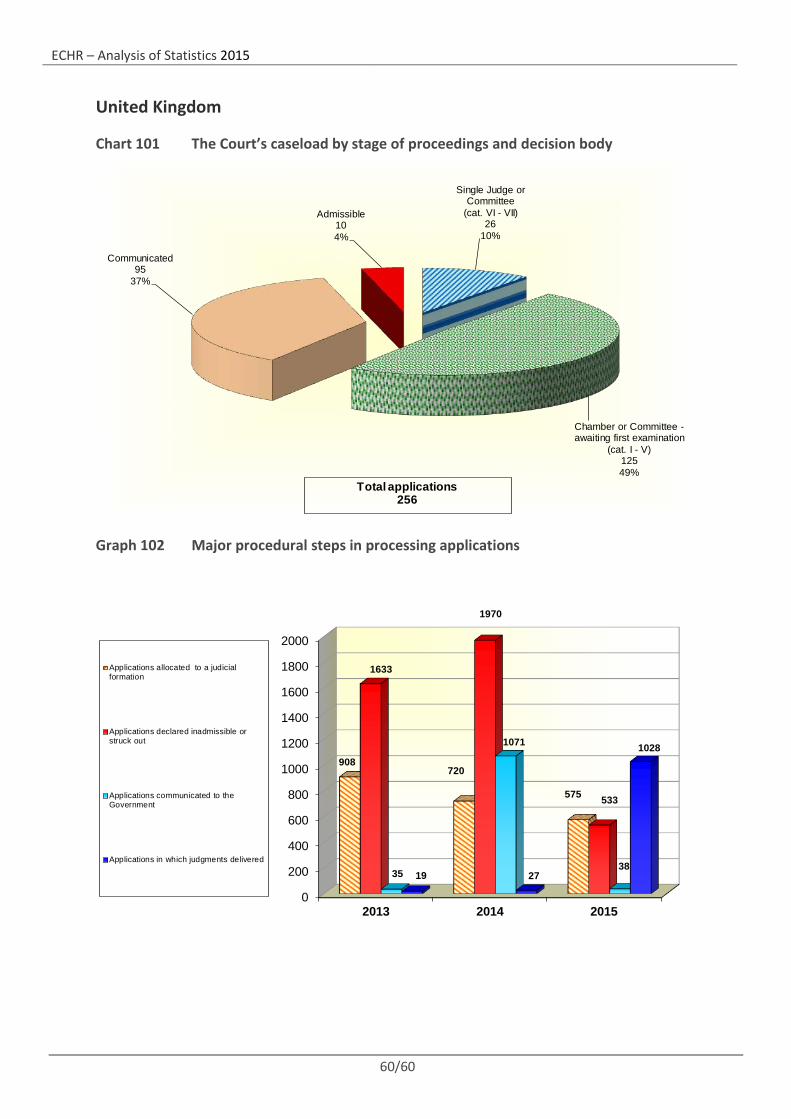
United Kingdom
Chart 101 The Court’s caseload by stage of proceedings and decision body
Graph 102 Major procedural steps in processing applications
Single Judge or Committee
(cat. VI - VII)26
10%
Chamber or Committee -awaiting first examination
(cat. I - V)12549%
Communicated95
37%
Admissible104%
Total applications256
0
200
400
600
800
1000
1200
1400
1600
1800
2000
2013 2014 2015
908720
575
1633
1970
533
35
1071
3819 27
1028
Applications allocated to a judicialformation
Applications declared inadmissible orstruck out
Applications communicated to theGovernment
Applications in which judgments delivered


![Roma and Travellers - echr.coe.int · Factsheet – Roma and Travellers February 2018 . This factsheet does not bind the Court and is not exhaustive . Roma and Travellers “[A]s](https://img.pdfslide.us/doc/110x75/5adac6db7f8b9a6d318d3e06/roma-and-travellers-echrcoeint-roma-and-travellers-february-2018-this.jpg)