Embed Size (px)
Citation preview
ANALYSIS OF SOCIO-ECONOMIC FACTORS THAT AFFECT
AGROFORESTRY ADOPTION AMONG SMALLHOLDERS IN TEMIYOTTA
LOCATION, NAKURU COUNTY
BY
NYAMWEYA JOSEPH MAKORI
C50/63078/2010
RESEARCH PROJECT SUBMITTED IN PARTIAL FULFILMENT FOR THE
AWARD OF A MASTERS DEGREE IN ENVIRONMENTAL PLANNING AND
MANAGEMENT IN THE FACULTY OF ARTS, DEPARTMENT OF
GEOGRAPHY AND ENVIRONMENTAL STUDIES, UNIVERSITY OF NAIROBI
NOVEMBER, 2017

ii
DECLARATION
I hereby declare that this is my own original work and has not been submitted for
examination at any other institution.
Signature: …………………….………… Date: …………………………..
Nyamweya Joseph Makori
(Reg No: C50/63078/2010)
This project paper has been submitted with our approval as the university supervisors:
Dr. Margaret Kirimi.
Department of Geography and Environmental Studies.
University of Nairobi.
Signature: …………………….………… Date: …………………….…….
Dr. James Moronge.
Department of Geography and Environmental Studies.
University of Nairobi.
Signature: ……………………………….. Date:……………………………..

iii
DEDICATION
I dedicate this project to my Wife, Lizzy Kerubo and my children (Akeelah Josephs and
Nyamweya Joseph Junior) also to my parents Mr. and Mrs. William Makori Nyagara,
Sister Josepha Otwori, my siblings: Paul, Hassan, Timothy, Francis and Joan. Lastly but
not least I dedicate it to Dennis Miranyi and family.

iv
ACKNOWLEDGEMENT
I am thankful to all colleagues and friends who supported me through this research
project. I owe my sincere gratitude to all individuals who assisted and supported me
directly or indirectly during the entire period I worked in this research including my dear,
wife and children, parents, brothers and sisters.
Secondly, I am very grateful to my supervisors Dr. Margaret Kirimi, and Dr. James
Moronge for their invaluable input, support, patience, encouragement, and guidance in
conducting, presenting and successfully completing my research work. Thank you for
taking your time throughout whenever I needed your support. You were available, ready
to listen, guide and provide me with a limelight from the onset of this research till
completion. I also extend my gratitude to the entire Geography Department for providing
a conducive environment with adequate resources from which I got reference materials
which were vital in making this research a success from the start to the end.
Lastly but not least I am thankful to the Almighty God for giving me good health, sound
mind, strength, blessings and an insight to pursue and complete the Master Degree.
Finally to all that I may not have specifically mentioned but contributed their resources in
different forms to make this research a success, Thank you.
v
TABLE OF CONTENTS
DECLARATION............................................................................................................... ii
DEDICATION.................................................................................................................. iii
ACKNOWLEDGEMENT ............................................................................................... iv
TABLE OF CONTENTS ..................................................................................................v
LIST OF TABLES ........................................................................................................... ix
LIST OF FIGURES ...........................................................................................................x
LIST OF MAPS AND PLATES ..................................................................................... xi
LIST OF ACRONYMS AND ABBREVIATIONS ...................................................... xii
ABSTRACT .................................................................................................................... xiii
CHAPTER ONE: INTRODUCTION ..............................................................................1
1.1 Study Background ..........................................................................................................1
1.2 Statement Problem .........................................................................................................4
1.3 Research Questions ........................................................................................................5
1.4 Project Objectives ..........................................................................................................5
1.4.1 General Objective ................................................................................................... 5
1.4.2 Specific Objectives ................................................................................................. 5
1.5 Research Hypotheses .....................................................................................................6
1.6 Justification ....................................................................................................................6
1.7 Scope and limitations of the Study ................................................................................6
1.8 Definition of Terms........................................................................................................7
CHAPTER TWO: LITERATURE REVIEW .................................................................8
2.1 Introduction ....................................................................................................................8
2.2.2 Education Level.................................................................................................... 10
2.2.3 Household Size ..................................................................................................... 12
2.2.4 Income .................................................................................................................. 13
2.3 Theoretical Framework ................................................................................................14
2.3.1 Adoption Behavior Model .................................................................................... 14
2.4 Conceptual Framework ................................................................................................16
vi
2.4 Conceptual Framework ................................................................................................18
CHAPTER THREE: STUDY AREA AND RESEARCH METHODOLOGY ..........19
3.1 Study Area ...................................................................................................................19
3.1.1 Introduction ............................................................................................................19
3.1.2 Location of Temiyotta .......................................................................................... 20
3.2 Physiography and Natural Conditions .........................................................................21
3.2.1 Geomorphologic Features .................................................................................... 21
3.2.2 Climate ................................................................................................................. 21
3.3 Demographic Characteristics of the Location ..............................................................21
3.3.1 Population Distribution ........................................................................................ 21
3.3.2 Education in the Location .................................................................................... 22
3.3.3 Income in the Location ......................................................................................... 22
3.4 Land Use in the Location .............................................................................................23
3.4.1 Agriculture ........................................................................................................... 23
3.4.2 Vegetation Cover.................................................................................................. 23
3.5 Introduction ..................................................................................................................24
3.6 Study Design ................................................................................................................24
3.7 Data Types and Sources ...............................................................................................24
3.8 Target Population and Sampling Frame ......................................................................24
3.9 Sampling Procedure and Sample selection ..................................................................25
3.10 Data Collection Instruments ......................................................................................27
3.11 Data Processing and Analyzes ...................................................................................28
CHAPTER FOUR: RESULTS AND DISCUSSION ....................................................29
4.1 Introduction ..................................................................................................................29
4.2 Questionnaire Response Rate ......................................................................................29
4.3 Social and Economic Characteristic ............................................................................29
4.4 Information on Head of Household .............................................................................30
4.5 Farm Size .....................................................................................................................31
4.5.1 Relationship between Size of Farm and Agroforestry ......................................... 31
vii
4.5.3 Main Type of Crop Cultivated ............................................................................. 33
4.5.4 Influence of Farm Size on Decision Making ....................................................... 34
4.6 Education Level ...........................................................................................................36
4.6.1 Educational Level of the Household Head ........................................................... 36
4.6.2 Establishing the Relationship between Household Head’s Level of Education and
Agroforestry Adoption ......................................................................................... 37
4.6.3 Total Annual Income ........................................................................................... 39
4.6.4 Establishing Relationship between Household Income and Agroforestry Adoption
....................................................................................................................................... 41
4.7 Household Size ............................................................................................................43
4.7.1 Respondent’s Household Size .............................................................................. 43
4.7.2 Effect of Household Size on Agroforestry Adoption ........................................... 45
4.7.3 Establishing Relationship between Household Size and Agroforestry Adoption 45
4.8 Types of Agroforestry Practiced ..................................................................................47
4.8.1 Source of Smallholders’ Tree Seedlings .............................................................. 47
4.8.2 Nature of Planting Trees ...................................................................................... 48
4.9 Benefits of Planted Trees .............................................................................................52
4.10 Discussion of the Findings .........................................................................................53
CHAPTER FIVE: SUMMARY OF FINDINGS, CONCLUSIONS AND
RECOMMENDATIONS .................................................................................................56
5.1 Introduction ..................................................................................................................56
5.2 Summary of Findings ...................................................................................................56
5.3 Conclusion ...................................................................................................................57
5.4 Recommendations ........................................................................................................58
5.5 Suggestions for further Research .................................................................................59
REFERENCES .................................................................................................................60
APPENDICES ..................................................................................................................66
Appendix I: Questionnaire .................................................................................................66
Appendix II: Key Informant Interview Guide ...................................................................70

viii
Appendix III: Focus Group Discussions ............................................................................71
Appendix V: Research Authorization ................................................................................73
ix
LIST OF TABLES
Table 3.1: Population by Administrative Location Unit ....................................................22
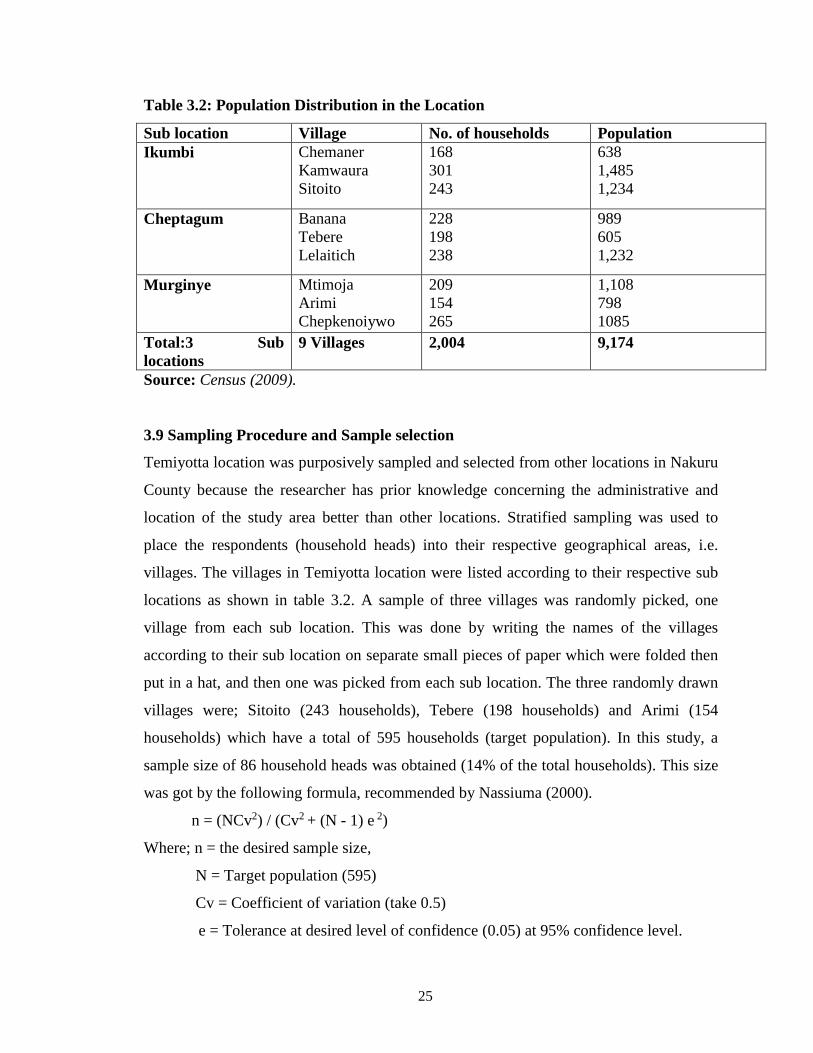
Table 3.2: Population Distribution in the Location ...........................................................25
Table 3.3: Sample Size and Sampling of the Households .................................................26
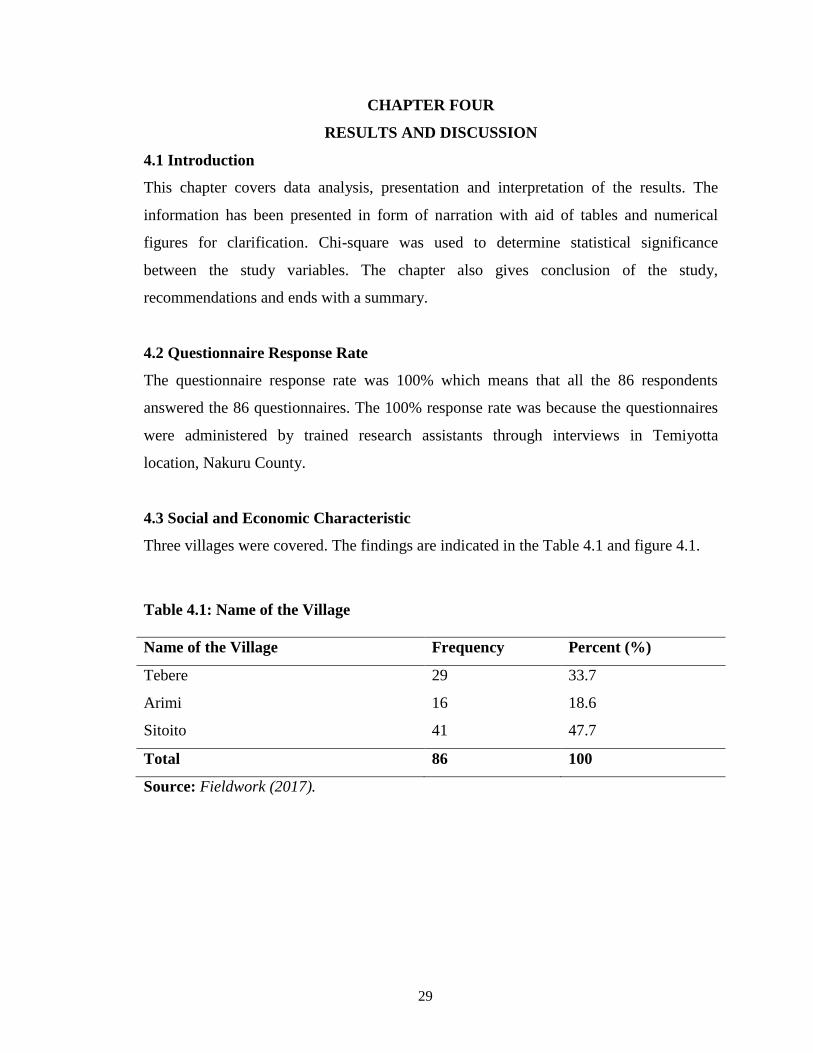
Table 4.1: Name of the Village ..........................................................................................29
Table 4.2: Occupation ........................................................................................................30
Table 4.3: Relationship between Size of Farm and Agroforestry ......................................32
Table 4.4: Land Use Activity .............................................................................................33
Table 4.5: Main Type of Crop Cultivated ..........................................................................34
Table 4.6: Influence of Farm Size on Decision Making ....................................................35
Table 4.7: Mode of Influence .............................................................................................35
Table 4.8: Educational Level of the Household Head .......................................................36
Table 4.9: Educational Level of the Household Head and Agroforestry Adoption...........38
Table 4.10: Contingency table for the Head of Household’s Level of Education and
Agroforestry Adoption ...................................................................................38
Table 4.11: Total Annual Income ......................................................................................40
Table 4.12: Agroforestry Adoption and Annual Income ...................................................42
Table 4.13: Contingency table for the Residents’ Income and Agroforestry Adoption ....42
Table 4.14: Household Size ...............................................................................................43
Table 4.15: Effect of Household Size on Adoption of Agroforestry .................................45
Table 4.16: Household Size ...............................................................................................46
Table 4.17: Contingency table for the size of Household and Agroforestry Adoption .....46
Table 4.18: Source of Smallholders’ Tree Seedlings.........................................................47
Table 4.19: Nature of Planting Trees in the Farm .............................................................49
Table 4.20: Main Use of Planted Trees .............................................................................53
x
LIST OF FIGURES
Figure 2.1: Agroforestry (AF) Adoption Behavior Model ................................................16
Figure 2.2: Conceptual Framework ...................................................................................18
Figure 3.1: Map Highlighting Nakuru County in Kenya ...................................................19
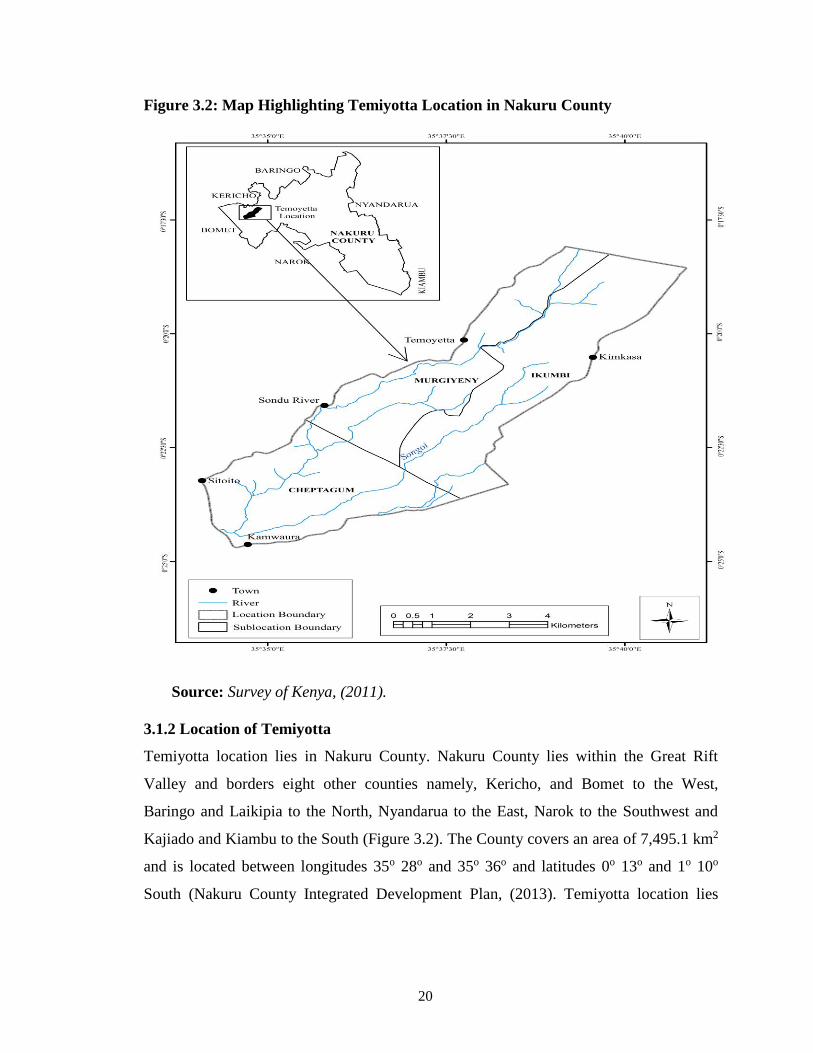
Figure 3.2: Map Highlighting Temiyotta Location in Nakuru County ..............................20
Figure 4.1: Name of the Village ........................................................................................30
Figure 4.2: Occupation of the Respondents .......................................................................31
Figure 4.3: Land Use Activity ...........................................................................................33
Figure 4.4: Main Type of Crop Cultivated ........................................................................34
Figure 4.5: Educational Level of the Household Head ......................................................37
Figure 4.6: Total Annual Income .......................................................................................40
Figure 4.7: Household Size ................................................................................................44
Figure 4.8: Source of Smallholders’ Tree Seedlings .........................................................48
Figure 4.9: Nature of Planting Trees in the Farm ..............................................................49
Figure 4.10: Main Use of Planted Trees ............................................................................53
xi
LIST OF MAPS AND PLATES
Figure 3.1: Map Highlighting Nakuru County in Kenya ...................................................19
Figure 3.2: Map Highlighting Temiyotta Location in Nakuru County ..............................20
Plate 4.1: Gravellea planted as a woodlot ......................................................................... 50
Plate 4.2: Calliandra ...........................................................................................................51
Plate 4.3: Gravellea as Boundary marks and dispersed trees in the Homestead ...............52

xii
LIST OF ACRONYMS AND ABBREVIATIONS
AF Agroforestry
CBO Community Based Organization
FAO Food Agricultural Organization
ICRAF International Centre for Research in Agro-forestry
KNBS Kenya National Bureau of Statistics
MDGs Millennium Development Goals
PES Payment for Environmental Services
SID Society for International Development
SPSS Statistical Package for Social Sciences
UNEP United Nations Environmental Program
xiii
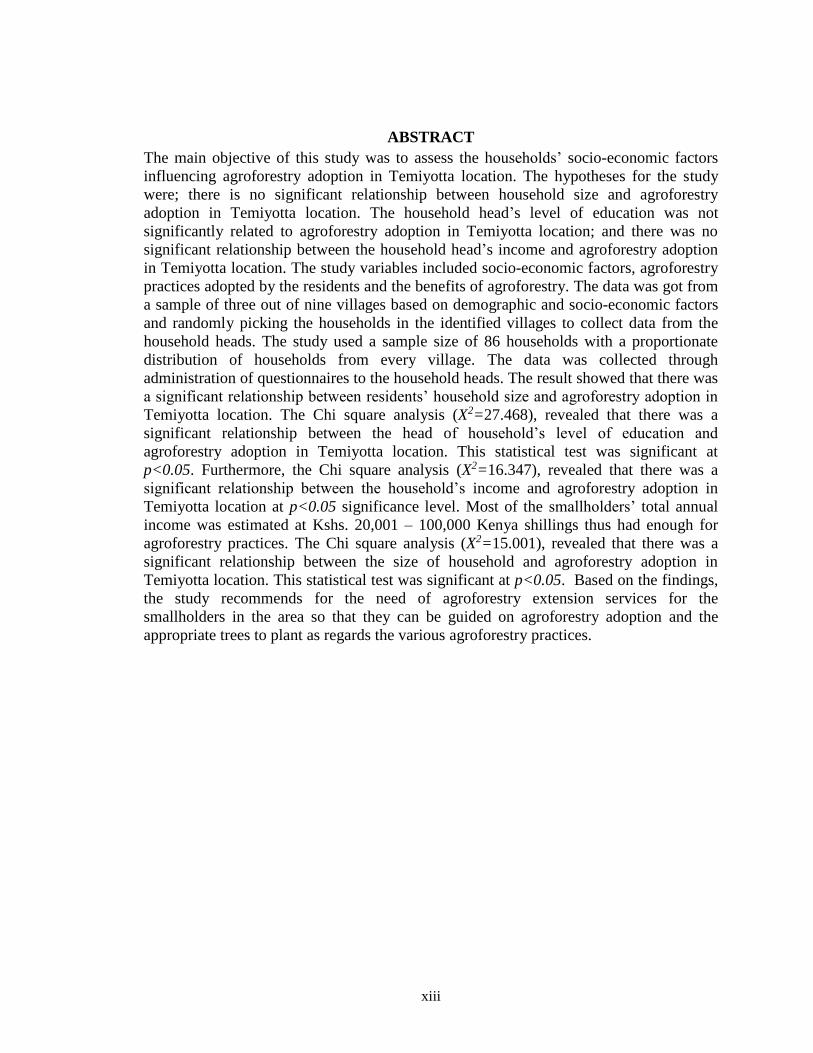
ABSTRACT
The main objective of this study was to assess the households’ socio-economic factors
influencing agroforestry adoption in Temiyotta location. The hypotheses for the study
were; there is no significant relationship between household size and agroforestry
adoption in Temiyotta location. The household head’s level of education was not
significantly related to agroforestry adoption in Temiyotta location; and there was no
significant relationship between the household head’s income and agroforestry adoption
in Temiyotta location. The study variables included socio-economic factors, agroforestry
practices adopted by the residents and the benefits of agroforestry. The data was got from
a sample of three out of nine villages based on demographic and socio-economic factors
and randomly picking the households in the identified villages to collect data from the
household heads. The study used a sample size of 86 households with a proportionate
distribution of households from every village. The data was collected through
administration of questionnaires to the household heads. The result showed that there was
a significant relationship between residents’ household size and agroforestry adoption in
Temiyotta location. The Chi square analysis (X2=27.468), revealed that there was a
significant relationship between the head of household’s level of education and
agroforestry adoption in Temiyotta location. This statistical test was significant at
p<0.05. Furthermore, the Chi square analysis (X2=16.347), revealed that there was a
significant relationship between the household’s income and agroforestry adoption in
Temiyotta location at p<0.05 significance level. Most of the smallholders’ total annual
income was estimated at Kshs. 20,001 – 100,000 Kenya shillings thus had enough for
agroforestry practices. The Chi square analysis (X2=15.001), revealed that there was a
significant relationship between the size of household and agroforestry adoption in
Temiyotta location. This statistical test was significant at p<0.05. Based on the findings,
the study recommends for the need of agroforestry extension services for the
smallholders in the area so that they can be guided on agroforestry adoption and the
appropriate trees to plant as regards the various agroforestry practices.
1
CHAPTER ONE
INTRODUCTION
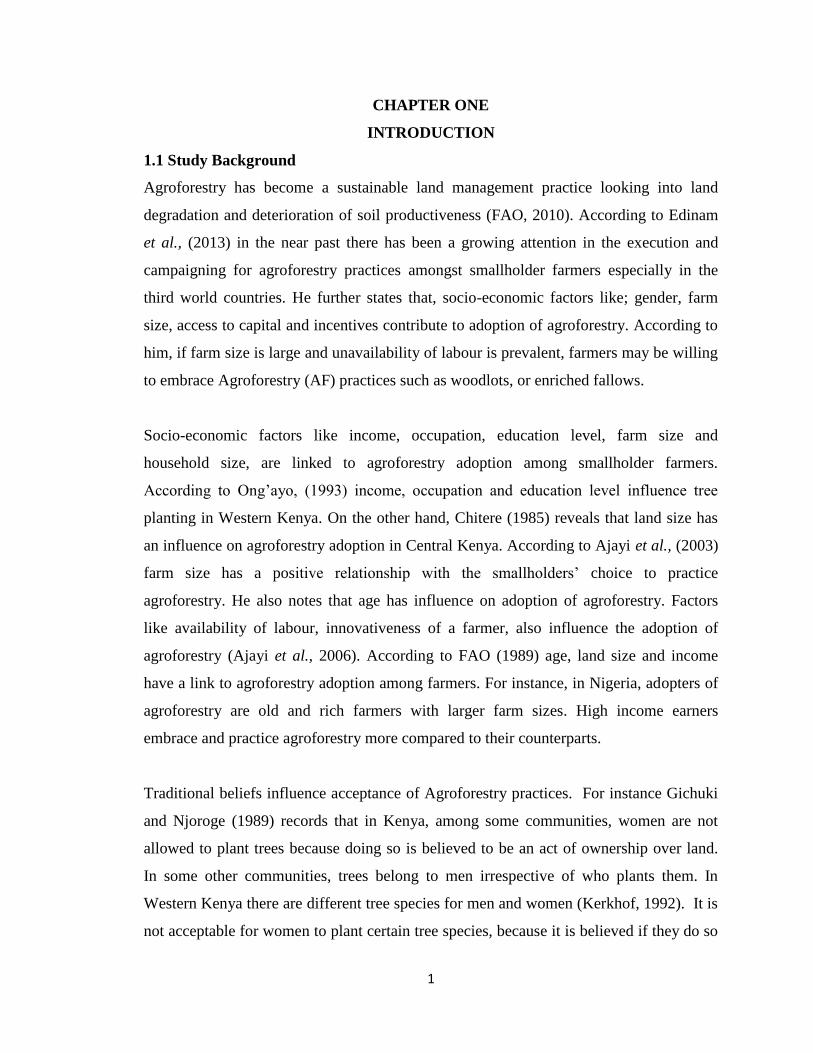
1.1 Study Background
Agroforestry has become a sustainable land management practice looking into land
degradation and deterioration of soil productiveness (FAO, 2010). According to Edinam
et al., (2013) in the near past there has been a growing attention in the execution and
campaigning for agroforestry practices amongst smallholder farmers especially in the
third world countries. He further states that, socio-economic factors like; gender, farm
size, access to capital and incentives contribute to adoption of agroforestry. According to
him, if farm size is large and unavailability of labour is prevalent, farmers may be willing
to embrace Agroforestry (AF) practices such as woodlots, or enriched fallows.
Socio-economic factors like income, occupation, education level, farm size and
household size, are linked to agroforestry adoption among smallholder farmers.
According to Ong’ayo, (1993) income, occupation and education level influence tree
planting in Western Kenya. On the other hand, Chitere (1985) reveals that land size has
an influence on agroforestry adoption in Central Kenya. According to Ajayi et al., (2003)
farm size has a positive relationship with the smallholders’ choice to practice
agroforestry. He also notes that age has influence on adoption of agroforestry. Factors
like availability of labour, innovativeness of a farmer, also influence the adoption of
agroforestry (Ajayi et al., 2006). According to FAO (1989) age, land size and income
have a link to agroforestry adoption among farmers. For instance, in Nigeria, adopters of
agroforestry are old and rich farmers with larger farm sizes. High income earners
embrace and practice agroforestry more compared to their counterparts.
Traditional beliefs influence acceptance of Agroforestry practices. For instance Gichuki
and Njoroge (1989) records that in Kenya, among some communities, women are not
allowed to plant trees because doing so is believed to be an act of ownership over land.
In some other communities, trees belong to men irrespective of who plants them. In
Western Kenya there are different tree species for men and women (Kerkhof, 1992). It is
not acceptable for women to plant certain tree species, because it is believed if they do so
2
they will become barren. Some tree species are linked with certain beliefs and therefore,
cannot be planted at all by community members even if they are beneficial in any way.
On the other hand tree planting decisions in some communities have to be done by the
male head of the household (Ipara, 1992). According to Kiptot and Franzel, (2011)
women are often in charge of management of trees and other agricultural undertakings.
For instance, in Uganda, the percentage of households where females managed fodder
shrubs is way above 80%. Paralleling the tree survival rates as managed by males or
females in Kenya, reveal that households headed by men have higher survival rates for
fodder shrubs than those headed by females (45% as compared to 31%).
Blaug (1970) argues that, education improves one’s ability to capitalize on opportunities.
The same is echoed by Thangata (1996) who states that educational level of household
head is a key factor of agroforestry adoption. He argues that formal and informal training
has the prospective to rise the rate of adoption by directly increasing awareness, on the
new practice. The level of education and exposure to information influences farmers to
embrace and practice agroforestry. Farmers in rural areas throughout the world in recent
years have faced massive challenges including population upsurge, poverty increase and
food insecurity, climate change among others. Gradually many farmers are turning to
agroforestry practices as alternative means of improving their state of affairs. According
to Mercer, (2004) an investigation carried out in more than 700 households in East Africa
established that more than 50% of those households had adopted agroforestry with the
aim to protect the environment and expand their production.
According to FAO, (2013) some countries are working hard to promote agroforestry
adoption among farmers by enhancing and coordinating national activities, through the
development of national information networks. In different areas around the globe
different agroforestry prospects are evolving, for instance; in Niger, the introduction of
friendly legal environment has prompted farmers to embrace the restoration and
management of natural trees, this has led to about 5 million hectares of freshly created
parkland systems.
3
Agroforestry systems can be carried out in different farm sizes ranging from small plots
to large tracts of lands. On small plots, cereal crops can be combined with nitrogen fixing
trees to enrich the soil. On large tracts of land, trees may be planted in woodlots,
boundaries, and on landscape scale trees and other vegetation can be cultivated (Sileshi
and Mafongoya 2006). For Agroforestry systems to be effective they have to have
positive interactions among their innumerable components, leading to final products
which are invaluable, also lessen the likelihood of total failure of harvests’ and reliance
on chemical inputs. Properly managed agro-forestry plots, have demonstrated that trees
add value that surpass any loss in crop production process. Nevertheless, these results are
not assured, therefore consideration on the type of agro-forestry system used and species
selected is key (UNEP 2015).
According to Sileshi et al., (2007) if Agroforestry is properly planned and carried out,
particularly at landscape level, enormous benefits which play a part to the sustainability
of residents and, on a greater magnitude, to ecosystems on which the local community
rely upon for their livelihoods will be enhanced. On the other hand, the environmental
and economic services perhaps could not be valued by the market, implying that
development actors and farmers must take up all the production cost, though the entire
nation benefits in the long run. Introducing financial assistance to farmers who practice
tree cultivation in their farms can be regarded as a system of payment for environmental
services, which will motivate more people to embrace agroforestry.
Cheik (2015) records that progress has been made in integrating sustainable development
goals into forest sector. The integration of agroforestry into national sustainable
development can help achieve sustainability. Forests and agroforestry if well embraced
and managed, play a role in achieving the United Nations, Millennium Development
Goals (MDGs), including other globally agreed development goals. Agroforestry makes
an enormous impact on the MDGs for instance, it eliminates hunger and poverty also
ensuring environmental sustainability. On the other hand agroforestry has an indirect role
assisting to meet other MDGs, through their social, economic and environmental
services. For instance agroforestry minimizes child mortality rate and enhances human
4
health through its contribution to food security, providing medicines, as well as a source
of income.
1.2 Statement Problem
According to Nakuru County Integrated Development Plan, (2013) agroforestry was
introduced in the year 2010 in Temiyotta location. Agroforestry rules were introduced in
the same year which requires that all farmers in Temiyotta location and the larger Nakuru
County increase their trees’ species to 10 per cent per land hectare. The study area has
experienced a decline of Kariara community forest, which has been overexploited by
residents for; charcoal, firewood, timber and poles. About 543.41 Ha. (61.85%) of the
community forest has been lost since 1970s (DRSRS, 2010). Efforts must be put to
increase the area under tree cover, and agroforestry is one way of sustainably achieving
this. This study seeks to analyse the socioeconomic factors i.e. household size, education
level of the household head, income of the household head and farm size of the
household, and how they influence agroforestry adoption.
Agroforestry adoption in the study area has experienced numerous challenges, for
instance little access to information sources and insufficient understanding on tree/crop
growing on-farms. Few studies have been carried out to examine how socio-economic
factors affect agroforestry adoption among smallholders within farming communities.
The available information regarding socioeconomic factors that affect agroforestry in
many areas is often scanty in terms of quality and quantity. Most of the past studies on
this subject often emphasized on the biophysical factors and disregarded the socio-
economic factors, assuming that it is only biophysical factors that affect the advancement
in agroforestry practices.
Nakuru District Strategic Plan (2005) states that; the households of Temiyotta location
own an average farm size of 0.77Ha. Agroforestry improves soil fertility. Fertilizer trees
like Grevellea robusta, Sesbania sesban grown together with food crops are known to
increase the fertility of the soil and hence productivity (Ayuya et al., 2012). Agroforestry
is a source of income to farmers. It is a source of fodder to livestock e.g. Calliandra.
5
Provides fuel for household use, Nakuru District Strategic Plan (2005) states that 70% of
the households buy firewood and long distances are covered daily to fetch firewood,
hence a lot of time is wasted which could be used in other productive farm practices.
According to Kenya National Bureau of Statistics (2013) 86% (1,723) households use
fire-wood and 12.8% (257) use charcoal for cooking. This statistic shows the urgency of
promoting agroforestry among the farmers so that they can cut down on the cost and time
spent in fetching the commodity.
1.3 Research Questions
1. Do socio-economic factors such as; household size, education, farm size, and
income, influence agroforestry adoption among the household heads of Temiyotta
location?
2. Which agroforestry practices are adopted by the household heads of Temiyotta
location?
3. What are the benefits of agroforestry among the household heads of Temiyotta
location?
1.4 Project Objectives
1.4.1 General Objective
The main objective of this study was to assess the household heads’ socio-economic
factors influencing agroforestry adoption in Temiyotta location.
1.4.2 Specific Objectives
The specific objectives of the study included:
1. To assess how socio-economic factors influence agroforestry adoption in
Temiyotta location.
2. To document the agroforestry practices adopted by the households in Temiyotta
location.
3. To identify the benefits of agroforestry among the households of Temiyotta
location.
6
1.5 Research Hypotheses
H0: There is no significant relationship between the household heads’ household
size and agroforestry adoption in Temiyotta location
H0: The household heads’ level of education was not significantly related to
agroforestry adoption in Temiyotta location
H0: There was no significant relationship between the household heads’ income and
agroforestry adoption in Temiyotta location
1.6 Justification
Temiyotta location was chosen as the case study, because of poor adoption of agro
forestry in the area. To achieve the Millennium Development Goals (MDGs) and
Kenya’s vision 2030 as a country, we need environmental sustainability. Systematic
environmental degradation in any society would deter it from reaching the goal of
reversing loss of environmental resources. Also, unequal access to productive resources
hold back a society from achieving the goal of halving extreme poverty. Sustainable
development and achievements of the MDGs are thus mutually reinforcing. They
represent a two-way relationship – where achievement of the MDGs helps in achieving
sustainable development and where the presence of sustainability in its various
dimensions is needed for achievement of the time-bound global goals.
1.7 Scope and limitations of the Study
This study focused on the adoption of Agroforestry in Temiyotta location; For instance,
the socio-economic factors that influence agroforestry adoption i.e. income, household
size, farm size, and education of the household heads. On the other hand the study
identified some of the agro-forestry technologies practiced in Temiyotta location. Lastly
the study identified the benefits of agroforestry adoption among the residents of the study
area. This study did not focus into biophysical, environmental and cultural factors that
affect agroforestry adoption.
7
1.8 Definition of Terms
Agro forestry: It is a collective name for land-use systems and practices where woody
perennials are deliberately integrated with crops and/or animals on the same land
management unit.
Household: It refers to a single person or group of persons who live and eat together and
share common living arrangements i.e. share expense.
Household head: It refers to the main decision-maker, or the person who owns or rents
the dwelling, or the person who is the chief breadwinner.
Household income: It refers to all revenue earned by all members of a household, in
cash and in kind, in exchange for employment, or in return for capital investment, or
revenue gained from other sources such as social grants, pension, etc.
8
CHAPTER TWO
LITERATURE REVIEW
2.1 Introduction
This chapter begins by presenting literature on various studies carried out in Kenya and
outside Kenya on socio-economic factors affecting agroforestry adoption. The study
begins by reviewing literature done globally, then Africa and finally discussing literature
on Kenya about Agroforestry adoption. The chapter also shows gaps identified in the
empirical studies in various parts of the world and how the study intends to fill those
gaps. These chapter as well presents the conceptual and theoretical frameworks and lastly
concludes by discussing the variables under study
2.2 Socio-Economic Factors Affecting Agroforestry Adoption
2.2.1 Farm Size
Pattanayak et al., (2002) carried out a study to identify general determinants of
agroforestry adoption in eastern Philippines. The study reports that; farm size is
statistically correlated with adoption of agroforestry r2 = 0.66. The findings show that as
the farm size increases, agroforestry adoption as well increases. The study concludes that
the ‘economies of scale’ should offer an explanation of adoption in this scenario; that is, a
farmer with more land is more likely and, or willing to experiment with a new
technology.
Orisakwe and Agomuo, (2011) in his study in Imo State Nigeria, sought to examine the
socio-economic factors of the residents practicing agroforestry, and the extent of adoption
of agroforestry technologies in the area. In his findings, he states that 48.9% of the
farmers own land sizes of 1-3 hectares, and 40% own land sizes which are below 1
hectare. The average land owned by the residents practising agroforestry was
approximately 1.5 hectares. The study revealed that, land size of the respondents had a
positive relationship to levels of agroforestry adoption, meaning that; as the respondents
land size increase, adoption of agroforestry systems increase, and when the farm size
decreases the adoption as well declines. There was a significant relationship between the
farm size and adoption levels, the t-calculated value was 2.325 which is greater than the
9
t-tabulated value which is 1.98, this was tested at 5% level of probability. A similar study
by Kabwe et al., (2009) carried out with the objectives to determine extent of adoption of
agroforestry technologies and to determine factors influencing adoption of agroforestry
among smallholder farmers in Zambia. His findings show that farm size is significantly
associated with adoption of agroforestry. The calculated χ2 = 5.787 is greater than the
critical value, χ2 = 3.84.
Geremew (2016) carried out a study in Mecha rural district, found in Amhara National
Regional State in the Northwest of Ethiopia. The objective of the study was to investigate
the factors that influence the agroforestry adoption decisions of the farm households and
its effect on farmland productivity. The findings show that; farm size has a positive
correlation with agroforestry adoption (r2 = 0.834). The study records that as farm size
increased by one hectare, the probability of adopting agroforestry of that household
would rise by 28.2% units. The study concludes that, where there is surplus farmland the
household can be motivated to allocate the additional farmland for cash generating
agroforestry practices. Similar findings are echoed in the study of Kassa, (2015).
Maluki et al., (2016) carried out a survey targeting smallholder households in the semi-
arid Makueni County, Kenya. The objective of the survey was to ascertain the various
agroforestry practices adopted and the extent of adoption. 234 respondents were
interviewed. Adoption of agroforestry was positively correlated with size of landholding
(r2 = 0.507). The bigger the land, the higher the likelihood to invest in agroforestry
technologies suitable in the semi-arid areas and that the farmer can plant in parts of the
land deemed suitable without restrictions. 23% of the respondents own less than 3 acres,
59% own between 3.1-6 acres and 18% own above 6.1 acres. The studies failed to
recognize that farmers with a small size of land are likely to adopt agroforestry
technologies to improve soil fertility, through intercropping fertilizer trees with crops.
Therefore this study seeks to fill this gap, by linking improving soil fertility with
agroforestry adoption among small land holders.
10
These studies have failed to indicate how the size of the farm influence the farmers’
decision to plant/not to plant trees. Therefore this study seeks to fill this gap by, finding
out the various farm factors that play a role in the farmers’ decision making to adopt or
not to adopt agroforestry. These study will reveal how farmers use their farm, the kind of
crops grown and the size of farm occupied by each crop in question.
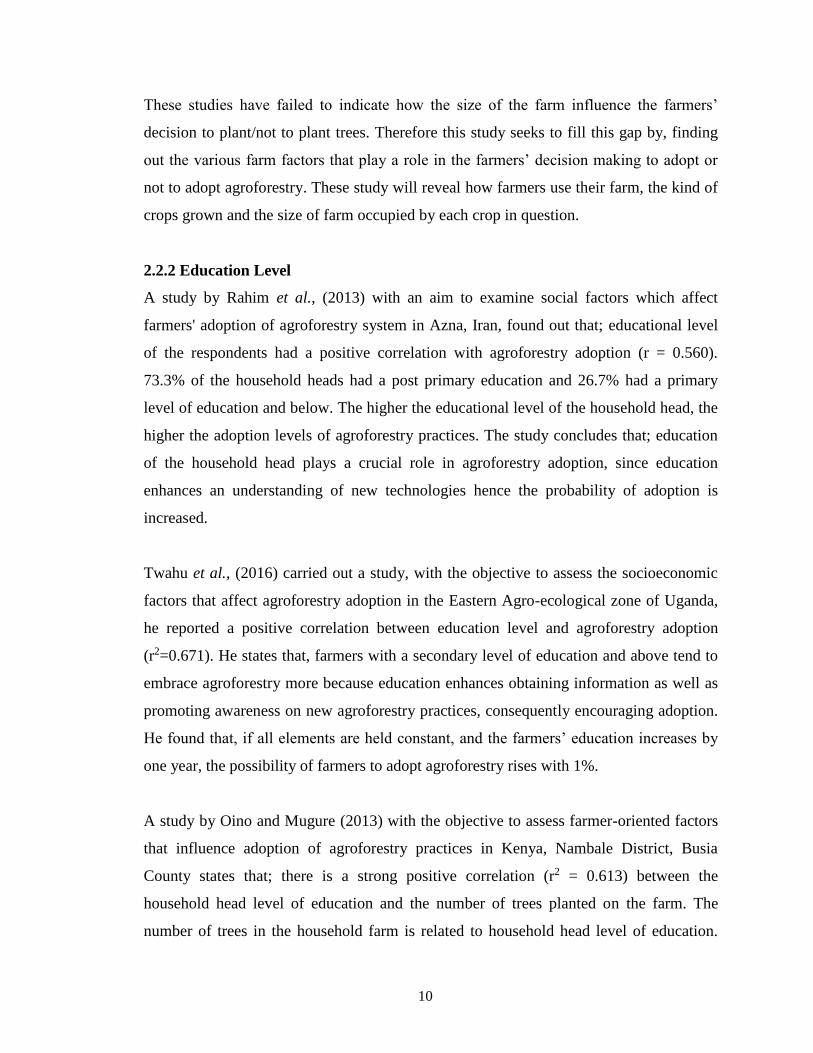
2.2.2 Education Level
A study by Rahim et al., (2013) with an aim to examine social factors which affect
farmers' adoption of agroforestry system in Azna, Iran, found out that; educational level
of the respondents had a positive correlation with agroforestry adoption (r = 0.560).
73.3% of the household heads had a post primary education and 26.7% had a primary
level of education and below. The higher the educational level of the household head, the
higher the adoption levels of agroforestry practices. The study concludes that; education
of the household head plays a crucial role in agroforestry adoption, since education
enhances an understanding of new technologies hence the probability of adoption is
increased.
Twahu et al., (2016) carried out a study, with the objective to assess the socioeconomic
factors that affect agroforestry adoption in the Eastern Agro-ecological zone of Uganda,
he reported a positive correlation between education level and agroforestry adoption
(r2=0.671). He states that, farmers with a secondary level of education and above tend to
embrace agroforestry more because education enhances obtaining information as well as
promoting awareness on new agroforestry practices, consequently encouraging adoption.
He found that, if all elements are held constant, and the farmers’ education increases by
one year, the possibility of farmers to adopt agroforestry rises with 1%.
A study by Oino and Mugure (2013) with the objective to assess farmer-oriented factors
that influence adoption of agroforestry practices in Kenya, Nambale District, Busia
County states that; there is a strong positive correlation (r2 = 0.613) between the
household head level of education and the number of trees planted on the farm. The
number of trees in the household farm is related to household head level of education.
11
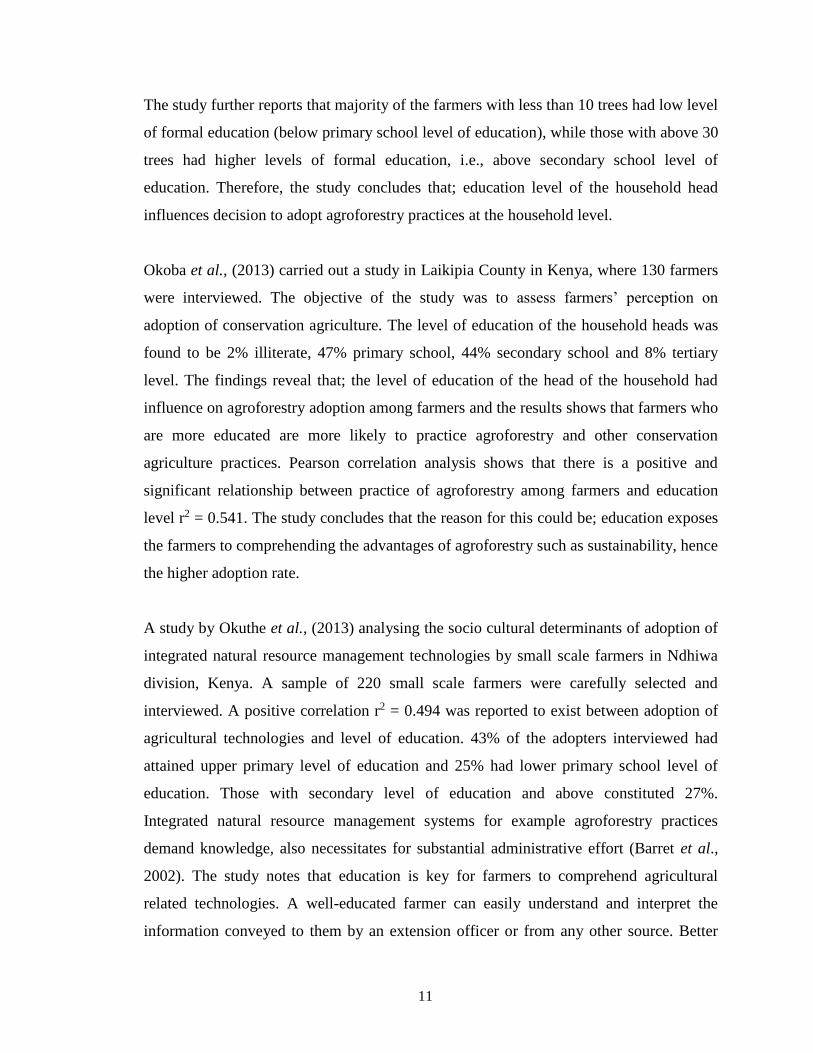
The study further reports that majority of the farmers with less than 10 trees had low level
of formal education (below primary school level of education), while those with above 30
trees had higher levels of formal education, i.e., above secondary school level of
education. Therefore, the study concludes that; education level of the household head
influences decision to adopt agroforestry practices at the household level.
Okoba et al., (2013) carried out a study in Laikipia County in Kenya, where 130 farmers
were interviewed. The objective of the study was to assess farmers’ perception on
adoption of conservation agriculture. The level of education of the household heads was
found to be 2% illiterate, 47% primary school, 44% secondary school and 8% tertiary
level. The findings reveal that; the level of education of the head of the household had
influence on agroforestry adoption among farmers and the results shows that farmers who
are more educated are more likely to practice agroforestry and other conservation
agriculture practices. Pearson correlation analysis shows that there is a positive and
significant relationship between practice of agroforestry among farmers and education
level r2 = 0.541. The study concludes that the reason for this could be; education exposes
the farmers to comprehending the advantages of agroforestry such as sustainability, hence
the higher adoption rate.
A study by Okuthe et al., (2013) analysing the socio cultural determinants of adoption of
integrated natural resource management technologies by small scale farmers in Ndhiwa
division, Kenya. A sample of 220 small scale farmers were carefully selected and
interviewed. A positive correlation r2 = 0.494 was reported to exist between adoption of
agricultural technologies and level of education. 43% of the adopters interviewed had
attained upper primary level of education and 25% had lower primary school level of
education. Those with secondary level of education and above constituted 27%.
Integrated natural resource management systems for example agroforestry practices
demand knowledge, also necessitates for substantial administrative effort (Barret et al.,
2002). The study notes that education is key for farmers to comprehend agricultural
related technologies. A well-educated farmer can easily understand and interpret the
information conveyed to them by an extension officer or from any other source. Better

12
educated farmers have an enhanced understanding of agroforestry related information at
their disposal, also improves their involvement in agricultural related undertakings. The
studies on how education of the household head affects agroforestry adoption have failed
to indicate how education directly affects the adoption levels. Consequently this study
seeks to fill this gap by, investigating how the farmers thought education influences them
to adopt or fail to adopt agroforestry.
2.2.3 Household Size
Bzugu et al., (2012) carried out a study with the objective to analyse the socio economic
factors influencing the adoption of improved agricultural technologies. The study was
carried out at the sahelian zone of Borno State, Nigeria. A sample size of 321 households
was used for this exercise. A positive correlation is reported to exist between agroforestry
and household size r2 = 0.5039. Further findings from the study reveals that 32.1% of the
respondents had 9-12 members per household. The study concludes that much labor used
in small scale farms emanates from the household.
Madalcho and Tefera (2016) conducted a study, in which he had a sample size of 50
households. The study was carried out in Gunugo watershed at Wolayitta zone it
Ethiopia, with an objective to assess the socioeconomic factors affecting tree planting in
agroforestry practices. The findings reveal a positive correlation between household size
and agroforestry adoption in the area (r2 = 0.501). Larger households planted more trees
than small households. He attributes the findings to labor availability, where he argues
that larger households would have enough labor to plant trees and able to provide
adequate management for the planted trees.
Ayuya et al., (2012) carried out a study, with the objective to establishing the most
preferred organic soil management techniques among farmers and the factors influencing
the choice of these techniques. A sample size of 150 smallholder maize farmers were
selected, from Bungoma County. Household size is significantly related to adoption of
agroforestry technology r2 = 0.692. An increase in the household size by one member,
increases the likelihood of choosing agroforestry technologies by 5.57%. Large
13
household size positively influences adoption of labor- demanding agricultural
technologies since they have the ability to relax the labor limitations necessary in the
course of introduction of new technologies (Odendo et al., 2009). The studies above
failed to clearly articulate how household size is one of the factors influencing
agroforestry adoption. Therefore this study seeks to fill this gap by asking the
respondents to state the roles of their household members in agroforestry. This gives a
clearer picture of how various persons in the household contribute to adoption and
management of agroforestry.
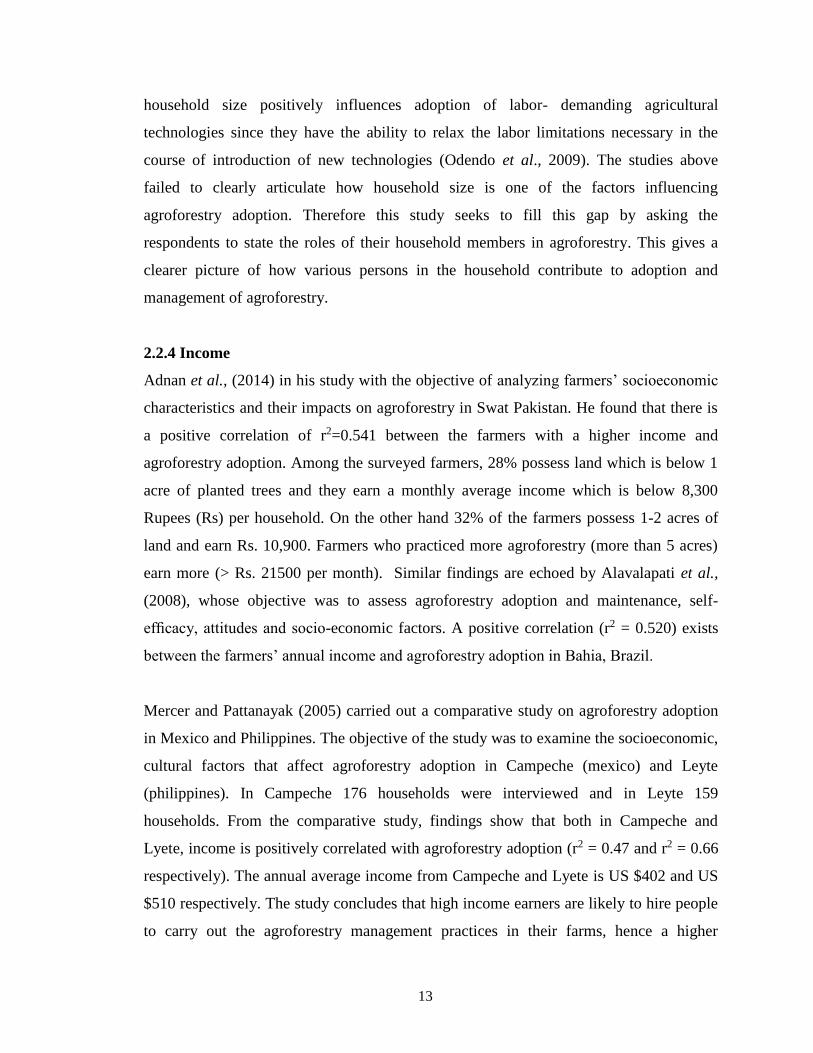
2.2.4 Income
Adnan et al., (2014) in his study with the objective of analyzing farmers’ socioeconomic
characteristics and their impacts on agroforestry in Swat Pakistan. He found that there is
a positive correlation of r2=0.541 between the farmers with a higher income and
agroforestry adoption. Among the surveyed farmers, 28% possess land which is below 1
acre of planted trees and they earn a monthly average income which is below 8,300
Rupees (Rs) per household. On the other hand 32% of the farmers possess 1-2 acres of
land and earn Rs. 10,900. Farmers who practiced more agroforestry (more than 5 acres)
earn more (> Rs. 21500 per month). Similar findings are echoed by Alavalapati et al.,
(2008), whose objective was to assess agroforestry adoption and maintenance, self-
efficacy, attitudes and socio-economic factors. A positive correlation (r2 = 0.520) exists
between the farmers’ annual income and agroforestry adoption in Bahia, Brazil.
Mercer and Pattanayak (2005) carried out a comparative study on agroforestry adoption
in Mexico and Philippines. The objective of the study was to examine the socioeconomic,
cultural factors that affect agroforestry adoption in Campeche (mexico) and Leyte
(philippines). In Campeche 176 households were interviewed and in Leyte 159
households. From the comparative study, findings show that both in Campeche and
Lyete, income is positively correlated with agroforestry adoption (r2 = 0.47 and r2 = 0.66
respectively). The annual average income from Campeche and Lyete is US $402 and US
$510 respectively. The study concludes that high income earners are likely to hire people
to carry out the agroforestry management practices in their farms, hence a higher
14
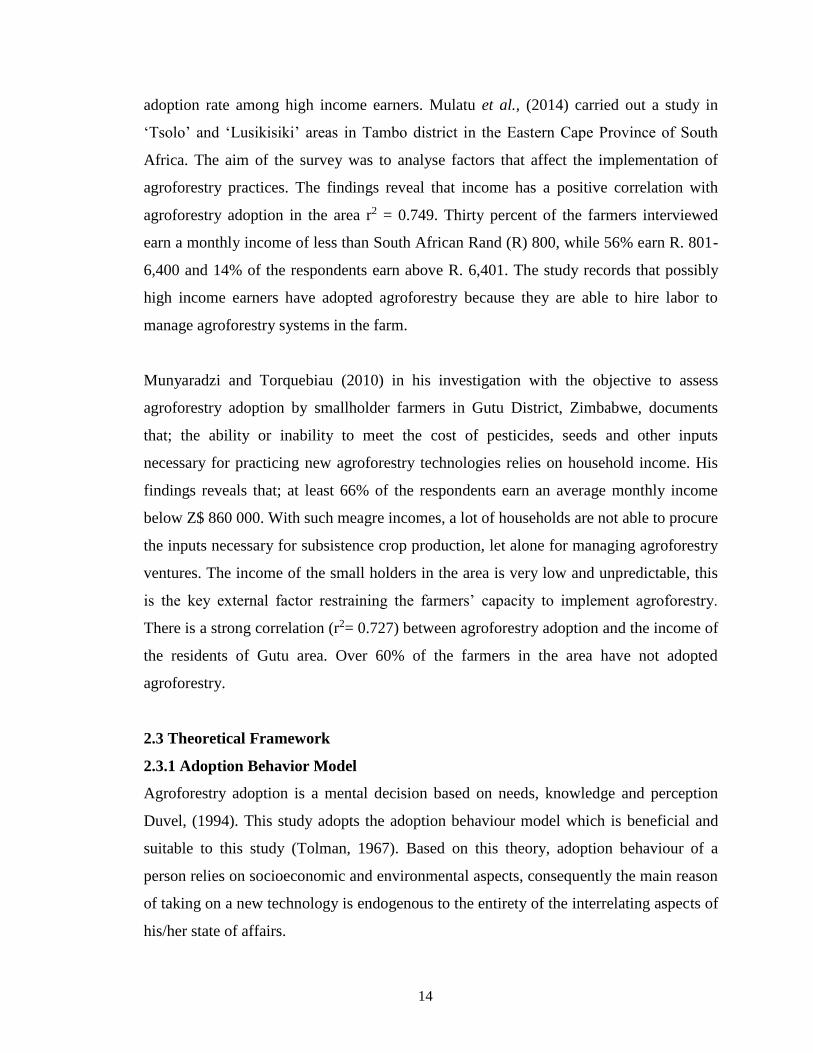
adoption rate among high income earners. Mulatu et al., (2014) carried out a study in
‘Tsolo’ and ‘Lusikisiki’ areas in Tambo district in the Eastern Cape Province of South
Africa. The aim of the survey was to analyse factors that affect the implementation of
agroforestry practices. The findings reveal that income has a positive correlation with
agroforestry adoption in the area r2 = 0.749. Thirty percent of the farmers interviewed
earn a monthly income of less than South African Rand (R) 800, while 56% earn R. 801-
6,400 and 14% of the respondents earn above R. 6,401. The study records that possibly
high income earners have adopted agroforestry because they are able to hire labor to
manage agroforestry systems in the farm.
Munyaradzi and Torquebiau (2010) in his investigation with the objective to assess
agroforestry adoption by smallholder farmers in Gutu District, Zimbabwe, documents
that; the ability or inability to meet the cost of pesticides, seeds and other inputs
necessary for practicing new agroforestry technologies relies on household income. His
findings reveals that; at least 66% of the respondents earn an average monthly income
below Z$ 860 000. With such meagre incomes, a lot of households are not able to procure
the inputs necessary for subsistence crop production, let alone for managing agroforestry
ventures. The income of the small holders in the area is very low and unpredictable, this
is the key external factor restraining the farmers’ capacity to implement agroforestry.
There is a strong correlation (r2= 0.727) between agroforestry adoption and the income of
the residents of Gutu area. Over 60% of the farmers in the area have not adopted
agroforestry.
2.3 Theoretical Framework
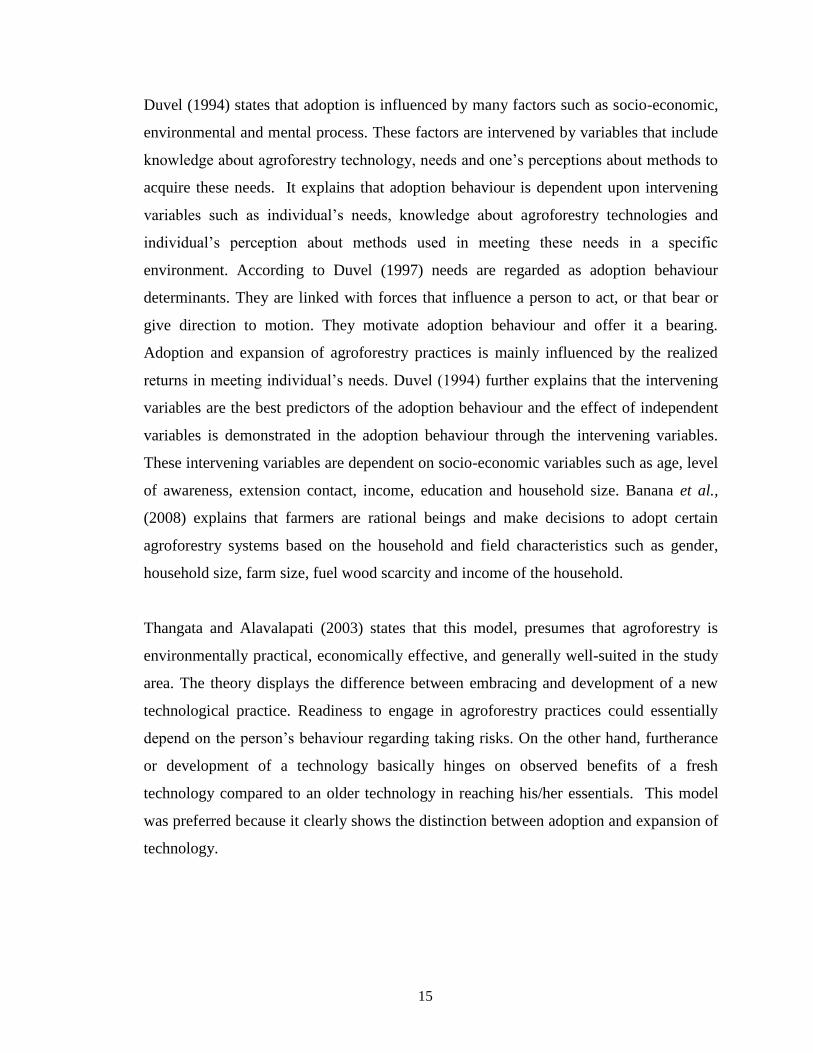
2.3.1 Adoption Behavior Model
Agroforestry adoption is a mental decision based on needs, knowledge and perception
Duvel, (1994). This study adopts the adoption behaviour model which is beneficial and
suitable to this study (Tolman, 1967). Based on this theory, adoption behaviour of a
person relies on socioeconomic and environmental aspects, consequently the main reason
of taking on a new technology is endogenous to the entirety of the interrelating aspects of
his/her state of affairs.
15
Duvel (1994) states that adoption is influenced by many factors such as socio-economic,
environmental and mental process. These factors are intervened by variables that include
knowledge about agroforestry technology, needs and one’s perceptions about methods to
acquire these needs. It explains that adoption behaviour is dependent upon intervening
variables such as individual’s needs, knowledge about agroforestry technologies and
individual’s perception about methods used in meeting these needs in a specific
environment. According to Duvel (1997) needs are regarded as adoption behaviour
determinants. They are linked with forces that influence a person to act, or that bear or
give direction to motion. They motivate adoption behaviour and offer it a bearing.
Adoption and expansion of agroforestry practices is mainly influenced by the realized
returns in meeting individual’s needs. Duvel (1994) further explains that the intervening
variables are the best predictors of the adoption behaviour and the effect of independent
variables is demonstrated in the adoption behaviour through the intervening variables.
These intervening variables are dependent on socio-economic variables such as age, level
of awareness, extension contact, income, education and household size. Banana et al.,
(2008) explains that farmers are rational beings and make decisions to adopt certain
agroforestry systems based on the household and field characteristics such as gender,
household size, farm size, fuel wood scarcity and income of the household.
Thangata and Alavalapati (2003) states that this model, presumes that agroforestry is
environmentally practical, economically effective, and generally well-suited in the study
area. The theory displays the difference between embracing and development of a new
technological practice. Readiness to engage in agroforestry practices could essentially
depend on the person’s behaviour regarding taking risks. On the other hand, furtherance
or development of a technology basically hinges on observed benefits of a fresh
technology compared to an older technology in reaching his/her essentials. This model
was preferred because it clearly shows the distinction between adoption and expansion of
technology.
16
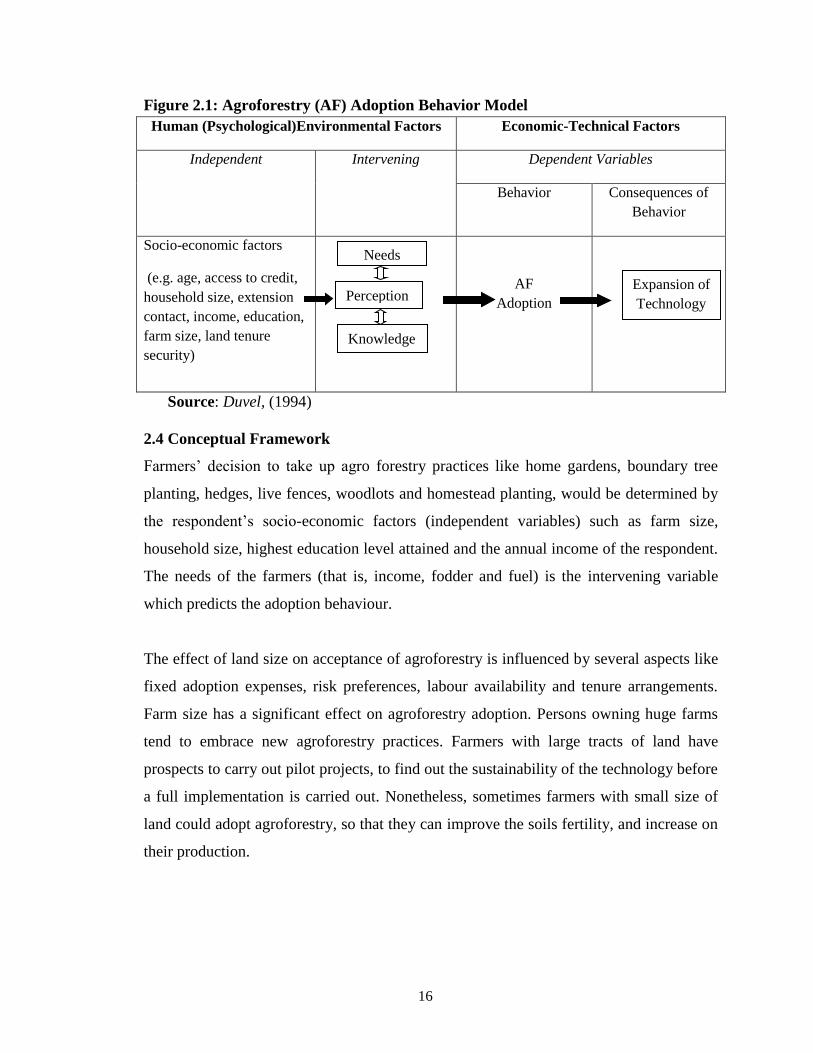
Figure 2.1: Agroforestry (AF) Adoption Behavior Model
Human (Psychological)Environmental Factors Economic-Technical Factors
Independent Intervening Dependent Variables
Behavior Consequences of
Behavior
Socio-economic factors
(e.g. age, access to credit,
household size, extension
contact, income, education,
farm size, land tenure
security)
AF
Adoption
Source: Duvel, (1994)
2.4 Conceptual Framework
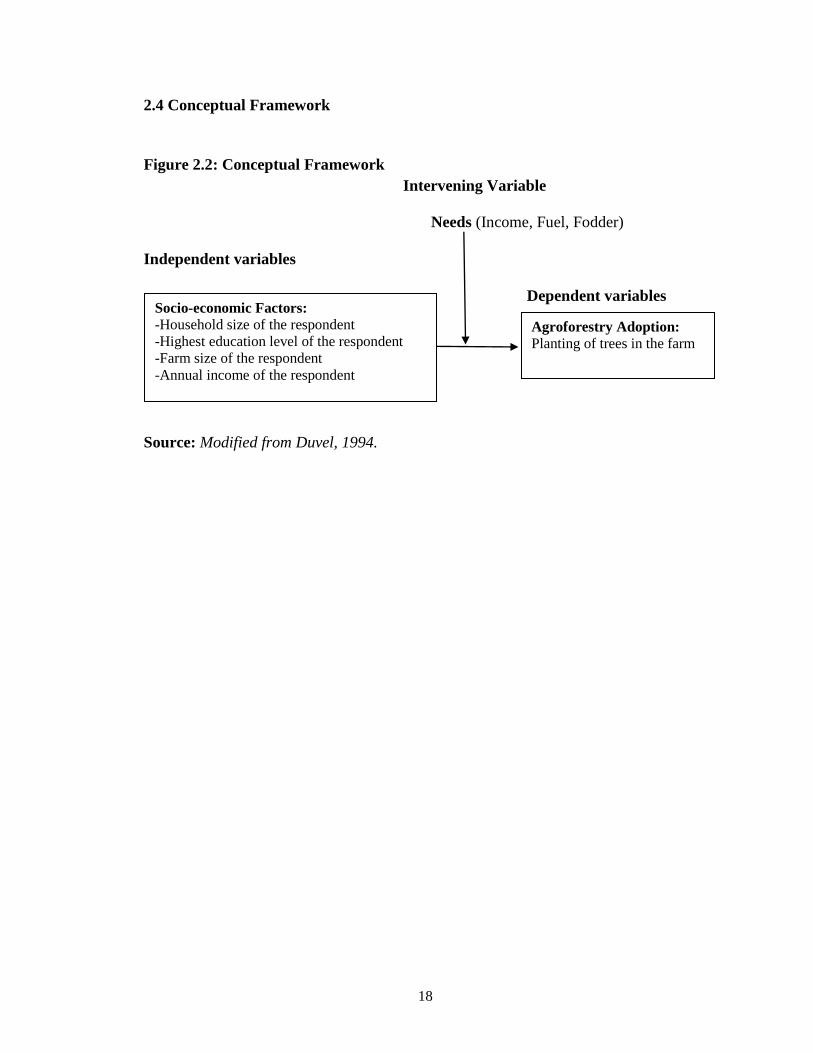
Farmers’ decision to take up agro forestry practices like home gardens, boundary tree
planting, hedges, live fences, woodlots and homestead planting, would be determined by
the respondent’s socio-economic factors (independent variables) such as farm size,
household size, highest education level attained and the annual income of the respondent.
The needs of the farmers (that is, income, fodder and fuel) is the intervening variable
which predicts the adoption behaviour.
The effect of land size on acceptance of agroforestry is influenced by several aspects like
fixed adoption expenses, risk preferences, labour availability and tenure arrangements.
Farm size has a significant effect on agroforestry adoption. Persons owning huge farms
tend to embrace new agroforestry practices. Farmers with large tracts of land have
prospects to carry out pilot projects, to find out the sustainability of the technology before
a full implementation is carried out. Nonetheless, sometimes farmers with small size of
land could adopt agroforestry, so that they can improve the soils fertility, and increase on
their production.
Needs
Perception
Knowledge
Expansion of
Technology
17
It is likely that persons who earn more money have the potential to implement
agroforestry practices than those with meagre earnings. Adoption of agroforestry
practices may vary among groups with different income levels, for instance small scale
farmers may think the new practices are too risky hence avoid it. On the other hand the
high income earners can afford to pay wages for agroforestry management in their farm
as a result they chose to adopt it. In some cases high income earners may not practice the
agroforestry due to other factors.
Household size might have a varying influence on adoption of agroforestry practices.
Increased household size impacts on the need for additional produce for household
members to consume. In the context of agroforestry, the household size has a varying
effect on the implementation of a new technology. Larger households with sufficient
labour source tend to embrace agroforestry practices compared with those of small
households. However agroforestry adoption may as well increase in small household
sizes, perhaps for the reason that agroforestry is less labour demanding.
Education level of the farmer has an influence on the adoption of agroforestry practices in
the farm level. Farmers with high education are likely to develop a positive attitude
towards agroforestry. Farmers with higher education are better at understanding the
problems and they have more capacity to access, process and use relevant information
about new practices or technology in their farming. Farmers who are more educated can
certainly acquire the relevant knowledge regarding agroforestry for instance, on
disadvantages of new practices, consequently they may reduce, avoid or tend to delay on
adopting the practices.
18
2.4 Conceptual Framework
Figure 2.2: Conceptual Framework
Intervening Variable
Needs (Income, Fuel, Fodder)
Independent variables
Dependent variables
Source: Modified from Duvel, 1994.
Socio-economic Factors:
-Household size of the respondent
-Highest education level of the respondent
-Farm size of the respondent
-Annual income of the respondent
Agroforestry Adoption:
Planting of trees in the farm

19
CHAPTER THREE
STUDY AREA AND RESEARCH METHODOLOGY
3.1 Study Area
3.1.1 Introduction
The study was carried out in Temiyotta location, in Kuresoi North Constituency, Nakuru
County in Rift valley Province, Kenya. As illustrated in Figures 3.1 and 3.2 respectively.
Figure 3.1: Map Highlighting Nakuru County in Kenya
Source: Survey of Kenya, (2011).
20
Figure 3.2: Map Highlighting Temiyotta Location in Nakuru County
Source: Survey of Kenya, (2011).
3.1.2 Location of Temiyotta
Temiyotta location lies in Nakuru County. Nakuru County lies within the Great Rift
Valley and borders eight other counties namely, Kericho, and Bomet to the West,
Baringo and Laikipia to the North, Nyandarua to the East, Narok to the Southwest and
Kajiado and Kiambu to the South (Figure 3.2). The County covers an area of 7,495.1 km2
and is located between longitudes 35o 28o and 35o 36o and latitudes 0o 13o and 1o 10o
South (Nakuru County Integrated Development Plan, (2013). Temiyotta location lies
21
within longitudes; 35o 34o E to 35o 41o E, and latitudes 0o 18o S to 0o 25o 0o S. It covers a
total area of 5900.88 hectares.
3.2 Physiography and Natural Conditions
3.2.1 Geomorphologic Features
The major geomorphologic features in the location include of the hills, rolling land and
plains. From field-measurements, the top soils in the plains are of clay loam (CL) to loam
(L) in texture, with friable consistence and weak to moderate sub-angular blocky
structure. The subsoil texture ranges from silty clay loam (SCL) to clay loam (CL) and
clay (C), with pH values ranging from 5.6 to 6.4, making them slightly to moderately
acidic in nature (China, 1993).
3.2.2 Climate
Temiyotta location lies at 2,400 m above sea level. The rainfall pattern in the location is
bimodal in distribution, peaking in April and August, and ranges from 1000 to 2000 mm.
The rain days range from 120 to 200 per year. This rainfall pattern supports healthy forest
vegetation. The temperatures range from 16°C to 22°C with July being the coldest month.
The potential evapotranspiration is 1400 to 1800 mm per annum (Nakuru District
Strategic Plan, 2005). Forests where agroforestry is included are essential for maintaining
the rain patterns, therefore it is of essence that farmers adopt agroforestry.
3.3 Demographic Characteristics of the Location
3.3.1 Population Distribution
The population of the area has been on the upward trend since 1979 to 2009, this is
because of the new migrants and natural increase. Many new people come to buy land
after the ethnic conflicts because at this time the land is sold at cheaper rates. In the year
2009 there was a slight decrease of the population simply because of the 2007/2008
violent ethnic conflicts whereby other people have not returned to their destroyed homes.
On the other hand the numbers of households and population density/ persons per square
kilometer have ever since increased within the location (table 3.1).

22
Table 3.1: Population by Administrative Location Unit
Source: Census (2009).
3.3.2 Education in the Location
According to Nakuru District Strategic Plan (2005) Temiyotta location and the larger
Nakuru County experience a 38% drop out of females and males out of primary schools.
On the other hand in secondary schools the males drop out levels increases to 49.1% and
that of females rises to 54.8%. More boys are enrolled in schools than girls. Most of the
drop outs are likely to engage in farming activities, and therefore may not be able to read
and write and therefore may not be able to access literature related to agroforestry to
enlighten themselves on its advantages. On the other hand farmers with higher education
have more capacity to access, process and use relevant information about new practices
or technology in their farming.
3.3.3 Income in the Location
Ayieni (2013) states that most of the residents of Temiyotta location earn less than
Kshs.100 a day. He further explains that poverty in the area is high due to unemployment,
landlessness, insecurity, lack of basic services such as health, education and lack of credit
facilities. He notes that land crashes have played a major role in the current state of
poverty in the location and its environs by creating tension, insecurity, forced migration
and destruction of life and property and wastage of time. Many low income earners are
prone to undermine agroforestry since it is a long term investment, and their immediate
needs is food which they have to work for on a daily basis.
Census Total
population
Number of
households
Square
kilometers
Density/
persons per
Km2
Inter-
censual
growth rate
1979 3,415 627 187 77 2.1%
1989 4,589 1,473 167 137 2.4%
1999 9,792 1,992 19.7 179 3.6%
2009 9,174 2,004 19.1 161 2.7%
23
3.4 Land Use in the Location
3.4.1 Agriculture
The most common livestock kept by residents of Temiyotta location are dairy and beef
cattle, goats, poultry and sheep, with milk, meat, hide and skin, wool and mutton as their
main products. The main crops grown in the area include: maize, beans, peas and Irish
Potatoes. Many residents cultivate Irish potatoes for commercial reasons (KARI, 2007).
Nakuru District Strategic Plan (2005) states that; the households of Temiyotta location
own an average farm size of 0.77Ha. Since the farm is small most of them purely rely on
subsistence agriculture, and therefore not likely to adopt agroforestry.
3.4.2 Vegetation Cover
The Vegetation in the location varies largely from grasslands with scattered trees in the
plains, to shrub land and forests in the hilly uplands. In the hilly areas, bamboo forests are
largely predominant. The vegetation around the rivers is mainly indigenous trees and
dense bush and shrubs. Previously, the area was largely covered by rich evergreen
forests, extending from the hills, and woodland in the plains (Mutangah, et al., 1993).
The location has witnessed land use changes consequent of the up-surging human
population and their associated activities. The former large scale farms have been
subdivided and allocated to small scale farmers. For instance, the large scale farms,
which produced wheat and dairy products on commercial basis, have been converted into
small arable and grazing plots through the land fragmentation process (DRSRS, 2010).
24
RESEARCH METHODOLOGY
3.5 Introduction
This section describes in detail the strategy that was used by the researcher in conducting
the research. It includes the following; research design, sampling and sampling
procedures, and description of research instruments, data collection and data analysis
procedures.
3.6 Study Design
Survey research design was used for this study, which involved sampling three out of
nine villages based on demographic and socio-economic factors and randomly picking
the households in the identified villages to collect data from the household heads, who
make decisions for the household, whereby the decision to plant or not to plant trees is
inclusive. The questions asked in the questionnaires were based on the study variables
(that is; annual income, household size, farm size, and education level) to lead to
responses that were analyzed to measure the study objectives and test the hypotheses.
3.7 Data Types and Sources
Primary and secondary data were used with an intention of meeting the research
objectives. Household information (Primary data) was obtained through the use of the
structured questionnaires administered to the heads of households, interview guides for
key informants and focus group discussions were used. Secondary data was obtained
from books, journals, articles, academic thesis and projects.
3.8 Target Population and Sampling Frame
The target population in this study is small scale farmers from Temiyotta location. The
location, which is the study area, is made of 3 sub locations and 9 villages with a total of
2,004 households and a population of 9,174 people Census (2009), from which household
heads were interviewed. Table 3.2 shows the sub locations and villages within the
location, also it shows how the population and households are distributed. The number of
households and population has been categorized according to villages.
25
Table 3.2: Population Distribution in the Location
Sub location Village No. of households Population
Ikumbi
Chemaner
Kamwaura
Sitoito
168
301
243
638
1,485
1,234
Cheptagum Banana
Tebere
Lelaitich
228
198
238
989
605
1,232
Murginye Mtimoja
Arimi
Chepkenoiywo
209
154
265
1,108
798
1085
Total:3 Sub
locations
9 Villages 2,004 9,174
Source: Census (2009).
3.9 Sampling Procedure and Sample selection
Temiyotta location was purposively sampled and selected from other locations in Nakuru
County because the researcher has prior knowledge concerning the administrative and
location of the study area better than other locations. Stratified sampling was used to
place the respondents (household heads) into their respective geographical areas, i.e.
villages. The villages in Temiyotta location were listed according to their respective sub
locations as shown in table 3.2. A sample of three villages was randomly picked, one
village from each sub location. This was done by writing the names of the villages
according to their sub location on separate small pieces of paper which were folded then
put in a hat, and then one was picked from each sub location. The three randomly drawn
villages were; Sitoito (243 households), Tebere (198 households) and Arimi (154
households) which have a total of 595 households (target population). In this study, a
sample size of 86 household heads was obtained (14% of the total households). This size
was got by the following formula, recommended by Nassiuma (2000).
n = (NCv2) / (Cv2 + (N - 1) e 2)
Where; n = the desired sample size,
N = Target population (595)
Cv = Coefficient of variation (take 0.5)
e = Tolerance at desired level of confidence (0.05) at 95% confidence level.

26
n = (595x0.52) ÷ (0.52+ (595-1) 0.052)
n = 86
The study used a sample size of 86 households with a proportionate distribution of
households from every village as shown in Table 3.2 below;
Table 3.3: Sample Size and Sampling of the Households
Source: Fieldwork (2017).
Once the strata was established and the sample size from each stratum (village)
determined, the researcher sourced a list from the sub chief’s offices of the respective
villages from which the household heads were picked using systematic sampling. A
sampling interval (K = 7) was established by dividing the target population (595
households) by the sample size (86). A sampling starting point was established by folding
N papers as per the sample size in every stratum (village) then one was randomly picked.
The subsequent households to be interviewed were obtained by adding the sampling
interval (K=7) to the household that has been interviewed (Kothari, 2004). The
household heads selected for the study were derived from the lists that were obtained at
the Sub chiefs offices of the respective villages showing the number and names of the
household heads.
The focus group discussions and the key informant interviews were also conducted. The
number of key informants’ who were interviewed are four. They are; A Community
Based Organization (CBO) leader, local area administration Chief, a Rural forest officer
from the area and a women leader. The 4 key informants mentioned above were
purposively identified and interviewed based on the fact that they are knowledgeable on
Sub
Location
Selected
Villages
No. of
Households
Selected no. of
Households (n)
Response Rate
Ikumbi Sitoito 243 41 47.7%
Cheptagum Tebere 198 28 32.6%
Murginye Arimi 154 17 19.7%
Total 595 86 100%
27
social economic and agroforestry issues which affect Temiyotta location. They were
asked to discuss on the challenges they encounter while promoting agroforestry and also
to explain the kind of support they give to the farmers. Three focus group discussions
were as well conducted, one from each village named on table 3.3 above. The
composition of the focus group discussions purely comprised of; a group of men, a group
of women and that of youth. They gave information on the challenges farmers undergo as
far as agroforestry adoption is concerned.
3.10 Data Collection Instruments
Primary data for this study was collected through administration of questionnaires to the
Household heads. The questionnaire comprised of queries linked to the variables of the
study as shown in the study objectives. These variables are: respondents’ annual income,
the household size, education level of the household head, respondents’ farm size
(independent variables) and agroforestry adoption (dependent variable). On the other
hand the researcher used observations on the respondents’ farms, this helps to support
data collected through questionnaires. The questions were structured to collect data on
the socio-economic factors that affect agroforestry, identify the agroforestry technologies
practiced in the area, and as well assess the level of awareness on agroforestry within the
location.
A Camera was used to capture some important features relevant to the objectives of the
study as at the time of the field survey such as; agroforestry technologies practiced by the
respondents. The questionnaire for focus group discussions was structured in such a way
that it captured on key issues with regard to agroforestry adoption in Temiyotta location.
Such as; the influence of socio-economic factors on agroforestry adoption. The key
informant interview guides were designed in a manner that information relevant to the
study was obtained, such as; agroforestry awareness efforts by extension officers,
Community Based Organizations (CBOs), Non-Governmental Organizations (NGOs).
Secondary data was generated from the following sources; books, journals, articles,
academic thesis and projects to back-up primary sources.
28
3.11 Data Processing and Analyzes
Questionnaires were designed in such a way that vital statistics on the responses was
sought, and it included variables such as; the annual income of the respondents, their
household sizes, their education level, respondents contact with extension services, farm
size of the respondents (Independent variables), and agroforestry adoption (Dependent
variable). Descriptive and inferential statistical techniques were used to analyze data.
Descriptive statistics of percentages and frequency tables were calculated for each
variable in relation to agroforestry adoption in Temiyotta location. The Data was then
further analyzed using chi square statistics. The Chi square technique was used to test the
association between the dependent variable and the independent variables. The Chi
square analysis used the formulae of observed and expected values (shown below) to
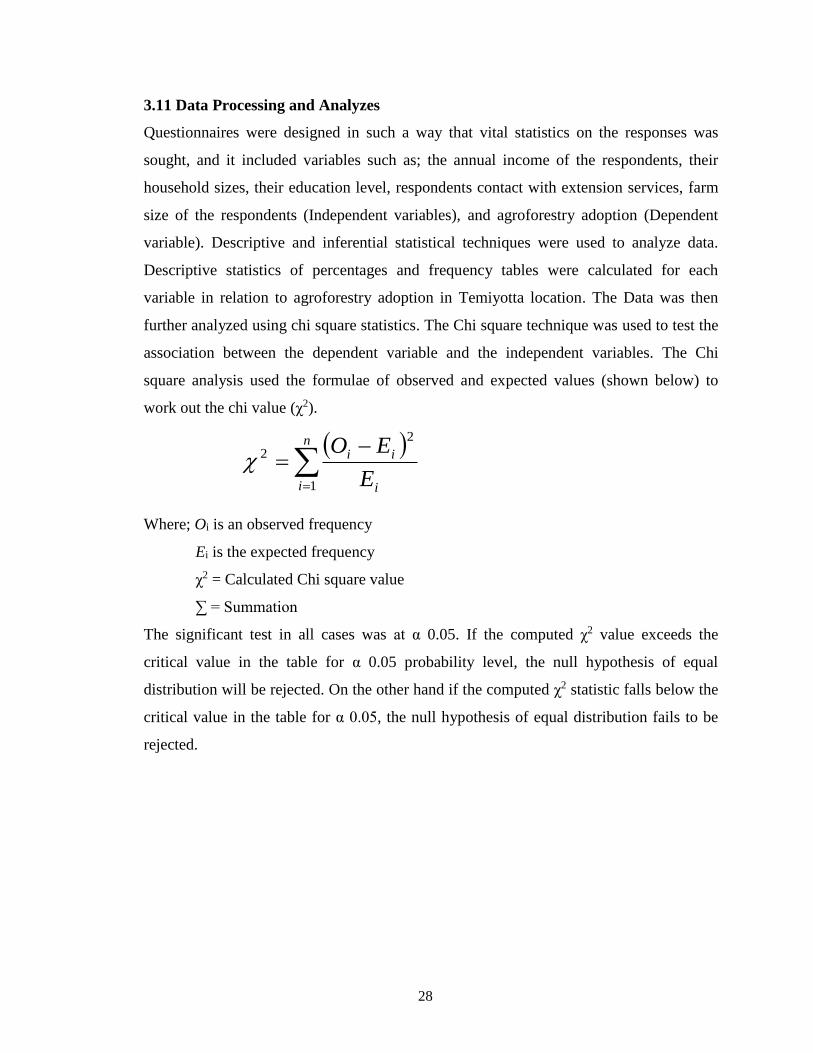
work out the chi value (χ2).
n
i i
ii
E
EO
1
2
2
Where; Oi is an observed frequency
Ei is the expected frequency
χ2 = Calculated Chi square value
∑ = Summation
The significant test in all cases was at α 0.05. If the computed χ2 value exceeds the
critical value in the table for α 0.05 probability level, the null hypothesis of equal
distribution will be rejected. On the other hand if the computed χ2 statistic falls below the
critical value in the table for α 0.05, the null hypothesis of equal distribution fails to be
rejected.
29
CHAPTER FOUR
RESULTS AND DISCUSSION
4.1 Introduction
This chapter covers data analysis, presentation and interpretation of the results. The
information has been presented in form of narration with aid of tables and numerical
figures for clarification. Chi-square was used to determine statistical significance
between the study variables. The chapter also gives conclusion of the study,
recommendations and ends with a summary.
4.2 Questionnaire Response Rate
The questionnaire response rate was 100% which means that all the 86 respondents
answered the 86 questionnaires. The 100% response rate was because the questionnaires
were administered by trained research assistants through interviews in Temiyotta
location, Nakuru County.
4.3 Social and Economic Characteristic
Three villages were covered. The findings are indicated in the Table 4.1 and figure 4.1.
Table 4.1: Name of the Village
Name of the Village Frequency Percent (%)
Tebere 29 33.7
Arimi 16 18.6
Sitoito 41 47.7
Total 86 100
Source: Fieldwork (2017).
30
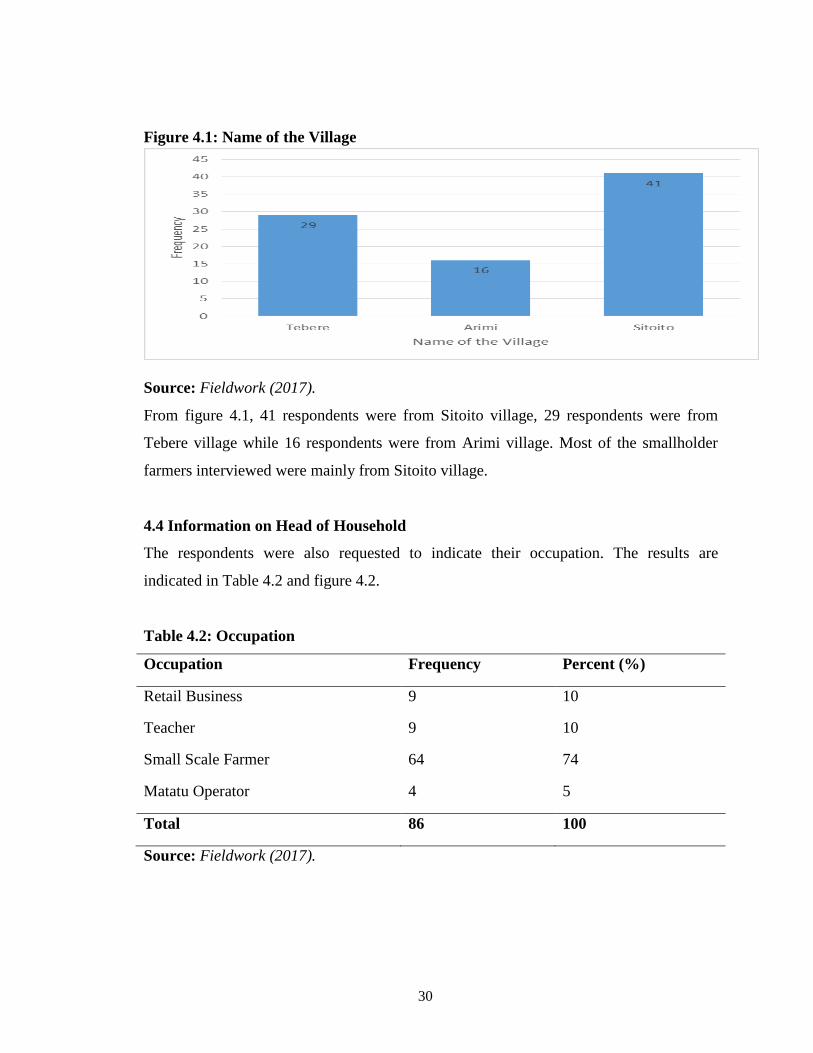
Figure 4.1: Name of the Village
Source: Fieldwork (2017).
From figure 4.1, 41 respondents were from Sitoito village, 29 respondents were from
Tebere village while 16 respondents were from Arimi village. Most of the smallholder
farmers interviewed were mainly from Sitoito village.
4.4 Information on Head of Household
The respondents were also requested to indicate their occupation. The results are
indicated in Table 4.2 and figure 4.2.
Table 4.2: Occupation
Occupation Frequency Percent (%)
Retail Business 9 10
Teacher 9 10
Small Scale Farmer 64 74
Matatu Operator 4 5
Total 86 100
Source: Fieldwork (2017).
31
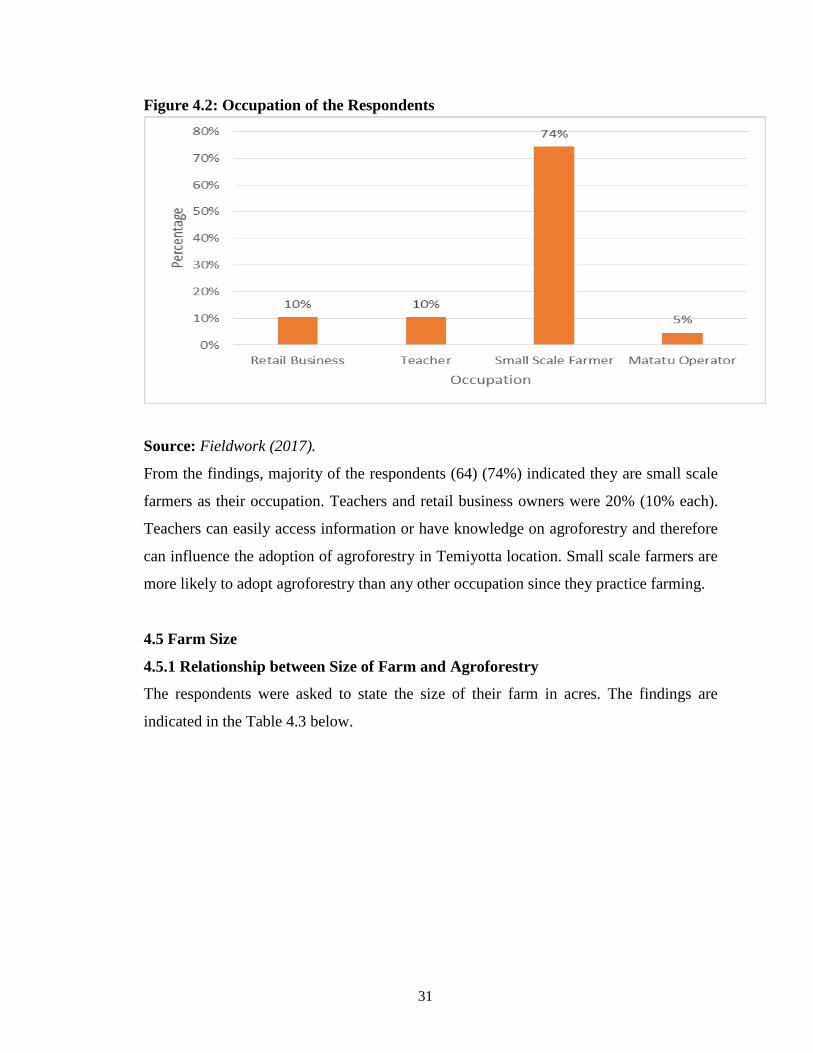
Figure 4.2: Occupation of the Respondents
Source: Fieldwork (2017).
From the findings, majority of the respondents (64) (74%) indicated they are small scale
farmers as their occupation. Teachers and retail business owners were 20% (10% each).
Teachers can easily access information or have knowledge on agroforestry and therefore
can influence the adoption of agroforestry in Temiyotta location. Small scale farmers are
more likely to adopt agroforestry than any other occupation since they practice farming.
4.5 Farm Size
4.5.1 Relationship between Size of Farm and Agroforestry
The respondents were asked to state the size of their farm in acres. The findings are
indicated in the Table 4.3 below.
32
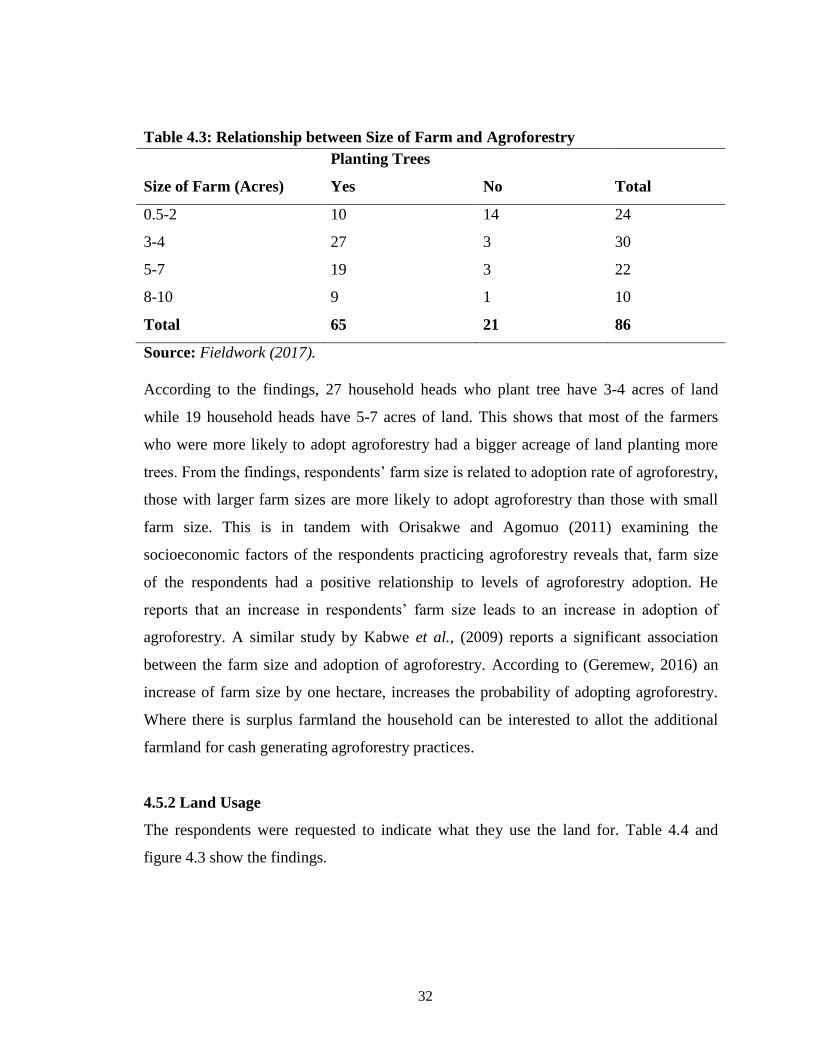
Table 4.3: Relationship between Size of Farm and Agroforestry
Planting Trees
Size of Farm (Acres) Yes No Total
0.5-2 10 14 24
3-4 27 3 30
5-7 19 3 22
8-10 9 1 10
Total 65 21 86
Source: Fieldwork (2017).
According to the findings, 27 household heads who plant tree have 3-4 acres of land
while 19 household heads have 5-7 acres of land. This shows that most of the farmers
who were more likely to adopt agroforestry had a bigger acreage of land planting more
trees. From the findings, respondents’ farm size is related to adoption rate of agroforestry,
those with larger farm sizes are more likely to adopt agroforestry than those with small
farm size. This is in tandem with Orisakwe and Agomuo (2011) examining the
socioeconomic factors of the respondents practicing agroforestry reveals that, farm size
of the respondents had a positive relationship to levels of agroforestry adoption. He
reports that an increase in respondents’ farm size leads to an increase in adoption of
agroforestry. A similar study by Kabwe et al., (2009) reports a significant association
between the farm size and adoption of agroforestry. According to (Geremew, 2016) an
increase of farm size by one hectare, increases the probability of adopting agroforestry.
Where there is surplus farmland the household can be interested to allot the additional
farmland for cash generating agroforestry practices.
4.5.2 Land Usage
The respondents were requested to indicate what they use the land for. Table 4.4 and
figure 4.3 show the findings.
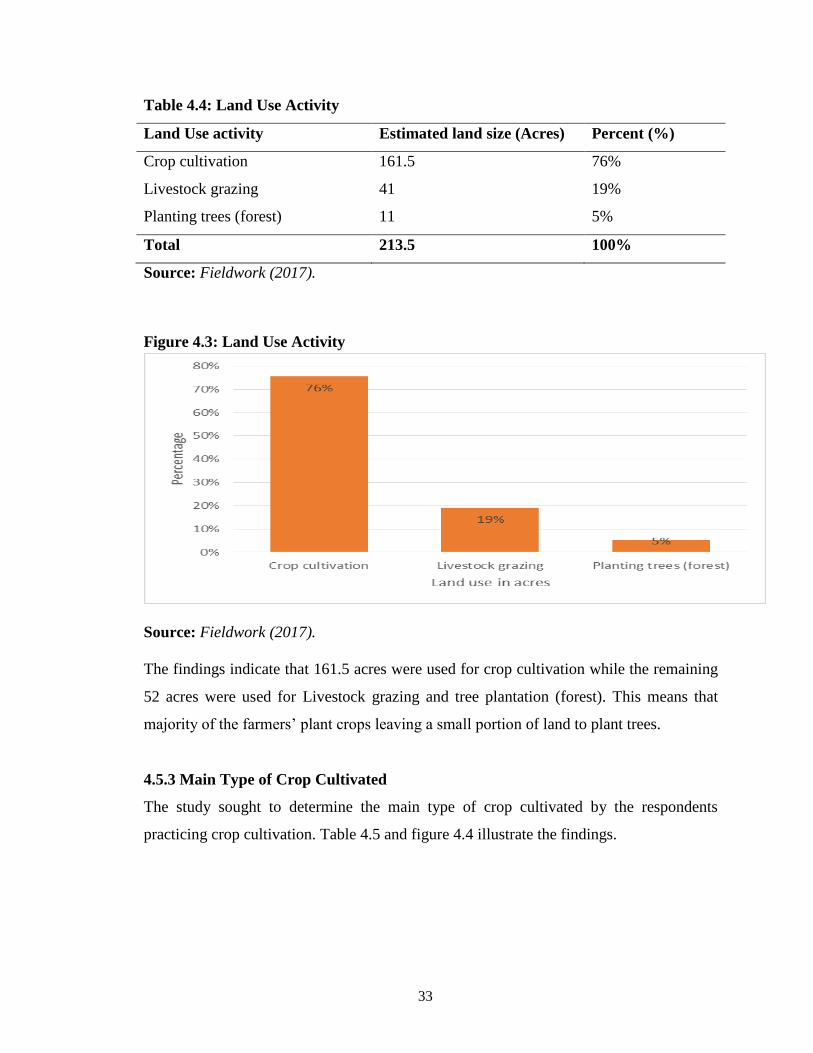
33
Table 4.4: Land Use Activity
Land Use activity Estimated land size (Acres) Percent (%)
Crop cultivation 161.5 76%
Livestock grazing 41 19%
Planting trees (forest) 11 5%
Total 213.5 100%
Source: Fieldwork (2017).
Figure 4.3: Land Use Activity
Source: Fieldwork (2017).
The findings indicate that 161.5 acres were used for crop cultivation while the remaining
52 acres were used for Livestock grazing and tree plantation (forest). This means that
majority of the farmers’ plant crops leaving a small portion of land to plant trees.
4.5.3 Main Type of Crop Cultivated
The study sought to determine the main type of crop cultivated by the respondents
practicing crop cultivation. Table 4.5 and figure 4.4 illustrate the findings.

34
Table 4.5: Main Type of Crop Cultivated
Land Use activity Estimated land size (acres) Percent (%)
Maize 121.125 75%
Irish Potatoes 30.685 19%
Peas 9.69 6%
Total 161.5 100%
Source: Fieldwork (2017).
Figure 4.4: Main Type of Crop Cultivated
Source: Fieldwork (2017).
As reflected in table 4.5 and figure 4.4, 121.125 acres (75%) of the total land size of the
respondents are used for maize production, while 19% was used to plant Irish potatoes.
Therefore, it can be indicated that maize was the main type of crop cultivated, out of the
121.125 acres of land owned by the respondents who were likely to adopt agroforestry.
4.5.4 Influence of Farm Size on Decision Making
The respondents were requested to state whether the size of farm influenced their
decision to plant/not to plant trees. The findings are presented in table 4.6.

35
Table 4.6: Influence of Farm Size on Decision Making
Influence of Farm Size on Decision Making Frequency Percent (%)
Yes 79 91.9
No 7 8.1
Total 86 100
Source: Fieldwork (2017).
According to the findings, 79 (91.9%) respondents revealed that the size of farm had an
influence on their decision to plant/not to plant trees while 7 (8.1%) indicated that the
size of farm did not influence their decision to plant or not to plant trees. As such, this
implies that the size of farm had an influence on their decision to plant or not to plant
trees.
How the size of the farm influence the farmers’ decision to plant or not to plant trees. The
findings are illustrated in Table 4.7 below.
Table 4.7: Mode of Influence
Mode of Influence Agreement Frequency Percent (%)
Farm too small to accommodate trees Agree 22 25.6
Disagree 61 70.9
Farm too big and trees are naturally
growing
Agree 5 5.8
Disagree 79 91.9
Utilized for cereals production and
grazing
Disagree 84 97.7
Trees interfere with mechanized farming
Agree
Agree
2 2.3
Disagree 82 95.3
Farm small hence trees supplement
income
Agree 55 64
Disagree 29 33.7
Total 86 100
Source: Fieldwork (2017).
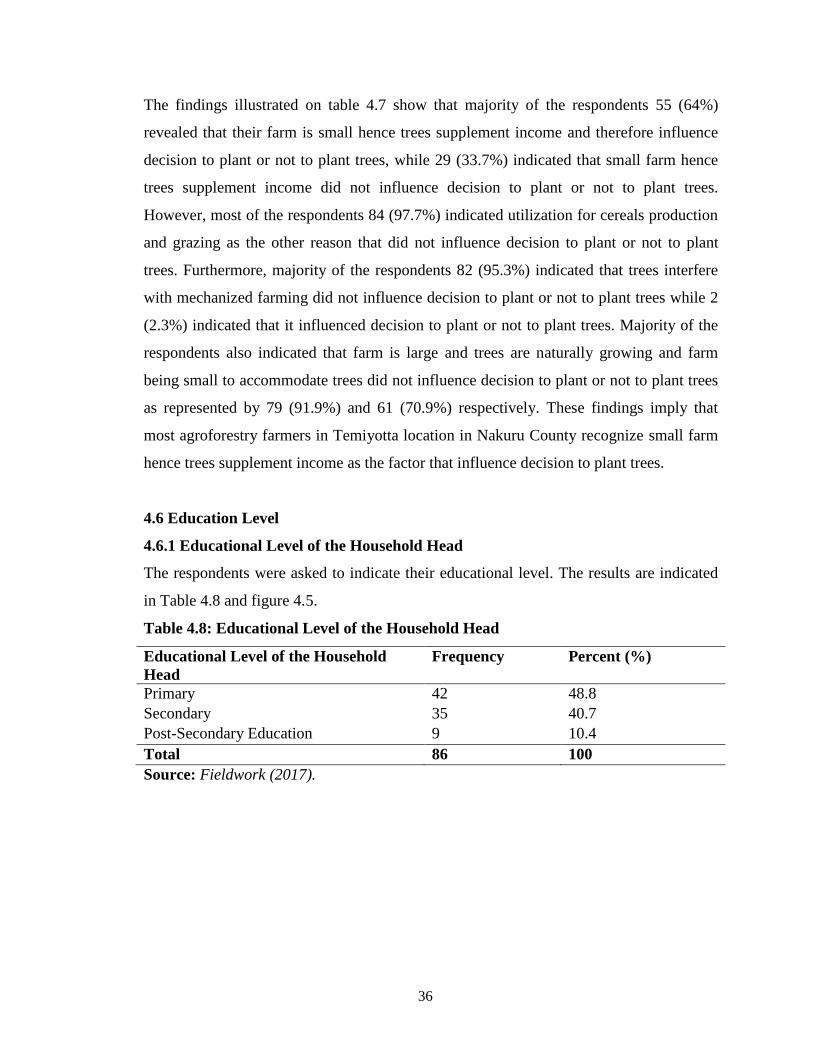
36
The findings illustrated on table 4.7 show that majority of the respondents 55 (64%)
revealed that their farm is small hence trees supplement income and therefore influence
decision to plant or not to plant trees, while 29 (33.7%) indicated that small farm hence
trees supplement income did not influence decision to plant or not to plant trees.
However, most of the respondents 84 (97.7%) indicated utilization for cereals production
and grazing as the other reason that did not influence decision to plant or not to plant
trees. Furthermore, majority of the respondents 82 (95.3%) indicated that trees interfere
with mechanized farming did not influence decision to plant or not to plant trees while 2
(2.3%) indicated that it influenced decision to plant or not to plant trees. Majority of the
respondents also indicated that farm is large and trees are naturally growing and farm
being small to accommodate trees did not influence decision to plant or not to plant trees
as represented by 79 (91.9%) and 61 (70.9%) respectively. These findings imply that
most agroforestry farmers in Temiyotta location in Nakuru County recognize small farm
hence trees supplement income as the factor that influence decision to plant trees.
4.6 Education Level
4.6.1 Educational Level of the Household Head
The respondents were asked to indicate their educational level. The results are indicated
in Table 4.8 and figure 4.5.
Table 4.8: Educational Level of the Household Head
Educational Level of the Household
Head
Frequency Percent (%)
Primary 42 48.8
Secondary 35 40.7
Post-Secondary Education 9 10.4
Total 86 100
Source: Fieldwork (2017).
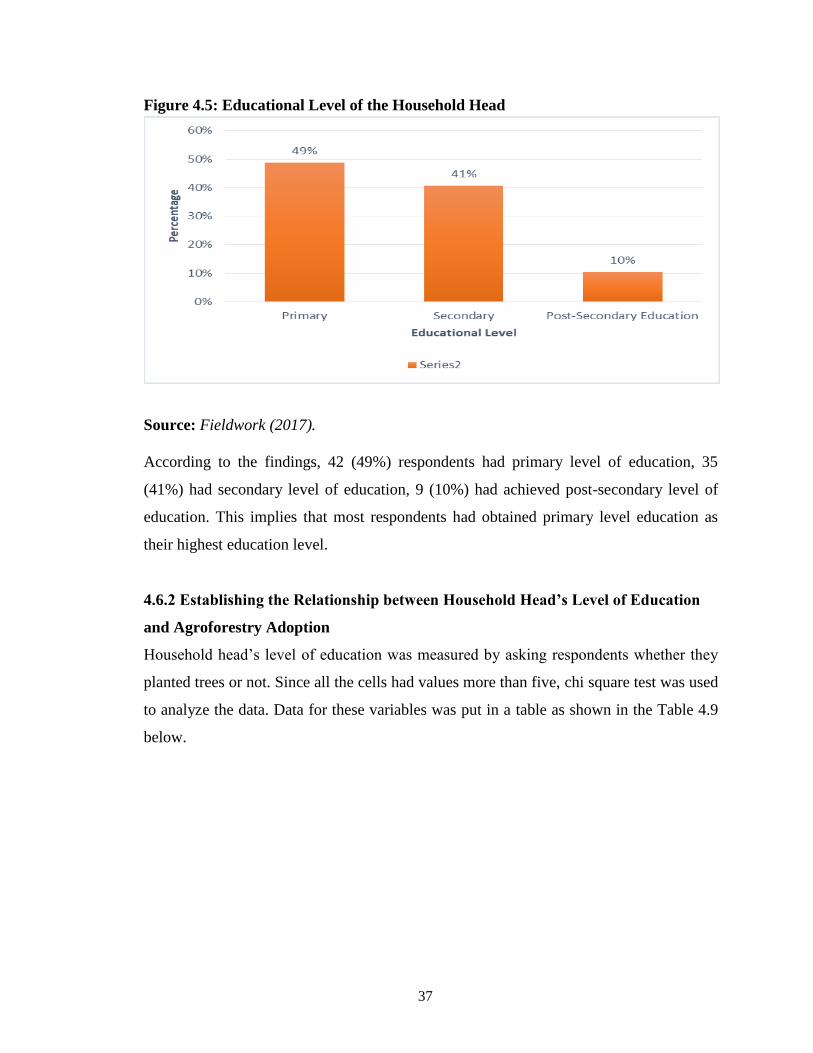
37
Figure 4.5: Educational Level of the Household Head
Source: Fieldwork (2017).
According to the findings, 42 (49%) respondents had primary level of education, 35
(41%) had secondary level of education, 9 (10%) had achieved post-secondary level of
education. This implies that most respondents had obtained primary level education as
their highest education level.
4.6.2 Establishing the Relationship between Household Head’s Level of Education
and Agroforestry Adoption
Household head’s level of education was measured by asking respondents whether they
planted trees or not. Since all the cells had values more than five, chi square test was used
to analyze the data. Data for these variables was put in a table as shown in the Table 4.9
below.
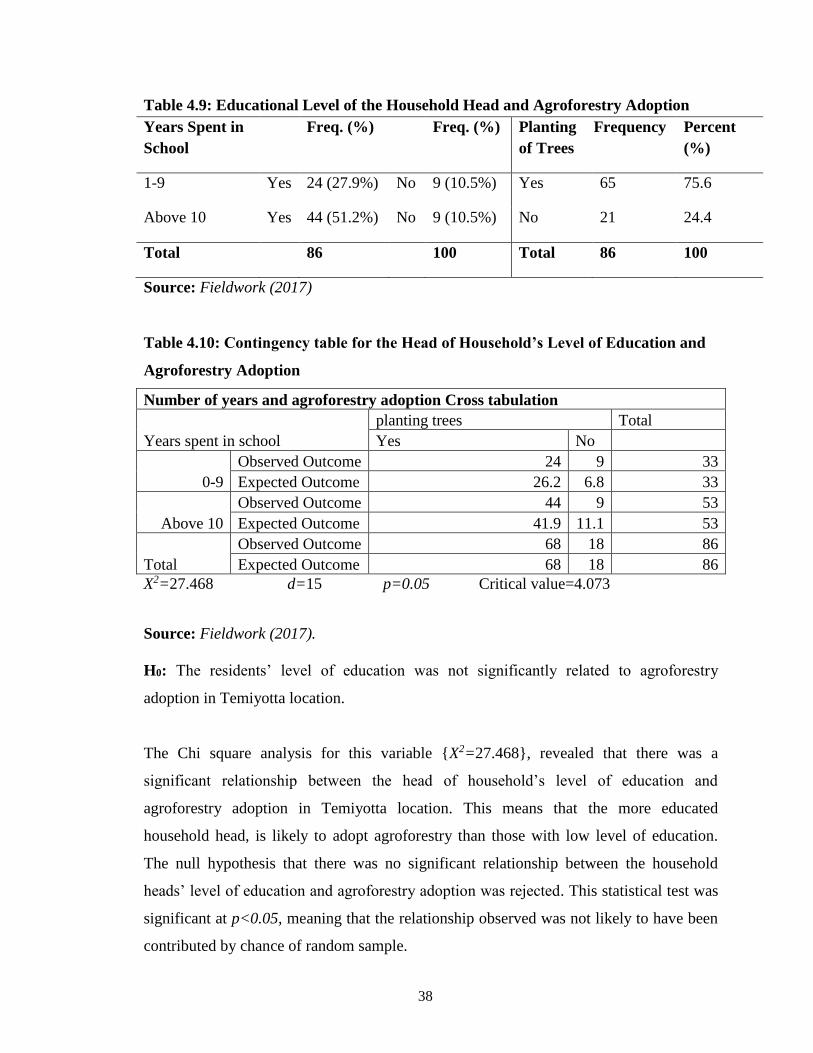
38
Table 4.9: Educational Level of the Household Head and Agroforestry Adoption
Years Spent in
School
Freq. (%) Freq. (%) Planting
of Trees
Frequency Percent
(%)
1-9 Yes 24 (27.9%) No 9 (10.5%) Yes 65 75.6
Above 10 Yes 44 (51.2%) No 9 (10.5%) No 21 24.4
Total 86 100 Total 86 100
Source: Fieldwork (2017)
Table 4.10: Contingency table for the Head of Household’s Level of Education and
Agroforestry Adoption
Number of years and agroforestry adoption Cross tabulation
Years spent in school
planting trees Total
Yes No
0-9
Observed Outcome 24 9 33
Expected Outcome 26.2 6.8 33
Above 10
Observed Outcome 44 9 53
Expected Outcome 41.9 11.1 53
Total
Observed Outcome 68 18 86
Expected Outcome 68 18 86
X2=27.468 d=15 p=0.05 Critical value=4.073
Source: Fieldwork (2017).
H0: The residents’ level of education was not significantly related to agroforestry
adoption in Temiyotta location.
The Chi square analysis for this variable {X2=27.468}, revealed that there was a
significant relationship between the head of household’s level of education and
agroforestry adoption in Temiyotta location. This means that the more educated
household head, is likely to adopt agroforestry than those with low level of education.
The null hypothesis that there was no significant relationship between the household
heads’ level of education and agroforestry adoption was rejected. This statistical test was
significant at p<0.05, meaning that the relationship observed was not likely to have been
contributed by chance of random sample.
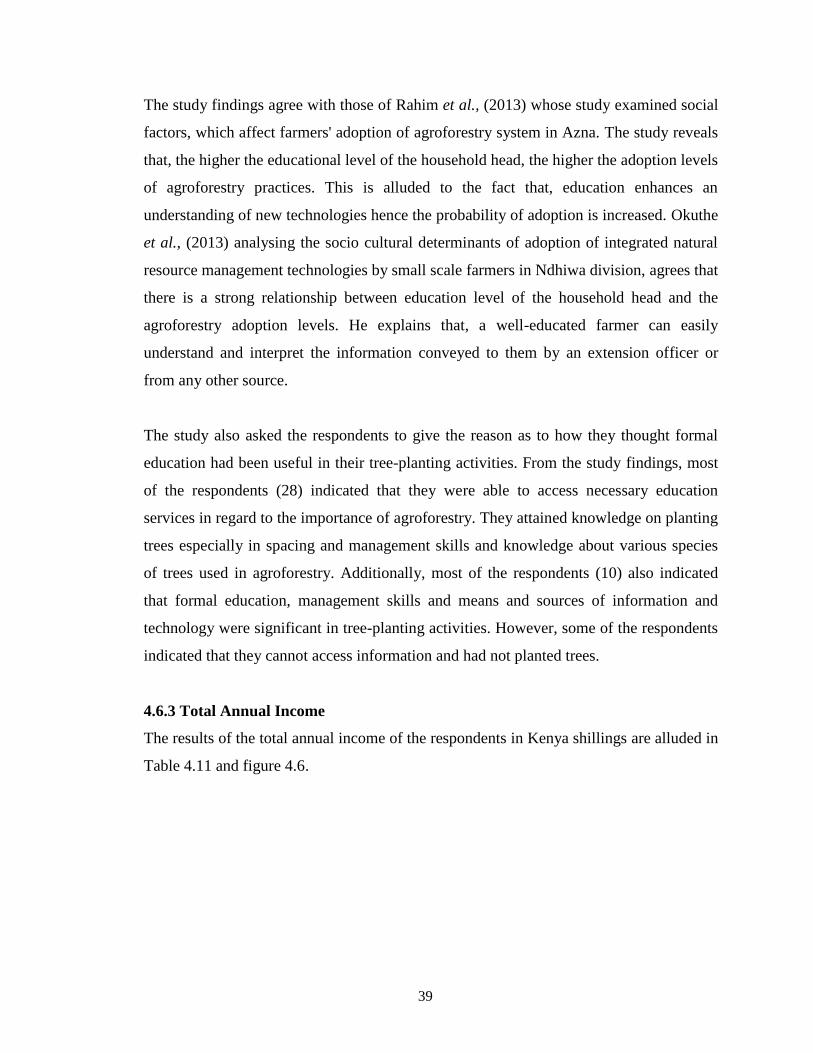
39
The study findings agree with those of Rahim et al., (2013) whose study examined social
factors, which affect farmers' adoption of agroforestry system in Azna. The study reveals
that, the higher the educational level of the household head, the higher the adoption levels
of agroforestry practices. This is alluded to the fact that, education enhances an
understanding of new technologies hence the probability of adoption is increased. Okuthe
et al., (2013) analysing the socio cultural determinants of adoption of integrated natural
resource management technologies by small scale farmers in Ndhiwa division, agrees that
there is a strong relationship between education level of the household head and the
agroforestry adoption levels. He explains that, a well-educated farmer can easily
understand and interpret the information conveyed to them by an extension officer or
from any other source.
The study also asked the respondents to give the reason as to how they thought formal
education had been useful in their tree-planting activities. From the study findings, most
of the respondents (28) indicated that they were able to access necessary education
services in regard to the importance of agroforestry. They attained knowledge on planting
trees especially in spacing and management skills and knowledge about various species
of trees used in agroforestry. Additionally, most of the respondents (10) also indicated
that formal education, management skills and means and sources of information and
technology were significant in tree-planting activities. However, some of the respondents
indicated that they cannot access information and had not planted trees.
4.6.3 Total Annual Income
The results of the total annual income of the respondents in Kenya shillings are alluded in
Table 4.11 and figure 4.6.
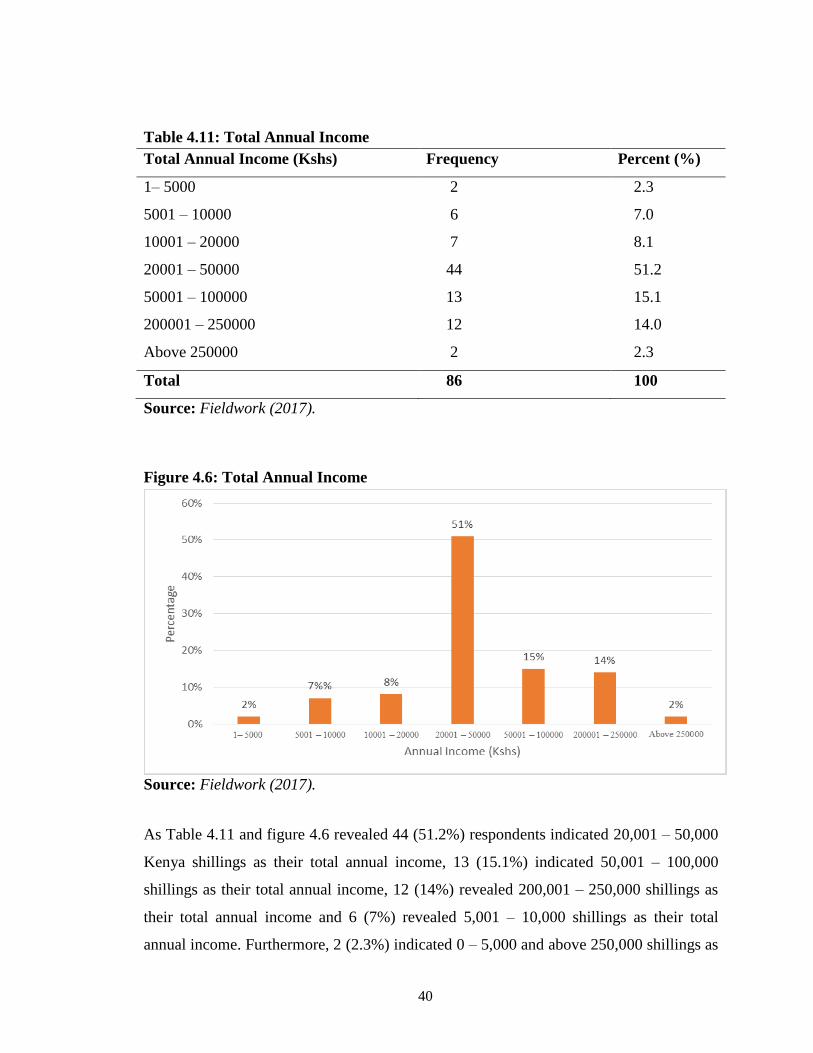
40
Table 4.11: Total Annual Income
Total Annual Income (Kshs) Frequency Percent (%)
1– 5000 2 2.3
5001 – 10000 6 7.0
10001 – 20000 7 8.1
20001 – 50000 44 51.2
50001 – 100000 13 15.1
200001 – 250000 12 14.0
Above 250000 2 2.3
Total 86 100
Source: Fieldwork (2017).
Figure 4.6: Total Annual Income
Source: Fieldwork (2017).
As Table 4.11 and figure 4.6 revealed 44 (51.2%) respondents indicated 20,001 – 50,000
Kenya shillings as their total annual income, 13 (15.1%) indicated 50,001 – 100,000
shillings as their total annual income, 12 (14%) revealed 200,001 – 250,000 shillings as
their total annual income and 6 (7%) revealed 5,001 – 10,000 shillings as their total
annual income. Furthermore, 2 (2.3%) indicated 0 – 5,000 and above 250,000 shillings as
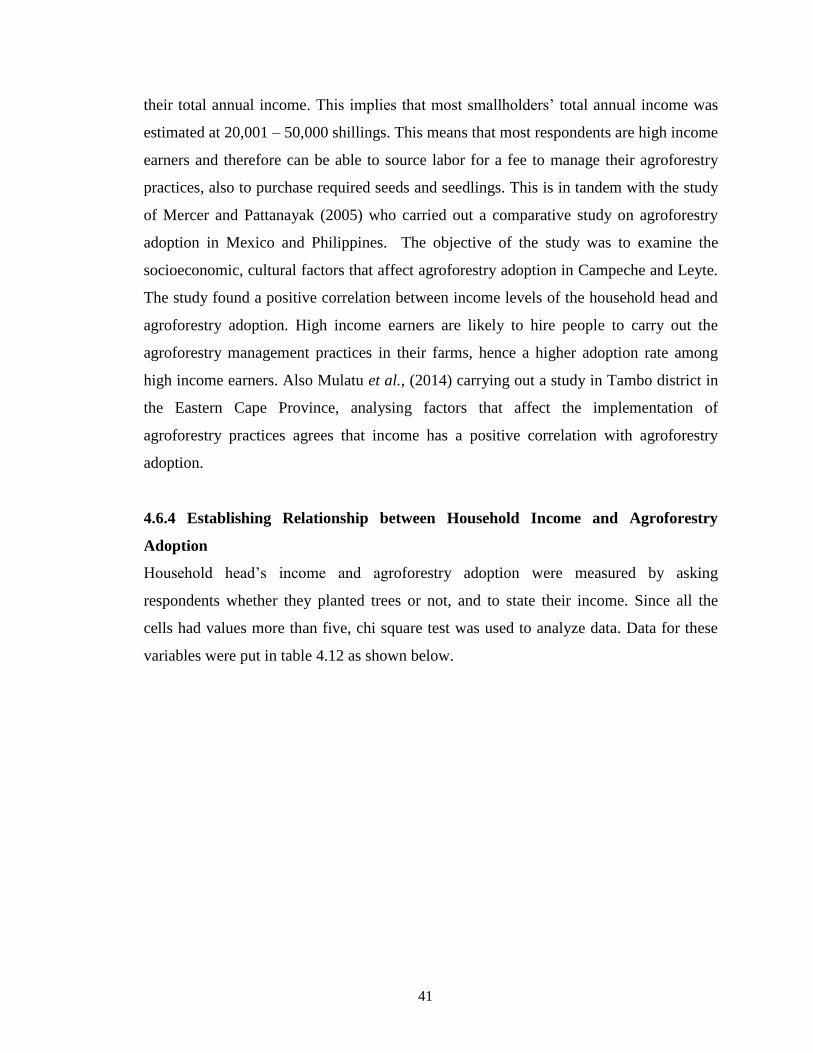
41
their total annual income. This implies that most smallholders’ total annual income was
estimated at 20,001 – 50,000 shillings. This means that most respondents are high income
earners and therefore can be able to source labor for a fee to manage their agroforestry
practices, also to purchase required seeds and seedlings. This is in tandem with the study
of Mercer and Pattanayak (2005) who carried out a comparative study on agroforestry
adoption in Mexico and Philippines. The objective of the study was to examine the
socioeconomic, cultural factors that affect agroforestry adoption in Campeche and Leyte.
The study found a positive correlation between income levels of the household head and
agroforestry adoption. High income earners are likely to hire people to carry out the
agroforestry management practices in their farms, hence a higher adoption rate among
high income earners. Also Mulatu et al., (2014) carrying out a study in Tambo district in
the Eastern Cape Province, analysing factors that affect the implementation of
agroforestry practices agrees that income has a positive correlation with agroforestry
adoption.
4.6.4 Establishing Relationship between Household Income and Agroforestry
Adoption
Household head’s income and agroforestry adoption were measured by asking
respondents whether they planted trees or not, and to state their income. Since all the
cells had values more than five, chi square test was used to analyze data. Data for these
variables were put in table 4.12 as shown below.
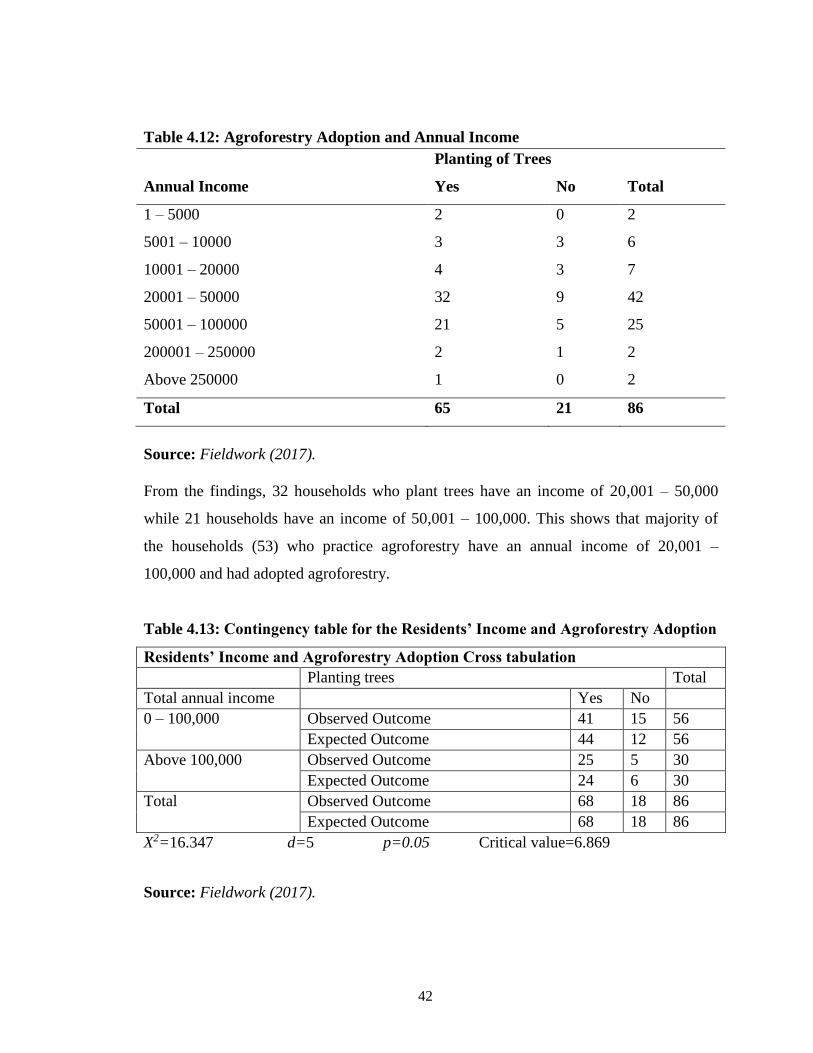
42
Table 4.12: Agroforestry Adoption and Annual Income
Planting of Trees
Annual Income Yes No Total
1 – 5000 2 0 2
5001 – 10000 3 3 6
10001 – 20000 4 3 7
20001 – 50000 32 9 42
50001 – 100000 21 5 25
200001 – 250000 2 1 2
Above 250000 1 0 2
Total 65 21 86
Source: Fieldwork (2017).
From the findings, 32 households who plant trees have an income of 20,001 – 50,000
while 21 households have an income of 50,001 – 100,000. This shows that majority of
the households (53) who practice agroforestry have an annual income of 20,001 –
100,000 and had adopted agroforestry.
Table 4.13: Contingency table for the Residents’ Income and Agroforestry Adoption
Residents’ Income and Agroforestry Adoption Cross tabulation
Planting trees Total
Total annual income Yes No
0 – 100,000 Observed Outcome 41 15 56
Expected Outcome 44 12 56
Above 100,000 Observed Outcome 25 5 30
Expected Outcome 24 6 30
Total Observed Outcome 68 18 86
Expected Outcome 68 18 86
X2=16.347 d=5 p=0.05 Critical value=6.869
Source: Fieldwork (2017).
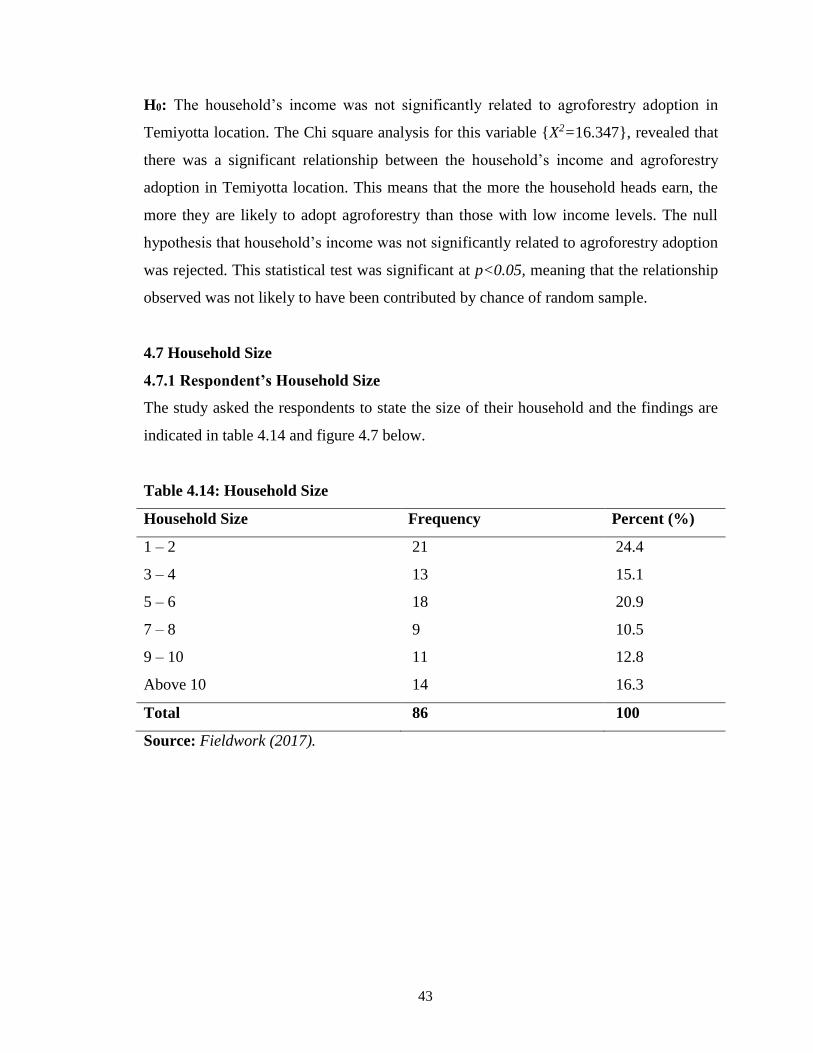
43
H0: The household’s income was not significantly related to agroforestry adoption in
Temiyotta location. The Chi square analysis for this variable {X2=16.347}, revealed that
there was a significant relationship between the household’s income and agroforestry
adoption in Temiyotta location. This means that the more the household heads earn, the
more they are likely to adopt agroforestry than those with low income levels. The null
hypothesis that household’s income was not significantly related to agroforestry adoption
was rejected. This statistical test was significant at p<0.05, meaning that the relationship
observed was not likely to have been contributed by chance of random sample.
4.7 Household Size
4.7.1 Respondent’s Household Size
The study asked the respondents to state the size of their household and the findings are
indicated in table 4.14 and figure 4.7 below.
Table 4.14: Household Size
Household Size Frequency Percent (%)
1 – 2 21 24.4
3 – 4 13 15.1
5 – 6 18 20.9
7 – 8 9 10.5
9 – 10 11 12.8
Above 10 14 16.3
Total 86 100
Source: Fieldwork (2017).
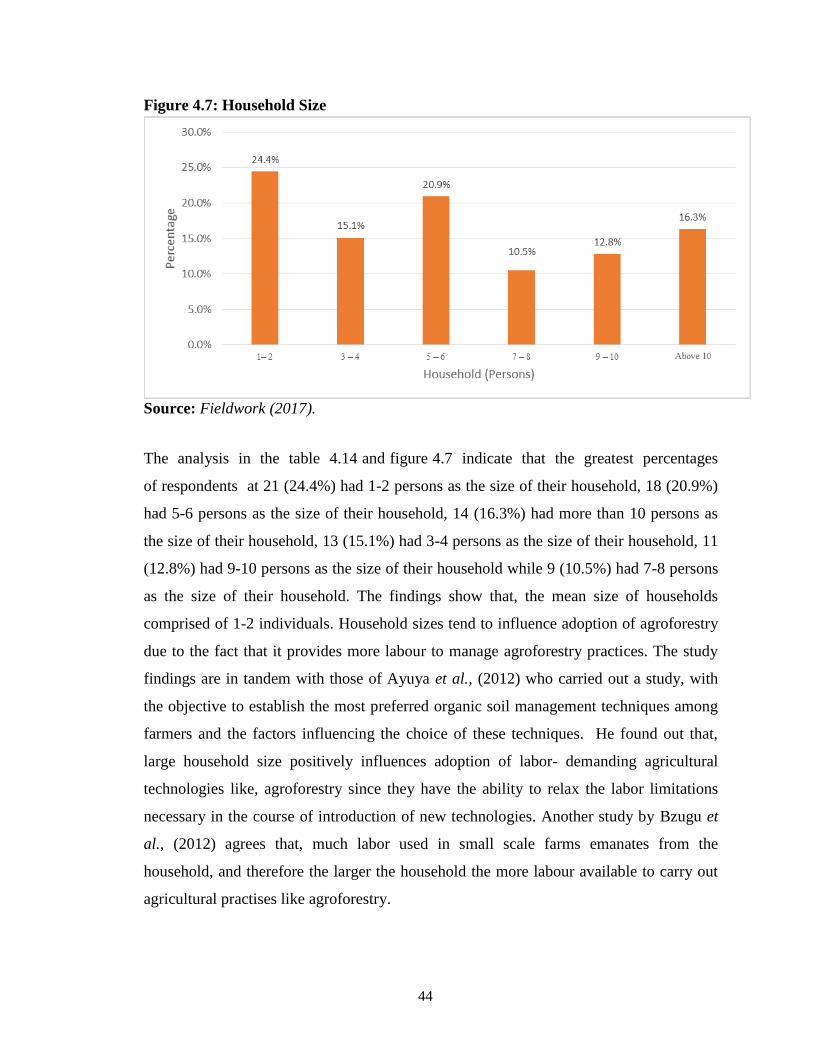
44
Figure 4.7: Household Size
Source: Fieldwork (2017).
The analysis in the table 4.14 and figure 4.7 indicate that the greatest percentages
of respondents at 21 (24.4%) had 1-2 persons as the size of their household, 18 (20.9%)
had 5-6 persons as the size of their household, 14 (16.3%) had more than 10 persons as
the size of their household, 13 (15.1%) had 3-4 persons as the size of their household, 11
(12.8%) had 9-10 persons as the size of their household while 9 (10.5%) had 7-8 persons
as the size of their household. The findings show that, the mean size of households
comprised of 1-2 individuals. Household sizes tend to influence adoption of agroforestry
due to the fact that it provides more labour to manage agroforestry practices. The study
findings are in tandem with those of Ayuya et al., (2012) who carried out a study, with
the objective to establish the most preferred organic soil management techniques among
farmers and the factors influencing the choice of these techniques. He found out that,
large household size positively influences adoption of labor- demanding agricultural
technologies like, agroforestry since they have the ability to relax the labor limitations
necessary in the course of introduction of new technologies. Another study by Bzugu et
al., (2012) agrees that, much labor used in small scale farms emanates from the
household, and therefore the larger the household the more labour available to carry out
agricultural practises like agroforestry.
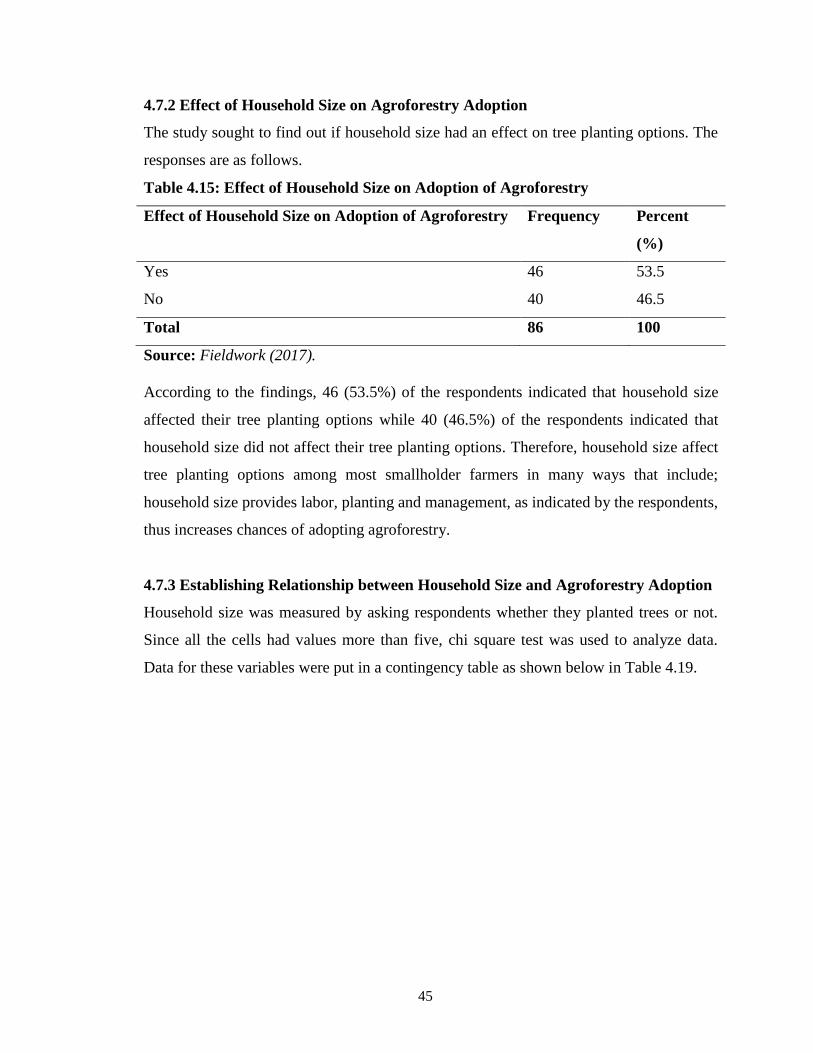
45
4.7.2 Effect of Household Size on Agroforestry Adoption
The study sought to find out if household size had an effect on tree planting options. The
responses are as follows.
Table 4.15: Effect of Household Size on Adoption of Agroforestry
Effect of Household Size on Adoption of Agroforestry Frequency Percent
(%)
Yes 46 53.5
No 40 46.5
Total 86 100
Source: Fieldwork (2017).
According to the findings, 46 (53.5%) of the respondents indicated that household size
affected their tree planting options while 40 (46.5%) of the respondents indicated that
household size did not affect their tree planting options. Therefore, household size affect
tree planting options among most smallholder farmers in many ways that include;
household size provides labor, planting and management, as indicated by the respondents,
thus increases chances of adopting agroforestry.
4.7.3 Establishing Relationship between Household Size and Agroforestry Adoption
Household size was measured by asking respondents whether they planted trees or not.
Since all the cells had values more than five, chi square test was used to analyze data.
Data for these variables were put in a contingency table as shown below in Table 4.19.

46
Table 4.16: Household Size
Tree Plantation Total
Household Size Yes No
1 – 2 4 2 6
3 – 4 13 3 16
5 – 6 23 2 25
7 – 8 21 6 27
9 – 10 4 3 7
Above 10 0 5 5
Total 65 21 86
Source: Fieldwork (2017).
Table 4.17: Contingency table for the size of Household and Agroforestry Adoption
Contingency table for the size of Household and Agroforestry Adoption
Size of Household
Planting trees
Total Yes No
1– 4
Observed Outcome 22 11 33
Expected Outcome 26.1 6.9 48
Above 5
Observed Outcome 46 7 52
Expected Outcome 42 11 48
Total
Observed Outcome 68 18 86
Expected Outcome 68 18 86
X2=15.001 d=3 p=0.05 Critical value=12.924
Source: Fieldwork (2017).
H0: The size of household was not significantly related to agroforestry adoption in
Temiyotta location.
The Chi square analysis for this variable {X2=15.001}, revealed that there was a
significant relationship between the size of household and agroforestry adoption in
Temiyotta location. This means that the larger the household size, the more likely they
are to adopt agroforestry than those with small household size. The null hypothesis that
the size of household was not significantly related to agroforestry adoption was rejected.
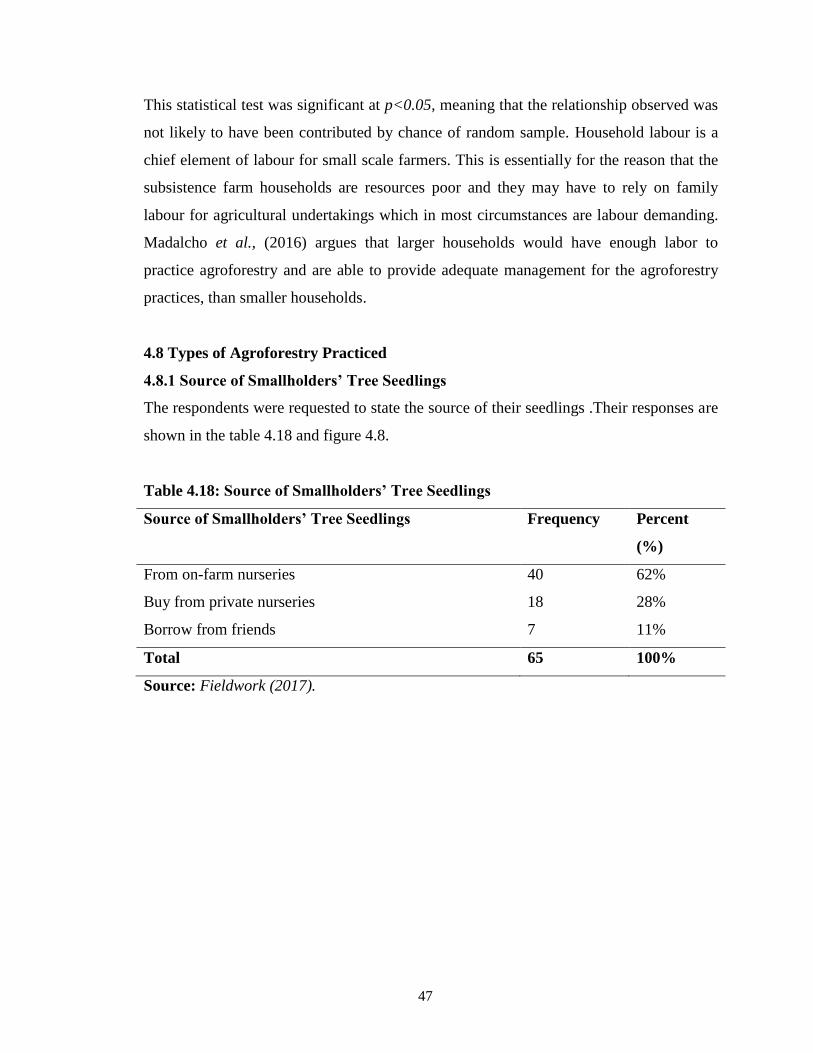
47
This statistical test was significant at p<0.05, meaning that the relationship observed was
not likely to have been contributed by chance of random sample. Household labour is a
chief element of labour for small scale farmers. This is essentially for the reason that the
subsistence farm households are resources poor and they may have to rely on family
labour for agricultural undertakings which in most circumstances are labour demanding.
Madalcho et al., (2016) argues that larger households would have enough labor to
practice agroforestry and are able to provide adequate management for the agroforestry
practices, than smaller households.
4.8 Types of Agroforestry Practiced
4.8.1 Source of Smallholders’ Tree Seedlings
The respondents were requested to state the source of their seedlings .Their responses are
shown in the table 4.18 and figure 4.8.
Table 4.18: Source of Smallholders’ Tree Seedlings
Source of Smallholders’ Tree Seedlings Frequency Percent
(%)
From on-farm nurseries 40 62%
Buy from private nurseries 18 28%
Borrow from friends 7 11%
Total 65 100%
Source: Fieldwork (2017).
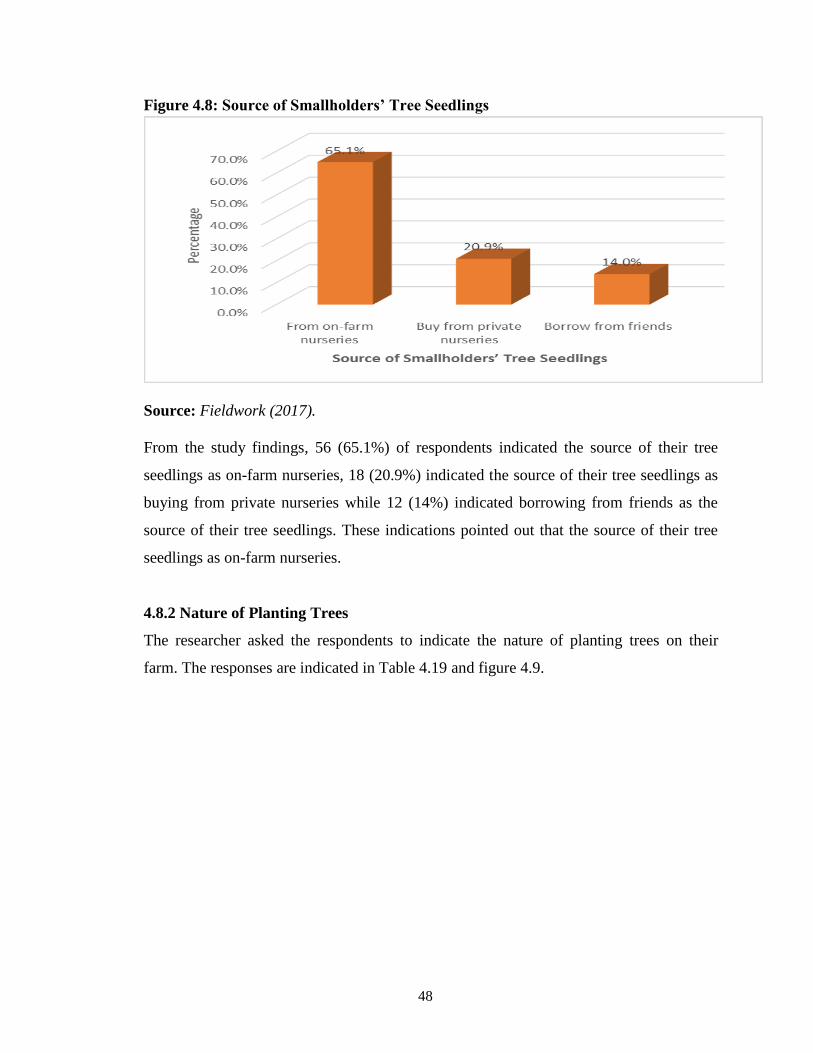
48
Figure 4.8: Source of Smallholders’ Tree Seedlings
Source: Fieldwork (2017).
From the study findings, 56 (65.1%) of respondents indicated the source of their tree
seedlings as on-farm nurseries, 18 (20.9%) indicated the source of their tree seedlings as
buying from private nurseries while 12 (14%) indicated borrowing from friends as the
source of their tree seedlings. These indications pointed out that the source of their tree
seedlings as on-farm nurseries.
4.8.2 Nature of Planting Trees
The researcher asked the respondents to indicate the nature of planting trees on their
farm. The responses are indicated in Table 4.19 and figure 4.9.
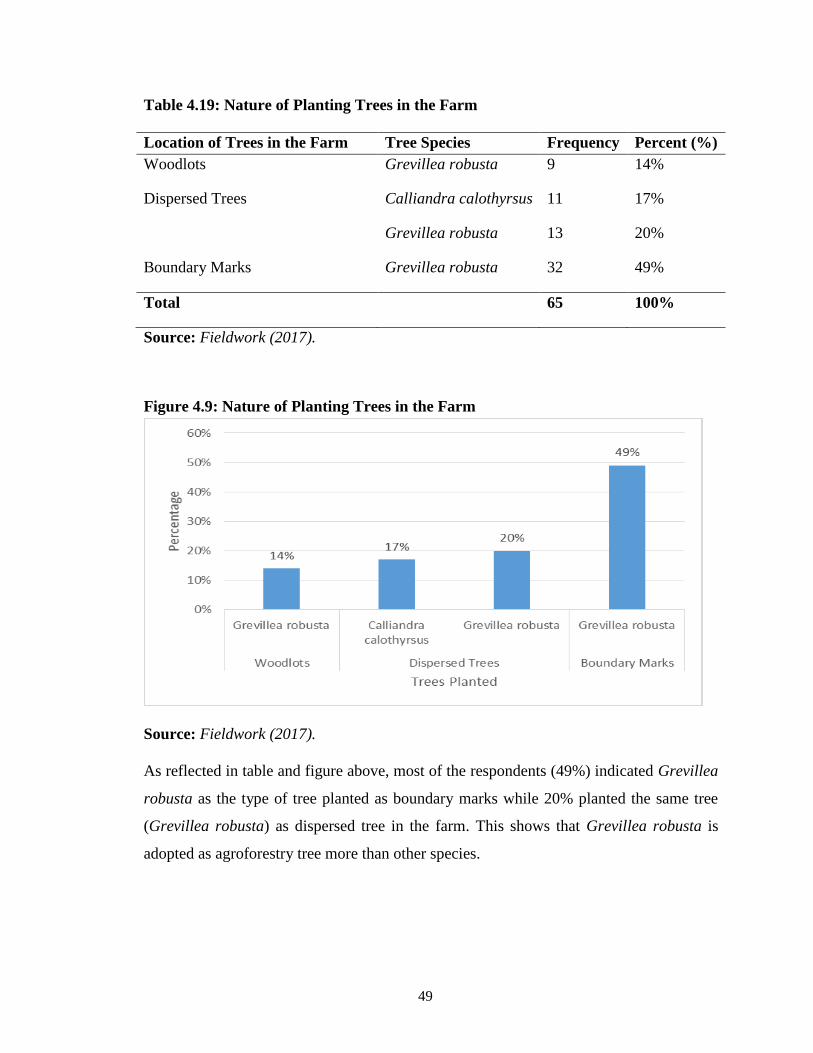
49
Table 4.19: Nature of Planting Trees in the Farm
Location of Trees in the Farm Tree Species Frequency Percent (%)
Woodlots Grevillea robusta 9 14%
Dispersed Trees Calliandra calothyrsus 11 17%
Grevillea robusta 13 20%
Boundary Marks Grevillea robusta 32 49%
Total 65 100%
Source: Fieldwork (2017).
Figure 4.9: Nature of Planting Trees in the Farm
Source: Fieldwork (2017).
As reflected in table and figure above, most of the respondents (49%) indicated Grevillea
robusta as the type of tree planted as boundary marks while 20% planted the same tree
(Grevillea robusta) as dispersed tree in the farm. This shows that Grevillea robusta is
adopted as agroforestry tree more than other species.
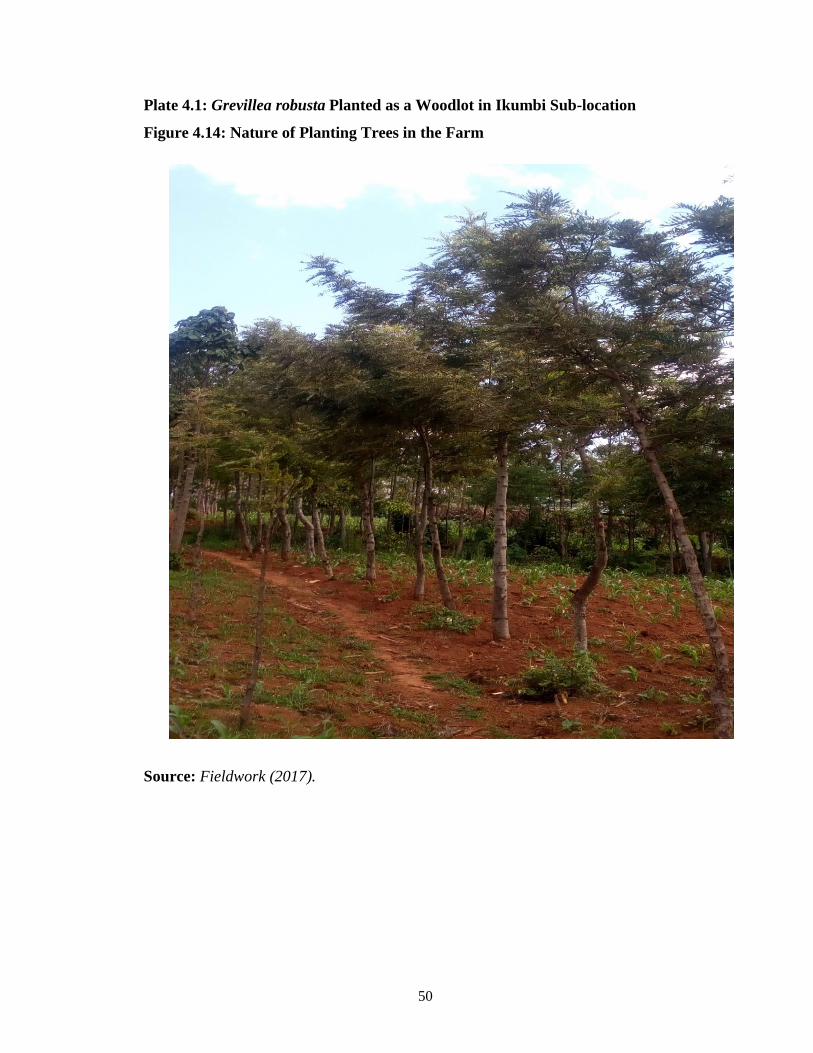
50
Plate 4.1: Grevillea robusta Planted as a Woodlot in Ikumbi Sub-location
Figure 4.14: Nature of Planting Trees in the Farm
Source: Fieldwork (2017).
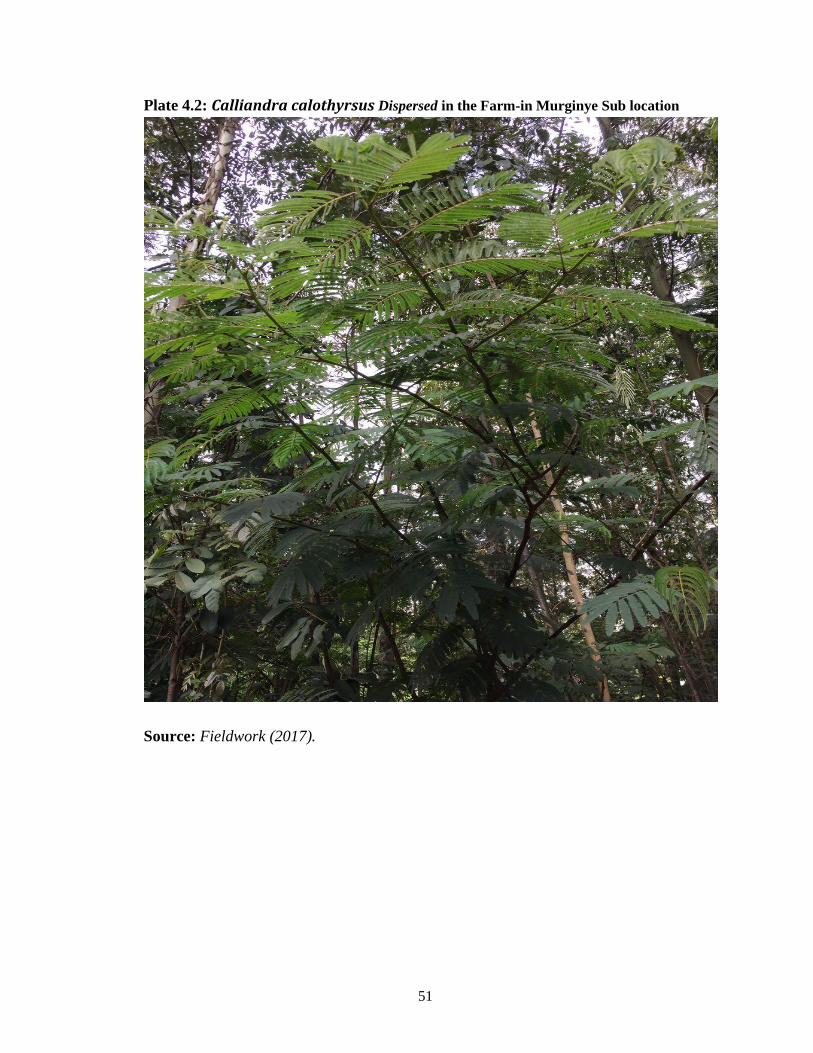
51
Plate 4.2: Calliandra calothyrsus Dispersed in the Farm-in Murginye Sub location
Source: Fieldwork (2017).
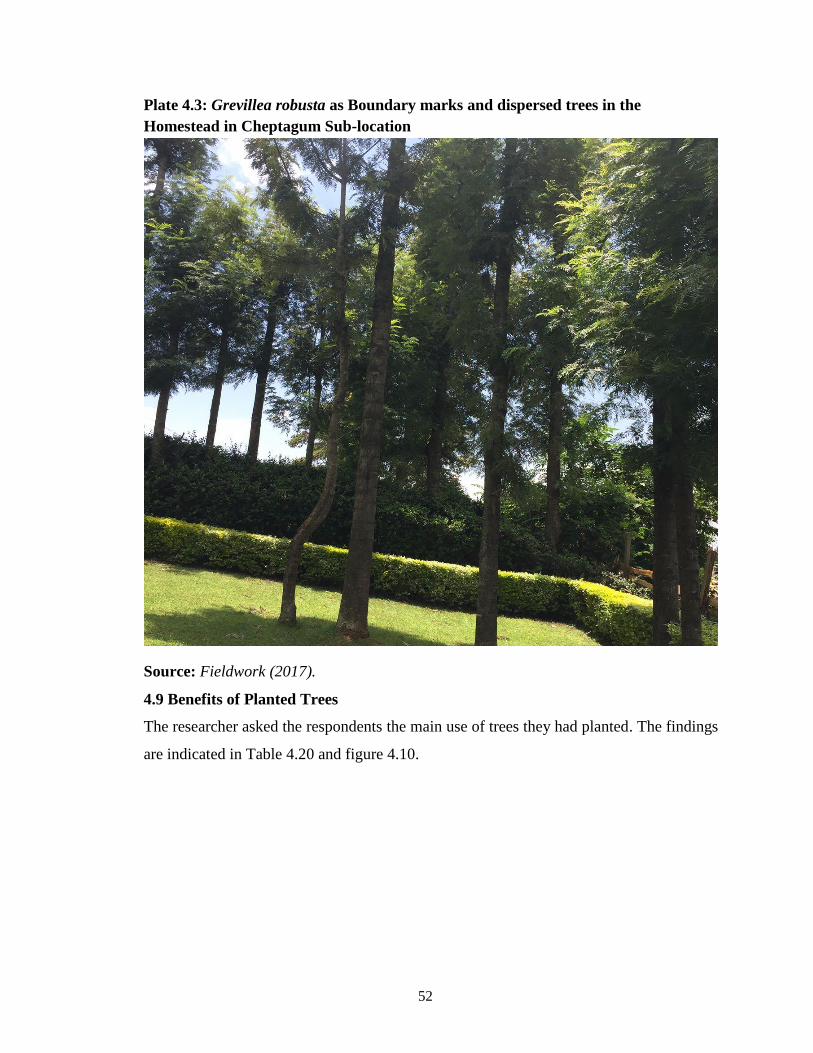
52
Plate 4.3: Grevillea robusta as Boundary marks and dispersed trees in the
Homestead in Cheptagum Sub-location
Source: Fieldwork (2017).
4.9 Benefits of Planted Trees
The researcher asked the respondents the main use of trees they had planted. The findings
are indicated in Table 4.20 and figure 4.10.
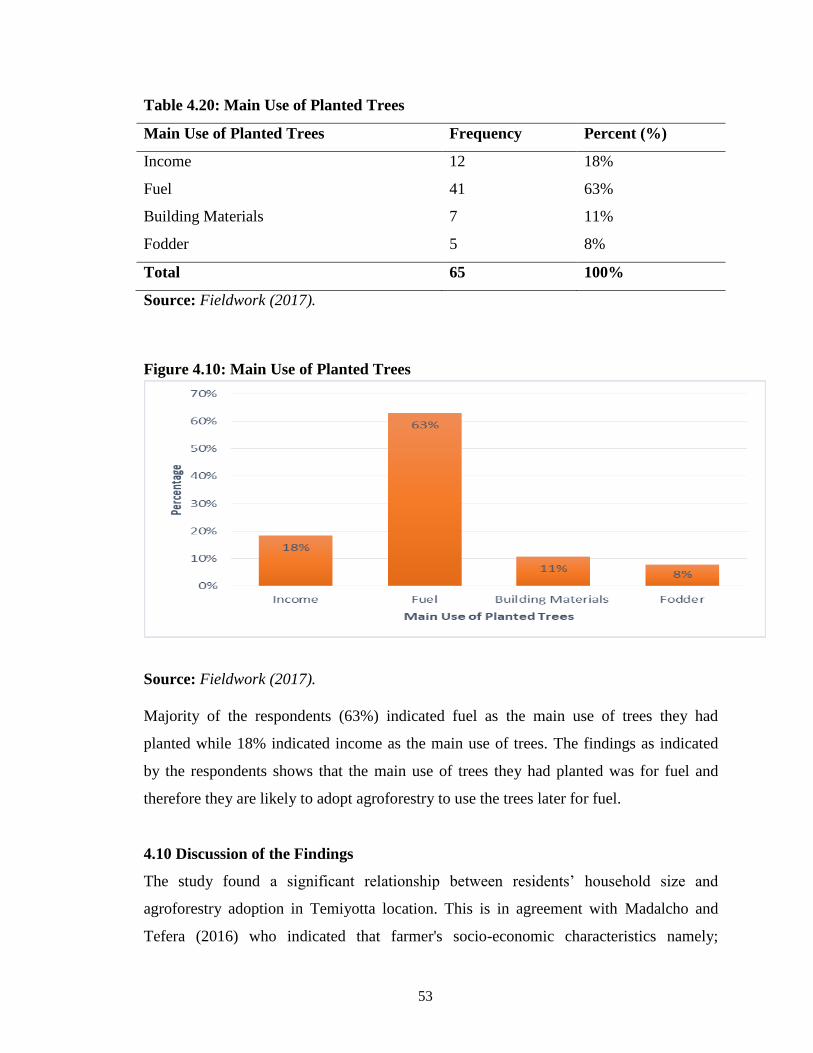
53
Table 4.20: Main Use of Planted Trees
Main Use of Planted Trees Frequency Percent (%)
Income 12 18%
Fuel 41 63%
Building Materials 7 11%
Fodder 5 8%
Total 65 100%
Source: Fieldwork (2017).
Figure 4.10: Main Use of Planted Trees
Source: Fieldwork (2017).
Majority of the respondents (63%) indicated fuel as the main use of trees they had
planted while 18% indicated income as the main use of trees. The findings as indicated
by the respondents shows that the main use of trees they had planted was for fuel and
therefore they are likely to adopt agroforestry to use the trees later for fuel.
4.10 Discussion of the Findings
The study found a significant relationship between residents’ household size and
agroforestry adoption in Temiyotta location. This is in agreement with Madalcho and
Tefera (2016) who indicated that farmer's socio-economic characteristics namely;
54
residents’ household size, educational level, membership to farmers' association and
accessibility to extension services had a significant positive influence on the adoption
of agroforestry.
Ayuya et al., (2012) also concurs with the findings of the study by indicating that
household size is significantly related to adoption of agroforestry technology. Large
household size positively influences adoption of labor-demanding agricultural
technologies since they have the ability to relax the labor limitations necessary in the
course of introduction of new technologies. Social sustainability is achieved if the
quality of life of those who live and work on the farm as well as the surrounding
communities is seen to improve. Agrochemicals that are likely to injure them should
be minimized or eradicated. Further, they should access yields at affordable prices
(Odendo et al., 2009).
The study also found that the residents’ level of education was significantly related to
agroforestry adoption in Temiyotta location. Okuthe et al., (2013) concur with the view
that there is a relationship between the level of education and the practice of agroforestry.
They indicate that the decisions on the soil fertility management and agroforestry
practice are made within the context of the whole farm and the totality of the
resources available to the farmer, which includes the entire land holding and the different
fields comprising it. The scholar views the farmer as a rational individual whose land use
decisions are based on level of education as well other human and material resources.
Okoba et al., (2013) note that when level of education increase farmers may become
more interested in high yielding systems such as alley cropping. Alley cropping is a form
of agroforestry where crops are grown between rows of trees.
He further states that a change in production system comes also as a need for change in
knowledge, management skills, and extension services. For farmers, introduction of a
new species means that they have to learn how to take care of it. In other cases effective
integration of local knowledge and perspectives into agroforestry are necessary for
such projects. Twahu et al., (2016) says that education and training are needed in many
55
cases to help communities value and manage forest resources. The importance of
education and training is a constant factor in all the work on forest quality. Such
education can work in two directions because experts often have much to learn
from local communities. Education opportunities may include bringing different groups
together or informal teaching alongside more traditional approaches to extension and
training. They feel that informal or formal training sessions for groups would be a
good model for dissemination of agroforestry services.
Furthermore, there was a significant relationship between the residents’ income and
agroforestry adoption in Temiyotta location. This is in agreement with Adnan et al.,
(2014) who states that many farmers would take up credit for the agroforestry projects.
However, Kenya National Bureau of Statistics (2013) indicate that it is expensive to
obtain credit. Fees, costs and documentation requirements also serve to limit financial
access Munyaradzi and Torquebiau (2010). Hence, unless one has other sources of
income, he probably, would not be in a position to access credit facilities. This is
especially so if he does not have land titles or other assets to secure finance or an
engagement in other income generating activities. Hence this would have negative
implications on community based agro-forestry project in that the individual would be
more interested in securing other financial assets to improve his net worth. This has an
impact on their participation on community based projects, as a less empowered man
would not readily participate in these projects. At an individual level, there's a positive
link between financial deepening and growth Adnan et al., (2014). Since men have
limited access to credit, they face the option of engaging in self-help projects rather than
community based projects to improve their net worth or otherwise seek alternative
funding from other sources. While this may happen in some cases, most men have
to meet their culturally defined obligations to their immediate family first.
56
CHAPTER FIVE
SUMMARY OF FINDINGS, CONCLUSIONS AND RECOMMENDATIONS
5.1 Introduction
This chapter contains the summary of the findings; the discussions of the findings which
are based on each of the stated objectives, conclusion and recommendations based on the
findings of the study. The chapter also highlights the suggestions for further studies.
5.2 Summary of Findings
According to the study, most of the smallholder farmers were mainly from Sitoito village.
The study found that majority of the farmers were aged between 35-39 years. The study
further found that small scale farmers in Temiyotta location, Nakuru County were more
likely to adopt agroforestry than any other occupation. It found that most smallholder
farmers have 4-7 members as their household size. Household sizes tend to influence
adoption of agroforestry due to the fact that it provides more people who are involved in
these communities based initiatives, laying strategies to enhance participation of more
households in agro-forestry.
It was discovered that most respondents owned between 3-7 acres of land and were more
likely to adopt agroforestry. Farm size of farmers is positively related to adoption rate of
agroforestry practices implying that as the farmers’ farm sizes increase they adopt more
of agroforestry practices, and when the farm size decreases the adoption as well declines.
The study also found that majority of the farmers planted crops leaving a small portion of
land to plant trees. The study further found that maize was the main type of crop
cultivated 121 acres of land by the respondents who were likely to adopt agroforestry.
Additionally, the study found that the size of farm had an influence on their decision to
plant/not to plant trees since agroforestry farmers in Temiyotta location in Nakuru
County recognize small farm hence trees supplement income as the factor that influence
decision to plant trees.
57
The study found that most respondents had obtained primary level education as their
highest education level. Most of the respondents were able to access necessary education
services on the importance of tree farming and agroforestry, attained knowledge for
planting trees especially in spacing and management skills and knowledge about various
species of trees and management skills. The study found that most smallholders’ total
annual income was estimated at Kshs. 20001 – 50000. Furthermore, the study found that
the more income of the household head, the more likely to adopt agroforestry than those
with low income levels.
In regard to household size, the study found that the mean size of households was
between 1-2 individuals. The study found that household size affect tree planting options
among most smallholder farmers in many ways that include; household size provides
labor, planting and management, as indicated by the respondents, thus increases chances
of adopting agroforestry. It further found that the larger the household size, the more
likely to adopt agroforestry than those with small household size.
The study found that the source of farmers’ tree seedlings was on-farm nurseries. The
study found that extension approach sensitizes community groups and schools on need
for agroforestry especially establishment of household woodlots; growing of fruits for
family and surplus for market; growing of fodder tress for improved animal husbandry
and returns and growing of indigenous trees for conservation of water catchment areas. In
relation to type of agroforestry trees planted, the study found Grevillea as the likely tree
to be adopted as agroforestry tree by households. Finally, the study found out that the
main use of trees they had planted was for fuel and therefore they are likely to adopt
agroforestry to use the trees later for fuel.
5.3 Conclusion
From the study, adoption of agroforestry have a positive influence on the environment
because of the many benefits derived. The study established that most respondents owned
between 3-7 acres of land. The study also concluded farm size of farmers is positively
related to adoption rate of agroforestry practices implying that as the farmers’ farm sizes

58
increase they adopt more agroforestry practices, and when the farm size decreases the
adoption as well declines. The study also concluded that the size of farm had an influence
on their decision to plant/not to plant trees. Most agroforestry farmers in Temiyotta
location in Nakuru County recognize that they own small farm hence trees supplement
income as the factor that influence decision to plant/not to plant trees. The study
concluded that most respondents had obtained primary level of education as their highest
education level. Most of the respondents were able to access necessary information on the
importance of agroforestry, attained knowledge for planting trees especially in spacing
and management skills and knowledge about various species of trees and management
skills.
It was established that the size of households was between 4-7 individuals. It further
concluded that household size affect tree planting options among most smallholder
farmers in many ways that include enough source of labor and management. The study
further concluded that household labour is a chief element of labour for small scale
farmers. This is essentially for the reason that the subsistence farm households are
capitals poor and they may have to rely on family labour for agricultural undertakings
which in most circumstances are labour demanding. This is because labour availability,
where he argues that larger households would have enough labour to plant trees and able
to provide adequate management for the planted trees.
On matters concerning type of agroforestry practiced, the study established that Grevillea
robusta and Calliandra calothyrsus are the tree species planted by agroforestry farmers in
the area. The study further concludes that Grevillea robusta was the likely tree to be
adopted as agroforestry tree by most households. Finally, the study revealed that the main
use of trees they had planted was for fuel and therefore they are likely to adopt
agroforestry to use the trees later for fuel.
5.4 Recommendations
There is a great need for agroforestry extension services for the smallholder farmers in
the area so that they can be guided on agroforestry adoption. Also the farmers need to be

59
educated on the appropriate trees to plant as regards the various agroforestry tree species.
The government and other stakeholders should promote tree farming in the area so as to
prevent deforestation and land degradation in search of firewood and timber from the
community and government forests. The government should give incentives to encourage
people to plant trees for own consumption and at the same time to restore the degraded
environment.The community has inadequate knowledge on all the agroforestry adoption
practices discussed. Therefore, the government and NGOs working in the area should
look into capacity building of the communities on agroforestry adoption. This will help to
empower the communities in conserving the environment which has been degraded
through deforestation.
5.5 Suggestions for further Research
The study suggests that more studies on agroforestry to be carried out in Temiyotta
location, Nakuru County on the right kind of species for different agroforestry adoption
practices in the different ecological zones. This should be combined with an extensive
study on the level of knowledge by the different farmers regarding the different practices.

60
REFERENCES
Adnan J., Haider A. & Danish M. G. (2014). Factors upsetting agroforestry system in
Swat, Pakistan. International Journal of Agroforestry and Silviculture, Vol. 1 (8),
pp. 086-092.
Ajayi, O. C., Franzel, S., Kuntashula, E., & Kwesiga, F. (2003). Adoption of improved
fallow technology for soil fertility management in Zambia: Empirical studies and
emerging issues. Agroforestry Systems, 59(3), 317-326.
Ajayi, O. C., Massi, C., Katanga, R., & Kabwe, G. (2006). Typology and characteristics
of farmers planting improved fallows in southern Africa. Zambian Journal of
Agricultural Sciences, 8(2), 1-5.
Alao, J. S., and Shuaibu, R. B. (2013). Agroforestry practices and concepts in sustainable
land use systems in Nigeria. Journal of Horticulture and Forestry, Vol. 5(10), pp.
156-159.
Alavalapati J., Meghan M. M. & Mickie E. S. (2008). Agroforestry adoption and
maintenance: self-efficacy, attitudes and socio-economic factors. Agroforest
Syst. 73:99–108. Applications 6: 107-115.
Ayieni A. J., (2013) Empowering Kuresoi North Constituency, ‘Build People, Build a
Nation’. An Initiative by Pulse Care Systems. Narshi Hse 1st Floor Moktar
Daddah Street, Nairobi.
Ayuya O. I., Waluse S. K & Gido O. E. (2012). Multinomial Logit Analysis of Small-
Scale Farmers’ Choice of Organic Soil Management Practices in Bungoma
County, Kenya. Current Research Journal of Social Sciences 4(4): pp 314-322.
Banana, A., Nabanoga, G. & Ntakimanye, A. (2008). Rotational woodlot technology in
Kigorobya Sub-county of Hoima District, Western Uganda. Ethnobotany
Research & Applications 6: 107-115.
Barret, C.B., Place F. & Aboud, A.A. (2002). Natural Resource Management in African
Agriculture: Understanding and Improving Current Practices. CABI Publishers,
Oxford.
Blaug, M. (1970). Introduction to the Economics of Education. Harmondsworth:
Penguin, Bonnard P. Within gender differences in tree management: Is gender
distinction a reliable concept? Agroforestry Systems 25: 71–93.
Bzugu, P.M., Mustapha, S.B. & Adeogun, F.A. (2012). Socio Economic Factors
Influencing Adoption of Improved Gum Arabic Seedlings Among Farmers in the
Sahelian Zone of Borno State, Nigeria. International Journal of Innovative
Research & Development, Vol 1(9) pp. 237-252.

61
Census, (2009). The 2009 Kenya population and housing, Volume 1A. Nairobi.
Cheikh M. (2015). Agroforestry can form an effective, efficient and fair pathway to
achieve food security and agricultural sustainability in Africa. World
Agroforestry Centre-Nairobi, Kenya.
China, S.S. (1993). Land Use Planning using GIS. Unpublished PhD thesis, University of
Southampton.
Chitere, P.A. (1985). Agroforestry Plots for Rural Kenya Project. Socio-Economic
Survey Report. Mazingira Institute, Nairobi, Kenya.
Cooper, P. J. M., Leakey, R. R. B., Rao, M. R., and Reynolds, L. (1996). Agroforestry
and the mitigation of land degradation in the humid and sub-humid tropics of
Africa. Experimental Agriculture, 32: 235-290.
DRSRS (Department of Resource Surveys and Remote Sensing) (2010) Nairobi Kenya.
Duvel G. H, (1997). An Interdisciplinary Model for Behaviour Analysis and Intervention
in Agricultural Extension and Rural Development. Journal of International
Agricultural and Extension. South African Institute for Agricultural Extension.
Vol. 4 pp. 55-65.
Duvel, G.H., (1994). A model for Adoption Behavior: Analysis in Situation Surveys. J.
Extension. Systems. Vol. 10, No. 1 pp 1–32.
Edinam K. G., Hassan B. A., & Mawutor K. G. (2013) Analysis of Socio-Economic
Conditions Influencing Adoption of Agroforestry Practices. International Journal
of Agriculture and Forestry 2013, 3(4): 178-184.
FAO. (2013). Advancing Agroforestry on the Policy Agenda: A guide for decision-
makers, by G.Buttoud, in collaboration with O. Ajayi, G. Detlefsen, F. Place &
E. Torquebiau. Agroforestry Working Paper no. 1. Food and Agriculture
Organization of the United Nations. FAO, Rome. Pp. 37.
FAO/REOSA. (2010). Farming for the future in Southern Africa: An introduction to
conservation agriculture. (FAO Regional Emergency Office for Southern Africa)
REOSA Technical Brief No. 1.
Food and Agriculture Organization of the United Nations. (1989). Forestry and Food
Security, FAO Forestry Paper No. 90 FAO. Rome, Italy.
Franzel, S., Cooper, J., and Denning, G. (2001). Scaling up the benefits of agroforestry
research: lessons learned and research challenges. Development in Practice,
11(4)524-534.
62
Garrity, D. P. (2006). Science-Based Agroforestry and the Millennium Development
Goals. In: D. P. Garrity, A. Okono, M. Grayson and S. Parrott (Eds). World
Agroforestry into the Future. Nairobi, Kenya: World Agroforestry Centre,
ICRAF.
Geremew W. K., (2016). Agroforestry and land productivity: Evidence from rural
Ethiopia. Kassie, Cogent Food & Agriculture, research article (2016), 2:
1259140.
Gichuki, J.J. & Njoroge, S.N.J. (1989). Socio-economic Aspects in Agro forestry.
Permanent Presidential Commission on Soil Conservation and Afforestation,
Nairobi, Kenya.
International Centre for Research in Agro forestry. (1992). A Selection of Useful Trees
and Shrubs for Kenya. ICRAF, Nairobi, Kenya.
Ipara, H.I. (1992). Socio-economic Factors Affecting the Participation of women in
Agroforestry Activities in Sabatia Division in Vihiga, Kenya. M. phil, Thesis
(Unpublished) Moi University, Eldoret, Kenya.
Kabwe G., Bigsby H. & Cullen R. (2009). Factors influencing adoption of agroforestry
among smallholder farmers in Zambia. Paper presented at the 2009 NZARES
Conference Tahuna Conference Centre – Nelson, New Zealand. August 27-28,
2009.
Kassa, G. (2015). Profitability analysis and determinants of fruit tree based agroforestry
system in Wondo district, Ethiopia. African Journal of Agricultural Research,
(10) pp.1273–1280.
Kenya Agricultural Research Institute (KARI)-National Potato Research Centre, Tigoni
FOODNET Potato Processing Project Title: Linking ware potato growers with
processors of French-fries in Nakuru District. Kenya, 2007.
Kenya National Bureau of Statistics (KNBS) and Society for International Development
(SID) (2013) Exploring Kenya’s Inequality, Pulling Apart or Pooling Together-
Nakuru County. Ascent Limited, Nairobi Kenya.
Kerkhof, P. (1992). Agroforestry in Africa: A survey of project experience, Ipara
Publication.
Kiptot E. & Franzel S. (2011). Gender and agroforestry in Africa: are women
participating? ICRAF Occasional Paper No. 13. Nairobi: World Agroforestry
Centre.
Kothari, C. R. (2004). Research Methodology: Methods and Techniques. New Age
International, 2004, New Delhi. 401pp.
63
Kwesiga, F., Akinnifesi, F.K., Mafongoya, P.L, McDermott, M.H. & Agumya, A. (2003)
Agroforestry research and development in southern Africa during the 1990s:
review and challenges ahead. Agroforestry systems 59 (3), 173-186.
Kwesiga, F., Akinnifesi, F.K., Mafongoya, P.L, McDermott, M.H. and Agumya, A.
(2003) Agroforestry research and development in southern Africa during the
1990s: review and challenges ahead. Agroforestry systems 59 (3), 173-186.
Madalcho A. B. & Tefera M. T. (2016). Management of Traditional Agroforestry
Practices in Gununo Watershed in Wolaita Zone, Ethiopia. Forest Res 5: 163.
Makaya, P. R. (2000). Fodder Banks – Chikwaka Dairy Farmers (Zimbabwe) Give
Feedback. Living With Trees in Southern Africa, 4, 17-19.
Maluki J. M., Kimiti J. M., Nguluu S. and Musyoki J. K. (2016). Adoption levels of
agroforestry tree types and practices by smallholders in the semi-arid areas of
Kenya: A case of Makueni County. Journal of Agricultural Extension and Rural
Development. Vol.8 (9), pp. 187-196.
Mercer D. E. & Pattanayak K. S (2005). Agroforestry Adoption by Smallholders. USDA
Forest Service and Research Triangle Institute. Sills and Abt (eds.), Forests in a
Market Economy. Kluwer Academic publishers, Netherlands, pp 283-299.
Mercer, D. (2004). Adoption of agro forestry innovations in the tropics: a review.
Agroforestry Systems, 61, 311-328.
Morris, C.T. & I. Adelman. (1988). Comparative patterns of economic development
1850-1914. John Hopkins University Press, Baltimore, MD.
Mulatu F. Z., Mammo M. & Zeleke W. (2014) Determinants of agroforestry technology
adoption in Eastern Cape Province, South Africa. Development Studies
Research, 1:1, 382-394.
Munyaradzi C. and Torquebiau E. (2010). Barriers and coping mechanisms relating to
agroforestry adoption by smallholder farmers in Zimbabwe. Centre for
Environmental Studies, University of Pretoria, South Africa.
Nakuru County Integrated Development Plan, (2013). First County Integrated
Development Plan (2013-2017). Republic of Kenya Nakuru County.
Nakuru District Strategic Plan 2005-2010 (2005). Nakuru District Strategic Plan 2005-
2010 for Implementation of the National Population Policy for Sustainable
Development. Ministry of Planning and National Development Nairobi-Kenya.
Nassiuma D. K., (2000), Survey Sampling: Theory and Methods. Nairobi: University of
Nairobi Press.
64
Neupane, R. P., and Thapa, G. B. (2001). Impact of Agroforestry Intervention on Soil
Fertility and Farm Income under the Subsistence Farming System of the Middle
Hills, Nepal. Agriculture, Ecosystems & Environment, 84(2): 157-167.
Neupane, R. P., Sharma, K. R., and Thapa, G. B. (2002). Adoption of Agroforestry in the
Hills of Nepal: A Logistic Regression Analysis. Agricultural Systems, 72(3):177-
196.
Odendo, M., Obare, G. and Salasya, B. (2009). Factors responsible for differences in
uptake of integrated soil fertility management practices amongst smallholders in
western Kenya. African Journal for Agricultural Research, 4(11): pp. 1303-1311.
Oino P. & Mugure A. (2013). Farmer-Oriented Factors that Influence Adoption of
Agroforestry Practices in Kenya: Experiences from Nambale District, Busia
County.International Journal of Science and Research (IJSR), India Online ISSN:
2319‐7064, Vol. 2, pp 450-456.
Okoba B., Waweru G. & Wim C. (2013). Farmers’ perception of conservation
agriculture in Laikipia East District in Kenya. Joint proceedings of the 27th Soil
Science Society of East Africa and the 6th African Soil Science Society. Nairobi
Kenya.
Okuthe I. K., Kioli F. & Abuom P. (2013). Socio Cultural Determinants of the Adoption
of Integrated Natural Resource Management Technologies by Small Scale
Farmers in Ndhiwa Division, Kenya. Current Research Journal of Social
Sciences 5(6): pp 203-218.
Ong’ayo, M. (1993). Manual for Training Field Extension Workers: Extension Methods.
Moto Mwaka, KWAP and ETC. Nairobi, Kenya.
Orisakwe L. & Agomuo F., O. (2011): “Adoption of Improved Agroforestry Technologies
among Contact Farmers in Imo State, Nigeria” Asian Journal of Agriculture and
Rural Development, 2(1), pp. 1-9.
Pattanayak S. K., Mercer D. E., Erin O. S., Jui-Chen Y. & Kirsten C. (2002). Taking
Stock of Agroforestry Adoption Studies. Working Paper 02_04. RTI
International’s.
Rahim M., Zeynab B., Javad S. & Kamran A. (2013). Factors Affecting Agroforestry
Acceptance Level by Framers in Lorestan, Iran. Journal of Agriculture Science
Developments, 2(10), pp 102-105.
Sileshi G., Akinnifesi F.K, Ajayi O.C, Chakeredza S., Kaonga M. & Matakala P.W.
(2007). Contributions of agroforestry to ecosystem service in the Miombo eco-
region of eastern and southern Africa. African Journal of Environmental Science
and Technology, 1(4), pp 068-080.
65
Sileshi, G. & Mafongoya, P.L. (2006). Long-term effects of legume-improved fallows on
soil invertebrate and maize yield in eastern Zambia. Journal of Applied Soil
Ecology, M Vol.33 (1):49-60.
Survey of Kenya (2011).
Tengnas B. (1994). Agroforestry extension manual for Kenya. Nairobi: International
Centre for Research in Agroforestry.
Thangata P. H & Alavalapati J R R, (1996) Adoption of Agroforestry Practices in
Malawi: A Case Study of Gliricidia Sepium and Maize. School of Forest
Resources and Conservation, University of Florida, Gainesville.
Thangata, P. H. & Alavalapati J.R.R. (1996). Resource poor farmers’ perception of
agro-forestry practices: A case study of Malawi. Unpublished Master’s Thesis,
University of Edinburgh, Scotland, UK.
Thangata, P. H., & Alavalapati, J. R. R. (2003). Agroforestry adoption in southern
Malawi: the case of mixed intercropping of Gliricidia sepium and maize.
Agricultural Systems, 78(1), 57-71.
Tolman, E. C. (1967). A psychological model. In: T. Parsons and E.A. Shils. Toward a
general theory of action. Cambridge. Harvard Univ. Press.
Twaha, A. B., Mayanja C., Kiiza B., Nakileza B., Matsiko F., Nyende P., Bacwayo E. K.,
Tumushabe A. and Kassim S. (2016) Enhancing Adoption of Agroforestry in the
Eastern Agro-Ecological Zone of Uganda. International Journal of Ecological
Science and Environmental Engineering. Vol. 3, No. 1, pp. 20-31.
UNEP. (2015). Green Economy Sector Study on Agriculture in Kenya. 34 p.

66
APPENDICES
APPENDIX I: QUESTIONNAIRE
CONFIDENTIAL
ANALYSIS OF SOCIO-ECONOMIC FACTORS THAT AFFECT
AGROFORESTRY ADOPTION AMONG SMALLHOLDERS IN TEMIYOTTA
LOCATION, NAKURU COUNTY
1. (a) Name of the Village
Area tick (√ )
1 Tebere
2 Arimi
3 Sitoito
(b) Information on Head of Household
Name of
Respondent
Age Gender
(Male/
Female)
Marital Status If married/ Widowed/
Separated how many children
do you have?
Education
level
Occupation How long you
have stayed
here
Household size
(c) Household Information – to be answered by household head INTERVIEWER: List all the people who live in the household and get the required
information.
2. (i) What size of farm do you own?........Acres
(ii)What do you use the land for?
Land use activity Tick (√) Estimate land size
Crop cultivation
Livestock grazing
Planting trees (forest)
Persons
first
name
Relationship to
the Head of
Household
How long have
you lived in the
current
home/Area
Gender
(Male/
Female)
Age Education Occupation
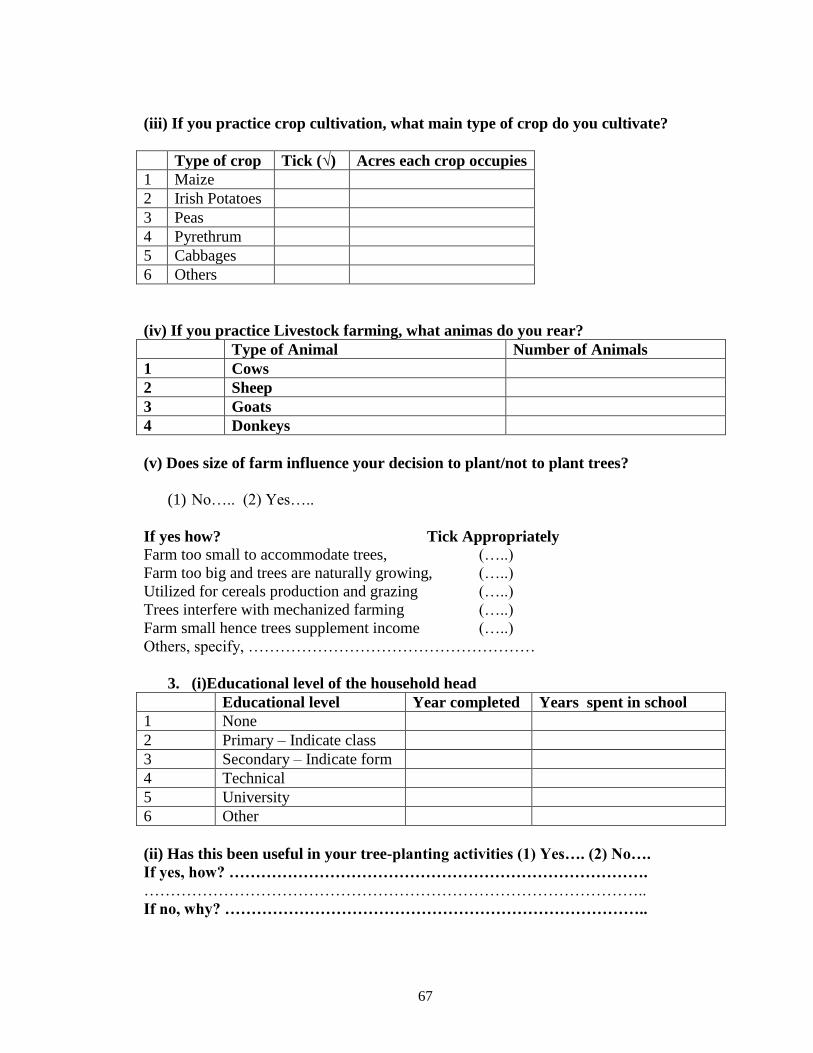
67
(iii) If you practice crop cultivation, what main type of crop do you cultivate?
Type of crop Tick (√) Acres each crop occupies
1 Maize
2 Irish Potatoes
3 Peas
4 Pyrethrum
5 Cabbages
6 Others
(iv) If you practice Livestock farming, what animas do you rear?
Type of Animal Number of Animals
1 Cows
2 Sheep
3 Goats
4 Donkeys
(v) Does size of farm influence your decision to plant/not to plant trees?
(1) No….. (2) Yes…..
If yes how? Tick Appropriately
Farm too small to accommodate trees, (…..)
Farm too big and trees are naturally growing, (…..)
Utilized for cereals production and grazing (…..)
Trees interfere with mechanized farming (…..)
Farm small hence trees supplement income (…..)
Others, specify, ………………………………………………
3. (i)Educational level of the household head
Educational level Year completed Years spent in school
1 None
2 Primary – Indicate class
3 Secondary – Indicate form
4 Technical
5 University
6 Other
(ii) Has this been useful in your tree-planting activities (1) Yes…. (2) No….
If yes, how? …………………………………………………………………….
…………………………………………………………………………………..
If no, why? ……………………………………………………………………..

68
4 (a) what is your occupation?....................................................
(b) What are your other sources of income, and what’s the income from each
source?
Other sources of Income Income from each source (Kshs.)
1 Farming
2 Peasantry
3 Logging
4 Charcoal burning business
5 Own a retail kiosk
6 Other
(c)What is your monthly income? Kshs.................................
(d)What is your total annual income? Kshs…………………
5. (i) what is the size of your Household?................................
(ii) Does your household size affect your tree planting options: (1) No…. (2) Yes…..
(iii)If yes, how?……………………………………………………………………………
6. Extension Services:
(i) (a) Do you get visited by an extension officer? (1) Yes…. (2) No….
(b) If yes,
How often are you visited by an extension staff at your farm?
(1) Once a week (2) Twice a month (3) Once a month
(4) Once after 3 months (5) Once a year (6) Not at all
(ii) Do you visit extension officers/offices? (1) Yes…. (2) No….
How often do you visit the extension officers/offices?
(1) Once a week (2) Twice a month (3) Once a month
(4) Once after 3 months (5) Once a year (6) Not at all
(iii) (a)Do extension officers provide seedlings (1) No…. (2) Yes….
(b) If no, what is the source of your tree seedlings?
(1) From on-farm nurseries (2) Buy from private nurseries
(3) Borrow from friends (4) Others, specify …………………………………
(c) How often do you plant trees?
(1) Monthly (2) Quarterly (3) Semi-annually

69
(4) Annually (5) Not at all
7. Types of Agroforestry Practiced
(a) Do you plant trees (1) Yes….. (2). No…..
(b) If yes, what kind of trees and how many?
Types of Trees Amount Planted
1
2
3
(c) What is the total number of trees on your farm?.............
(d) What is the main use of trees you have planted?
1. Income
2. Fuel
3. Building materials
4. Fruits
5. Fodder
6. Shade
7. Fertilizer trees
8. Other (specify)…………………………………………..
(8) What is the location of trees on your farm?
Location of Trees in the Farm Tick Appropriately Tree Species
1 Woodlots
2 Windbreak/Shelterbelts
3 Alley Cropping
4 Home gardens
5 Dispersed Trees (Homesteads)
6 Boundary Marks
7 Live Fencing
8 Fodder Banks
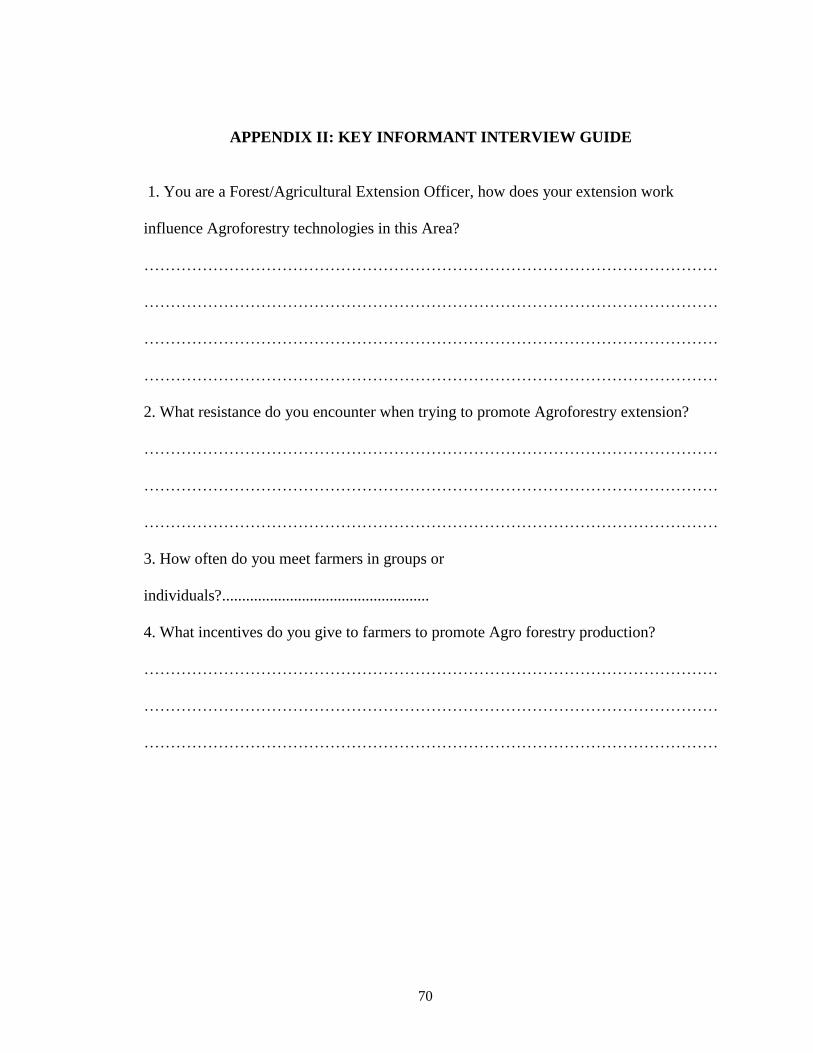
70
APPENDIX II: KEY INFORMANT INTERVIEW GUIDE
1. You are a Forest/Agricultural Extension Officer, how does your extension work
influence Agroforestry technologies in this Area?
………………………………………………………………………………………………
………………………………………………………………………………………………
………………………………………………………………………………………………
………………………………………………………………………………………………
2. What resistance do you encounter when trying to promote Agroforestry extension?
………………………………………………………………………………………………
………………………………………………………………………………………………
………………………………………………………………………………………………
3. How often do you meet farmers in groups or
individuals?....................................................
4. What incentives do you give to farmers to promote Agro forestry production?
………………………………………………………………………………………………
………………………………………………………………………………………………
………………………………………………………………………………………………

71
APPENDIX III: FOCUS GROUP DISCUSSIONS
1. How often are you visited by extension officers during your barazas?
………………………………………………………………………………………………
2. Are you satisfied, there is enough trees in your area? (1) Yes (2) No
If No, what is the cause of low attention to on-farm tree production?
………………………...……………………………………………………………………
………………………………………………………………………………………………
………………………………………………………………………………………………
………………………………………………………………………………………………
………………………………………………………………………………………………
3. What do you think the government should do to encourage Agro forestry production in
your area?
……………….……………………………………………………………………………
………….…………………………………………………………………………………
………………………………………………………………………………………………
………………………………………………………………………………………………
………………………………………………………………………………………………

72
APPENDIX IV: RESEARCH CLEARANCE PERMIT

73
APPENDIX V: RESEARCH AUTHORIZATION

74
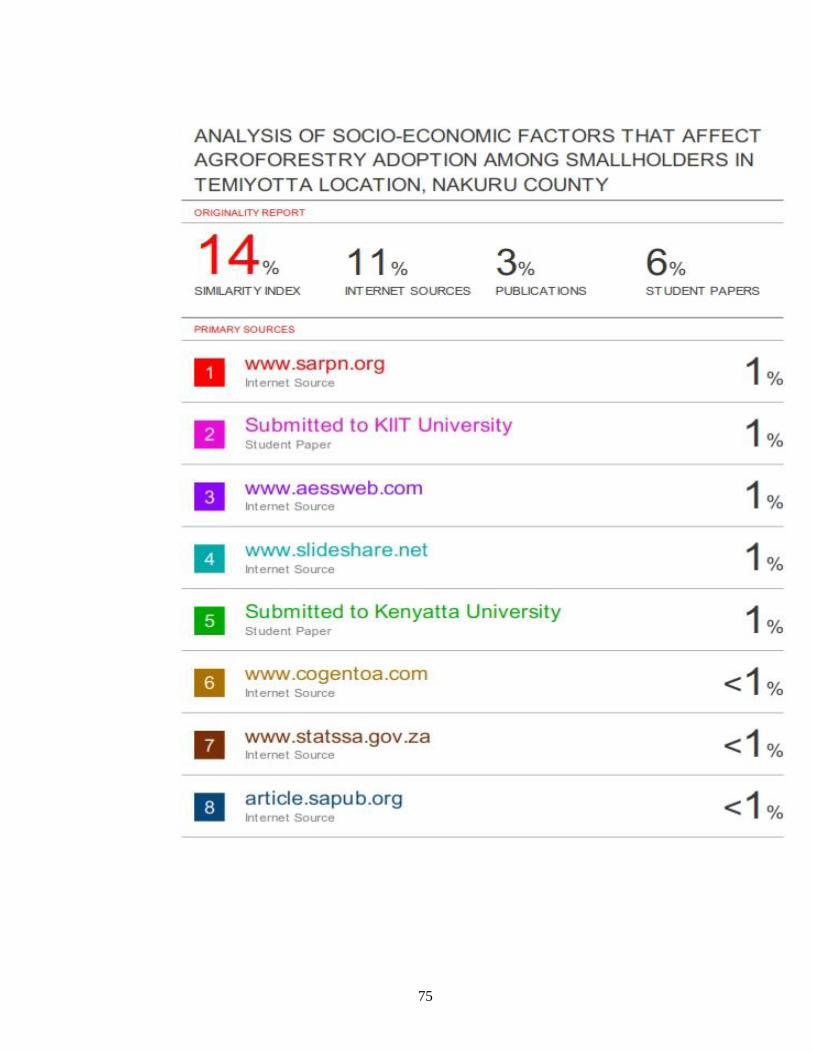
75