Embed Size (px)
Citation preview
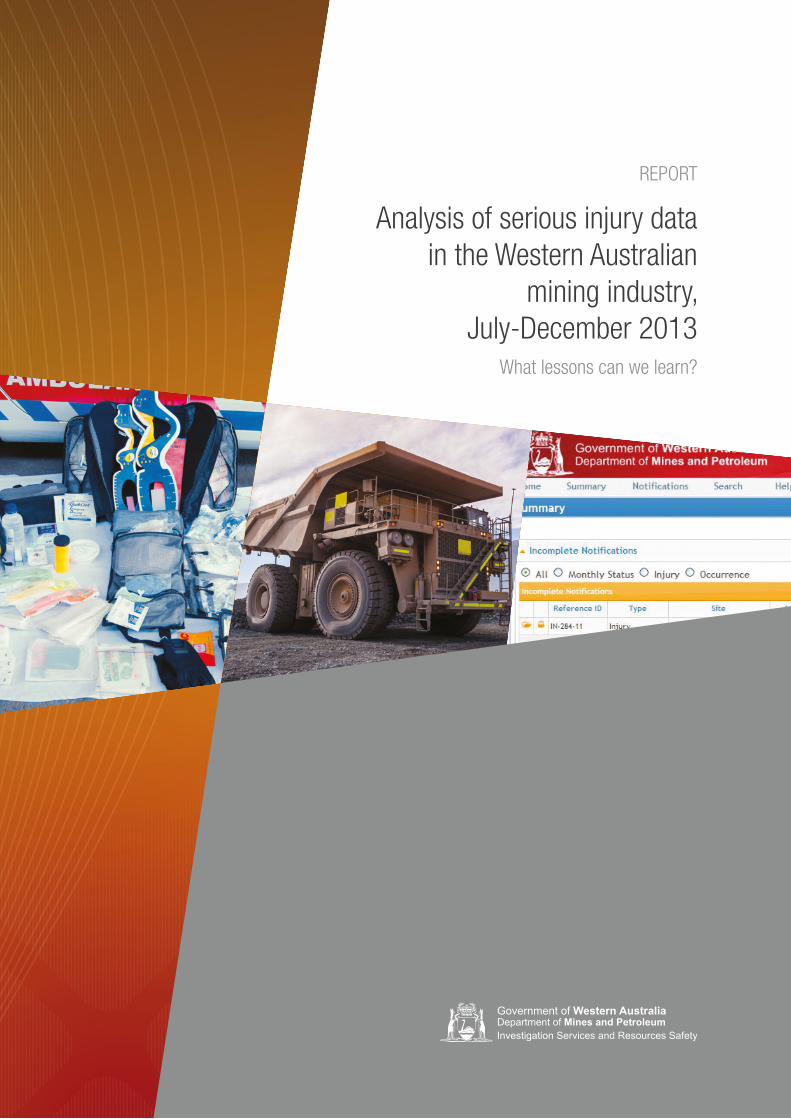
REPORT
Analysis of serious injury data in the Western Australian
mining industry, July-December 2013
What lessons can we learn?
II
Disclaimer
The information contained in this publication is provided in good faith and is believed to be reliable and accurate at the time of publication. However, the information is provided on the basis that the reader will be solely responsible for assessing the information and its veracity and usefulness.
The State shall in no way be liable, in negligence or howsoever, for any loss sustained or incurred by anyone relying on the information, even if such information is or turns out to be wrong, incomplete, out-of-date or misleading.
In this disclaimer:
State means the State of Western Australia and includes every Minister, agent, agency, department, statutory body corporate and instrumentality thereof and each employee or agent of any of them.
Information includes information, data, representations, advice, statements and opinions, expressly or implied set out in this publication.
Loss includes loss, damage, liability, cost, expense, illness and injury (including death).
Reference
Department of Mines and Petroleum, 2015, Analysis of serious injury data for the Western Australian mining industry, July-December 2013: what lessons can we learn? – report: Investigation Services and Resources Safety Division, Department of Mines and Petroleum, Western Australia, 29 pp.
ISBN 978 1 922149 43 5
© Department of Mines and Petroleum 2015
Except where the Copyright Act otherwise allows, reproduction in whole or part of this publication will be permitted only with the prior written permission of the Department of Mines and Petroleum. Applications for permission should be addressed to the Manager Safety Communications, Resources Safety.
This publication is available on request in other formats for people with special needs.
This publication is also available in digital format (PDF) online at www.dmp.wa.gov.au/ResourcesSafety
Further details of publications produced by Resources Safety can be obtained by contacting:
Resources Safety Department of Mines and Petroleum 100 Plain Street EAST PERTH WA 6004
Telephone: + 61 8 9358 8002 (general queries) + 61 8 9358 8154 (publication orders)
NRS: 13 36 77 Facsimile: + 61 8 9358 8000 Email: [email protected] (general queries)
[email protected] (publication orders)
III
Contents
1 Introduction ....................................................................................................................................................1
2 Findings from the fatalities review .....................................................................................................2
2.1 Overview......................................................................................................................................................2
2.2 Active failures ..............................................................................................................................................2
2.3 Latent conditions ..........................................................................................................................................2
2.4 Recommendations ........................................................................................................................................2
3 Injury and occurrence reporting requirements.............................................................................3
3.1 Legislative framework ...................................................................................................................................3
3.2 What is injury data and how is it reported? .....................................................................................................3
3.3 Quality assurance of injury data held in SRS ...................................................................................................3
3.4 What is occurrence data and how is it reported? ............................................................................................3
4 Methodology for serious injury analysis ..........................................................................................5
4.1 Establishing a representative sampling interval ...............................................................................................5
4.2 Data sets used in analysis .............................................................................................................................6
4.3 Grouping data ..............................................................................................................................................6
4.4 Limitations resulting from reporting requirements under legislation ..................................................................6
5 Analysis of injury data for 1 July to 31 December 2013 ..........................................................7
5.1 All injury data ...............................................................................................................................................7
5.2 Serious injury data ........................................................................................................................................8
6 Identifying potentially significant factors for serious injuries ............................................18
6.1 Energy transferred ......................................................................................................................................18
6.2 Analysis of repetitive high-consequence serious injuries ...............................................................................19
6.3 Analysis of low-frequency and rare high-consequence serious injuries...........................................................20
7 Risk profile for Western Australian mines ....................................................................................21
7.1 Establishing a risk profile for Western Australian mines .................................................................................21
7.2 Detailed Western Australian mining industry risk profile.................................................................................23
8 Tracking improvements in fatality accident performance ....................................................24
9 Strategies to address fatal and serious injury causation factors .....................................26
9.1 Applying findings of serious injuries analysis ...............................................................................................26
9.2 Hazard and precaution-based safety ...........................................................................................................26
9.3 Other strategies .........................................................................................................................................27
Appendix 1 Useful resources .......................................................................................................................29
Anal
ysis
of s
erio
us in
jury
dat
a in
the
Wes
tern
Aus
tralia
n m
inin
g in
dust
ry, J
uly-
Dece
mbe
r 201
5 –
REPO
RT
1
1 Introduction1.1 Aims
The Fatal accidents in the Western Australian mining industry 2000-2012: What lessons can we learn? – report was published by the Department of Mines and Petroleum in 2014. It considered underlying causation factors and active failures that have contributed to fatal accidents. While some safety performance indicators are showing slight downward trends, the fatality incidence rate appears to have plateaued, apart from the fatality-free year in 2012. Industry and the government are committed to improving safety outcomes and this report provides a state-wide view of the current injury profile.
The fatalities review is a powerful tool in understanding the causes of accidents and fatalities in Western Australian mines. However, there are clear benefits in not waiting several years to analyse the circumstances around a group of fatal accidents with a view to preventing similar incidents. For this reason, serious injury data was chosen for analysis to see if, being the “next level down” from a fatality, it could be used as an indicator to assist in understanding the causation factors behind fatal accidents.
1.2 Analytical approach
A six-month sample of data for injuries reported for the period 1 July to 31 December 2013 was selected for detailed analysis from the Department’s Safety Regulation System (SRS). The suitability of using the six-month data set was established by interrogating injury data recorded in SRS for 2002 to 2013 to determine whether the sample size was representative.
Trends and clusters in data relating to causation factors and critical activities were identified and compared to those of the fatalities review to assist in verification and the development
of an industry risk profile. Occurrence notifications were also used to help understand the mechanism of injury and develop a more comprehensive industry risk profile.
Subgroups of serious injury types were investigated further to see if meaningful and potentially leading performance indicators could be identified.
Note: The general safety theory and practice that inform this report are discussed in detail in the fatality report.
1.3 Structure of report
This analysis draws heavily on a comparison with the findings of the fatalities review, which is summarised in Chapter 2.
There are legislative requirements that determine the incident information notified to the Department of Mines and Petroleum. The Department’s online Safety Regulation System (SRS) is used to manage the notifications and store the data. Chapter 3 outlines the reporting requirements and how the data is processed.
Chapters 4 to 7 describe how the data was analysed and present the results and interpretations.
The significance of the data analysis and potential use of the findings are discussed in Chapter 8.
Chapter 9 presents strategies for industry to reduce the incidence of serious and fatal injuries.
Note: The SRS codes used for groupings, and graphs and supporting data are available in digital format. Contact [email protected] for further information.
Analysis of serious injury data in the Western Australian m
ining industry, July-December 2013 – REPORT
2
2 Findings from the fatalities review2.1 Overview
The fatalities review considered 52 detailed investigation reports prepared by mines inspectors for work-related mining fatalities for the period 2000 to 2012. The review findings are based on the causation factors identified through an analysis of evidence contained in the inspectors’ reports.
There was an average of 4 fatal accidents each year for the 13 years covered by the fatalities report. This was a period of major expansion in the Western Australian mining industry, with the mining workforce increasing from about 40,000 to 100,000 workers.
The review findings were considered from the aspect of active failures and latent conditions.
• Active failures relate to the factors that contributed to the final events triggering the accident (e.g. vehicle collisions, falls from height, crushed between components and rock falls).
• Latent conditions are those factors that might be prevalent at a mine, in the industry or in society as a whole (e.g. hours of work, rosters, fatigue, quality of training and supervision).
2.2 Active failures
About 75 to 80 per cent of the fatal accidents involved repeat scenarios with common causation factors.
Ten critical activity areas were identified:
• falls from height involving inappropriate application of preventative measures
• departures from original equipment manufacturer (OEM) procedures, mainly involving fitters in workshops
• run-away vehicles where park brakes were not applied, or downward vehicle momentum exceeded braking capability
• vehicles driven over edges such as waste dumps, stock piles or underground stopes
• vehicle collisions, with contact between various types of mobile plant
• electrical contacts in open panels with live conductors exposed
• rock falls just beyond the limit of supported ground
• pit wall failures onto or under workers and vehicles
• inrush situations in underground mines
• tyre handling where pressure was involved, or gravity caused the tyre to fall or roll.
2.3 Latent conditions
Factors identified as latent conditions include:
• occupation of the deceased worker – fitters and machine operators were most at risk
• duration of the deceased worker in their role
• duration of the deceased worker at the mine site
• duration of the supervisor in the role
• for workers and supervisors, the first six to twelve months of employment appears to be the most significant time period
• a lack of or inadequate training in hazard awareness such that hazards were often unrecognised
• a lack of or inadequate training in critical tasks associated with known hazards and known precautions
• the time of day, which appears to affect the propensity of workers to make errors
• quality of supervision to ensure work conducted according to standards
• the working environment, particularly in the early 2000s, with underground being four to five times more hazardous than the surface.
Note: The fatalities review found no particular correlation to different commute schedules, and the age of the worker did not appear to be significant.
2.4 Recommendations
The analysis suggested potential areas of improvement for industry are:
• improved hazard identification and risk assessment
• the development of principal hazard management plans (PHMPs)
• the use of written work procedures for all critical tasks
• supervision and observations to ensure compliance with procedures
• the pro-active involvement of workers in safe work system development
• improved training of workers and supervisors in procedures and processes
• improved site induction and familiarisation in the early months of employment
• adequate breaks during the shift to reduce the potential for human error.
Anal
ysis
of s
erio
us in
jury
dat
a in
the
Wes
tern
Aus
tralia
n m
inin
g in
dust
ry, J
uly-
Dece
mbe
r 201
5 –
REPO
RT
3
3 Injury and occurrence reporting requirements3.1 Legislative framework
Under the Mines Safety and Inspection Act 1994 and Mines Safety and Inspection Regulations 1995, a mining operation (including exploration operations) must report the following to the Department:
• accidents involving injury to persons
• occurrences (commonly referred to as notifiable incidents for reporting purposes).
For injuries, section 76 of the Mines Safety and Inspection Act 1994 specifies the type of injury that must be reported and by when.
3.2 What is injury data and how is it reported?
A serious injury is defined in legislation as an injury that results in the injured person being disabled from following his or her ordinary occupation for a period of two weeks or more. This definition is inclusive of lost time and restricted work injuries.
If a fatality has resulted from an injury, it is classed as a serious injury.
A minor injury is a reportable injury that is not classified as serious where the person is away for less than two weeks.
Serious injury information is submitted using the Department’s Safety Regulation System (SRS) as a notifiable incident report, and at the end of each month in a mining injury report. Minor injuries are also reported at the end of the month in the mining injury report.
Although not defined by legislation, the following types of injury are used in safety performance measures published by the Department. They are notified by mining operators when submitting injury and monthly status reports.
A lost time injury (LTI) is a work injury that results in an absence from work for at least one full day or shift any time after the day or shift on which the injury happened.
A restricted work injury (RWI) is a work injury that is not a LTI but results in the injured person being unable to fully perform his or her ordinary occupation (regular job) any time after the day or shift on which the injury happened. This is regardless of whether or not the person is rostered to work, and where alternative or light duties may be performed or hours restricted
3.3 Quality assurance of injury data held in SRS
When mining operators submit injury reports via SRS, a quality assurance (QA) process is undertaken during which coding standards are applied to each injury report against a set of defined categories. Codes are available for about 70 injury types, 90 occupations, and more than a hundred machines, mines and a range of activities. In total, several hundred coding splits are applied at the QA stage.
Since 2002, the same quality assurance standards have been applied to data in accordance with departmentally derived standards, and to address the range of commute rosters.
The QA process can take several months to complete as medical and injury outcomes are resolved.
3.4 What is occurrence data and how is it reported?
Occurrences or notifiable incidents are unplanned incidents that do not necessarily result in injury to a person or damage to property. Under the Mines Safety and Inspection Act 1994, the following occurrences are required to be reported:
• extensive subsidence, settlement or fall of ground or any major collapse of any part of the operations of a mine, or any earth movement caused by a seismic event [s. 78(3)(a)]
• outbreak of fire above or below ground in any mine [s. 78(3)(b)]
• breakage of a rope, cable, chain or other gear by which persons are raised or lowered [s. 78(3)(c)]
• inrush of water from old underground operations or other source [s. 78(3)(d)]
• accidental ignition of dust below ground or the discovery of the presence of potentially harmful or asphyxiant gas or an outburst of such gas in any part of a mine [s. 78(3)(e)]
• accidental ignition or detonation of explosives, or any delayed or fast ignition of explosives [s. 78(3)(f)]
• explosion or bursting of compressed air receivers, boilers, or pressure vessels [s. 78(3)(g)]
• every electric shock or burn to a person and every dangerous occurrence involving electricity [s. 78(3)(h)]
• incidence of a person being affected by poisoning or exposure to toxic gas or fumes [s. 78(3)(i)]
• loss of control of heavy earth-moving equipment, including failure of braking or steering [s. 78(3)(j)].

Analysis of serious injury data in the Western Australian m
ining industry, July-December 2013 – REPORT
4
In addition to the occurrences listed above, other reportable incidents and accidents under the mines safety legislation include:
• an injury that is serious or appears to be serious, including a fatality [s. 76 (2)(a)]
• a potentially serious occurrence or incident [s. 79]
• incidents affecting registered plant [r. 6.36].
Occurrences or notifiable incidents are submitted as a notifiable incident report via SRS. The Department must be notified whether or not anyone was injured, and whether or not there was any damage to property.
Anal
ysis
of s
erio
us in
jury
dat
a in
the
Wes
tern
Aus
tralia
n m
inin
g in
dust
ry, J
uly-
Dece
mbe
r 201
5 –
REPO
RT
5
4 Methodology for serious injury analysis4.1 Establishing a representative sampling interval
One of the aims of the serious injuries analysis is to determine a reporting time period that can be routinely used to provide meaningful and timely information on safety performance trends.
The sampling interval chosen needs to provide a data set of sufficient size and duration that it would be representative of longer term trends but also capture more recent activity. Since late 2002, reporting and quality assurance standards have been sufficiently consistent to provide a reliable base for comparison purposes. Hence, to select the appropriate sampling interval, serious injury data was collated and summarised for 2002 to 2013.
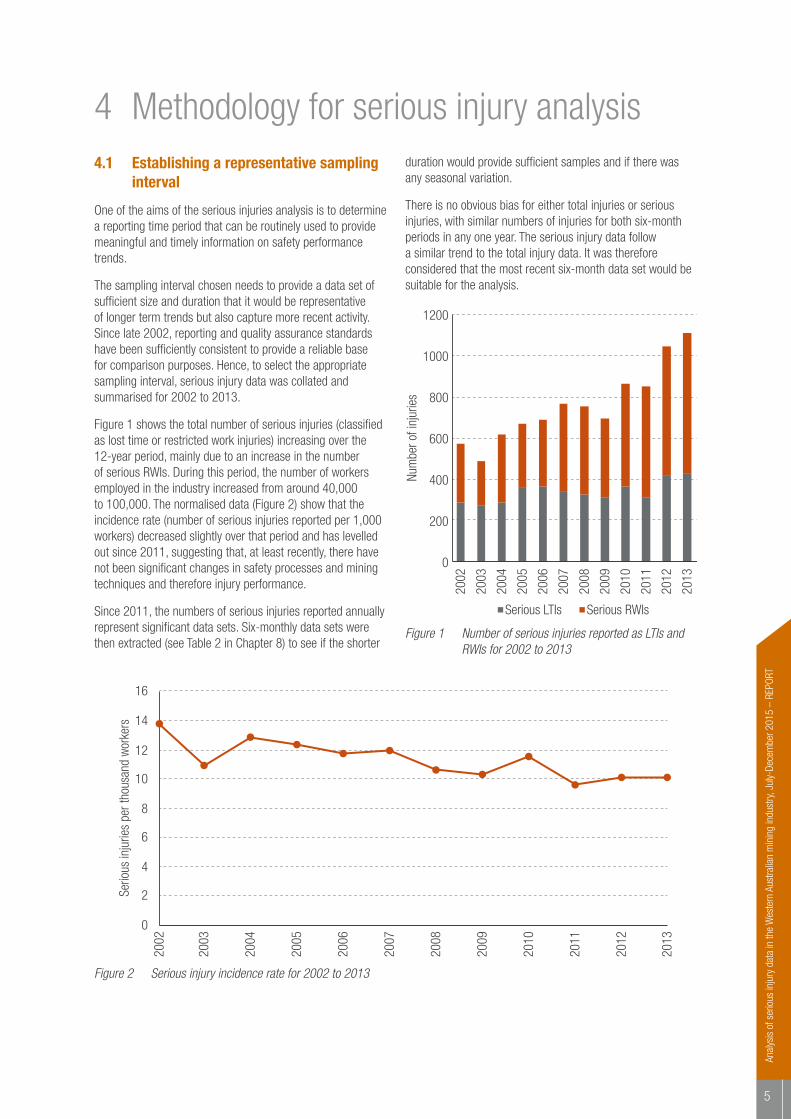
Figure 1 shows the total number of serious injuries (classified as lost time or restricted work injuries) increasing over the 12-year period, mainly due to an increase in the number of serious RWIs. During this period, the number of workers employed in the industry increased from around 40,000 to 100,000. The normalised data (Figure 2) show that the incidence rate (number of serious injuries reported per 1,000 workers) decreased slightly over that period and has levelled out since 2011, suggesting that, at least recently, there have not been significant changes in safety processes and mining techniques and therefore injury performance.
Since 2011, the numbers of serious injuries reported annually represent significant data sets. Six-monthly data sets were then extracted (see Table 2 in Chapter 8) to see if the shorter
duration would provide sufficient samples and if there was any seasonal variation.
There is no obvious bias for either total injuries or serious injuries, with similar numbers of injuries for both six-month periods in any one year. The serious injury data follow a similar trend to the total injury data. It was therefore considered that the most recent six-month data set would be suitable for the analysis.
0
200
400
600
800
1000
1200
2002
2003
2004
2005
2006
2007
2008
2009
2010
2011
2012
2013
Serious LTIs Serious RWIs
Num
ber o
f inj
urie
s
Figure 1 Number of serious injuries reported as LTIs and RWIs for 2002 to 2013
0
2
4
6
8
10
12
14
16
2002
2003
2004
2005
2006
2007
2008
2009
2010
2011
2012
2013
Serio
us in
jurie
s pe
r tho
usan
d w
orke
rs
Figure 2 Serious injury incidence rate for 2002 to 2013
Analysis of serious injury data in the Western Australian m
ining industry, July-December 2013 – REPORT
6
4.2 Data sets used in analysis
The six-month period of injury data chosen for analysis covers the period from 1 July to 31 December 2013. This represents the most recent data that had been quality assured at the commencement of the review.
A total of 837 injuries were reported for the review period. This included information on 658 serious injuries, of which 3 were fatalities. There were 179 injuries classified as being minor.
To complement the more detailed analysis of the serious injury data, occurrence reports for this time period were also used to help clarify the details of some serious injuries. The occurrence data set was subsequently used in the development of the industry risk profile (1,036 occurrences with no injury reported).
4.3 Grouping data
Initially, attempts were made to analyse the injury data using the individual codes assigned at the QA stage. However, the graphs produced were essentially flat with the data appearing as a cloud of unrelated items. Subsequently, the coded serious injury data was grouped by similar occupation groups, activities and injury outcomes. This provided a much clearer pattern of hazard exposures and causation factors in the sample of serious injuries.
At the QA stage, information (e.g. occupation, injury type) is coded, which allows injury data to be grouped in multiple ways for further analysis, including determining injury severity.
A variety of charts was then developed to illustrate causation factors for serious injuries in a manner consistent with the fatalities review. This allowed analysis of possible correlations with the causation factors identified in the fatalities review.
Three-dimensional plots proved useful for assessing trends and clusters of data when two variables were analysed. The plots are presented in this report as screen grabs together with the data plotted conventionally on bar graphs.
Note: The order of items may differ between the three-dimensional plots, which represent the original output, and the bar graphs, where items have been arranged to reflect the review discussion.
4.4 Limitations resulting from reporting requirements under legislation
The definition of serious injury in the Mines Safety and Inspection Act 1994 does not differentiate injury severity. Rather, it captures injuries that result in a person being away from normal work for two or more weeks. In some circumstances, the mechanism of the serious injury is considered unlikely to result in a fatal or severe physical injury, but it is those circumstances where it may that are the subject of this analysis.
Note: The definition of serious injury in the Model Work Occupational Health and Safety Act differs from that in the Mines Safety and Inspection Act 1994 as it relates to injury type rather than time off work.
Another limitation is that the detail of information reported for injuries is not as in-depth as that provided or gathered for fatality investigations. The key latent conditions for fatal accidents discussed in Section 2.3 could be identified because these incidents were investigated in detail by mines inspectors to a consistent standard over the 13-year period. Unfortunately, similar latent conditions cannot be identified using the injury and occurrence data, which is submitted by mines in accordance with the requirements of the Mines Safety and Inspection Act 1994 — detailed reports are not required for all incidents. However, the notification format approved by the State Mining Engineer does cover active failures associated with incidents. Consequently, comparisons with the fatalities review could be made using active failures identified in the reports.
Also, although medically treated injuries may be an outcome of a potentially serious (or near miss) incident, they are not required to be reported and therefore the lessons learnt are not captured in this analysis.
The occupation, injury type, work activity and nature of injury could not be determined for one injury report. This injury report was not included in the data set where such information was required for the analysis.
Incidence rate (per thousand workers) is used in this report rather than frequency rate (per million hours worked) because the values are higher, allowing comparison of rates at a reasonable scale.
Note: The workforce numbers used to determine incidence rates are based on 2,000 hours worked per year being equivalent to one full-time worker.
Anal
ysis
of s
erio
us in
jury
dat
a in
the
Wes
tern
Aus
tralia
n m
inin
g in
dust
ry, J
uly-
Dece
mbe
r 201
5 –
REPO
RT
7
5 Analysis of injury data for 1 July to 31 December 20135.1 All injury data
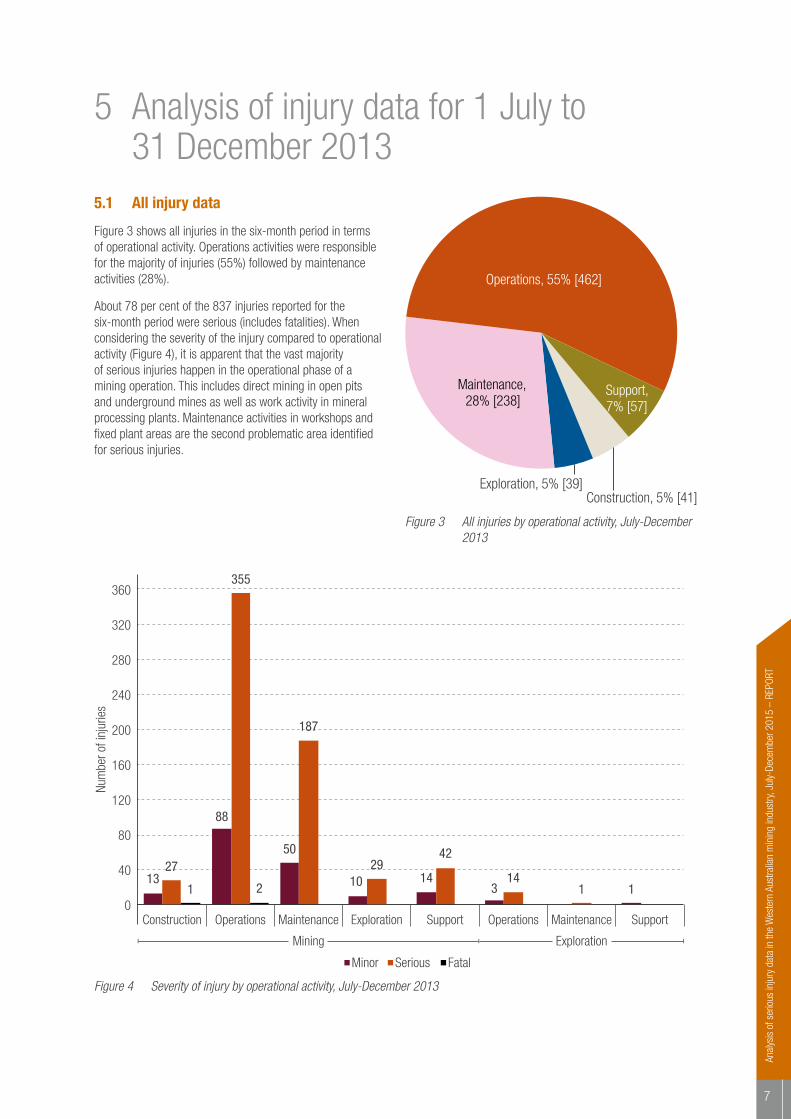
Figure 3 shows all injuries in the six-month period in terms of operational activity. Operations activities were responsible for the majority of injuries (55%) followed by maintenance activities (28%).
About 78 per cent of the 837 injuries reported for the six-month period were serious (includes fatalities). When considering the severity of the injury compared to operational activity (Figure 4), it is apparent that the vast majority of serious injuries happen in the operational phase of a mining operation. This includes direct mining in open pits and underground mines as well as work activity in mineral processing plants. Maintenance activities in workshops and fixed plant areas are the second problematic area identified for serious injuries.
Construction, 5% [41]Exploration, 5% [39]
Maintenance, 28% [238]
Operations, 55% [462]
Support, 7% [57]
Figure 3 All injuries by operational activity, July-December 2013
1 1 12 3
50
88
141327
10 29
187
355
42
0
40
80
120
160
200
240
280
320
360
Fatal Minor Serious
Construction Operations Maintenance Exploration Support Operations Maintenance Support
Mining Exploration
14
Num
ber o
f inj
urie
s
Figure 4 Severity of injury by operational activity, July-December 2013
Analysis of serious injury data in the Western Australian m
ining industry, July-December 2013 – REPORT
8
5.2 Serious injury data
To compare serious injuries with the outcomes of the fatalities review, the information from the serious injury reports was analysed in the same manner.
Serious injuries by employment arrangements
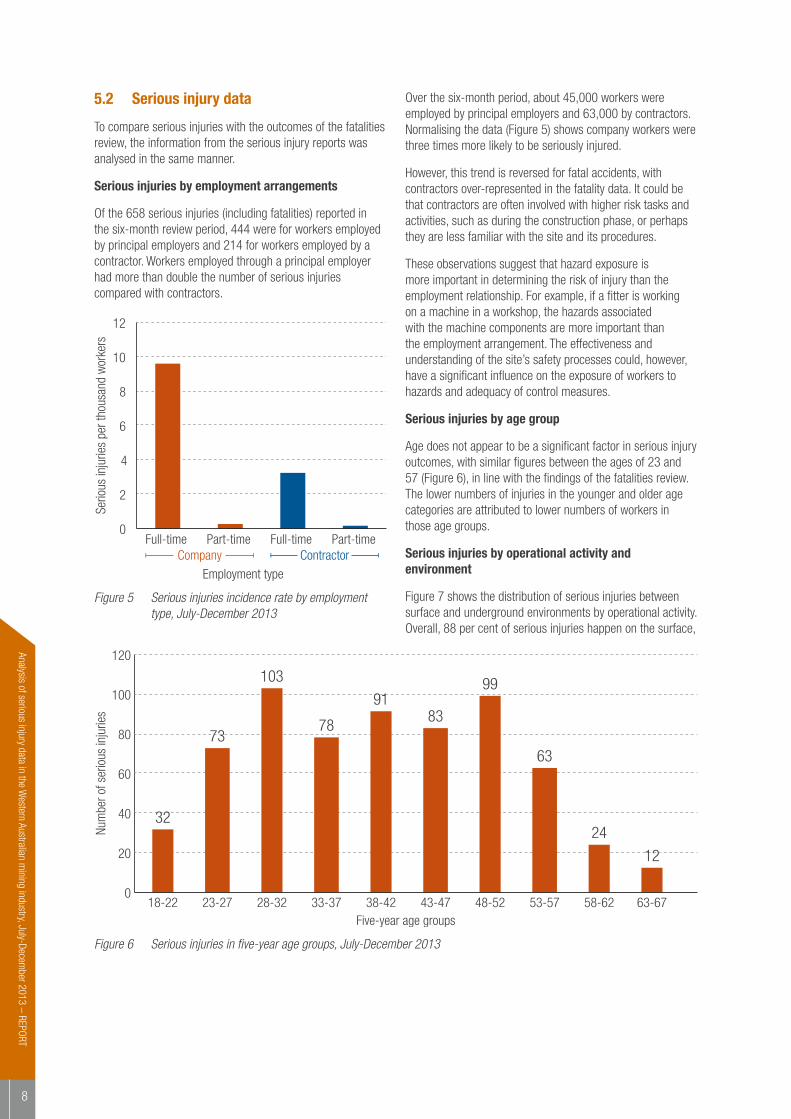
Of the 658 serious injuries (including fatalities) reported in the six-month review period, 444 were for workers employed by principal employers and 214 for workers employed by a contractor. Workers employed through a principal employer had more than double the number of serious injuries compared with contractors.
Figure 5 Serious injuries incidence rate by employment type, July-December 2013
Over the six-month period, about 45,000 workers were employed by principal employers and 63,000 by contractors. Normalising the data (Figure 5) shows company workers were three times more likely to be seriously injured.
However, this trend is reversed for fatal accidents, with contractors over-represented in the fatality data. It could be that contractors are often involved with higher risk tasks and activities, such as during the construction phase, or perhaps they are less familiar with the site and its procedures.
These observations suggest that hazard exposure is more important in determining the risk of injury than the employment relationship. For example, if a fitter is working on a machine in a workshop, the hazards associated with the machine components are more important than the employment arrangement. The effectiveness and understanding of the site’s safety processes could, however, have a significant influence on the exposure of workers to hazards and adequacy of control measures.
Serious injuries by age group
Age does not appear to be a significant factor in serious injury outcomes, with similar figures between the ages of 23 and 57 (Figure 6), in line with the findings of the fatalities review. The lower numbers of injuries in the younger and older age categories are attributed to lower numbers of workers in those age groups.
Serious injuries by operational activity and environment
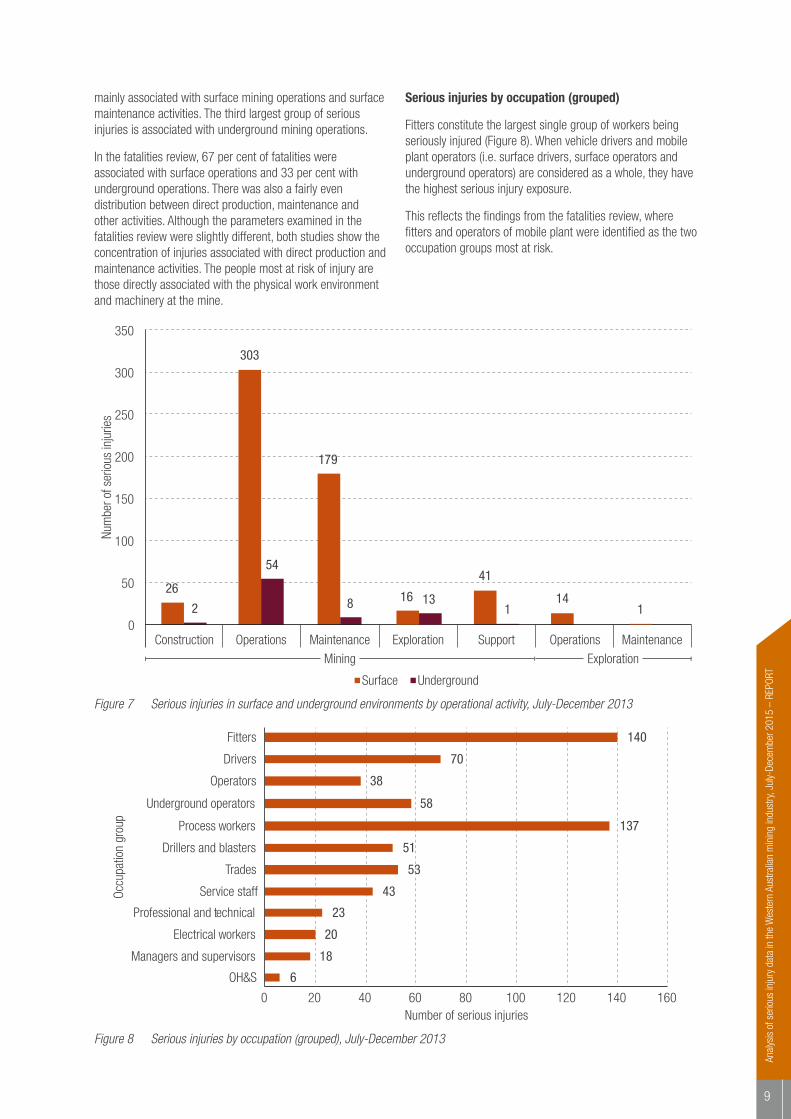
Figure 7 shows the distribution of serious injuries between surface and underground environments by operational activity. Overall, 88 per cent of serious injuries happen on the surface,
0
2
4
6
8
10
12
Full-time Company
Part-time Full-time Part-time
Employment type
Serio
us in
jurie
s pe
r tho
usan
d w
orke
rs
Contractor
0
20
40
60
80
100
120
Five-year age groups
Num
ber o
f ser
ious
inju
ries
18-22 23-27 28-32 33-37 38-42 43-47 48-52 53-57 58-62 63-67
32
73
103
78
9183
99
63
24
12
Figure 6 Serious injuries in five-year age groups, July-December 2013
Anal
ysis
of s
erio
us in
jury
dat
a in
the
Wes
tern
Aus
tralia
n m
inin
g in
dust
ry, J
uly-
Dece
mbe
r 201
5 –
REPO
RT
9
mainly associated with surface mining operations and surface maintenance activities. The third largest group of serious injuries is associated with underground mining operations.
In the fatalities review, 67 per cent of fatalities were associated with surface operations and 33 per cent with underground operations. There was also a fairly even distribution between direct production, maintenance and other activities. Although the parameters examined in the fatalities review were slightly different, both studies show the concentration of injuries associated with direct production and maintenance activities. The people most at risk of injury are those directly associated with the physical work environment and machinery at the mine.
Serious injuries by occupation (grouped)
Fitters constitute the largest single group of workers being seriously injured (Figure 8). When vehicle drivers and mobile plant operators (i.e. surface drivers, surface operators and underground operators) are considered as a whole, they have the highest serious injury exposure.
This reflects the findings from the fatalities review, where fitters and operators of mobile plant were identified as the two occupation groups most at risk.
26
179
303
41
14 2 8
54
1 0
50
100
150
200
250
300
350
Construction
16 13
ExplorationMaintenanceOperations Support
1
MaintenanceOperations
Mining Exploration
Surface Underground
Num
ber o
f ser
ious
inju
ries
Figure 7 Serious injuries in surface and underground environments by operational activity, July-December 2013
51 Drillers and blasters
70 Drivers
20 Electrical workers
140 Fitters
18 Managers and supervisors
6 OH&S
38 Operators
137 Process workers
23 Professional and technical
53 Trades
0 20 40 60 80 100 120 140 160 Number of serious injuries
Occu
patio
n gr
oup
43 Service staff
58 Underground operators
Figure 8 Serious injuries by occupation (grouped), July-December 2013
Analysis of serious injury data in the Western Australian m
ining industry, July-December 2013 – REPORT
10
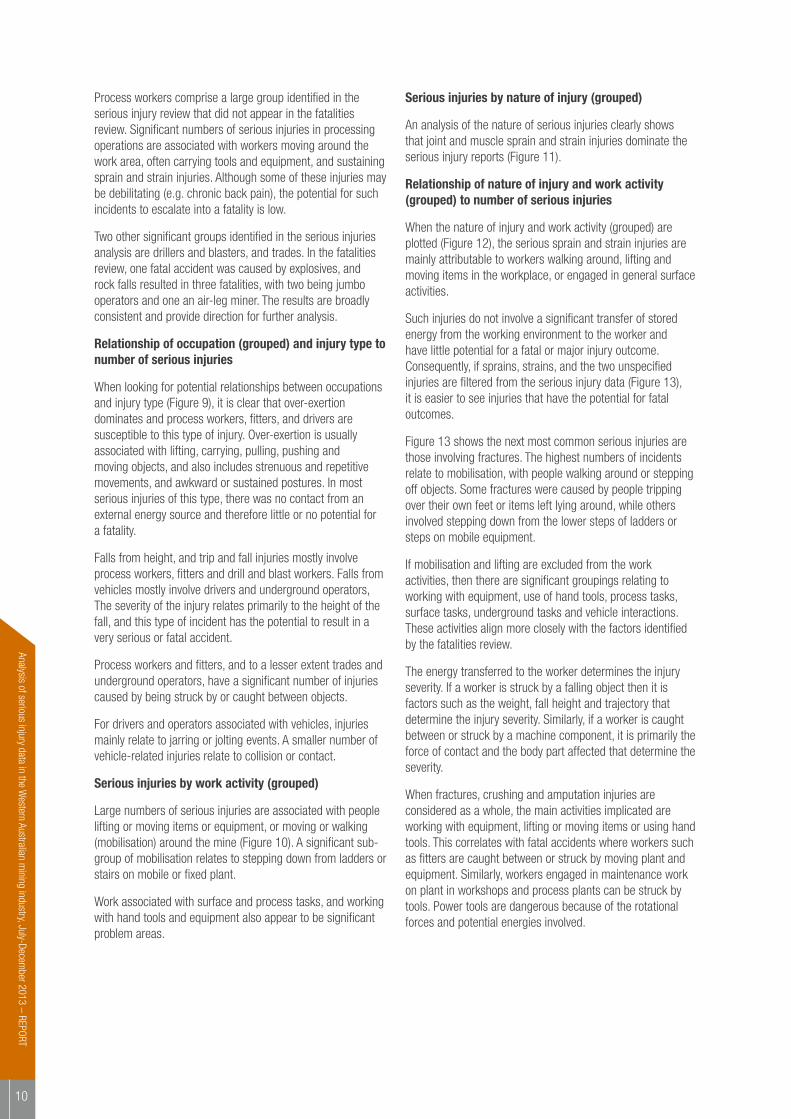
Process workers comprise a large group identified in the serious injury review that did not appear in the fatalities review. Significant numbers of serious injuries in processing operations are associated with workers moving around the work area, often carrying tools and equipment, and sustaining sprain and strain injuries. Although some of these injuries may be debilitating (e.g. chronic back pain), the potential for such incidents to escalate into a fatality is low.
Two other significant groups identified in the serious injuries analysis are drillers and blasters, and trades. In the fatalities review, one fatal accident was caused by explosives, and rock falls resulted in three fatalities, with two being jumbo operators and one an air-leg miner. The results are broadly consistent and provide direction for further analysis.
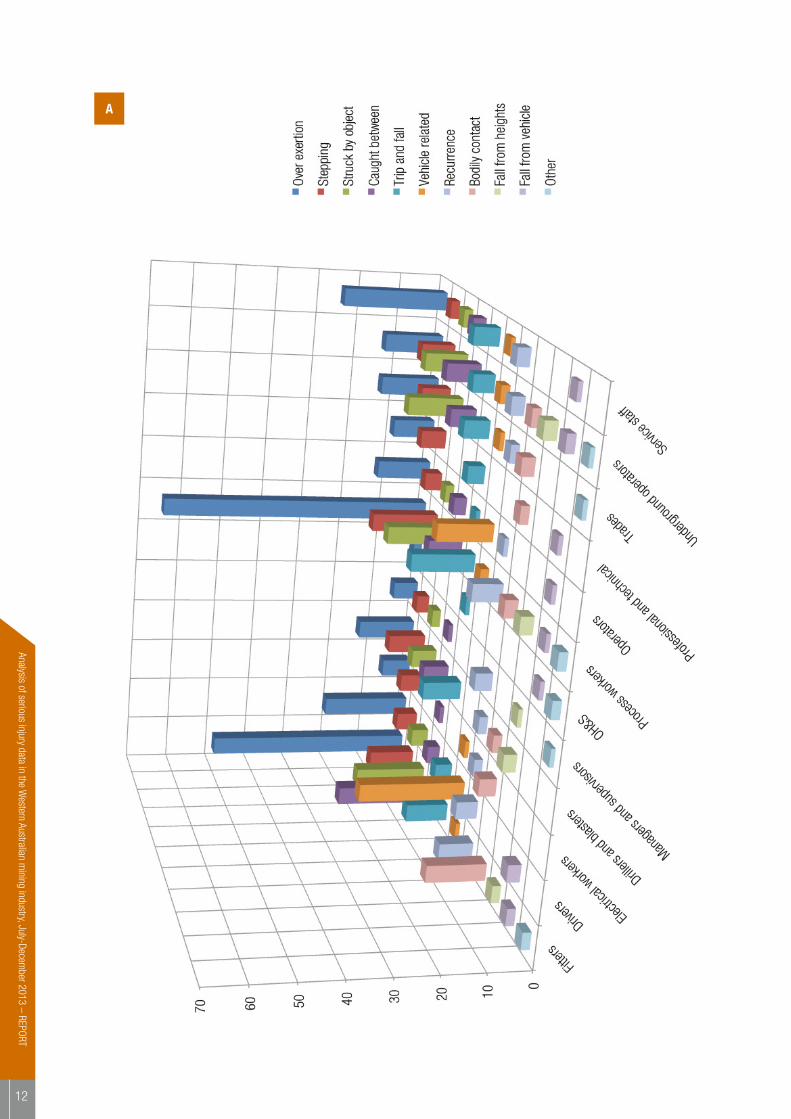
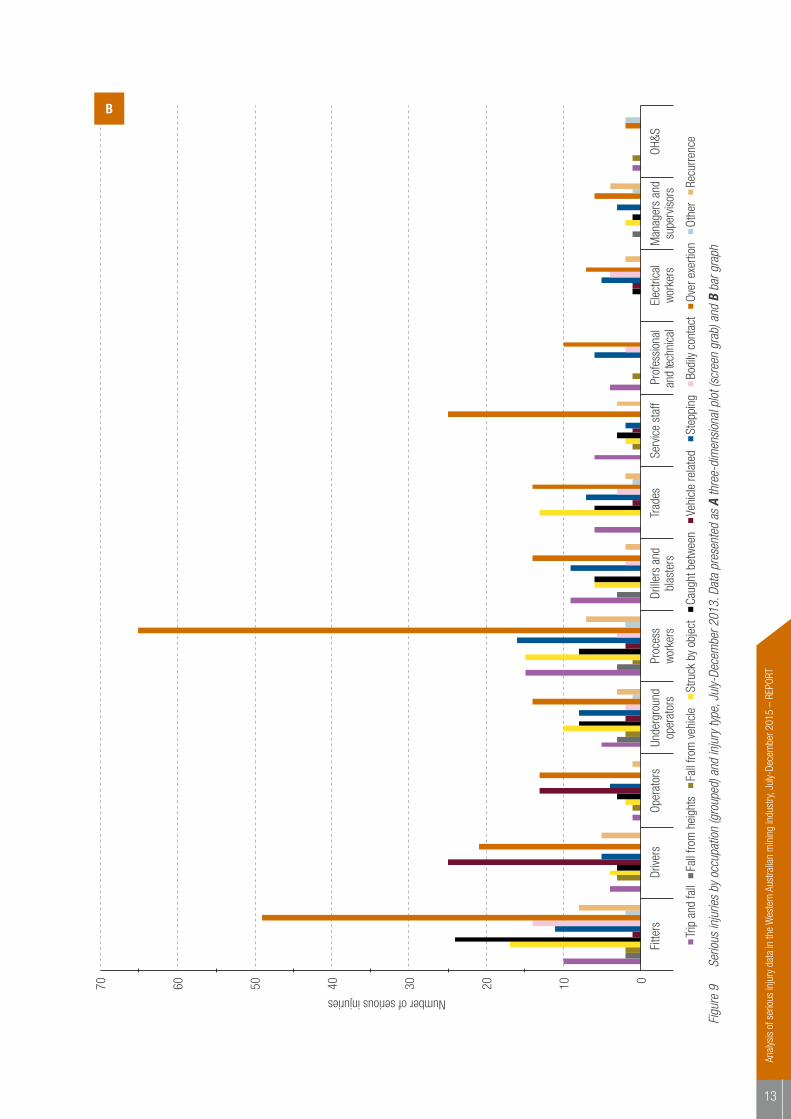
Relationship of occupation (grouped) and injury type to number of serious injuries
When looking for potential relationships between occupations and injury type (Figure 9), it is clear that over-exertion dominates and process workers, fitters, and drivers are susceptible to this type of injury. Over-exertion is usually associated with lifting, carrying, pulling, pushing and moving objects, and also includes strenuous and repetitive movements, and awkward or sustained postures. In most serious injuries of this type, there was no contact from an external energy source and therefore little or no potential for a fatality.
Falls from height, and trip and fall injuries mostly involve process workers, fitters and drill and blast workers. Falls from vehicles mostly involve drivers and underground operators, The severity of the injury relates primarily to the height of the fall, and this type of incident has the potential to result in a very serious or fatal accident.
Process workers and fitters, and to a lesser extent trades and underground operators, have a significant number of injuries caused by being struck by or caught between objects.
For drivers and operators associated with vehicles, injuries mainly relate to jarring or jolting events. A smaller number of vehicle-related injuries relate to collision or contact.
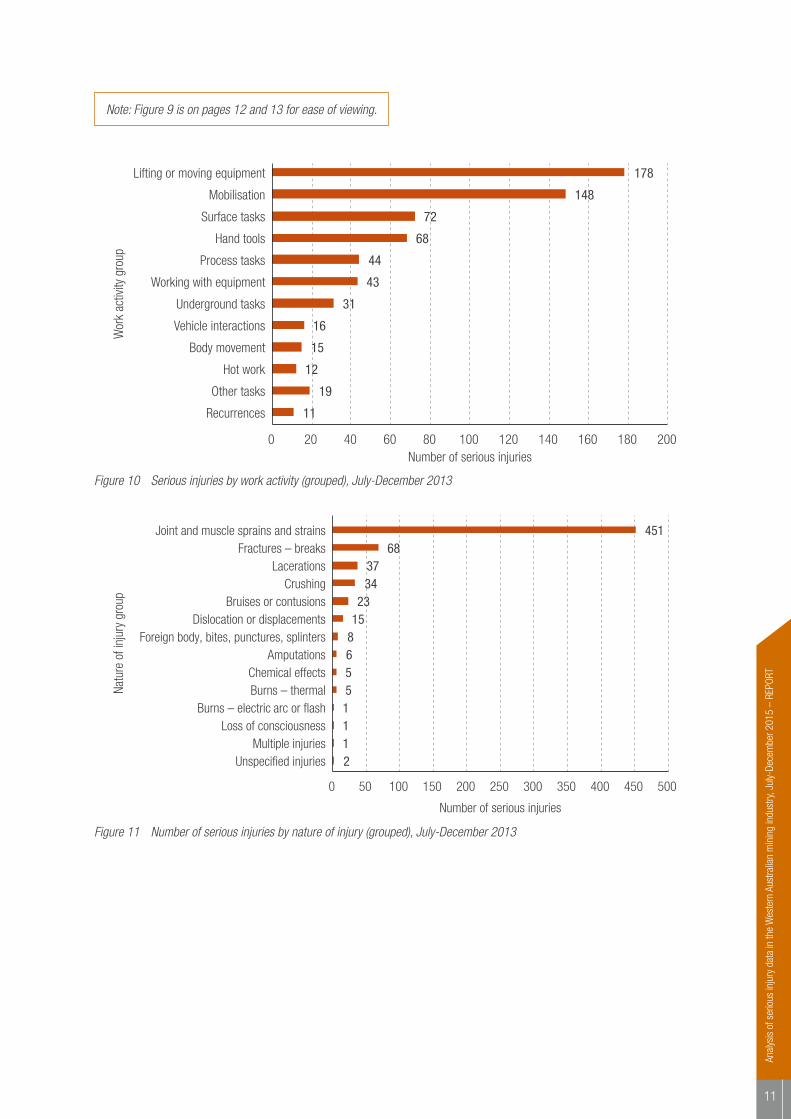
Serious injuries by work activity (grouped)
Large numbers of serious injuries are associated with people lifting or moving items or equipment, or moving or walking (mobilisation) around the mine (Figure 10). A significant sub-group of mobilisation relates to stepping down from ladders or stairs on mobile or fixed plant.
Work associated with surface and process tasks, and working with hand tools and equipment also appear to be significant problem areas.
Serious injuries by nature of injury (grouped)
An analysis of the nature of serious injuries clearly shows that joint and muscle sprain and strain injuries dominate the serious injury reports (Figure 11).
Relationship of nature of injury and work activity (grouped) to number of serious injuries
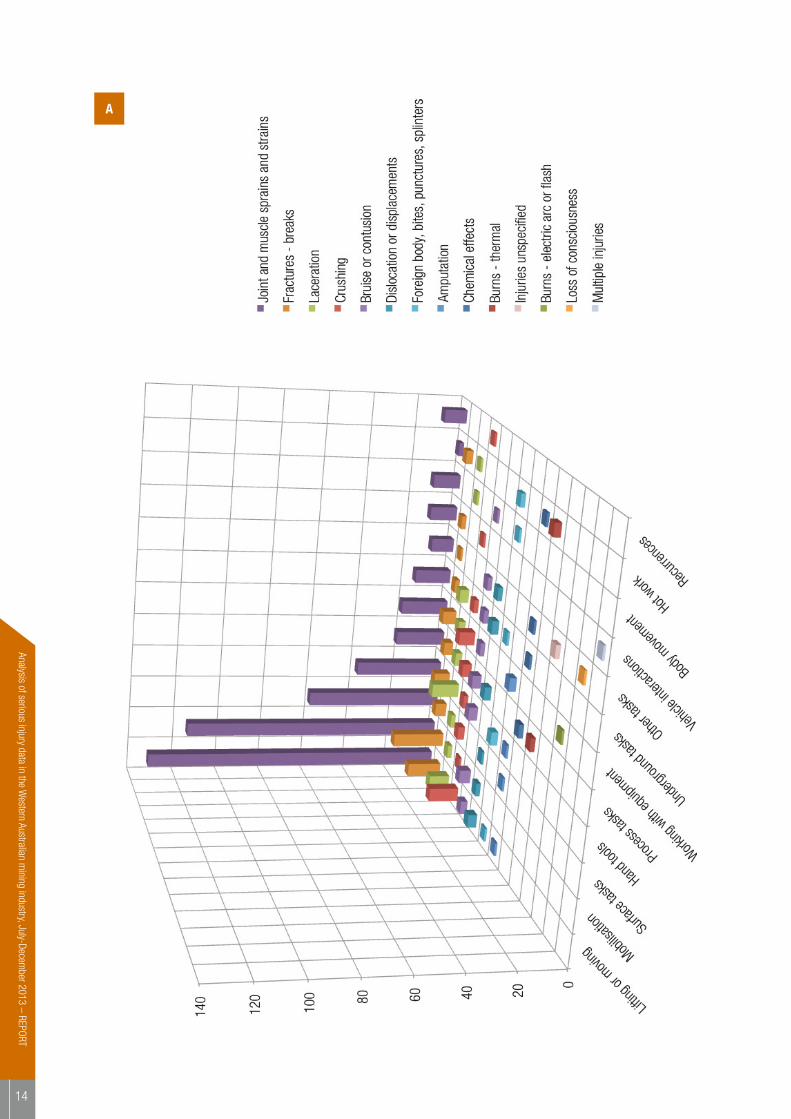
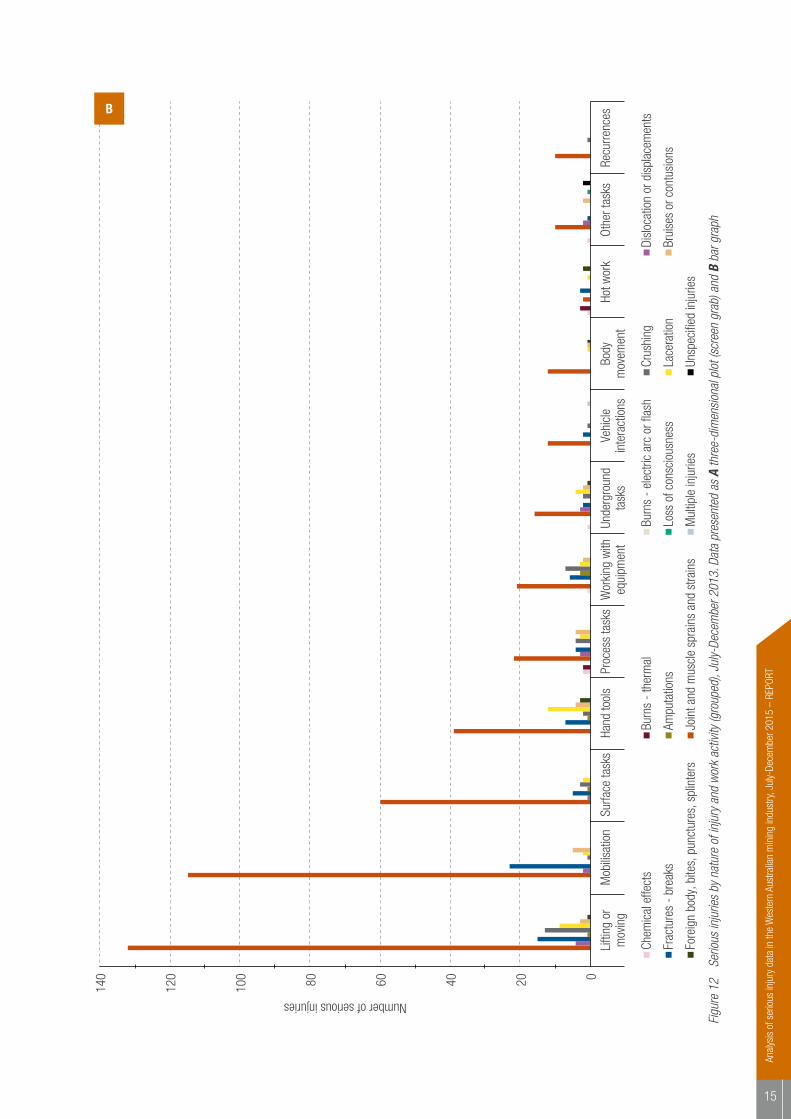
When the nature of injury and work activity (grouped) are plotted (Figure 12), the serious sprain and strain injuries are mainly attributable to workers walking around, lifting and moving items in the workplace, or engaged in general surface activities.
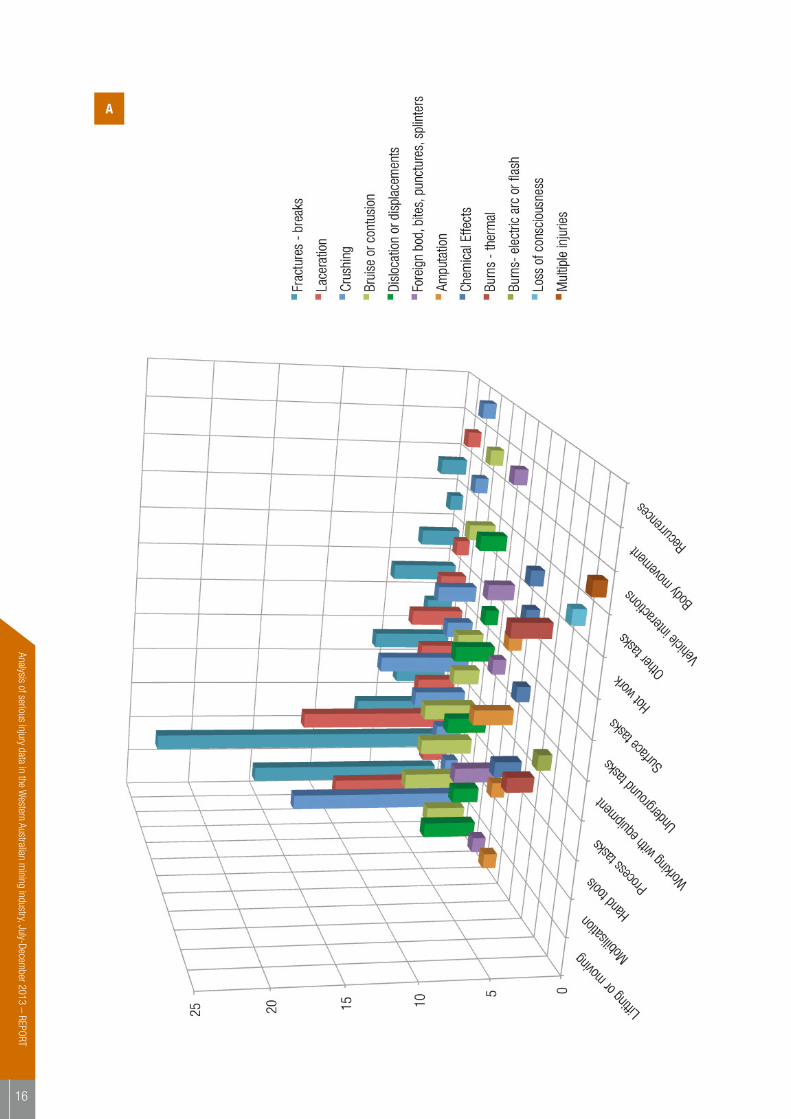
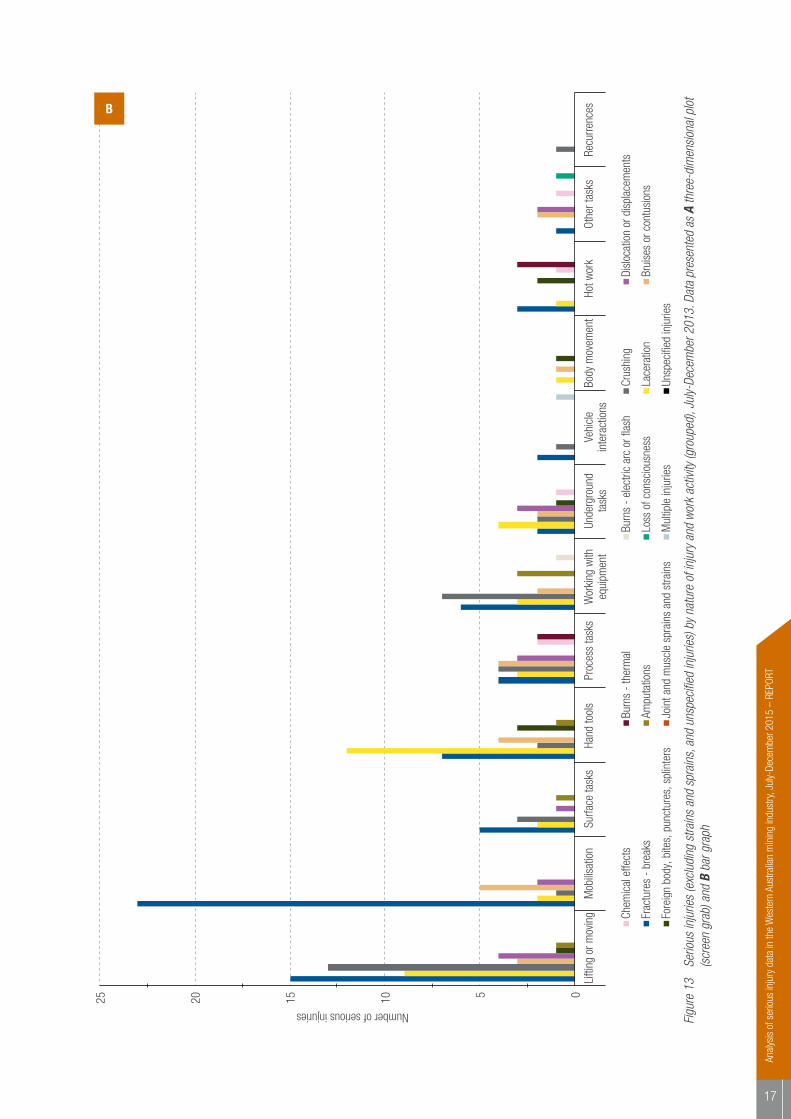
Such injuries do not involve a significant transfer of stored energy from the working environment to the worker and have little potential for a fatal or major injury outcome. Consequently, if sprains, strains, and the two unspecified injuries are filtered from the serious injury data (Figure 13), it is easier to see injuries that have the potential for fatal outcomes.
Figure 13 shows the next most common serious injuries are those involving fractures. The highest numbers of incidents relate to mobilisation, with people walking around or stepping off objects. Some fractures were caused by people tripping over their own feet or items left lying around, while others involved stepping down from the lower steps of ladders or steps on mobile equipment.
If mobilisation and lifting are excluded from the work activities, then there are significant groupings relating to working with equipment, use of hand tools, process tasks, surface tasks, underground tasks and vehicle interactions. These activities align more closely with the factors identified by the fatalities review.
The energy transferred to the worker determines the injury severity. If a worker is struck by a falling object then it is factors such as the weight, fall height and trajectory that determine the injury severity. Similarly, if a worker is caught between or struck by a machine component, it is primarily the force of contact and the body part affected that determine the severity.
When fractures, crushing and amputation injuries are considered as a whole, the main activities implicated are working with equipment, lifting or moving items or using hand tools. This correlates with fatal accidents where workers such as fitters are caught between or struck by moving plant and equipment. Similarly, workers engaged in maintenance work on plant in workshops and process plants can be struck by tools. Power tools are dangerous because of the rotational forces and potential energies involved.
Anal
ysis
of s
erio
us in
jury
dat
a in
the
Wes
tern
Aus
tralia
n m
inin
g in
dust
ry, J
uly-
Dece
mbe
r 201
5 –
REPO
RT
11
Note: Figure 9 is on pages 12 and 13 for ease of viewing.
0 20 40 60 80 100 120 140 160 180 200
11 Recurrences
19 Other tasks
148 Mobilisation
15 Body movement
178 Lifting or moving equipment
68 Hand tools
31 Underground tasks
72 Surface tasks
16 Vehicle interactions
44 Process tasks
12 Hot work
43 Working with equipment
Number of serious injuries
Wor
k ac
tivity
gro
up
Figure 10 Serious injuries by work activity (grouped), July-December 2013
0 50 100 150 200 250 300 350 400 450 500
5 Chemical effects5 Burns – thermal1 Burns – electric arc or flash
451 Joint and muscle sprains and strains
15 Dislocation or displacements
68 Fractures – breaks
6 Amputations
34 Crushing37 Lacerations
23 Bruises or contusions
8 Foreign body, bites, punctures, splinters
1 Loss of consciousness1 Multiple injuries2 Unspecified injuries
Number of serious injuries
Natu
re o
f inj
ury
grou
p
Figure 11 Number of serious injuries by nature of injury (grouped), July-December 2013
Analysis of serious injury data in the Western Australian m
ining industry, July-December 2013 – REPORT
12
A
Anal
ysis
of s
erio
us in
jury
dat
a in
the
Wes
tern
Aus
tralia
n m
inin
g in
dust
ry, J
uly-
Dece
mbe
r 201
5 –
REPO
RT
13
0 10
20
30
40
50
60
70
Drille
rs a
ndbl
aste
rsDr
ivers
Elec
trica
lw
orke
rsFi
tters
M
anag
ers
and
supe
rvis
ors
OH&S
Oper
ator
sPr
oces
sw
orke
rsPr
ofes
sion
alan
d te
chni
cal
Trad
esUn
derg
roun
dop
erat
ors
Serv
ice
staf
f
Trip
and
fall
Fall
from
hei
ghts
Fa
ll fro
m v
ehic
le
Stru
ck b
y ob
ject
Ca
ught
bet
wee
n Ve
hicl
e re
late
d St
eppi
ng
Bodi
ly co
ntac
t Ov
er e
xerti
on
Othe
r Re
curre
nce
Number of serious injuries
Figu
re 9
Se
rious
inju
ries
by o
ccup
atio
n (g
roup
ed) a
nd in
jury
type
, Jul
y-De
cem
ber 2
013.
Dat
a pr
esen
ted
as A
thre
e-di
men
siona
l plo
t (sc
reen
gra
b) a
nd B
bar
gra
ph
B
Analysis of serious injury data in the Western Australian m
ining industry, July-December 2013 – REPORT
14
A
Anal
ysis
of s
erio
us in
jury
dat
a in
the
Wes
tern
Aus
tralia
n m
inin
g in
dust
ry, J
uly-
Dece
mbe
r 201
5 –
REPO
RT
15
0 20
40
60
80
100
120
140
Recu
rrenc
esM
obilis
atio
nBo
dym
ovem
ent
Hand
tool
sUn
derg
roun
dta
sks
Surfa
ce ta
sks
Vehi
cle
inte
ract
ions
Proc
ess
task
sHo
t wor
kW
orki
ng w
itheq
uipm
ent
Othe
r tas
ks
Number of serious injuries
Loss
of c
onsc
ious
ness
Burn
s -
elec
tric
arc
or fl
ash
Lace
ratio
n
Mul
tiple
inju
ries
Crus
hing
Frac
ture
s -
brea
ks
Fore
ign
body
, bite
s, p
unct
ures
, spl
inte
rs
Chem
ical
effe
cts
Join
t and
mus
cle
spra
ins
and
stra
ins
Ampu
tatio
ns
Burn
s -
ther
mal
Brui
ses
or c
ontu
sion
s
Unsp
ecifi
ed in
jurie
s
Disl
ocat
ion
or d
ispl
acem
ents
Lifti
ng o
rm
ovin
g
Figu
re 1
2 Se
rious
inju
ries
by n
atur
e of
inju
ry a
nd w
ork
activ
ity (g
roup
ed),
July-
Dece
mbe
r 201
3. D
ata
pres
ente
d as
A th
ree-
dim
ensio
nal p
lot (
scre
en g
rab)
and
B b
ar g
raph
B
Analysis of serious injury data in the Western Australian m
ining industry, July-December 2013 – REPORT
16
A
Anal
ysis
of s
erio
us in
jury
dat
a in
the
Wes
tern
Aus
tralia
n m
inin
g in
dust
ry, J
uly-
Dece
mbe
r 201
5 –
REPO
RT
17
0 5 10
15
20
25
Lifti
ng o
r mov
ing
Mob
ilisat
ion
Hand
tool
sPr
oces
s ta
sks
Wor
king
with
equi
pmen
tUn
derg
roun
dta
sks
Surfa
ce ta
sks
Hot w
ork
Othe
r tas
ksVe
hicl
ein
tera
ctio
nsBo
dy m
ovem
ent
Recu
rrenc
es
Number of serious injuries
Loss
of c
onsc
ious
ness
Burn
s -
elec
tric
arc
or fl
ash
Lace
ratio
n
Mul
tiple
inju
ries
Crus
hing
Frac
ture
s -
brea
ks
Fore
ign
body
, bite
s, p
unct
ures
, spl
inte
rs
Chem
ical
effe
cts
Join
t and
mus
cle
spra
ins
and
stra
ins
Ampu
tatio
ns
Burn
s -
ther
mal
Brui
ses
or c
ontu
sion
s
Unsp
ecifi
ed in
jurie
s
Disl
ocat
ion
or d
ispl
acem
ents
Figu
re 1
3 Se
rious
inju
ries
(exc
ludi
ng s
train
s an
d sp
rain
s, an
d un
spec
ified
inju
ries)
by
natu
re o
f inj
ury
and
work
act
ivity
(gro
uped
), Ju
ly-De
cem
ber 2
013.
Dat
a pr
esen
ted
as A
thre
e-di
men
siona
l plo
t
(scr
een
grab
) and
B b
ar g
raph
B
Analysis of serious injury data in the Western Australian m
ining industry, July-December 2013 – REPORT
18
6 Identifying potentially significant factors for serious injuries6.1 Energy transferred
The analysis presented in Chapter 5 shows that the level of energy transferred to the worker has a strong influence on the injury outcome. It has identified factors that can lead to fatal and serious injuries as a result of physical contact between the working environment and a worker.
Two groupings of serious injuries are recognised in this analysis, categorised as follows:
• low-consequence serious injuries
• high-consequence serious injuries.
Low-consequence serious injuries
There is a large number of sprain and strain injuries, which often result in people being off work for more than two weeks. The majority of these injuries relate to activities that are unlikely to result in a fatal or a more severe serious injury, and therefore they are not analysed further.
Note: These injuries are termed low-consequence with respect to their potential to be fatal, not their potential to result in chronic or longer term health impacts.
High-consequence serious injuries
Fewer serious injuries involve a transfer of energy from the working environment to the worker, resulting in severe injuries. Significantly, the associated work activities have potential to result in fatal accidents or major physical injuries. Essentially these are the injuries that are a level of severity down from the fatal category.
The analysis identified three groups within the high-consequence serious injuries data set. One group is associated with repetitive tasks, and therefore represents a larger data set, which was assessed to determine its suitability as an indicator for fatalities. The remaining groups are associated with low-frequency incidents or rare events with high-potential outcomes.
Repetitive high-consequence serious injuries
Two combinations of injury type were identified for the common high-consequence serious injuries:
• amputations (i.e. severed body parts), fractures and crush injuries
• lacerations, dislocations or displacements, and bruises or contusions
When the associated work activities are considered, these types of injuries have causation factors in common with those identified in the fatalities review:
• falls from height
• suspended or dropped loads
• crush hazards with machines and equipment.
It should be possible to use a detailed knowledge of the risks associated with these high-consequence serious injuries to develop strategies to reduce the risk of injury and highlight fatality potentials. This proposal is explored further in Section 6.2.
Low-frequency high-consequence serious injuries
There is no direct correlation between the numbers of high-consequence serious injuries for vehicle accidents, rock falls, and electrical incidents, identified as critical activities in the fatalities review, and fatalities. For example, vehicle incidents represent three of the top ten categories for fatalities but their representation in the high-level serious injuries is not as pronounced.
This is probably due to the nature and frequency of the incident coupled with the stored energy associated with the work activity. If a large rock falls and hits someone, a fatal or high-consequence serious injury would result. If the rock misses the person, there is no physical injury. Similarly, for a vehicle collision or electrical contact, the outcome is likely to be either:
• a fatal or high-consequence serious injury, or
• a minor or no injury.
Rare high-consequence serious injuries
An aspect of hazard identification that is unlikely to be highlighted in a single six-month sample is that related to high-potential events. High-potential events are defined to be any incident or near miss that could, in other circumstances, have realistically resulted in one or more fatalities. Fortunately, such events are infrequent but potential scenarios must always be treated as a high priority. Examples include:
• inrushes of water, mud or fluids
• major fires
• explosions
• major pit wall failures
• major collapse of underground workings
• failures of tailings dams and waste dumps
• release of toxic or inflammable gases underground
• exposure to toxic or inflammable substances or gases on surface.
Anal
ysis
of s
erio
us in
jury
dat
a in
the
Wes
tern
Aus
tralia
n m
inin
g in
dust
ry, J
uly-
Dece
mbe
r 201
5 –
REPO
RT
19
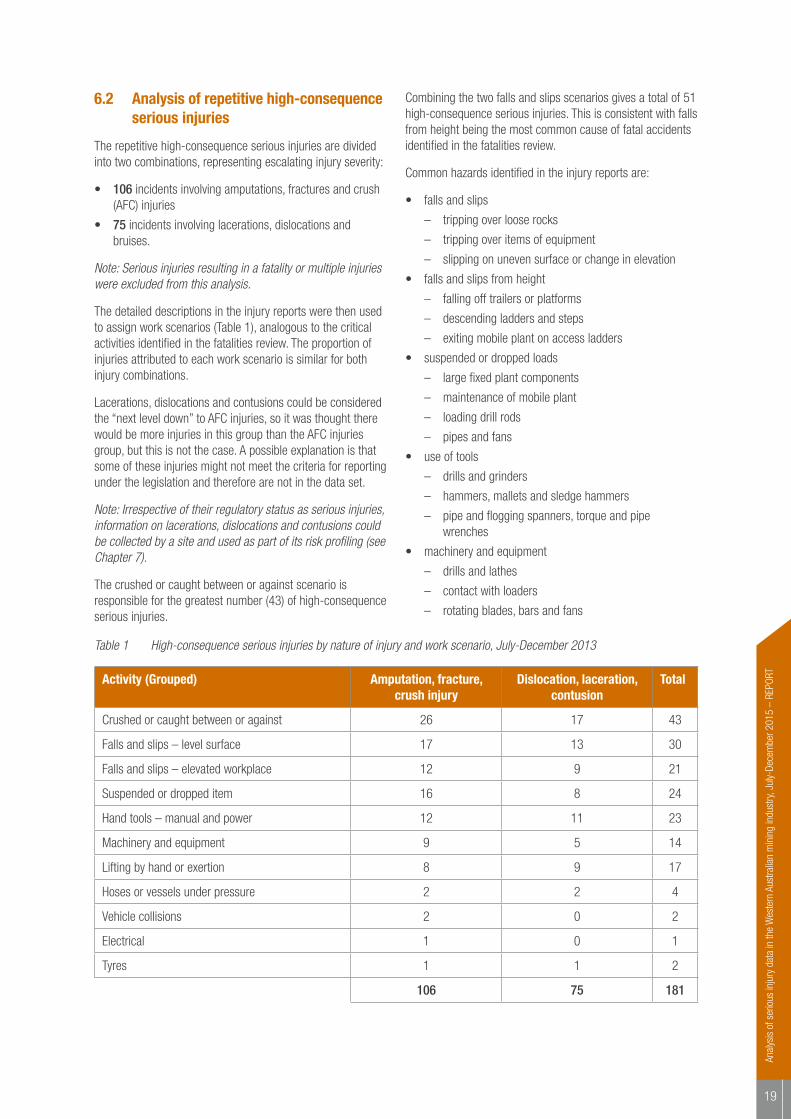
6.2 Analysis of repetitive high-consequence serious injuries
The repetitive high-consequence serious injuries are divided into two combinations, representing escalating injury severity:
• 106 incidents involving amputations, fractures and crush (AFC) injuries
• 75 incidents involving lacerations, dislocations and bruises.
Note: Serious injuries resulting in a fatality or multiple injuries were excluded from this analysis.
The detailed descriptions in the injury reports were then used to assign work scenarios (Table 1), analogous to the critical activities identified in the fatalities review. The proportion of injuries attributed to each work scenario is similar for both injury combinations.
Lacerations, dislocations and contusions could be considered the “next level down” to AFC injuries, so it was thought there would be more injuries in this group than the AFC injuries group, but this is not the case. A possible explanation is that some of these injuries might not meet the criteria for reporting under the legislation and therefore are not in the data set.
Note: Irrespective of their regulatory status as serious injuries, information on lacerations, dislocations and contusions could be collected by a site and used as part of its risk profiling (see Chapter 7).
The crushed or caught between or against scenario is responsible for the greatest number (43) of high-consequence serious injuries.
Combining the two falls and slips scenarios gives a total of 51 high-consequence serious injuries. This is consistent with falls from height being the most common cause of fatal accidents identified in the fatalities review.
Common hazards identified in the injury reports are:
• falls and slips
– tripping over loose rocks
– tripping over items of equipment
– slipping on uneven surface or change in elevation
• falls and slips from height
– falling off trailers or platforms
– descending ladders and steps
– exiting mobile plant on access ladders
• suspended or dropped loads
– large fixed plant components
– maintenance of mobile plant
– loading drill rods
– pipes and fans
• use of tools
– drills and grinders
– hammers, mallets and sledge hammers
– pipe and flogging spanners, torque and pipe wrenches
• machinery and equipment
– drills and lathes
– contact with loaders
– rotating blades, bars and fans
Table 1 High-consequence serious injuries by nature of injury and work scenario, July-December 2013
Activity (Grouped) Amputation, fracture, crush injury
Dislocation, laceration, contusion
Total
Crushed or caught between or against 26 17 43
Falls and slips – level surface 17 13 30
Falls and slips – elevated workplace 12 9 21
Suspended or dropped item 16 8 24
Hand tools – manual and power 12 11 23
Machinery and equipment 9 5 14
Lifting by hand or exertion 8 9 17
Hoses or vessels under pressure 2 2 4
Vehicle collisions 2 0 2
Electrical 1 0 1
Tyres 1 1 2
106 75 181
Analysis of serious injury data in the Western Australian m
ining industry, July-December 2013 – REPORT
20
• lifting by hand
– boxes and cabinets
– heavy machine parts
– guards and plates.
6.3 Analysis of low-frequency and rare high-consequence serious injuries
The low-frequency and rare high-consequence serious injuries are problematic when trying to establish whether there are trends and clusters in the data. Fortunately, there are few such injuries over a six-month sampling period. Rather than extend the sampling period, which defeats the aim of trying to find a data set that can provide a more immediate indication of safety performance, a more detailed analysis of the (more numerous) occurrence reports is being undertaken as part of the ongoing study of the industry risk profile.
Anal
ysis
of s
erio
us in
jury
dat
a in
the
Wes
tern
Aus
tralia
n m
inin
g in
dust
ry, J
uly-
Dece
mbe
r 201
5 –
REPO
RT
21
7 Risk profile for Western Australian mines 7.1 Establishing a risk profile for Western Australian mines
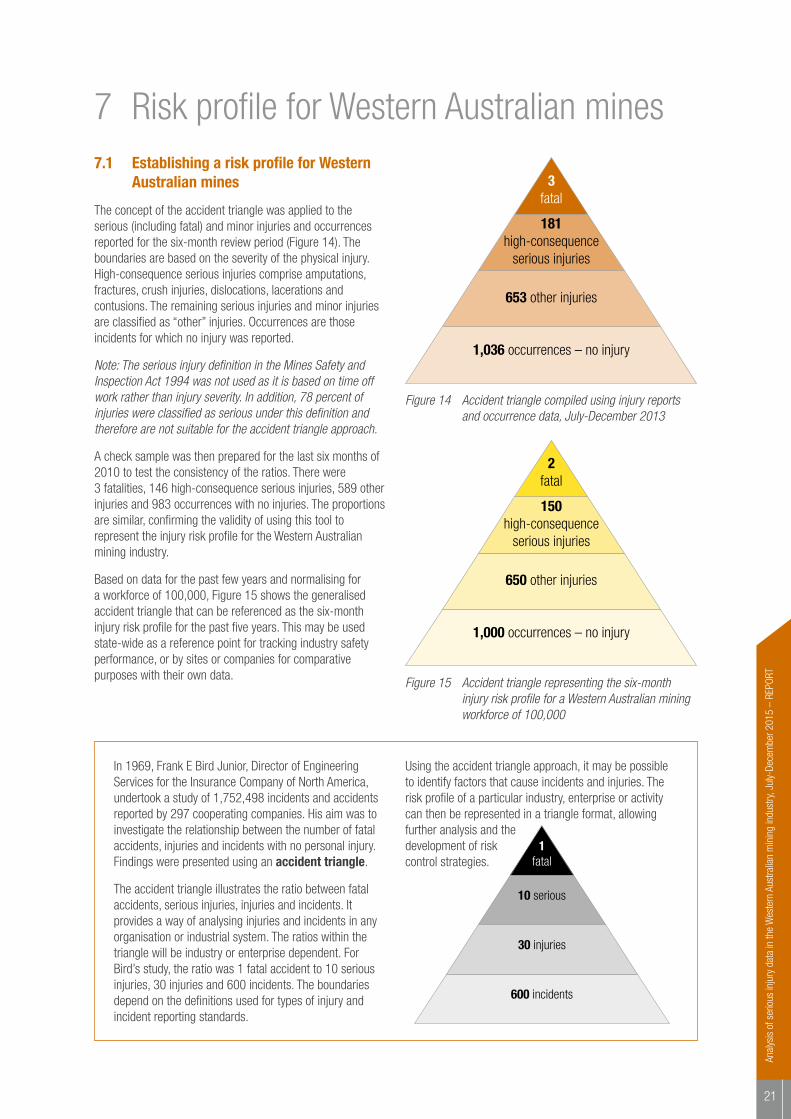
The concept of the accident triangle was applied to the serious (including fatal) and minor injuries and occurrences reported for the six-month review period (Figure 14). The boundaries are based on the severity of the physical injury. High-consequence serious injuries comprise amputations, fractures, crush injuries, dislocations, lacerations and contusions. The remaining serious injuries and minor injuries are classified as “other” injuries. Occurrences are those incidents for which no injury was reported.
Note: The serious injury definition in the Mines Safety and Inspection Act 1994 was not used as it is based on time off work rather than injury severity. In addition, 78 percent of injuries were classified as serious under this definition and therefore are not suitable for the accident triangle approach.
A check sample was then prepared for the last six months of 2010 to test the consistency of the ratios. There were 3 fatalities, 146 high-consequence serious injuries, 589 other injuries and 983 occurrences with no injuries. The proportions are similar, confirming the validity of using this tool to represent the injury risk profile for the Western Australian mining industry.
Based on data for the past few years and normalising for a workforce of 100,000, Figure 15 shows the generalised accident triangle that can be referenced as the six-month injury risk profile for the past five years. This may be used state-wide as a reference point for tracking industry safety performance, or by sites or companies for comparative purposes with their own data.
1,036 occurrences – no injury
653 other injuries
181 high-consequence
serious injuries
3 fatal
1,000 occurrences – no injury
650 other injuries
150high-consequence
serious injuries
2 fatal
In 1969, Frank E Bird Junior, Director of Engineering Services for the Insurance Company of North America, undertook a study of 1,752,498 incidents and accidents reported by 297 cooperating companies. His aim was to investigate the relationship between the number of fatal accidents, injuries and incidents with no personal injury. Findings were presented using an accident triangle.
The accident triangle illustrates the ratio between fatal accidents, serious injuries, injuries and incidents. It provides a way of analysing injuries and incidents in any organisation or industrial system. The ratios within the triangle will be industry or enterprise dependent. For Bird’s study, the ratio was 1 fatal accident to 10 serious injuries, 30 injuries and 600 incidents. The boundaries depend on the definitions used for types of injury and incident reporting standards.
Using the accident triangle approach, it may be possible to identify factors that cause incidents and injuries. The risk profile of a particular industry, enterprise or activity can then be represented in a triangle format, allowing further analysis and the development of risk control strategies.
600 incidents
30 injuries
10 serious
1 fatal
Figure 14 Accident triangle compiled using injury reports and occurrence data, July-December 2013
Figure 15 Accident triangle representing the six-month injury risk profile for a Western Australian mining workforce of 100,000
Analysis of serious injury data in the Western Australian m
ining industry, July-December 2013 – REPORT
22
A
B
0
50
100
150
200
250
474 low-consequence serious injuries 181 high-consequence serious injuries
3 fatal serious injuries
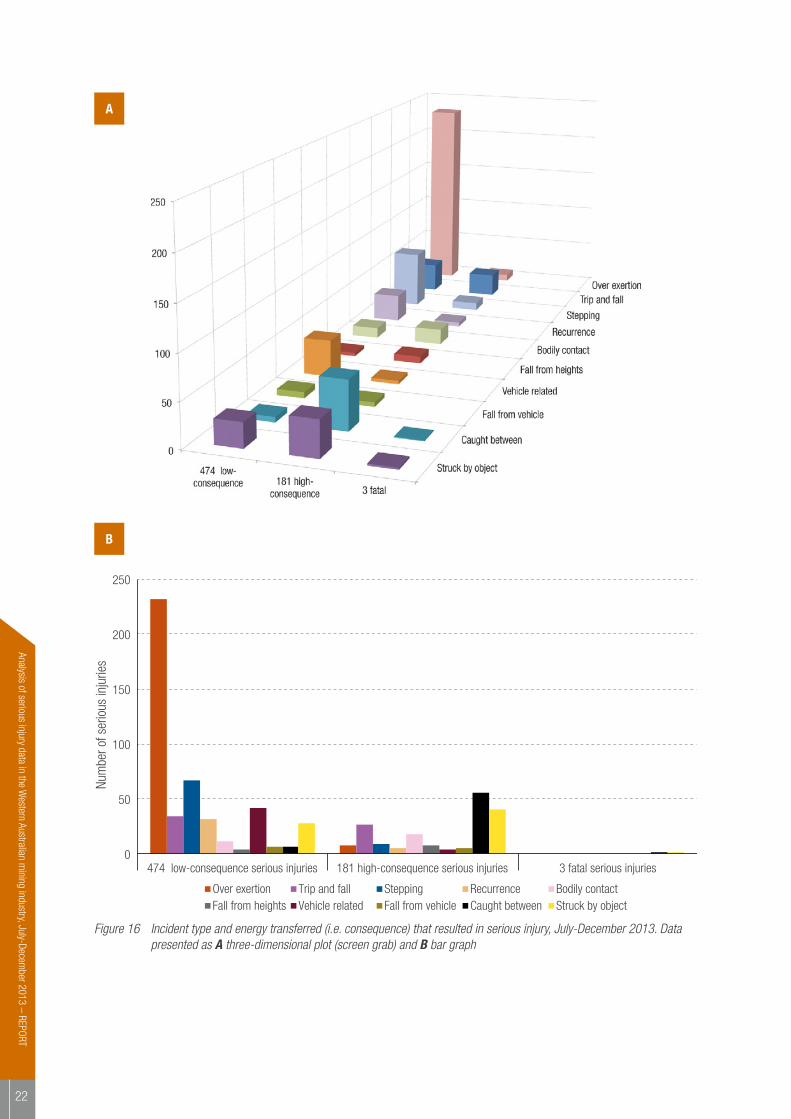
Over exertion Trip and fall Stepping Recurrence Bodily contact Fall from heights Vehicle related Fall from vehicle Caught between Struck by object
Num
ber o
f ser
ious
inju
ries
Figure 16 Incident type and energy transferred (i.e. consequence) that resulted in serious injury, July-December 2013. Data presented as A three-dimensional plot (screen grab) and B bar graph
Anal
ysis
of s
erio
us in
jury
dat
a in
the
Wes
tern
Aus
tralia
n m
inin
g in
dust
ry, J
uly-
Dece
mbe
r 201
5 –
REPO
RT
23
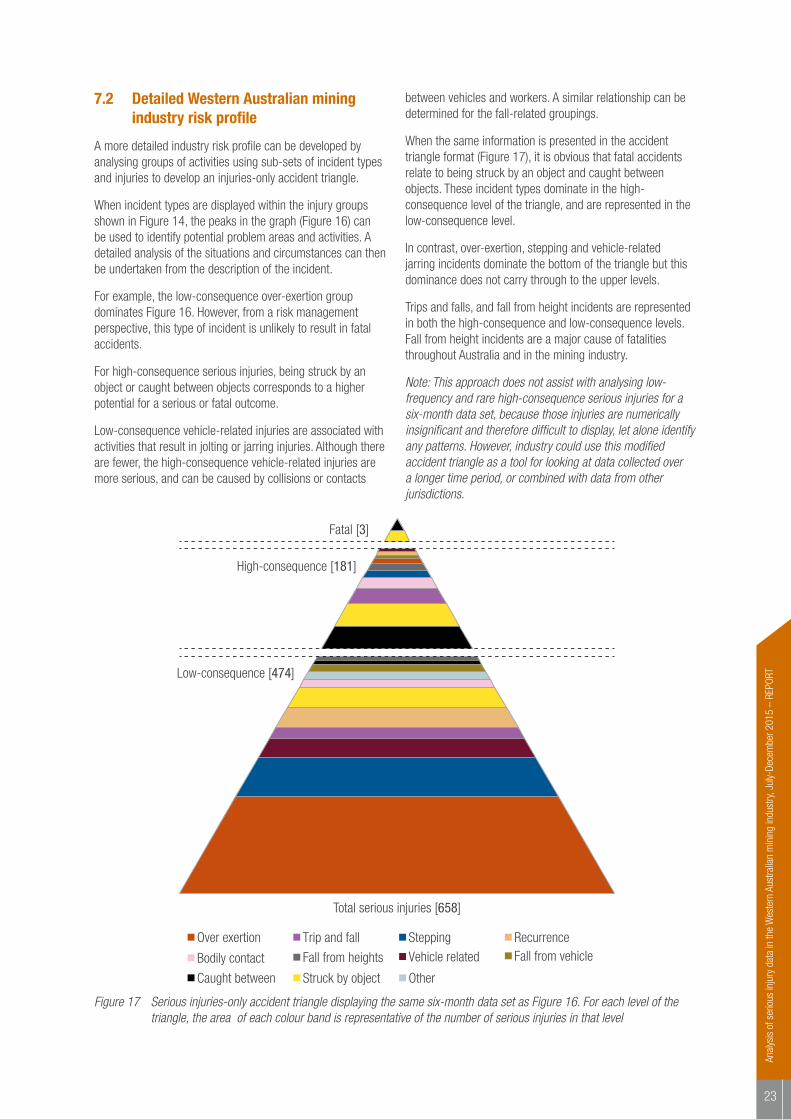
7.2 Detailed Western Australian mining industry risk profile
A more detailed industry risk profile can be developed by analysing groups of activities using sub-sets of incident types and injuries to develop an injuries-only accident triangle.
When incident types are displayed within the injury groups shown in Figure 14, the peaks in the graph (Figure 16) can be used to identify potential problem areas and activities. A detailed analysis of the situations and circumstances can then be undertaken from the description of the incident.
For example, the low-consequence over-exertion group dominates Figure 16. However, from a risk management perspective, this type of incident is unlikely to result in fatal accidents.
For high-consequence serious injuries, being struck by an object or caught between objects corresponds to a higher potential for a serious or fatal outcome.
Low-consequence vehicle-related injuries are associated with activities that result in jolting or jarring injuries. Although there are fewer, the high-consequence vehicle-related injuries are more serious, and can be caused by collisions or contacts
between vehicles and workers. A similar relationship can be determined for the fall-related groupings.
When the same information is presented in the accident triangle format (Figure 17), it is obvious that fatal accidents relate to being struck by an object and caught between objects. These incident types dominate in the high-consequence level of the triangle, and are represented in the low-consequence level.
In contrast, over-exertion, stepping and vehicle-related jarring incidents dominate the bottom of the triangle but this dominance does not carry through to the upper levels.
Trips and falls, and fall from height incidents are represented in both the high-consequence and low-consequence levels. Fall from height incidents are a major cause of fatalities throughout Australia and in the mining industry.
Note: This approach does not assist with analysing low-frequency and rare high-consequence serious injuries for a six-month data set, because those injuries are numerically insignificant and therefore difficult to display, let alone identify any patterns. However, industry could use this modified accident triangle as a tool for looking at data collected over a longer time period, or combined with data from other jurisdictions.
Over exertion Trip and fall Stepping Recurrence
Bodily contact Fall from heights Vehicle related
Other
Fall from vehicle
Caught between Struck by object
Low-consequence [474]
High-consequence [181]
Fatal [3]
Total serious injuries [658]
Figure 17 Serious injuries-only accident triangle displaying the same six-month data set as Figure 16. For each level of the triangle, the area of each colour band is representative of the number of serious injuries in that level
Analysis of serious injury data in the Western Australian m
ining industry, July-December 2013 – REPORT
24
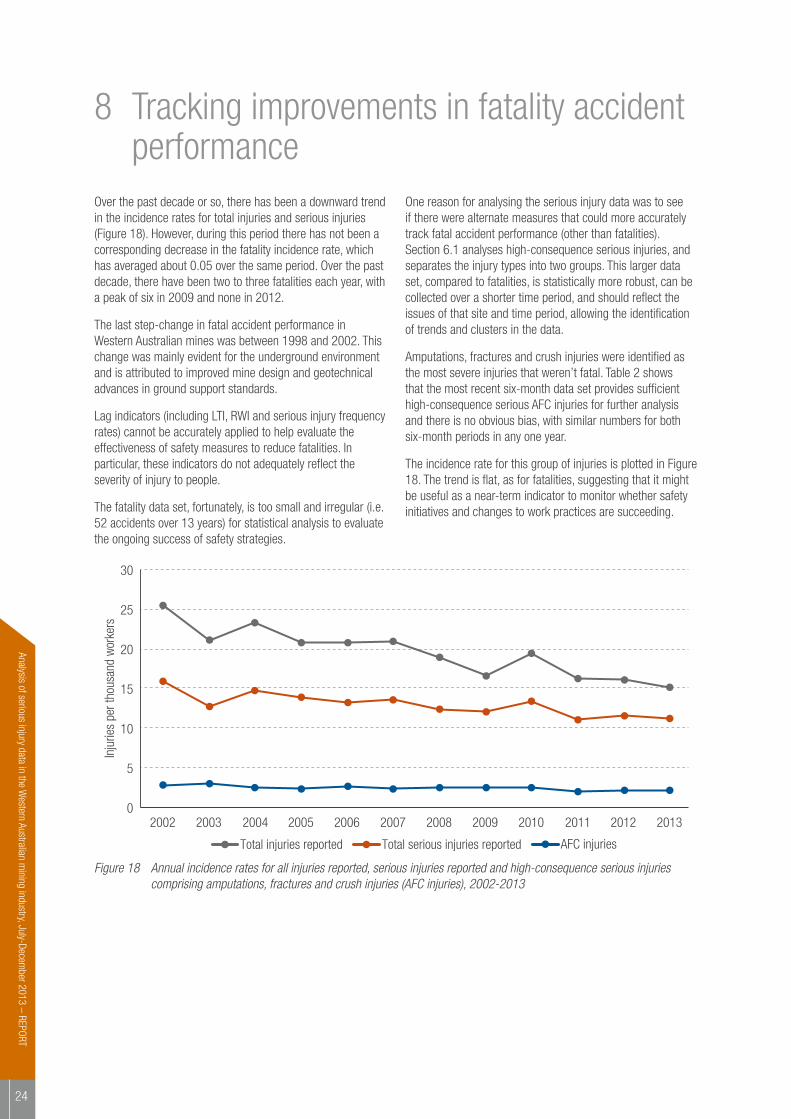
8 Tracking improvements in fatality accident performanceOver the past decade or so, there has been a downward trend in the incidence rates for total injuries and serious injuries (Figure 18). However, during this period there has not been a corresponding decrease in the fatality incidence rate, which has averaged about 0.05 over the same period. Over the past decade, there have been two to three fatalities each year, with a peak of six in 2009 and none in 2012.
The last step-change in fatal accident performance in Western Australian mines was between 1998 and 2002. This change was mainly evident for the underground environment and is attributed to improved mine design and geotechnical advances in ground support standards.
Lag indicators (including LTI, RWI and serious injury frequency rates) cannot be accurately applied to help evaluate the effectiveness of safety measures to reduce fatalities. In particular, these indicators do not adequately reflect the severity of injury to people.
The fatality data set, fortunately, is too small and irregular (i.e. 52 accidents over 13 years) for statistical analysis to evaluate the ongoing success of safety strategies.
One reason for analysing the serious injury data was to see if there were alternate measures that could more accurately track fatal accident performance (other than fatalities). Section 6.1 analyses high-consequence serious injuries, and separates the injury types into two groups. This larger data set, compared to fatalities, is statistically more robust, can be collected over a shorter time period, and should reflect the issues of that site and time period, allowing the identification of trends and clusters in the data.
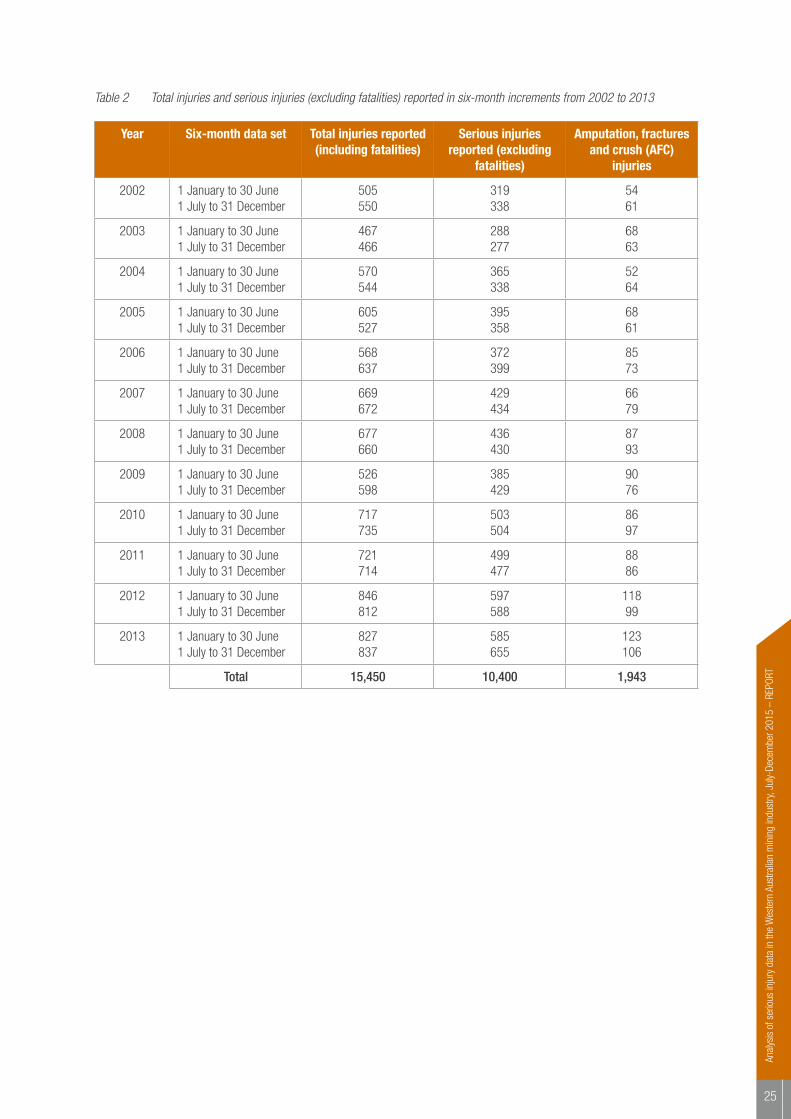
Amputations, fractures and crush injuries were identified as the most severe injuries that weren’t fatal. Table 2 shows that the most recent six-month data set provides sufficient high-consequence serious AFC injuries for further analysis and there is no obvious bias, with similar numbers for both six-month periods in any one year.
The incidence rate for this group of injuries is plotted in Figure 18. The trend is flat, as for fatalities, suggesting that it might be useful as a near-term indicator to monitor whether safety initiatives and changes to work practices are succeeding.
0
5
10
15
20
25
30
2002 2003 2004 2005 2006 2007 2008 2009 2010 2011 2012 2013
AFC injuriesTotal serious injuries reportedTotal injuries reported
Inju
ries
per t
hous
and
wor
kers
Figure 18 Annual incidence rates for all injuries reported, serious injuries reported and high-consequence serious injuries comprising amputations, fractures and crush injuries (AFC injuries), 2002-2013
Anal
ysis
of s
erio
us in
jury
dat
a in
the
Wes
tern
Aus
tralia
n m
inin
g in
dust
ry, J
uly-
Dece
mbe
r 201
5 –
REPO
RT
25
Table 2 Total injuries and serious injuries (excluding fatalities) reported in six-month increments from 2002 to 2013
Year Six-month data set Total injuries reported (including fatalities)
Serious injuries reported (excluding
fatalities)
Amputation, fractures and crush (AFC)
injuries
2002 1 January to 30 June1 July to 31 December
505550
319338
5461
2003 1 January to 30 June1 July to 31 December
467466
288277
6863
2004 1 January to 30 June1 July to 31 December
570544
365338
5264
2005 1 January to 30 June1 July to 31 December
605527
395358
6861
2006 1 January to 30 June1 July to 31 December
568637
372399
8573
2007 1 January to 30 June1 July to 31 December
669672
429434
6679
2008 1 January to 30 June1 July to 31 December
677660
436430
8793
2009 1 January to 30 June1 July to 31 December
526598
385429
9076
2010 1 January to 30 June1 July to 31 December
717735
503504
8697
2011 1 January to 30 June1 July to 31 December
721714
499477
8886
2012 1 January to 30 June1 July to 31 December
846812
597588
11899
2013 1 January to 30 June1 July to 31 December
827837
585655
123106
Total 15,450 10,400 1,943
Analysis of serious injury data in the Western Australian m
ining industry, July-December 2013 – REPORT
26
9 Strategies to address fatal and serious injury causation factors9.1 Applying findings of serious injuries analysis
Risk profiles
There is a clear advantage in analysing recent injury data rather than waiting several years for more fatal accidents before attempting to assess the latest industry risk profile.
Considering the fatal accident and serious injury data together has allowed a more comprehensive understanding of the risk profile of the Western Australian mining industry. The risk profile, presented as a six-month accident triangle (Figures 14 and 15) and a serious injuries-only six-month accident triangle (Figure 17), can be used to focus attention on the critical activities, occupations and hazards identified from this serious injuries analysis and the fatalities review.
Many companies and sites have well developed safety systems. Information from the serious injuries and fatalities reviews can be incorporated into their current systems to improve systems of work, hazard identification, training programs and supervision standards. It is recommended that mining operators modify the industry risk profile to their specific conditions. They can then use the modified risk profile to improve current systems of work, including hazard identification, control implementation, training programs and supervision standards.
The risk profiles generated by a more detailed analysis of particular industry sectors and types of mining operations may allow an even more targeted approach for safety strategies.
AFC incidence rate
Present key performance indicators (KPIs), such as incidence or frequency rates for LTIs, RWIs, total injuries reported and serious injuries reported, provide a measure of overall performance but do not reflect fatality trends. Further analysis of the serious injury data has identified a performance indicator, based on a subgroup of serious injury types, which appears to reflect fatality trends. A KPI based on the incidence rate for amputations, fractures and crush injuries (AFC) has potential as a lead indicator to measure the effectiveness of fatality prevention strategies.
Regulatory response
The Department will use these findings to identify priority targets for the minerals sector and help drive the next step change in safety performance by:
• improving hazard awareness and control selection
• promoting the adoption of appropriate risk management strategies
• supporting effective leadership and positive cultural change.
In particular, data relating to the industry risk profile and AFC injuries will be monitored and industry updated regularly.
Sites are reminded of the importance of concentrating on the identification of critical tasks and activities that can cause fatal and high-consequence serious injuries when undertaking hazard identification and developing their risk profile.
9.2 Hazard and precaution-based safety
The fatalities review showed that the majority of fatal accidents were caused by commonly occurring events and processes. The hazards associated with these accident types are well known and in most cases there are known precautions.
The repetitive high-consequence serious injury data shows similar features to those found for the fatalities review, with common incidents such as falls from height, suspended load, and machinery contacts recurring in the data.
The serious injury and fatalities reviews have independently identified that the three main hazards for all workers are:
• working at height (and subsequently falling)
• working under a suspended load or object with components than can move
• contact with machines and heavy components (with the potential to be struck or crushed).
In many work situations, simply being aware of common hazards can prevent workers from being exposed to the risk of injury. The repetitive nature of many of the incidents causing injury indicates that complex risk assessment processes are not required for most routine tasks. Significant improvements can be achieved in fatal and serious injury performance simply by consistently applying known standards and procedures.
Anal
ysis
of s
erio
us in
jury
dat
a in
the
Wes
tern
Aus
tralia
n m
inin
g in
dust
ry, J
uly-
Dece
mbe
r 201
5 –
REPO
RT
27
The concept of “golden safety rules” can be used to reinforce awareness of critical activities and appropriate controls. For example:
NEVER start work if there is a risk of falling from height.
NEVER stand under anything that can fall on you.
NEVER place any part of your body where it can be crushed.
9.3 Other strategies
The recommendations of the fatalities review should be followed to address other causation factors implicated for incidents resulting in serious injuries. These are summarised in Section 2.3.

Analysis of serious injury data in the Western Australian m
ining industry, July-December 2013 – REPORT
28
Anal
ysis
of s
erio
us in
jury
dat
a in
the
Wes
tern
Aus
tralia
n m
inin
g in
dust
ry, J
uly-
Dece
mbe
r 201
5 –
REPO
RT
29
Appendix 1 Useful resourcesDepartment of Mines and Petroleum
www.dmp.wa.gov.au/ResourcesSafety
Department of Mines and Petroleum, 2014, Fatal accidents in the Western Australian mining industry 2000-12: What lessons can we learn? – report: Investigation Services and Resources Safety Division, Department of Mines and Petroleum, Western Australia, 17 pp.
Department of Mines and Petroleum, 2013, Accident and incident reporting — guideline (3rd edition): Resources Safety, Department of Mines and Petroleum, Western Australia, 19 pp.
The Department also produces annual safety performance reports, significant incident reports, safety bulletins and incident summaries for industry awareness, which can be used by mining operations to develop their risk profiles.
International Council on Mining and Metals (ICMM)
www.icmm.com
Health and safety critical control management: good practice guide
Australian and International Standards
www.standards.org.au
AS/NZS ISO 31000 Risk management – Principles and guidelines
IEC/ISO 31010 Risk management – Risk assessment techniques
AS/NZS 4801 Occupational health and safety management systems – Specification with guidance for use


RS
D15
Aug
_901
Department of Mines and Petroleum 100 Plain Street EAST PERTH WA 6004
Investigation Services Telephone: + 61 8 9222 3333NRS: 13 36 77 Facsimile: + 61 8 9222 3862 Email: [email protected] Website: www.dmp.wa.gov.au
Resources Safety Division Telephone: + 61 8 9358 8002 NRS: 13 36 77 Facsimile: + 61 8 9358 8000 Email: [email protected] Website: www.dmp.wa.gov.au/ResourcesSafety