Embed Size (px)
Citation preview
Analysis of rockfall hazards
Introduction
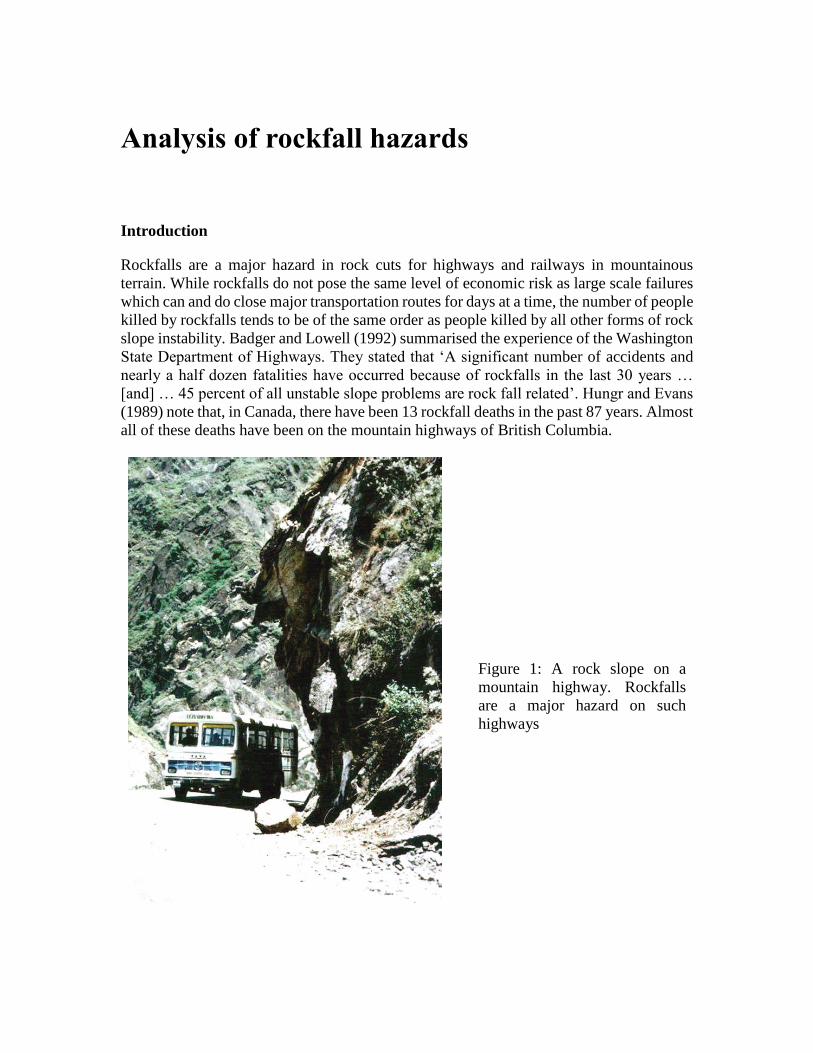
Rockfalls are a major hazard in rock cuts for highways and railways in mountainous
terrain. While rockfalls do not pose the same level of economic risk as large scale failures
which can and do close major transportation routes for days at a time, the number of people
killed by rockfalls tends to be of the same order as people killed by all other forms of rock
slope instability. Badger and Lowell (1992) summarised the experience of the Washington
State Department of Highways. They stated that ‘A significant number of accidents and
nearly a half dozen fatalities have occurred because of rockfalls in the last 30 years …
[and] … 45 percent of all unstable slope problems are rock fall related’. Hungr and Evans
(1989) note that, in Canada, there have been 13 rockfall deaths in the past 87 years. Almost
all of these deaths have been on the mountain highways of British Columbia.
Figure 1: A rock slope on a
mountain highway. Rockfalls
are a major hazard on such
highways
Analysis of rockfall hazards
2
Mechanics of rockfalls
Rockfalls are generally initiated by some climatic or biological event that causes a change
in the forces acting on a rock. These events may include pore pressure increases due to
rainfall infiltration, erosion of surrounding material during heavy rain storms, freeze-thaw
processes in cold climates, chemical degradation or weathering of the rock, root growth or
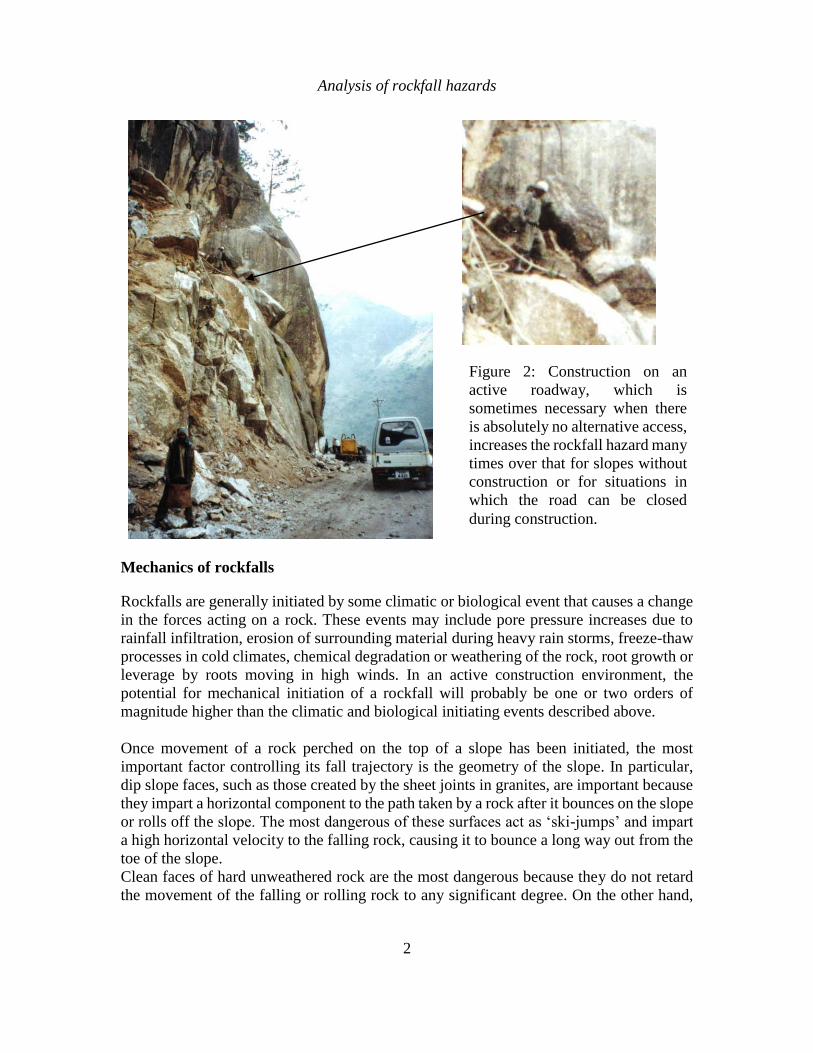
leverage by roots moving in high winds. In an active construction environment, the
potential for mechanical initiation of a rockfall will probably be one or two orders of
magnitude higher than the climatic and biological initiating events described above.
Once movement of a rock perched on the top of a slope has been initiated, the most
important factor controlling its fall trajectory is the geometry of the slope. In particular,
dip slope faces, such as those created by the sheet joints in granites, are important because
they impart a horizontal component to the path taken by a rock after it bounces on the slope
or rolls off the slope. The most dangerous of these surfaces act as ‘ski-jumps’ and impart
a high horizontal velocity to the falling rock, causing it to bounce a long way out from the
toe of the slope.
Clean faces of hard unweathered rock are the most dangerous because they do not retard
the movement of the falling or rolling rock to any significant degree. On the other hand,
Figure 2: Construction on an
active roadway, which is
sometimes necessary when there
is absolutely no alternative access,
increases the rockfall hazard many
times over that for slopes without
construction or for situations in
which the road can be closed
during construction.
Analysis of rockfall hazards
3
surfaces covered in talus material, scree or gravel absorb a considerable amount of the
energy of the falling rock and, in many cases, will stop it completely.
This retarding capacity of the surface material is expressed mathematically by a term called
the coefficient of restitution. The value of this coefficient depends upon the nature of the
materials that form the impact surface. Clean surfaces of hard rock have high coefficients
of restitution while soil, gravel and completely decomposed granite have low coefficients
of restitution. This is why gravel layers are placed on catch benches in order to prevent
further bouncing of falling rocks.
Other factors such as the size and shape of the rock boulders, the coefficients of friction of
the rock surfaces and whether or not the rock breaks into smaller pieces on impact are all
of lesser significance than the slope geometry and the coefficients of restitution described
above. Consequently, relative crude rockfall simulation models are capable of producing
reasonably accurate predictions of rockfall trajectories. Obviously more refined models
will produce better results, provided that realistic input information is available. Some of
the more recent rockfall models are those of Bozzolo et al (1988), Hungr and Evans (1989),
Spang and Rautenstrauch (1988) and Azzoni et al (1995).
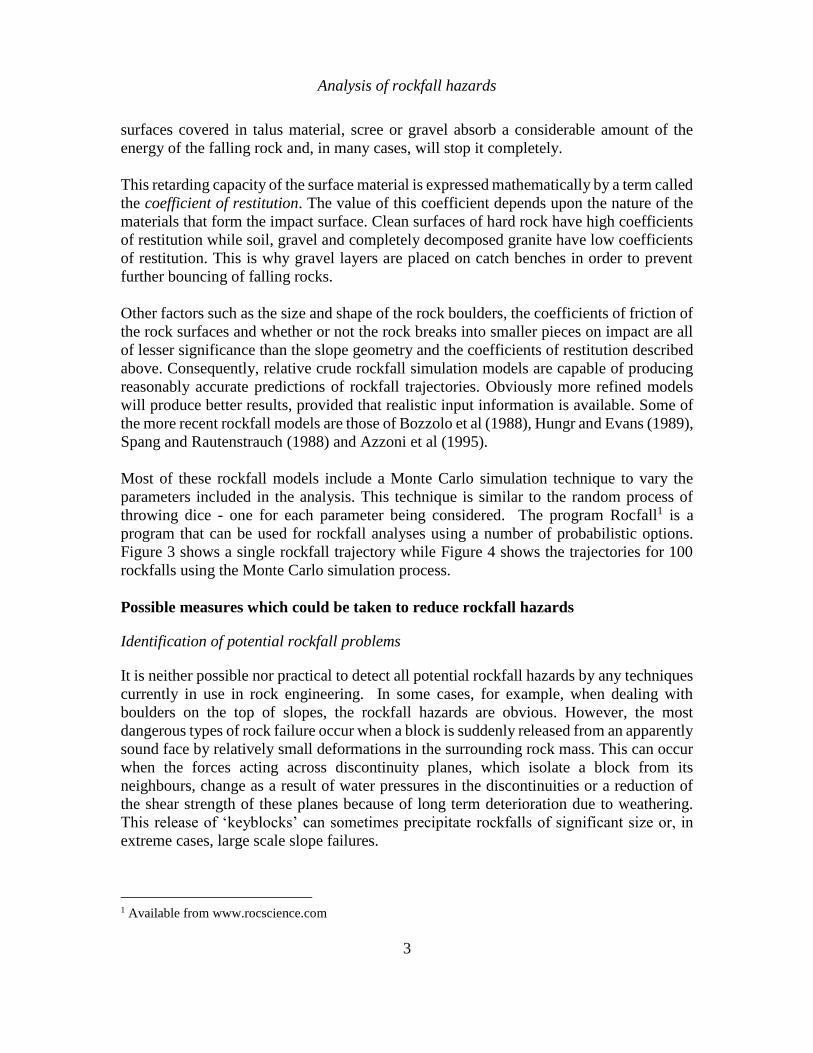
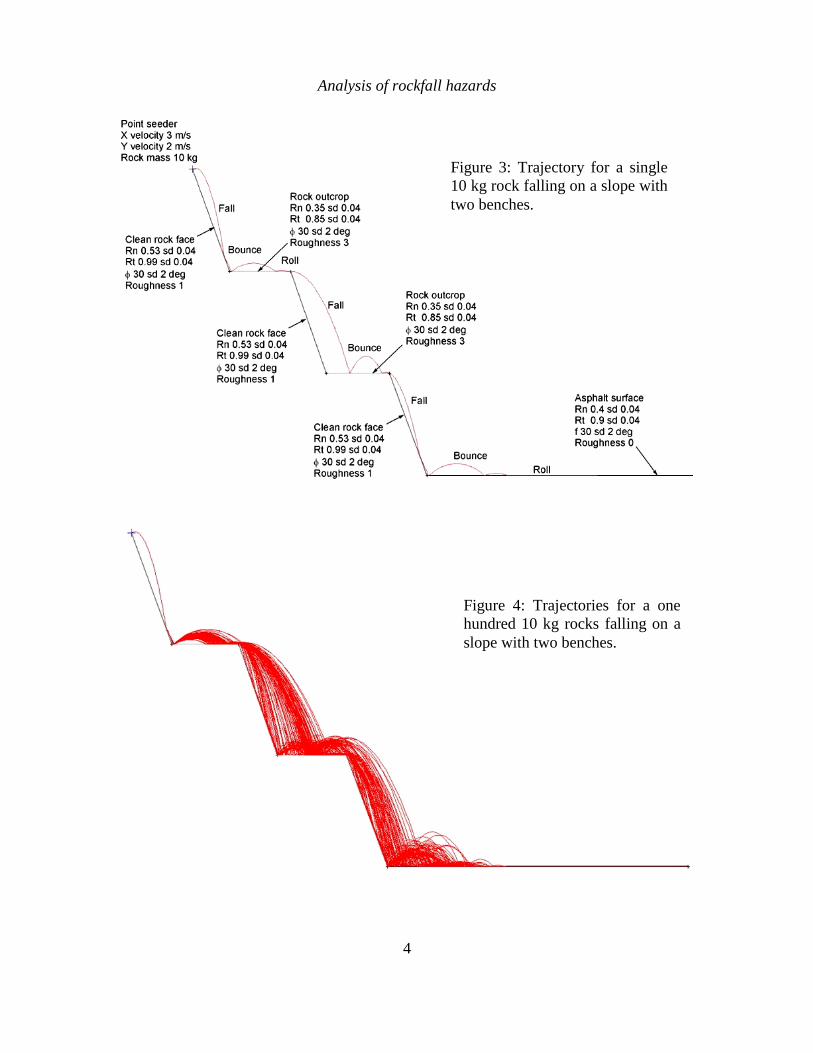
Most of these rockfall models include a Monte Carlo simulation technique to vary the
parameters included in the analysis. This technique is similar to the random process of
throwing dice - one for each parameter being considered. The program Rocfall1 is a
program that can be used for rockfall analyses using a number of probabilistic options.
Figure 3 shows a single rockfall trajectory while Figure 4 shows the trajectories for 100
rockfalls using the Monte Carlo simulation process.
Possible measures which could be taken to reduce rockfall hazards
Identification of potential rockfall problems
It is neither possible nor practical to detect all potential rockfall hazards by any techniques
currently in use in rock engineering. In some cases, for example, when dealing with
boulders on the top of slopes, the rockfall hazards are obvious. However, the most
dangerous types of rock failure occur when a block is suddenly released from an apparently
sound face by relatively small deformations in the surrounding rock mass. This can occur
when the forces acting across discontinuity planes, which isolate a block from its
neighbours, change as a result of water pressures in the discontinuities or a reduction of
the shear strength of these planes because of long term deterioration due to weathering.
This release of ‘keyblocks’ can sometimes precipitate rockfalls of significant size or, in
extreme cases, large scale slope failures.
1 Available from www.rocscience.com
Analysis of rockfall hazards
4
Figure 3: Trajectory for a single
10 kg rock falling on a slope with
two benches.
Figure 4: Trajectories for a one
hundred 10 kg rocks falling on a
slope with two benches.
Analysis of rockfall hazards
5
While it is not suggested that rock faces should not be carefully inspected for potential
rockfall problems, it should not be assumed that all rockfall hazards will be detected by
such inspections.
Reduction of energy levels associated with excavation
Traditional excavation methods for hard rock slopes involve the use of explosives. Even
when very carefully planned controlled blasts are carried out, high intensity short duration
forces act on the rock mass. Blocks and wedges which are at risk can be dislodged by these
forces. Hence, an obvious method for reducing rockfall hazards is to eliminate excavation
by blasting or by any other method, such as ripping, which imposes concentrated, short
duration forces or vibrations on the rock mass. Mechanical and hand excavation methods
can be used and, where massive rock has to be broken, chemical expanding rock breaking
agents may be appropriate.
Physical restraint of rockfalls
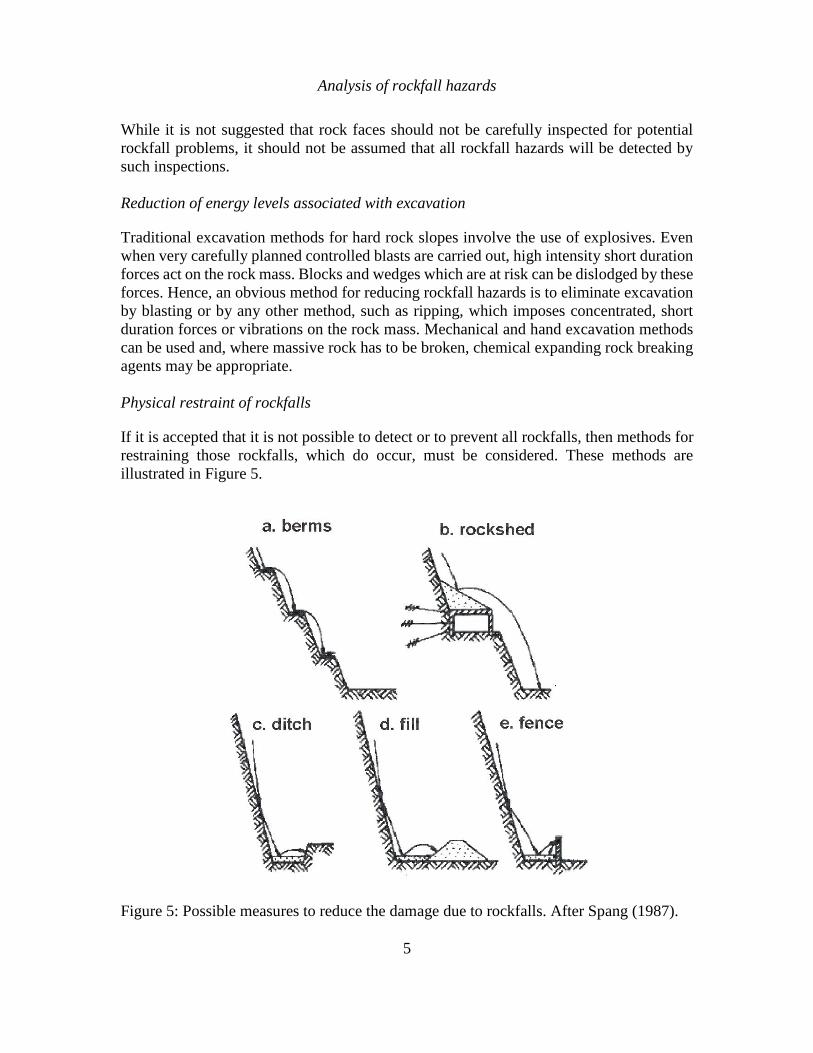
If it is accepted that it is not possible to detect or to prevent all rockfalls, then methods for
restraining those rockfalls, which do occur, must be considered. These methods are
illustrated in Figure 5.
Figure 5: Possible measures to reduce the damage due to rockfalls. After Spang (1987).
Analysis of rockfall hazards
6
Berms are a very effective means of catching rockfalls and are frequently used on
permanent slopes. However, berms can only be excavated from the top downwards and
they are of limited use in minimising the risk of rockfalls during construction.
Rocksheds or avalanche shelters are widely used on steep slopes above narrow railways
or roadways. An effective shelter requires a steeply sloping roof covering a relatively
narrow span. In the case of a wide multi-lane highway, it may not be possible to design a
rockshed structure with sufficient strength to withstand large rockfalls. It is generally
advisable to place a fill of gravel or soil on top of the rockshed in order to act as both a
retarder and a deflector for rockfalls.
Rock traps work well in catching rockfalls provided that there is sufficient room at the toe
of the slope to accommodate these rock traps. In the case of very narrow roadways at the
toe of steep slopes, there may not be sufficient room to accommodate rock traps. This
restriction also applies to earth or rock fills and to gabion walls or massive concrete walls.
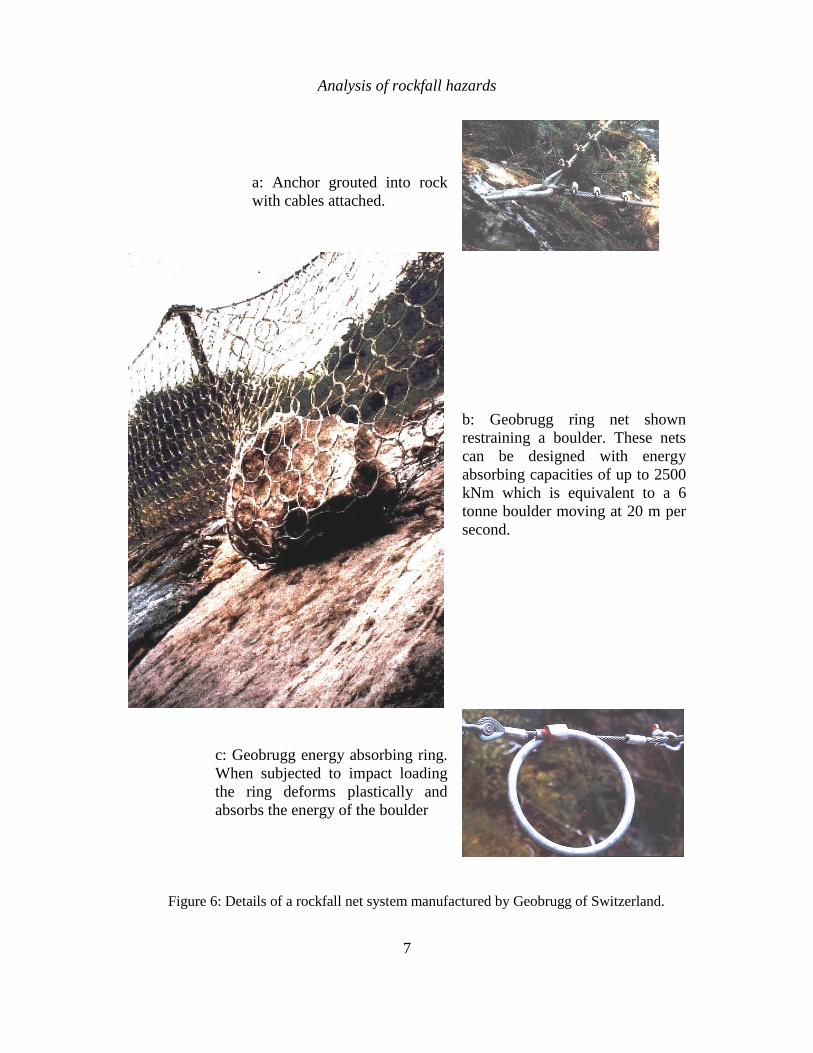
Catch fences or barrier fences in common use are estimated to have an energy absorption
capacity2 of 100 kNm. This is equivalent to a 250 kg rock moving at about 20 metres per
second. More robust barrier fences, such as those used in the European Alps3, have an
energy absorbing capacity of up to 2500 kNm which means that they could stop a 6250 kg
boulder moving at approximately 20 metres per second. Details of a typical high capacity
net are illustrated in Figure 6.
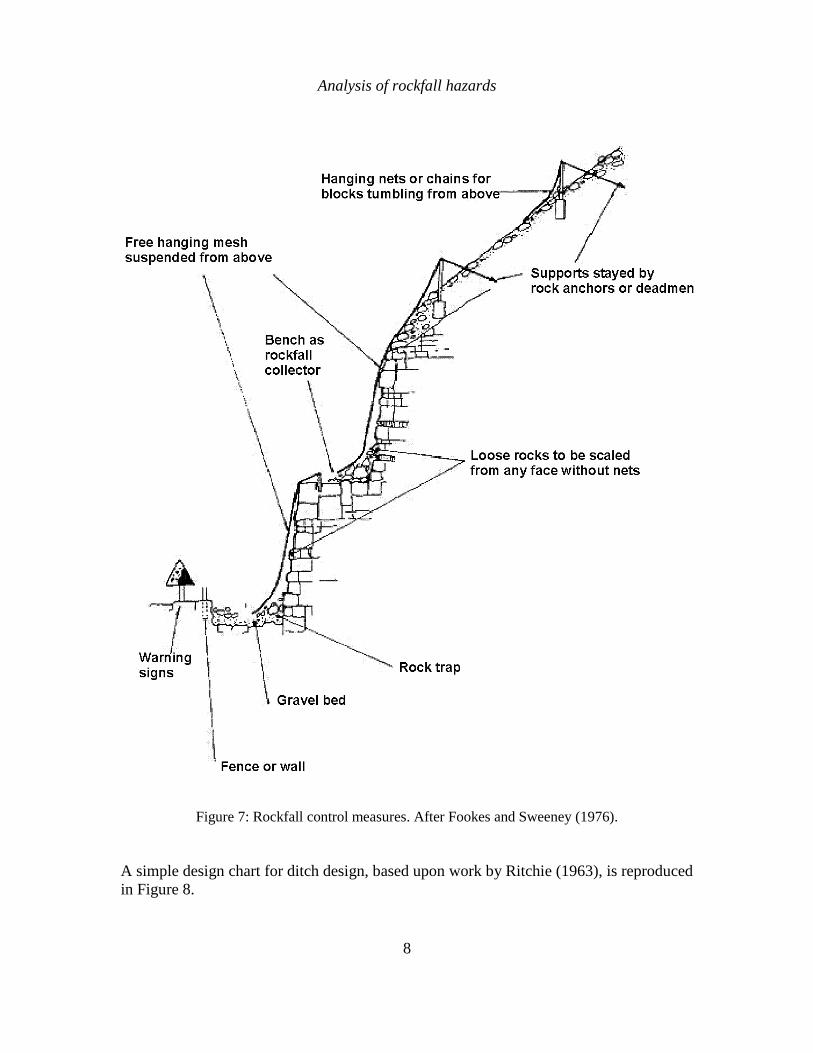
Another restraint system which merits further consideration is the use of mesh draped over
the face. This type of restraint is commonly used for permanent slopes and is illustrated in
Figure 7. The mesh is draped over the rock face and attached at several locations along the
slope. The purpose of the mesh is not to stop rockfalls but to trap the falling rock between
the mesh and the rock face and so to reduce the horizontal velocity component which
causes the rock to bounce out onto the roadway below.
Probably the most effective permanent rockfall protective system for most highways is the
construction of a catch ditch at the toe of the slope. The base of this ditch should be covered
by a layer of gravel to absorb the energy of falling rocks and a sturdy barrier fence should
be placed between the ditch and the roadway. The location of the barrier fence can be
estimated by means of a rockfall analysis such as that used to calculate the trajectories
presented in Figure 3. The criterion for the minimum distance between the toe of the slope
and the rock fence is that no rocks can be allowed to strike the fence before their kinetic
energy has been diminished by the first impact on the gravel layer in the rock trap.
2 The kinetic energy of a falling body is given by 0.5 x mass x velocity2. 3 Wire mesh fence which incorporates cables and energy absorbing slipping joints is manufactured by
Geobrugg Protective Systems, CH-8590 Romanshorn, Switzerland, Fax +41 71466 81 50.
Analysis of rockfall hazards
7
a: Anchor grouted into rock
with cables attached.
b: Geobrugg ring net shown
restraining a boulder. These nets
can be designed with energy
absorbing capacities of up to 2500
kNm which is equivalent to a 6
tonne boulder moving at 20 m per
second.
c: Geobrugg energy absorbing ring.
When subjected to impact loading
the ring deforms plastically and
absorbs the energy of the boulder
Figure 6: Details of a rockfall net system manufactured by Geobrugg of Switzerland.
Analysis of rockfall hazards
8
Figure 7: Rockfall control measures. After Fookes and Sweeney (1976).
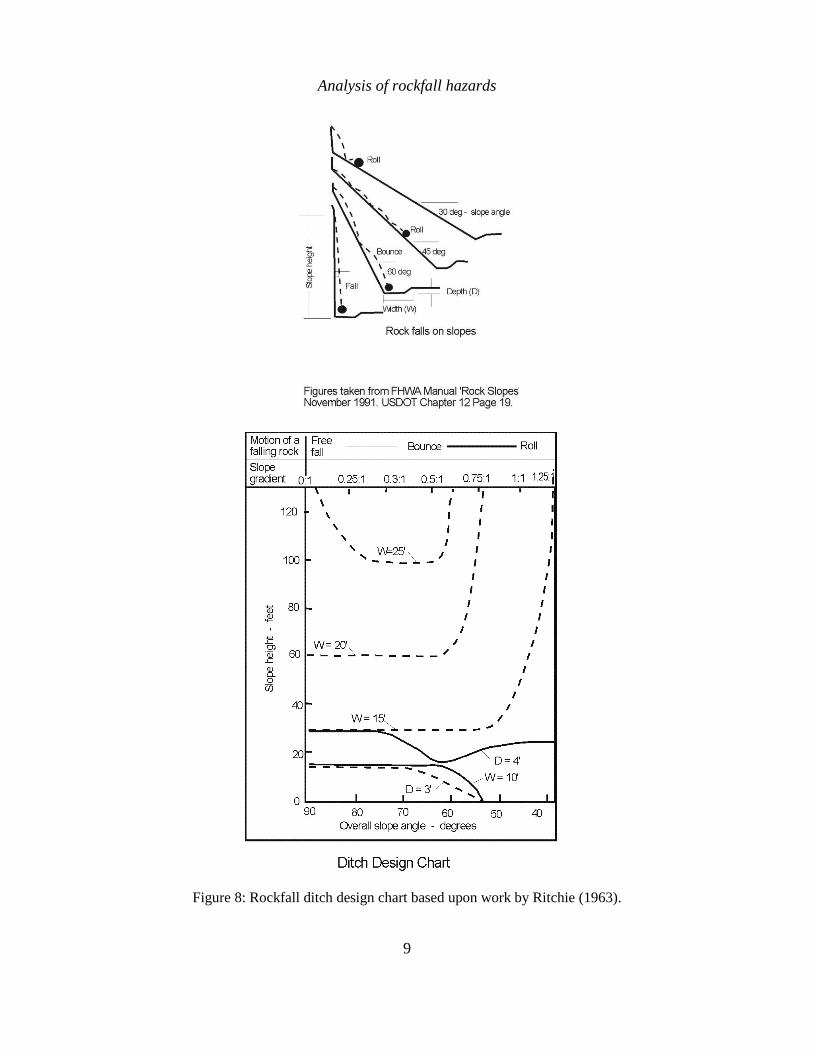
A simple design chart for ditch design, based upon work by Ritchie (1963), is reproduced
in Figure 8.
Analysis of rockfall hazards
9
Figure 8: Rockfall ditch design chart based upon work by Ritchie (1963).
Analysis of rockfall hazards
10
Rockfall Hazard Rating System
Highway and railway construction in mountainous regions presents a special challenge to
geologists and geotechnical engineers. This is because the extended length of these projects
makes it difficult to obtain sufficient information to permit stability assessments to be
carried out for each of the slopes along the route. This means that, except for sections
which are identified as particularly critical, most highway slopes tend to be designed on
the basis of rather rudimentary geotechnical analyses. Those analyses which are carried
out are almost always concerned with the overall stability of the slopes against major
sliding or toppling failures which could jeopardise the operation of the highway or railway.
It is very rare to find a detailed analysis of rockfall hazards except in heavily populated
regions in highly developed countries such as Switzerland.
In recognition of the seriousness of this problem and of the difficulty of carrying out
detailed investigations and analyses on the hundreds of kilometres of mountain highway
in the western United States and Canada, highway and railway departments have worked
on classification schemes which can be carried out by visual inspection and simple
calculations. The purpose of these classifications is to identify slopes which are particularly
hazardous and which require urgent remedial work or further detailed study.
In terms of rockfall hazard assessment, one of the most widely accepted4 is the Rockfall
Hazard Rating System (RHRS) developed by the Oregon State Highway Division (Pierson
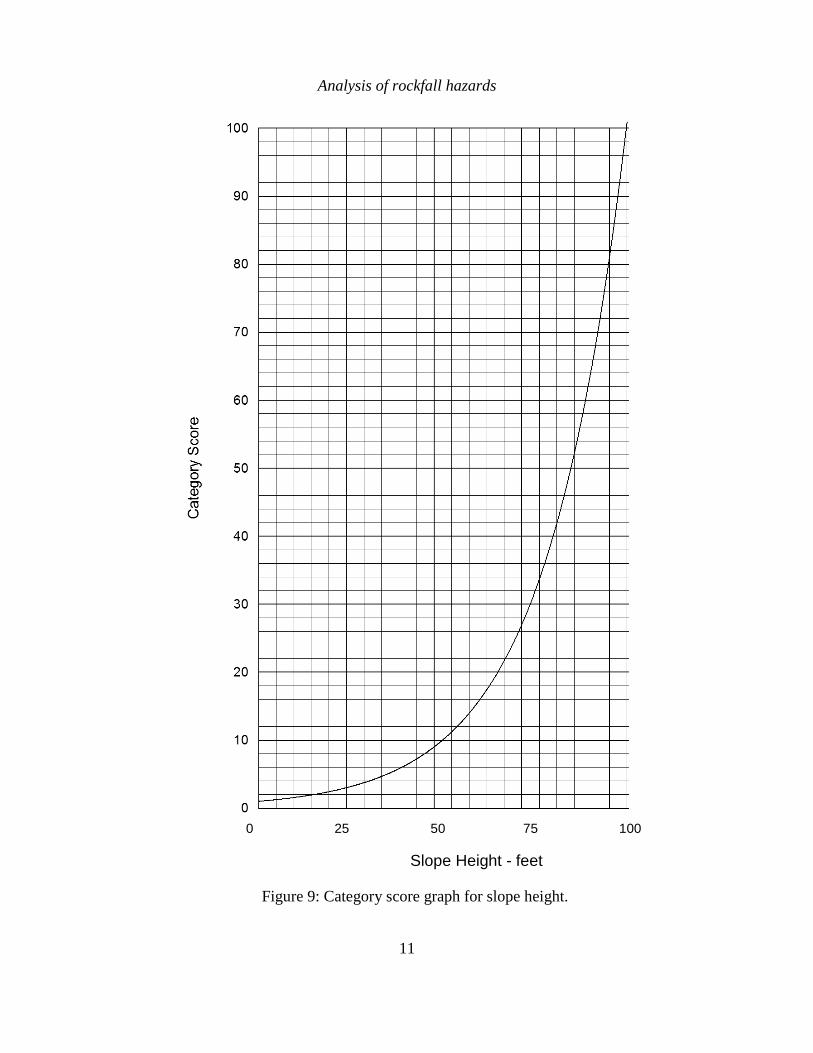
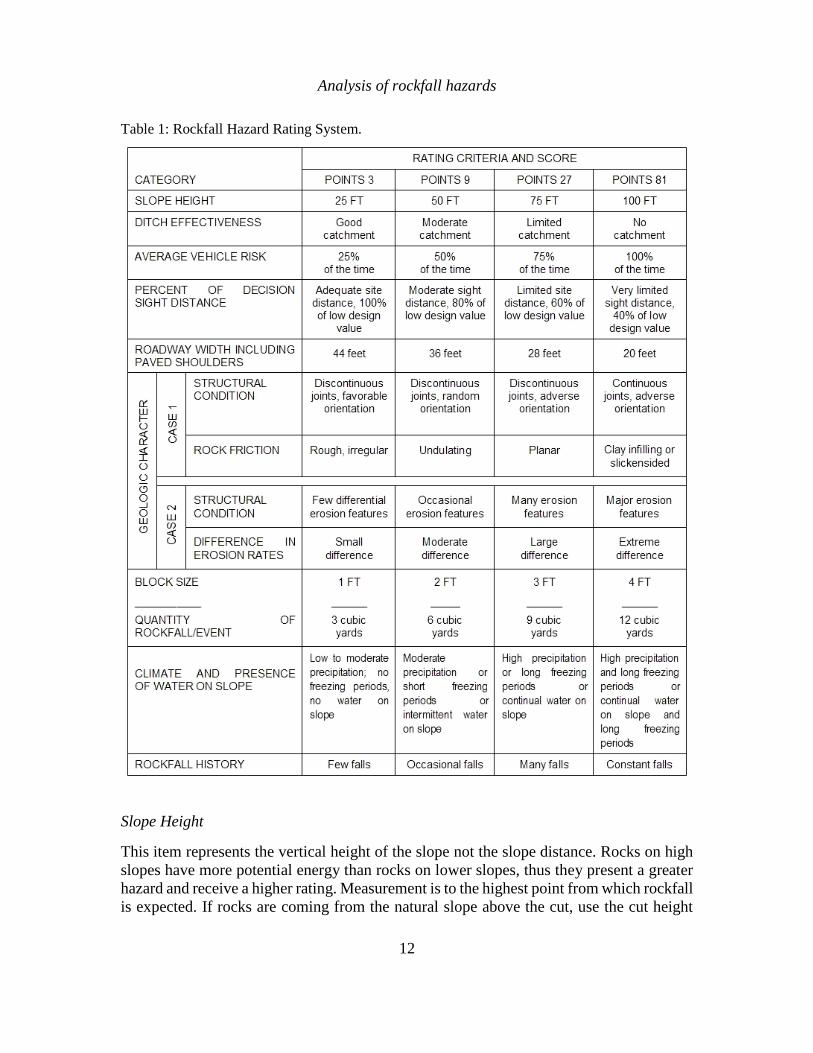
et al. 1990). Table 1 gives a summary of the scores for different categories included in the
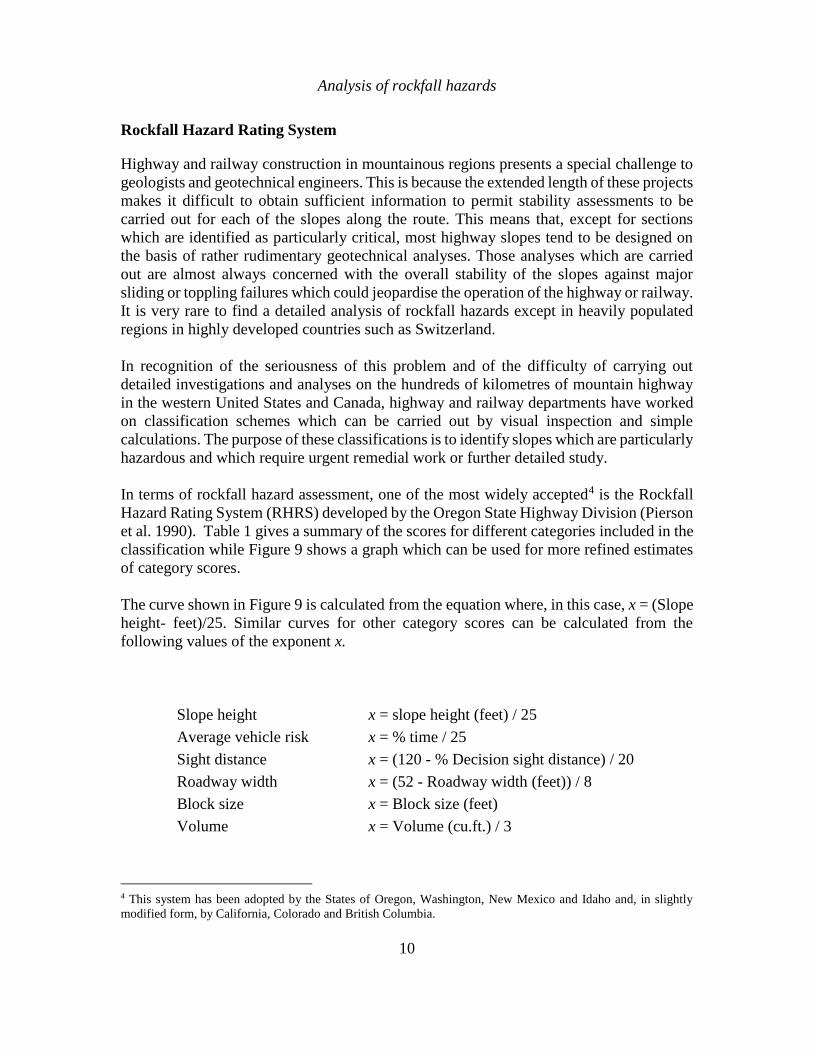
classification while Figure 9 shows a graph which can be used for more refined estimates
of category scores.
The curve shown in Figure 9 is calculated from the equation where, in this case, x = (Slope
height- feet)/25. Similar curves for other category scores can be calculated from the
following values of the exponent x.
Slope height x = slope height (feet) / 25
Average vehicle risk x = % time / 25
Sight distance x = (120 - % Decision sight distance) / 20
Roadway width x = (52 - Roadway width (feet)) / 8
Block size x = Block size (feet)
Volume x = Volume (cu.ft.) / 3
4 This system has been adopted by the States of Oregon, Washington, New Mexico and Idaho and, in slightly
modified form, by California, Colorado and British Columbia.
Analysis of rockfall hazards
11
0 25 50 75 100
Slope Height - feet
Figure 9: Category score graph for slope height.
Analysis of rockfall hazards
12
Table 1: Rockfall Hazard Rating System.
Slope Height
This item represents the vertical height of the slope not the slope distance. Rocks on high
slopes have more potential energy than rocks on lower slopes, thus they present a greater
hazard and receive a higher rating. Measurement is to the highest point from which rockfall
is expected. If rocks are coming from the natural slope above the cut, use the cut height
Analysis of rockfall hazards
13
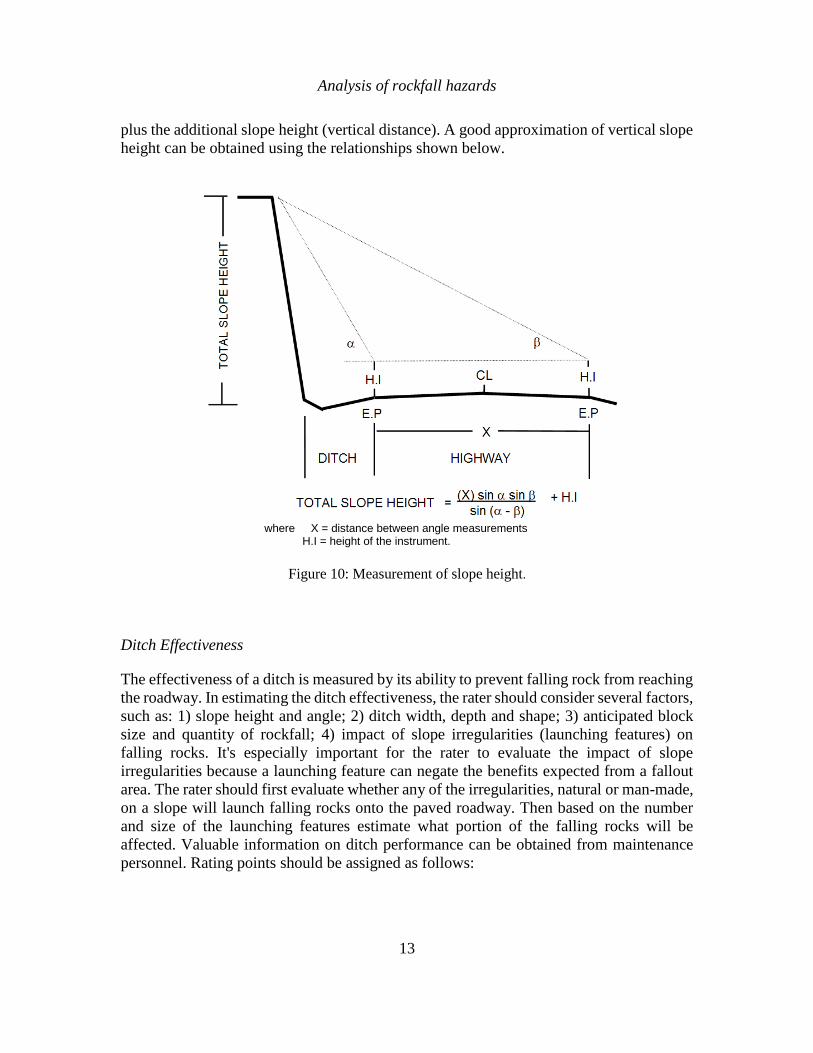
plus the additional slope height (vertical distance). A good approximation of vertical slope
height can be obtained using the relationships shown below.
where X = distance between angle measurements
H.I = height of the instrument.
Figure 10: Measurement of slope height.
Ditch Effectiveness
The effectiveness of a ditch is measured by its ability to prevent falling rock from reaching
the roadway. In estimating the ditch effectiveness, the rater should consider several factors,
such as: 1) slope height and angle; 2) ditch width, depth and shape; 3) anticipated block
size and quantity of rockfall; 4) impact of slope irregularities (launching features) on
falling rocks. It's especially important for the rater to evaluate the impact of slope
irregularities because a launching feature can negate the benefits expected from a fallout
area. The rater should first evaluate whether any of the irregularities, natural or man-made,
on a slope will launch falling rocks onto the paved roadway. Then based on the number
and size of the launching features estimate what portion of the falling rocks will be
affected. Valuable information on ditch performance can be obtained from maintenance
personnel. Rating points should be assigned as follows:
Analysis of rockfall hazards
14
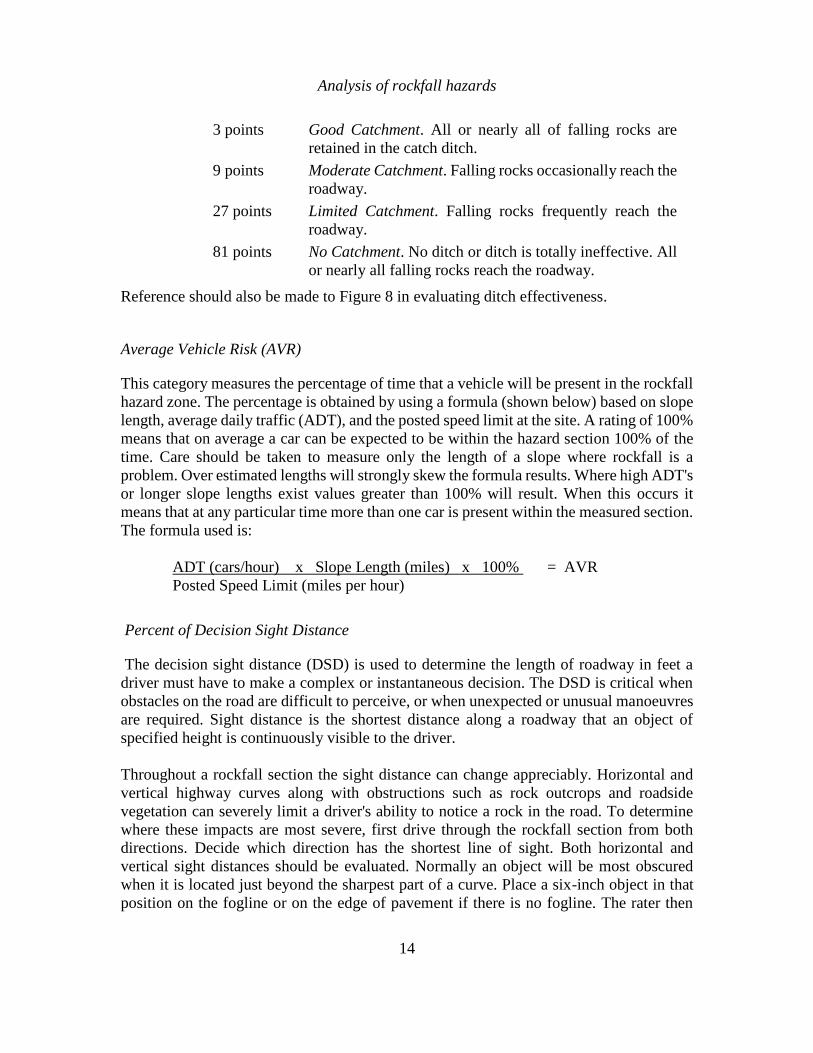
3 points Good Catchment. All or nearly all of falling rocks are
retained in the catch ditch.
9 points Moderate Catchment. Falling rocks occasionally reach the
roadway.
27 points Limited Catchment. Falling rocks frequently reach the
roadway.
81 points No Catchment. No ditch or ditch is totally ineffective. All
or nearly all falling rocks reach the roadway. Reference should also be made to Figure 8 in evaluating ditch effectiveness.
Average Vehicle Risk (AVR)
This category measures the percentage of time that a vehicle will be present in the rockfall
hazard zone. The percentage is obtained by using a formula (shown below) based on slope
length, average daily traffic (ADT), and the posted speed limit at the site. A rating of 100%
means that on average a car can be expected to be within the hazard section 100% of the
time. Care should be taken to measure only the length of a slope where rockfall is a
problem. Over estimated lengths will strongly skew the formula results. Where high ADT's
or longer slope lengths exist values greater than 100% will result. When this occurs it
means that at any particular time more than one car is present within the measured section.
The formula used is:
ADT (cars/hour) x Slope Length (miles) x 100% = AVR
Posted Speed Limit (miles per hour)
Percent of Decision Sight Distance
The decision sight distance (DSD) is used to determine the length of roadway in feet a
driver must have to make a complex or instantaneous decision. The DSD is critical when
obstacles on the road are difficult to perceive, or when unexpected or unusual manoeuvres
are required. Sight distance is the shortest distance along a roadway that an object of
specified height is continuously visible to the driver.
Throughout a rockfall section the sight distance can change appreciably. Horizontal and
vertical highway curves along with obstructions such as rock outcrops and roadside
vegetation can severely limit a driver's ability to notice a rock in the road. To determine
where these impacts are most severe, first drive through the rockfall section from both
directions. Decide which direction has the shortest line of sight. Both horizontal and
vertical sight distances should be evaluated. Normally an object will be most obscured
when it is located just beyond the sharpest part of a curve. Place a six-inch object in that
position on the fogline or on the edge of pavement if there is no fogline. The rater then
Analysis of rockfall hazards
15
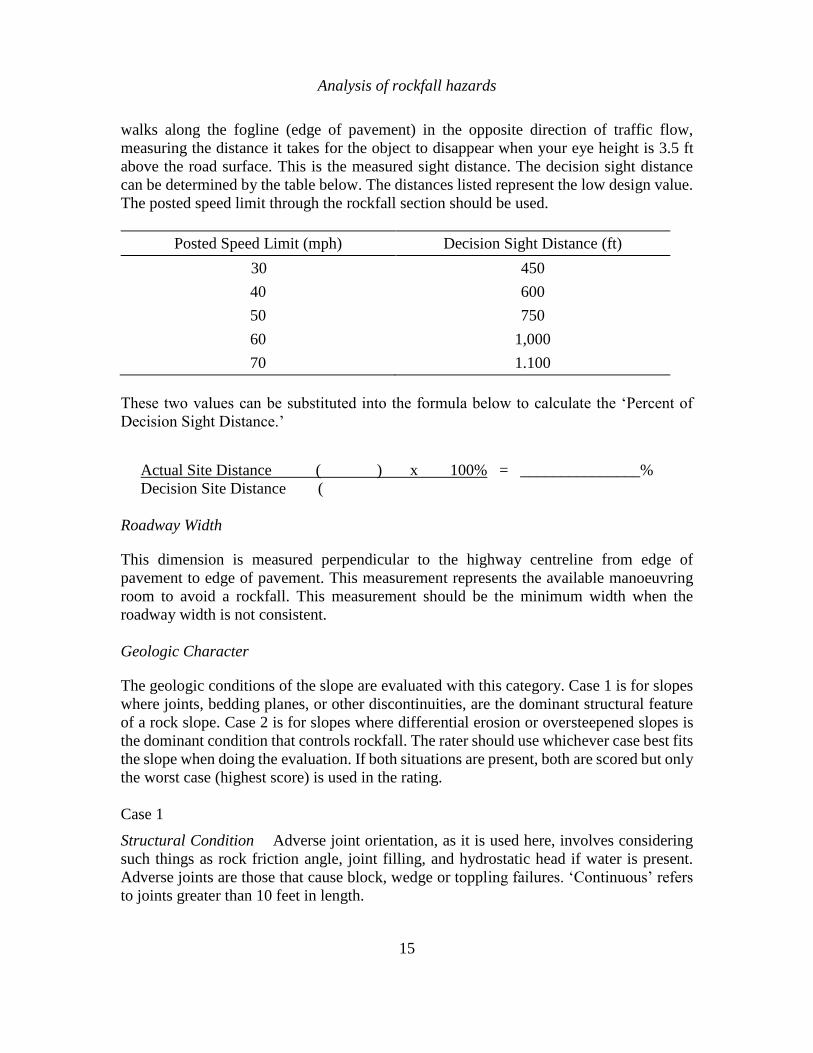
walks along the fogline (edge of pavement) in the opposite direction of traffic flow,
measuring the distance it takes for the object to disappear when your eye height is 3.5 ft
above the road surface. This is the measured sight distance. The decision sight distance
can be determined by the table below. The distances listed represent the low design value.
The posted speed limit through the rockfall section should be used.
Posted Speed Limit (mph) Decision Sight Distance (ft)
30 450
40 600
50 750
60 1,000
70 1.100
These two values can be substituted into the formula below to calculate the ‘Percent of
Decision Sight Distance.’
Actual Site Distance ( ) x 100% = _______________%
Decision Site Distance (
Roadway Width
This dimension is measured perpendicular to the highway centreline from edge of
pavement to edge of pavement. This measurement represents the available manoeuvring
room to avoid a rockfall. This measurement should be the minimum width when the
roadway width is not consistent.
Geologic Character
The geologic conditions of the slope are evaluated with this category. Case 1 is for slopes
where joints, bedding planes, or other discontinuities, are the dominant structural feature
of a rock slope. Case 2 is for slopes where differential erosion or oversteepened slopes is
the dominant condition that controls rockfall. The rater should use whichever case best fits
the slope when doing the evaluation. If both situations are present, both are scored but only
the worst case (highest score) is used in the rating.
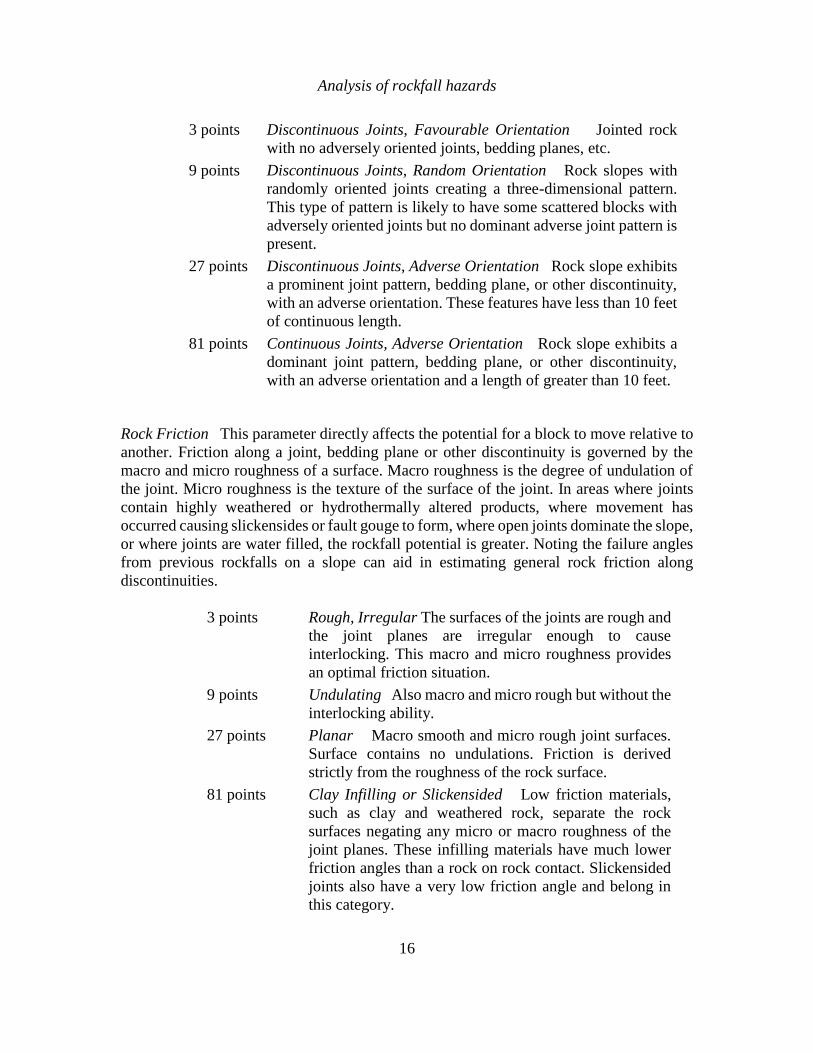
Case 1 Structural Condition Adverse joint orientation, as it is used here, involves considering
such things as rock friction angle, joint filling, and hydrostatic head if water is present.
Adverse joints are those that cause block, wedge or toppling failures. ‘Continuous’ refers
to joints greater than 10 feet in length.
Analysis of rockfall hazards
16
3 points Discontinuous Joints, Favourable Orientation Jointed rock
with no adversely oriented joints, bedding planes, etc.
9 points Discontinuous Joints, Random Orientation Rock slopes with
randomly oriented joints creating a three-dimensional pattern.
This type of pattern is likely to have some scattered blocks with
adversely oriented joints but no dominant adverse joint pattern is
present.
27 points Discontinuous Joints, Adverse Orientation Rock slope exhibits
a prominent joint pattern, bedding plane, or other discontinuity,
with an adverse orientation. These features have less than 10 feet
of continuous length.
81 points Continuous Joints, Adverse Orientation Rock slope exhibits a
dominant joint pattern, bedding plane, or other discontinuity,
with an adverse orientation and a length of greater than 10 feet.
Rock Friction This parameter directly affects the potential for a block to move relative to
another. Friction along a joint, bedding plane or other discontinuity is governed by the
macro and micro roughness of a surface. Macro roughness is the degree of undulation of
the joint. Micro roughness is the texture of the surface of the joint. In areas where joints
contain highly weathered or hydrothermally altered products, where movement has
occurred causing slickensides or fault gouge to form, where open joints dominate the slope,
or where joints are water filled, the rockfall potential is greater. Noting the failure angles
from previous rockfalls on a slope can aid in estimating general rock friction along
discontinuities.
3 points Rough, Irregular The surfaces of the joints are rough and
the joint planes are irregular enough to cause
interlocking. This macro and micro roughness provides
an optimal friction situation.
9 points Undulating Also macro and micro rough but without the
interlocking ability.
27 points Planar Macro smooth and micro rough joint surfaces.
Surface contains no undulations. Friction is derived
strictly from the roughness of the rock surface.
81 points Clay Infilling or Slickensided Low friction materials,
such as clay and weathered rock, separate the rock
surfaces negating any micro or macro roughness of the
joint planes. These infilling materials have much lower
friction angles than a rock on rock contact. Slickensided
joints also have a very low friction angle and belong in
this category.
Analysis of rockfall hazards
17
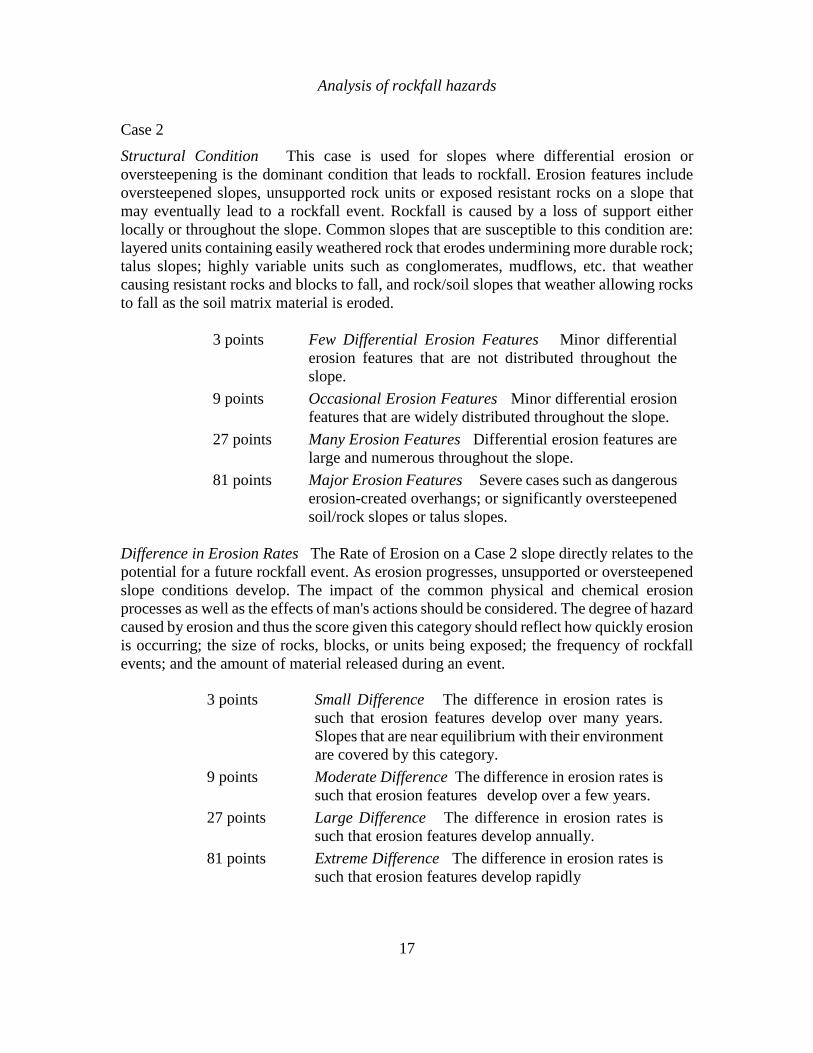
Case 2 Structural Condition This case is used for slopes where differential erosion or
oversteepening is the dominant condition that leads to rockfall. Erosion features include
oversteepened slopes, unsupported rock units or exposed resistant rocks on a slope that
may eventually lead to a rockfall event. Rockfall is caused by a loss of support either
locally or throughout the slope. Common slopes that are susceptible to this condition are:
layered units containing easily weathered rock that erodes undermining more durable rock;
talus slopes; highly variable units such as conglomerates, mudflows, etc. that weather
causing resistant rocks and blocks to fall, and rock/soil slopes that weather allowing rocks
to fall as the soil matrix material is eroded.
3 points Few Differential Erosion Features Minor differential
erosion features that are not distributed throughout the
slope.
9 points Occasional Erosion Features Minor differential erosion
features that are widely distributed throughout the slope.
27 points Many Erosion Features Differential erosion features are
large and numerous throughout the slope.
81 points Major Erosion Features Severe cases such as dangerous
erosion-created overhangs; or significantly oversteepened
soil/rock slopes or talus slopes.
Difference in Erosion Rates The Rate of Erosion on a Case 2 slope directly relates to the
potential for a future rockfall event. As erosion progresses, unsupported or oversteepened
slope conditions develop. The impact of the common physical and chemical erosion
processes as well as the effects of man's actions should be considered. The degree of hazard
caused by erosion and thus the score given this category should reflect how quickly erosion
is occurring; the size of rocks, blocks, or units being exposed; the frequency of rockfall
events; and the amount of material released during an event.
3 points Small Difference The difference in erosion rates is
such that erosion features develop over many years.
Slopes that are near equilibrium with their environment
are covered by this category.
9 points Moderate Difference The difference in erosion rates is
such that erosion features develop over a few years.
27 points Large Difference The difference in erosion rates is
such that erosion features develop annually.
81 points Extreme Difference The difference in erosion rates is
such that erosion features develop rapidly
Analysis of rockfall hazards
18
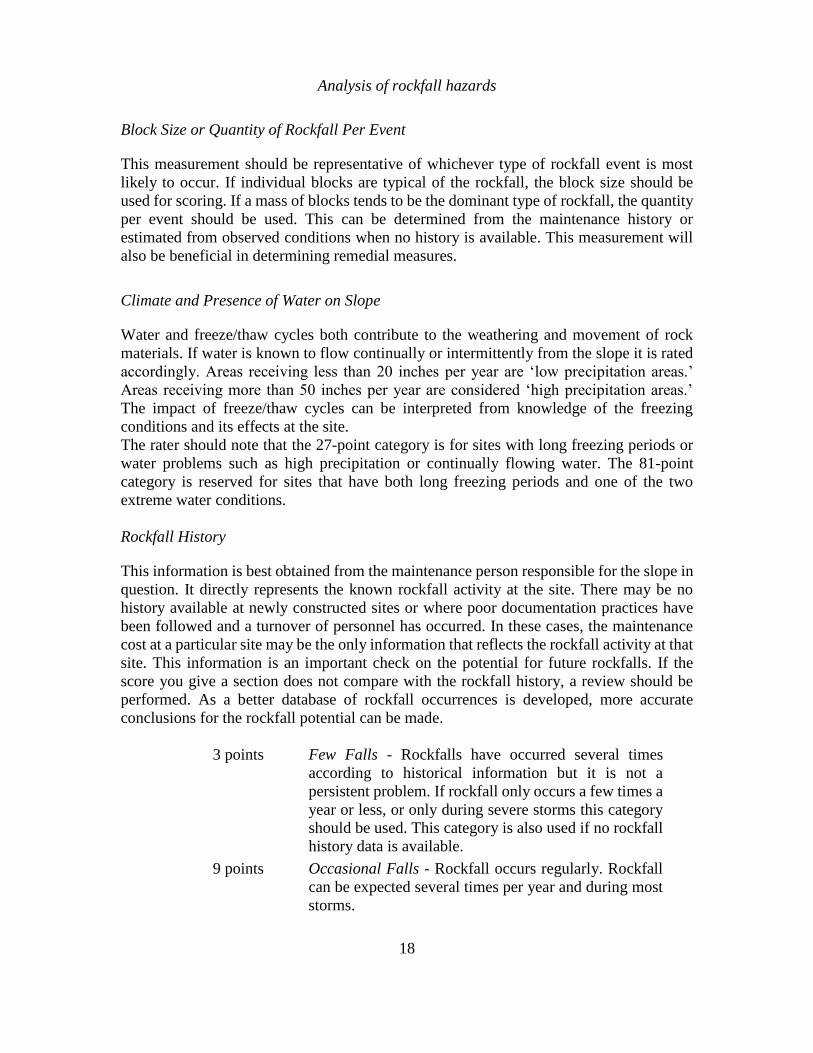
Block Size or Quantity of Rockfall Per Event
This measurement should be representative of whichever type of rockfall event is most
likely to occur. If individual blocks are typical of the rockfall, the block size should be
used for scoring. If a mass of blocks tends to be the dominant type of rockfall, the quantity
per event should be used. This can be determined from the maintenance history or
estimated from observed conditions when no history is available. This measurement will
also be beneficial in determining remedial measures.
Climate and Presence of Water on Slope
Water and freeze/thaw cycles both contribute to the weathering and movement of rock
materials. If water is known to flow continually or intermittently from the slope it is rated
accordingly. Areas receiving less than 20 inches per year are ‘low precipitation areas.’
Areas receiving more than 50 inches per year are considered ‘high precipitation areas.’
The impact of freeze/thaw cycles can be interpreted from knowledge of the freezing
conditions and its effects at the site.
The rater should note that the 27-point category is for sites with long freezing periods or
water problems such as high precipitation or continually flowing water. The 81-point
category is reserved for sites that have both long freezing periods and one of the two
extreme water conditions.
Rockfall History
This information is best obtained from the maintenance person responsible for the slope in
question. It directly represents the known rockfall activity at the site. There may be no
history available at newly constructed sites or where poor documentation practices have
been followed and a turnover of personnel has occurred. In these cases, the maintenance
cost at a particular site may be the only information that reflects the rockfall activity at that
site. This information is an important check on the potential for future rockfalls. If the
score you give a section does not compare with the rockfall history, a review should be
performed. As a better database of rockfall occurrences is developed, more accurate
conclusions for the rockfall potential can be made.
3 points Few Falls - Rockfalls have occurred several times
according to historical information but it is not a
persistent problem. If rockfall only occurs a few times a
year or less, or only during severe storms this category
should be used. This category is also used if no rockfall
history data is available.
9 points Occasional Falls - Rockfall occurs regularly. Rockfall
can be expected several times per year and during most
storms.
Analysis of rockfall hazards
19
27 points Many Falls - Typically rockfall occurs frequently
during a certain season, such as the winter or spring wet
period, or the winter freeze-thaw, etc. This category is
for sites where frequent rockfalls occur during a certain
season and is not a significant problem during the rest
of the year. This category may also be used where
severe rockfall events have occurred.
81 points Constant Falls - Rockfalls occur frequently throughout
the year. This category is also for sites where severe
rockfall events are common.
In addition to scoring the above categories, the rating team should gather enough field
information to recommend which rockfall remedial measure is best suited to the rockfall
problem. Both total fixes and hazard reduction approaches should be considered. A
preliminary cost estimate should be prepared.
Risk analysis of rockfalls on highways
The analysis of the risk of damage to vehicles or the death of vehicle occupants as a result
of rockfalls on highways has not received very extensive coverage in the geotechnical
literature. Papers which deal directly with the probability of a slope failure event and the
resulting death, injury or damage have been published by Hunt (1984), Fell (1994),
Morgan (1991), Morgan et al (1992) and Varnes (1984). Most of these papers deal with
landslides rather than with rockfalls. An excellent study of risk analysis applied to rockfalls
on highways is contained in an MSc thesis by Christopher M. Bunce (1994), submitted to
the Department of Civil Engineering at the University of Alberta. This thesis reviews risk
assessment methodology and then applies this methodology to a specific case in which a
rockfall killed a passenger and injured the driver of a vehicle.
RHRS rating for Argillite Cut
Bunce carried out a study using the Rockfall Hazard Rating System for the Argillite Cut
in which the rockfall occurred. A summary of his ratings for the section in which the
rockfall happened and for the entire cut is presented in Table 2. The ratings which he
obtained were 394 for the rockfall section and 493 for the entire cut. Note that this highway
has been upgraded and the Argillite Cut no longer exists. However, Bunce’s work still
provides a good case history for the application of the Rockfall Hazard Rating System.
The RHRS system does not include recommendations on actions to be taken for different
ratings. This is because decisions on remedial action for a specific slope depend upon many
factors such as the budget allocation for highway work which cannot be taken into account
in the ratings. However, in personal discussions with Mr Lawrence Pierson, the principal
author of the RHRS, I was informed that in the State of Oregon, slopes with a rating of
Analysis of rockfall hazards
20
less than 300 are assigned a very low priority while slopes with a rating in excess of 500
are identified for urgent remedial action.
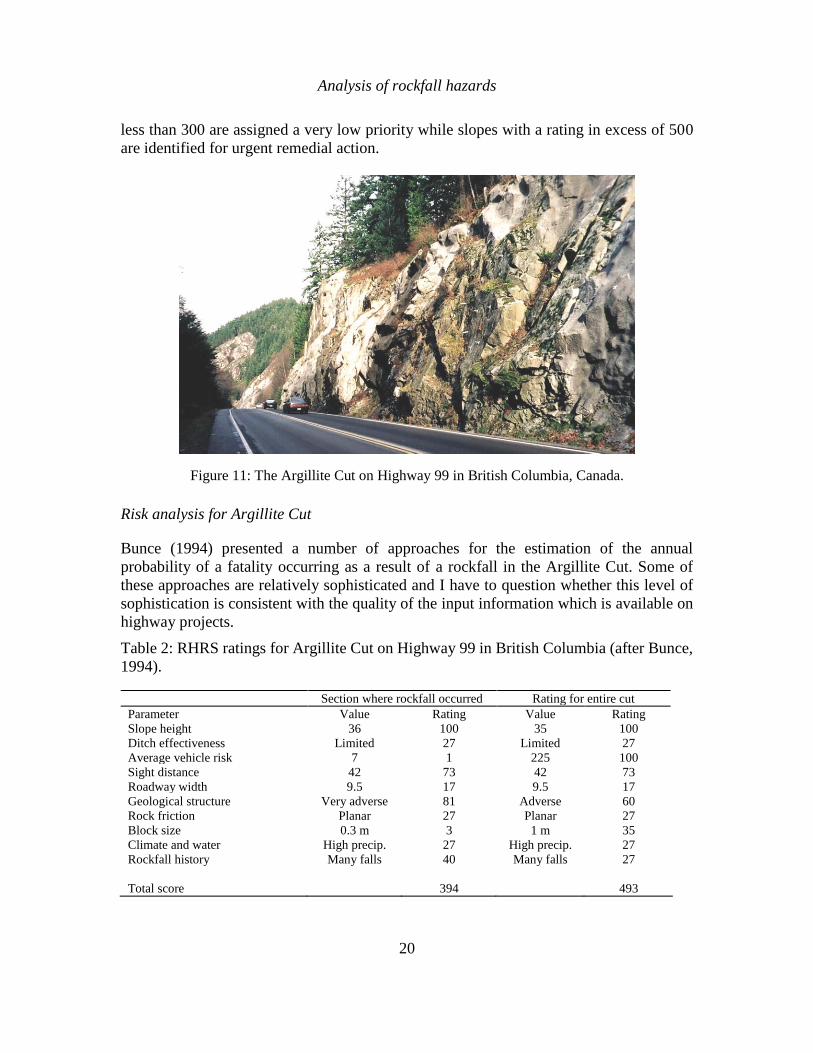
Figure 11: The Argillite Cut on Highway 99 in British Columbia, Canada.
Risk analysis for Argillite Cut
Bunce (1994) presented a number of approaches for the estimation of the annual
probability of a fatality occurring as a result of a rockfall in the Argillite Cut. Some of
these approaches are relatively sophisticated and I have to question whether this level of
sophistication is consistent with the quality of the input information which is available on
highway projects.
Table 2: RHRS ratings for Argillite Cut on Highway 99 in British Columbia (after Bunce,
1994).
Section where rockfall occurred Rating for entire cut
Parameter Value Rating Value Rating
Slope height 36 100 35 100
Ditch effectiveness Limited 27 Limited 27
Average vehicle risk 7 1 225 100
Sight distance 42 73 42 73
Roadway width 9.5 17 9.5 17
Geological structure Very adverse 81 Adverse 60
Rock friction Planar 27 Planar 27
Block size 0.3 m 3 1 m 35
Climate and water High precip. 27 High precip. 27
Rockfall history Many falls 40 Many falls 27
Total score 394 493
Analysis of rockfall hazards
21
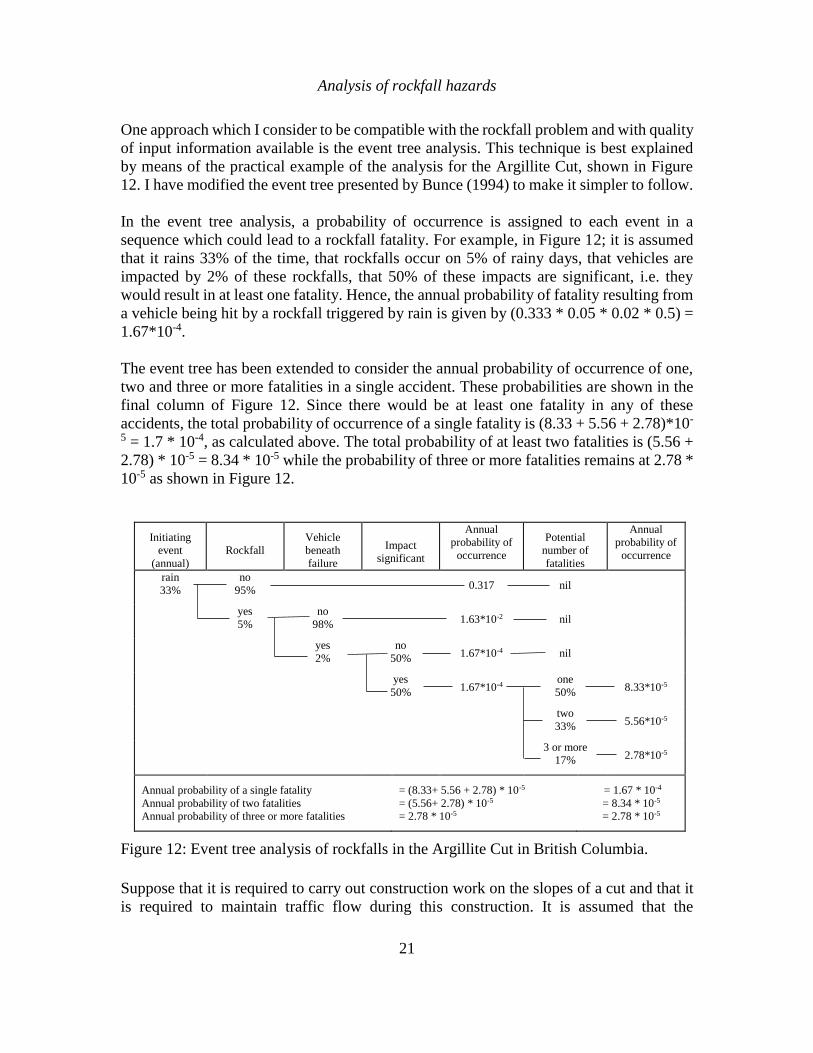
One approach which I consider to be compatible with the rockfall problem and with quality
of input information available is the event tree analysis. This technique is best explained
by means of the practical example of the analysis for the Argillite Cut, shown in Figure
12. I have modified the event tree presented by Bunce (1994) to make it simpler to follow.
In the event tree analysis, a probability of occurrence is assigned to each event in a
sequence which could lead to a rockfall fatality. For example, in Figure 12; it is assumed
that it rains 33% of the time, that rockfalls occur on 5% of rainy days, that vehicles are
impacted by 2% of these rockfalls, that 50% of these impacts are significant, i.e. they
would result in at least one fatality. Hence, the annual probability of fatality resulting from
a vehicle being hit by a rockfall triggered by rain is given by (0.333 * 0.05 * 0.02 * 0.5) =
1.67*10-4.
The event tree has been extended to consider the annual probability of occurrence of one,
two and three or more fatalities in a single accident. These probabilities are shown in the
final column of Figure 12. Since there would be at least one fatality in any of these
accidents, the total probability of occurrence of a single fatality is (8.33 + 5.56 + 2.78)*10-
5 = 1.7 * 10-4, as calculated above. The total probability of at least two fatalities is (5.56 +
2.78) * 10-5 = 8.34 * 10-5 while the probability of three or more fatalities remains at 2.78 *
10-5 as shown in Figure 12.
Initiating
event
(annual)
Rockfall
Vehicle
beneath
failure
Impact
significant
Annual
probability of
occurrence
Potential
number of
fatalities
Annual
probability of
occurrence
rain
33%
no
95%
0.317 nil
yes
5%
no
98%
1.63*10-2 nil
yes
2%
no
50% 1.67*10-4 nil
yes
50% 1.67*10-4 one
50% 8.33*10-5
two
33% 5.56*10-5
3 or more
17% 2.78*10-5
Annual probability of a single fatality
Annual probability of two fatalities
Annual probability of three or more fatalities
= (8.33+ 5.56 + 2.78) * 10-5
= (5.56+ 2.78) * 10-5
= 2.78 * 10-5
= 1.67 * 10-4
= 8.34 * 10-5
= 2.78 * 10-5
Figure 12: Event tree analysis of rockfalls in the Argillite Cut in British Columbia.
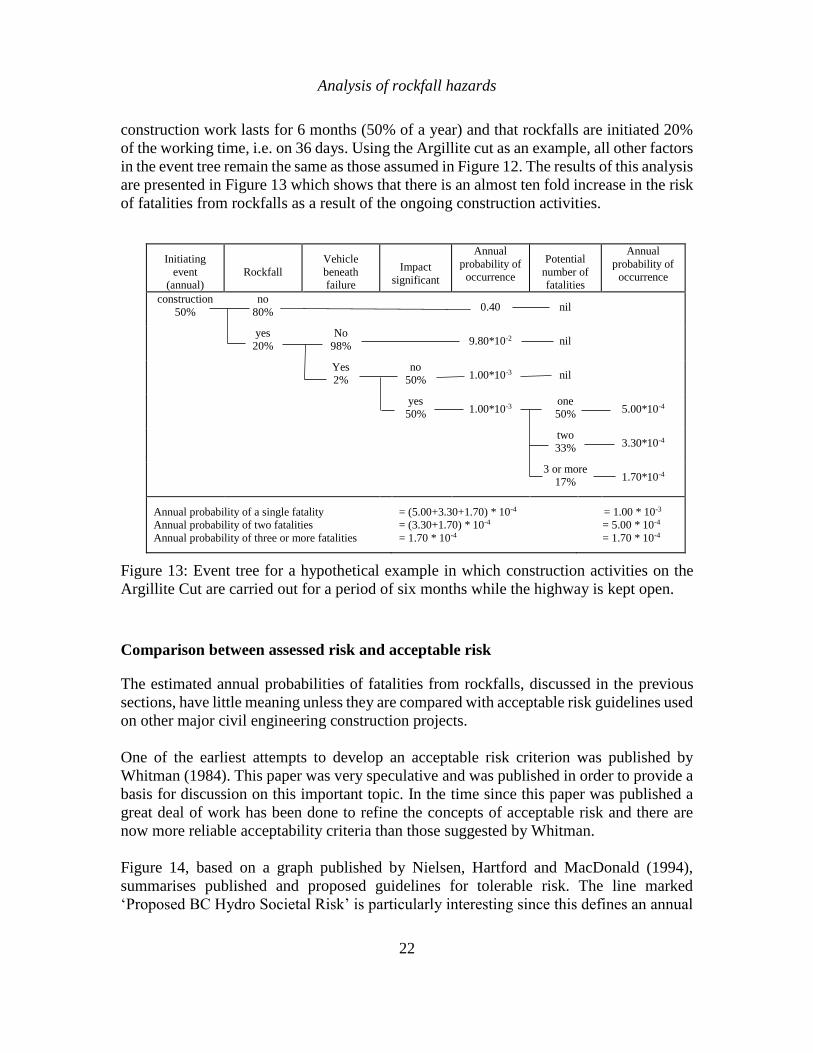
Suppose that it is required to carry out construction work on the slopes of a cut and that it
is required to maintain traffic flow during this construction. It is assumed that the
Analysis of rockfall hazards
22
construction work lasts for 6 months (50% of a year) and that rockfalls are initiated 20%
of the working time, i.e. on 36 days. Using the Argillite cut as an example, all other factors
in the event tree remain the same as those assumed in Figure 12. The results of this analysis
are presented in Figure 13 which shows that there is an almost ten fold increase in the risk
of fatalities from rockfalls as a result of the ongoing construction activities.
Initiating
event
(annual)
Rockfall
Vehicle
beneath
failure
Impact
significant
Annual
probability of
occurrence
Potential
number of
fatalities
Annual
probability of
occurrence
construction
50%
no
80%
0.40 nil
yes
20%
No
98%
9.80*10-2 nil
Yes
2%
no
50% 1.00*10-3 nil
yes
50% 1.00*10-3 one
50% 5.00*10-4
two
33% 3.30*10-4
3 or more
17% 1.70*10-4
Annual probability of a single fatality
Annual probability of two fatalities
Annual probability of three or more fatalities
= (5.00+3.30+1.70) * 10-4
= (3.30+1.70) * 10-4
= 1.70 * 10-4
= 1.00 * 10-3
= 5.00 * 10-4
= 1.70 * 10-4
Figure 13: Event tree for a hypothetical example in which construction activities on the
Argillite Cut are carried out for a period of six months while the highway is kept open.
Comparison between assessed risk and acceptable risk
The estimated annual probabilities of fatalities from rockfalls, discussed in the previous
sections, have little meaning unless they are compared with acceptable risk guidelines used
on other major civil engineering construction projects.
One of the earliest attempts to develop an acceptable risk criterion was published by
Whitman (1984). This paper was very speculative and was published in order to provide a
basis for discussion on this important topic. In the time since this paper was published a
great deal of work has been done to refine the concepts of acceptable risk and there are
now more reliable acceptability criteria than those suggested by Whitman.
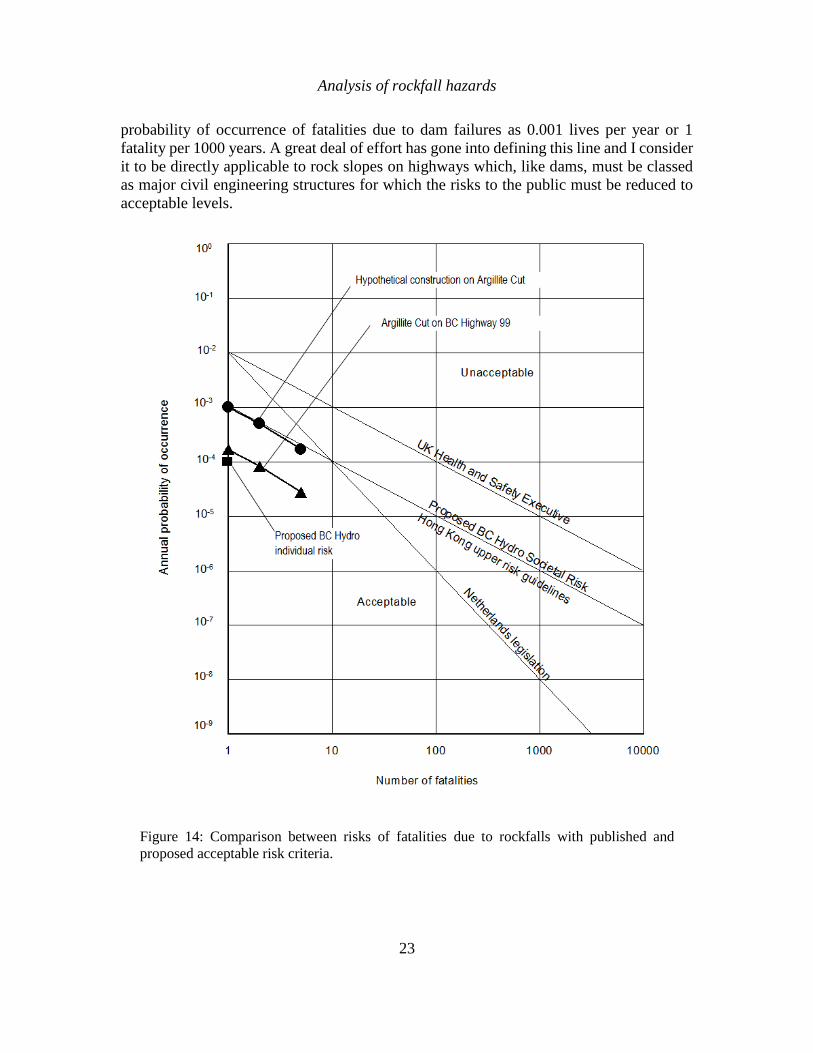
Figure 14, based on a graph published by Nielsen, Hartford and MacDonald (1994),
summarises published and proposed guidelines for tolerable risk. The line marked
‘Proposed BC Hydro Societal Risk’ is particularly interesting since this defines an annual
Analysis of rockfall hazards
23
probability of occurrence of fatalities due to dam failures as 0.001 lives per year or 1
fatality per 1000 years. A great deal of effort has gone into defining this line and I consider
it to be directly applicable to rock slopes on highways which, like dams, must be classed
as major civil engineering structures for which the risks to the public must be reduced to
acceptable levels.
Figure 14: Comparison between risks of fatalities due to rockfalls with published and
proposed acceptable risk criteria.
Analysis of rockfall hazards
24
Another point to be noted in Figure 14 is that marked ‘Proposed BC Hydro Individual
risk’. This annual probability of fatalities of 10-4 (1 in 10,000) is based upon the concept
that the risk to an individual from a dam failure should not exceed the individual ‘natural
death’ risk run by the safest population group (10 to 14 year old children). Consensus is
also developing that the annual probability of fatality of 10-4 defines the boundary between
voluntary (restricted access to site personnel) and involuntary (general public access) risk
(Nielsen, Hartford and MacDonald, 1994).
On Figure 14, I have plotted the estimated annual probabilities of fatalities from rockfalls
on the Argillite Cut on BC Highway 99, with and without construction. These plots show
that the estimated risk for these slopes, without construction, is significantly lower than
the 0.001 lives per year line. The estimated risk for the Argillite Cut slopes during active
construction is approximately ten times higher and is marginally higher than the 0.001
lives per year criterion. Given the fact that courts tend to be unsympathetic to engineers
who knowingly put the public at risk, it would be unwise to proceed with construction
while attempting to keep the traffic flowing. A more prudent course of action would be to
close the highway during periods of active construction on the slopes, even if this meant
having to deal with the anger of frustrated motorists.
Conclusions
The Rockfall Hazard Rating System and the Event Tree risk assessments, discussed on the
previous pages, are very crude tools which can only be regarded as semi-quantitative.
However, the trends indicated by these tools together with common sense engineering
judgement, give a reasonable assessment of the relative hazards due to rockfalls from cut
slopes adjacent to highways and railways.
References
Azzoni, A., La Barbera, G. and Zaninetti, A. 1995. Analysis and prediction of rockfalls
using a mathematical model. Int. J. Rock Mech. Min. Sci. and Geomech. Abstracts.
. 32, (7) 709-724.
Badger, T.C. and Lowell, S. 1992. Rockfall Control Washington State. In Rockfall
Prediction and Control and Landslide Case Histories, Transportation Research
Record, National Research Council, Washington, No 1342, 14-19.
Bozzolo, D., Pamini, R. and Hutter, K. 1988. Rockfall analysis - a mathematical model
and its test with field data. Proc. 5th Intl symposium on Landslides, Lusanne. July
1988, 1, 555-560.
Bunce, C.M. 1994. Risk Analysis for Rock Fall on Highways. MSc thesis submitted to the
Department of Civil Engineering, University of Alberta, Canada. 129 pages.
Analysis of rockfall hazards
25
Fell, R. 1994. Landslide risk assessment and acceptable risk. Can. Geotech. J. 31, 261-
272.
Fookes, P.G. and Sweeney, M. 1976. Stabilisation and control of local rockfalls and
degrading of slopes. Quart. J. Engng Geol. 9,37-55.
Hoek, E. 1986. Rockfall: a computer program for predicting rockfall trajectories.
Unpublished internal notes, Golder Associates, Vancouver.
Hungr, O. and Evans, S.G. 1989. Engineering aspects of rockfall hazard in Canada.
Geological Survey of Canada, Open File 2061, 102 pages.
Hunt, R.E. 1984. Slope failure risk mapping for highways: Methodology and case history.
In Rockfall prediction and Control and Landslide Case Histories. Transportation
Research Record, National Research Council, Washington, No. 1343. 42-51.
Morgan, G.C. 1991. Qualification of risks from slope hazards. In Landslide Hazards in the
Canadian Cordillera. Geological Association of Canada, Special Publication.
Morgan, G.C., Rawlings, G.E. and Sobkowicz, J.C. 1992. Evaluation of total risk to
communities from large debris flows. Geotechnical and Natural Hazards,
Vancouver Geotechnical Society and Canadian Geotechnical Society, Vancouver,
BC, Canada, May 6-9, 1992, 225—236.
Nielsen, N.M., Hartford, D.N.D. and MacDonald. 1994. Selection of tolerable risk criteria
for dam safety decision making. Proc. 1994 Canadian Dam Safety Conference,
Winnipeg, Manitoba. Vancouver: BiTech Publishers, 355-369.
Pierson, L.A., Davis, S.A. and Van Vickle, R. 1990. Rockfall Hazard Rating System
Implementation Manual. Federal Highway Administration (FHWA) Report
FHWA-OR—EG-90-01. FHWA, U.S. Department of Transportation.
Ritchie, A.M., 1963. The evaluation of rockfall and its control. Highway Record. 17.
Spang, R.M. and Rautenstrauch, R.W. 1988. Empirical and mathematical approaches to
rockfall prediction and their practical applications. Proc. 5th Int. Symp. on
Landslides, Lusanne. 2,1237-1243.
Varnes, D.J. 1984. Landslide hazard zonation: a review of principles and practice. Natural
Hazards 3. UNESCO, Paris, 63 pages.
Whitman. R.V. 1984. Evaluating calculated risk in geotechnical engineering. J. Geotech.
Eng, ASCE 110(2), 145-186.