Embed Size (px)
Citation preview

Analysis of Protein Complexes by Size Exclusion
Chromatography Coupled with Light Scattering
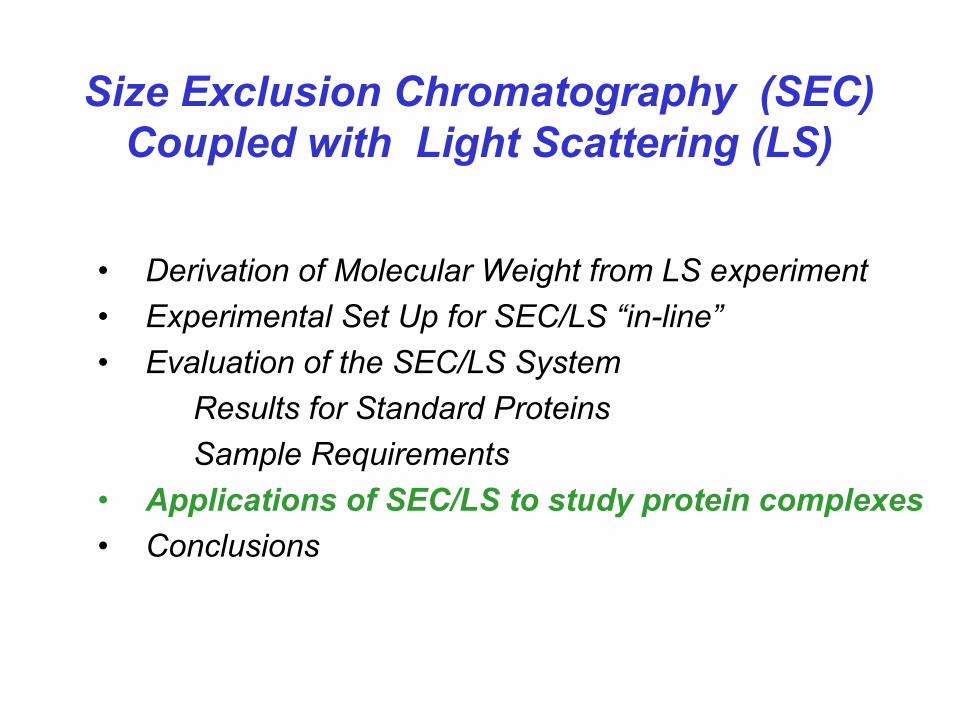
Size Exclusion Chromatography (SEC)Coupled with Light Scattering (LS)
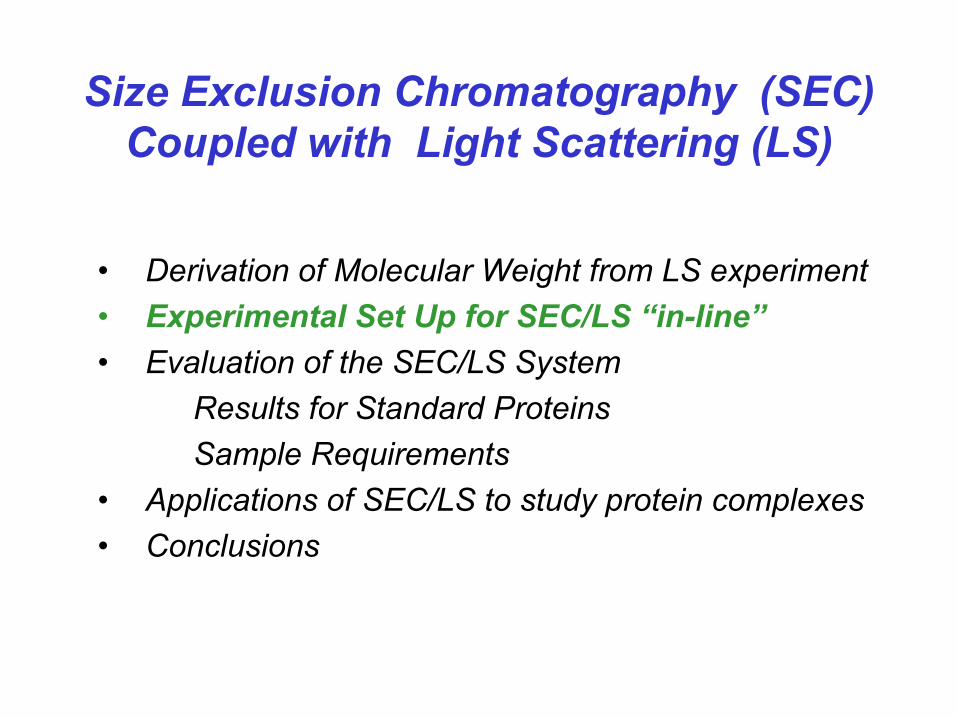
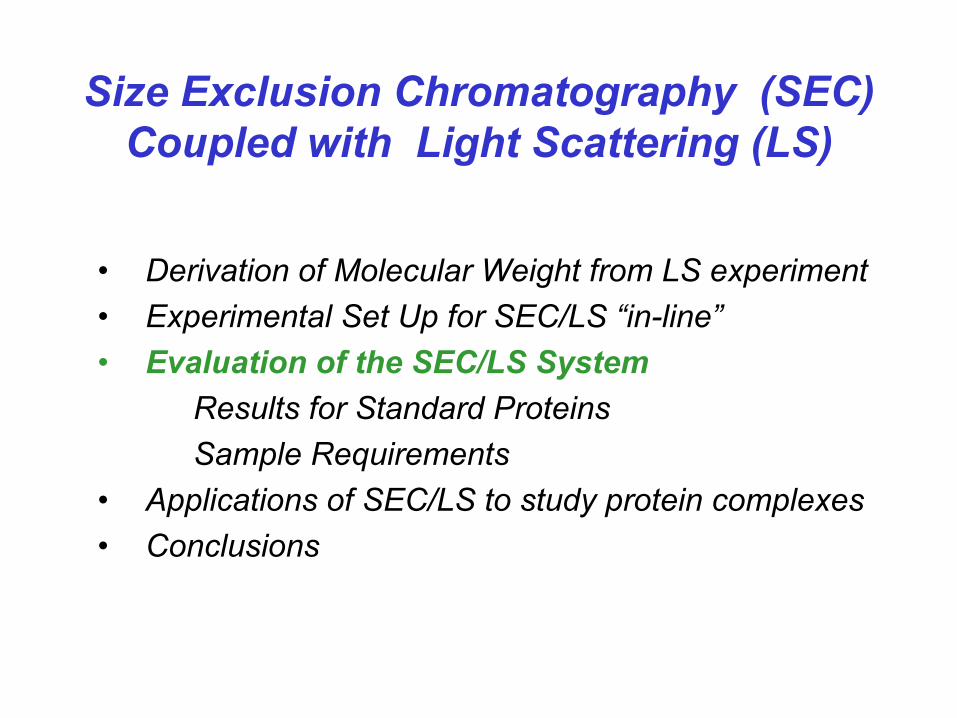
• Derivation of Molecular Weight from LS experiment• Experimental Set Up for SEC/LS “in-line”• Evaluation of the SEC/LS System
Results for Standard ProteinsSample Requirements
• Applications of SEC/LS to study protein complexes• Conclusions
Size Exclusion Chromatography (SEC)Coupled with Light Scattering (LS)
• Derivation of Molecular Weight from LS experiment• Experimental Set Up for SEC/LS “in-line”• Evaluation of the SEC/LS System
Results for Standard ProteinsSample Requirements
• Applications of SEC/LS to study protein complexes• Conclusions

Light Scattering Experiments
Sample cell
Monochromatic Laser Light
Io I
IΘ
detector
Computer
Θ

Static Light Scattering Experiments
Debye-Zimm formalism for R(Θ), the excess intensity of scattered light at an angle Θ
c is the sample concentration (g/ml)Mw is the weight-average molecular weight (molar mass)A2 is the second virial coefficient (ml-mol/g2)K* is an optical parameter equal to 4π2n2 (dn/dc)2 /(λ0
4NA)n is the solvent refractive index and dn/dc is the refractive index
increment NA is Avogadro’s numberλ0 is the wavelength of the scattered light in vacuum (cm)
is the form factor (describes angular dependence of scattered light)
cAPMR
cKw 22
)(1
)(*
+=θθ
)(θP
Static Light Scattering Experiments
cAPMR
cKw 22
)(1
)(*
+=θθ
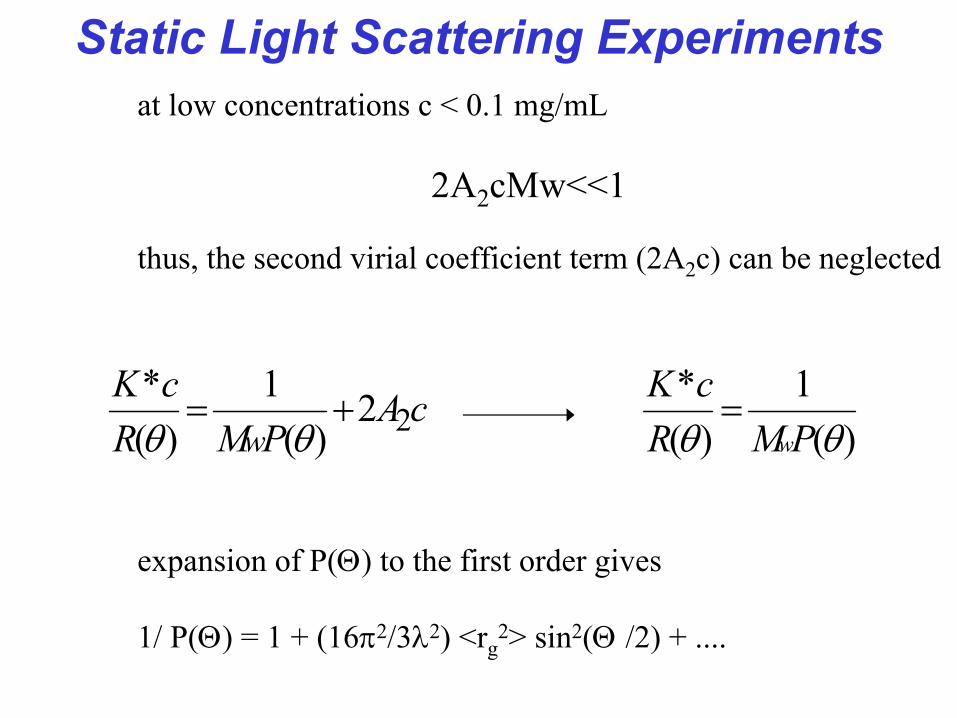
at low concentrations c < 0.1 mg/mL
2A2cMw<<1
thus, the second virial coefficient term (2A2c) can be neglected
)(1
)(*
θθ PMRcK
w=
expansion of P(Θ) to the first order gives
1/ P(Θ) = 1 + (16π2/3λ2) <rg2> sin2(Θ /2) + ....
Static Light Scattering Experiments
) )(sin r ) 3/ (16 (11)(
*2
2222g
θλπθ
><+=wMR
cK
)(*θRcK
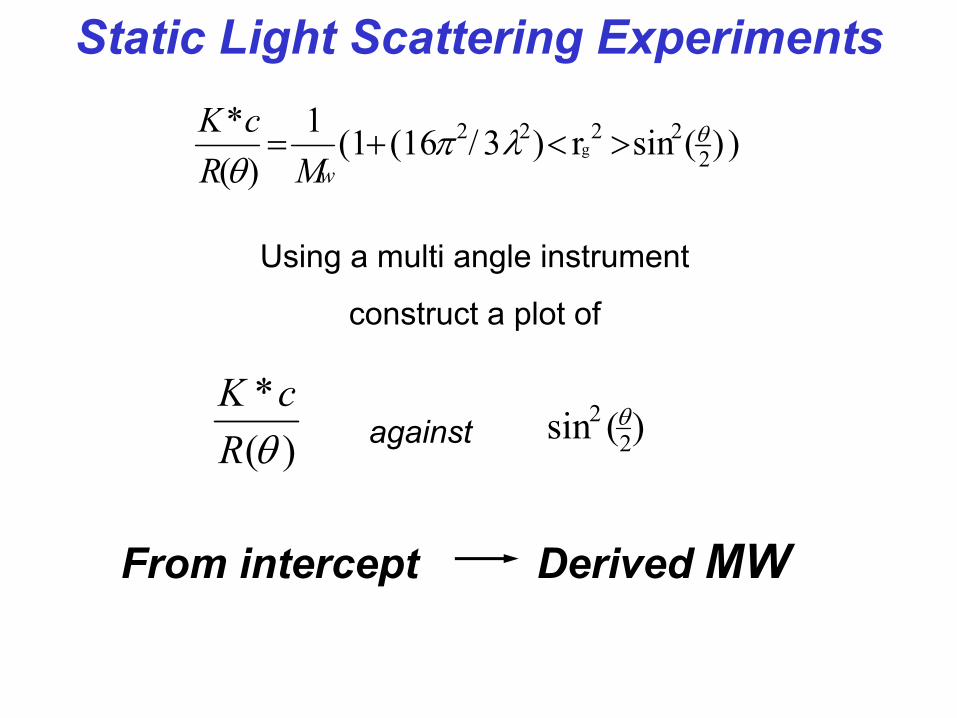
)( sin 22 θagainst
From intercept Derived MW
Using a multi angle instrument
construct a plot of
2.2e-5
2.3e-5
0.2 0.6 sin²( Θ /2)
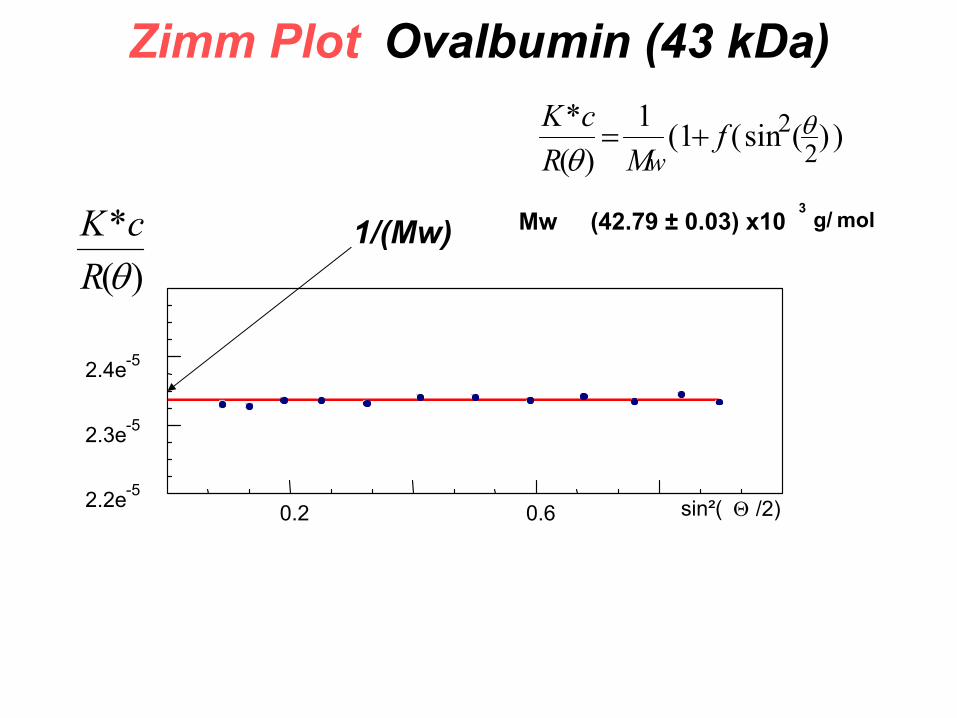
Mw (42.79 ± 0.03) x103 g/ mol
2.4e-5
Zimm Plot Ovalbumin (43 kDa)
1/(Mw)
) )(sin ((11)(
*2
2 θθ
fMR
cKw
+=
)(*θRcK
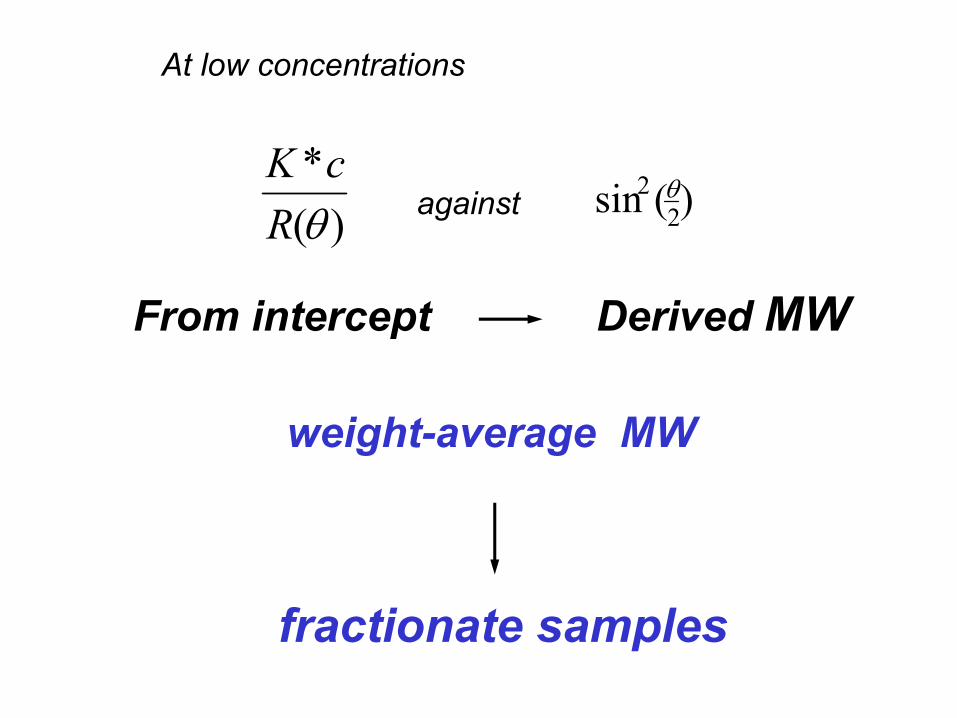
From intercept Derived MW
weight-average MW
)(*θRcK
)( sin 22 θagainst
fractionate samples
At low concentrations
Size Exclusion Chromatography (SEC)Coupled with Light Scattering (LS)
• Derivation of Molecular Weight from LS experiment• Experimental Set Up for SEC/LS “in-line”• Evaluation of the SEC/LS System
Results for Standard ProteinsSample Requirements
• Applications of SEC/LS to study protein complexes• Conclusions
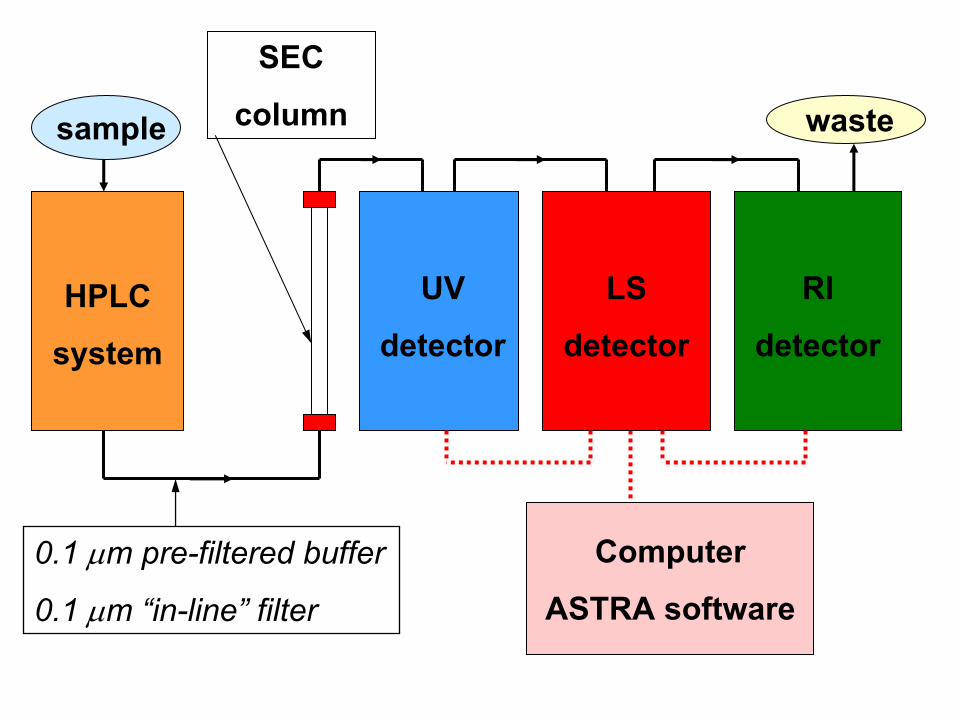
sample
HPLC
system
waste
Computer
ASTRA software
UV
detector
LS
detector
RI
detector
SEC
column
0.1 µm pre-filtered buffer
0.1 µm “in-line” filter

90° & AUX detectors
2.2e-5
2.3e-5
0.2 0.6 sin²( Θ /2)
Volume : 16.300 mL
Conc. : (0.173 ± 0.000) mg/mL
Mw (42.79 ± 0.03) x103 g/molRadius : 0.0 ± 0.0 nm
2.4e-5
Zimm Plot Ovalbumin (43 kDa)
1/(Mw)
) )(sin ((11)(
*2
2 θθ
fMR
cKw
+=
)(*θRcK
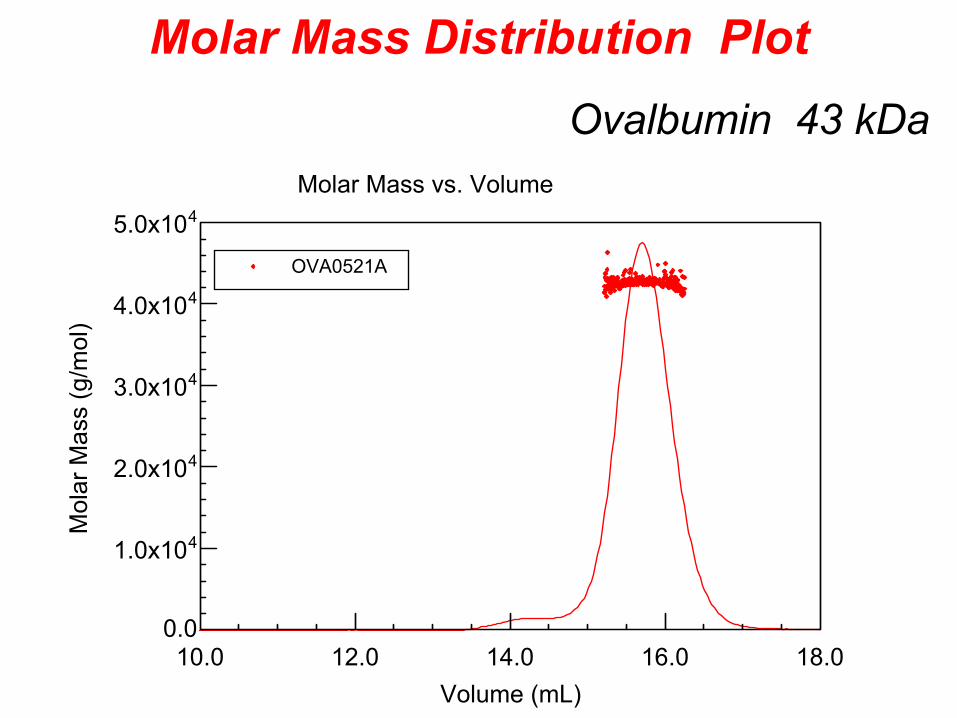
Molar Mass Distribution Plot
0.0
41.0x10
42.0x10
43.0x10
44.0x10
45.0x10
10.0 12.0 14.0 16.0 18.0
Mol
ar M
ass
(g/m
ol)
Volume (mL)
Molar Mass vs. Volume
OVA0521A
Ovalbumin 43 kDa
0.0
45.0x10
51.0x10
51.5x10
52.0x10
52.5x10
10.0 12.0 14.0 16.0 18.0
Mol
ar M
ass
(g/m
ol)
Volume (mL)
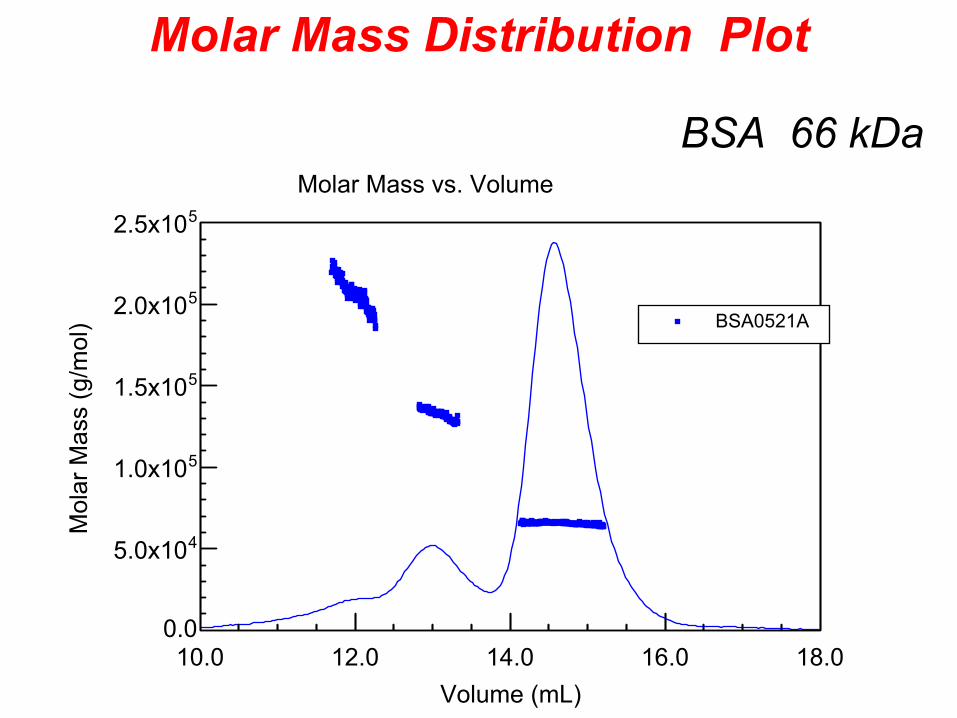
Molar Mass vs. Volume
BSA0521A
BSA 66 kDa
Molar Mass Distribution Plot
Size Exclusion Chromatography (SEC)Coupled with Light Scattering (LS)
• Derivation of Molecular Weight from LS experiment• Experimental Set Up for SEC/LS “in-line”• Evaluation of the SEC/LS System
Results for Standard ProteinsSample Requirements
• Applications of SEC/LS to study protein complexes• Conclusions
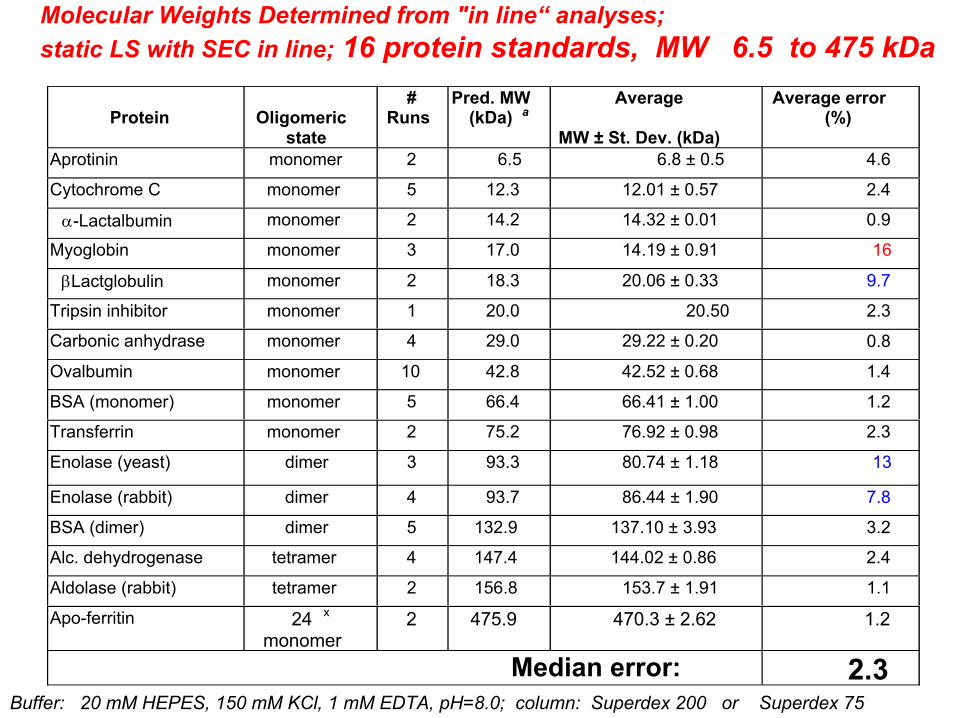
Buffer: 20 mM HEPES, 150 mM KCl, 1 mM EDTA, pH=8.0; column: Superdex 200 or Superdex 75
Molecular Weights Determined from "in line“ analyses; static LS with SEC in line; 16 protein standards, MW 6.5 to 475 kDa
Protein Oligomericstate
#Runs
Pred. MW(kDa) a
Average
MW ± St. Dev. (kDa)
Average error(%)
Aprotinin monomer 2 6.5 6.8 ± 0.5 4.6
Cytochrome C monomer 5 12.3 12.01 ± 0.57 2.4
α-Lactalbumin monomer 2 14.2 14.32 ± 0.01 0.9
Myoglobin monomer 3 17.0 14.19 ± 0.91 16
βLactglobulin monomer 2 18.3 20.06 ± 0.33 9.7
Tripsin inhibitor monomer 1 20.0 20.50 2.3
Carbonic anhydrase monomer 4 29.0 29.22 ± 0.20 0.8
Ovalbumin monomer 10 42.8 42.52 ± 0.68 1.4
BSA (monomer) monomer 5 66.4 66.41 ± 1.00 1.2
Transferrin monomer 2 75.2 76.92 ± 0.98 2.3
Enolase (yeast) dimer 3 93.3 80.74 ± 1.18 13
Enolase (rabbit) dimer 4 93.7 86.44 ± 1.90 7.8
BSA (dimer) dimer 5 132.9 137.10 ± 3.93 3.2
Alc. dehydrogenase tetramer 4 147.4 144.02 ± 0.86 2.4
Aldolase (rabbit) tetramer 2 156.8 153.7 ± 1.91 1.1
Apo-ferritin 24 x
monomer2 475.9 470.3 ± 2.62 1.2
Median error: 2.3
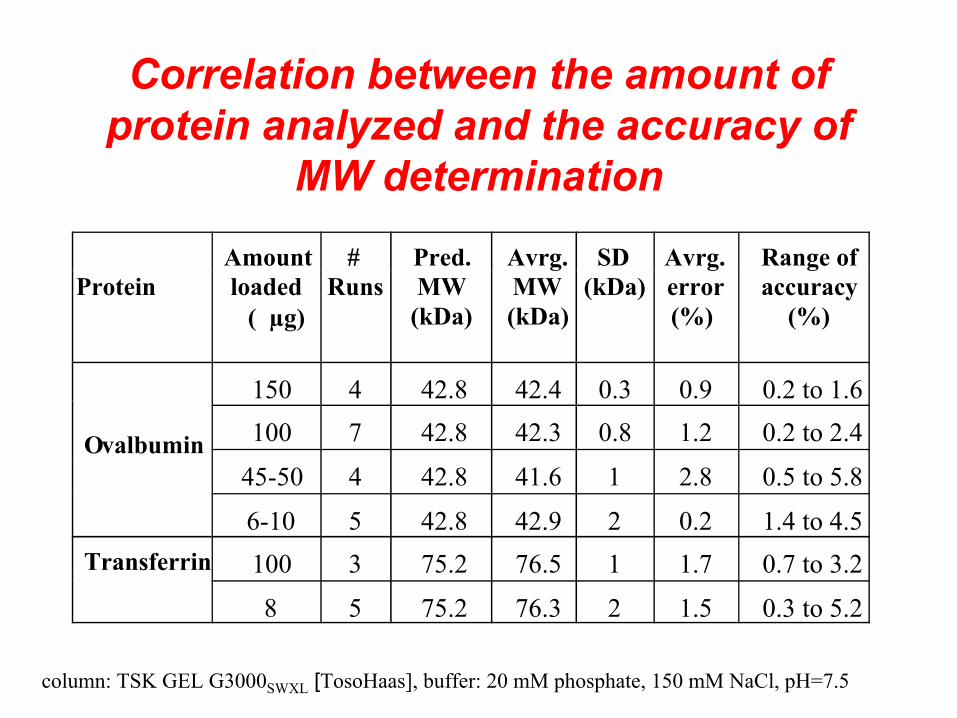
Correlation between the amount of protein analyzed and the accuracy of
MW determination
column: TSK GEL G3000SWXL [TosoHaas], buffer: 20 mM phosphate, 150 mM NaCl, pH=7.5
ProteinAmountloaded
( µg)
#Runs
Pred.MW
(kDa)
Avrg.MW(kDa)
SD(kDa)
Avrg.error(%)
Range ofaccuracy
(%)
Ovalbumin
150 4 42.8 42.4 0.3 0.9 0.2 to 1.6100 7 42.8 42.3 0.8 1.2 0.2 to 2.4
45-50 4 42.8 41.6 1 2.8 0.5 to 5.8
6-10 5 42.8 42.9 2 0.2 1.4 to 4.5Transferrin 100 3 75.2 76.5 1 1.7 0.7 to 3.2
8 5 75.2 76.3 2 1.5 0.3 to 5.2
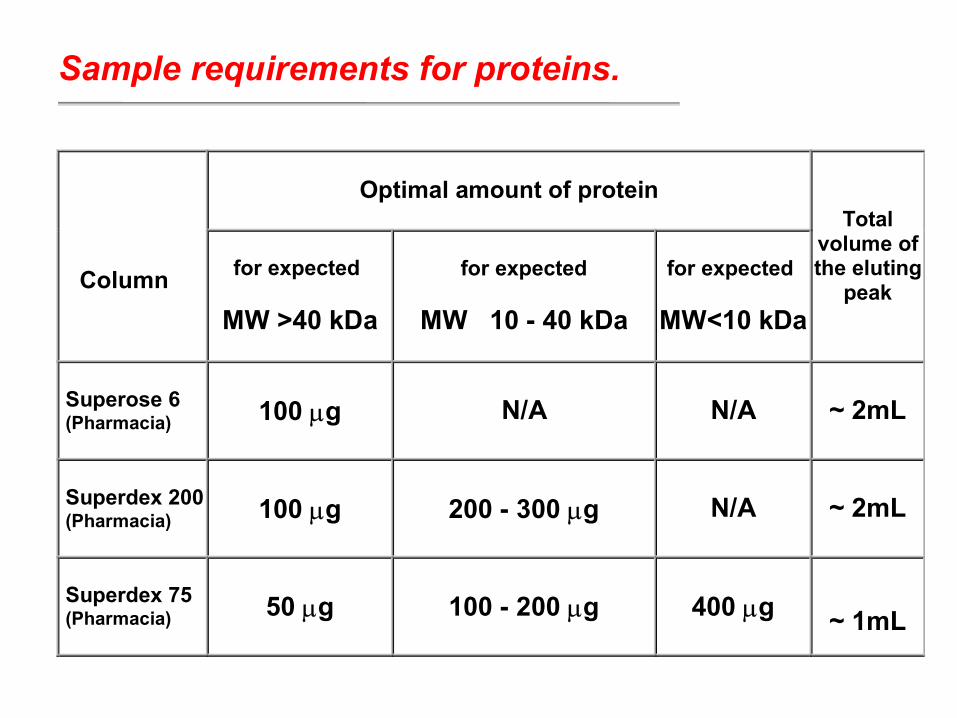
Sample requirements for proteins.
Optimal amount of protein
Column for expected
MW >40 kDa
for expected
MW 10 - 40 kDa
for expected
MW<10 kDa
Totalvolume ofthe eluting
peak
Superose 6 (Pharmacia) 100 µg N/A N/A ~ 2mL
Superdex 200 (Pharmacia) 100 µg 200 - 300 µg N/A ~ 2mL
Superdex 75 (Pharmacia) 50 µg 100 - 200 µg 400 µg ~ 1mL
Size Exclusion Chromatography (SEC)Coupled with Light Scattering (LS)
• Derivation of Molecular Weight from LS experiment• Experimental Set Up for SEC/LS “in-line”• Evaluation of the SEC/LS System
Results for Standard ProteinsSample Requirements
• Applications of SEC/LS to study protein complexes• Conclusions

Applications of SEC/LS to study protein complexes
• Determination of the oligomeric state of mutant vs. wild type protein
• Mixtures of non-interacting proteins• Mixtures of interacting protein- detection of ligand driven
protein complexes• Determination of oligomeric state of glycosylated
proteins• Determination of oligomeric state of membrane proteins
solubilized in detergents
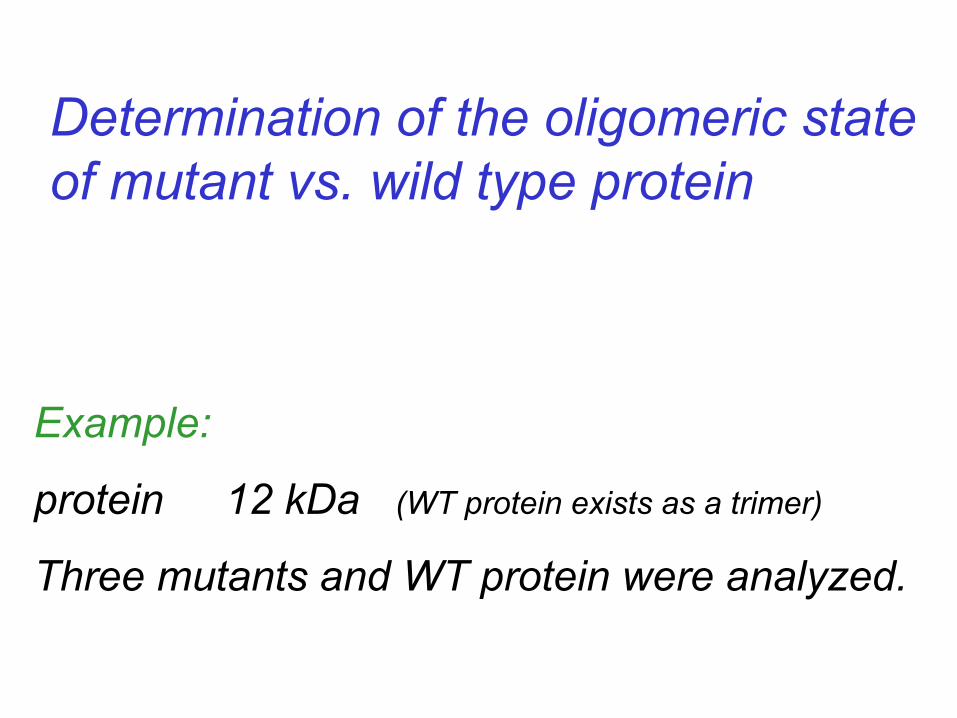
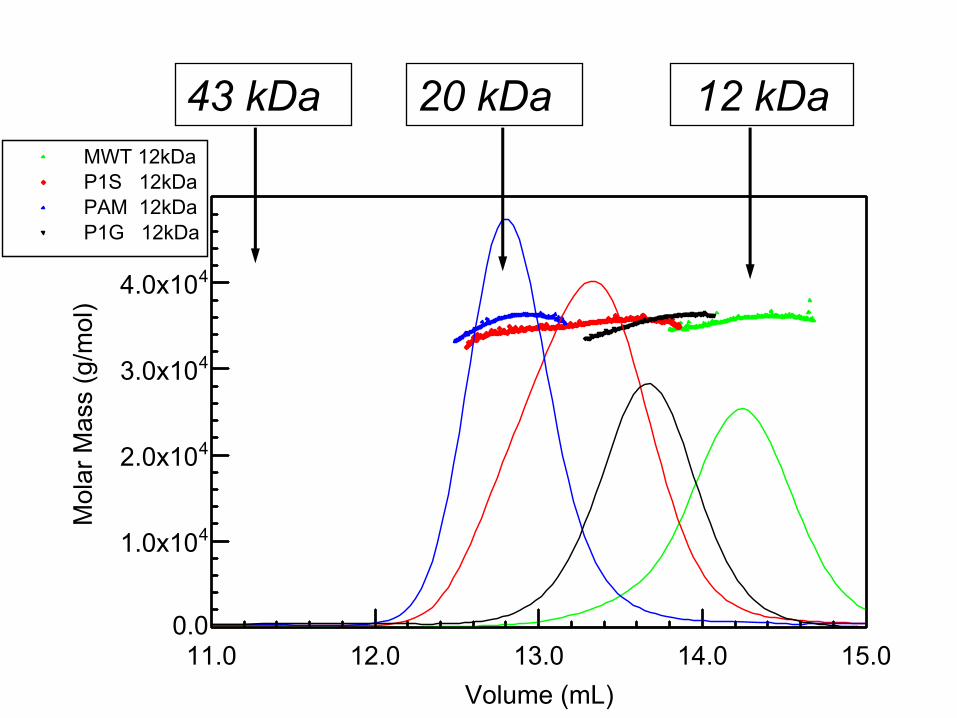
Determination of the oligomeric state of mutant vs. wild type protein
Example:
protein 12 kDa (WT protein exists as a trimer)
Three mutants and WT protein were analyzed.
0.0
41.0x10
42.0x10
43.0x10
44.0x10
45.0x10
11.0 12.0 13.0 14.0 15.0
Mol
ar M
ass
(g/m
ol)
Volume (mL)
Molar Mass vs. VolumeMWT 12kDaP1S 12kDaPAM 12kDaP1G 12kDa
12 kDa trimeric20 kDa43 kDa 12 kDa
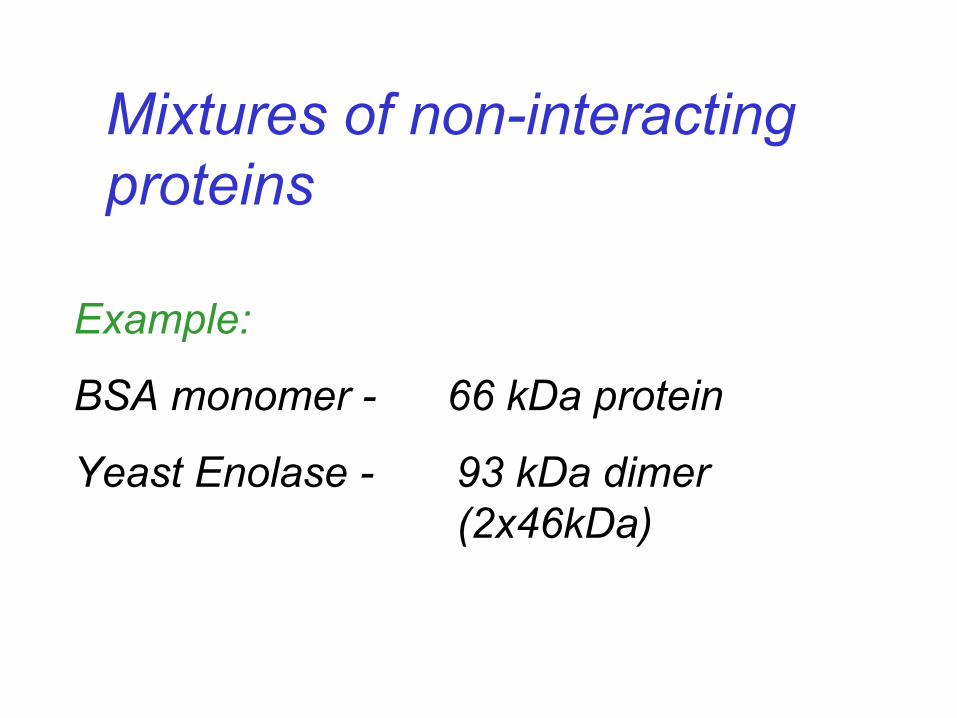
Mixtures of non-interacting proteins
Example:
BSA monomer - 66 kDa protein
Yeast Enolase - 93 kDa dimer (2x46kDa)
0.0
42.0x10
44.0x10
46.0x10
48.0x10
51.0x10
6.0 7.0 8.0 9.0 10.0 11.0
Mol
ar M
ass
(g/m
ol)
Volume (mL)
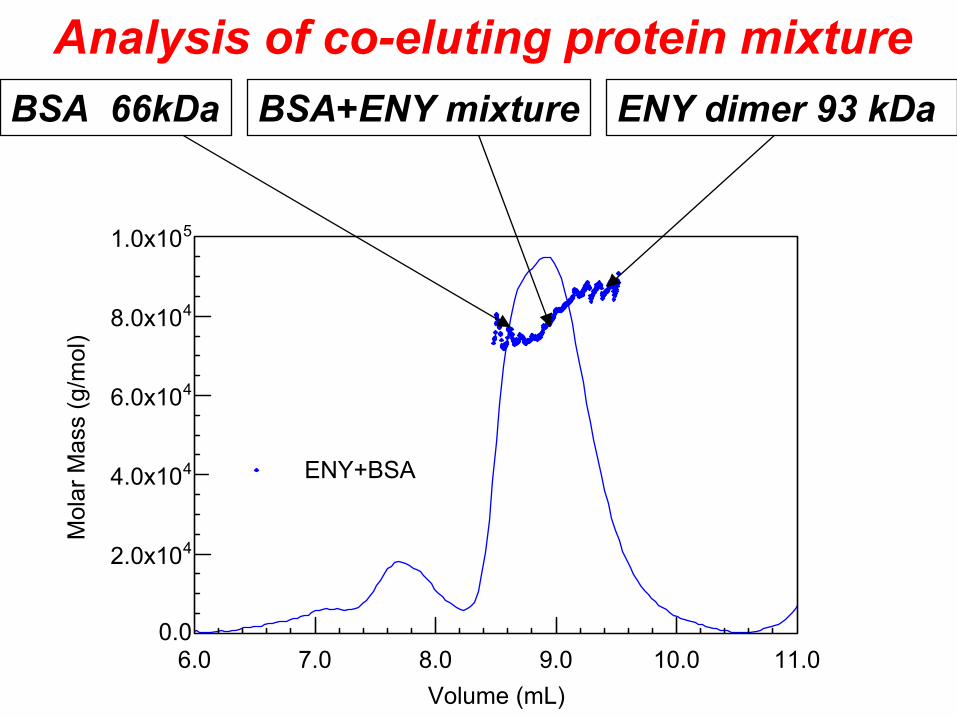
Molar Mass vs. Volume
ENY+BSA
Analysis of co-eluting protein mixtureBSA 66kDa BSA+ENY mixture ENY dimer 93 kDa
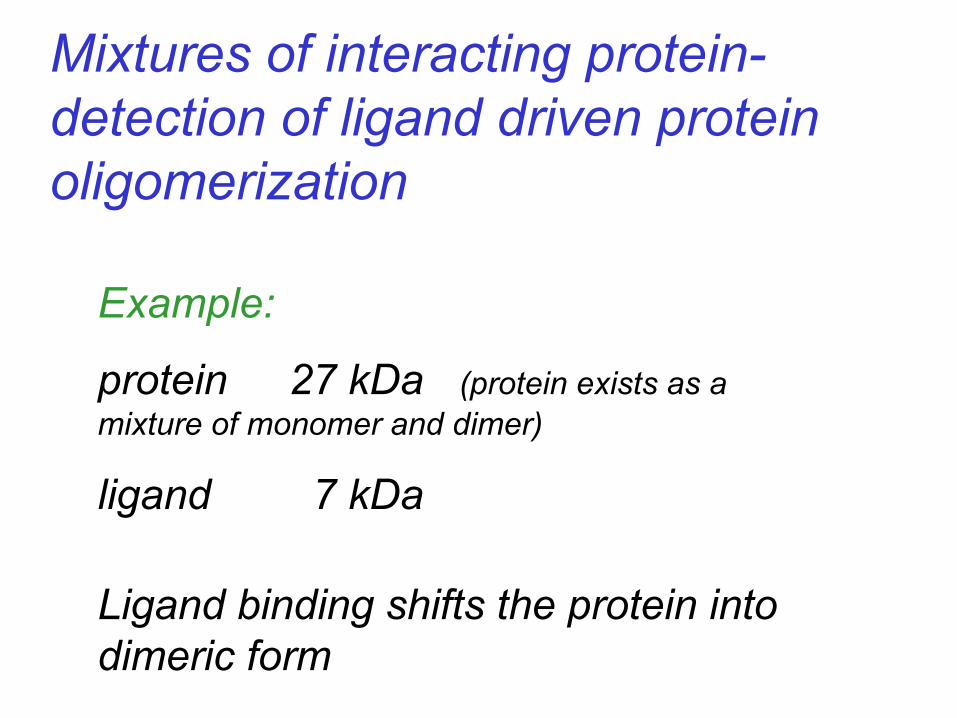
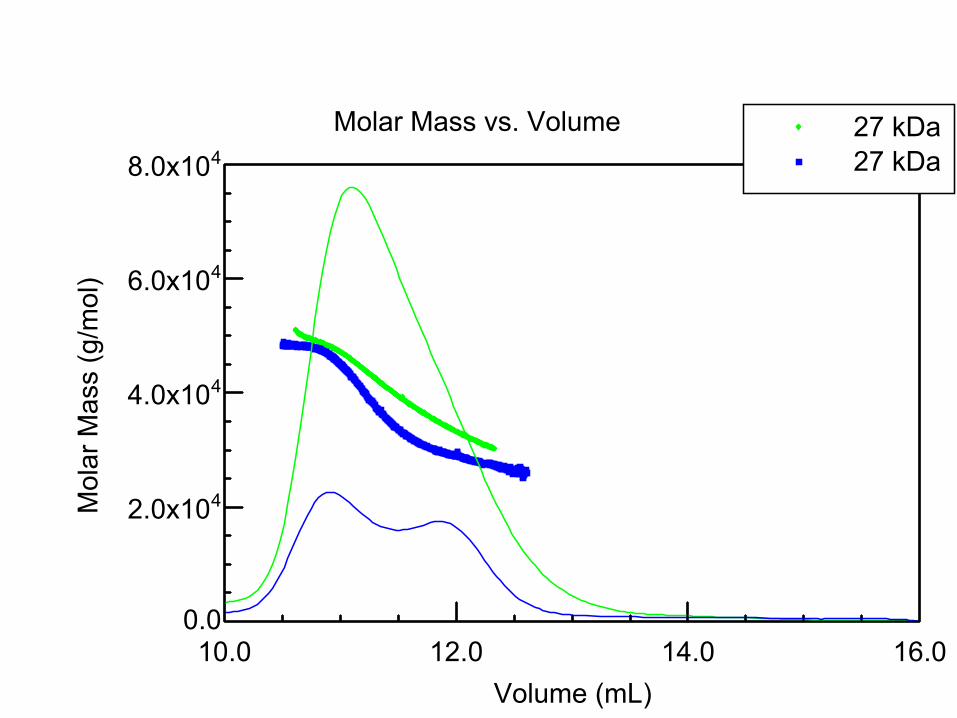
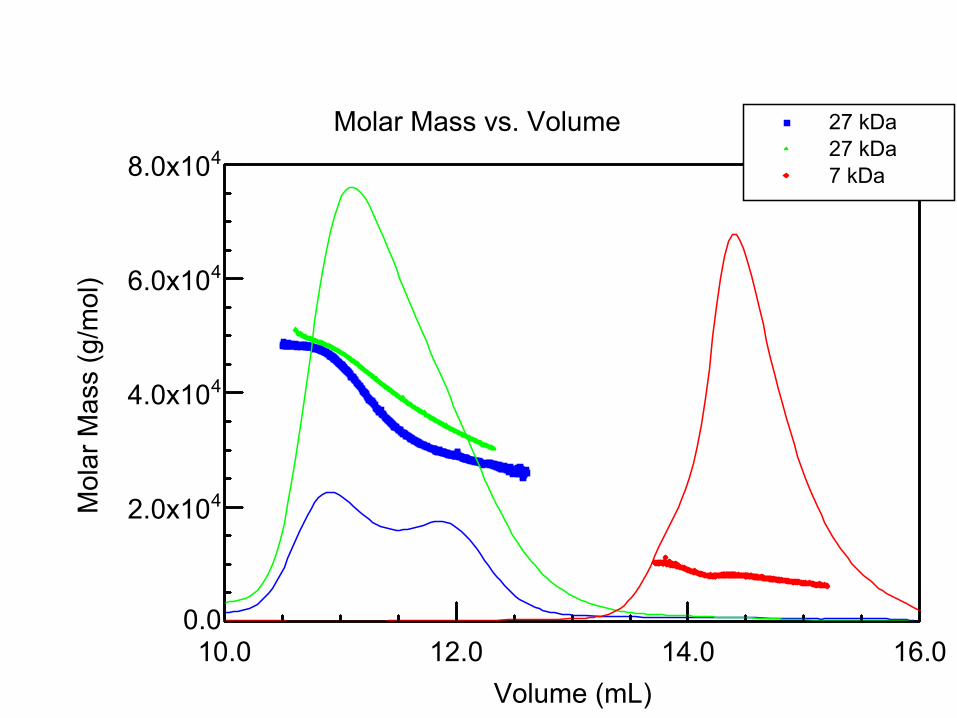
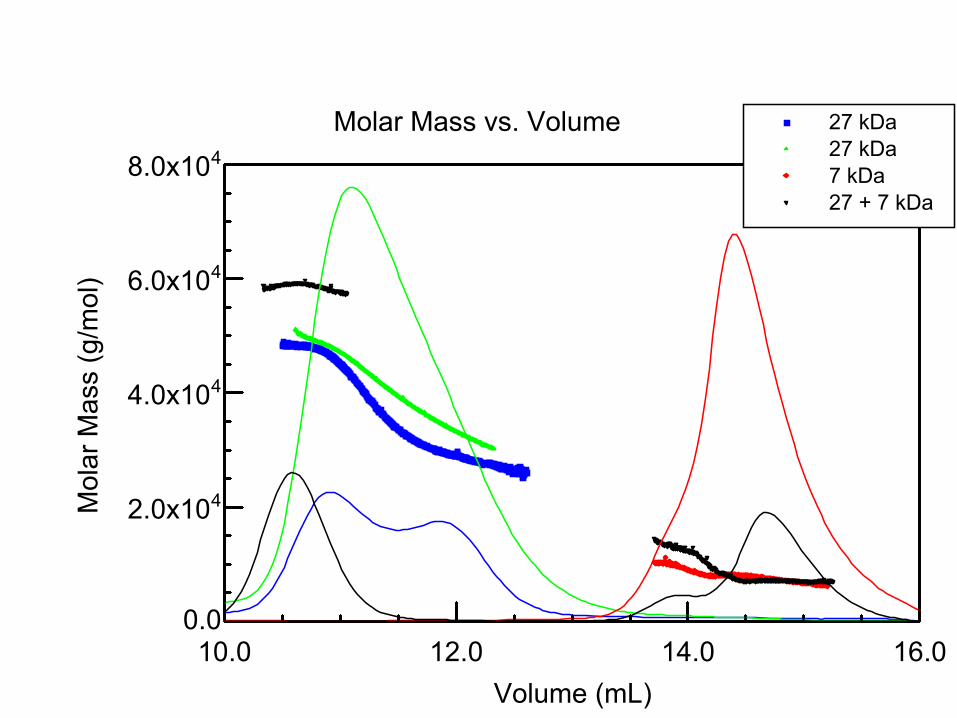
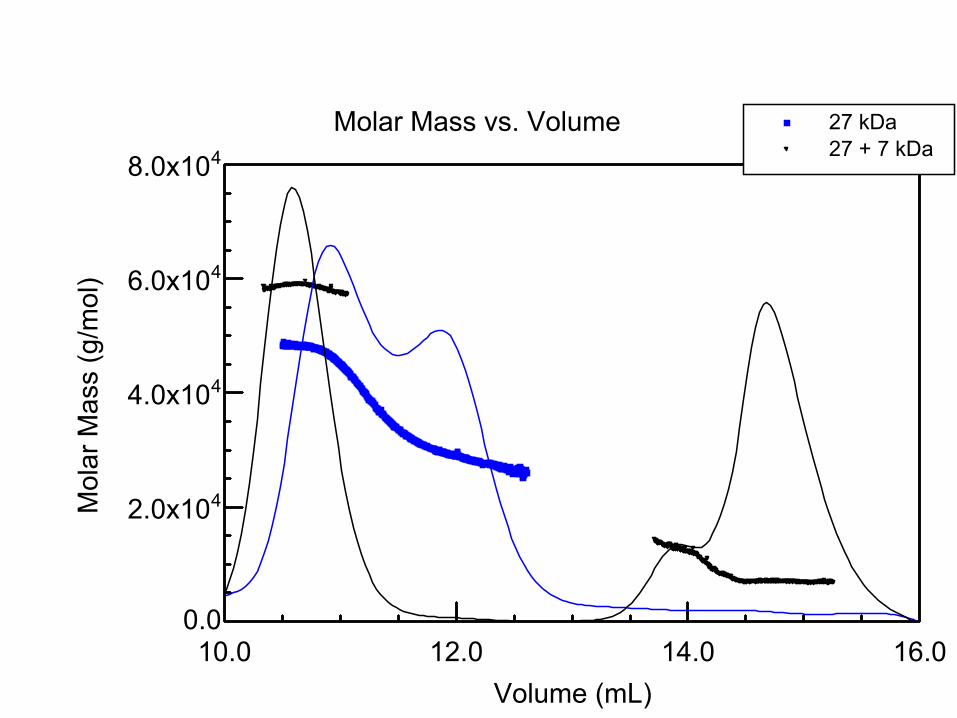
Mixtures of interacting protein-detection of ligand driven protein oligomerization
Example:
protein 27 kDa (protein exists as a mixture of monomer and dimer)
ligand 7 kDa
Ligand binding shifts the protein into dimeric form

Analysis of interacting proteins
0.0
42.0x10
44.0x10
46.0x10
48.0x10
10.0 12.0 14.0 16.0
Mol
ar M
ass
(g/m
ol)
Volume (mL)
Molar Mass vs. Volume 27 kDa
0.0
42.0x10
44.0x10
46.0x10
48.0x10
10.0 12.0 14.0 16.0
Mol
ar M
ass
(g/m
ol)
Volume (mL)
Molar Mass vs. Volume 27 kDa27 kDa
0.0
42.0x10
44.0x10
46.0x10
48.0x10
10.0 12.0 14.0 16.0
Mol
ar M
ass
(g/m
ol)
Volume (mL)
Molar Mass vs. Volume 27 kDa27 kDa7 kDa
0.0
42.0x10
44.0x10
46.0x10
48.0x10
10.0 12.0 14.0 16.0
Mol
ar M
ass
(g/m
ol)
Volume (mL)
Molar Mass vs. Volume 27 kDa27 kDa7 kDa27 + 7 kDa
0.0
42.0x10
44.0x10
46.0x10
48.0x10
10.0 12.0 14.0 16.0
Mol
ar M
ass
(g/m
ol)
Volume (mL)
Molar Mass vs. Volume 27 kDa27 + 7 kDa
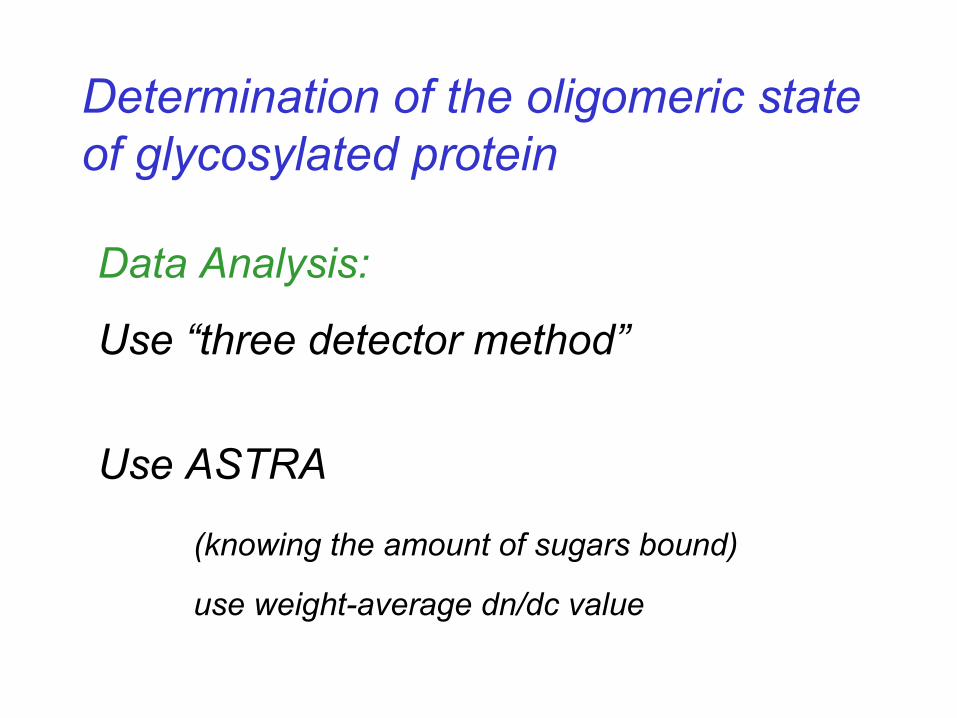
Determination of the oligomeric state of glycosylated protein
Data Analysis:
Use “three detector method”
Use ASTRA
(knowing the amount of sugars bound)
use weight-average dn/dc value
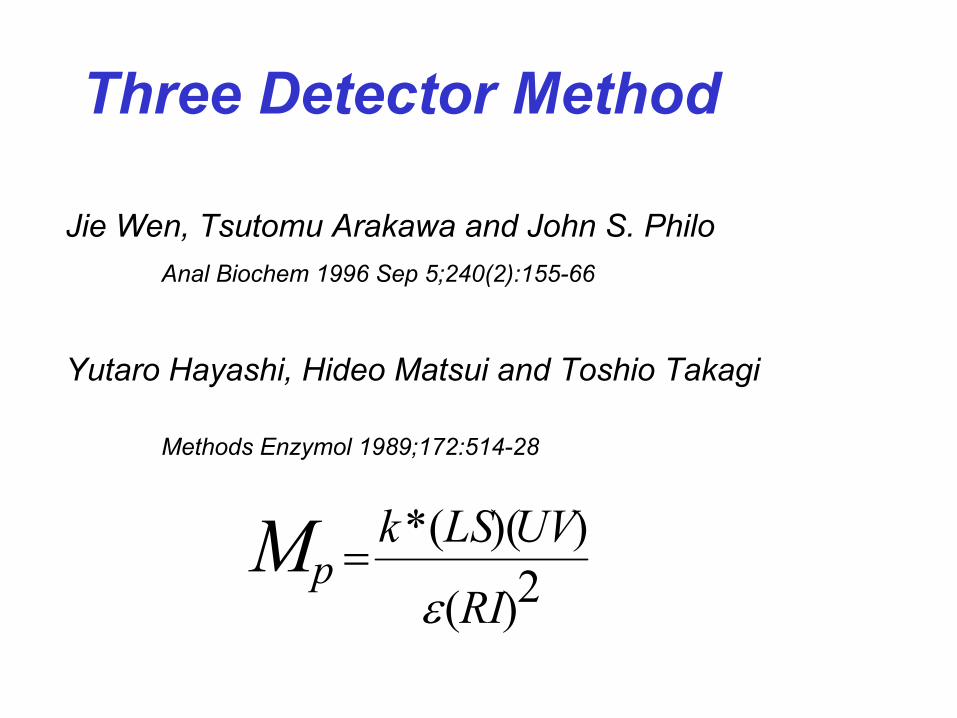
Jie Wen, Tsutomu Arakawa and John S. PhiloAnal Biochem 1996 Sep 5;240(2):155-66
Yutaro Hayashi, Hideo Matsui and Toshio Takagi
Methods Enzymol 1989;172:514-28
2)(
))((*
RI
UVLSkpM
ε=
Three Detector Method
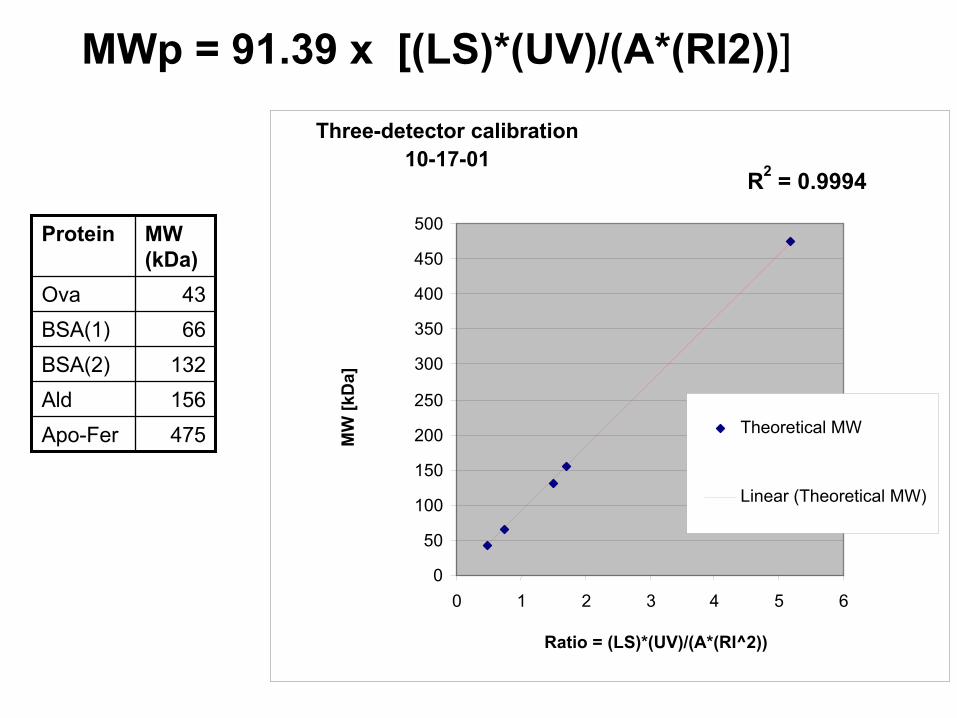
475Apo-Fer156Ald132BSA(2)66BSA(1)43Ova
MW (kDa)
Protein
Three-detector calibration 10-17-01
R2 = 0.9994
0
50
100
150
200
250
300
350
400
450
500
0 1 2 3 4 5 6
Ratio = (LS)*(UV)/(A*(RI^2))
MW
[kD
a]
Theoretical MW
Linear (Theoretical MW)
MWp = 91.39 x [(LS)*(UV)/(A*(RI2))]

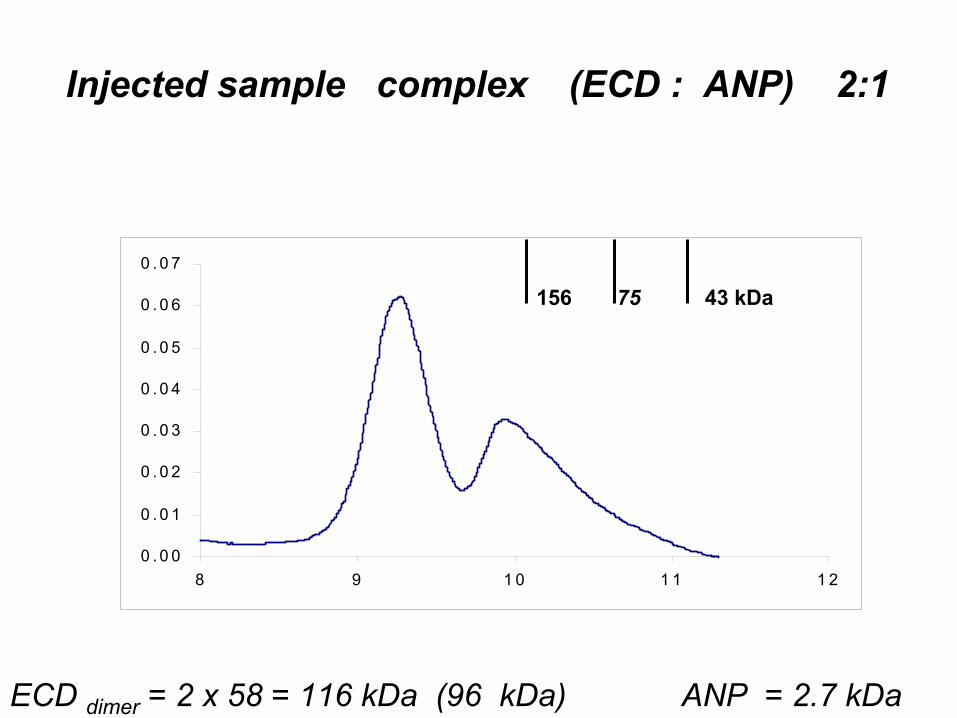
Determination of the oligomeric state of glycosylated protein
Example:
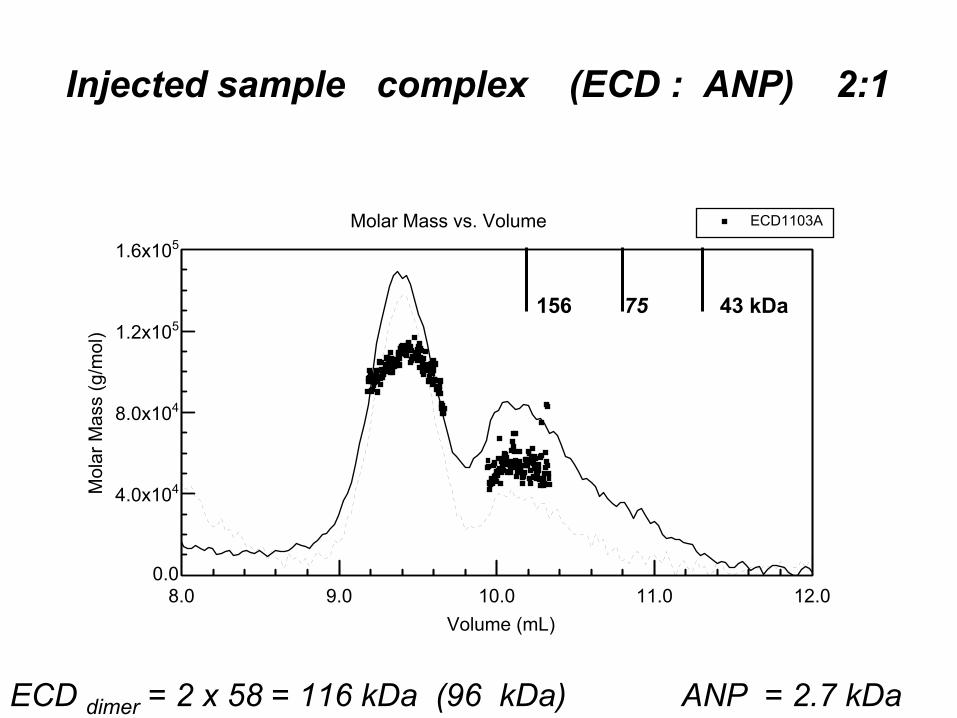
protein 58 kDa extracellular ANP-binding domain (ECD) of cell-surface receptor 16% of mass is sugar
dn/dct = 0.179 g/mL
48 kDa polypeptide portion
ligand 2.7 kDa atrial natriuretic peptide (ANP)
0 . 0 0
0 . 0 1
0 . 0 2
0 . 0 3
0 . 0 4
0 . 0 5
0 . 0 6
0 . 0 7
8 9 1 0 1 1 1 2
43 kDa75156
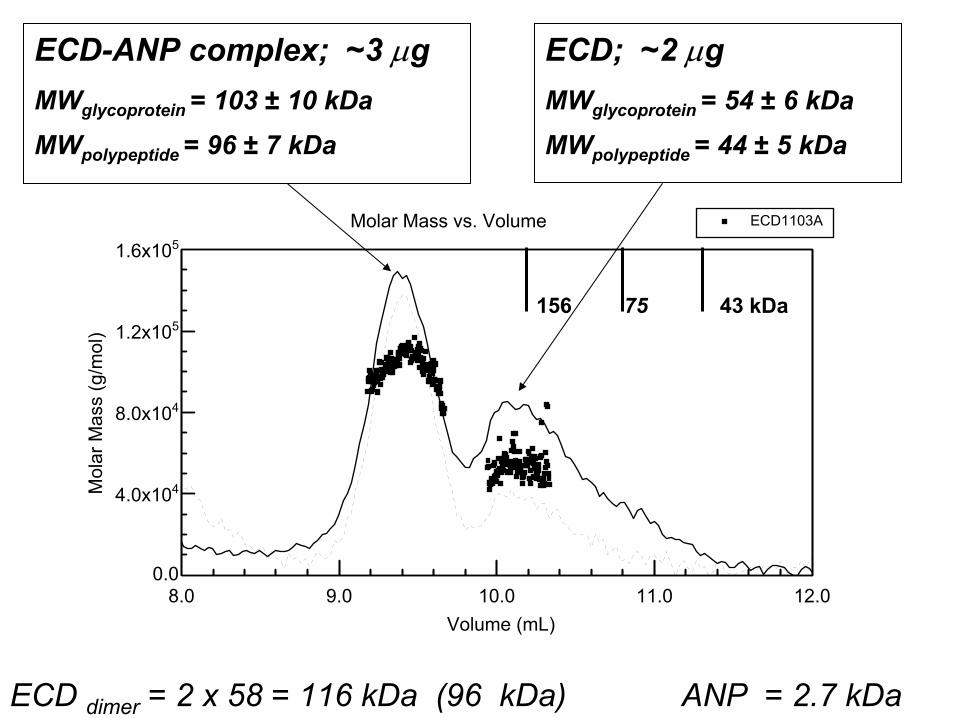
Injected sample complex (ECD : ANP) 2:1
ECD dimer = 2 x 58 = 116 kDa (96 kDa) ANP = 2.7 kDa
0.0
44.0x10
48.0x10
51.2x10
51.6x10
8.0 9.0 10.0 11.0 12.0
Mol
ar M
ass
(g/m
ol)
Volume (mL)
Molar Mass vs. Volume ECD1103A
43 kDa75156
ECD dimer = 2 x 58 = 116 kDa (96 kDa) ANP = 2.7 kDa
Injected sample complex (ECD : ANP) 2:1
0.0
44.0x10
48.0x10
51.2x10
51.6x10
8.0 9.0 10.0 11.0 12.0
Mol
ar M
ass
(g/m
ol)
Volume (mL)
Molar Mass vs. Volume ECD1103A
ECD-ANP complex; ~3 µgMWglycoprotein = 103 ± 10 kDaMWpolypeptide = 96 ± 7 kDa
ECD; ~2 µgMWglycoprotein = 54 ± 6 kDaMWpolypeptide = 44 ± 5 kDa
ECD dimer = 2 x 58 = 116 kDa (96 kDa) ANP = 2.7 kDa
43 kDa75156
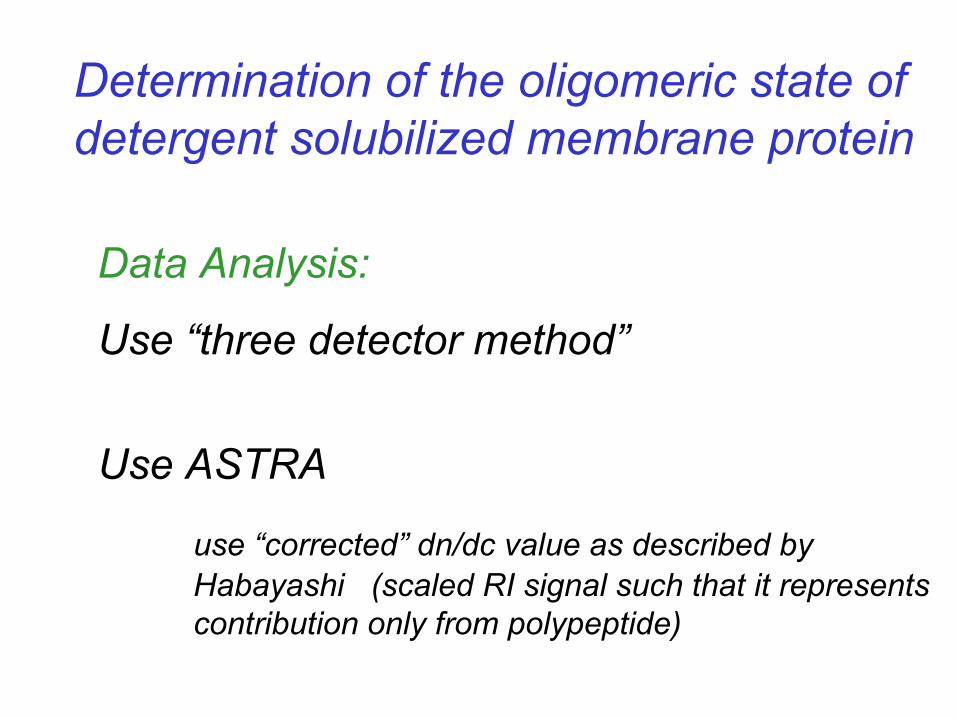
Determination of the oligomeric state of detergent solubilized membrane protein
Data Analysis:
Use “three detector method”
Use ASTRA
use “corrected” dn/dc value as described by Habayashi (scaled RI signal such that it represents contribution only from polypeptide)
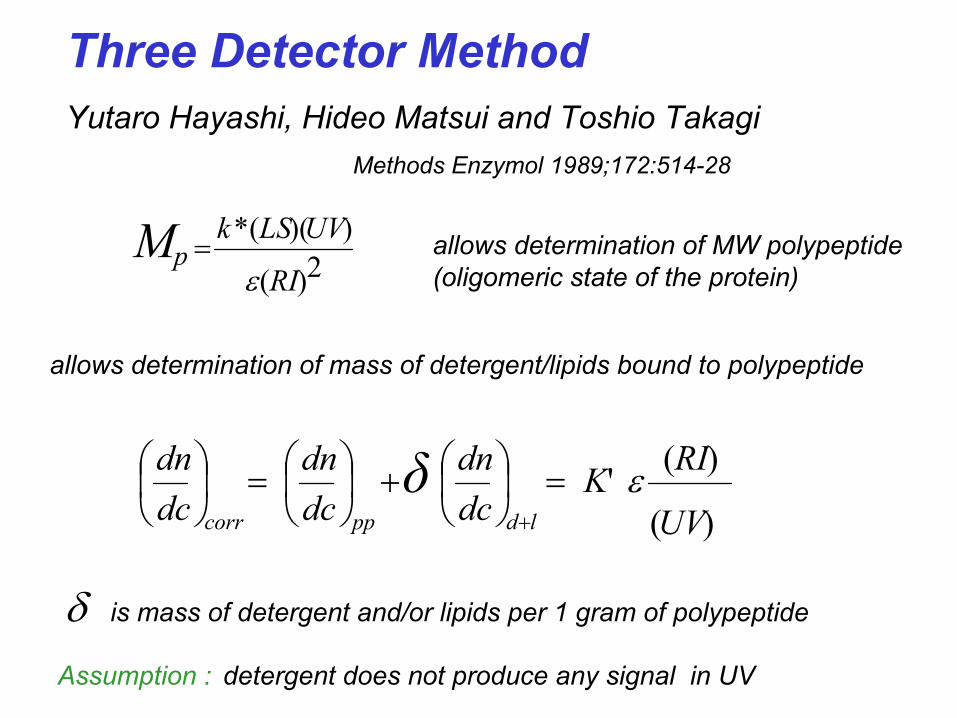
Three Detector MethodYutaro Hayashi, Hideo Matsui and Toshio Takagi
Methods Enzymol 1989;172:514-28
2)(
))((*
RI
UVLSkpM
ε=
)(
)('UV
RIKdcdn
dcdn
dcdn
ldppcorrδ ε=
+
=
+
allows determination of MW polypeptide (oligomeric state of the protein)
allows determination of mass of detergent/lipids bound to polypeptide
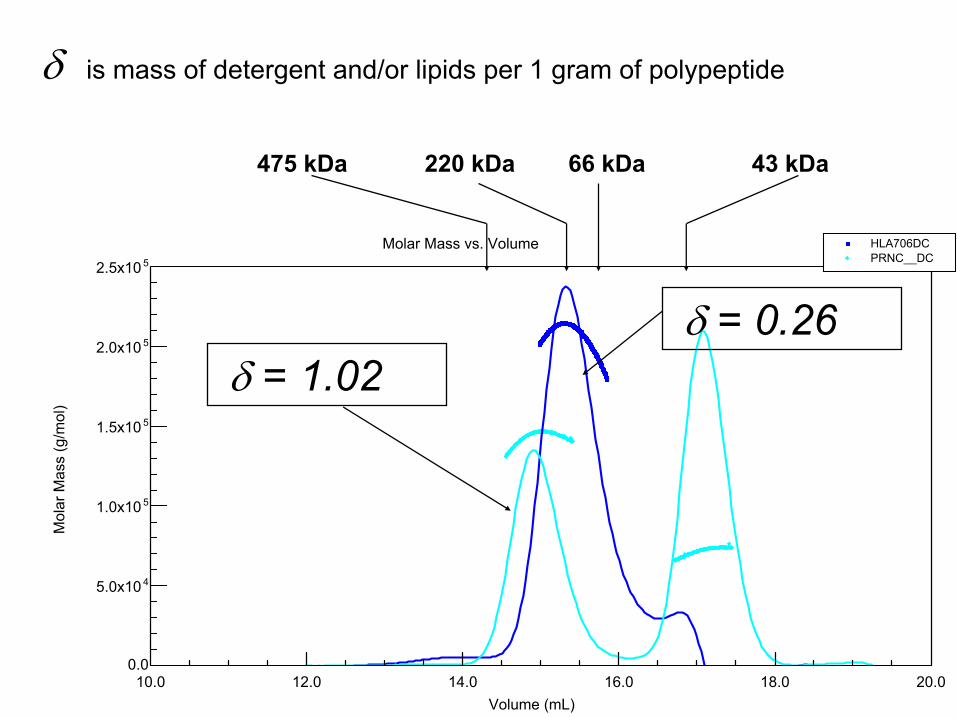
δ is mass of detergent and/or lipids per 1 gram of polypeptide
Assumption : detergent does not produce any signal in UV
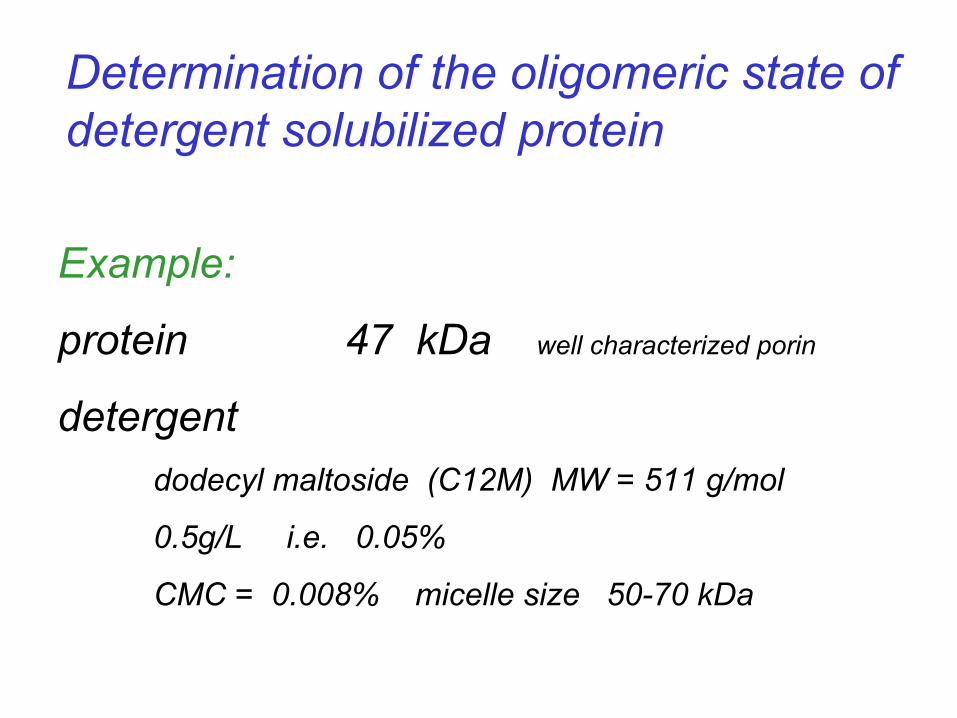
Determination of the oligomeric state of detergent solubilized protein
Example:
protein 47 kDa well characterized porin
detergentdodecyl maltoside (C12M) MW = 511 g/mol
0.5g/L i.e. 0.05%
CMC = 0.008% micelle size 50-70 kDa
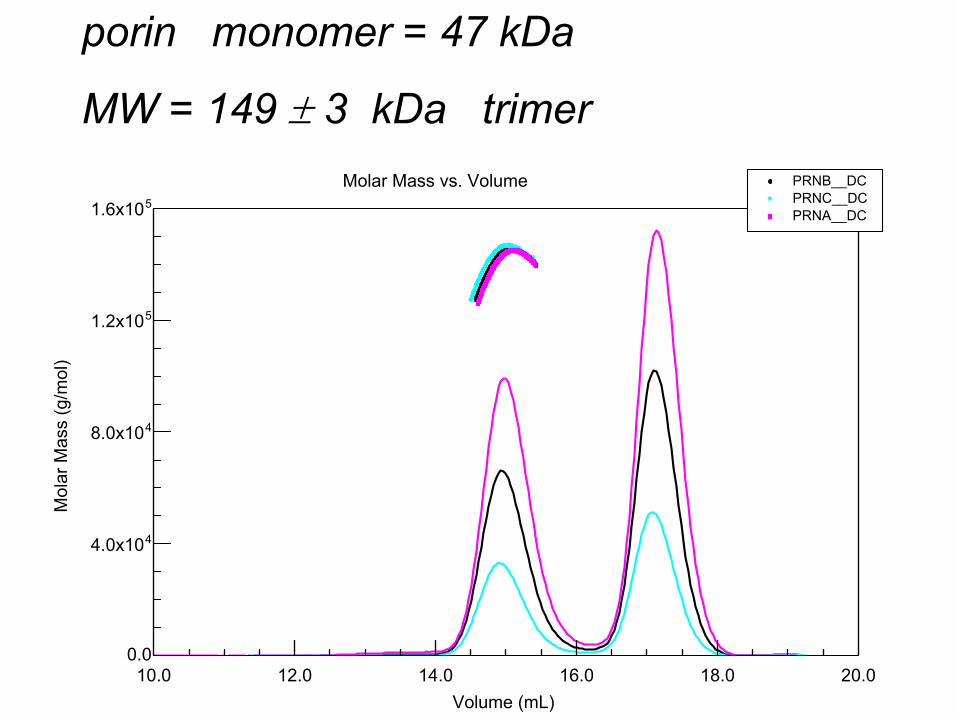
porin monomer = 47 kDa
MW = 149 ± 3 kDa trimer
0.0
44.0x10
48.0x10
51.2x10
51.6x10
10.0 12.0 14.0 16.0 18.0 20.0
Mol
ar M
ass
(g/m
ol)
Volume (mL)
Molar Mass vs. Volume PRNB__DCPRNC__DCPRNA__DC

-0.2
0.0
0.2
0.4
0.6
0.8
10.0 12.0 14.0 16.0 18.0 20.0
AU
X, 9
0° D
etec
tor
Volume (mL)
Peak ID - PRNC__DC 90°AUX1AUX2
LS @ 90 degree
RI
UV @ 280 nm
0.0
44.0x10
48.0x10
51.2x10
51.6x10
10.0 12.0 14.0 16.0 18.0 20.0
Mol
ar M
ass
(g/m
ol)
Volume (mL)
Molar Mass vs. Volume PRNC__DCPRNB__DCPRNA__DC
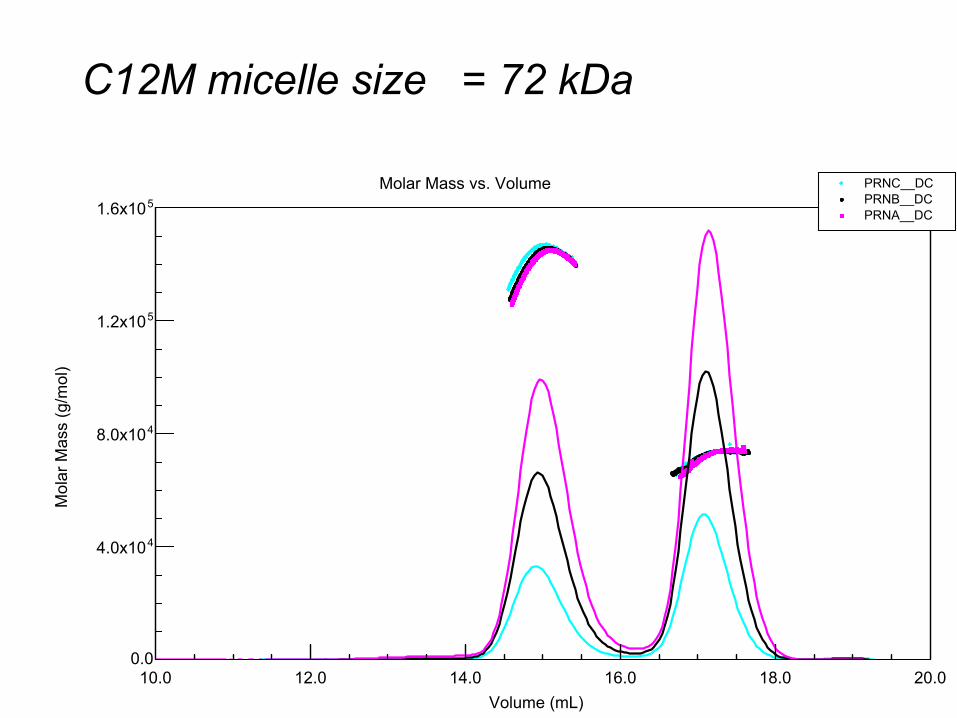
C12M micelle size = 72 kDa

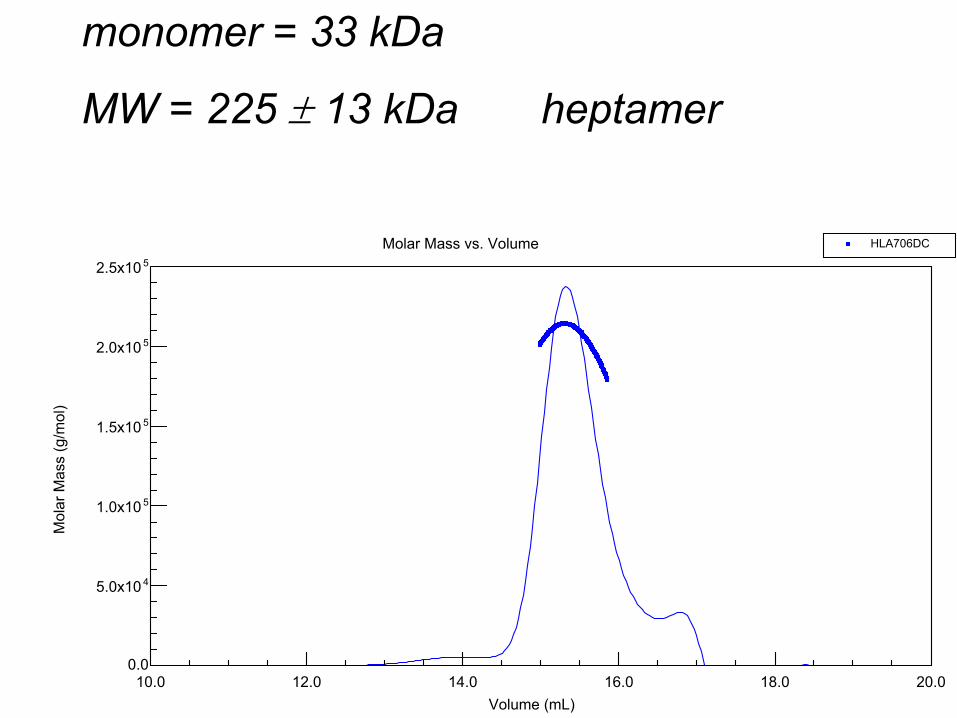
Determination of the oligomeric state of detergent solubilized protein
Example:
protein 33 kDa
Detergent
dodecyl maltoside (C12M) MW = 511 g/mol
n-Dodecyl-β-D-Maltoside
0.5g/L i.e. 0.05%
CMC = 0.008% micelle size 50-70 kDa
0.0
45.0x10
51.0x10
51.5x10
52.0x10
52.5x10
10.0 12.0 14.0 16.0 18.0 20.0
Mol
ar M
ass
(g/m
ol)
Volume (mL)
Molar Mass vs. Volume HLA706DC
monomer = 33 kDa
MW = 225 ± 13 kDa heptamer
0.0
45.0x10
51.0x10
51.5x10
52.0x10
52.5x10
10.0 12.0 14.0 16.0 18.0 20.0
Mol
ar M
ass
(g/m
ol)
Volume (mL)
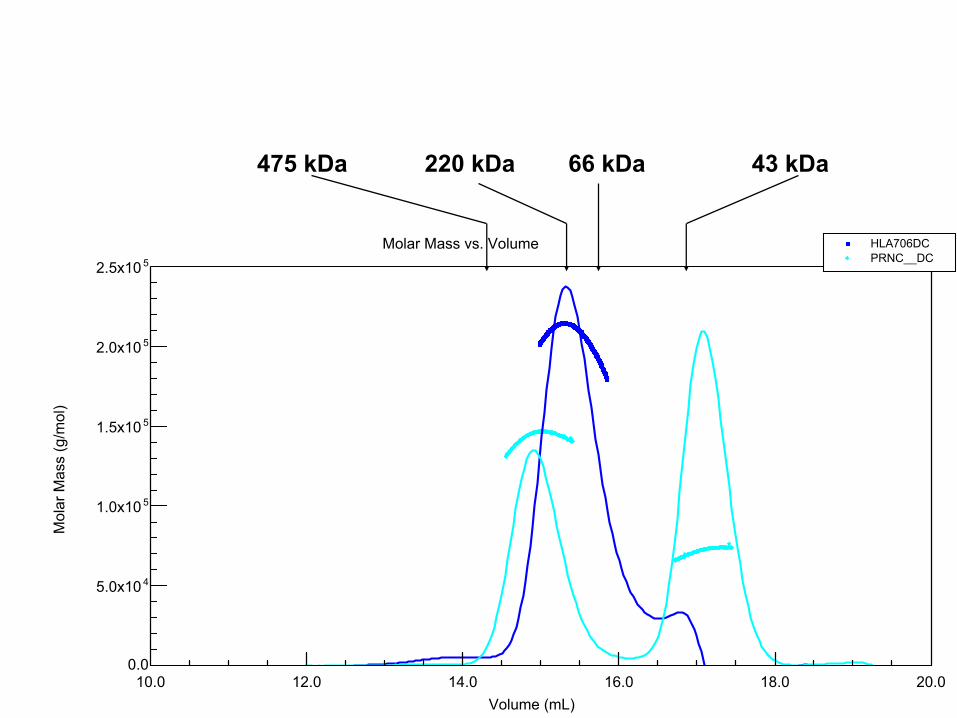
Molar Mass vs. Volume HLA706DCPRNC__DC
475 kDa 220 kDa 66 kDa 43 kDa
0.0
45.0x10
51.0x10
51.5x10
52.0x10
52.5x10
10.0 12.0 14.0 16.0 18.0 20.0
Mol
ar M
ass
(g/m
ol)
Volume (mL)
Molar Mass vs. Volume HLA706DCPRNC__DC
475 kDa 220 kDa 66 kDa 43 kDa
δ = 1.02 δ = 0.26
δ is mass of detergent and/or lipids per 1 gram of polypeptide
0.0
51.0x10
52.0x10
53.0x10
54.0x10
10.0 12.0 14.0 16.0 18.0 20.0
Mol
ar M
ass
(g/m
ol)
Volume (mL)
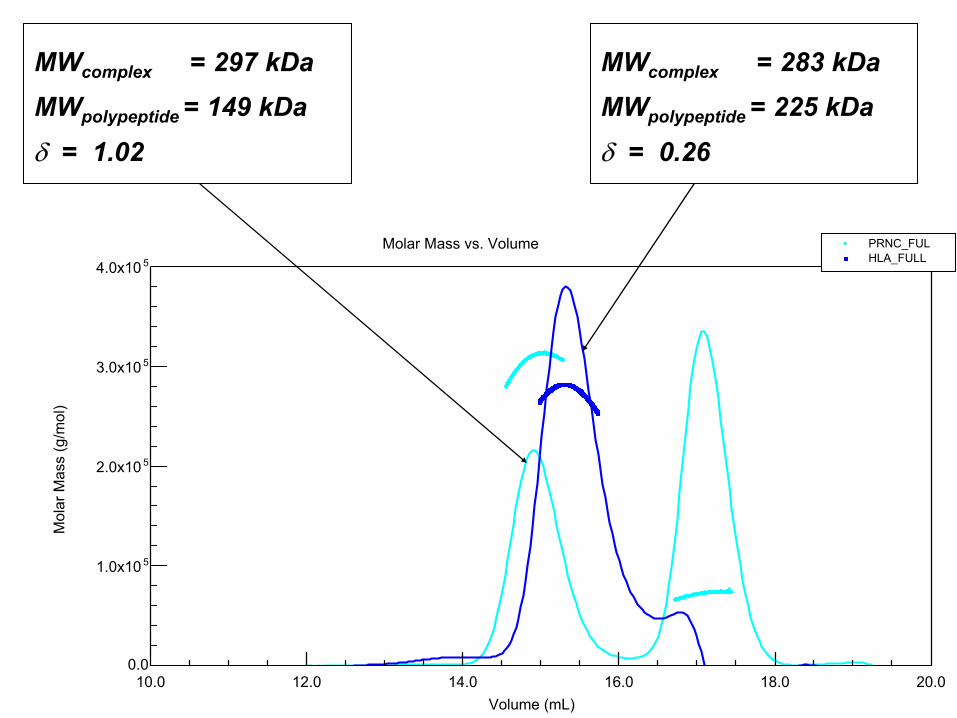
Molar Mass vs. Volume PRNC_FULHLA_FULL
MWcomplex = 297 kDaMWpolypeptide = 149 kDaδ = 1.02
MWcomplex = 283 kDaMWpolypeptide = 225 kDaδ = 0.26

Conclusions
SEC coupled with Static LS/RI/UV
• fast and accurate determination of molecular weight (MW) of macromolecules in solution
• single SEC/LS measurement should be sufficient to estimate a MW with a precession of ± 5%
• SEC/LS suitable for detection and characterization of non-interacting and interacting systems
• SEC/LS/UV/RI analysis can determine oligomeric state of detergent solubilized membrane proteins
Ken WilliamsDirector of HHMI Biopolymer & W.M. Keck Biotechnology Resource Laboratory
NIH
Users of SEC/LS Service
Wyatt Technology