Embed Size (px)
Citation preview
Analysis of price incentives for live cattle in Ethiopia or the time period 2005–2012
February 2015
Analysis of price incentives for live cattle in Ethiopia or the time period 2005–2012
February 2015
This technical note is a product of the Monitoring and Analysing Food and Agricultural Policies (MAFAP) programme. It may be updated as new data becomes available.
MAFAP is implemented by the Food and Agriculture Organization of the United Nations (FAO) in collaboration with the Organisation for Economic Co-operation and Development (OECD) and national partners in participating countries. It is financially supported by the Bill and Melinda Gates Foundation, the United States Agency for International Development (USAID) and FAO.
The analysis presented in this document is the result of partnerships established in the context of the MAFAP programme with The Ethiopian Development Research Institute.
This technical note was prepared by Dr. Tadesse Kuma Worako of the Ethiopian Development Research Institute, with support and contributions from Alban MasAparisi and Barthélemy Lanos of the FAO.
For more information: www.fao.org/in-action/mafap
Recommended citation:
FAO. 2015. Analysis of price incentives for Live Cattle in Ethiopia. Technical notes series, MAFAP, by Kuma, T., Lanos, B. and MasAparisi, A., Rome.
The designations employed and the presentation of material in this information product do not imply the expression of any opinion whatsoever on the part of the Food and Agriculture Organization of the United Nations (FAO) concerning the legal or development status of any country, territory, city or area or of its authorities, or concerning the delimitation of its frontiers or boundaries. The mention of specific companies or products of manufacturers, whether or not these have been patented, does not imply that these have been endorsed or recommended by FAO in preference to others of a similar nature that are not mentioned.
The views expressed in this information product are those of the author(s) and do not necessarily reflect the views or policies of FAO.
© FAO, 2015
FAO encourages the use, reproduction and dissemination of material in this information product. Except where otherwise indicated, material may be copied, downloaded and printed for private study, research and teaching purposes, or for use in non-commercial products or services, provided that appropriate acknowledgement of FAO as the source and copyright holder is given and that FAO’s endorsement of users’ views, products or services is not implied in any way.
All requests for translation and adaptation rights, and for resale and other commercial use rights should be made via www.fao.org/contact-us/licence-request or addressed to [email protected].
FAO information products are available on the FAO website (www.fao.org/publications) and can be purchased through [email protected].

TABLE OF CONTENTS TABLE OF CONTENTS ............................................................................................................................... iv
SUMMARY OF THE NOTE .......................................................................................................................... v
COMMODITY CONTEXT .................................................................................................................... v
DRIVING FACTORS ........................................................................................................................... vi
RECOMMENDATIONS ...................................................................................................................... vi
1. PURPOSE OF THE NOTE ................................................................................................................... 1
2. COMMODITY CONTEXT ................................................................................................................... 2
PRODUCTION ....................................................................................................................................... 2
CONSUMPTION/UTILIZATION ............................................................................................................. 7
MARKETING AND TRADE ..................................................................................................................... 9
DESCRIPTION OF THE VALUE CHAIN ................................................................................................. 16
POLICY DECISIONS AND MEASURES .................................................................................................. 19
3. METHODOLOGY ............................................................................................................................. 22
4. DATA REQUIREMENTS AND CALCULATION OF INDICATORS ........................................................ 27
TRADE STATUS OF THE PRODUCT ..................................................................................................... 27
MARKET PATHWAY ANALYSED .......................................................................................................... 27
BENCHMARK PRICES .......................................................................................................................... 27
DOMESTIC PRICES ............................................................................................................................. 28
EXCHANGE RATES .............................................................................................................................. 29
ACCESS COSTS ................................................................................................................................... 30
BUDGET AND OTHER TRANSFERS ..................................................................................................... 34
QUALITY AND QUANTITY ADJUSTMENTS .......................................................................................... 34
DATA OVERVIEW ............................................................................................................................... 35
SUMMARY OF INDICATORS ............................................................................................................... 37
5. RESULTS AND INTERPRETATION .................................................................................................... 39
6. RECOMMENDATIONS .................................................................................................................... 43
7. CONCLUSION ................................................................................................................................. 45
MAIN MESSAGE ................................................................................................................................. 45
LIMITATIONS ..................................................................................................................................... 45
FURTHER INVESTIGATION AND RESEARCH ....................................................................................... 45
BIBLIOGRAPHY ....................................................................................................................................... 46
ANNEX I: Data and Calculations Used in the Analysis ........................................................................... 48
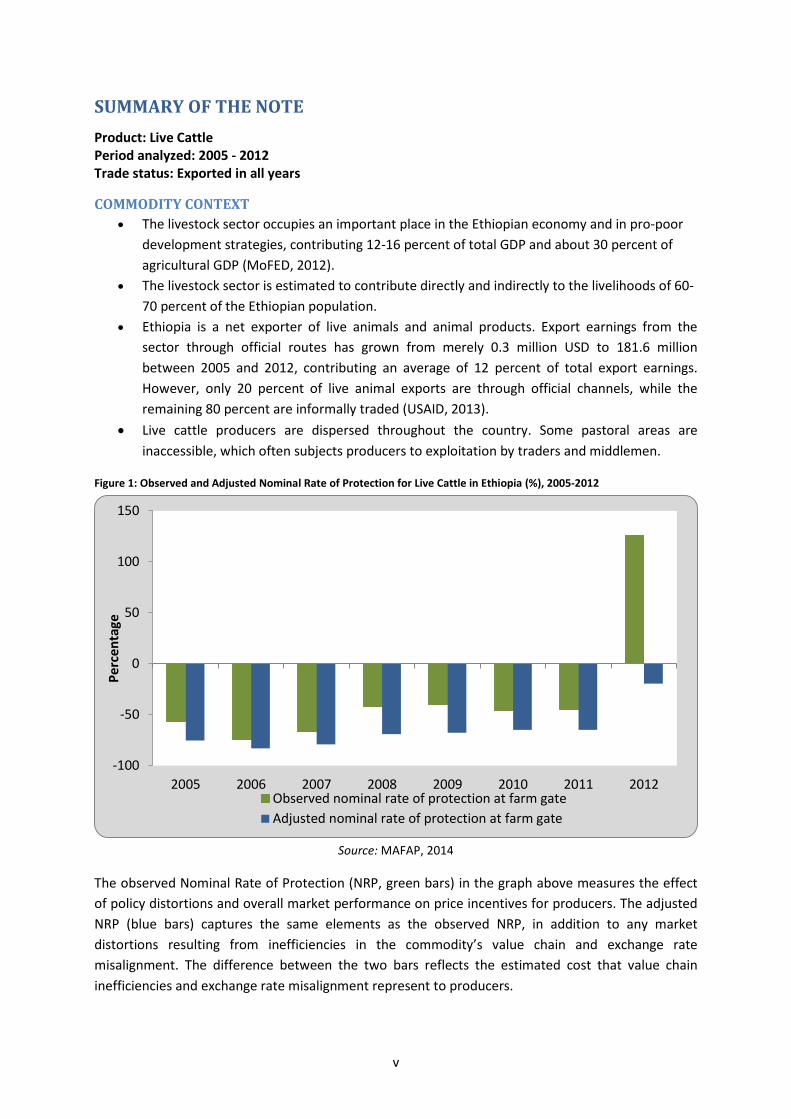
SUMMARY OF THE NOTE Product: Live Cattle Period analyzed: 2005 - 2012 Trade status: Exported in all years
COMMODITY CONTEXT • The livestock sector occupies an important place in the Ethiopian economy and in pro-poor
development strategies, contributing 12-16 percent of total GDP and about 30 percent of agricultural GDP (MoFED, 2012).
• The livestock sector is estimated to contribute directly and indirectly to the livelihoods of 60-70 percent of the Ethiopian population.
• Ethiopia is a net exporter of live animals and animal products. Export earnings from the sector through official routes has grown from merely 0.3 million USD to 181.6 million between 2005 and 2012, contributing an average of 12 percent of total export earnings. However, only 20 percent of live animal exports are through official channels, while the remaining 80 percent are informally traded (USAID, 2013).
• Live cattle producers are dispersed throughout the country. Some pastoral areas are inaccessible, which often subjects producers to exploitation by traders and middlemen.
Figure 1: Observed and Adjusted Nominal Rate of Protection for Live Cattle in Ethiopia (%), 2005-2012
Source: MAFAP, 2014
The observed Nominal Rate of Protection (NRP, green bars) in the graph above measures the effect of policy distortions and overall market performance on price incentives for producers. The adjusted NRP (blue bars) captures the same elements as the observed NRP, in addition to any market distortions resulting from inefficiencies in the commodity’s value chain and exchange rate misalignment. The difference between the two bars reflects the estimated cost that value chain inefficiencies and exchange rate misalignment represent to producers.
-100
-50
0
50
100
150
2005 2006 2007 2008 2009 2010 2011 2012
Perc
enta
ge
Observed nominal rate of protection at farm gateAdjusted nominal rate of protection at farm gate
v

DRIVING FACTORS • Our results show that there are disincentives for wholesalers and producers in the observed
domain for the analysed period. • However, the level of disincentives compared with other commodities in the country is
rather low, meaning that the domestic market is closely linked to the international market (see Technical notes series, MAFAP 2014).
• Disincentives are considerable in the adjusted domain, and they arise from i) an overvalued exchange rate; ii) high feed and transport costs for the feedlot operator; and iii) high margins of traders over producers. This indicates that the future of the sector may not be promising without appropriate policy action.
• The official trade value of live animal export increased from USD 0.3 million in 2005 to USD 186 million in 2012, mainly due to increasing international demand for meat. Despite this promising achievement, the sector faces daunting challenges. There is no systematically recorded data or information system that would be reliable for a sector performance analysis. The cost of feeding is increasing over time, leaving agents faced with disincentives and high economic risks.
RECOMMENDATIONS Policy work could address:
• The increasing cost of feedlots that hinder the competitiveness of the sector. This also implies the need to deal with the cost and availability of foreign currencies, which could lower costs and increase value chain efficiency. Improved transport infrastructure would also mitigate rising access costs.
• Improving the communication between farmers to help them get the right price signal (as the Livestock Information Network Knowledge System).
• Fostering private investment in the animal feed sector. • Improving the quarantine facilities to ensure that sanitary and safety requirements for buying
countries are met, as well as the requirements established by the World Organization for Animal Health. The formalization of the clearance would ease exports by speeding up the procedure.
• Supporting the development of marketing infrastructure, as wholesales for cattle, marketing centres in the production areas and the emergence of strong and various private sector agents (feedlot operators, big traders and exporters) increase competition in the value chain.
• Promoting the development of an identification and tracking system for the origin of the animal, as well as improved quality inspection centres that would redefine the causes of import bans in neighbouring countries and would provide non-negligible branding for Ethiopian cattle, which is already preferred in export markets.
• Supporting the development of a specific value chain within the overall cattle value chain, especially in terms of weight, to satisfy the demand from importing countries (which are requiring different animals in terms of age and weight).
vi
1. PURPOSE OF THE NOTE This technical note is an attempt to measure, analyse and interpret price incentives for Live Cattle in Ethiopia over the period 2005-2012.
For this purpose, yearly averages of domestic farm gate and wholesale prices are compared with reference prices calculated on the basis of the price of the commodity in the international market. The price gaps between reference prices and domestic prices along the commodity’s value chain indicate the extent to which incentives (positive gaps) or disincentives (negative gaps) were present at the farm gate and wholesale level. The price gaps are expressed in relative terms as a percentage of the reference price, referred to as the Nominal Rate of Protection (NRP). These key indicators are used by MAFAP to assess the effects of policy and market performance on prices.
This technical note begins with a review of the commodity’s production, consumption and utilization, marketing and trade, and a description of the agents along the value chain and policy context (Chapter 2). It also provides a detailed description of how key data elements were obtained and indicators were calculated (Chapter 3). The indicators were then interpreted in light of existing policies and market characteristics (Chapter 4), and key policy recommendations were formulated on the basis of this interpretation (Chapter 5). Finally, the note concludes with a few main messages, limitations of the analysis and areas identified for further research to improve the analysis (Chapter 6).
The results and recommendations presented in this analysis of price incentives can be used by stakeholders involved in policy-making for the food and agriculture sector. They can also serve as input for evidence-based policy dialogue at the national, regional or international level.
This technical note should not be interpreted as an in-depth value chain analysis or detailed description of the trade and policy contexts. All information related to these areas is presented merely to provide background on the commodity under review, help understand major trends and facilitate the interpretation of the indicators.
All information in this technical note is subject to review and validation.
1

2. COMMODITY CONTEXT The livestock sector occupies an important place in the Ethiopian economy and pro-poor development strategies. Ethiopia is generally considered to have the largest population of livestock in Africa. There are huge numbers of cattle, sheep, goats, horses, donkeys, mules, camels, poultry and beehives in the country. The livestock sector contributes 12-16 percent to total GDP and about 30 percent to agricultural GDP (MoFED, 2012). The livestock sector is estimated to contribute directly and indirectly to the livelihoods of 60-70 percent of the Ethiopian population. Livestock provides food in the form of meat and milk and non-food items such as draft power, manure and transport services, as well as inputs into food crop production and fuel for cooking in the form of dung.
Cattle are also a source of income through the sale of live animals, hides and skins. In the lowlands, where a pastoral management system is practiced, livestock is the principal source of subsistence, providing milk and cash to cover family expenses for food grains and other essential consumer goods. Cattle offer a particular package of benefits to pastoralists, for whom few alternative livelihoods exist. In addition to direct income benefits, cattle provide indirect benefits, serving as both an investment and insurance against risk and disaster for those beyond the reach of banking institutions, and determine social status within the community (Gebremedihin S., Amare S., Baker D., and Solomon A., 2013).
Livestock plays an important role in improving food security and reducing poverty in Ethiopia. Any shocks that affect livestock will have adverse effects on the overall economy, as well as on household welfare. Conversely, accelerated growth in the livestock sector has the potential to have significant positive effects on overall economic growth and poverty reduction.
Cattle production constitutes the greater part of Ethiopia’s livestock sector. In terms of domestic meat consumption, cattle contribute 65 percent, mutton 19 percent and goat 13 percent (FAOSTAT, 2011).
Although Ethiopia produces and trades live cattle, meat, and other livestock products, this study solely focuses on live cattle production, consumption and trade. According to the CSA, smallholders account for 98 percent of live cattle production and supply in Ethiopia. Hence, the fundamental aim of this analysis is to assess whether smallholder cattle producers receive market price incentives or disincentives and to identify potential inefficiencies along the value chain that could be affecting the overall marketability of live cattle and the level of incentives for producers. Viable markets ideally serve as an engine for the development of livestock production, processing, consumption, and for attracting investment, which are ultimately reflected in greater overall benefits from the livestock resources of the country.
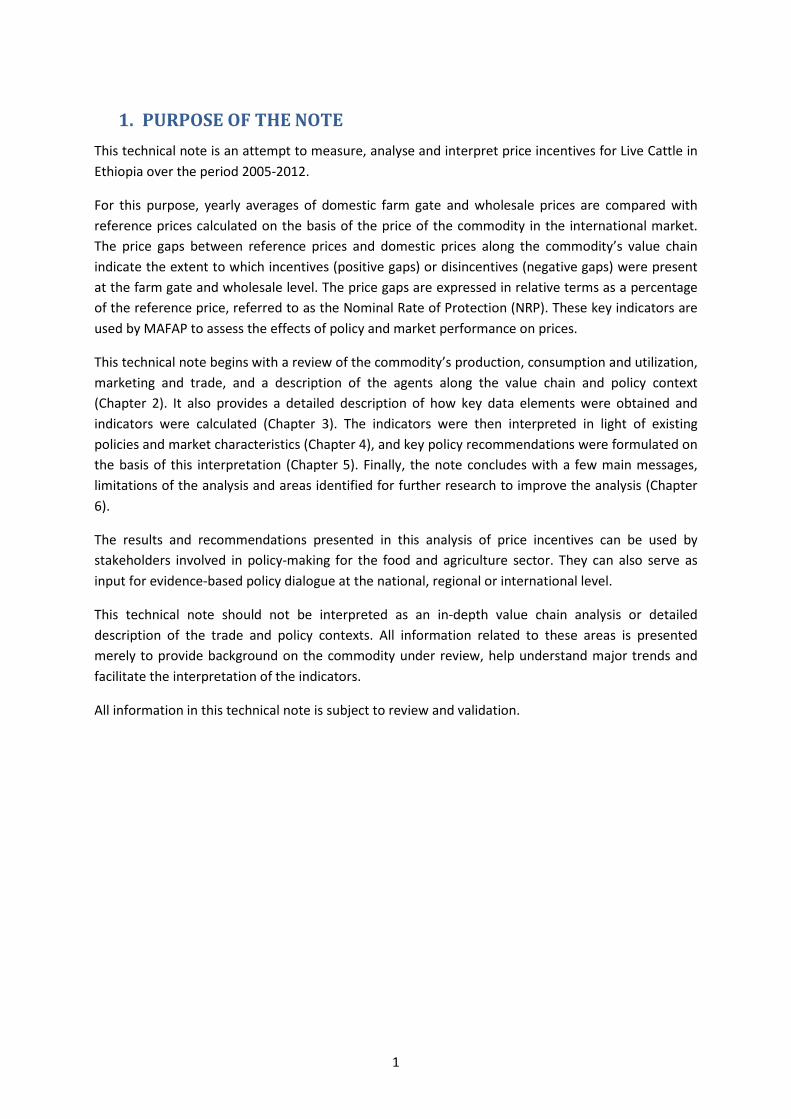
PRODUCTION Cattle production in Ethiopia has long remained a form of subsistence with limited market-orientation. According to national statistics, the livestock population in Ethiopia continues to grow, with the highland regions accounting for the largest share. According to the Agricultural Sample Survey report of the Central Statistical Authority (CSA), between 2003 and 2012, the live cattle population in Ethiopia increased from 38.1 to 54 million heads, a 39.3 percent growth over the entire period with an annual average growth of 4 percent. In the same period, the sheep population increased from 16.6 to 25.5 million (41 percent) and goat stock grew from 13.8 to 24.1 million (61.9
2
percent) with an annual average growth of 6.2 percent. The slow growth rate of cattle production compared to the high off take rate of sheep and goats will remain a concern for the future on how to balance production and utilization. Camels are concentrated in the pastoral regions, and their number grew from 0.5 to 0.9 million heads (Figure 2).
Figure 2: Trends of Livestock Population in Ethiopia (million heads), 2003-2012
Source: CSA (2003-2012)
The livestock production in Ethiopia can be broadly classified into three systems: (i) the highland crop-livestock farming system; (ii) the lowland pastoral and agro-pastoral system; and (iii) the commercial production system. The commercial farms are restricted to the peripheries of major urban centers that have a large demand for meat and milk.
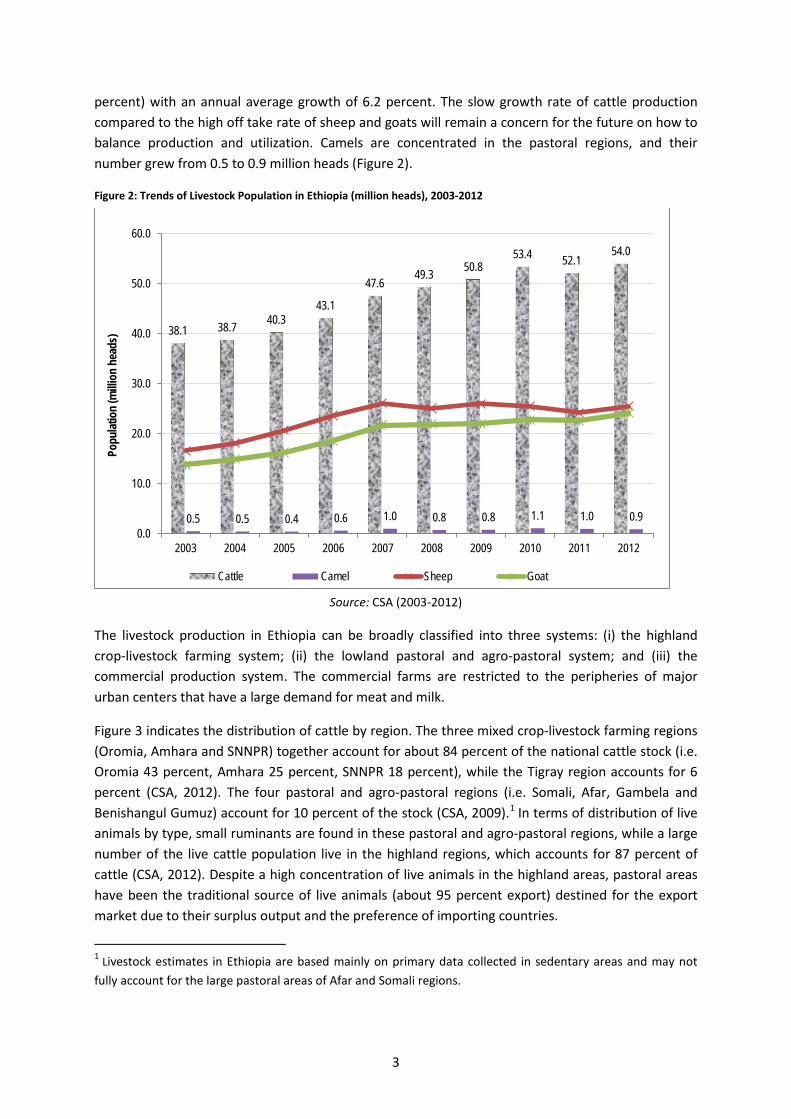
Figure 3 indicates the distribution of cattle by region. The three mixed crop-livestock farming regions (Oromia, Amhara and SNNPR) together account for about 84 percent of the national cattle stock (i.e. Oromia 43 percent, Amhara 25 percent, SNNPR 18 percent), while the Tigray region accounts for 6 percent (CSA, 2012). The four pastoral and agro-pastoral regions (i.e. Somali, Afar, Gambela and Benishangul Gumuz) account for 10 percent of the stock (CSA, 2009).1 In terms of distribution of live animals by type, small ruminants are found in these pastoral and agro-pastoral regions, while a large number of the live cattle population live in the highland regions, which accounts for 87 percent of cattle (CSA, 2012). Despite a high concentration of live animals in the highland areas, pastoral areas have been the traditional source of live animals (about 95 percent export) destined for the export market due to their surplus output and the preference of importing countries.
1 Livestock estimates in Ethiopia are based mainly on primary data collected in sedentary areas and may not fully account for the large pastoral areas of Afar and Somali regions.
38.1 38.7 40.3 43.1
47.6 49.3 50.8
53.4 52.1 54.0
0.5 0.5 0.4 0.6 1.0 0.8 0.8 1.1 1.0 0.9 0.0
10.0
20.0
30.0
40.0
50.0
60.0
2003 2004 2005 2006 2007 2008 2009 2010 2011 2012
Popu
latio
n (m
illion
hea
ds)
Cattle Camel Sheep Goat
3
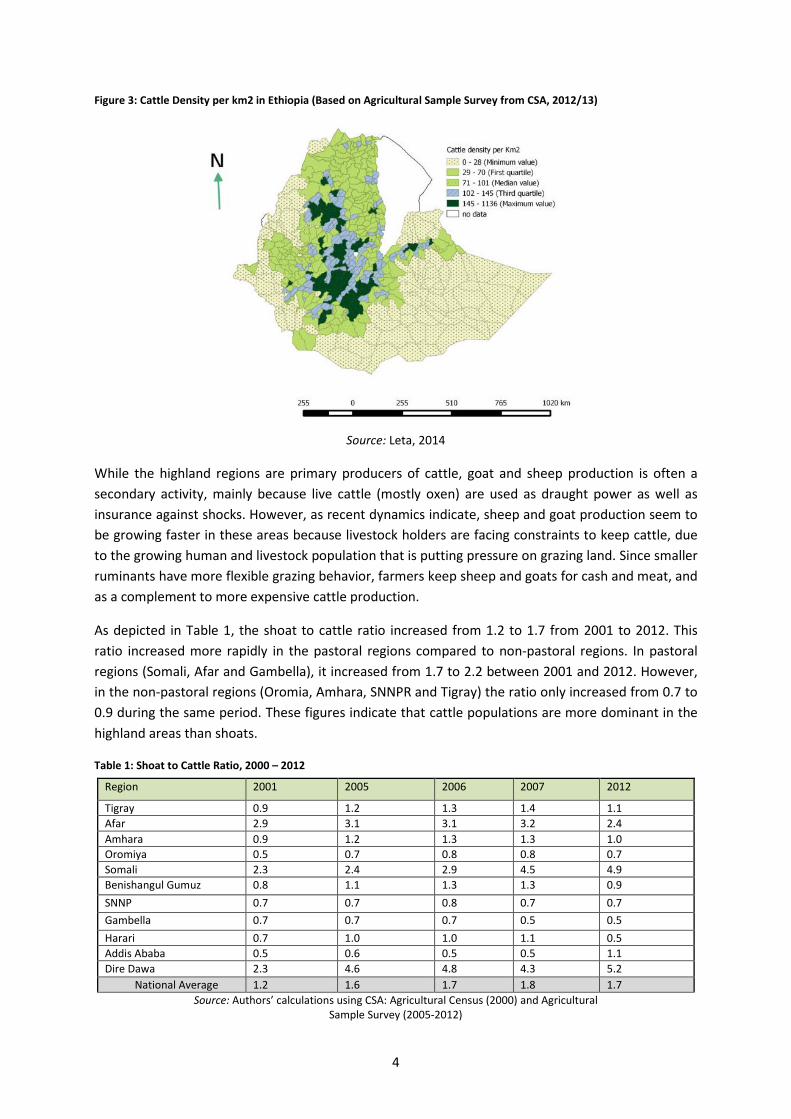
Figure 3: Cattle Density per km2 in Ethiopia (Based on Agricultural Sample Survey from CSA, 2012/13)
Source: Leta, 2014
While the highland regions are primary producers of cattle, goat and sheep production is often a secondary activity, mainly because live cattle (mostly oxen) are used as draught power as well as insurance against shocks. However, as recent dynamics indicate, sheep and goat production seem to be growing faster in these areas because livestock holders are facing constraints to keep cattle, due to the growing human and livestock population that is putting pressure on grazing land. Since smaller ruminants have more flexible grazing behavior, farmers keep sheep and goats for cash and meat, and as a complement to more expensive cattle production.
As depicted in Table 1, the shoat to cattle ratio increased from 1.2 to 1.7 from 2001 to 2012. This ratio increased more rapidly in the pastoral regions compared to non-pastoral regions. In pastoral regions (Somali, Afar and Gambella), it increased from 1.7 to 2.2 between 2001 and 2012. However, in the non-pastoral regions (Oromia, Amhara, SNNPR and Tigray) the ratio only increased from 0.7 to 0.9 during the same period. These figures indicate that cattle populations are more dominant in the highland areas than shoats.
Table 1: Shoat to Cattle Ratio, 2000 – 2012
Region 2001 2005 2006 2007 2012
Tigray 0.9 1.2 1.3 1.4 1.1 Afar 2.9 3.1 3.1 3.2 2.4 Amhara 0.9 1.2 1.3 1.3 1.0 Oromiya 0.5 0.7 0.8 0.8 0.7 Somali 2.3 2.4 2.9 4.5 4.9 Benishangul Gumuz 0.8 1.1 1.3 1.3 0.9 SNNP 0.7 0.7 0.8 0.7 0.7 Gambella 0.7 0.7 0.7 0.5 0.5 Harari 0.7 1.0 1.0 1.1 0.5 Addis Ababa 0.5 0.6 0.5 0.5 1.1 Dire Dawa 2.3 4.6 4.8 4.3 5.2 National Average 1.2 1.6 1.7 1.8 1.7
Source: Authors’ calculations using CSA: Agricultural Census (2000) and Agricultural Sample Survey (2005-2012)
4
The large number of livestock in the highland areas of Ethiopia is due to the availability of crop residues for feed, less disease prevalence, and relatively adequate water supply. However, because there is a high population density of people in the highland areas, the per capita livestock numbers are low. In the less populated lowland areas of the southern SNNP, west Oromiya and Tigray regions, a high livestock per household ratio is observed (Figure 4).
Figure 4: Cattle Population per Household in Ethiopia (head), 2007/08
Source: Helina Tilahun and Emily Schmidt (IFPRI, 2012)
Despite having the largest livestock population in Africa, cattle production in Ethiopia faces considerable challenges and remains as a form of subsistence. The main constraints for cattle development are poor genetics, animal disease prevalence, feed availability and quality, subsistence based animal husbandry, poor market infrastructures, weak institutional arrangements and the seasonality of both the demand and supply of meat (Legese, Teklewold, Alemu and Negassa, 2008).
As data gathered by the CSA (2012) on animal feed practices used by small holders in the rural sedentary areas of the country to assess the feed utilization experience indicates, green fodder (grazing) is the major type of feed (about 57.5 percent), followed by crops residue (29.6 percent). Hay and by-products were also used as animal feed, comprising about 7.1 and 0.9 percent of total feed, respectively. A very small amount of improved (0.22 percent) and other types of feed (4.7 percent) were used (Figure 5).
5

Figure 5: Animal Feed Practices in Ethiopia, 2012
Source: CSA, 2012
Grazing feed sources (green fodder) are mostly communal with strong seasonality in supply due to rainfall patterns and overgrazing. This type of feed exceeds 80 percent of total feed supply in the pastoral regions (i.e. Afar, Somali, Benishangul Gumuz and Gambella), where gazing lands are predominantly owned by the community. In recent years, grazing as a source of livestock feed has declined in these areas as a result of increasing commercial cultivation and changing patterns of land use (i.e. lack of land fallow for regeneration).
According to the Ministry of Agriculture and Rural Development (2008) in its Livestock Development Master Plan2 (LDMP), an estimated 64 million tonnes of annual animal feed, including forage and dry matter, are required annually to sustain the livestock population in Ethiopia. However, the same source estimates that only about 37 million tonnes are currently available, meaning that the system satisfies just 58 percent of the requirement. This gap signifies the extent of the feed challenge for the sector, which may result in even higher feed prices.
This gap between feed demand and supply indicates the high profit margins of the current inputs suppliers and the need for private investments to develop feed production in the country. An efficient feed sector, based on available technologies, could trigger a decrease in current high prices. However, the commercial feed industry is in an infant stage, with only a few feed millers operating around Addis Ababa and slightly to the south. There are about 20 feed millers in the country who mostly produce for their own cattle consumption. Roughly half of the feed produced is sold on the
2 The livestock development master plan study is designed to develop a comprehensive set of strategies to address the major constraints hindering the country’s ability to take advantage of these opportunities and harness the full potential of the sub-sector. The primary objectives include the preparation of a comprehensive livestock development master plan that will cover the dairy, meat, hides and skins, draught power, eggs and apiculture sub sectors for a plan horizon and investment period of twenty years. It was initiated in 2004.
Green fodder(Grazing) 57%
Crop residue 30%
Hay 7%
Improved feed 0%
By products 1%
Others 5%
6
market. Despite the presence of a vibrant grain industry in Ethiopia, cattle feed from whole grains is rarely used in the country, likely due to the lack of any surplus over human consumption. Feed made from flour by-products and oil mills were used by just a few private commercial and public research animal farms (GebreMariam, 2013). Thus, feed is available but price is by far the biggest constraint to cattle sector development.
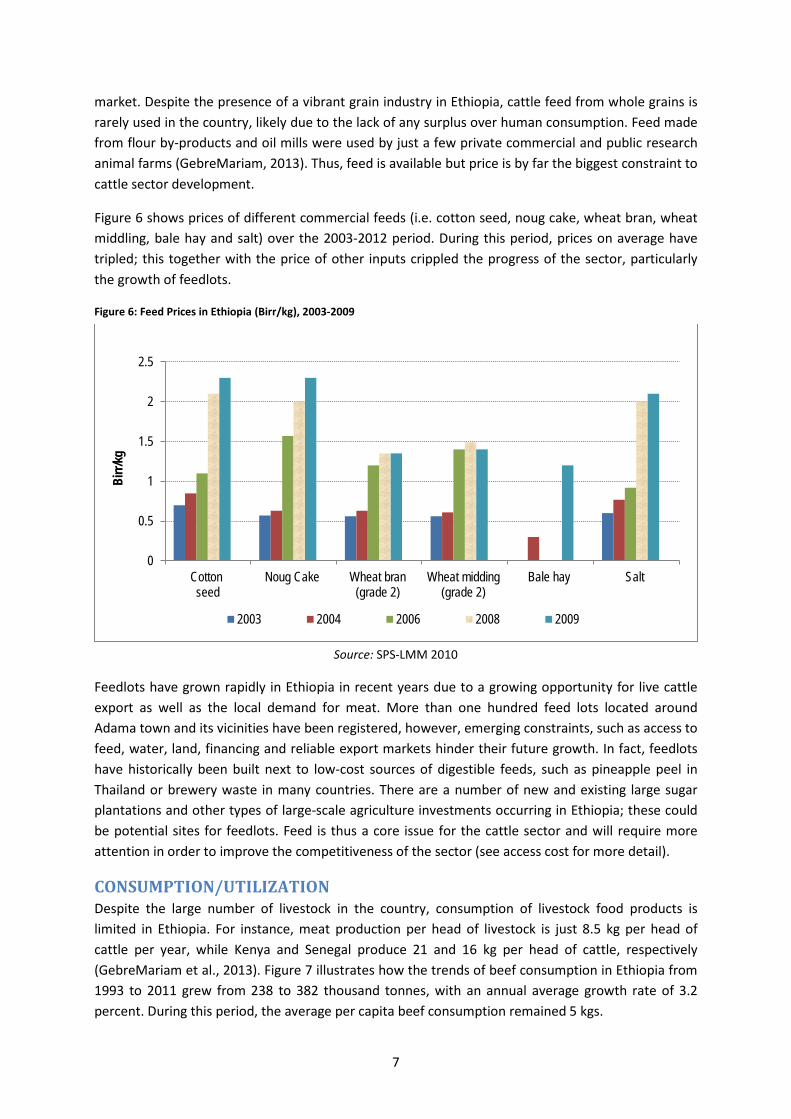
Figure 6 shows prices of different commercial feeds (i.e. cotton seed, noug cake, wheat bran, wheat middling, bale hay and salt) over the 2003-2012 period. During this period, prices on average have tripled; this together with the price of other inputs crippled the progress of the sector, particularly the growth of feedlots.
Figure 6: Feed Prices in Ethiopia (Birr/kg), 2003-2009
Source: SPS-LMM 2010
Feedlots have grown rapidly in Ethiopia in recent years due to a growing opportunity for live cattle export as well as the local demand for meat. More than one hundred feed lots located around Adama town and its vicinities have been registered, however, emerging constraints, such as access to feed, water, land, financing and reliable export markets hinder their future growth. In fact, feedlots have historically been built next to low-cost sources of digestible feeds, such as pineapple peel in Thailand or brewery waste in many countries. There are a number of new and existing large sugar plantations and other types of large-scale agriculture investments occurring in Ethiopia; these could be potential sites for feedlots. Feed is thus a core issue for the cattle sector and will require more attention in order to improve the competitiveness of the sector (see access cost for more detail).
CONSUMPTION/UTILIZATION Despite the large number of livestock in the country, consumption of livestock food products is limited in Ethiopia. For instance, meat production per head of livestock is just 8.5 kg per head of cattle per year, while Kenya and Senegal produce 21 and 16 kg per head of cattle, respectively (GebreMariam et al., 2013). Figure 7 illustrates how the trends of beef consumption in Ethiopia from 1993 to 2011 grew from 238 to 382 thousand tonnes, with an annual average growth rate of 3.2 percent. During this period, the average per capita beef consumption remained 5 kgs.
0
0.5
1
1.5
2
2.5
Cotton seed
Noug Cake Wheat bran(grade 2)
Wheat midding(grade 2)
Bale hay Salt
Birr/
kg
2003 2004 2006 2008 2009
7
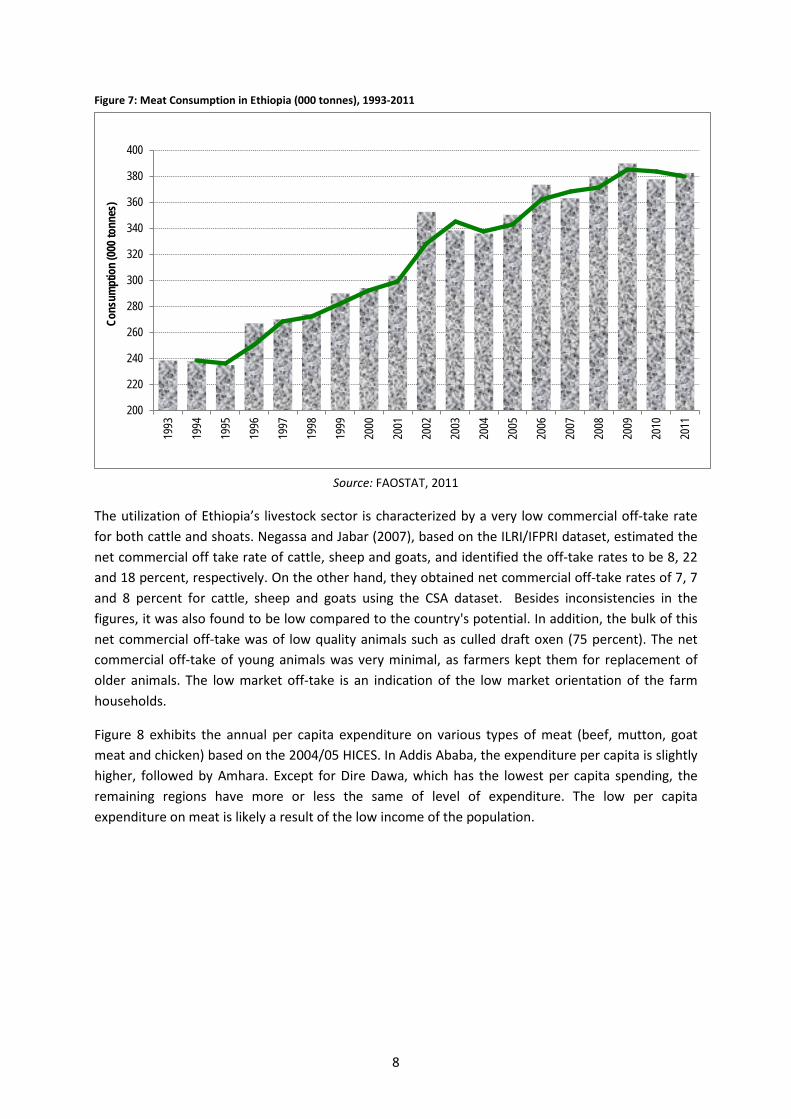
Figure 7: Meat Consumption in Ethiopia (000 tonnes), 1993-2011
Source: FAOSTAT, 2011
The utilization of Ethiopia’s livestock sector is characterized by a very low commercial off-take rate for both cattle and shoats. Negassa and Jabar (2007), based on the ILRI/IFPRI dataset, estimated the net commercial off take rate of cattle, sheep and goats, and identified the off-take rates to be 8, 22 and 18 percent, respectively. On the other hand, they obtained net commercial off-take rates of 7, 7 and 8 percent for cattle, sheep and goats using the CSA dataset. Besides inconsistencies in the figures, it was also found to be low compared to the country's potential. In addition, the bulk of this net commercial off-take was of low quality animals such as culled draft oxen (75 percent). The net commercial off-take of young animals was very minimal, as farmers kept them for replacement of older animals. The low market off-take is an indication of the low market orientation of the farm households.
Figure 8 exhibits the annual per capita expenditure on various types of meat (beef, mutton, goat meat and chicken) based on the 2004/05 HICES. In Addis Ababa, the expenditure per capita is slightly higher, followed by Amhara. Except for Dire Dawa, which has the lowest per capita spending, the remaining regions have more or less the same of level of expenditure. The low per capita expenditure on meat is likely a result of the low income of the population.
200
220
240
260
280
300
320
340
360
380
40019
93
1994
1995
1996
1997
1998
1999
2000
2001
2002
2003
2004
2005
2006
2007
2008
2009
2010
2011
Cons
umpt
ion (
000 t
onne
s)
8
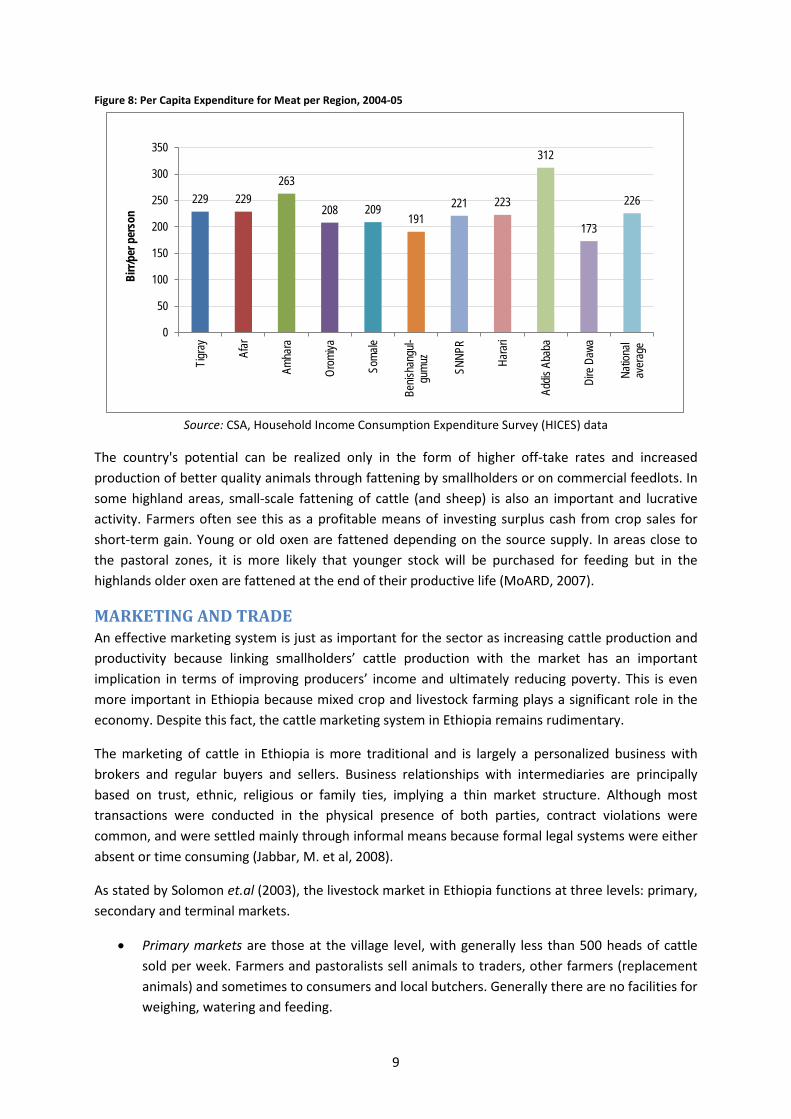
Figure 8: Per Capita Expenditure for Meat per Region, 2004-05
Source: CSA, Household Income Consumption Expenditure Survey (HICES) data
The country's potential can be realized only in the form of higher off-take rates and increased production of better quality animals through fattening by smallholders or on commercial feedlots. In some highland areas, small-scale fattening of cattle (and sheep) is also an important and lucrative activity. Farmers often see this as a profitable means of investing surplus cash from crop sales for short-term gain. Young or old oxen are fattened depending on the source supply. In areas close to the pastoral zones, it is more likely that younger stock will be purchased for feeding but in the highlands older oxen are fattened at the end of their productive life (MoARD, 2007).
MARKETING AND TRADE An effective marketing system is just as important for the sector as increasing cattle production and productivity because linking smallholders’ cattle production with the market has an important implication in terms of improving producers’ income and ultimately reducing poverty. This is even more important in Ethiopia because mixed crop and livestock farming plays a significant role in the economy. Despite this fact, the cattle marketing system in Ethiopia remains rudimentary.
The marketing of cattle in Ethiopia is more traditional and is largely a personalized business with brokers and regular buyers and sellers. Business relationships with intermediaries are principally based on trust, ethnic, religious or family ties, implying a thin market structure. Although most transactions were conducted in the physical presence of both parties, contract violations were common, and were settled mainly through informal means because formal legal systems were either absent or time consuming (Jabbar, M. et al, 2008).
As stated by Solomon et.al (2003), the livestock market in Ethiopia functions at three levels: primary, secondary and terminal markets.
• Primary markets are those at the village level, with generally less than 500 heads of cattle sold per week. Farmers and pastoralists sell animals to traders, other farmers (replacement animals) and sometimes to consumers and local butchers. Generally there are no facilities for weighing, watering and feeding.
229 229 263
208 209 191
221 223
312
173
226
0
50
100
150
200
250
300
350
Tigra
y
Afar
Amha
ra
Orom
iya
Soma
le
Benis
hang
ul-gu
muz
SNNP
R
Hara
ri
Addis
Aba
ba
Dire
Daw
a
Natio
nal
aver
age
Birr/
per p
erso
n
9
• Secondary markets are located mainly in regional capitals and are dominated by middlemen,
traders and butchers with a turnover of 500-1 000 animals per week, consisting of finished, breeding and draught stocks. Secondary markets serve the local butchers and feed the terminal markets.
• Terminal markets are those located in large urban centers. Medium to large-scale traders dominate these markets. The marketing of sheep and goats follows a similar pattern, except that more animals are sold through informal markets, especially in the urban areas.
Supply of cattle to the primary, secondary and terminal markets is mostly done through trekking. It is exceedingly costly for producers to move their livestock for long distances and entails the risk of losing weight and value. Besides, access to modern transport services, like trucks, is either highly expensive or the service may not be available for farmers. Hence, producers are more or less limited to selling at their closest market for the prevailing price in primary market centers. The primary producers’ decision to sell animals (both farmers and pastoralists) is usually based on urgent cash needs, i.e. not commercially oriented. Producers come to the markets with limited information on the going price of the day beforehand, and farmers may take back their animal(s) if the price offered is too low to try their luck next time. Pastoralists take the same measure if the market happens to be close to where they graze their animals but if the market is of some considerable distance from where they reside, then they will be persuaded to sell their animals, even if the price is low on the day, as they can’t afford to return empty handed without buying grain and other necessities for their families. Profit becomes a motive for sale only at the farmer-trader level and above (Solomon et.al, 2003). In general, the cattle marketing system in Ethiopia is characterized by poor infrastructure, lack of information, high marketing costs, weak producer bargaining power, and high risk levels.
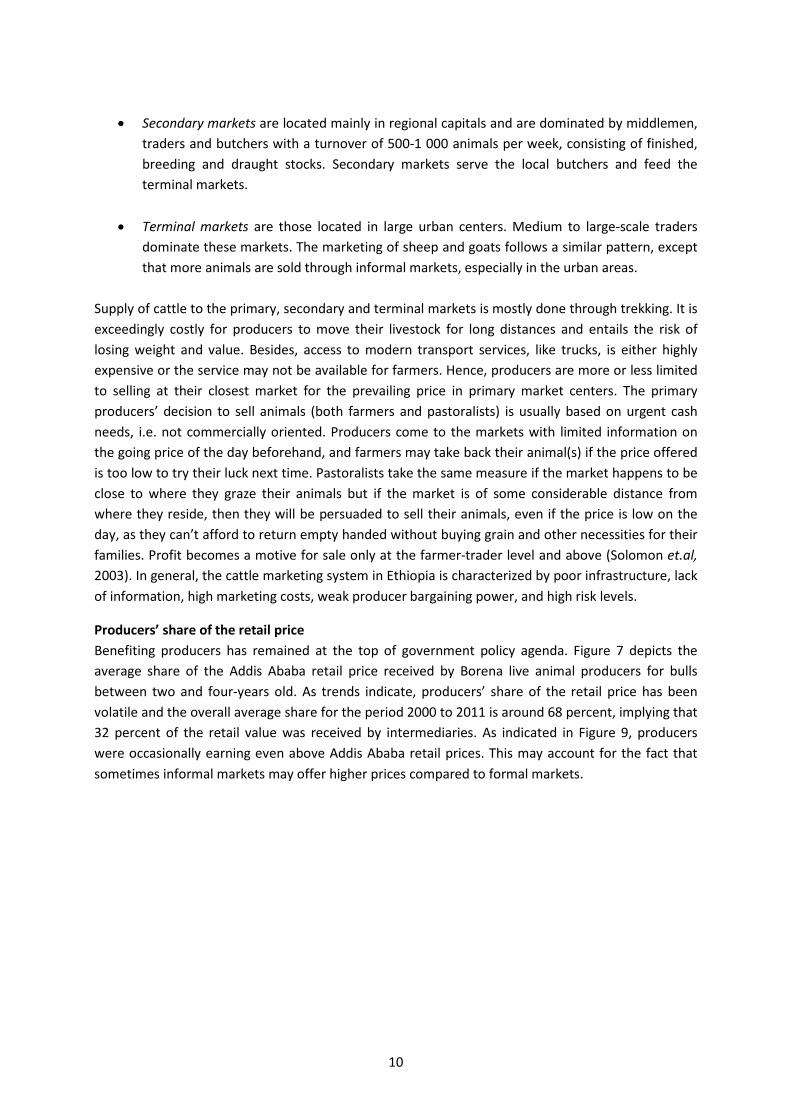
Producers’ share of the retail price Benefiting producers has remained at the top of government policy agenda. Figure 7 depicts the average share of the Addis Ababa retail price received by Borena live animal producers for bulls between two and four-years old. As trends indicate, producers’ share of the retail price has been volatile and the overall average share for the period 2000 to 2011 is around 68 percent, implying that 32 percent of the retail value was received by intermediaries. As indicated in Figure 9, producers were occasionally earning even above Addis Ababa retail prices. This may account for the fact that sometimes informal markets may offer higher prices compared to formal markets.
10
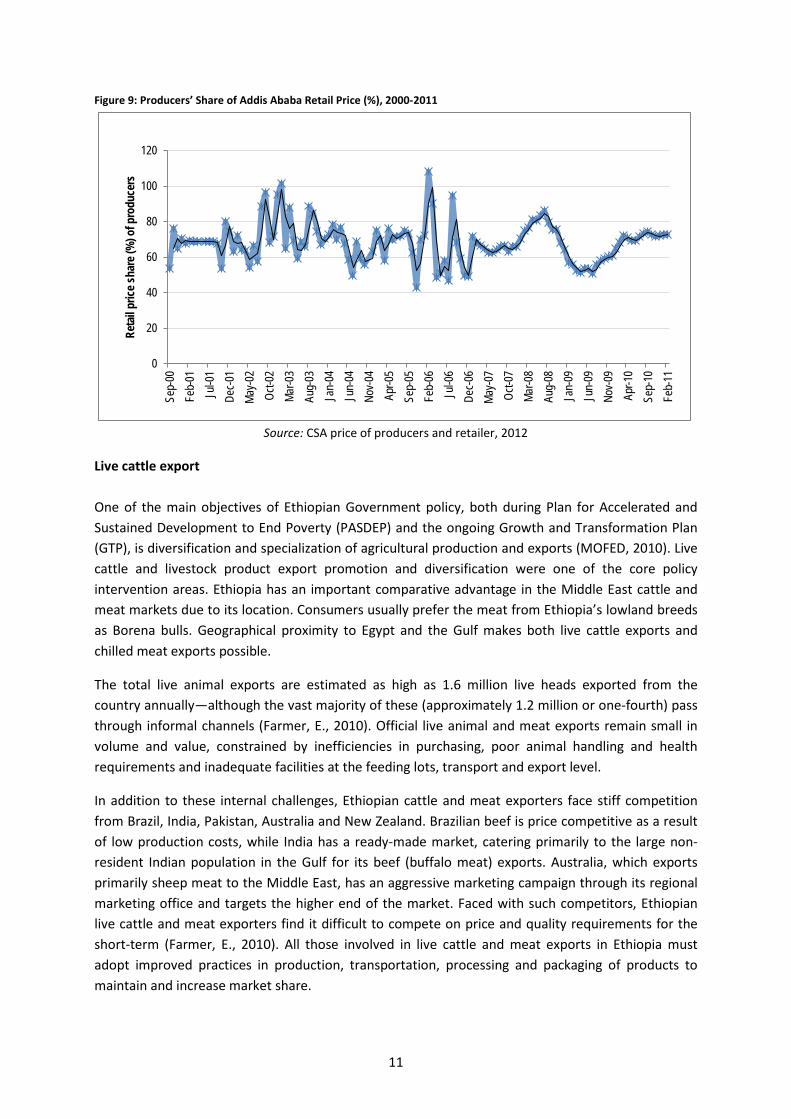
Figure 9: Producers’ Share of Addis Ababa Retail Price (%), 2000-2011
Source: CSA price of producers and retailer, 2012
Live cattle export One of the main objectives of Ethiopian Government policy, both during Plan for Accelerated and Sustained Development to End Poverty (PASDEP) and the ongoing Growth and Transformation Plan (GTP), is diversification and specialization of agricultural production and exports (MOFED, 2010). Live cattle and livestock product export promotion and diversification were one of the core policy intervention areas. Ethiopia has an important comparative advantage in the Middle East cattle and meat markets due to its location. Consumers usually prefer the meat from Ethiopia’s lowland breeds as Borena bulls. Geographical proximity to Egypt and the Gulf makes both live cattle exports and chilled meat exports possible.
The total live animal exports are estimated as high as 1.6 million live heads exported from the country annually—although the vast majority of these (approximately 1.2 million or one-fourth) pass through informal channels (Farmer, E., 2010). Official live animal and meat exports remain small in volume and value, constrained by inefficiencies in purchasing, poor animal handling and health requirements and inadequate facilities at the feeding lots, transport and export level.
In addition to these internal challenges, Ethiopian cattle and meat exporters face stiff competition from Brazil, India, Pakistan, Australia and New Zealand. Brazilian beef is price competitive as a result of low production costs, while India has a ready-made market, catering primarily to the large non-resident Indian population in the Gulf for its beef (buffalo meat) exports. Australia, which exports primarily sheep meat to the Middle East, has an aggressive marketing campaign through its regional marketing office and targets the higher end of the market. Faced with such competitors, Ethiopian live cattle and meat exporters find it difficult to compete on price and quality requirements for the short-term (Farmer, E., 2010). All those involved in live cattle and meat exports in Ethiopia must adopt improved practices in production, transportation, processing and packaging of products to maintain and increase market share.
0
20
40
60
80
100
120Se
p-00
Feb-
01Ju
l-01
Dec-0
1Ma
y-02
Oct-0
2Ma
r-03
Aug-
03Ja
n-04
Jun-
04No
v-04
Apr-0
5Se
p-05
Feb-
06Ju
l-06
Dec-0
6Ma
y-07
Oct-0
7Ma
r-08
Aug-
08Ja
n-09
Jun-
09No
v-09
Apr-1
0Se
p-10
Feb-
11
Reta
il pric
e sha
re (%
) of p
rodu
cers
11
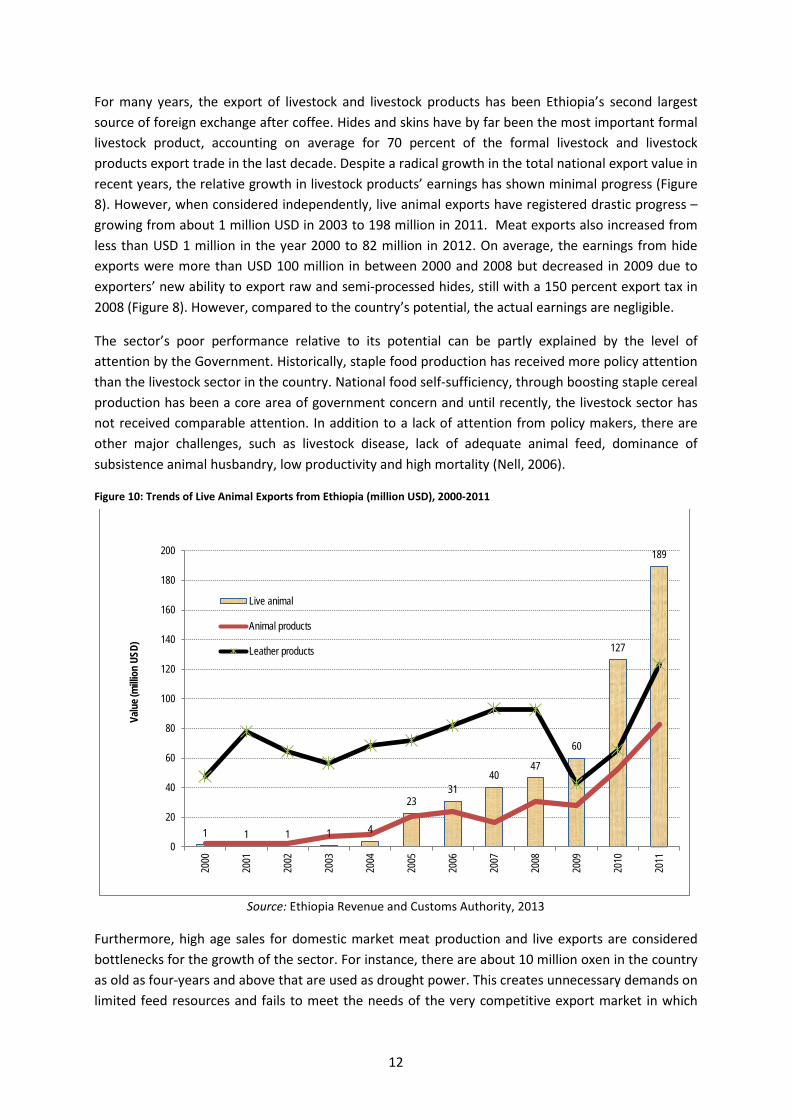
For many years, the export of livestock and livestock products has been Ethiopia’s second largest source of foreign exchange after coffee. Hides and skins have by far been the most important formal livestock product, accounting on average for 70 percent of the formal livestock and livestock products export trade in the last decade. Despite a radical growth in the total national export value in recent years, the relative growth in livestock products’ earnings has shown minimal progress (Figure 8). However, when considered independently, live animal exports have registered drastic progress – growing from about 1 million USD in 2003 to 198 million in 2011. Meat exports also increased from less than USD 1 million in the year 2000 to 82 million in 2012. On average, the earnings from hide exports were more than USD 100 million in between 2000 and 2008 but decreased in 2009 due to exporters’ new ability to export raw and semi-processed hides, still with a 150 percent export tax in 2008 (Figure 8). However, compared to the country’s potential, the actual earnings are negligible.
The sector’s poor performance relative to its potential can be partly explained by the level of attention by the Government. Historically, staple food production has received more policy attention than the livestock sector in the country. National food self-sufficiency, through boosting staple cereal production has been a core area of government concern and until recently, the livestock sector has not received comparable attention. In addition to a lack of attention from policy makers, there are other major challenges, such as livestock disease, lack of adequate animal feed, dominance of subsistence animal husbandry, low productivity and high mortality (Nell, 2006).
Figure 10: Trends of Live Animal Exports from Ethiopia (million USD), 2000-2011
Source: Ethiopia Revenue and Customs Authority, 2013
Furthermore, high age sales for domestic market meat production and live exports are considered bottlenecks for the growth of the sector. For instance, there are about 10 million oxen in the country as old as four-years and above that are used as drought power. This creates unnecessary demands on limited feed resources and fails to meet the needs of the very competitive export market in which
1 1 1 1 4
23 31
40 47
60
127
189
0
20
40
60
80
100
120
140
160
180
200
2000
2001
2002
2003
2004
2005
2006
2007
2008
2009
2010
2011
Valu
e (m
illion
USD
)
Live animal
Animal products
Leather products
12
younger animals are becoming more desirable. The current initiative by the government to expand live animal and meat exports may have considerable implications for improving fertility, reducing mortality and lowering the age at sale.
Live cattle export
Exporting live animals takes both formal and informal export routes. As some estimates indicate, between 80 and 90 percent of live animal exports are informal exports (USAID, 2013).
Formal live animal export
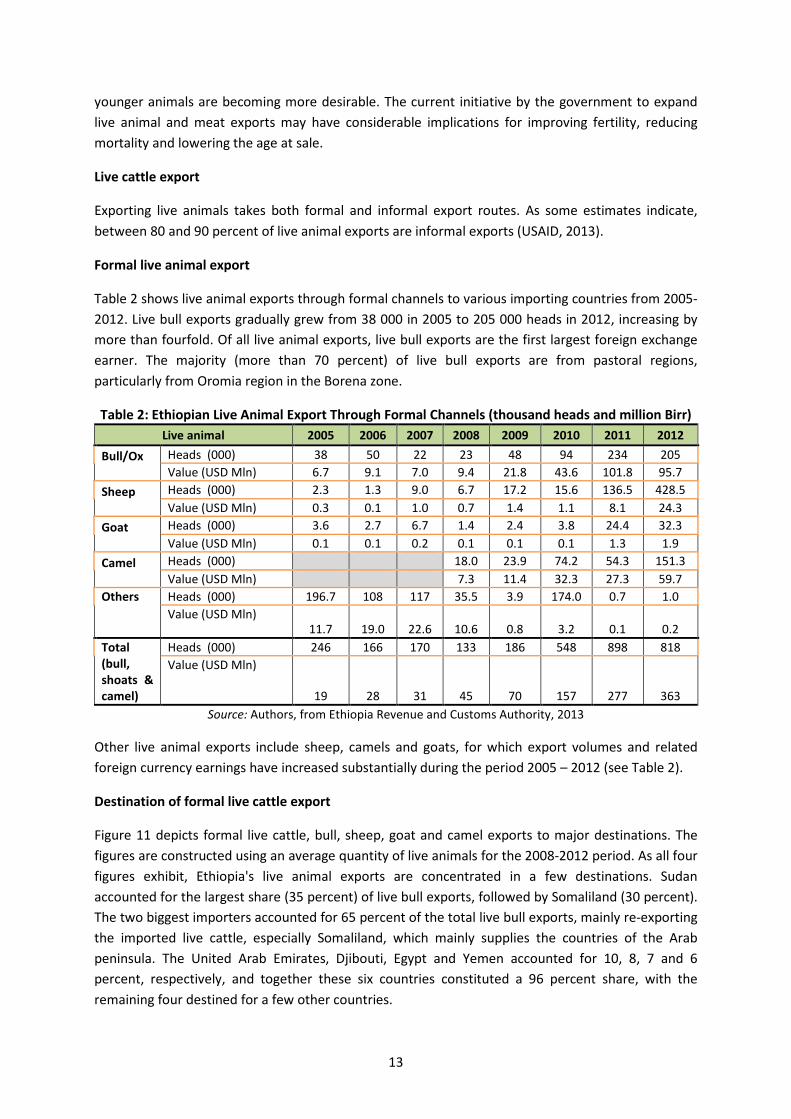
Table 2 shows live animal exports through formal channels to various importing countries from 2005-2012. Live bull exports gradually grew from 38 000 in 2005 to 205 000 heads in 2012, increasing by more than fourfold. Of all live animal exports, live bull exports are the first largest foreign exchange earner. The majority (more than 70 percent) of live bull exports are from pastoral regions, particularly from Oromia region in the Borena zone.
Table 2: Ethiopian Live Animal Export Through Formal Channels (thousand heads and million Birr) Live animal 2005 2006 2007 2008 2009 2010 2011 2012
Bull/Ox
Heads (000) 38 50 22 23 48 94 234 205 Value (USD Mln) 6.7 9.1 7.0 9.4 21.8 43.6 101.8 95.7
Sheep
Heads (000) 2.3 1.3 9.0 6.7 17.2 15.6 136.5 428.5 Value (USD Mln) 0.3 0.1 1.0 0.7 1.4 1.1 8.1 24.3
Goat
Heads (000) 3.6 2.7 6.7 1.4 2.4 3.8 24.4 32.3 Value (USD Mln) 0.1 0.1 0.2 0.1 0.1 0.1 1.3 1.9
Camel
Heads (000) 18.0 23.9 74.2 54.3 151.3 Value (USD Mln) 7.3 11.4 32.3 27.3 59.7
Others
Heads (000) 196.7 108 117 35.5 3.9 174.0 0.7 1.0 Value (USD Mln)
11.7 19.0 22.6 10.6 0.8 3.2 0.1 0.2 Total (bull, shoats & camel)
Heads (000) 246 166 170 133 186 548 898 818 Value (USD Mln)
19 28 31 45 70 157 277 363 Source: Authors, from Ethiopia Revenue and Customs Authority, 2013
Other live animal exports include sheep, camels and goats, for which export volumes and related foreign currency earnings have increased substantially during the period 2005 – 2012 (see Table 2).
Destination of formal live cattle export
Figure 11 depicts formal live cattle, bull, sheep, goat and camel exports to major destinations. The figures are constructed using an average quantity of live animals for the 2008-2012 period. As all four figures exhibit, Ethiopia's live animal exports are concentrated in a few destinations. Sudan accounted for the largest share (35 percent) of live bull exports, followed by Somaliland (30 percent). The two biggest importers accounted for 65 percent of the total live bull exports, mainly re-exporting the imported live cattle, especially Somaliland, which mainly supplies the countries of the Arab peninsula. The United Arab Emirates, Djibouti, Egypt and Yemen accounted for 10, 8, 7 and 6 percent, respectively, and together these six countries constituted a 96 percent share, with the remaining four destined for a few other countries.
13

Besides the limited amount of countries importing massively Ethiopian bulls, live animal exports are subject to periodic interruptions from bans imposed by importing countries due to disease outbreaks. Live animal imports from Middle Eastern countries were banned by Ethiopia for a total of seven times during the last three decades. Such bans are widely perceived as being driven by health related concerns.
Figure 11: Share of Importing Countries for Live Exports of Oxen, Sheep, Goats and Camels from Ethiopia
Source: Ethiopia Revenue and Customs Authority, 2013 Informal livestock trade
Beyond formal sector trade, there is significant informal cross-border trade of live animals, which substantially increases the importance of cattle exports. Although the statistics on the volume of informal livestock trade is shaky, estimates of informal trade volume are indicated below in Table 3 by several different researchers.
Table 3: Estimates of Informal Live Cattle Exports from Ethiopia Over Different Periods Source of data Reference
period Cattle (head)
Ministry of Foreign Trade 1987 1985/86 260,000 FAO 1993 1987/88 150,000 World Bank 1987 1987 225,000 MEDaC 1988 1998 260000 Belachew and Gemberu 2002
2001 325000 GebreMariam, Amare, Baker & Solomon, 2010 2010 375,000
The informal trade routes are more or less similar to the formal ones. Informal cross-border trade is practiced in the eastern, western, southern and northwestern borderlands of Ethiopia. According to Little (1996), cross-border trade in Ethiopia could be categorized into five zones: (i) eastern
Djibouti 8% Egypt
7%
Somali Land 30%
Sudan 35%
United Arab Emirates
10% Yemen
6%
Others 4%
I - Live ox export by destination (%)
14

Ethiopian/Somaliland, (ii) southeastern Ethiopia/northeastern Kenya, (iii) eastern Ethiopian/Somali region, (iv) Ethiopia/Djibouti cross-border trade and (v) western Ethiopia/Sudan.
• Eastern Ethiopian/Somaliland cross-border cattle trade accounts for the largest share among the four borders in terms of the volume and value of exports from Ethiopia. The port of Berbera is the main outlet for livestock exports. The majority of animals are exported mainly to Saudi Arabia via Somaliland.
• The second largest cross-border cattle trade is the southeastern Ethiopia/northeastern
Kenya. The southwestern Somalia market is extremely complex because it is located at the junction of the borders of Kenya, Ethiopia and Somalia, at the border town of Mendera (Little 1996). The main animals exported in this market are cattle, which are destined to the large urban markets in Kenya, including Nairobi. A study by Addis Ababa’s Chamber of Commerce (2008) pointed out that about 30 percent of Kenyan demand for meat was covered by informal imports from Ethiopia. Over the period 2004-2009, Pavanello (2010) revealed that there was a steady flow of castrated bulls from Moyale Ethiopia to Moyale Kenya. The average number of castrated bulls that crossed the Ethiopian border daily was estimated to be 250, 150, 400, 450, 200 and 450 in the years 2004, 2005, 2006, 2007, 2008 and 2009, respectively.
• The third most important cross-border trade route goes from the eastern Ethiopian/Somali
region, originating from Gode and Warder Zones, to central Somalia. This market route connects to the interior city of Mogadishu.
• The Ethiopia/Djibouti cross-border trade starts from Dire Dawa and ends in Djibouti. Most of the cattle traded in this route are sold in Djibouti for domestic consumption. Despite its meagre cattle population, Djibouti owns quarantine centers where large numbers of live animals are kept before being exported to the Middle East (in order to be re-certified as Djibouti origin).
• The fifth informal live animal export route is the Ethio-Sudan route, on which a considerable number of live animals flow to Sudan. A study by Mulugeta et al. (2007) estimated that about 60 thousand live animals, or 15 million USD in value, were informally exported to Sudan in 2007. As recent anecdotal evidence indicates, formal livestock trade through Metema is booming.
Reported factors contributing to large volumes of informal livestock trade and exports include: procedures required to formally export, including export licenses, quarantine, banking clearance for remitting foreign exchange, minimum weight restrictions and informal minimum price requirements. Some of the key reasons that traders opt for informal trade are (i) better prices and more reliable markets across the border; (ii) poor linkage with the domestic formal market (featuring high transportation and transaction costs); (iii) consumer goods (food, clothes and electronics) that can be traded for livestock and are readily available from across borders; (iv) bans on formal Ethiopian livestock and meat exports; and (v) financial and non-financial advantages to informality, including taxation evasion and black market foreign exchange rates.
15
DESCRIPTION OF THE VALUE CHAIN The live animal value chain engages millions of producers, traders, consumers, exporters and service providers. The core agents in the chain and their roles are discussed below.
Producers: Cattle producers in Ethiopia are categorized as pastoralists, agro-pastoralists and mixed crop-livestock farmers. In the highland area, all of them are more or less subsistence oriented but nevertheless account for 98 percent of total production and supply. Very few commercial cattle farms have emerged in the recent years, which tend to be concentrated around main town centers and contribute a negligible share to national production. Many producers are located in remote rural areas, where marketing information is very scarce. There has been an attempt by government and development partners to organize producers, especially in pastoral regions, through the establishment of livestock marketing cooperatives; this structure remains weak.
Collectors: These are important market agents playing a decisive role in collecting animals from their locality. Collectors travel to remote and inaccessible pastoral areas to collect animals in temporary pastoralist residences or central watering points where they can reach a large number of producers. They usually supply to big and small-scale traders and sometimes to livestock trading cooperatives. In most cases, these actors are independent operators who use their local knowledge and social relationships to collect animals from their surrounding and other remote areas. They may receive orders from bigger traders if there is a relationship of trust between them. Once the desired or available quantity of animals has been collected, the collectors deliver the animals to their buyers. They may distort market information according to the interest of their source or for their own benefit (Legesse et al, 2008).
Small-scale petty traders in the highland areas are synonymous with collectors in the pastoral areas. These traders operate at a local level, moving animals from village markets to larger markets in the same district, region, larger markets in other regions or even across international borders. They buy thin animals at a low cost in remote markets and then afterwards add value through supplementary feeding, selling them at a profit in more accessible markets. They usually have financial constraints that limit their scale of operation, yet based on trust, some petty traders are given cash advances from their buyers to fund their activities (Legesse et al, 2008).
Feedlot operators: As part of Sanitary and Phyto-Sanitary (SPS) requirements and according to the rules and regulations of animal quarantine, fattening is done after cattle receive the necessary vaccines and medication. According to one key feedlot informant, upon arrival to a feedlot, animals are vaccinated for the subsequent three weeks. Animals that are four-years and above of highland origin are fattened for the domestic market (slaughterhouses), while young bulls (two to four-years old) usually of lowland origin are kept for the export market. Live bulls stay in the feedlots for an average of 70 days, depending on their initial condition. All bulls meant for export are required to meet at least the minimum weight standard of 350 kg for export. However, feedlots often buy cattle less than 200 kg from Borena or Bale and keep them at the feeding lot until they meet the minimum requirements.
The Adama Livestock Quarantine Center is a federal institution operating under the supervision of the Ministry of Agriculture (MOA). It is mandated to undertake all the regulatory activities related to cattle trade and feedlot operations. More precisely, the center is responsible for: (i) sending a professional to feedlots to tag and vaccinate animals destined for the export market. Feedlot
16

operators must report each new group of animals received if the animals are intended for the export market; (ii) intensive veterinary treatment services to control internal and external parasitic infections; (iii) administering six types of vaccines to protect animals from contagious infectious diseases; (iv) undertaking the necessary regulatory measures pertinent to livestock movement and feedlot operations; and (v) ensuring the health state of the animals, providing certificates to cattle exporters. In addition to the Adama Livestock Quarantine Center, under the auspices of the Ministry of Agriculture, there are four quarantine centers in Metema, Humera, Jijiga and Benshangel Gumez. Moreover, another livestock quarantine center is under construction at Millie to raise export animals that meet international quality and health standards of inspection and efficiency.
Big traders are those permanently operating in the live cattle and meat value chain, known for purchasing large numbers of animals from different sources in order to supply their customers. There are only a few big traders operating in a specific area and each have a permanent buyer (abattoirs and/or live animal exporters). These traders usually have relatively fixed and agreed market shares to reduce competition. Based on a relationship of trust, big traders will use their own capital to extend credit to several smaller agents in order to collect livestock from primary markets and villages. A commission is paid to their collectors based on an agreement at the beginning of the market day or when money is lent. Big traders are also responsible for transporting animals to abattoirs depending on the agreement.
Big traders also face several risks: cattle mortality, weight loss during transportation and theft, to name a few. At times when the abattoirs postpone their purchase orders, these traders may keep the animals for over a week, having to bear additional costs. Most big traders are indigenous to the area they operate and have been in the business so long that they tend to control the market in their respective areas of operation (Legesse et al, 2008).3
Medium/small traders: They are large in number relative to big traders but their purchases are much smaller. Since they buy fewer animals at a time, they have a limited number of collectors at the primary markets. Medium traders have smaller operating capital and as a result, will collect animals on a weekly or biweekly basis and transport them directly to abattoirs using rented vehicles. In some other places, like Borena, these traders used the abattoirs’ collection point as selling outlets. They also serve as suppliers to the big traders in the secondary and terminal markets. Medium/small-scale traders do not have a permanent trade relationship with specific abattoirs.
Cooperatives: Livestock trading cooperatives are organized in pastoralist and semi-pastoralist areas based on the good will of their resident members. They work using operating capital obtained from member contributions. As a result, they usually try to deny other traders entry into primary markets where they are operating. Livestock trading cooperatives mostly operate in the shoats market owing to the low financial requirement relative to cattle and camels. They buy animals from their area (from both members and non-members) using spring balances and sell them to big traders or abattoir purchasers at purchasing stations. However, their operations are constrained by financial shortage, lack of market information and poor transport facilities, among others.
3According to Legesse et al., (2008), such traders in Bale area mostly collect animals (especially shoats) from their operation areas and communicate with abattoirs for transportation to the facility. They use the vehicles of their customers to transport shoats to Modjo. Those operating in Borena area hand over animals to purchasers of abattoirs working at respective purchase points in their area.
17
Brokers are market agents that serve as mediators between buyers and sellers in the livestock market. They usually link buyers with sellers, moderating negotiations and facilitating the terms of exchange. As evidence indicates, brokers are active in almost all levels of livestock markets. Buyers, as well as sellers, pay a broker fee (ETB 10/head of cattle or above) that is determined through negotiation. The broker fee for shoats is small (i.e. ETB 2-3/head).
Brokers do not face any risk, have no license nor pay taxes and tend to operate as syndicates. On arrival, traders are persuaded to tell brokers the price they are seeking and hand over the cattle to them. Brokers add their own margin on top of the trader’s price when negotiating with buyers. As some anecdotal evidence indicates, the broker obtains an average broker fee of between 200 and 300 Birr, depending on the bargaining power of traders. Brokers play a critical role in determining the price of the day. Besides facilitating exchange, they also play the important role of guaranteeing that the cattle being traded are not stolen.
Exporters are traders who act as the final link in the chain between the local cattle marketing system and the importing country. They assemble livestock from different regions, transport them to destination countries and arrange for their sale. Exporters are few in number compared to traders, and collect export animals from secondary and tertiary markets from big and small traders, livestock trading cooperatives, collectors and producers.
According to the Live Animal Exporter's Association, there are about 100 licensed exporters who are members of the association, though some are not active. The number of these actors in the live animal export sector is increasing. In the prevailing marketing chain, there are some importers from Yemen and Djibouti trying to get involved in purchasing animals from the domestic market and exporting to their country. They use the export license of Ethiopian exporters who will be paid commission on the number of animal heads to be exported. They also rent temporary barns at Adama and pass their animals through the quarantine process. Usually, these foreign exporters/importers collect animals directly from the source markets through transaction via brokers in an open market and sometimes purchase animals from feedlots. This vertical integration gives them power to manipulate prices. Their operation at source markets has raised objection from local cattle traders. They insist that these exporters/importers should be buying at the terminal markets (from feedlots at Adama) rather than coming to source markets. To address this problem, the government drafted a new Proclamation in 2013 on livestock marketing, which prohibits the direct engagement of foreign importers in source markets.
Live cattle marketing chain The marketing chain has a highly complex market structure in Ethiopia. As depicted in Figure 12, producers may sell their animals to collectors, small traders or cooperatives, as well as to feedlots for foreign traders. Collectors who work as an agent for actors in the second level could supply to big trades, supply to secondary market centers, small traders, cooperatives and/or feedlot operators.
18

Figure 13: Live Cattle Marketing Chain in Ethiopia.
Source: Adopted from Getachew Legesse, 2008
Big cooperatives and feedlots operate to supply live cattle to exporters, abattoirs/meat exporters and to foreign traders (importers). This chain involves millions of smallholders, traders and exporters.
The current marketing chain is intertwined with complex networks and several inefficiencies (Figure 13). In remote areas, live animal producers have very limited information that collectors have power to distort. Most big traders are from specific localities and often have vertical or horzontal connections in designated market areas, limiting competion and depressing producer prices. Furthermore, because foreign importers are using Ethiopian export licenses and are directly involved in the source markets, domestic price formation is likely being distorted.
POLICY DECISIONS AND MEASURES Ethiopia has tried several policy interventions to improve livestock sector performance for the benefit of producers and other actors in the chain. In the 1980s and 1990s, the government formulated and implemented the 2nd, 3rd and 4th Livestock Development projects. During the second phase, the Livestock and Meat Board was established to develop the sector through improved management and infrastructure development. The livestock marketing division was given the mandate to promote exports, improve market infrastructure and implement market development projects. In its life span, the Board succeeded in constructing marketplaces, livestock routes, quarantine stations, abattoirs, and implemented rules and regulations that guide the
Producer
Collectors Small traders
Market groups
Feedlot operators
Cooperative Big traders
Frontier (purchasing point)
Foreign trader (Importer )
Live animal exporter
Meat exporter
19

development of improved marketing in the sub-sector. The third phase was focused on assisting farmers in fattening young bulls through balanced feed supply. Young bulls were purchased from surplus lowland areas and distributed to farmers in the highland areas on credit terms to be fattened on pasture and grain by-products. The fourth phase focused on improving high quality feed supply through the introduction of improved forage seeds and implementation of pasture development techniques.
In line with this, the Livestock and Livestock Products Market Development Department was established under the Ministry of Agriculture with the main objective of developing a market information system in selected livestock markets, collecting market information and creating equitable access for all market participants. Furthermore, the department would provide technical advice concerning the marketing of livestock and livestock products. The Livestock Marketing Authority was established with the objective of promoting the domestic and export marketing of animals, animal products and by-products through increasing supply and improving quality. Despite all these efforts, no visible change was registered.
When the present Federal Government of Ethiopia came into power in 1991, in addition to market liberalization, the Agricultural Development Led Industrialization (ADLI) Strategy was launched. The strategy was designed to increase productivity and promote a shift from subsistence to commercial agricultural. The agricultural shift would be part of the transformation of the entire economy characterized by a strong industry and services sector. The ADLI strategy indicates that the EPRDF Government duly recognized the need to improve the livestock sector, as it cites several aims to that end: (i) to enhance the quality and quantity of feed by allocating sites for grazing, providing improved animal feed and extension services to farmers; (ii) to increase livestock health service coverage and improve vaccination sites; and (iii) to improve the productivity of local cows by artificial insemination, but also to preserve and improve indigenous breeds. The importance of livestock as a source of foreign exchange, employment, income and food security was recognized in the Poverty Reduction Strategy, Sustainable Development and Poverty Reduction Strategy (SDPRS), Plan for Accelerated and Sustainable Development to End Poverty (PASDEP) and in the Growth and Transformation Plan (GTP).
The government also established the Ethiopian Meat and Dairy Technology Institute (EMDTI) under the Ministry of Agriculture in January 2008 with two Proclamations (143/2000 and 176/2002) to modernize the sector and improve the competitiveness of the meat industry by enhancing the capacity of commercial actors. The Institute was transferred and has been under the Ministry of Trade since February 2013 to promote live animal and meat marketing and export. The Animal and Plant Health Regulatory Division (APHRD) was also established to enhance animal health protection and maintenance. The GoE, in a commitment to strengthen the livestock sector, established the Livestock Resource Development Department in May 2013, run by the State Minister under Ministry of Agriculture.
To realize the stated policy objectives of promoting cattle marketing, the government is in the process of enacting the 2013 Proclamation on cattle marketing, which aims to put in place a modern and efficient market structure that enables the supply of live animals that are competitive in quality and price to domestic and international markets. The market is envisaged to promote an efficient market structure, supported by up-to-date information that yields equitable benefits to live animal
20
breeders, traders, consumers and the country as a whole. It also sets rights and obligations of breeders, feedlot operators, exporters, transporters and other actors involved in the livestock sector. The proclamation sets severe penalties for traders purchasing animals from undesignated markets; if caught, traders may be imprisoned for a period not exceeding two years and with a fine not exceeding Birr 30 000. Similarly, licensed animal exporters found to have transferred their license to a foreign exporter/importer shall be jailed for at least five years with a fine of Birr 150 000. However, taxes levied on livestock trade are to be reduced to a minimal level.
The existence of clear laws and regulations that permit some control of the market has important implications. Previously, livestock trading licenses were required in Amhara but not in the Tigray, SNNPR or Oromia regions.4 Despite the strict license requirement in the Amhara region, many unlicensed traders are actively involved in the livestock market. This indicates the difficulty of enforcing trade laws in the livestock business (Gebremedhin et al., 2007).
However, under the current structure, the responsibility for livestock development is diffused throughout various government ministries and authorities. Furthermore, the responsible department for livestock development at the national level has been under different institutions and the coordination between federal and regional levels not fully clear.
4 According to Amhara regional trade law any trader operate on capital more than ETB 3000 required to have trade license.
21
3. METHODOLOGY MAFAP methodology seeks to measure price incentives for producers and other marketing agents in key agricultural value chains. The analysis is based on the comparison between observed domestic prices and constructed reference prices. Reference prices are calculated from the international price of the product at the country’s border, where the product enters the country (if imported) or exits the country (if exported). This price is considered the benchmark price free of influence from domestic policies and markets. MAFAP estimates two types of reference prices – observed and adjusted. Observed reference prices are those that producers and other marketing agents could receive if the effects of distortions from domestic market and trade policies, as well as overall market performance, were removed. Adjusted reference prices are the same as observed reference prices, but also exclude the effects of any additional distortions from domestic exchange rate policies, structural inefficiencies in the commodity’s value chain, and imperfect functioning and non-competitive pricing in international markets.
MAFAP’s price incentives analysis is based on the law of one price, which is the economic theory that there is only one prevailing price for each product in a perfectly competitive market. This law only applies in the case of homogeneous goods, if information is correct and free, and if transaction costs are zero. Thus, this analysis was conducted for goods that are either perfectly homogeneous or perfect substitutes in the local market in terms of quality, or, failing that, are simply comparable goods. Indicators calculated from reference and domestic prices will, therefore, reveal whether domestic prices represent support (incentives) or a tax (disincentives) to various agents in the value chain.
Domestic prices are compared to reference prices at two specific locations along commodity value chains – the farm gate (usually the main production area for the product) and the point of competition (usually the main wholesale market where the domestic product competes with the internationally traded product). The approach for comparing prices at each location is summarized below, using an imported commodity as an example. In this situation, the country is importing a commodity that arrives in the port at the benchmark price (usually the unit value CIF price at the port of entry). In the domestic market, we observe the price of the same commodity at the point of competition, which is in this case the wholesale market, and at the farm gate. We also have information on observed access costs, which are all the costs associated with bringing the commodity to market, such as costs for processing, storage, handling, transport and the different margins applied by marketing agents in the value chain. These include access costs between the border and wholesale, as well as between the farm gate and wholesale.
The benchmark price is made comparable to the domestic price at wholesale by adding the access costs between the border and wholesale, resulting in the observed reference price at wholesale. This takes into account all the costs incurred by importers and other agents to bring the commodity to market, which in effect, raises the price of the commodity. The reference price at wholesale is further made comparable to the domestic price at the farm gate by deducting the access costs between the farm gate and wholesale, resulting in the observed reference price at farm gate. This takes into account all the costs incurred by farmers and other agents to bring the commodity from the farm to the wholesale market. Mathematically, the equations for calculating the observed
22
reference prices at wholesale (𝑅𝑅𝑅𝑅𝑜𝑜𝑜𝑜ℎ) and farm gate �𝑅𝑅𝑅𝑅𝑜𝑜𝑜𝑜𝑜𝑜� for an imported commodity are as follows:
𝑅𝑅𝑅𝑅𝑜𝑜𝑜𝑜ℎ = 𝑅𝑅𝑏𝑏 + 𝐴𝐴𝐴𝐴𝑜𝑜𝑜𝑜ℎ
𝑅𝑅𝑅𝑅𝑜𝑜𝑜𝑜𝑜𝑜 = 𝑅𝑅𝑅𝑅𝑜𝑜𝑜𝑜ℎ − 𝐴𝐴𝐴𝐴𝑜𝑜𝑜𝑜𝑜𝑜
where 𝐴𝐴𝐴𝐴𝑜𝑜𝑜𝑜ℎ are the observed access costs from the border to wholesale, including handling costs at the border, transport costs from the border to the wholesale market, profit margins and all observed taxes and levies, except tariffs, and 𝑅𝑅𝑏𝑏 is the benchmark price. 𝐴𝐴𝐴𝐴𝑜𝑜𝑜𝑜𝑜𝑜 are the observed access costs from the farm gate to wholesale, including handling costs at the farm, transport costs from farm to wholesale market, processing, profit margins and all observed taxes and levies.
The same steps described above can be taken a second time using benchmark prices and access costs that have been adjusted to eliminate market distortions due to exchange rate misalignments, structural inefficiencies in the commodity’s value chain 5 and imperfect functioning and non-competitive pricing in international markets, where possible and relevant. The adjusted benchmark prices and access costs are then used to generate a second set of adjusted reference prices, in addition to the first set of observed reference prices calculated.
For exported commodities, a slightly different approach is used. In this case, the border is generally considered the point of competition (wholesale), and the unit value FOB price for the commodity is normally taken as the benchmark price. Furthermore, observed and adjusted reference prices at wholesale are obtained by subtracting, rather than adding, the access costs between the border and wholesale. Mathematically, the equations for calculating the observed reference prices at wholesale (𝑅𝑅𝑅𝑅𝑜𝑜𝑜𝑜ℎ) and farm gate �𝑅𝑅𝑅𝑅𝑜𝑜𝑜𝑜𝑜𝑜� for an exported commodity are as follows:
𝑅𝑅𝑅𝑅𝑜𝑜𝑜𝑜ℎ = 𝑅𝑅𝑏𝑏 − 𝐴𝐴𝐴𝐴𝑜𝑜𝑜𝑜ℎ
𝑅𝑅𝑅𝑅𝑜𝑜𝑜𝑜𝑜𝑜 = 𝑅𝑅𝑅𝑅𝑜𝑜𝑜𝑜ℎ − 𝐴𝐴𝐴𝐴𝑜𝑜𝑜𝑜𝑜𝑜
After observed and adjusted reference prices are calculated for the commodity, they are subtracted from the domestic prices at each point in the value chain to obtain the observed and adjusted price gaps at wholesale and farm gate. Observed price gaps capture the effect of distortions from trade and market policies directly influencing the price of the commodity in domestic markets (e.g. price ceilings and tariffs), as well as overall market performance. Adjusted price gaps capture the same as the observed, in addition to the effect of any distortions from domestic exchange rate policies, structural inefficiencies in the commodity’s value chain, and imperfect functioning and non-competitive pricing in international markets. Mathematically, the equations for calculating the observed price gaps at wholesale (𝑅𝑅𝑃𝑃𝑜𝑜𝑜𝑜ℎ) and farm gate �𝑅𝑅𝑃𝑃𝑜𝑜𝑜𝑜𝑜𝑜� are as follows:
𝑅𝑅𝑃𝑃𝑜𝑜𝑜𝑜ℎ = 𝑅𝑅𝑜𝑜ℎ − 𝑅𝑅𝑅𝑅𝑜𝑜𝑜𝑜ℎ
𝑅𝑅𝑃𝑃𝑜𝑜𝑜𝑜𝑜𝑜 = 𝑅𝑅𝑜𝑜𝑜𝑜 − 𝑅𝑅𝑅𝑅𝑜𝑜𝑜𝑜𝑜𝑜
5 Structural inefficiencies in commodity value chains may include government taxes and fees (excluding fees for services), high transportation and processing costs, high profit margins captured by various marketing agents, bribes and other non-tariff barriers.
23
where 𝑅𝑅𝑜𝑜𝑜𝑜 is the domestic price at farm gate, 𝑅𝑅𝑅𝑅𝑜𝑜𝑜𝑜𝑜𝑜 is the observed reference price at farm gate, 𝑅𝑅𝑜𝑜ℎ is the domestic price at wholesale, and 𝑅𝑅𝑅𝑅𝑜𝑜𝑜𝑜ℎ is the observed reference price at wholesale.
A positive price gap, resulting when the domestic price exceeds the reference price, means that the policy environment and market functioning as a whole generate incentives (support) to producers or wholesalers. For an imported commodity this could be due to distortions such as the existence of an import tariff. On the other hand, if the reference price exceeds the domestic price, resulting in a negative price gap, this means that the policy environment and market functioning as a whole generate disincentives (taxes) to producers or wholesalers. For an imported commodity this could be due to distortions such as a price ceiling established by the government to keep domestic prices low.
In general, price gaps provide an absolute measure of the market price incentives (or disincentives) that producers and wholesalers face. Therefore, price gaps at wholesale and farm gate are divided by their corresponding reference price and expressed as a ratio, referred to as the Nominal Rate of Protection (NRP), which can be compared between years, commodities, and countries.
The Observed Nominal Rates of Protection at the farm gate (𝑁𝑁𝑅𝑅𝑅𝑅𝑜𝑜𝑜𝑜𝑜𝑜) and wholesale (𝑁𝑁𝑅𝑅𝑅𝑅𝑜𝑜𝑜𝑜ℎ) are defined by the following equations:
𝑁𝑁𝑅𝑅𝑅𝑅𝑜𝑜𝑜𝑜𝑜𝑜 =𝑅𝑅𝑃𝑃𝑜𝑜𝑜𝑜𝑜𝑜𝑅𝑅𝑅𝑅𝑜𝑜𝑜𝑜𝑜𝑜
; 𝑁𝑁𝑅𝑅𝑅𝑅𝑜𝑜𝑜𝑜ℎ =𝑅𝑅𝑃𝑃𝑜𝑜𝑜𝑜ℎ𝑅𝑅𝑅𝑅𝑜𝑜𝑜𝑜ℎ
where 𝑅𝑅𝑃𝑃𝑜𝑜𝑜𝑜𝑜𝑜 is the observed price gap at farm gate, 𝑅𝑅𝑅𝑅𝑜𝑜𝑜𝑜𝑜𝑜 is the observed reference price at the farm gate, 𝑅𝑅𝑃𝑃𝑜𝑜𝑜𝑜ℎis the observed price gap at wholesale and 𝑅𝑅𝑅𝑅𝑜𝑜𝑜𝑜ℎ is the observed reference price at wholesale.
Similarly, the Adjusted Nominal Rates of Protection at the farm gate (𝑁𝑁𝑅𝑅𝑅𝑅𝑎𝑎𝑜𝑜𝑜𝑜) and wholesale (𝑁𝑁𝑅𝑅𝑅𝑅𝑎𝑎𝑜𝑜ℎ) are defined by the following equations:
𝑁𝑁𝑅𝑅𝑅𝑅𝑎𝑎𝑜𝑜𝑜𝑜 =𝑅𝑅𝑃𝑃𝑎𝑎𝑜𝑜𝑜𝑜𝑅𝑅𝑅𝑅𝑎𝑎𝑜𝑜𝑜𝑜
; 𝑁𝑁𝑅𝑅𝑅𝑅𝑎𝑎𝑜𝑜ℎ =𝑅𝑅𝑃𝑃𝑎𝑎𝑜𝑜ℎ𝑅𝑅𝑅𝑅𝑎𝑎𝑜𝑜ℎ
where 𝑅𝑅𝑃𝑃𝑎𝑎𝑜𝑜𝑜𝑜 is the adjusted price gap at farm gate, 𝑅𝑅𝑅𝑅𝑎𝑎𝑜𝑜𝑜𝑜 is the adjusted reference price at the farm gate, 𝑅𝑅𝑃𝑃𝑎𝑎𝑜𝑜ℎis the adjusted price gap at wholesale and 𝑅𝑅𝑅𝑅𝑎𝑎𝑜𝑜ℎ is the adjusted reference price at wholesale.
If public expenditure allocated to the commodity is added to the price gap at farm gate when calculating the ratios, the Nominal Rate of Assistance (NRA) is generated. This indicator summarizes the incentives (or disincentives) due to policies, market performance and public expenditure.6 Mathematically, the Nominal Rate of Assistance is defined by the following equation:
𝑁𝑁𝑅𝑅𝐴𝐴 =𝑅𝑅𝑃𝑃𝑎𝑎𝑜𝑜𝑜𝑜 + 𝑅𝑅𝑃𝑃𝑐𝑐𝑐𝑐𝑐𝑐
𝑅𝑅𝑅𝑅𝑎𝑎𝑜𝑜𝑜𝑜
6 The NRA indicator was not calculated for any of the commodities analyzed because of insufficient data on public expenditure. However, it will be developed in the forthcoming reports, as the public expenditure analysis is improved and better data are made available.
24
where PEcsp is commodity-specific public expenditure that has been identified and measured as monetary units per tonne.
Finally, MAFAP methodology estimates the Market Development Gap (MDG), which is the portion of the price gap that can be attributed to “excessive” or inefficient access costs within a given value chain, exchange rate misalignments, and imperfect functioning of international markets. “Excessive” access costs may result from factors such as poor infrastructure, high processing costs due to obsolete technology, government taxes and fees (excluding fees for services), high profit margins captured by various marketing agents, bribes and other non-tariff barriers. Therefore, the total MDG at farm gate is comprised of three components – gaps due to “excessive” access costs, the exchange rate policy gap and the international market gap. When added together, these components are equivalent to the difference between the observed and adjusted price gaps at farm gate.
Similar to the price gaps calculated, the MDG is an absolute measure, which is also expressed as a ratio to allow for comparison between years, commodities, and countries. This relative indicator of the total MDG affecting farmers is derived by calculating the ratio between the total MDG at farm gate and the adjusted reference price at farm gate as follows:
𝑀𝑀𝑀𝑀𝑃𝑃𝑜𝑜𝑜𝑜 = (𝐴𝐴𝐴𝐴𝐴𝐴𝑤𝑤ℎ+𝐴𝐴𝐴𝐴𝐴𝐴𝑓𝑓𝑓𝑓+𝐸𝐸𝐸𝐸𝐸𝐸𝐴𝐴+𝐼𝐼𝐼𝐼𝐴𝐴)𝑅𝑅𝐸𝐸𝑎𝑎𝑓𝑓𝑓𝑓
where ACGwh is the access cost gap at wholesale defined as the difference between observed and adjusted access costs at wholesale, ACGfg is the access cost gap at farm gate defined as the difference between observed and adjusted access costs at the farm gate, ERPG is the exchange rate policy gap, and IMG is the international market gap.
A more detailed description of the methodology applied in this analysis is available on MAFAP’s website at www.fao.org/in-action/mafap/.
25


4. DATA REQUIREMENTS AND CALCULATION OF INDICATORS To calculate MAFAP’s price incentives indicators, several types of data are needed. This section presents the data that was obtained and methodological decisions that were taken in this analysis.
TRADE STATUS OF THE PRODUCT Historically, livestock and livestock products are among the major exported items in Ethiopia and hold a substantial share of overall value of export earnings. Ethiopia exports large volumes of bulls, while importing few live animals for breeding purposes only; these two conditions make Ethiopia a net exporter of live cattle (Table 4).
Table 4: Live Bovine Animal Exports and Imports (Heads), 2005-2012
Live cattle export and import 2005 2006 2007 2008 2009 2010 2011 2012
Export (heads) 119,919 146,495 124,970 20,984 0 100 116 400
Import (heads) 0 10063 0 2595 0 0 1058 0
Source: ERCA for export & FAOSTAT for import, 2013
MARKET PATHWAY ANALYSED There are about 26 registered farms that are engaged in feedlot operations in and around Adama town. Feedlot operators purchase 70 percent of their oxen/bulls from Borena and the remaining 30 percent from Bale. The basic reason for large purchases from Borena is that Borena breeds gain weight more rapidly than those from Bale, making Borena cattle preferred by importers. Thus, Borena cattle are the breed considered in this analysis and the farm gate chosen is at Negele (Borena), which is the major center for live bulls destined for export.
Around Adama, in the Bale region, there are roughly 140 feedlot operators in total. The feedlots use Borena markets as the main source for cattle exports because of accessible transportation, relatively lower prices and preference for these cattle, which are large in size, fast growing, efficient in feed conversion and adapt more easily to harsh environments (Legesse et al, 2008). Additionally, feedlot operators collect cattle from Dera and Adama markets, as well as from other main markets.
The Adama cattle market is chosen as the point of competition for live bull/ox marketing, which is the traditional market used by abattoirs, exporters and feedlot operators. Adama market is close to most feedlots around Adama and Dera areas.
The last segment used in the exporting pathway is between the wholesale market of Adama and the port of Djibouti. Exporters purchase live oxen/bulls directly from feedlot operators and have to get quarantine clearance or Sanitary and Phyto-Sanitary (SPS) certificates from the Ministry of Agriculture Quarantine Center in Adama, in addition to customs permits before shipping to the port of Djibouti.
BENCHMARK PRICES Observed
A benchmark price is established as a basis to calculate a reference parity price in order to determine whether Ethiopia's bull raising farmers receive market incentives or disincentives. Ethiopia is
27
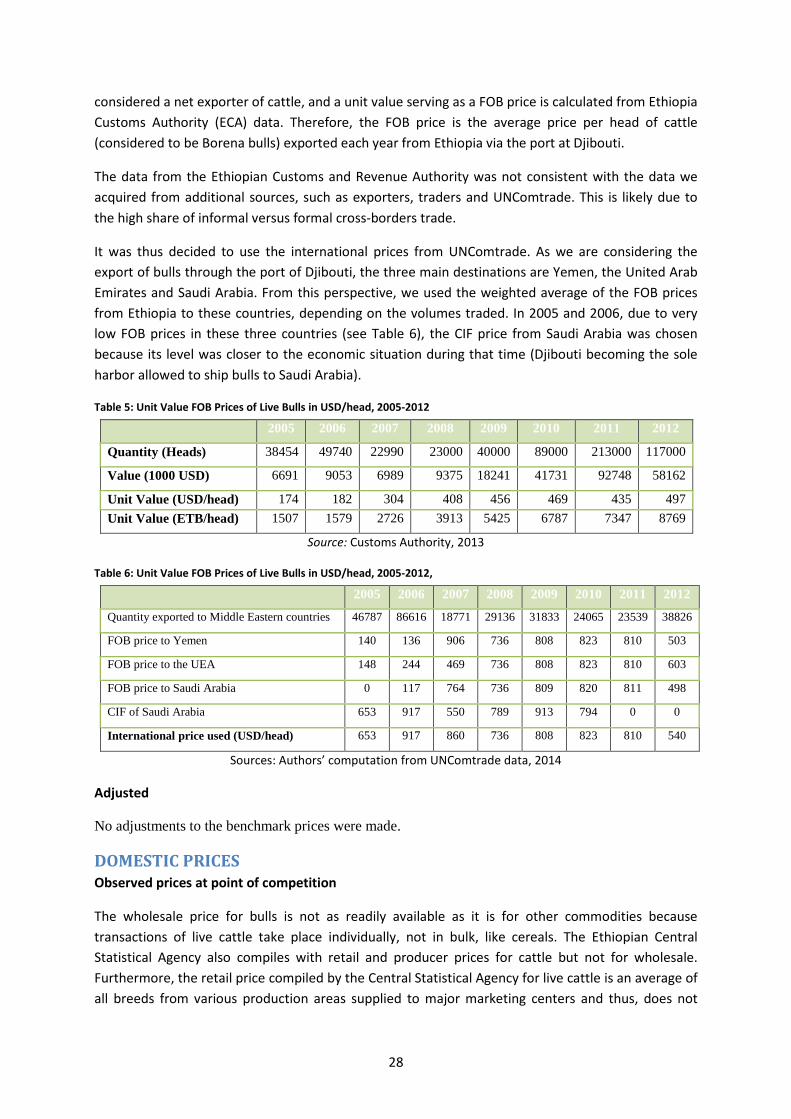
considered a net exporter of cattle, and a unit value serving as a FOB price is calculated from Ethiopia Customs Authority (ECA) data. Therefore, the FOB price is the average price per head of cattle (considered to be Borena bulls) exported each year from Ethiopia via the port at Djibouti.
The data from the Ethiopian Customs and Revenue Authority was not consistent with the data we acquired from additional sources, such as exporters, traders and UNComtrade. This is likely due to the high share of informal versus formal cross-borders trade.
It was thus decided to use the international prices from UNComtrade. As we are considering the export of bulls through the port of Djibouti, the three main destinations are Yemen, the United Arab Emirates and Saudi Arabia. From this perspective, we used the weighted average of the FOB prices from Ethiopia to these countries, depending on the volumes traded. In 2005 and 2006, due to very low FOB prices in these three countries (see Table 6), the CIF price from Saudi Arabia was chosen because its level was closer to the economic situation during that time (Djibouti becoming the sole harbor allowed to ship bulls to Saudi Arabia).
Table 5: Unit Value FOB Prices of Live Bulls in USD/head, 2005-2012
2005 2006 2007 2008 2009 2010 2011 2012
Quantity (Heads) 38454 49740 22990 23000 40000 89000 213000 117000
Value (1000 USD) 6691 9053 6989 9375 18241 41731 92748 58162
Unit Value (USD/head) 174 182 304 408 456 469 435 497 Unit Value (ETB/head) 1507 1579 2726 3913 5425 6787 7347 8769
Source: Customs Authority, 2013
Table 6: Unit Value FOB Prices of Live Bulls in USD/head, 2005-2012,
2005 2006 2007 2008 2009 2010 2011 2012
Quantity exported to Middle Eastern countries 46787 86616 18771 29136 31833 24065 23539 38826
FOB price to Yemen 140 136 906 736 808 823 810 503
FOB price to the UEA 148 244 469 736 808 823 810 603
FOB price to Saudi Arabia 0 117 764 736 809 820 811 498
CIF of Saudi Arabia 653 917 550 789 913 794 0 0
International price used (USD/head) 653 917 860 736 808 823 810 540
Sources: Authors’ computation from UNComtrade data, 2014
Adjusted
No adjustments to the benchmark prices were made.
DOMESTIC PRICES Observed prices at point of competition
The wholesale price for bulls is not as readily available as it is for other commodities because transactions of live cattle take place individually, not in bulk, like cereals. The Ethiopian Central Statistical Agency also compiles with retail and producer prices for cattle but not for wholesale. Furthermore, the retail price compiled by the Central Statistical Agency for live cattle is an average of all breeds from various production areas supplied to major marketing centers and thus, does not
28
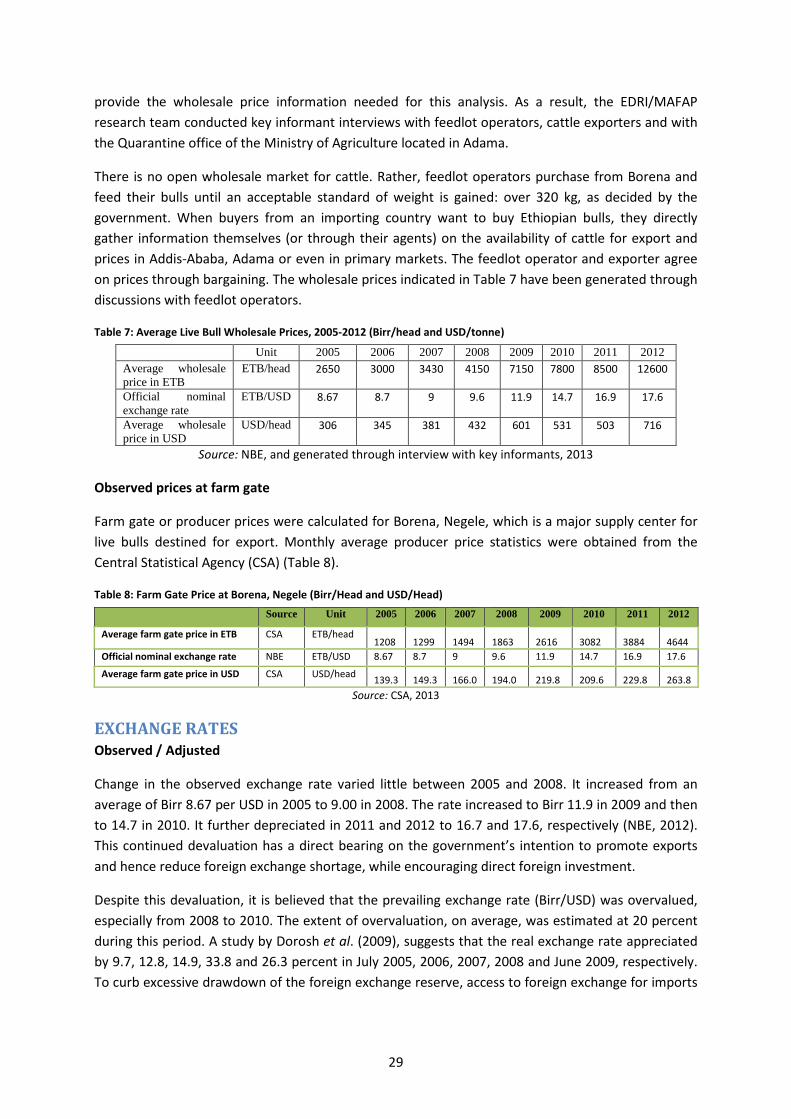
provide the wholesale price information needed for this analysis. As a result, the EDRI/MAFAP research team conducted key informant interviews with feedlot operators, cattle exporters and with the Quarantine office of the Ministry of Agriculture located in Adama.
There is no open wholesale market for cattle. Rather, feedlot operators purchase from Borena and feed their bulls until an acceptable standard of weight is gained: over 320 kg, as decided by the government. When buyers from an importing country want to buy Ethiopian bulls, they directly gather information themselves (or through their agents) on the availability of cattle for export and prices in Addis-Ababa, Adama or even in primary markets. The feedlot operator and exporter agree on prices through bargaining. The wholesale prices indicated in Table 7 have been generated through discussions with feedlot operators.
Table 7: Average Live Bull Wholesale Prices, 2005-2012 (Birr/head and USD/tonne)
Unit 2005 2006 2007 2008 2009 2010 2011 2012 Average wholesale price in ETB
ETB/head 2650 3000 3430 4150 7150 7800 8500 12600
Official nominal exchange rate
ETB/USD 8.67 8.7 9 9.6 11.9 14.7 16.9 17.6
Average wholesale price in USD
USD/head 306 345 381 432 601 531 503 716
Source: NBE, and generated through interview with key informants, 2013
Observed prices at farm gate
Farm gate or producer prices were calculated for Borena, Negele, which is a major supply center for live bulls destined for export. Monthly average producer price statistics were obtained from the Central Statistical Agency (CSA) (Table 8).
Table 8: Farm Gate Price at Borena, Negele (Birr/Head and USD/Head) Source Unit 2005 2006 2007 2008 2009 2010 2011 2012
Average farm gate price in ETB CSA ETB/head 1208 1299 1494 1863 2616 3082 3884 4644
Official nominal exchange rate NBE ETB/USD 8.67 8.7 9 9.6 11.9 14.7 16.9 17.6
Average farm gate price in USD CSA USD/head 139.3 149.3 166.0 194.0 219.8 209.6 229.8 263.8 Source: CSA, 2013
EXCHANGE RATES Observed / Adjusted
Change in the observed exchange rate varied little between 2005 and 2008. It increased from an average of Birr 8.67 per USD in 2005 to 9.00 in 2008. The rate increased to Birr 11.9 in 2009 and then to 14.7 in 2010. It further depreciated in 2011 and 2012 to 16.7 and 17.6, respectively (NBE, 2012). This continued devaluation has a direct bearing on the government’s intention to promote exports and hence reduce foreign exchange shortage, while encouraging direct foreign investment.
Despite this devaluation, it is believed that the prevailing exchange rate (Birr/USD) was overvalued, especially from 2008 to 2010. The extent of overvaluation, on average, was estimated at 20 percent during this period. A study by Dorosh et al. (2009), suggests that the real exchange rate appreciated by 9.7, 12.8, 14.9, 33.8 and 26.3 percent in July 2005, 2006, 2007, 2008 and June 2009, respectively. To curb excessive drawdown of the foreign exchange reserve, access to foreign exchange for imports
29
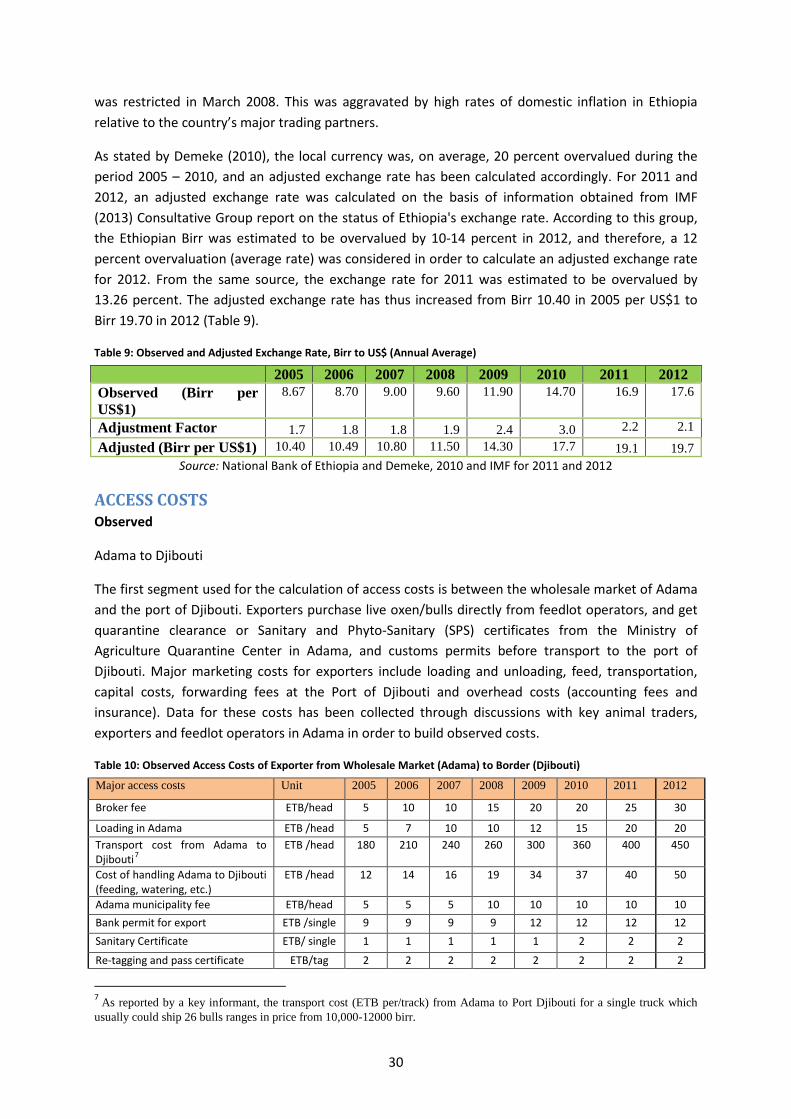
was restricted in March 2008. This was aggravated by high rates of domestic inflation in Ethiopia relative to the country’s major trading partners.
As stated by Demeke (2010), the local currency was, on average, 20 percent overvalued during the period 2005 – 2010, and an adjusted exchange rate has been calculated accordingly. For 2011 and 2012, an adjusted exchange rate was calculated on the basis of information obtained from IMF (2013) Consultative Group report on the status of Ethiopia's exchange rate. According to this group, the Ethiopian Birr was estimated to be overvalued by 10-14 percent in 2012, and therefore, a 12 percent overvaluation (average rate) was considered in order to calculate an adjusted exchange rate for 2012. From the same source, the exchange rate for 2011 was estimated to be overvalued by 13.26 percent. The adjusted exchange rate has thus increased from Birr 10.40 in 2005 per US$1 to Birr 19.70 in 2012 (Table 9).
Table 9: Observed and Adjusted Exchange Rate, Birr to US$ (Annual Average)
2005 2006 2007 2008 2009 2010 2011 2012 Observed (Birr per US$1)
8.67 8.70 9.00 9.60 11.90 14.70 16.9 17.6
Adjustment Factor 1.7 1.8 1.8 1.9 2.4 3.0 2.2 2.1 Adjusted (Birr per US$1) 10.40 10.49 10.80 11.50 14.30 17.7 19.1 19.7
Source: National Bank of Ethiopia and Demeke, 2010 and IMF for 2011 and 2012
ACCESS COSTS Observed
Adama to Djibouti
The first segment used for the calculation of access costs is between the wholesale market of Adama and the port of Djibouti. Exporters purchase live oxen/bulls directly from feedlot operators, and get quarantine clearance or Sanitary and Phyto-Sanitary (SPS) certificates from the Ministry of Agriculture Quarantine Center in Adama, and customs permits before transport to the port of Djibouti. Major marketing costs for exporters include loading and unloading, feed, transportation, capital costs, forwarding fees at the Port of Djibouti and overhead costs (accounting fees and insurance). Data for these costs has been collected through discussions with key animal traders, exporters and feedlot operators in Adama in order to build observed costs.
Table 10: Observed Access Costs of Exporter from Wholesale Market (Adama) to Border (Djibouti)
Major access costs Unit 2005 2006 2007 2008 2009 2010 2011 2012
Broker fee ETB/head 5 10 10 15 20 20 25 30
Loading in Adama ETB /head 5 7 10 10 12 15 20 20 Transport cost from Adama to Djibouti7
ETB /head 180 210 240 260 300 360 400 450
Cost of handling Adama to Djibouti (feeding, watering, etc.)
ETB /head 12 14 16 19 34 37 40 50
Adama municipality fee ETB/head 5 5 5 10 10 10 10 10 Bank permit for export ETB /single 9 9 9 9 12 12 12 12 Sanitary Certificate ETB/ single 1 1 1 1 1 2 2 2
Re-tagging and pass certificate ETB/tag 2 2 2 2 2 2 2 2
7 As reported by a key informant, the transport cost (ETB per/track) from Adama to Port Djibouti for a single truck which usually could ship 26 bulls ranges in price from 10,000-12000 birr.
30
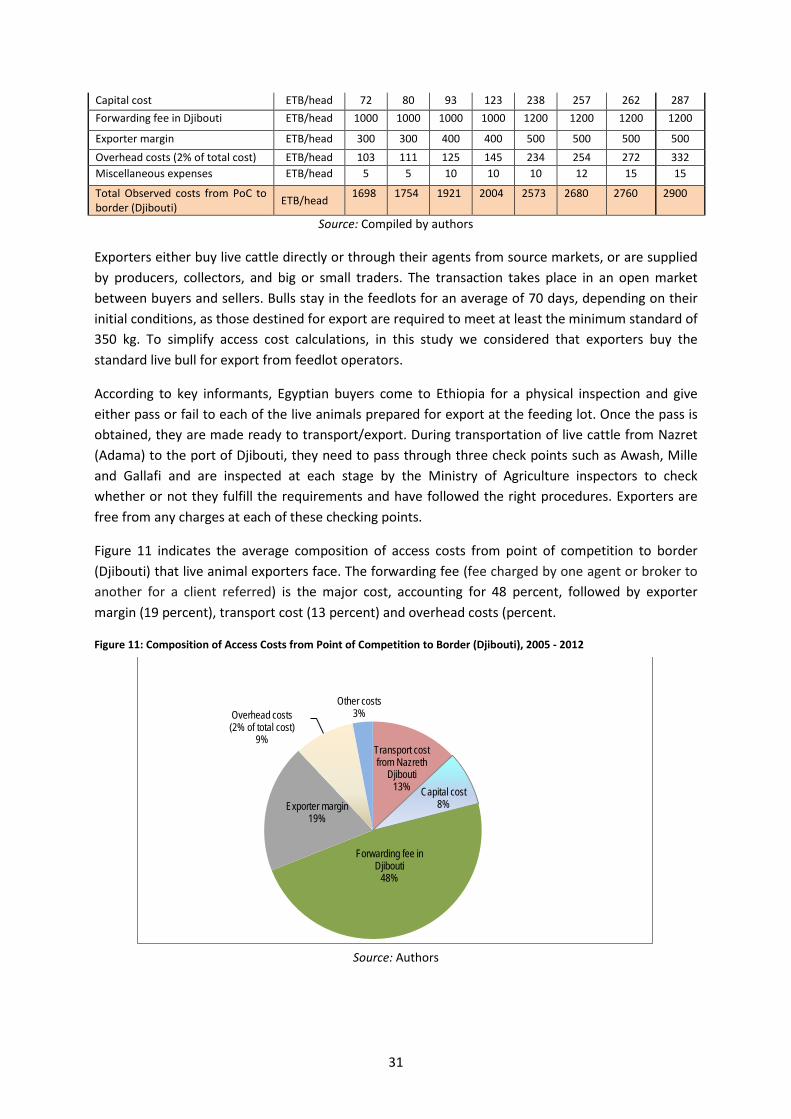
Capital cost ETB/head 72 80 93 123 238 257 262 287 Forwarding fee in Djibouti ETB/head 1000 1000 1000 1000 1200 1200 1200 1200
Exporter margin ETB/head 300 300 400 400 500 500 500 500 Overhead costs (2% of total cost) ETB/head 103 111 125 145 234 254 272 332 Miscellaneous expenses ETB/head 5 5 10 10 10 12 15 15
Total Observed costs from PoC to border (Djibouti) ETB/head 1698 1754 1921 2004 2573 2680 2760 2900
Source: Compiled by authors
Exporters either buy live cattle directly or through their agents from source markets, or are supplied by producers, collectors, and big or small traders. The transaction takes place in an open market between buyers and sellers. Bulls stay in the feedlots for an average of 70 days, depending on their initial conditions, as those destined for export are required to meet at least the minimum standard of 350 kg. To simplify access cost calculations, in this study we considered that exporters buy the standard live bull for export from feedlot operators.
According to key informants, Egyptian buyers come to Ethiopia for a physical inspection and give either pass or fail to each of the live animals prepared for export at the feeding lot. Once the pass is obtained, they are made ready to transport/export. During transportation of live cattle from Nazret (Adama) to the port of Djibouti, they need to pass through three check points such as Awash, Mille and Gallafi and are inspected at each stage by the Ministry of Agriculture inspectors to check whether or not they fulfill the requirements and have followed the right procedures. Exporters are free from any charges at each of these checking points.
Figure 11 indicates the average composition of access costs from point of competition to border (Djibouti) that live animal exporters face. The forwarding fee (fee charged by one agent or broker to another for a client referred) is the major cost, accounting for 48 percent, followed by exporter margin (19 percent), transport cost (13 percent) and overhead costs (percent.
Figure 11: Composition of Access Costs from Point of Competition to Border (Djibouti), 2005 - 2012
Source: Authors
Transport cost from Nazreth
Djibouti 13% Capital cost
8%
Forwarding fee in Djibouti
48%
Exporter margin 19%
Overhead costs (2% of total cost)
9%
Other costs 3%
31

Borena to Adama
The second segment used for the analysis of access costs is between the wholesale market of Adama and the producing area of Borena. The area around Borena is considered to be a representative producing area, the town being part of the Oromia region where 53 percent of Ethiopian bull production is concentrated. Marketing costs from Borena to Adama were obtained through discussions with traders and brokers at the Borena and Adama wholesale markets. The major access costs for feedlot operators include loading/transport/unloading costs at Borena and Adama, and all costs for feedlot activities such as sanitary, feed, water and labour costs and margins (Table 11).
Table 11: Observed Access Costs from Farm Gate (Borena) to Wholesalers/Feedlot Operators (Adama)
Observed access costs of from farm gate to point of competition
Unit 2005 2006 2007 2008 2009 2010 2011 2012
Broker fee at Borena ETB/Head 10 10 10 20 20 20 30 50 Loading cost at Borena ETB/Head 8 10 12 12 15 15 15 15 Transport cost (Borena to Adama 530 km). ETB/Head 200 200 270 300 375 450 500 550 Borena Municipality ETB/Head 10 10 10 10 10 10 Attendant's fee during transportation ETB/Head 10 15 20 25 30 30 40 50 Access costs during feedlot Feeding cost (70 days) ETB/70 days 630 630 840 1190 1750 2100 2450 2950 Vaccination (4 round 6 types) ETB/Head 13.9 13.9 13.9 13.9 13.9 13.9 13.9 13.9 Treatment ETB/Head 6.0 6.0 6.0 6.0 6.0 6.0 6.0 6.0 Ear tagging ETB/Head 8.0 8.0 8.0 8.0 8.0 8.0 8.0 8.0 Taxes and levies ETB/head - - - - 6.7 6.7 6.7 6.7 Labor, water and others (70 days) ETB /head 25 28 32 39 67 74 80 100 Capital cost ETB /head 37 45 58 73 97 108 133 146 Trader margin ETB/ head 150 150 200 200 300 300 400 400 Overhead cost ETB/ head 62 68 82 100 163 181 204 243 Total Observed Costs - FG to PoC ETB/ head 1159 1184 1561 1997 2862 2233 3896 4546
Source: Compiled by authors
Figure 12 depicts the composition of access costs from farm gate (Borena) to Adama and the costs incurred during the animals’ stay in the feedlot. As indicated in Figure 4, feed costs increased more than twofold between 2003 and 2012; this being one of the most challenging issues the sector is facing. Transport is the second biggest cost and accounts for 14 percent of the total, followed by trader margins at 11 percent.
32
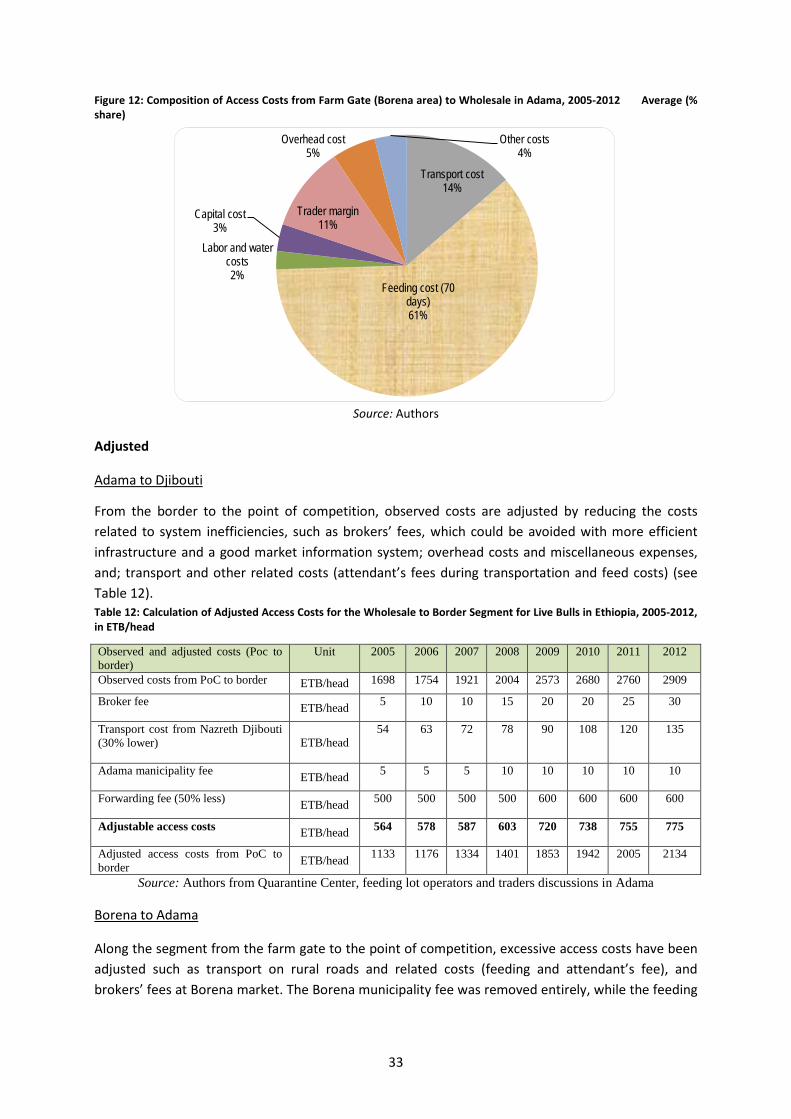
Figure 12: Composition of Access Costs from Farm Gate (Borena area) to Wholesale in Adama, 2005-2012 Average (% share)
Source: Authors
Adjusted
Adama to Djibouti
From the border to the point of competition, observed costs are adjusted by reducing the costs related to system inefficiencies, such as brokers’ fees, which could be avoided with more efficient infrastructure and a good market information system; overhead costs and miscellaneous expenses, and; transport and other related costs (attendant’s fees during transportation and feed costs) (see Table 12). Table 12: Calculation of Adjusted Access Costs for the Wholesale to Border Segment for Live Bulls in Ethiopia, 2005-2012, in ETB/head
Source: Authors from Quarantine Center, feeding lot operators and traders discussions in Adama
Borena to Adama
Along the segment from the farm gate to the point of competition, excessive access costs have been adjusted such as transport on rural roads and related costs (feeding and attendant’s fee), and brokers’ fees at Borena market. The Borena municipality fee was removed entirely, while the feeding
Transport cost 14%
Feeding cost (70 days) 61%
Labor and water costs 2%
Capital cost 3%
Trader margin 11%
Overhead cost 5%
Other costs 4%
Observed and adjusted costs (Poc to border)
Unit 2005 2006 2007 2008 2009 2010 2011 2012
Observed costs from PoC to border ETB/head 1698 1754 1921 2004 2573 2680 2760 2909
Broker fee ETB/head 5 10 10 15 20 20 25 30
Transport cost from Nazreth Djibouti (30% lower) ETB/head
54 63 72 78 90 108 120 135
Adama manicipality fee ETB/head 5 5 5 10 10 10 10 10
Forwarding fee (50% less) ETB/head 500 500 500 500 600 600 600 600
Adjustable access costs ETB/head 564 578 587 603 720 738 755 775
Adjusted access costs from PoC to border ETB/head 1133 1176 1334 1401 1853 1942 2005 2134
33
costs in feedlots were halved. Lack of rural infrastructure and an efficient market for feed are substantial drawbacks in Ethiopia (see Production section).
Table 13: Calculation of Adjusted Access Costs for the Farm Gate –to Wholesale segment for Live Bulls in Ethiopia, 2005-2012, in ETB/head
Source: Authors from Quarantine Center, feeding lot operators and traders discussions in Adama
BUDGET AND OTHER TRANSFERS No budgetary transfer has been taken into account in the analysis.
QUALITY AND QUANTITY ADJUSTMENTS No quantity or quality adjustments were used because impurity losses are already taken into account in the adjusted access costs calculation.
Observed and adjusted access costs (FG to Poc )
Unit 2005 2006 2007 2008 2009 2010 2011 2012
Observed access costs from FG to PoC ETB/ head 1159 1184 1561 1997 2862 3322 3896 4546 Brokers’ fee at Borena ETB/ head 10 10 10 20 20 20 30 50 Transport costs Borena-Adama ETB/ head 80 80 108 120 150 180 200 220 Municipality fee at Borena ETB/ head - - 10 10 10 10 10 10 Attendant’s fee during transportation ETB/ head 10 15 20 25 30 30 40 50 Feeding costs (70 days) ETB/ head 315 315 420 595 875 1050 1225 1475 Adjustable costs ETB/ head 415 420 568 770 1085 1290 1505 1805 Adjusted access costs from FG to PoC ETB/ head 744 764 993 1227 1777 2032 2391 2741
34
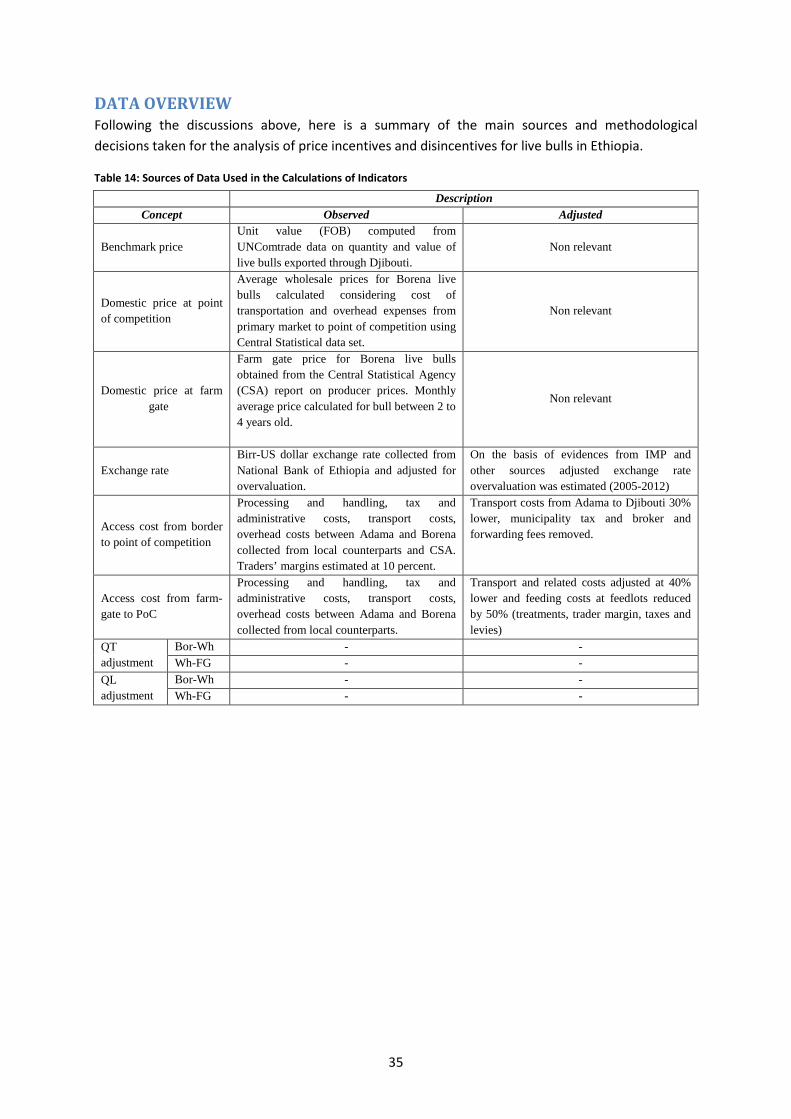
DATA OVERVIEW Following the discussions above, here is a summary of the main sources and methodological decisions taken for the analysis of price incentives and disincentives for live bulls in Ethiopia.
Table 14: Sources of Data Used in the Calculations of Indicators
Description Concept Observed Adjusted
Benchmark price Unit value (FOB) computed from UNComtrade data on quantity and value of live bulls exported through Djibouti.
Non relevant
Domestic price at point of competition
Average wholesale prices for Borena live bulls calculated considering cost of transportation and overhead expenses from primary market to point of competition using Central Statistical data set.
Non relevant
Domestic price at farm gate
Farm gate price for Borena live bulls obtained from the Central Statistical Agency (CSA) report on producer prices. Monthly average price calculated for bull between 2 to 4 years old.
Non relevant
Exchange rate Birr-US dollar exchange rate collected from National Bank of Ethiopia and adjusted for overvaluation.
On the basis of evidences from IMP and other sources adjusted exchange rate overvaluation was estimated (2005-2012)
Access cost from border to point of competition
Processing and handling, tax and administrative costs, transport costs, overhead costs between Adama and Borena collected from local counterparts and CSA. Traders’ margins estimated at 10 percent.
Transport costs from Adama to Djibouti 30% lower, municipality tax and broker and forwarding fees removed.
Access cost from farm-gate to PoC
Processing and handling, tax and administrative costs, transport costs, overhead costs between Adama and Borena collected from local counterparts.
Transport and related costs adjusted at 40% lower and feeding costs at feedlots reduced by 50% (treatments, trader margin, taxes and levies)
QT adjustment
Bor-Wh - - Wh-FG - -
QL adjustment
Bor-Wh - - Wh-FG - -
35

The data used for this analysis is summarized below.
Table 15: Data Used for the MAFAP Analysis
Year 2005 2006 2007 2008 2009 2010 2011 2012
trade status
DATA Unit Symbol Benchmark Price
Observed Pb(int$) 653 917 860 736 808 823 810 540 Adjusted Pba
Exchange Rate Observed ERo 8.67 8.7 9 9.6 11.9 14.7 16.9 17.6 Adjusted ERa 10.4 10.49 10.8 11.5 14.3 17.7 19.1 19.7
Access costs border - wholesale Observed ACowh 1698 1754 1921 2004 2573 2680 2760 2909 Adjusted ACawh 1131 1176 1334 1396 1850 1937 1990 2114
Domestic price at wholesale Pdwh 2650 3000 3430 4150 7150 7800 8500 12600 Access costs wholesale - farm gate
Observed ACofg 1159 1184 1561 1997 2862 3322 3896 4546 Adjusted ACafg 744 764 993 1227 1777 2032 2391 2741
Farm gate price Pdfg 1208 1299 1494 1863 2616 3082 3884 4644 Externalities associated with
production E - - - - - - - -
Budget and other product related transfers
BOT - - - - - - - -
Quantity conversion factor (border - point of competition)
Fraction QTwh - - - - - - - -
Quality conversion factor (border - point of competition)
Fraction QLwh - - - - - - - -
Quantity conversion factor (point of competition – farm gate)
Fraction QTfg - - - - - - - -
Quality conversion factor (point of competition – farm gate)
Fraction QLfg - - - - - - - -
36
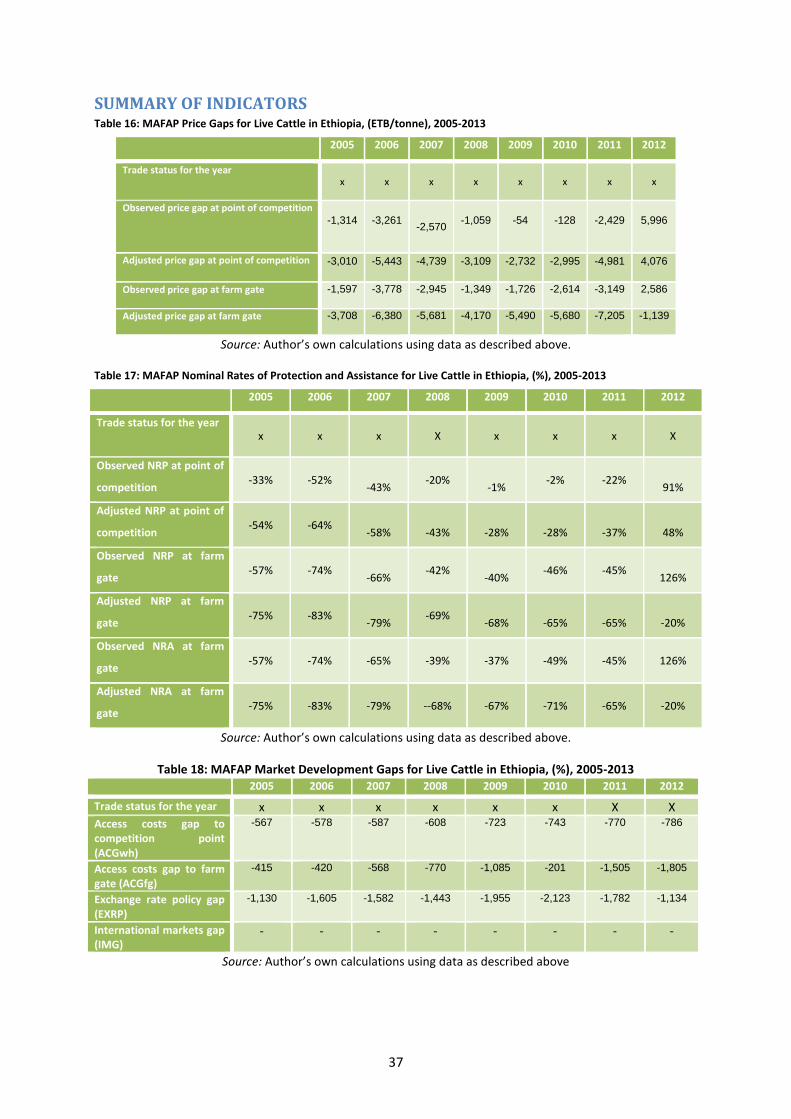
SUMMARY OF INDICATORS Table 16: MAFAP Price Gaps for Live Cattle in Ethiopia, (ETB/tonne), 2005-2013
2005 2006 2007 2008 2009 2010 2011 2012
Trade status for the year x x x x x x x x
Observed price gap at point of competition -1,314
-3,261
-2,570 -1,059
-54
-128
-2,429
5,996
Adjusted price gap at point of competition -3,010
-5,443
-4,739
-3,109
-2,732
-2,995
-4,981
4,076
Observed price gap at farm gate -1,597
-3,778
-2,945
-1,349
-1,726
-2,614
-3,149
2,586
Adjusted price gap at farm gate -3,708
-6,380
-5,681
-4,170
-5,490
-5,680
-7,205
-1,139
Source: Author’s own calculations using data as described above.
Table 17: MAFAP Nominal Rates of Protection and Assistance for Live Cattle in Ethiopia, (%), 2005-2013
2005 2006 2007 2008 2009 2010 2011 2012
Trade status for the year x x x X x x x X
Observed NRP at point of
competition -33% -52% -43% -20%
-1% -2% -22% 91%
Adjusted NRP at point of
competition -54% -64% -58%
-43%
-28%
-28%
-37%
48%
Observed NRP at farm
gate -57% -74% -66% -42%
-40% -46% -45% 126%
Adjusted NRP at farm
gate -75% -83% -79% -69%
-68%
-65%
-65%
-20%
Observed NRA at farm
gate -57% -74% -65% -39% -37% -49% -45% 126%
Adjusted NRA at farm
gate -75% -83% -79% --68% -67% -71% -65% -20%
Source: Author’s own calculations using data as described above.
Table 18: MAFAP Market Development Gaps for Live Cattle in Ethiopia, (%), 2005-2013 2005 2006 2007 2008 2009 2010 2011 2012
Trade status for the year x x x x x x X X Access costs gap to competition point (ACGwh)
-567
-578
-587
-608
-723
-743
-770
-786
Access costs gap to farm gate (ACGfg)
-415
-420
-568
-770
-1,085
-201
-1,505
-1,805
Exchange rate policy gap (EXRP)
-1,130
-1,605
-1,582
-1,443
-1,955
-2,123
-1,782
-1,134
International markets gap (IMG)
- - - - - - - -
Source: Author’s own calculations using data as described above
37


5. RESULTS AND INTERPRETATION Indicators were calculated to assess the price incentives and disincentives for wholesalers and producers from the data collected.
From 2005 to 2011, both observed and adjusted price gaps at wholesale and farm gate were negative most of the time (Figure 16). The price gaps show the difference between the reference price at a particular point in the value chain and the actual price received by the agents. This means that the wholesalers and farmers received lower prices than they could have received without any policy distortion and within a more efficient value chain.
On the other hand, both wholesalers and farmers received a better price in 2012. The price gap at point of competition peaked at almost 6 000 ETB/head and 2 586 ETB/head at farm gate. In part, this positive shift in 2012 owes to a substantial decrease in the international price of cattle by 33 percent. In 2010, the international price became more volatile, and began to fall in 2011. Conversely, farm gate prices continued to increase, partly stimulated by the devaluation policy of the government. Another factor increasing the price at farm gate was the rising price of imported animal feed, forcing producers to raise their prices in response. At the wholesale level, exporters were forced to become more competitive by lowering their costs. One explanation for the depression of the international price could be the shift in demand of the Gulf countries from Ethiopian bulls to Australian and Brazilian bulls. Food safety is one of the main drivers of this consumption shift in these middle/high-income countries. Moreover, the large number of cattle smuggled over the borders of Sudan, Somalia and Kenya is certainly another reason for the contradictory trends of international and domestic prices. In fact, with the international price depressed, exporters might have traded their bulls through the informal routes to get better prices.
Figure 13: Observed and Adjusted Price Gaps at Wholesale and Farm Gate Levels, 2005 to 2012
Source: MAFAP, 2014
(8,000)
(6,000)
(4,000)
(2,000)
-
2,000
4,000
6,000
8,000
2005 2006 2007 2008 2009 2010 2011 2012
ETB/
Tonn
e
Observed price gap at point of competition Adjusted price gap at point of competition
Observed price gap at farm gate Adjusted price gap at farm gate
39
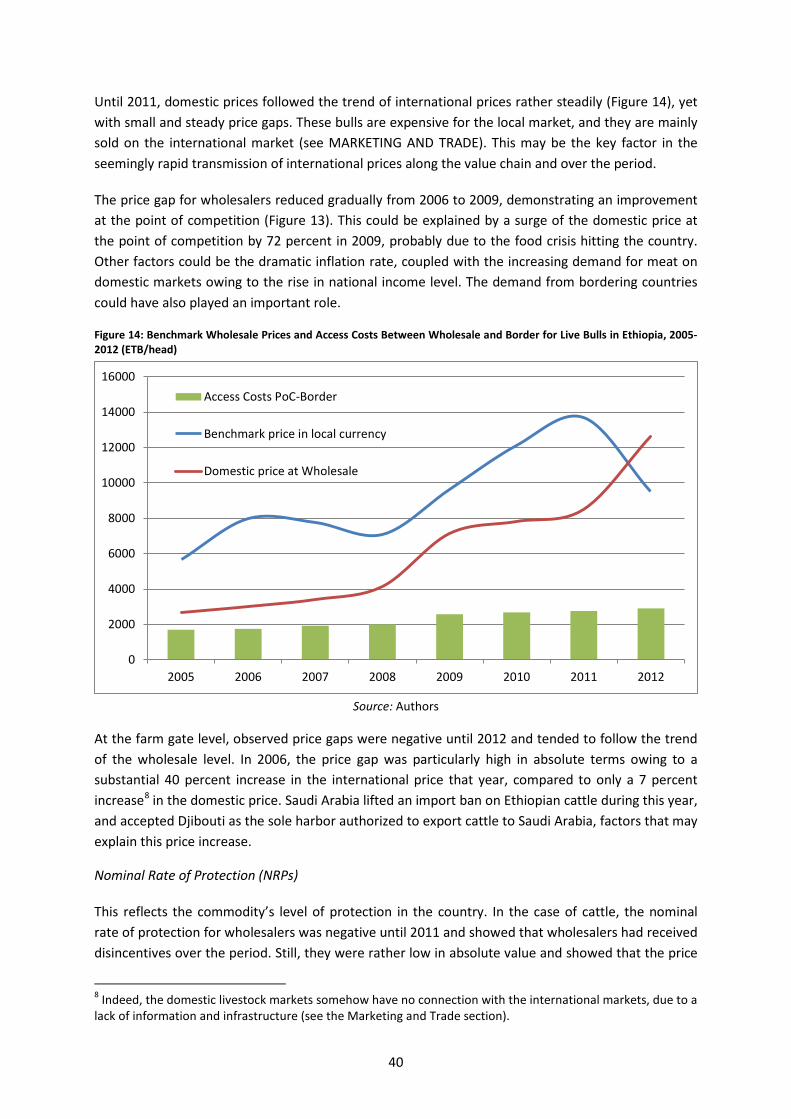
Until 2011, domestic prices followed the trend of international prices rather steadily (Figure 14), yet with small and steady price gaps. These bulls are expensive for the local market, and they are mainly sold on the international market (see MARKETING AND TRADE). This may be the key factor in the seemingly rapid transmission of international prices along the value chain and over the period.
The price gap for wholesalers reduced gradually from 2006 to 2009, demonstrating an improvement at the point of competition (Figure 13). This could be explained by a surge of the domestic price at the point of competition by 72 percent in 2009, probably due to the food crisis hitting the country. Other factors could be the dramatic inflation rate, coupled with the increasing demand for meat on domestic markets owing to the rise in national income level. The demand from bordering countries could have also played an important role.
Figure 14: Benchmark Wholesale Prices and Access Costs Between Wholesale and Border for Live Bulls in Ethiopia, 2005-2012 (ETB/head)
Source: Authors
At the farm gate level, observed price gaps were negative until 2012 and tended to follow the trend of the wholesale level. In 2006, the price gap was particularly high in absolute terms owing to a substantial 40 percent increase in the international price that year, compared to only a 7 percent increase8 in the domestic price. Saudi Arabia lifted an import ban on Ethiopian cattle during this year, and accepted Djibouti as the sole harbor authorized to export cattle to Saudi Arabia, factors that may explain this price increase.
Nominal Rate of Protection (NRPs)
This reflects the commodity’s level of protection in the country. In the case of cattle, the nominal rate of protection for wholesalers was negative until 2011 and showed that wholesalers had received disincentives over the period. Still, they were rather low in absolute value and showed that the price
8 Indeed, the domestic livestock markets somehow have no connection with the international markets, due to a lack of information and infrastructure (see the Marketing and Trade section).
0
2000
4000
6000
8000
10000
12000
14000
16000
2005 2006 2007 2008 2009 2010 2011 2012
Access Costs PoC-Border
Benchmark price in local currency
Domestic price at Wholesale
40
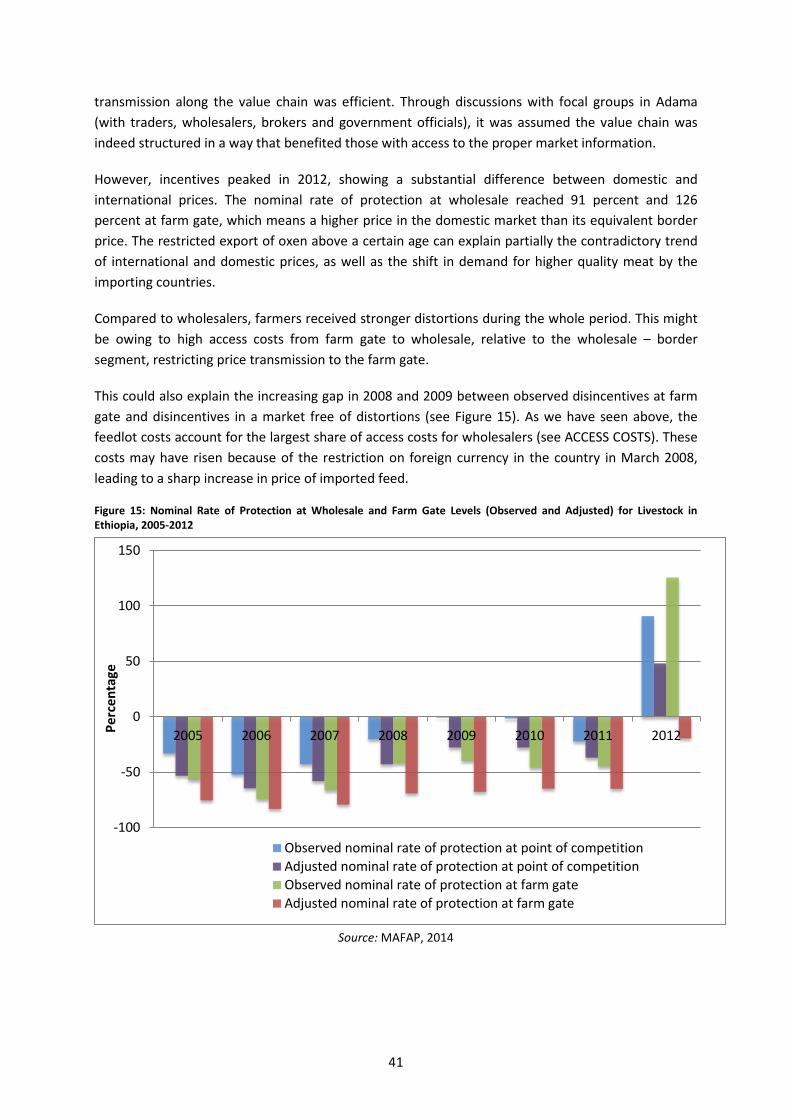
transmission along the value chain was efficient. Through discussions with focal groups in Adama (with traders, wholesalers, brokers and government officials), it was assumed the value chain was indeed structured in a way that benefited those with access to the proper market information.
However, incentives peaked in 2012, showing a substantial difference between domestic and international prices. The nominal rate of protection at wholesale reached 91 percent and 126 percent at farm gate, which means a higher price in the domestic market than its equivalent border price. The restricted export of oxen above a certain age can explain partially the contradictory trend of international and domestic prices, as well as the shift in demand for higher quality meat by the importing countries.
Compared to wholesalers, farmers received stronger distortions during the whole period. This might be owing to high access costs from farm gate to wholesale, relative to the wholesale – border segment, restricting price transmission to the farm gate.
This could also explain the increasing gap in 2008 and 2009 between observed disincentives at farm gate and disincentives in a market free of distortions (see Figure 15). As we have seen above, the feedlot costs account for the largest share of access costs for wholesalers (see ACCESS COSTS). These costs may have risen because of the restriction on foreign currency in the country in March 2008, leading to a sharp increase in price of imported feed.
Figure 15: Nominal Rate of Protection at Wholesale and Farm Gate Levels (Observed and Adjusted) for Livestock in Ethiopia, 2005-2012
Source: MAFAP, 2014
-100
-50
0
50
100
150
2005 2006 2007 2008 2009 2010 2011 2012Perc
enta
ge
Observed nominal rate of protection at point of competitionAdjusted nominal rate of protection at point of competitionObserved nominal rate of protection at farm gateAdjusted nominal rate of protection at farm gate
41

Inefficiencies are reported from the exchange rate misalignments and access costs gaps. The Market Development Gap (MDG), which is the sum of the three main inefficiencies, was negative throughout the entire period (see Figure 16). Thus, market distortions had a negative impact on the value chain.
Over the period, the difference between observed and adjusted access costs increased in both segments. The segment from farm gate to Adama increased the most, widening the overall Market Development Gap. The feedlot costs rose sharply owing to transport cost inflation, rising costs for imported feed and additional levies starting in 2009.
Figure 16: Market Development Gaps for Livestock in Ethiopia (ETB/tonne), 2005 - 2012
Sources: MAFAP, 2014
-564 -578 -587 -603 -720 -738 -755 -766
-415 -420 -568 -770
-1,085
-201
-1,505 -1,805
-2,108 -2,603 -2,737 -2,816
-3,761 -3,062
-4,042 -3,705
-1,130 -1,605
-1,582 -1,443
-1,955
-2,123
-1,782 -1,134
-4,500
-4,000
-3,500
-3,000
-2,500
-2,000
-1,500
-1,000
-500
0
2005 2006 2007 2008 2009 2010 2011 2012
ETB/
Tonn
e
Exchange rate policy gap Total market development gapAccess costs gap to farm gate Access costs gap to point of competition
42
6. RECOMMENDATIONS Further work on certain policy areas could lead the sector to be more competitive and offer higher quality meat. One major issue farmers and traders are facing nowadays is the shift of main importing countries for cheaper and safer livestock, such as from Australia and Brazil.
Further work would be needed to dig into the following issues:
• Our results show that there are disincentives for wholesalers and producers in the observed domain for the analysed period.
• However, the level of disincentives relative to other commodities in the country is rather low, meaning that the domestic market is closely linked to the international market (see Technical notes series, MAFAP 2014).
• In the adjusted domain, disincentives are considerable and arise from: (i) an overvalued exchange rate; (ii) high feed and transport costs facing the feedlot operator; and (iii) high margins of traders over producers. This indicates that the future of the sector may not be promising without appropriate policy action.
• The official trade value of live animal exports increased from USD 0.3 million in 2005 to USD 186 million in 2012, owing mainly to the increasing international demand for meat. Despite this promising achievement, the sector faces daunting challenges. There is no systematically recorded data or information system that would be reliable for a sector performance analysis. The cost of feeding is increasing over time, leaving agents to face disincentives and high economic risks.
43

7. CONCLUSION
MAIN MESSAGE Cattle are the most important source of livelihood for millions of Ethiopians. It is a source of income through the sale of live animals, hides and skins. In the lowlands, where a pastoral management system is practiced, cattle are the principal source of subsistence providing milk and cash to cover family expenses for food grains and other essential consumer goods. Cattle serve as a means to store wealth for those beyond the reach of banking systems, determining the social status within the community, and hedge against risk and disaster. Livestock play an important role in improving food security and alleviating poverty of the country.
Despite the importance of livestock sector and its contribution to livelihoods, its performance has remained low in terms of production and productivity. Moreover, the sector has faced on average a disincentive environment both for producers and traders. Wholesalers have faced increasing access costs in their feedlots but have benefited from a good access to information from the international market. Farmers have been penalized from the lack of financial resources to add value to their cattle as well as lack of information on the price signal. Within the value chain, this has led to a high concentration of value addition at the wholesale level. Broader inputs for distribution and extension services could help to more evenly distribute value added. From this perspective, some improvements in the marketing chain and infrastructure have been made in the recent years to tackle this major challenge.
In 2012, both farmers and wholesalers benefitted from incentive to trade their cattle. Indeed, facing a shifting from Ethiopian bulls to cheaper ones by the importing countries, exporters have experienced very depressed international prices (-33 percent between 2011 and 2012 prices). Indeed, due to several underlying factors, such as recurrent drought, shortage of feed, low body weight and lack of adequate animal health services, farmers are facing quality issues to meet export standards.
LIMITATIONS This study is based on secondary data gathered from official government statistic sources like the CSA, MOT, MOA, ERCA, and also from FAOSTAT. However, data inconsistency and unreliability (especially regarding the international price) have made the work more cumbersome.
FURTHER INVESTIGATION AND RESEARCH Additional investigation is needed on:
• Animal feed sources and prices (current and future perspectives); • How to build reliable data on livestock production, consumption, exports volumes,
destination and prices; • Detailed analysis of the livestock export market for Ethiopia and at the global level; • Assess the impact of the development of live cattle exports on the value chains of other
products of higher value (meat, skins and leather markets); • Government analysis of the improvement of the certification process and tracking origin
system that would reduce the costs and bring the illegal traders in the formal business.
45

BIBLIOGRAPHY Addis Ababa Chamber of Commerce. 2008. Livestock resource potentials: Constraints and opportunities for intervention by the private sector. PSD – Hub publication No.2. Arend Jan Nell (2006). Quick scan of the livestock and meat sector in Ethiopia Issues and opportunities. Wageningen, the Netherlands Aklilu, Y. (2008). Livestock Marketing in Kenya and Ethiopia: A Review of Policies and Practice. Feinstein International Center, Addis Ababa. CSA (Central Statistical Agency) (2000-2012). Federal Democratic Republic of Ethiopia. Central Statistical Agency. Statistical Abstract. CSA, Addis Ababa, Ethiopia. CSA (Central Statistical Agency). 2012. Livestock and livestock characteristics 2008–09 (Private peasant holdings). Statistical Bulletin No. 446. Addis Ababa, Ethiopia: CSA. FAOSTAT. 2012. http://faostat.fao.org . Farmer Elisabeth (2010). End Market Analysis of Ethiopian Livestock and meat. USAID, microreport #164, 2010. Getachew Legese, Hailemariam Teklewold, Dawit Alemu and Asfaw Negassa (2008). Live animal and meat export value chains for selected areas in Ethiopia. Constraints and opportunities for enhancing meat exports. Improving Market Opportunities. Discussion Paper No. 12. ILRI GebreMariam, S., Amare, S., Baker, D., Solomon, A. and Davies, R. (2013). Study of the Ethiopian live cattle and beef value chain. ILRI Discussion Paper 23. Nairobi: International Livestock Research Institute. Gebremedhin Berhanu, Hoekstra Dirk and Jemaneh Samson (2007). Heading towards commercialization?. Project on Improving Productivity and Market Success (IPMS) of Ethiopian farmers project. International Livestock Research Institute, Ethiopia.
International Monetary Fund (IMF) (2013). IMF Country Report (No. 13/308) for Federal Democratic Republic of Ethiopia, pp.42.
Leta S., Mesele F. (2014). Spatial analysis of cattle and shoat population in Ethiopia: growth trend, distribution and market access.
Little, P. 1996. Livestock trade and food security in Kenya/Somalia border lands. Binghamton, New York: Institute for Development Anthropology. Ministry of Agriculture and Rural Development (MOARD) (2008). Study on Livestock Sector Development Master Plan: Phase 1 Report. Volume H-Animal Nutrition, November 2008. Mulugeta, E., B. Gebremedhin, D. Hoekstra and M. Jabbar. 2008. Analysis of the Ethio–Sudan Negassa Asfaw and Jabbar Mohammad (2007). Commercial Offtake of Cattle under Smallholder Mixed Crop-Livestock Production System in Ethiopia, its Determinants and Implications for Improving Live Animal Supply for Export Abattoirs. International Livestock Research Institute, August 2007. Draft work
46

Cross-Border Cattle Trade: The case of Amhara Regional State. International Livestock Research Institute Working Paper 4. Nairobi: ILRI. Shawel Betru and H. Kawashima (2005). Pattern and determinants of meat consumption in urban and rural Ethiopia. Graduate School of Agriculture and Life Sciences, the University of Tokyo, Bunkyo_ku Yayoi 1-1-1, Japan. Solomon A., Workalemahu A., Jabbar M.A., Ahmed M.M., Hurissa B. (2003). Livestock Marketing in Ethiopia: A review of structure, performance and development initiatives. Socio-economic and Policy Research Working Paper 52. International Livestock Research Institute (ILRI), Nairobi, Kenya. 35 pp
Pavanello, S. 2010. Livestock marketing in Kenya-Ethiopia border areas: A baseline study. HPG working paper http://www.odi.org.uk/hpg/. USAID, 2013. Agricultural Growth Program – Livestock Market Development. End Market Analysis for Meat/Live animals, Leather and Leather Products, Dairy products Value Chains. Expanding Livestock Makets for the Small-Holder Producers. Prepared by AGP-Livestock Market Development Project. April 5, 2013. Yacob Aklilu, Patrick Irungu and Alemayehu Reda (2002). An Audit of the Livestock Marketing Status in Kenya, Ethiopia and Sudan Vol. 1. Organization of African Unity/Interafrican Bureau for Animal Resources, Nairobi, Kenya
47

ANNEX I: Data and Calculations Used in the Analysis Name of product LIVE CATTLE
International currency USD
Local currency ETB
Year 2005 2006 2007 2008 2009 2010 2011 2012
DATA Unit Symbol trade status x x x x x x x x
Benchmark price
Observed USD/head Pb(int$)
653
917
860
736
808
823
810
540 Adjusted USD/head Pba
Exchange rate
Observed ETB/USD ERo 8.67
8.74
9.21
9.80
12.10
12.89
16.90
17.60
Adjusted ETB/USD ERa 10.40
10.49
11.05
11.76
14.52
15.47
19.10
19.70
Access costs border - point of competition
Observed ETB/head ACowh
1,698
1,754
1,921
2,004
2,573
2,680
2,760
2,900
Adjusted ETB/head ACawh
1,134
1,176
1,334
1,401
1,853
1,942
2,005
2,134
Domestic price at point of competition ETB/head Pdwh
2,650
3,000
3,430
4,150
7,150
7,800
8,500
12,600 Access costs point of competition - farm gate
Observed ETB/head ACofg
1,159
1,184
1,561
1,997
2,862
2,233
3,896
4,546
Adjusted ETB/head ACafg
744
764
993
1,227
1,777
2,032
2,391
2,741
Domestic price at farm gate ETB/head Pdfg
1,208
1,299
1,494
1,863
2,616
3,082
3,884
4,644 Externalities associated with production ETB/head E Budget and other product related transfers ETB/head BOT Quantity conversion factor (border - point of competition) Fraction QTwh Quality conversion factor (border - point of competition) Fraction QLwh Quantity conversion factor (point of competition - farm gate) Fraction QTfg Quality conversion factor (point of competition - farm gate) Fraction QLfg
CALCULATED PRICES Unit Symbol 2005 2006 2007 2008 2009 2010 2011 2012
48
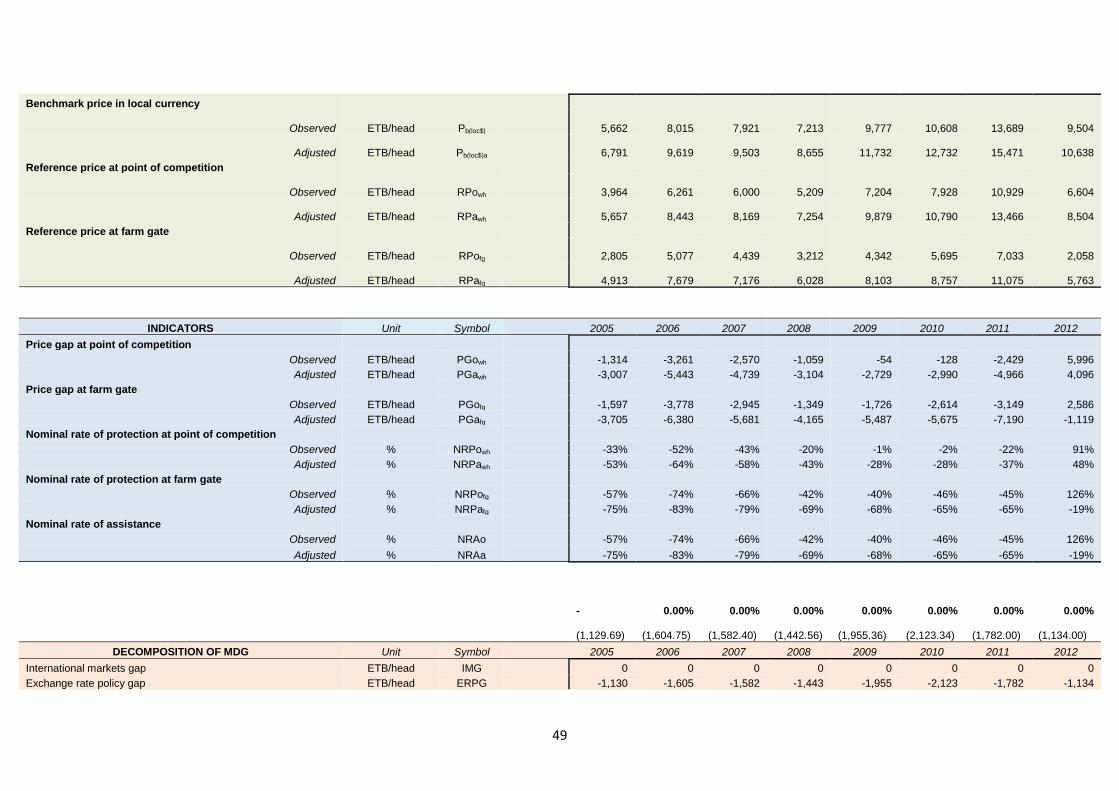
Benchmark price in local currency
Observed ETB/head Pb(loc$)
5,662
8,015
7,921
7,213
9,777
10,608
13,689
9,504
Adjusted ETB/head Pb(loc$)a
6,791
9,619
9,503
8,655
11,732
12,732
15,471
10,638 Reference price at point of competition
Observed ETB/head RPowh
3,964
6,261
6,000
5,209
7,204
7,928
10,929
6,604
Adjusted ETB/head RPawh
5,657
8,443
8,169
7,254
9,879
10,790
13,466
8,504 Reference price at farm gate
Observed ETB/head RPofg
2,805
5,077
4,439
3,212
4,342
5,695
7,033
2,058
Adjusted ETB/head RPafg
4,913
7,679
7,176
6,028
8,103
8,757
11,075
5,763
INDICATORS Unit Symbol 2005 2006 2007 2008 2009 2010 2011 2012 Price gap at point of competition
Observed ETB/head PGowh -1,314 -3,261 -2,570 -1,059 -54 -128 -2,429 5,996 Adjusted ETB/head PGawh -3,007 -5,443 -4,739 -3,104 -2,729 -2,990 -4,966 4,096
Price gap at farm gate Observed ETB/head PGofg -1,597 -3,778 -2,945 -1,349 -1,726 -2,614 -3,149 2,586 Adjusted ETB/head PGafg -3,705 -6,380 -5,681 -4,165 -5,487 -5,675 -7,190 -1,119
Nominal rate of protection at point of competition Observed % NRPowh -33% -52% -43% -20% -1% -2% -22% 91% Adjusted % NRPawh -53% -64% -58% -43% -28% -28% -37% 48%
Nominal rate of protection at farm gate Observed % NRPofg -57% -74% -66% -42% -40% -46% -45% 126% Adjusted % NRPafg -75% -83% -79% -69% -68% -65% -65% -19%
Nominal rate of assistance Observed % NRAo -57% -74% -66% -42% -40% -46% -45% 126% Adjusted % NRAa -75% -83% -79% -69% -68% -65% -65% -19%
- 0.00% 0.00% 0.00% 0.00% 0.00% 0.00% 0.00%
(1,129.69)
(1,604.75)
(1,582.40)
(1,442.56)
(1,955.36)
(2,123.34)
(1,782.00)
(1,134.00)
DECOMPOSITION OF MDG Unit Symbol 2005 2006 2007 2008 2009 2010 2011 2012 International markets gap ETB/head IMG 0 0 0 0 0 0 0 0 Exchange rate policy gap ETB/head ERPG -1,130 -1,605 -1,582 -1,443 -1,955 -2,123 -1,782 -1,134
49

Access costs gap to point of competition ETB/head ACGwh -564 -578 -587 -603 -720 -738 -755 -766 Access costs gap to farm gate ETB/head ACGfg -415 -420 -568 -770 -1,085 -201 -1,505 -1,805 Externality gap ETB/head EG 0 0 0 0 0 0 0 0 Total market development gap ETB/head MDG -2,108 -2,603 -2,737 -2,816 -3,761 -3,062 -4,042 -3,705 Market development gap as share of farm gate price % MDG -175% -200% -183% -151% -144% -99% -104% -80% Market development gap as share of adjusted reference price at farm gate % MDG -43% -34% -38% -47% -46% -35% -36% -64%
50
I4529E/1/04.15