Embed Size (px)
Citation preview
Journal of Food Engineering 119 (2013) 744–749
Contents lists available at SciVerse ScienceDirect
Journal of Food Engineering
journal homepage: www.elsevier .com/locate / j foodeng
Analysis of pork adulteration in minced mutton using electronic nose ofmetal oxide sensors
0260-8774/$ - see front matter � 2013 Elsevier Ltd. All rights reserved.http://dx.doi.org/10.1016/j.jfoodeng.2013.07.004
⇑ Corresponding author. Tel.: +86 571 88982178; fax: +86 571 88982191.E-mail address: [email protected] (J. Wang).
Xiaojing Tian a,b, Jun Wang a,⇑, Shaoqing Cui a
a Department of Biosystems Engineering, Zhejiang University, 886 Yuhangtang Road, Hangzhou 300058, Chinab College of Life Science and Engineering, Northwest University for Nationalities, Lanzhou 730024, China
a r t i c l e i n f o a b s t r a c t
Article history:Received 16 January 2013Received in revised form 4 April 2013Accepted 8 July 2013Available online 15 July 2013
Keywords:Electronic nosePattern recognitionMeat adulterationFeature extraction
The aims were to detect the adulteration of mutton by applying traditional methods (pH and color eval-uation) and the E-nose, to build a model for prediction of the content of pork in minced mutton. An E-nose of metal oxide sensors was used for the collection of volatiles presented in the samples. Featureextraction methods, Principle component analysis (PCA), loading analysis and Stepwise linear discrimi-nant analysis (step-LDA) were employed to optimize the data matrix. The results were evaluated by dis-criminant analysis methods, finding that step-LDA was the most effective method. Then Canonicaldiscriminant analysis (CDA) was used as pattern recognition techniques for the authentication of meat.Partial least square analysis (PLS), Multiple Linear Regression (MLR) and Back propagation neural net-work (BPNN) were used to build a predictive model for the pork content in minced mutton. The modelbuilt by BPNN could predict the adulteration more precisely than PLS and MLR do.
� 2013 Elsevier Ltd. All rights reserved.
1. Introduction
Adulteration of meat, involving the replacement of selectedbreeds, particular geographical region or particular traditionalmethod with other cheaper animal proteins and even none meatproteins (soy proteins), has attracted increasing attention. Thechoice of one meat over another can reflect the lifestyle, religion,diet and health concerns. For example, lard, pork and meats not rit-ually slaughtered are forbidden for Muslims and Jews (Bonne andVerbeke, 2008). However, cheaper animal protein, take pork asan example, has been fraudulently used to substitute more expen-sive animal proteins, like mutton and beef. It requires reliablemethods for the authentication of meat adulteration.
Techniques that have been used in the detection of meat adul-teration include molecular biology-based methods, enzyme linkedimmunological methods, chromatographic methods and spectros-copy methods. Molecular biology-based methods, such as poly-merase chain reaction (PCR), real-time PCR (Rodriguez et al.,2005), restriction fragment length polymorphism analysis (RFLP)(Chen et al., 2010), multiplex PCR (Ghovvati et al., 2009) and spe-cies–specific PCR (Man et al., 2007) have been used in the identifi-cation of species and adulteration of meat. Enzyme linkedimmunological methods used in meat and meat products had beenreviewed by Asensio et al. (2008). These methods are the most spe-cific and sensitive for species identification. However, they require
expensive laboratory equipments, high degree technical expertiseand also suffer from higher false-positive rates. Chromatographicmethods, such as gas chromatography mass spectrometer (GC/MS), high performance liquid chromatography (HPLC) have beenreported in the differentiation (Nurjuliana et al., 2011) and adulte-ration of meat (Chou et al., 2007). The requirement for tediousextractions and long analysis times significantly limited the wide-spread use of the chromatographic methods. For spectroscopymethods, mid-infrared spectroscopy combined with soft indepen-dent modeling of class analogies (SIMCA), visible (VIS) and nearinfrared reflectance spectroscopy (NIRS), Nuclear Magnetic Reso-nance (NMR) spectroscopy and Fourier transform infrared (FTIR)spectroscopy were shown to be useful for meat in the detectionand quantification of adulterants (Meza-Marquez et al., 2010; Roh-man et al., 2011), origin traceability (Sacco et al., 2005; Zhang et al.,2008), authentication and identification of meat muscle species(Cozzolino and Murray, 2004). However, the complex analysis oftesting data requires specialized software and algorithms and itis difficult for ordinary inspectors to master it. However, therewere few studies on meat adulteration in the view of aroma ofthe sample.
Electronic noses are devices with several advantages over othertechniques for analyzing food aroma, such as the small amount ofsample required, speed, simplicity, high sensitivity and good corre-lation with data from sensory analyses. E-nose is comprised of asensor array with broad and partly overlapping selectivity for themeasurement of volatile compounds within the headspace on asample, combined with computerized multivariate statistical data
X. Tian et al. / Journal of Food Engineering 119 (2013) 744–749 745
processing tools to give an odor fingerprint of the sample. Althoughthis technique does not allow the identification of compounds andhas a high detection limit in comparison with GC–MS, it has beensuccessfully used in processing monitoring, shelf-life investigation,freshness evaluation and authenticity assessment in a wide rangeof food products, including meat products. In the previous workson adulteration detection, the electronic nose was shown to beable to discriminate adulteration of oil (Cosio et al., 2006; Haddiet al., 2011; Hai and Wang, 2006; Man et al., 2005), wines (Penzaand Cassano, 2004) and meat. For meat discrimination, studieswere done on freshness evaluation (Musatov et al., 2010), process-ing methods evaluation (Limbo et al., 2010), meat products differ-entiation and authenticity assessment (Nurjuliana et al., 2011). Forthe identification and differentiation of pork for halal authentica-tion, pork and pork sausage from beef, mutton and chicken meatwere studied by E-nose (García et al., 2006).
However, most of the research on meat adulteration is mainlyfocused on the differentiation and classification of species of meat,with few studies performed on aroma differentiation. In addition,for most studies on authentication using E-nose, data used foranalysis were the sensor conductance at a particular time, forexample, 15 s, 30 s, 42 s, 45 s, 60 s, etc. (Gómez et al., 2006,2007; Yu and Wang, 2007). In this study, sensors conductance atdifferent collections times were analyzed and feature extractionmethods were used to optimize data set.
The potential use of E-nose for detection of pork adulteration inminced mutton was investigated in this work. The objectives ofthis study were: (1) to investigate the use of an E-nose combinedwith pattern recognition methods to detect the presence of porkin minced mutton, (2) to build a model for the prediction of porkcontent in minced mutton, (3) to optimize the feature extractionmethods, and (4) to develop a rapid method for detection of porkadulterated in minced mutton.
2. Materials and methods
2.1. Meat samples
All the mutton samples detected by E-nose and used for deter-mination of physical properties were obtained from logistics centerfor agricultural products of Hangzhou, and the pork samples wereobtained from Wal-Mart Stores in Hangzhou, China, at the day theywere slaughtered. Before experimental process, fat and connectivetissue were removed, and the meat samples were frozen at �18 �C.
The adulterated mutton was made by blending the frozen mut-ton with pork at levels of 0%, 20%, 40%, 60%, 80% and 100% byweight, respectively. The adulterated meat was minced for 2 minby mincer. The mixed meat was brought to room temperature be-fore detection.
2.2. Physiochemical analysis
2.2.1. pH measurementpH was measured by a pH meter (PB-10, Sartorius, Germany)
using the method of GB/T9695.5 (2008). The experiment was com-pleted by three duplicates for each sample. The pH was expressedas the mean of three replicates.
2.2.2. Color analysisThree samples from each treatment were randomly selected to
evaluate their color. Color (CIE tristimulus system, L, a and b val-ues) of the minced meat samples was measured using a MinoltaCM-700d/600d spectrophotometer (Konica Minolta Sensing, Inc.,Osaka, Japan) with 10� standard observer and D65 daylight
illuminant and calibrated with a white plate. The means were usedfor analysis.
2.3. The electronic nose (E-nose)
A PEN2 E-nose (portable electronic nose II, Airsense Corpora-tion, Germany) was used to obtain the chemical fingerprint ofthe samples. The basic system, which has been described in previ-ous researches (Hai and Wang, 2006; Zhang et al., 2007), consistedof a sampling apparatus, a detector unit containing the sensor ar-ray and pattern recognition software (Win Muster v.1.6) for datarecording and processing. The sensor array was composed of 10different metal oxide sensors positioned into a small chamber.Each sensor has a certain degree of affinity towards specific chem-ical or volatile compounds, and the nomenclature and characteris-tics of the sensors used are as follows: W1C (S1), sensitive toaromatics; W5S (S2), sensitive to nitrogen oxides; W3C (S3), sensi-tive to ammonia, aromatic molecules; W6S (S4), sensitive tohydrogen; W5C (S5), sensitive to methane, propane, and aliphaticnon-polar molecules; W1S (S6), sensitive to methane; W1W (S7),sensitive to sulfur-containing organics; W2S (S8), sensitive tobroad alcohols; W2W (S9), sensitive to aromatics, sulfur- and chlo-rine-containing organics; W3S (S10), sensitive to methane andaliphatic.
The experimental conditions for E-nose are given as follows:10 g of the minced mixed meat was placed in a beaker of 250 mlat the temperature of 25 �C ± 3 �C, and the beaker was sealed byplastic for a headspace generation time of 30 min. The headspacegeneration was carried out to increase the volatile compoundsfrom the meat sample. Before one sample was detected by E-nose,the sensors were cleaned with the flow of fresh dry air, so that thesample can be tested. Thereafter, the sensors were exposed to sam-ple volatiles and the changes in sensors’ responses were acquiredby the data acquisition system (Winmuster). During the samplingprocess, the sample gas was transferred into the sensor chamberat a flow rate of 200 ml min�1 and the collection time was 80 s atan interval of 1 s.
2.4. Optimization of sensor array and signal processing
Containing 10 sensors with different sensitivity, the E-nosegives a data set of 800 (10 sensors � 80 s of detecting time) foreach, with a total of 120 samples. The multidimensional signalsof the E-nose required some data pretreatment before statisticalanalysis was performed. Feature extraction and selection was doneby method of Stepwise discriminant analysis (Step-LDA), Principlecomponent analysis (PCA) and loading analysis, the effects werereviewed by comparison with the original data and data set con-taining one particular time using three discriminant analysismethods.
The ability of E-nose in identification of adulteration was ana-lyzed by multivariate data analysis. As a supervised method,Canonical discriminant analysis (CDA) and Bayes discriminantanalysis (BDA) were used for data visualization and identificationof adulteration according to the content of pork. Partial leastsquare analysis (PLS), using cross-validation, was performed tostudy the predictive capacity of E-nose for the content of pork Mul-tiple Linear Regression (MLR) is one kind of statistical techniquethat use several explanatory variables to predict the outcome ofa response variable. The goal of MLR is to model the relationshipbetween the E-nose signals and the content of pork. The model cre-ates a relationship in the form of a straight line (linear) that bestapproximates all the individual data points. Back propagation neu-ral network (BPNN), famous for its finer and more complex classi-fications, a commonly employed and most intensely studied neuralnetwork, was employed to study the predictive capacity of E-nose
746 X. Tian et al. / Journal of Food Engineering 119 (2013) 744–749
for the content of pork. The predictive capacity of these threemethods was compared to find the best predictive model.
For data analysis, the SAS version 8 (SAS Institute Inc., Gary,USA) was used.
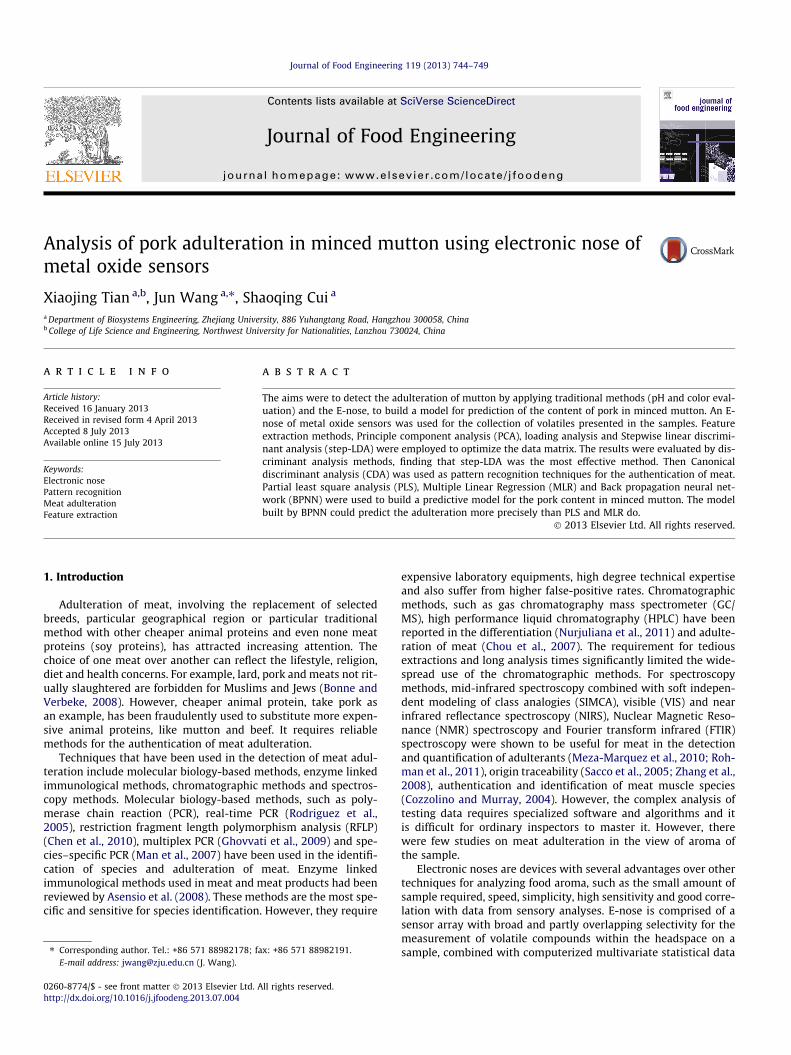
Fig. 2. Color of the minced mutton adulterated with different content of pork.
3. Results and discussion
3.1. Physical properties of minced samples
The consumption of glycogen before one animal was slaugh-tered would lead to higher final pH, which causes darker musclecolor. The pH of meat could reflect the freshness of meat and alsoaffect the color of meat. The color of meat is an important index ofeating quality. It is determined by the color and luster of musclesand fat, and varies with the specie, age and gender of the animal.These physical properties of meat might be useful in the adultera-tion detection of meat.
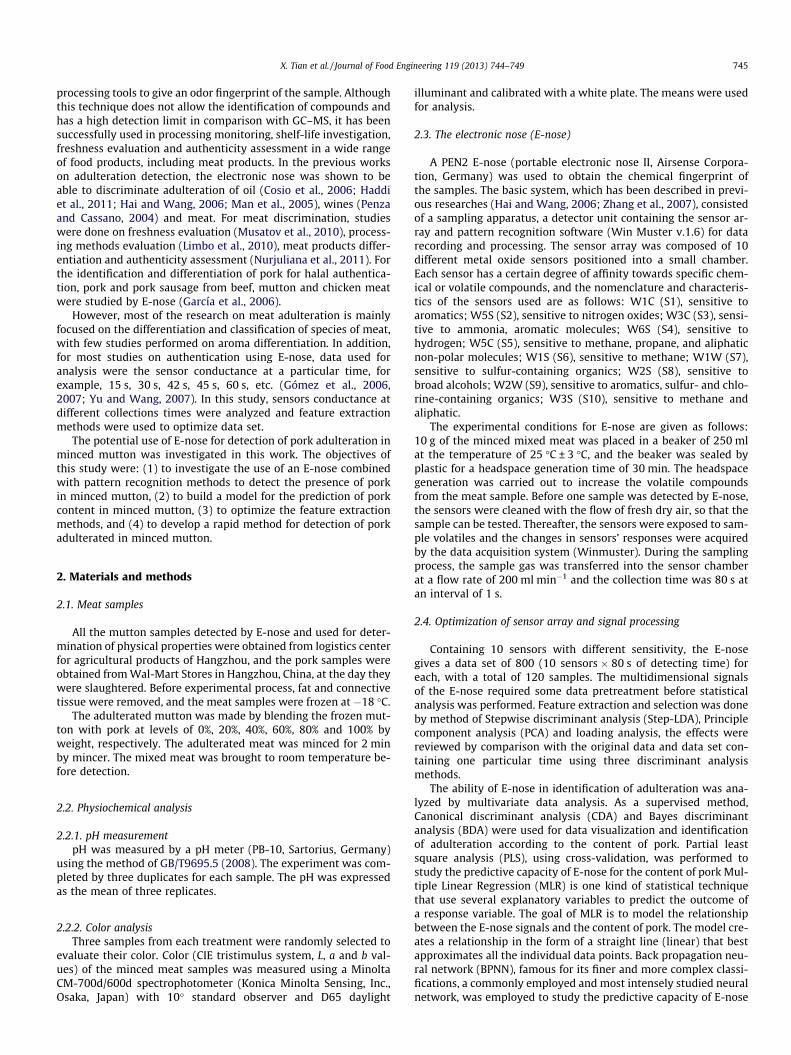
With the help of pH meter and spectrophotometer, these phys-ical parameters can be digitalized, without the subjective influenceof sensory evaluation member. As shown in Figs. 1 and 2, the pH ofmutton was higher than that of pork. For higher content of pork,the color of meat was brighter, the value of lightness increasedwith the content of pork adulterated. This is in accordance withthe color of meat by Nan (2003).
3.2. Sensor array response to meat odor
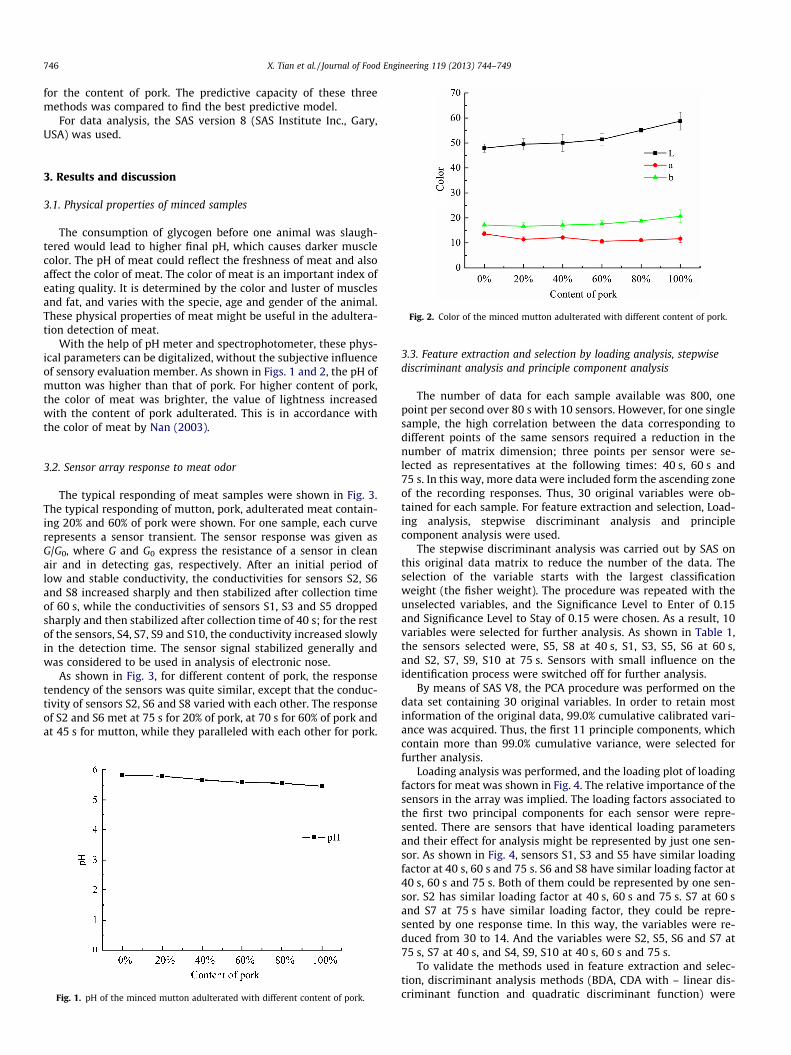
The typical responding of meat samples were shown in Fig. 3.The typical responding of mutton, pork, adulterated meat contain-ing 20% and 60% of pork were shown. For one sample, each curverepresents a sensor transient. The sensor response was given asG/G0, where G and G0 express the resistance of a sensor in cleanair and in detecting gas, respectively. After an initial period oflow and stable conductivity, the conductivities for sensors S2, S6and S8 increased sharply and then stabilized after collection timeof 60 s, while the conductivities of sensors S1, S3 and S5 droppedsharply and then stabilized after collection time of 40 s; for the restof the sensors, S4, S7, S9 and S10, the conductivity increased slowlyin the detection time. The sensor signal stabilized generally andwas considered to be used in analysis of electronic nose.
As shown in Fig. 3, for different content of pork, the responsetendency of the sensors was quite similar, except that the conduc-tivity of sensors S2, S6 and S8 varied with each other. The responseof S2 and S6 met at 75 s for 20% of pork, at 70 s for 60% of pork andat 45 s for mutton, while they paralleled with each other for pork.
Fig. 1. pH of the minced mutton adulterated with different content of pork.
3.3. Feature extraction and selection by loading analysis, stepwisediscriminant analysis and principle component analysis
The number of data for each sample available was 800, onepoint per second over 80 s with 10 sensors. However, for one singlesample, the high correlation between the data corresponding todifferent points of the same sensors required a reduction in thenumber of matrix dimension; three points per sensor were se-lected as representatives at the following times: 40 s, 60 s and75 s. In this way, more data were included form the ascending zoneof the recording responses. Thus, 30 original variables were ob-tained for each sample. For feature extraction and selection, Load-ing analysis, stepwise discriminant analysis and principlecomponent analysis were used.
The stepwise discriminant analysis was carried out by SAS onthis original data matrix to reduce the number of the data. Theselection of the variable starts with the largest classificationweight (the fisher weight). The procedure was repeated with theunselected variables, and the Significance Level to Enter of 0.15and Significance Level to Stay of 0.15 were chosen. As a result, 10variables were selected for further analysis. As shown in Table 1,the sensors selected were, S5, S8 at 40 s, S1, S3, S5, S6 at 60 s,and S2, S7, S9, S10 at 75 s. Sensors with small influence on theidentification process were switched off for further analysis.
By means of SAS V8, the PCA procedure was performed on thedata set containing 30 original variables. In order to retain mostinformation of the original data, 99.0% cumulative calibrated vari-ance was acquired. Thus, the first 11 principle components, whichcontain more than 99.0% cumulative variance, were selected forfurther analysis.
Loading analysis was performed, and the loading plot of loadingfactors for meat was shown in Fig. 4. The relative importance of thesensors in the array was implied. The loading factors associated tothe first two principal components for each sensor were repre-sented. There are sensors that have identical loading parametersand their effect for analysis might be represented by just one sen-sor. As shown in Fig. 4, sensors S1, S3 and S5 have similar loadingfactor at 40 s, 60 s and 75 s. S6 and S8 have similar loading factor at40 s, 60 s and 75 s. Both of them could be represented by one sen-sor. S2 has similar loading factor at 40 s, 60 s and 75 s. S7 at 60 sand S7 at 75 s have similar loading factor, they could be repre-sented by one response time. In this way, the variables were re-duced from 30 to 14. And the variables were S2, S5, S6 and S7 at75 s, S7 at 40 s, and S4, S9, S10 at 40 s, 60 s and 75 s.
To validate the methods used in feature extraction and selec-tion, discriminant analysis methods (BDA, CDA with – linear dis-criminant function and quadratic discriminant function) were
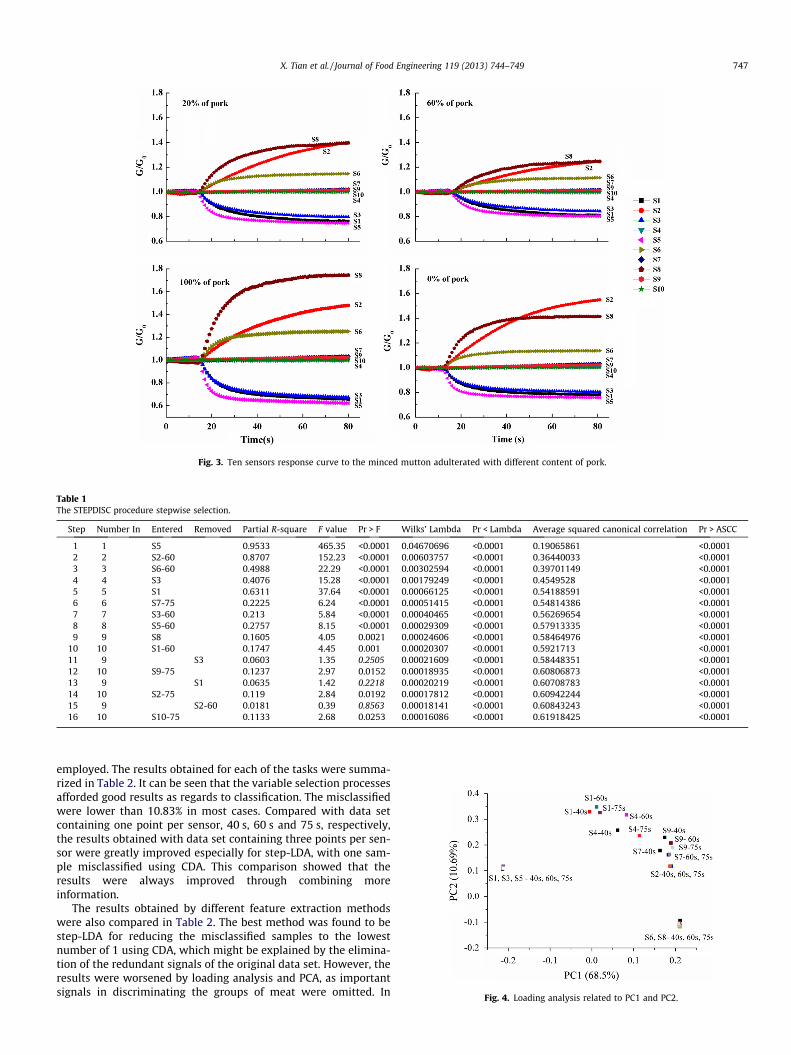
Fig. 3. Ten sensors response curve to the minced mutton adulterated with different content of pork.
Table 1The STEPDISC procedure stepwise selection.
Step Number In Entered Removed Partial R-square F value Pr > F Wilks’ Lambda Pr < Lambda Average squared canonical correlation Pr > ASCC
1 1 S5 0.9533 465.35 <0.0001 0.04670696 <0.0001 0.19065861 <0.00012 2 S2-60 0.8707 152.23 <0.0001 0.00603757 <0.0001 0.36440033 <0.00013 3 S6-60 0.4988 22.29 <0.0001 0.00302594 <0.0001 0.39701149 <0.00014 4 S3 0.4076 15.28 <0.0001 0.00179249 <0.0001 0.4549528 <0.00015 5 S1 0.6311 37.64 <0.0001 0.00066125 <0.0001 0.54188591 <0.00016 6 S7-75 0.2225 6.24 <0.0001 0.00051415 <0.0001 0.54814386 <0.00017 7 S3-60 0.213 5.84 <0.0001 0.00040465 <0.0001 0.56269654 <0.00018 8 S5-60 0.2757 8.15 <0.0001 0.00029309 <0.0001 0.57913335 <0.00019 9 S8 0.1605 4.05 0.0021 0.00024606 <0.0001 0.58464976 <0.0001
10 10 S1-60 0.1747 4.45 0.001 0.00020307 <0.0001 0.5921713 <0.000111 9 S3 0.0603 1.35 0.2505 0.00021609 <0.0001 0.58448351 <0.000112 10 S9-75 0.1237 2.97 0.0152 0.00018935 <0.0001 0.60806873 <0.000113 9 S1 0.0635 1.42 0.2218 0.00020219 <0.0001 0.60708783 <0.000114 10 S2-75 0.119 2.84 0.0192 0.00017812 <0.0001 0.60942244 <0.000115 9 S2-60 0.0181 0.39 0.8563 0.00018141 <0.0001 0.60843243 <0.000116 10 S10-75 0.1133 2.68 0.0253 0.00016086 <0.0001 0.61918425 <0.0001
Fig. 4. Loading analysis related to PC1 and PC2.
X. Tian et al. / Journal of Food Engineering 119 (2013) 744–749 747
employed. The results obtained for each of the tasks were summa-rized in Table 2. It can be seen that the variable selection processesafforded good results as regards to classification. The misclassifiedwere lower than 10.83% in most cases. Compared with data setcontaining one point per sensor, 40 s, 60 s and 75 s, respectively,the results obtained with data set containing three points per sen-sor were greatly improved especially for step-LDA, with one sam-ple misclassified using CDA. This comparison showed that theresults were always improved through combining moreinformation.
The results obtained by different feature extraction methodswere also compared in Table 2. The best method was found to bestep-LDA for reducing the misclassified samples to the lowestnumber of 1 using CDA, which might be explained by the elimina-tion of the redundant signals of the original data set. However, theresults were worsened by loading analysis and PCA, as importantsignals in discriminating the groups of meat were omitted. In
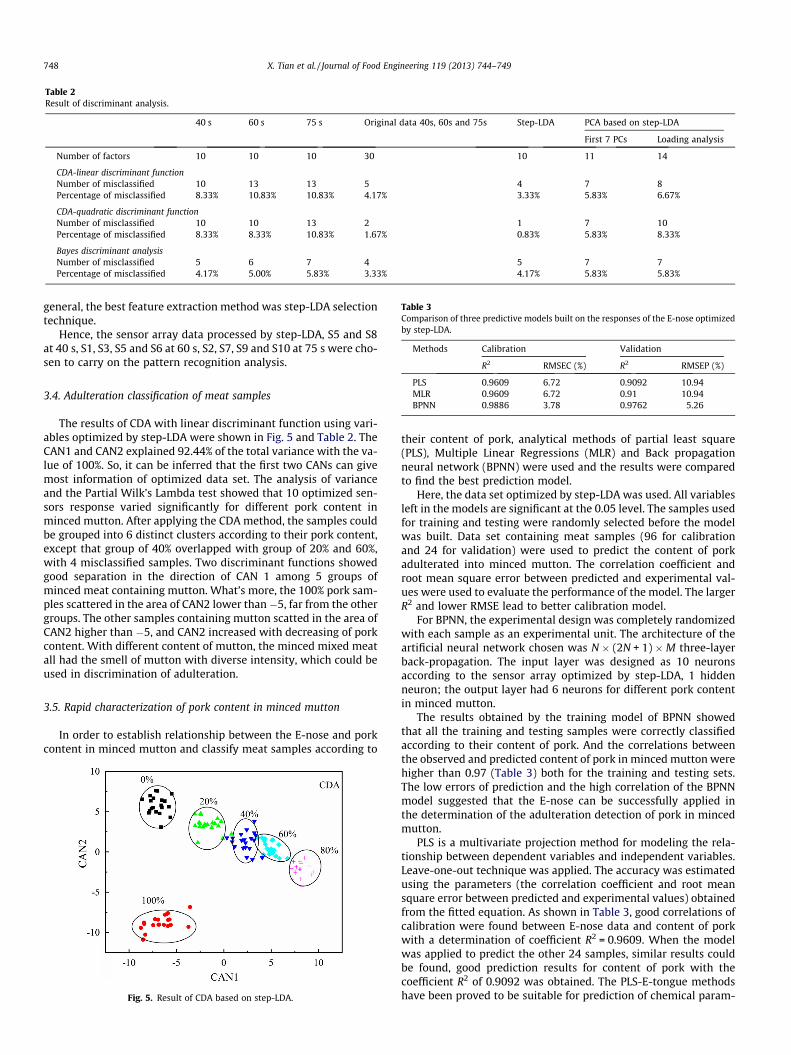
Table 2Result of discriminant analysis.
40 s 60 s 75 s Original data 40s, 60s and 75s Step-LDA PCA based on step-LDA
First 7 PCs Loading analysis
Number of factors 10 10 10 30 10 11 14
CDA-linear discriminant functionNumber of misclassified 10 13 13 5 4 7 8Percentage of misclassified 8.33% 10.83% 10.83% 4.17% 3.33% 5.83% 6.67%
CDA-quadratic discriminant functionNumber of misclassified 10 10 13 2 1 7 10Percentage of misclassified 8.33% 8.33% 10.83% 1.67% 0.83% 5.83% 8.33%
Bayes discriminant analysisNumber of misclassified 5 6 7 4 5 7 7Percentage of misclassified 4.17% 5.00% 5.83% 3.33% 4.17% 5.83% 5.83%
Table 3Comparison of three predictive models built on the responses of the E-nose optimizedby step-LDA.
Methods Calibration Validation
R2 RMSEC (%) R2 RMSEP (%)
748 X. Tian et al. / Journal of Food Engineering 119 (2013) 744–749
general, the best feature extraction method was step-LDA selectiontechnique.
Hence, the sensor array data processed by step-LDA, S5 and S8at 40 s, S1, S3, S5 and S6 at 60 s, S2, S7, S9 and S10 at 75 s were cho-sen to carry on the pattern recognition analysis.
PLS 0.9609 6.72 0.9092 10.94MLR 0.9609 6.72 0.91 10.94BPNN 0.9886 3.78 0.9762 5.26
3.4. Adulteration classification of meat samples
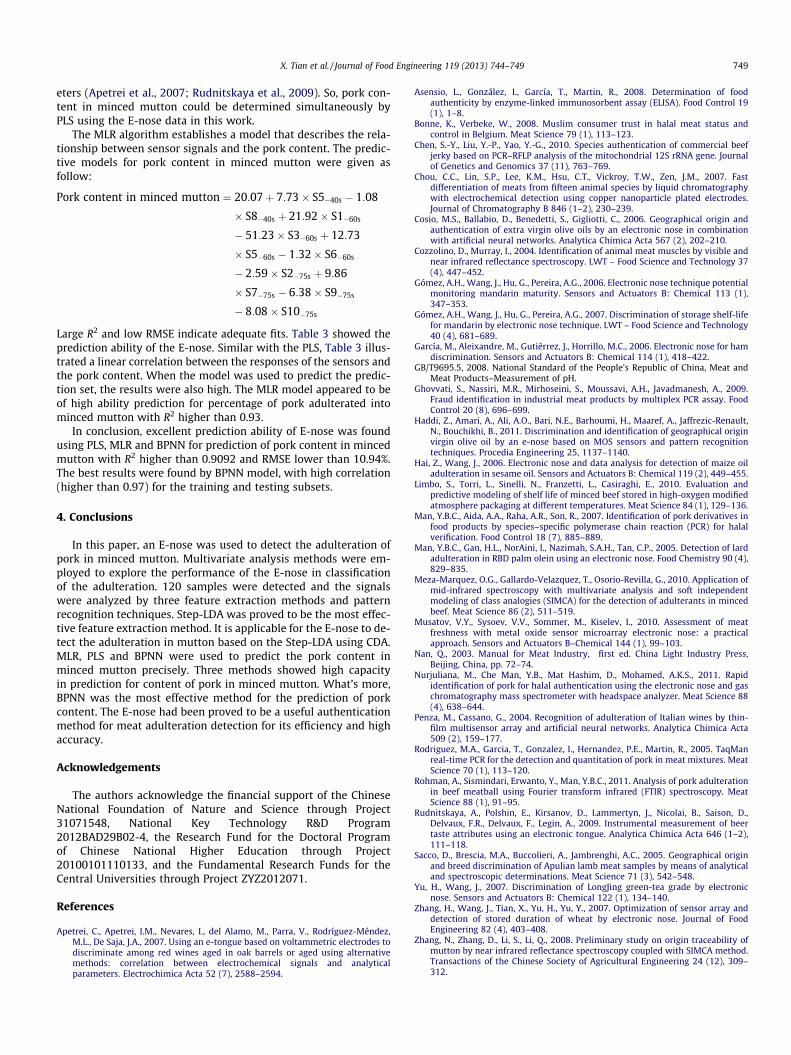
The results of CDA with linear discriminant function using vari-ables optimized by step-LDA were shown in Fig. 5 and Table 2. TheCAN1 and CAN2 explained 92.44% of the total variance with the va-lue of 100%. So, it can be inferred that the first two CANs can givemost information of optimized data set. The analysis of varianceand the Partial Wilk’s Lambda test showed that 10 optimized sen-sors response varied significantly for different pork content inminced mutton. After applying the CDA method, the samples couldbe grouped into 6 distinct clusters according to their pork content,except that group of 40% overlapped with group of 20% and 60%,with 4 misclassified samples. Two discriminant functions showedgood separation in the direction of CAN 1 among 5 groups ofminced meat containing mutton. What’s more, the 100% pork sam-ples scattered in the area of CAN2 lower than�5, far from the othergroups. The other samples containing mutton scatted in the area ofCAN2 higher than �5, and CAN2 increased with decreasing of porkcontent. With different content of mutton, the minced mixed meatall had the smell of mutton with diverse intensity, which could beused in discrimination of adulteration.
3.5. Rapid characterization of pork content in minced mutton
In order to establish relationship between the E-nose and porkcontent in minced mutton and classify meat samples according to
Fig. 5. Result of CDA based on step-LDA.
their content of pork, analytical methods of partial least square(PLS), Multiple Linear Regressions (MLR) and Back propagationneural network (BPNN) were used and the results were comparedto find the best prediction model.
Here, the data set optimized by step-LDA was used. All variablesleft in the models are significant at the 0.05 level. The samples usedfor training and testing were randomly selected before the modelwas built. Data set containing meat samples (96 for calibrationand 24 for validation) were used to predict the content of porkadulterated into minced mutton. The correlation coefficient androot mean square error between predicted and experimental val-ues were used to evaluate the performance of the model. The largerR2 and lower RMSE lead to better calibration model.
For BPNN, the experimental design was completely randomizedwith each sample as an experimental unit. The architecture of theartificial neural network chosen was N � (2N + 1) �M three-layerback-propagation. The input layer was designed as 10 neuronsaccording to the sensor array optimized by step-LDA, 1 hiddenneuron; the output layer had 6 neurons for different pork contentin minced mutton.
The results obtained by the training model of BPNN showedthat all the training and testing samples were correctly classifiedaccording to their content of pork. And the correlations betweenthe observed and predicted content of pork in minced mutton werehigher than 0.97 (Table 3) both for the training and testing sets.The low errors of prediction and the high correlation of the BPNNmodel suggested that the E-nose can be successfully applied inthe determination of the adulteration detection of pork in mincedmutton.
PLS is a multivariate projection method for modeling the rela-tionship between dependent variables and independent variables.Leave-one-out technique was applied. The accuracy was estimatedusing the parameters (the correlation coefficient and root meansquare error between predicted and experimental values) obtainedfrom the fitted equation. As shown in Table 3, good correlations ofcalibration were found between E-nose data and content of porkwith a determination of coefficient R2 = 0.9609. When the modelwas applied to predict the other 24 samples, similar results couldbe found, good prediction results for content of pork with thecoefficient R2 of 0.9092 was obtained. The PLS-E-tongue methodshave been proved to be suitable for prediction of chemical param-
X. Tian et al. / Journal of Food Engineering 119 (2013) 744–749 749
eters (Apetrei et al., 2007; Rudnitskaya et al., 2009). So, pork con-tent in minced mutton could be determined simultaneously byPLS using the E-nose data in this work.
The MLR algorithm establishes a model that describes the rela-tionship between sensor signals and the pork content. The predic-tive models for pork content in minced mutton were given asfollow:
Pork content in minced mutton ¼ 20:07þ 7:73� S5�40s � 1:08
� S8�40s þ 21:92� S1�60s
� 51:23� S3�60s þ 12:73
� S5�60s � 1:32� S6�60s
� 2:59� S2�75s þ 9:86
� S7�75s � 6:38� S9�75s
� 8:08� S10�75s
Large R2 and low RMSE indicate adequate fits. Table 3 showed theprediction ability of the E-nose. Similar with the PLS, Table 3 illus-trated a linear correlation between the responses of the sensors andthe pork content. When the model was used to predict the predic-tion set, the results were also high. The MLR model appeared to beof high ability prediction for percentage of pork adulterated intominced mutton with R2 higher than 0.93.
In conclusion, excellent prediction ability of E-nose was foundusing PLS, MLR and BPNN for prediction of pork content in mincedmutton with R2 higher than 0.9092 and RMSE lower than 10.94%.The best results were found by BPNN model, with high correlation(higher than 0.97) for the training and testing subsets.
4. Conclusions
In this paper, an E-nose was used to detect the adulteration ofpork in minced mutton. Multivariate analysis methods were em-ployed to explore the performance of the E-nose in classificationof the adulteration. 120 samples were detected and the signalswere analyzed by three feature extraction methods and patternrecognition techniques. Step-LDA was proved to be the most effec-tive feature extraction method. It is applicable for the E-nose to de-tect the adulteration in mutton based on the Step-LDA using CDA.MLR, PLS and BPNN were used to predict the pork content inminced mutton precisely. Three methods showed high capacityin prediction for content of pork in minced mutton. What’s more,BPNN was the most effective method for the prediction of porkcontent. The E-nose had been proved to be a useful authenticationmethod for meat adulteration detection for its efficiency and highaccuracy.
Acknowledgements
The authors acknowledge the financial support of the ChineseNational Foundation of Nature and Science through Project31071548, National Key Technology R&D Program2012BAD29B02-4, the Research Fund for the Doctoral Programof Chinese National Higher Education through Project20100101110133, and the Fundamental Research Funds for theCentral Universities through Project ZYZ2012071.
References
Apetrei, C., Apetrei, I.M., Nevares, I., del Alamo, M., Parra, V., Rodríguez-Méndez,M.L., De Saja, J.A., 2007. Using an e-tongue based on voltammetric electrodes todiscriminate among red wines aged in oak barrels or aged using alternativemethods: correlation between electrochemical signals and analyticalparameters. Electrochimica Acta 52 (7), 2588–2594.
Asensio, L., González, I., García, T., Martin, R., 2008. Determination of foodauthenticity by enzyme-linked immunosorbent assay (ELISA). Food Control 19(1), 1–8.
Bonne, K., Verbeke, W., 2008. Muslim consumer trust in halal meat status andcontrol in Belgium. Meat Science 79 (1), 113–123.
Chen, S.-Y., Liu, Y.-P., Yao, Y.-G., 2010. Species authentication of commercial beefjerky based on PCR–RFLP analysis of the mitochondrial 12S rRNA gene. Journalof Genetics and Genomics 37 (11), 763–769.
Chou, C.C., Lin, S.P., Lee, K.M., Hsu, C.T., Vickroy, T.W., Zen, J.M., 2007. Fastdifferentiation of meats from fifteen animal species by liquid chromatographywith electrochemical detection using copper nanoparticle plated electrodes.Journal of Chromatography B 846 (1–2), 230–239.
Cosio, M.S., Ballabio, D., Benedetti, S., Gigliotti, C., 2006. Geographical origin andauthentication of extra virgin olive oils by an electronic nose in combinationwith artificial neural networks. Analytica Chimica Acta 567 (2), 202–210.
Cozzolino, D., Murray, I., 2004. Identification of animal meat muscles by visible andnear infrared reflectance spectroscopy. LWT – Food Science and Technology 37(4), 447–452.
Gómez, A.H., Wang, J., Hu, G., Pereira, A.G., 2006. Electronic nose technique potentialmonitoring mandarin maturity. Sensors and Actuators B: Chemical 113 (1),347–353.
Gómez, A.H., Wang, J., Hu, G., Pereira, A.G., 2007. Discrimination of storage shelf-lifefor mandarin by electronic nose technique. LWT – Food Science and Technology40 (4), 681–689.
García, M., Aleixandre, M., Gutiérrez, J., Horrillo, M.C., 2006. Electronic nose for hamdiscrimination. Sensors and Actuators B: Chemical 114 (1), 418–422.
GB/T9695.5, 2008. National Standard of the People’s Republic of China, Meat andMeat Products–Measurement of pH.
Ghovvati, S., Nassiri, M.R., Mirhoseini, S., Moussavi, A.H., Javadmanesh, A., 2009.Fraud identification in industrial meat products by multiplex PCR assay. FoodControl 20 (8), 696–699.
Haddi, Z., Amari, A., Ali, A.O., Bari, N.E., Barhoumi, H., Maaref, A., Jaffrezic-Renault,N., Bouchikhi, B., 2011. Discrimination and identification of geographical originvirgin olive oil by an e-nose based on MOS sensors and pattern recognitiontechniques. Procedia Engineering 25, 1137–1140.
Hai, Z., Wang, J., 2006. Electronic nose and data analysis for detection of maize oiladulteration in sesame oil. Sensors and Actuators B: Chemical 119 (2), 449–455.
Limbo, S., Torri, L., Sinelli, N., Franzetti, L., Casiraghi, E., 2010. Evaluation andpredictive modeling of shelf life of minced beef stored in high-oxygen modifiedatmosphere packaging at different temperatures. Meat Science 84 (1), 129–136.
Man, Y.B.C., Aida, A.A., Raha, A.R., Son, R., 2007. Identification of pork derivatives infood products by species–specific polymerase chain reaction (PCR) for halalverification. Food Control 18 (7), 885–889.
Man, Y.B.C., Gan, H.L., NorAini, I., Nazimah, S.A.H., Tan, C.P., 2005. Detection of lardadulteration in RBD palm olein using an electronic nose. Food Chemistry 90 (4),829–835.
Meza-Marquez, O.G., Gallardo-Velazquez, T., Osorio-Revilla, G., 2010. Application ofmid-infrared spectroscopy with multivariate analysis and soft independentmodeling of class analogies (SIMCA) for the detection of adulterants in mincedbeef. Meat Science 86 (2), 511–519.
Musatov, V.Y., Sysoev, V.V., Sommer, M., Kiselev, I., 2010. Assessment of meatfreshness with metal oxide sensor microarray electronic nose: a practicalapproach. Sensors and Actuators B–Chemical 144 (1), 99–103.
Nan, Q., 2003. Manual for Meat Industry, first ed. China Light Industry Press,Beijing, China, pp. 72–74.
Nurjuliana, M., Che Man, Y.B., Mat Hashim, D., Mohamed, A.K.S., 2011. Rapididentification of pork for halal authentication using the electronic nose and gaschromatography mass spectrometer with headspace analyzer. Meat Science 88(4), 638–644.
Penza, M., Cassano, G., 2004. Recognition of adulteration of Italian wines by thin-film multisensor array and artificial neural networks. Analytica Chimica Acta509 (2), 159–177.
Rodriguez, M.A., Garcia, T., Gonzalez, I., Hernandez, P.E., Martin, R., 2005. TaqManreal-time PCR for the detection and quantitation of pork in meat mixtures. MeatScience 70 (1), 113–120.
Rohman, A., Sismindari, Erwanto, Y., Man, Y.B.C., 2011. Analysis of pork adulterationin beef meatball using Fourier transform infrared (FTIR) spectroscopy. MeatScience 88 (1), 91–95.
Rudnitskaya, A., Polshin, E., Kirsanov, D., Lammertyn, J., Nicolai, B., Saison, D.,Delvaux, F.R., Delvaux, F., Legin, A., 2009. Instrumental measurement of beertaste attributes using an electronic tongue. Analytica Chimica Acta 646 (1–2),111–118.
Sacco, D., Brescia, M.A., Buccolieri, A., Jambrenghi, A.C., 2005. Geographical originand breed discrimination of Apulian lamb meat samples by means of analyticaland spectroscopic determinations. Meat Science 71 (3), 542–548.
Yu, H., Wang, J., 2007. Discrimination of LongJing green-tea grade by electronicnose. Sensors and Actuators B: Chemical 122 (1), 134–140.
Zhang, H., Wang, J., Tian, X., Yu, H., Yu, Y., 2007. Optimization of sensor array anddetection of stored duration of wheat by electronic nose. Journal of FoodEngineering 82 (4), 403–408.
Zhang, N., Zhang, D., Li, S., Li, Q., 2008. Preliminary study on origin traceability ofmutton by near infrared reflectance spectroscopy coupled with SIMCA method.Transactions of the Chinese Society of Agricultural Engineering 24 (12), 309–312.