Embed Size (px)
Citation preview
For Peer Review O
nly
Analysis of polycyclic aromatic hydrocarbons in vegetable oils combining gel permeation chromatography with solid
phase extraction cleanup
Journal: Food Additives and Contaminants
Manuscript ID: TFAC-2006-221.R1
Manuscript Type: Original Research Paper
Date Submitted by the Author:
23-Nov-2006
Complete List of Authors: Fromberg, Arvid; Danish Institute for Food and Veterinary Research, Department of Food Chemistry Højgård, Arne; Regional Veterinary and Food Administration Centre, Region North Duedahl-Olesen, Lene; Danish Institute for Food and Veterinary Research, Department of Food Chemistry
Methods/Techniques: Chromatography - GC/MS, Clean-up, Method validation, Survey
Additives/Contaminants: PAH, Process contaminants - PAH’s
Food Types: Oils and fats, Olive oil
http://mc.manuscriptcentral.com/tfac Email: [email protected]
Food Additives and Contaminantspe
er-0
0577
538,
ver
sion
1 -
17 M
ar 2
011
Author manuscript, published in "Food Additives and Contaminants 24, 07 (2007) 758-767" DOI : 10.1080/02652030601150505
For Peer Review O
nly
1
Analysis of polycyclic aromatic hydrocarbons in vegetable oils
combining gel permeation chromatography with solid phase
extraction cleanup
Arvid Fromberg*1, Arne Højgård2 and Lene Duedahl-Olesen1
1Danish Institute for Food and Veterinary Research, Department of Food Chemistry,
Mørkhøj Bygade 19, DK-2860 Søborg, Denmark.
2Regional Veterinary and Food Administration Centre, Region North, Sønderskovvej 5,
DK-8520 Lystrup, Denmark
Abstract
A semi-automatic method for the determination of polycyclic aromatic hydrocarbons in
edible oils using a combined Gel Permeation Chromatography/Solid Phase Extraction
(GPC/SPE) clean-up is presented. The method takes advantage of automatic injections
using a Gilson ASPEC XL sample handling system equipped with a GPC column (S-
X3) and pre-packed silica SPE columns for the subsequent clean-up and finally gas
chromatography–mass spectrometry (GC-MS) determination. The method was validated
for the determination of PAHs in vegetable oils and is able to meet the criteria for the
official control of benzo[a]pyrene levels in foods laid down by the Commission of the
European Communities. A survey of 69 vegetable oils sampled on the Danish market
included olive oil as well as other vegetable oils like rapeseed oil, sunflower oil, grape
seed oil and sesame oil. Levels of benzo[a]pyrene in all the oils were low (<0.2–0.8 µg
kg-1), except for one sample of sunflower oil containing 11 µg kg-1 benzo[a]pyrene.
* Corresponding author. Tel.: +45 7234 6000; fax.: +45 7234 7448; E-mail address: [email protected].
Page 1 of 31
http://mc.manuscriptcentral.com/tfac Email: [email protected]
Food Additives and Contaminants
123456789101112131415161718192021222324252627282930313233343536373839404142434445464748495051525354555657585960
peer
-005
7753
8, v
ersi
on 1
- 17
Mar
201
1
For Peer Review O
nly
2
Keywords: Analysis, PAHs, benzo[a]pyrene, method validation, vegetable oil,
sunflower oil, rapeseed oil, grape seed oil, sesame oil, GPC, SPE.
Introduction
Polycyclic aromatic hydrocarbons (PAHs) are a group of hundreds of organic
compounds, which contain two or more fused aromatic rings made up of carbon and
hydrogen. PAHs are formed by the incomplete combustion of organic material like
wood, coal or oil. Studies of various matrices, such as coal combustion effluents, motor
vehicle exhaust, used motor lubricating oil and tobacco smoke, have shown that PAHs
are found in the outdoor air and the indoor environment. However, for non-smokers,
human exposure to PAHs occurs mainly via food consumption (IPCS, 1998; European
Commission, 2002). The occurrence of PAHs in foods is due to the formation of PAHs
during food processing, such as drying, smoking, and domestic food preparation such as
barbecuing, roasting and frying.
Although studies on animals exposed to individual PAHs, most notably benzo[a]pyrene,
have shown various toxicological effects, such as haematological effects, reproductive
and developmental toxicity and immunotoxicity, the critical effects are genotoxicity and
cancer. Only very few single PAHs and a few complex mixtures have been
toxicologically risk assessed. Recently, the European Scientific Committee on Food
(SCF) has risk assessed 33 PAHs. The Committee concluded that 15 PAHs showed
clear evidence of genotoxicity, and 14 of these were carcinogenic to animals (European
Commission, 2002). However, SCF recommended to evaluate the usefulness of
Page 2 of 31
http://mc.manuscriptcentral.com/tfac Email: [email protected]
Food Additives and Contaminants
123456789101112131415161718192021222324252627282930313233343536373839404142434445464748495051525354555657585960
peer
-005
7753
8, v
ersi
on 1
- 17
Mar
201
1
For Peer Review O
nly
3
benzo[a]pyrene as a marker for the carcinogenic PAHs in food and to evaluate the risk
assessment of the carcinogenicity of PAHs in food based on the level of
benzo[a]pyrene.
In 2001, a processing problem caused a general contamination of European olive
pomace oils. The awareness of processing problems and the publication in 2002 of
SCF’s health risk assessment of PAHs exposure from foods (European Commission,
2002) has given rise to novel interests in the field of PAHs in foods. In April 2005, EC
maximum levels for benzo[a]pyrene (European Commission, 2005) were adapted for
e.g. oils and fats intended for human consumption or use as an ingredient in foods (2 µg
kg-1 wet weight). At the same time, minimum performance criteria for sampling
methods and for methods of analysis for the official control of benzo[a]pyrene levels in
foodstuffs were adapted in a Commission Directive (European Commission, 2005a).
Commission recommendations on further investigation into the levels of the 15 EU
priority PAHs in certain foods were also given (European Commission, 2005b).
Vegetable oils, naturally free of PAHs, are contaminated by technological processes like
smoke drying of oil seeds or indirectly by environmental sources, such as exhaust gases
from traffic or other combustion derived atmospheric particles deposited on the crops
during growing. However, the PAHs content in vegetable oils can be radically reduced
during refining, the final level depending on the refining conditions adopted (Hopia et
al., 1986; Larsson et al., 1987; IPCS, 1998; Moret et al., 2000).
Page 3 of 31
http://mc.manuscriptcentral.com/tfac Email: [email protected]
Food Additives and Contaminants
123456789101112131415161718192021222324252627282930313233343536373839404142434445464748495051525354555657585960
peer
-005
7753
8, v
ersi
on 1
- 17
Mar
201
1
For Peer Review O
nly
4
Previously, benzo[a]pyrene concentrations below the European Commission maximum
limit of 2 µg kg-1 have been reported for virgin olive oils (Hopia et al., 1986; Moret et
al., 1997; Menichini et al., 1991; Speer et al., 1990; Lodovici et al., 1995; European
Commission, 2004). In comparison, surveillance data reflecting targeted sampling of
vegetable oils showed that benzo[a]pyrene concentrations in olive pomace oils
exceeded the European maximum limit for 83% of 268 samples (European
Commission, 2004).
Pupin and Toledo (1996) found benzo[a]pyrene concentrations for olive oils (n=7) of
Argentine origin up to 164 µg kg-1, with no further explanation for the high
concentrations. Van der Wielen and co-workers (2006) reported benzo[a]pyrene
concentrations up to 85 µg kg-1 in olive oils (n=170), while other vegetable oils (n=170)
for human consumption only showed benzo[a]pyrene concentrations up to 9 µg kg-1.
Crude rapeseed oils have been reported to contain benzo[a]pyrene concentrations
ranging from 1.4 to 64 µg kg-1 (Dennis et al., 1991), while grape seed oils have been
reported to contain average benzo[a]pyrene concentrations of 4.2 µg kg-1 (n=92)
(European Commission, 2004) and from 8.6 to 44 µg kg-1 (n=20) (Moret et al., 2000).
Sunflower oils (n=201) collected in seven European member states revealed an average
value of 3.2 µg kg-1 benzo[a]pyrene (European Commission, 2004) with 29% of all
samples exceeding the EU maximum limit of 2 µg kg-1.
Literature including results of PAHs for types of vegetable oils other than olive oils
have been rare and if other types of vegetable oils were included, only a few samples
were reported e.g. one linseed and one sesame oil (Speer et al., 1990), two refined
Page 4 of 31
http://mc.manuscriptcentral.com/tfac Email: [email protected]
Food Additives and Contaminants
123456789101112131415161718192021222324252627282930313233343536373839404142434445464748495051525354555657585960
peer
-005
7753
8, v
ersi
on 1
- 17
Mar
201
1
For Peer Review O
nly
5
rapeseed oils (Larsson et al., 1987) three refined maize oils (Dennis et al., 1991).
Furthermore no results have been presented for samples taken after the introduction of
the EU maximum limit.
Previously, the German Society for Fat Science fixed a limit of 25 µg kg-1 for the total
sum of PAHs and a limit of 5 µg kg-1 for the sum of PAHs of five or more aromatic
rings (Speer et al., 1990, Swetman et al., 1999). In addition a calculation of the sum of
genotoxic PAHs analysed are included in the present study.
Traditionally, determination of PAHs has relied on procedures generally consisting of
an extraction step (e.g. liquid-liquid partition or saponification) followed by one or more
purification procedures (e.g. column chromatography or solid phase extraction (SPE)).
Analytical determination has usually been carried out by HPLC coupled to fluorometric
or UV detection, or through high resolution capillary GC coupled to flame ionization
detection (FID) or mass spectrometry (MS) (Hopia et al., 1986; Larsson et al., 1987;
Dennis et al., 1991; Menichini et al., 1991; Moret et al., 2000; Moret and Conte 2000).
Among different purification procedures silica gel columns, used alone or in
combination with other materials, have been widely used (Moret and Conte 2000). In
1996 Moret and co-workers evaluated the use of SPE silica cartridges for olive oils, and
these cartridges were also employed by Swetman et al. (1999) for coconut oil.
The present study presents a semi-automatic method for the determination of PAHs in
edible oils using a combined Gel Permeation Chromatography (GPC) and Solid Phase
Extraction (SPE) clean-up. The clean-up techniques are based on those described by
Page 5 of 31
http://mc.manuscriptcentral.com/tfac Email: [email protected]
Food Additives and Contaminants
123456789101112131415161718192021222324252627282930313233343536373839404142434445464748495051525354555657585960
peer
-005
7753
8, v
ersi
on 1
- 17
Mar
201
1
For Peer Review O
nly
6
Speer et al. (1990). The method takes advantage of automatic injections and sample
handling using a Gilson apparatus and is validated for the determination of a large
number of important PAHs in vegetable oils. The analytical method is able to meet the
criteria for the official control of benzo[a]pyrene levels in foods laid down by the
Commission of the European Communities. The study also includes new data on olive
oils and report values for oils commonly used for food preparation in Denmark, but
rarely reported in the literature. These oils include rapeseed oils, sunflower oils, grape
seed oils and sesame oil.
Methods and materials
Chemicals
All solvents used were HPLC-grade or pro analysi. Bio-Beads S-X3, 200-400 mesh was
obtained from Bio-Rad Laboratories and Silica Isolute SPE columns 500 mg/3 ml from
International Sorbent Technology Limited. The individual PAH compounds were
obtained from Dr. Ehrenstofer included: Acenaphtylene, Acenaphthene, Fluorene,
Phenanthrene, Anthracene, Fluoranthene, Pyrene, Benzo[a]anthracene, Chrysene,
Benzo[b]fluoranthene, Perylene, Benzo[j]fluoranthene, Benzo[k]fluoranthene,
Benzo[e]pyrene, Benzo[a]pyrene, Indeno[1,2,3-c,d]pyrene, Dibenzo[a,h]anthracene,
Benzo[g,h,i]perylene, and all the 13C6 and D12 labelled compounds were obtained from
Cambridge Isotope Laboratories, Inc., including: 13C6 labelled Acenaphthene and
Fluorene, and D12 labelled Benzo[a]anthracene, Benzo[e]pyrene, Benzo[a]pyrene and
Indeno[1,2,3-c,d]pyrene.
Page 6 of 31
http://mc.manuscriptcentral.com/tfac Email: [email protected]
Food Additives and Contaminants
123456789101112131415161718192021222324252627282930313233343536373839404142434445464748495051525354555657585960
peer
-005
7753
8, v
ersi
on 1
- 17
Mar
201
1
For Peer Review O
nly
7
Gel permeation chromatography (GPC)
About 1.5 g of edible oil was dissolved in cyclohexane-ethyl acetate 1:1 (v/v), and the
internal standard containing 13C6 or D12 labelled PAHs was added. Half of the sample
solution was then added, via a Gilson ASPEC XL apparatus, onto a glass column (15 x
500 mm) packed with pre-swollen and washed Bio-Beads S-X3 corresponding to 24 g
dry material. The column was eluted using cyclohexane-ethyl acetate 1:1 (v/v) at a flow
rate of 1.5 ml min-1. The first fraction (0-64 ml) eluting from the column containing
lipids was diverted to waste, after which the PAHs fraction (65-115 ml) was collected.
Subsequently the other half of the sample was cleaned up on the column and the
combined PAHs fraction was collected, including in total 100 ml of eluate. The solvent
was evaporated on a rotary evaporator and subsequently concentrated to 1 ml by
blowing with nitrogen.
Silica column clean-up
A pre-packed silica SPE column was used to remove residue lipids and other disruptive
compounds from the GPC cleaned sample using the Gilson ASPEC XL apparatus. After
conditioning of the column with cyclohexane, the concentrated sample was added to the
SPE column followed by elution using cyclohexane. The cleaned up sample was
transferred into a GC-vial equipped with a pointed bottom and the solvent was
evaporated to around 50 – 100 µl and afterwards 100 µl of the internal injection
standard (Benzo[e]pyrene D12) was added to the GC-vial. Finally the sample was
concentrated to 100 µl and analysed using GC-MS (gas chromatograph equipped with a
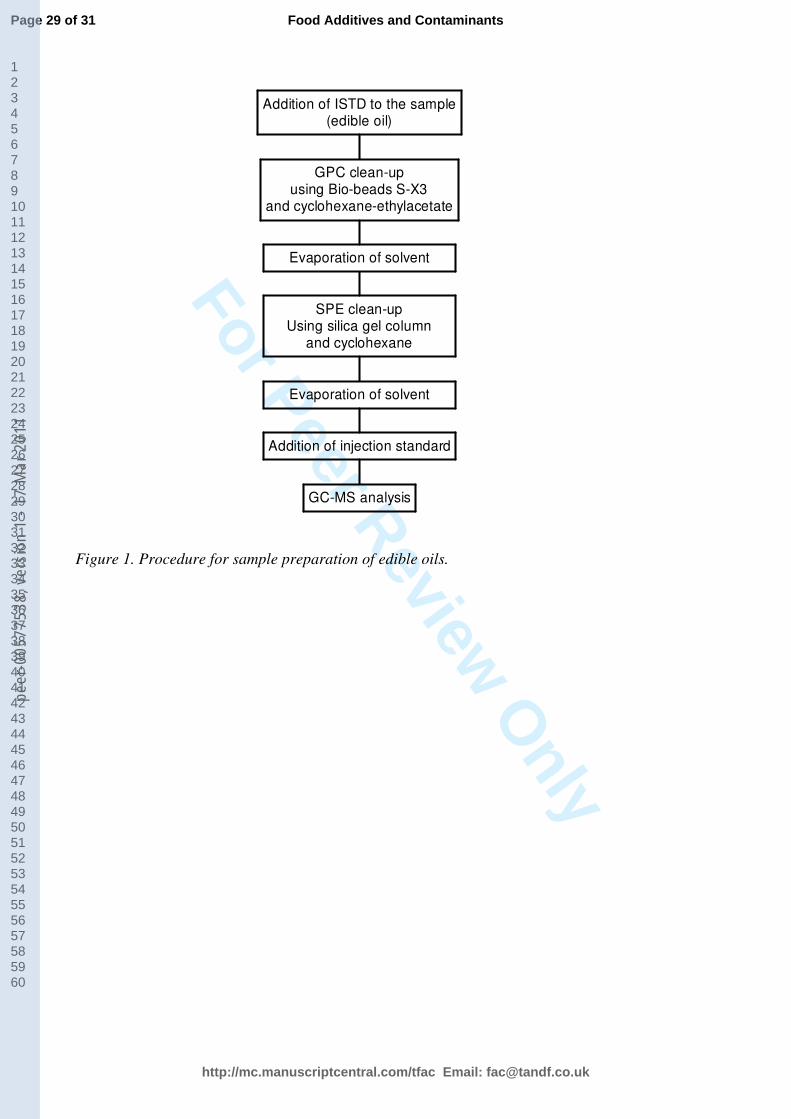
mass spectrometer). The entire sample preparation procedure for sample preparation of
edible oils is outlined in Figure 1.
Page 7 of 31
http://mc.manuscriptcentral.com/tfac Email: [email protected]
Food Additives and Contaminants
123456789101112131415161718192021222324252627282930313233343536373839404142434445464748495051525354555657585960
peer
-005
7753
8, v
ersi
on 1
- 17
Mar
201
1
For Peer Review O
nly
8
[Insert Figure 1 here]
GC-MS analysis
The GC-MS analyses were preformed using a 50m DB-5MS (J&W) column, 0.25 mm
inner diameter, 0.25 µm film thickness. The ionisation mode was electron impact at
70eV. The carrier gas used was helium at 1 ml min-1. 2 µl of the cleaned sample was
injected splitless with a splitless time of 1 min. The injector was held at 280°C and the
transfer-line at 280°C. The GC oven was held at 90°C for 1 min. then raised to 270°C at
a rate of 7°C min-1; further raised to 280°C at a rate of 1°C min-1 and finally to 320°C at
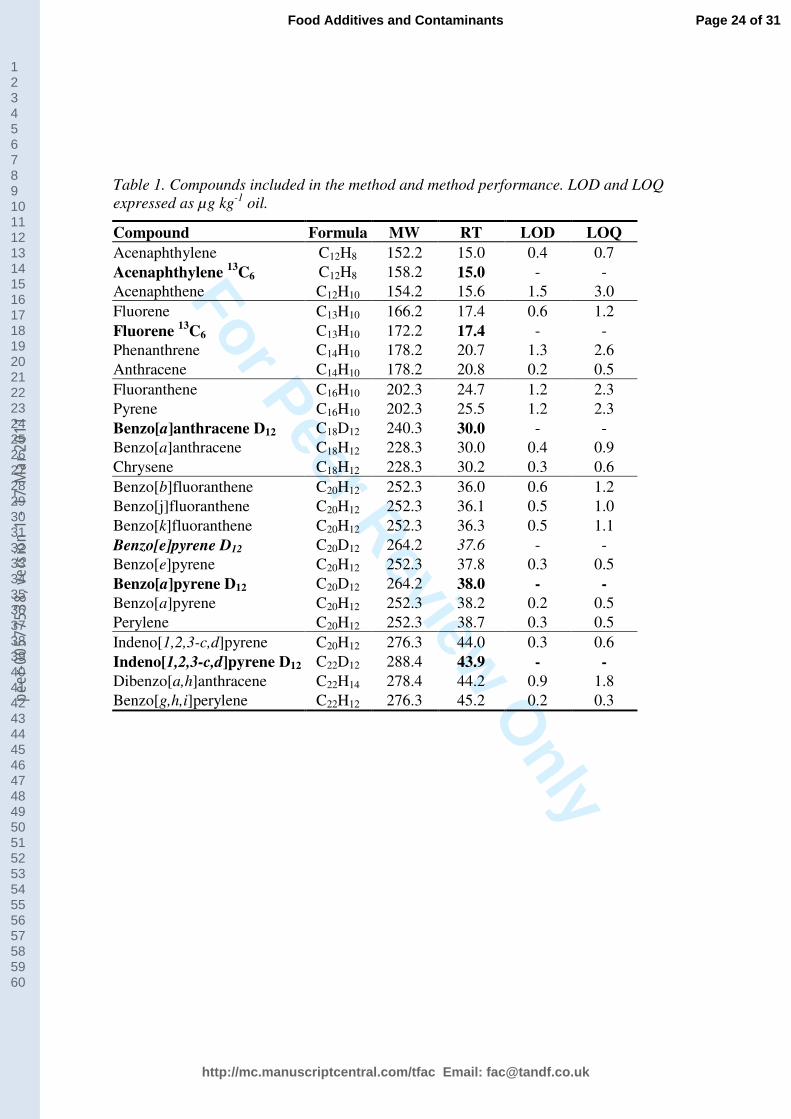
a rate of 5°C min-1; and held at 320°C for 10 min. The compounds were identified and
quantified by comparing retention times and responses with those of standard mixtures.
The criteria for identification were same retention times as the standard within ± 2%,
correct relative abundance of the two characteristic ions within ± 15%. Compounds
formula, mol weight, retention times, Limit of detection (LOD) and limit of
quantification (LOQ) are listed in Table 1.
[Insert Table 1 here]
Method validation
The analytical method has been validated according to the Danish guidelines for
validation of methods in chemical analytical laboratories (Danak 2003) interpreting the
Page 8 of 31
http://mc.manuscriptcentral.com/tfac Email: [email protected]
Food Additives and Contaminants
123456789101112131415161718192021222324252627282930313233343536373839404142434445464748495051525354555657585960
peer
-005
7753
8, v
ersi
on 1
- 17
Mar
201
1
For Peer Review O
nly
9
general requirements for the competence of testing and calibration laboratories laid
down in ISO standard 17025 (ISO 2005). The validation protocol for validation of the
analytical method included linearity, limit of detection, limit of quantification,
repeatability and intermediate reproducibility. As a supplement to the method validation
the measurement uncertainty was calculated according to the guidelines for expression
uncertainty (GUM) (ISO 1993). Included in the calculations were the uncertainty of the
calibration standards used in the method including the contributions from purity and
gravimetric determination of standards and solvents used for preparation of the
standards. In addition the relative standard deviation of the results were included.
Sampling of vegetable oils
The Regional Veterinary and Food Control Authorities in Denmark sampled vegetable
oils from merchants. The samples included 52 samples of olive oil, 8 samples of
rapeseed oil, 4 samples of sunflower oil, 4 samples of grape seed oil and one sample of
sesame oil. All samples were for human consumption, to be used either in private homes
or in restaurants or catering firms.
Results and discussion
Method development
A part of the method development included the selection of suitable internal standards.
Bolt et al. (1997) observed instability of deuterium labelled PAHs due to the loss of
deuterium from the labelled compounds. Carbon-13 labelled compounds are therefore
Page 9 of 31
http://mc.manuscriptcentral.com/tfac Email: [email protected]
Food Additives and Contaminants
123456789101112131415161718192021222324252627282930313233343536373839404142434445464748495051525354555657585960
peer
-005
7753
8, v
ersi
on 1
- 17
Mar
201
1
For Peer Review O
nly
10
preferred. However, benzo[a]pyrene D12 was preferred as the internal standard for
benzo[a]pyrene, as carbon labelled benzo[a]pyrene only contains four carbon-13 atoms
per molecule and a test showed a peak at the retention time and m/z of benzo[a]pyrene
probably due to loss of H from the molecule or due to benzo[a]pyrene as impurity in the
labelled standard. Difficulties with the loss of deuterium from benzo[a]pyrene D12 have
not been observed. Bolt and co-workers did not report any problems with the loss of
deuterium from benzo[a]anthracene, and benzo[a]anthracene D12 was therefore used as
the internal standard.
Calibration curves
Page 10 of 31
http://mc.manuscriptcentral.com/tfac Email: [email protected]
Food Additives and Contaminants
123456789101112131415161718192021222324252627282930313233343536373839404142434445464748495051525354555657585960
peer
-005
7753
8, v
ersi
on 1
- 17
Mar
201
1
For Peer Review O
nly
11
External standards of all the compounds in solvent were used for the determination of
the calibration curves, using the approximate concentrations of 0 µg L-1, 1 µg L-1, 2 µg
L-1, 10 µg L-1, 30 µg L-1, 100 µg L-1, and 250 µg L-1 in toluene to ensure a well fitted
calibration curve. For the curve fit function, a linear regression line going through point
of origin was chosen, i.e. a function (Y= αX) with Y as the area ratio between the
compound and the internal standard, α as the slope and X as the concentration. All
standard curves had correlation coefficients above 0.99 for the linear regression through
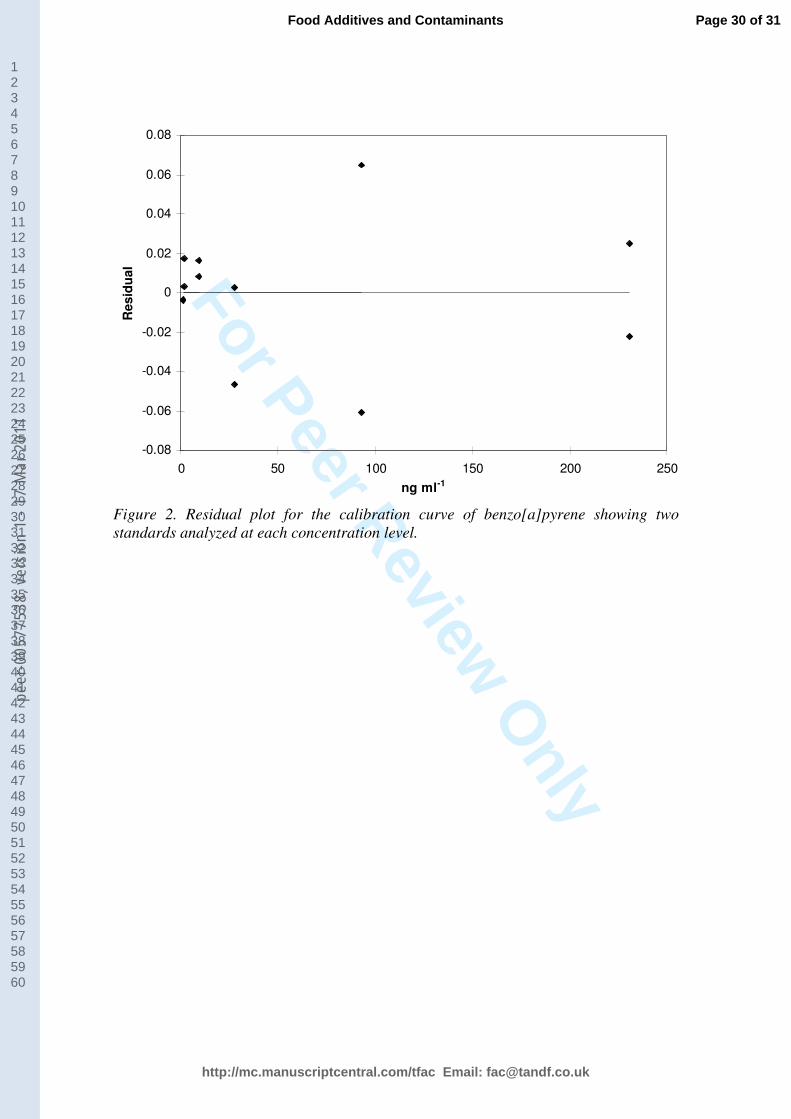
the data points and therefore a satisfactory linear range. In Figure 2 the residual plot for
the calibration curve of benzo[a]pyrene is displayed. All residuals were between ± 0.07
µg L-1 and the studentized residuals were between ± 2.
[Insert Figure 2 here]
Limit of detection and limit of quantification
In order to determine the limit of detection (LOD) and limit of quantification (LOQ) 14
olive oil samples were spiked with 1 µg kg-1 of the compounds. The individual PAH
level of each of the spiked olive samples was determined using the analytical method,
and concentrations were calculated. LOD and LOQ were calculated using three and six
times the standard deviation on the calculated amount in the spiked samples,
respectively. The study of sensitivity indicated that the limit of detection ranged from
0.2 to 1.5 µg kg-1 oil for the individual compounds, and the estimated LOQs ranged
from 0.3 to 3.0 µg kg-1 oil (Table 1).
The combination of GPC and further SPE clean-up resulted in relatively clean extracts,
avoiding problems with chromatographic interferences for most compounds. Absolute
Page 11 of 31
http://mc.manuscriptcentral.com/tfac Email: [email protected]
Food Additives and Contaminants
123456789101112131415161718192021222324252627282930313233343536373839404142434445464748495051525354555657585960
peer
-005
7753
8, v
ersi
on 1
- 17
Mar
201
1
For Peer Review O
nly
12
recoveries were calculated for spiked olive oil samples relative to the internal standard
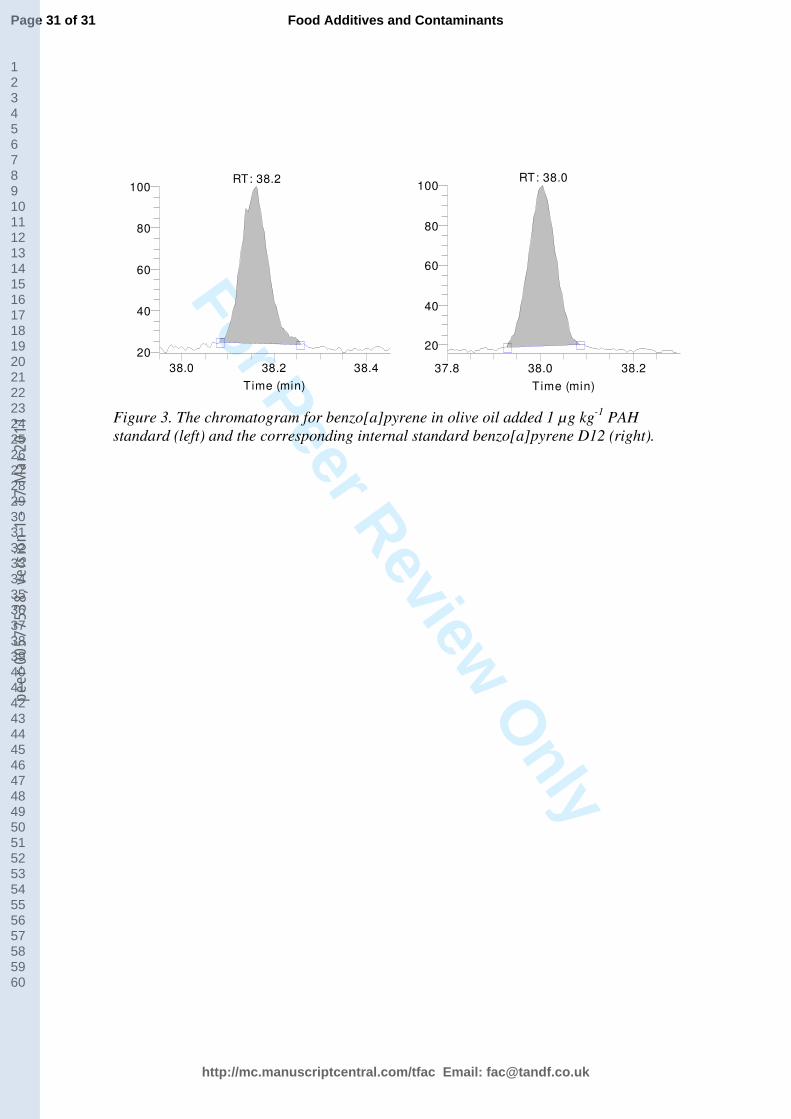
(ISTD) added to the sample before clean-up. An example of the chromatogram for
benzo[a]pyrene spiked at low level (1 µg kg-1) and the correlating internal standard
benzo[a]pyrene D12 are illustrated in Figure 3 left and right, respectively.
[Insert Figure 3 here]
The chromatogram revealed however, that benzo[b]fluoranthene and
benzo[j]fluoranthene, being identified using the same mass (m/z: 252), were only partly
resolved. The peaks were split into two at the valley and quantified separately during
the first part of the method development and method validation. However, it was
recognised that it was not possible to quantify the two compounds individually, as high
standards derivations were observed during validation mainly expected to be due to the
problem of splitting the peaks.
Recovery, repeatability, intermediate reproducibility and measurement uncertainty
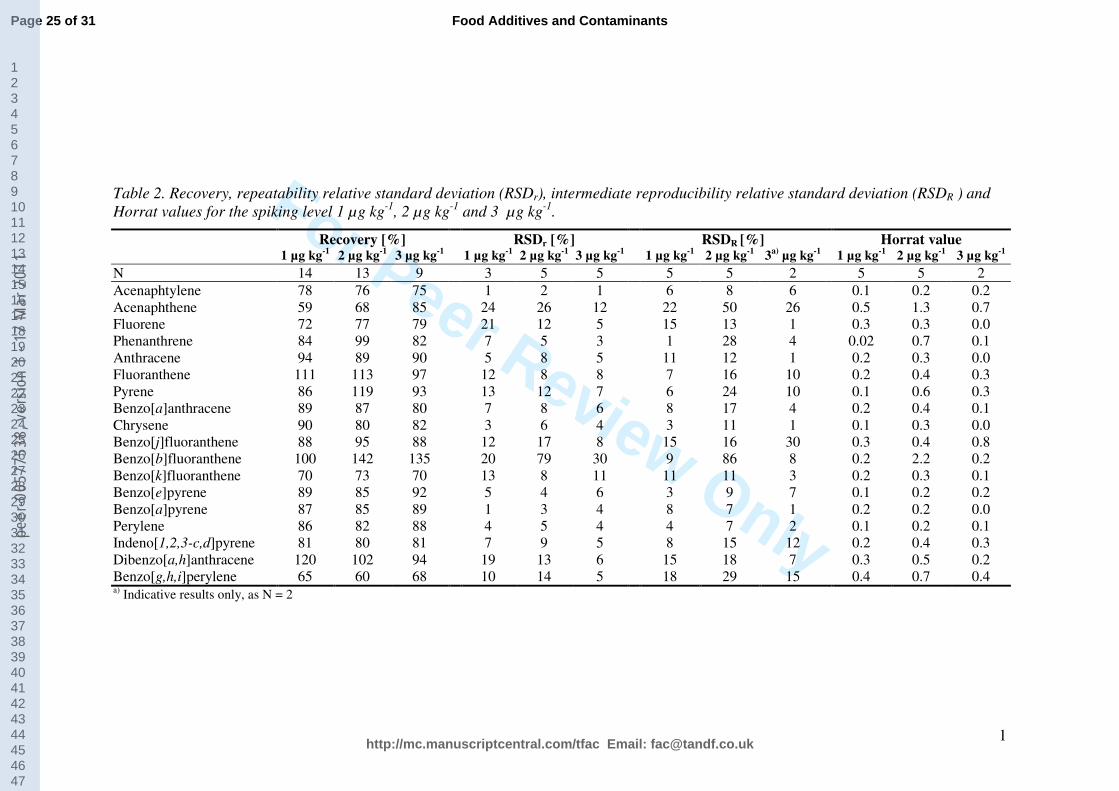
In order to validate the analytical method, recovery results as well as the repeatability
and intermediate reproducibility for olive oil spiked with the compounds were
determined (Table 2). Three concentrations were used for spiking the oil during the
method validation. For spiking level 1 approximately 1 µg kg-1 of PAHs standard was
added to the olive oil, for spiking level 2: approximately 2 µg kg-1 was added and for
spiking level 3: approximately 3 µg kg-1 was added. The repeatability includes analyses
of a number of individual samples cleaned up and analysed in the same batch. The
intermediate reproducibility includes clean-up and analysis of samples by different
Page 12 of 31
http://mc.manuscriptcentral.com/tfac Email: [email protected]
Food Additives and Contaminants
123456789101112131415161718192021222324252627282930313233343536373839404142434445464748495051525354555657585960
peer
-005
7753
8, v
ersi
on 1
- 17
Mar
201
1
For Peer Review O
nly
13
laboratory technicians, analysed in separate series using individual calibration curves
and spiked samples made with two different olive oils.
The recovery of each compound was calculated after the concentration in the unspiked
sample (olive oil) was subtracted from that found in the spiked sample and divided by
the theoretical spiked concentration. Generally the average recoveries for all three
spiking levels were 60 to 120 percent, except for acenaphthene (59% for the recovery at
1 µg kg-1) and benzo[b]fluoranthene (142% for the recovery at 2 µg kg-1) which were
influenced by coeluting peaks, and phenanthrene (up to 178%), fluoranthene (up to
188%) and pyrene (up to 153%) at the low spiking levels as the incurred level of the
individual PAH in the unspiked sample was high compared to the spiking levels.
Considerable uncertainty was therefore applied to these results. This fact can also be
seen from the repeatability and intermediate reproducibility results. The HORRAT
values were calculated (McClure and Lee, 2003): HORRAT= RSD [%] / PRSD [%]
where PRSD is calculated using the Horwitz equation (Horwitz, 1982). The relative
standard deviation for intermediate reproducibility lead to HORRAT values within the
limits of acceptability (0.02 – 1.3), except for benzo[b]fluoranthene at spiking level 2µg
kg-1. The expanded measurement uncertainty was calculated using the lowest relative
standard deviation for the intermediate reproducibility. The calculations resulted in a
measurement uncertainty equivalent to the intermediate reproducibility, as the
contributions from other factors were negligible. Results in Table 2 are therefore given
as intermediate reproducibility as a measure for the measurement uncertainty.
Page 13 of 31
http://mc.manuscriptcentral.com/tfac Email: [email protected]
Food Additives and Contaminants
123456789101112131415161718192021222324252627282930313233343536373839404142434445464748495051525354555657585960
peer
-005
7753
8, v
ersi
on 1
- 17
Mar
201
1
For Peer Review Only
14
[Insert Table 2 here, landscape]
Page 14 of 31
http://mc.manuscriptcentral.com/tfac Email: [email protected]
Food Additives and Contaminants
123456789101112131415161718192021222324252627282930313233343536373839404142434445464748495051525354555657585960
peer
-005
7753
8, v
ersi
on 1
- 17
Mar
201
1
For Peer Review O
nly
15
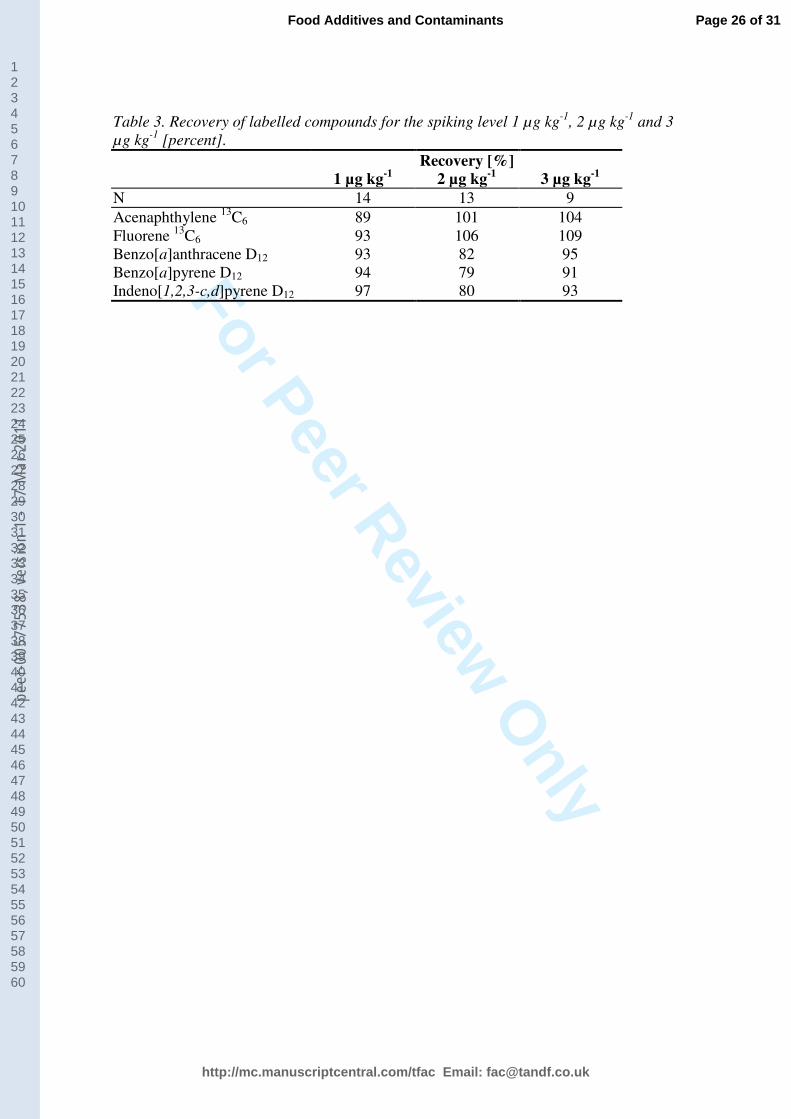
The recovery for the internal standards has been calculated using the internal injection
standard (benzo[e]pyrene D12) expressing the performance of the analytical method.
The average recoveries of the internal standards for the three spiking levels are between
79 and 109 percent (Table 3).
[insert Tabel 3 about here]
In order to ensure quality during method validation, all analytical GC-MS series
included analyses of a NIST CRM 1647d reference material, consisting of a standard
solution in acetonitrile containing all the PAH compounds, except benzo[j]fluoranthene,
benzo[e]pyrene and perylene. Furthermore, all series included the clean-up and analysis
of at least one unspiked oil sample. The method has also been tested in a interlaboratory
study provided by the UK Food Analysis Performance Assessment Scheme (FAPAS®)
with excellent result e.g. Benzo[a]pyrene: FAPAS® assigned value 18.66 µg/kg, result
18.5 µg/kg, z-score 0.0 (FAPAS 2004).
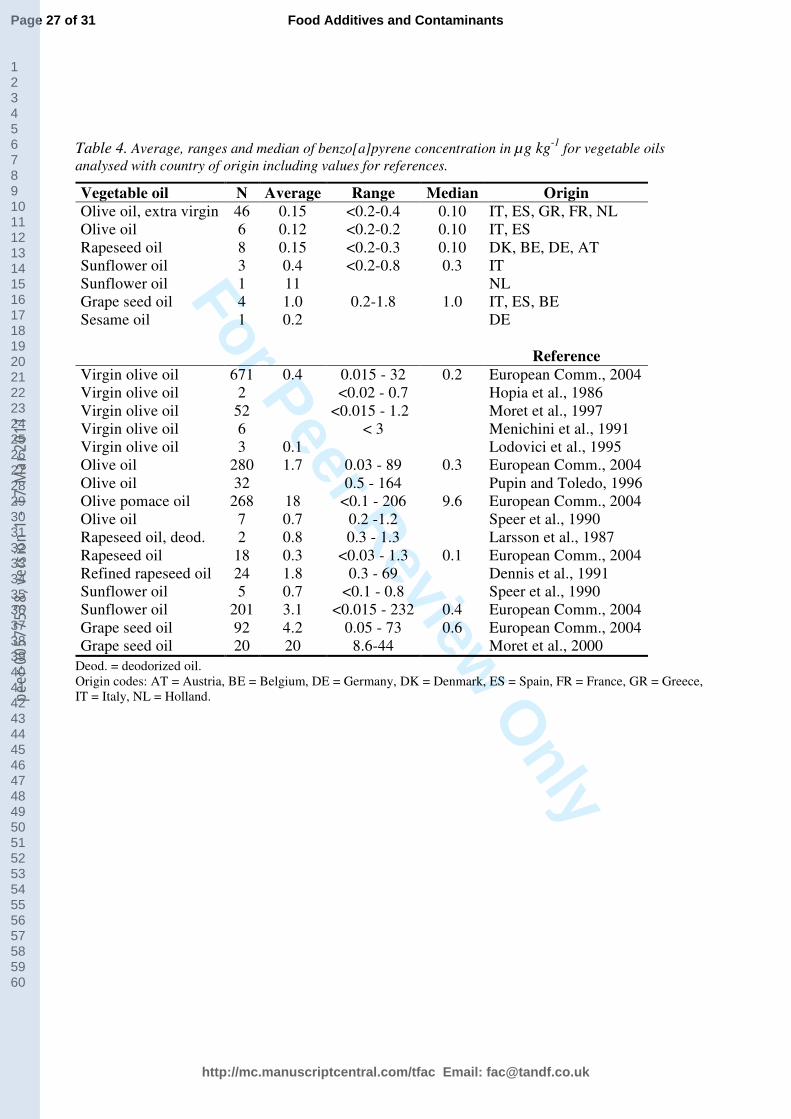
Benzo[a]pyrene levels in vegetable oils
The average concentration of benzo[a]pyrene (Table 4), the total sum of PAHs, the sum
of genotoxic PAHs, and the sum of light and heavy PAHs (Table 5) were calculated
using half of the LOD for results below LOD. Of the 69 vegetable oils analysed only
one sample of sunflower oil at 11 µg kg-1 benzo[a]pyrene exceeded the EU maximum
limit of 2 µg kg-1 (subtracted into a separate line in Table 4). Two of four grape seed oils
Page 15 of 31
http://mc.manuscriptcentral.com/tfac Email: [email protected]
Food Additives and Contaminants
123456789101112131415161718192021222324252627282930313233343536373839404142434445464748495051525354555657585960
peer
-005
7753
8, v
ersi
on 1
- 17
Mar
201
1
For Peer Review O
nly
16
had benzo[a]pyrene concentrations of 1.7 and 1.8 µg kg-1. All the other samples have
contents below the EU maximum limit set in April 2005 (European Commission, 2005),
and most samples have contents even below the LOD.
[Insert Table 4 here]
In the present study the data reported on rapeseed oils, the average concentration of
benzo[a]pyrene and the sum of PAHs (Table 5), correspond to the low levels previously
reported for two deodorized rapeseed oils (Larsson et al., 1987) and rapeseed oils
collected in three member states (European Commission, 2004). Refined rapeseed oils
have been reported with benzo[a]pyrene concentrations well above 2 µg kg-1 and with
increased levels of benzo[a]pyrene even for crude rapeseed oils (1.4 – 64 µg kg-1)
(Dennis et al., 1991).
Levels of benzo[a]pyrene in sunflower oils were found to range from <0.2 to 0.8 µg kg-
1, similar to the levels found by Speer and co-workers (1990).
In sesame oil, both the benzo[a]pyrene concentration (0.2 µg kg-1) and total sum of
PAHs (11 µg kg-1) were similar to the levels found for rapeseed and sunflower oils.
However, only one sample was analysed and more data is needed for this type of oil.
Total sum of PAHs in vegetable oils
Page 16 of 31
http://mc.manuscriptcentral.com/tfac Email: [email protected]
Food Additives and Contaminants
123456789101112131415161718192021222324252627282930313233343536373839404142434445464748495051525354555657585960
peer
-005
7753
8, v
ersi
on 1
- 17
Mar
201
1
For Peer Review O
nly
17
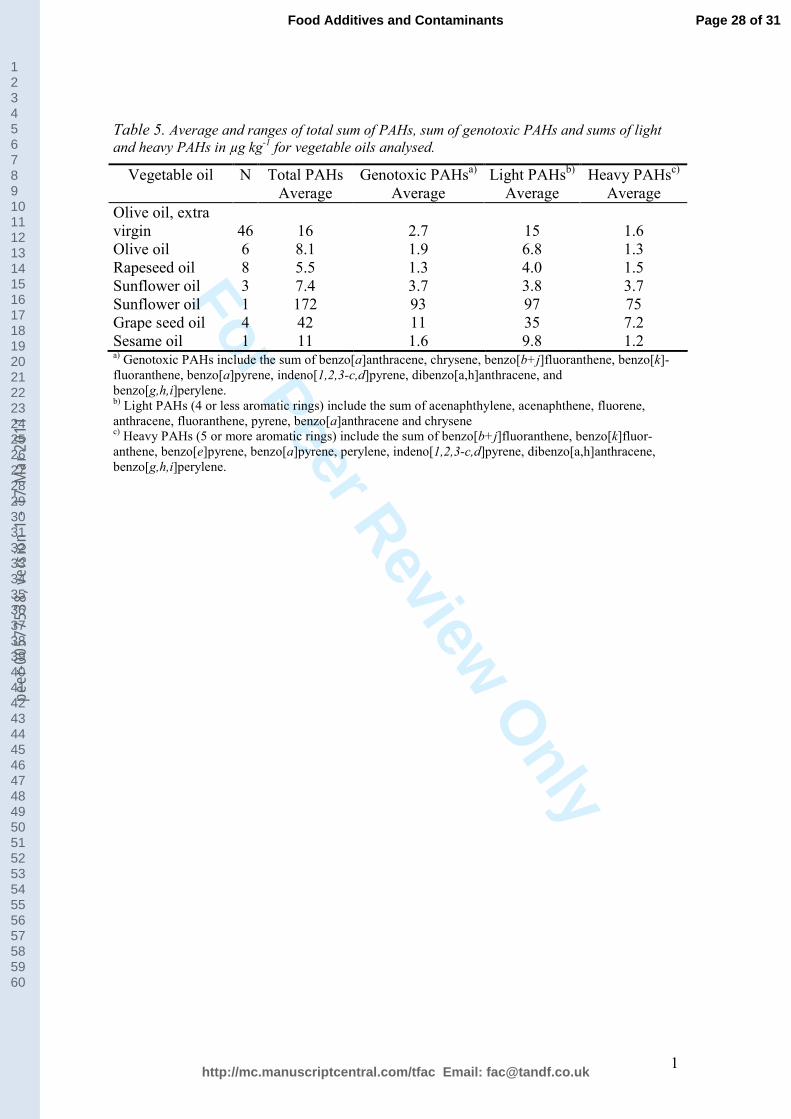
The total sum of PAHs for vegetable oils (Table 5) includes 17 PAHs and was
calculated by omitting phenanthrene, which was not detected in this survey. For
sunflower oils 50% or more of the total concentration of PAHs analysed were
carcinogenic (3.7 µg kg-1 out of 7.4 µg kg-1 and 93 µg kg-1 out of 172 µg kg-1), while for
the vegetable oils in general less than 25% of the total sum of PAHs were found to
belong to the genotoxic compounds.
[Insert Table 5 here]
Three grape seed oils, three virgin olive oils and one single sunflower oil had a total
sum of PAHs above the suggested limit of 25 µg kg-1 for the total sum of PAHs (Speer
et al., 1990; Swetman et al., 1999). While more and more PAHs are included in the
analysis, the limit of 25 µg kg-1 for the total sum of PAHs has been remarked as
unrealistic, especially if dealing with unrefined products such as extra virgin olive oil
containing up to 110 µg kg-1 PAHs (Speer et al., 1990; Moret et al., 1997). For data
obtained in this study it is important to notice that when omitting phenanthrene, the
PAH compound most abundant in e.g. grape seed oil, lower total sums of PAHs are
obtained which might explain the lower results.
The average sum of PAHs in the virgin olive oil samples was in agreement with
previous studies (Menichini et al., 1991; Moret et al., 1997; Moret and Conte, 2000)
found to be higher than the average sum of PAHs for the olive oils (a blend of refined
and virgin oils) (Table 5). These results has previously been explained by the olive oil
Page 17 of 31
http://mc.manuscriptcentral.com/tfac Email: [email protected]
Food Additives and Contaminants
123456789101112131415161718192021222324252627282930313233343536373839404142434445464748495051525354555657585960
peer
-005
7753
8, v
ersi
on 1
- 17
Mar
201
1
For Peer Review O
nly
18
blend being exposed to a PAHs reduction in the oil refining processes (Larsson et al.,
1987).
Two grape seed oils and two sunflower oils had a sum of heavy PAHs (5 or more
aromatic rings) exceeding 5 µg kg-1. Using the limit of the sum of heavy PAHs
corresponds well to the fact that 12 of 15 genotoxic compounds assessed by SCF
(European Commission, 2002) contain five or more aromatic rings.
Comparing the level of light PAHs for all oil samples, only sunflower (app. 50%) and
rapeseed oils (70%) have levels of light PAHs less than 90% of the total sum of PAHs,
indicating the use of a refining process. For vegetable oils the refining process includes
a bleaching step, a treatment with activated carbon removing a considerable amount of
PAHs, while the deodorizing step removes some of the light PAHs and has little effect
on the heavy PAHs. Therefore a total reduction in the amount of light PAHs indicates
the inclusion of a refining step in the vegetable oil production.
Conclusions
The presented analytical method makes it possible to meet the performance criteria for
the limit of detection (LOD) and the recovery, as described in the EC document laying
down methods of analysis for the official control of the levels of benzo[a]pyrene in
foods. The criteria for LOD is set to no more than 0.3 µg kg-1 and the recovery between
50% and 120%.
Page 18 of 31
http://mc.manuscriptcentral.com/tfac Email: [email protected]
Food Additives and Contaminants
123456789101112131415161718192021222324252627282930313233343536373839404142434445464748495051525354555657585960
peer
-005
7753
8, v
ersi
on 1
- 17
Mar
201
1
For Peer Review O
nly
19
Using the method for the determination of the levels of polycyclic aromatic
hydrocarbons in vegetable oils revealed low levels of the compounds in many of the
olive oil samples and other vegetable oils with higher levels. Olive oils of virgin origin
were confirmed as having higher concentrations of PAHs compared to olive oils (a
blend of refined and virgin oils) with a slightly lower fraction of light PAHs in olive oils
(80% compared to 90% for virgin oils). Generally, the benzo[a]pyrene levels and the
sum of PAHs for olive oils, including virgin olive oils, was lower in this study than the
levels previously reported. A low fraction of light PAHs was remarked for the
sunflower oils, while grape seed oils contained the highest concentrations of
benzo[a]pyrene, heavy PAHs, genotoxic PAHs as well as the total sum of PAHs.
Acknowledgements
We wish to thank Vera Klausen and Vibeke Balswel from the Danish Institute for Food
and Veterinary Research, as well as Anni Mårbjerg Thomsen and Thomas Dyekjær
from the Regional Veterinary and Food Administration Center, Region North for their
skilful technical assistance with the chemical analyses.
References
Bolt D. B, Bradley, J.C. and Re, M.A. 1997 The preparation of 13C-labled standards of
polycyclic aromatic hydrocarbons and other micropollutants: Synthetic and QA/QC
considerations. Chemosphere 34 5-7: 905-913.
Page 19 of 31
http://mc.manuscriptcentral.com/tfac Email: [email protected]
Food Additives and Contaminants
123456789101112131415161718192021222324252627282930313233343536373839404142434445464748495051525354555657585960
peer
-005
7753
8, v
ersi
on 1
- 17
Mar
201
1
For Peer Review O
nly
20
Danak 2003. RL 1 Validation of methods in chemical analytical laboratories –
quantitative methods of analysis (in Danish: RL 1 Metodevalidering i kemisk analytiske
laboratorier). Available: http://www2.danak.dk/akkreditering/RL/RL1.pdf via the
INTERNET. Accessed 2006 Nov 10.
Dennis, M., J., Massey, R.,C., Cripps, G., Venn, I., Howarth, N., and Lee, G. 1991.
Factors affecting the polycyclic aromatic hydrocarbon content of cereals, fats and other
food products. Food Additives and Contaminants. 8: 517-530.
European Commission, 2002. Opinion of the Scientific Committee on Food on the risks
to human health of Polycyclic Aromatic Hydrocarbons in food.
SCF/CS/CNTM/PAH/29/Final.
European Commission, 2004. Report on experts participating in Task 3.2.12.
Collection of occurrence data on polycyclic aromatic hydrocarbons in food.
European Commission , 2005. Commission Regulation (EC) No 208/2005 of 4
February 2005 amending Regulation (EC) No 466/2001 as regards polycyclic aromatic
hydrocarbons. Official Journal of the European Union, L 34/3.
European Commission , 2005a. Commission Directive 2005/10/EC of 4 February 2005
laying down sampling methods and the methods of analysis for the official control of
the levels of benzo(a)pyrene in foodstuffs. Official Journal of the European Union, L
34/15.
Page 20 of 31
http://mc.manuscriptcentral.com/tfac Email: [email protected]
Food Additives and Contaminants
123456789101112131415161718192021222324252627282930313233343536373839404142434445464748495051525354555657585960
peer
-005
7753
8, v
ersi
on 1
- 17
Mar
201
1
For Peer Review O
nly
21
European Commission , 2005b. Commission Recommendation of 4 February 2005 on
further investigation into the levels of polycyclic aromatic hydrocarbons in certain
foods. Official Journal of the European Union, L 34/43.
Fapas 2004. Enviromental contaminants FAPAS ® Series 6 Round 18, May – July
2004, Report No. 0618.
McClure, F.D. and Lee, J.K. 2003. Computation of HORRAT values. Journal of AOAC
international. 86: 1056-1058.
Horwitz, W. 1982. Evaluation of analytical methods used for regulation of foods and
drugs. Analytical Chemistry. 54: 67A-76A.
Hopia, A., Pyysalo, H., and Wickström, K. 1986. Margarines, butter and vegetable oils
as sources of poilycyclic aromatic hydrocarbons. Journal of the American Oil Chemists’
Society. 63: 889-893.
IPCS, 1998. Selected non-heterocyclic Polycyclic Aromatic Hydrocarbons.
Environmental Health Criteria No. 202. International Programme on Chemical Safety,
World Health Organisation. Geneva 1998.
ISO 1993. BIPM, IEC, IFCC, ISO, IUPAC, IUPAP, OIML: Guide to the expression of
uncertainty in measurement. Geneva 1993.
Page 21 of 31
http://mc.manuscriptcentral.com/tfac Email: [email protected]
Food Additives and Contaminants
123456789101112131415161718192021222324252627282930313233343536373839404142434445464748495051525354555657585960
peer
-005
7753
8, v
ersi
on 1
- 17
Mar
201
1
For Peer Review O
nly
22
ISO 2005. General requirements for the competence of testing and calibration
laboratories (ISO/IEC 17025:2005). Geneva 2005.
Larsson, B.K., Eriksson, A.T., and Cervenka, M. 1987. Polycyclic aromatic
hydrocarbons in crude and deodorized vegetable oils. Journal of American Oil
Chemist’s Society. 64: 365-370.
Lodovici, M., Dolara, P., Casalini, C., Ciappellano, S., and Testolin, G. 1995.
Polycyclic aromatic hydrocarbon contamination in the Italian diet. Food Additives and
Contaminants. 12: 703-713.
Menichini, E., Bocca, A., Merli, F., Ianni, D., and Monfredini, F. 1991. Polycyclic
aromatic hydrocarbons in olive oils on the Italian market. Food Additives and
Contaminants. 8: 363-369.
Moret, S. and Conte, L.S. 2000. Polycyclic aromatic hydrocarbons in edible fats and
oils: Occurrence and analytical methods. Review. Journal of Chromatography A. 882:
245-253.
Moret, S., Dudine, A., and Conte, L.S. 2000. Processing effects on the polyaromatic
hydrocarbon content of grapeseed oil. Journal of the American Oil Chemists’ Society.
77: 1289-1292.
Page 22 of 31
http://mc.manuscriptcentral.com/tfac Email: [email protected]
Food Additives and Contaminants
123456789101112131415161718192021222324252627282930313233343536373839404142434445464748495051525354555657585960
peer
-005
7753
8, v
ersi
on 1
- 17
Mar
201
1
For Peer Review O
nly
23
Moret, S., Piani, B., Bortolomeazzi, R., and Conte, L.S. 1997. HPLC determination of
polycyclic aromatic hydrocarbons in olive oils. Zeitschrift für Lebensmittel-
Untersuchung und -Forschung A. 205:116-120.
Pupin, A.M. and Toledo, M.C.F. 1996. Benzo(a)pyrene in olive oils on the Brazilian
market. Food Chemistry. 55: 185-188.
Speer, K., Steeg, E., Horstmann, P., Kühn, Th., and Montag, A. 1990. Determination
and distribution of polycyclic aromatic hydrocarbons in native vegetable oils, smoked
fish products, mussels and oysters, and bream from the river Elbe. Journal of High
Resolution Chromatography 13:104-111.
Swetman, T., Head, S., and Evans, D. 1999. Contamination of coconut oil by PAH.
Inform - International News on Fats Oils and Related Materials 10: 706-712.
Van der Wielen, J.C.A., Jansen, J.T.A., Martena, M.J., De Groot, H.N., In’t Veld, P.H.
2006. Determination of the level of benzo[a]pyrene in fatty foods and food supplements.
Food Additives and Contaminants 23: 709-714.
Page 23 of 31
http://mc.manuscriptcentral.com/tfac Email: [email protected]
Food Additives and Contaminants
123456789101112131415161718192021222324252627282930313233343536373839404142434445464748495051525354555657585960
peer
-005
7753
8, v
ersi
on 1
- 17
Mar
201
1
For Peer Review O
nly
Table 1. Compounds included in the method and method performance. LOD and LOQ
expressed as µg kg-1
oil.
Compound Formula MW RT LOD LOQ
Acenaphthylene C12H8 152.2 15.0 0.4 0.7
Acenaphthylene 13
C6 C12H8 158.2 15.0 - -
Acenaphthene C12H10 154.2 15.6 1.5 3.0
Fluorene C13H10 166.2 17.4 0.6 1.2
Fluorene 13
C6 C13H10 172.2 17.4 - -
Phenanthrene C14H10 178.2 20.7 1.3 2.6
Anthracene C14H10 178.2 20.8 0.2 0.5
Fluoranthene C16H10 202.3 24.7 1.2 2.3
Pyrene C16H10 202.3 25.5 1.2 2.3
Benzo[a]anthracene D12 C18D12 240.3 30.0 - -
Benzo[a]anthracene C18H12 228.3 30.0 0.4 0.9
Chrysene C18H12 228.3 30.2 0.3 0.6
Benzo[b]fluoranthene C20H12 252.3 36.0 0.6 1.2
Benzo[j]fluoranthene C20H12 252.3 36.1 0.5 1.0
Benzo[k]fluoranthene C20H12 252.3 36.3 0.5 1.1
Benzo[e]pyrene D12 C20D12 264.2 37.6 - -
Benzo[e]pyrene C20H12 252.3 37.8 0.3 0.5
Benzo[a]pyrene D12 C20D12 264.2 38.0 - -
Benzo[a]pyrene C20H12 252.3 38.2 0.2 0.5
Perylene C20H12 252.3 38.7 0.3 0.5
Indeno[1,2,3-c,d]pyrene C20H12 276.3 44.0 0.3 0.6
Indeno[1,2,3-c,d]pyrene D12 C22D12 288.4 43.9 - -
Dibenzo[a,h]anthracene C22H14 278.4 44.2 0.9 1.8
Benzo[g,h,i]perylene C22H12 276.3 45.2 0.2 0.3
Page 24 of 31
http://mc.manuscriptcentral.com/tfac Email: [email protected]
Food Additives and Contaminants
123456789101112131415161718192021222324252627282930313233343536373839404142434445464748495051525354555657585960
peer
-005
7753
8, v
ersi
on 1
- 17
Mar
201
1
For Peer Review Only
1
Table 2. Recovery, repeatability relative standard deviation (RSDr), intermediate reproducibility relative standard deviation (RSDR ) and
Horrat values for the spiking level 1 µg kg-1
, 2 µg kg-1
and 3 µg kg-1
.
Recovery [%] RSDr [%] RSDR [%] Horrat value 1 µg kg
-1 2 µg kg
-1 3 µg kg
-1 1 µg kg
-1 2 µg kg
-1 3 µg kg
-1 1 µg kg
-1 2 µg kg
-1 3
a) µg kg
-1 1 µg kg
-1 2 µg kg
-1 3 µg kg
-1
N 14 13 9 3 5 5 5 5 2 5 5 2
Acenaphtylene 78 76 75 1 2 1 6 8 6 0.1 0.2 0.2
Acenaphthene 59 68 85 24 26 12 22 50 26 0.5 1.3 0.7
Fluorene 72 77 79 21 12 5 15 13 1 0.3 0.3 0.0
Phenanthrene 84 99 82 7 5 3 1 28 4 0.02 0.7 0.1
Anthracene 94 89 90 5 8 5 11 12 1 0.2 0.3 0.0
Fluoranthene 111 113 97 12 8 8 7 16 10 0.2 0.4 0.3
Pyrene 86 119 93 13 12 7 6 24 10 0.1 0.6 0.3
Benzo[a]anthracene 89 87 80 7 8 6 8 17 4 0.2 0.4 0.1
Chrysene 90 80 82 3 6 4 3 11 1 0.1 0.3 0.0
Benzo[j]fluoranthene 88 95 88 12 17 8 15 16 30 0.3 0.4 0.8
Benzo[b]fluoranthene 100 142 135 20 79 30 9 86 8 0.2 2.2 0.2
Benzo[k]fluoranthene 70 73 70 13 8 11 11 11 3 0.2 0.3 0.1
Benzo[e]pyrene 89 85 92 5 4 6 3 9 7 0.1 0.2 0.2
Benzo[a]pyrene 87 85 89 1 3 4 8 7 1 0.2 0.2 0.0
Perylene 86 82 88 4 5 4 4 7 2 0.1 0.2 0.1
Indeno[1,2,3-c,d]pyrene 81 80 81 7 9 5 8 15 12 0.2 0.4 0.3
Dibenzo[a,h]anthracene 120 102 94 19 13 6 15 18 7 0.3 0.5 0.2
Benzo[g,h,i]perylene 65 60 68 10 14 5 18 29 15 0.4 0.7 0.4 a)
Indicative results only, as N = 2
Page 25 of 31
http://mc.manuscriptcentral.com/tfac Email: [email protected]
Food Additives and Contaminants
123456789101112131415161718192021222324252627282930313233343536373839404142434445464748495051525354555657585960
peer
-005
7753
8, v
ersi
on 1
- 17
Mar
201
1
For Peer Review O
nly
Table 3. Recovery of labelled compounds for the spiking level 1 µg kg-1
, 2 µg kg-1
and 3
µg kg-1
[percent].
Recovery [%]
1 µg kg-1
2 µg kg-1
3 µg kg-1
N 14 13 9
Acenaphthylene 13
C6 89 101 104
Fluorene 13
C6 93 106 109
Benzo[a]anthracene D12 93 82 95
Benzo[a]pyrene D12 94 79 91
Indeno[1,2,3-c,d]pyrene D12 97 80 93
Page 26 of 31
http://mc.manuscriptcentral.com/tfac Email: [email protected]
Food Additives and Contaminants
123456789101112131415161718192021222324252627282930313233343536373839404142434445464748495051525354555657585960
peer
-005
7753
8, v
ersi
on 1
- 17
Mar
201
1
For Peer Review O
nly
Table 4. Average, ranges and median of benzo[a]pyrene concentration in µg kg-1
for vegetable oils
analysed with country of origin including values for references.
Deod. = deodorized oil.
Origin codes: AT = Austria, BE = Belgium, DE = Germany, DK = Denmark, ES = Spain, FR = France, GR = Greece,
IT = Italy, NL = Holland.
Vegetable oil N Average Range Median Origin
Olive oil, extra virgin 46 0.15 <0.2-0.4 0.10 IT, ES, GR, FR, NL
Olive oil 6 0.12 <0.2-0.2 0.10 IT, ES
Rapeseed oil 8 0.15 <0.2-0.3 0.10 DK, BE, DE, AT
Sunflower oil 3 0.4 <0.2-0.8 0.3 IT
Sunflower oil 1 11 NL
Grape seed oil 4 1.0 0.2-1.8 1.0 IT, ES, BE
Sesame oil 1 0.2 DE
Reference
Virgin olive oil 671 0.4 0.015 - 32 0.2 European Comm., 2004
Virgin olive oil 2 <0.02 - 0.7 Hopia et al., 1986
Virgin olive oil 52 <0.015 - 1.2 Moret et al., 1997
Virgin olive oil 6 < 3 Menichini et al., 1991
Virgin olive oil 3 0.1 Lodovici et al., 1995
Olive oil 280 1.7 0.03 - 89 0.3 European Comm., 2004
Olive oil 32 0.5 - 164 Pupin and Toledo, 1996
Olive pomace oil 268 18 <0.1 - 206 9.6 European Comm., 2004
Olive oil 7 0.7 0.2 -1.2 Speer et al., 1990
Rapeseed oil, deod. 2 0.8 0.3 - 1.3 Larsson et al., 1987
Rapeseed oil 18 0.3 <0.03 - 1.3 0.1 European Comm., 2004
Refined rapeseed oil 24 1.8 0.3 - 69 Dennis et al., 1991
Sunflower oil 5 0.7 <0.1 - 0.8 Speer et al., 1990
Sunflower oil 201 3.1 <0.015 - 232 0.4 European Comm., 2004
Grape seed oil 92 4.2 0.05 - 73 0.6 European Comm., 2004
Grape seed oil 20 20 8.6-44 Moret et al., 2000
Page 27 of 31
http://mc.manuscriptcentral.com/tfac Email: [email protected]
Food Additives and Contaminants
123456789101112131415161718192021222324252627282930313233343536373839404142434445464748495051525354555657585960
peer
-005
7753
8, v
ersi
on 1
- 17
Mar
201
1
For Peer Review O
nly
1
Table 5. Average and ranges of total sum of PAHs, sum of genotoxic PAHs and sums of light
and heavy PAHs in µg kg-1
for vegetable oils analysed.
Vegetable oil N Total PAHs
Average
Genotoxic PAHsa)
Average
Light PAHsb)
Average
Heavy PAHsc)
Average
Olive oil, extra
virgin
46
16
2.7
15
1.6
Olive oil 6 8.1 1.9 6.8 1.3
Rapeseed oil 8 5.5 1.3 4.0 1.5
Sunflower oil 3 7.4 3.7 3.8 3.7
Sunflower oil 1 172 93 97 75
Grape seed oil 4 42 11 35 7.2
Sesame oil 1 11 1.6 9.8 1.2 a) Genotoxic PAHs include the sum of benzo[a]anthracene, chrysene, benzo[b+j]fluoranthene, benzo[k]-
fluoranthene, benzo[a]pyrene, indeno[1,2,3-c,d]pyrene, dibenzo[a,h]anthracene, and
benzo[g,h,i]perylene. b) Light PAHs (4 or less aromatic rings) include the sum of acenaphthylene, acenaphthene, fluorene,
anthracene, fluoranthene, pyrene, benzo[a]anthracene and chrysene c) Heavy PAHs (5 or more aromatic rings) include the sum of benzo[b+j]fluoranthene, benzo[k]fluor-
anthene, benzo[e]pyrene, benzo[a]pyrene, perylene, indeno[1,2,3-c,d]pyrene, dibenzo[a,h]anthracene,
benzo[g,h,i]perylene.
Page 28 of 31
http://mc.manuscriptcentral.com/tfac Email: [email protected]
Food Additives and Contaminants
123456789101112131415161718192021222324252627282930313233343536373839404142434445464748495051525354555657585960
peer
-005
7753
8, v
ersi
on 1
- 17
Mar
201
1
For Peer Review O
nly
Figure 1. Procedure for sample preparation of edible oils.
GPC clean-upusing Bio-beads S-X3
and cyclohexane-ethylacetate
Evaporation of solvent
GC-MS analysis
Addition of injection standard
Evaporation of solvent
SPE clean-upUsing silica gel column
and cyclohexane
Addition of ISTD to the sample(edible oil)
Page 29 of 31
http://mc.manuscriptcentral.com/tfac Email: [email protected]
Food Additives and Contaminants
123456789101112131415161718192021222324252627282930313233343536373839404142434445464748495051525354555657585960
peer
-005
7753
8, v
ersi
on 1
- 17
Mar
201
1
For Peer Review O
nly
Figure 2. Residual plot for the calibration curve of benzo[a]pyrene showing two
standards analyzed at each concentration level.
-0.08
-0.06
-0.04
-0.02
0
0.02
0.04
0.06
0.08
0 50 100 150 200 250
ng ml-1
Resid
ual
Page 30 of 31
http://mc.manuscriptcentral.com/tfac Email: [email protected]
Food Additives and Contaminants
123456789101112131415161718192021222324252627282930313233343536373839404142434445464748495051525354555657585960
peer
-005
7753
8, v
ersi
on 1
- 17
Mar
201
1
For Peer Review O
nly
RT: 38.0 - 38.5 SM: 5G
38.0 38.2 38.4
Time (min)
20
40
60
80
100RT: 38.2
RT: 37.8 - 38.3 SM: 5G
37.8 38.0 38.2
Time (min)
20
40
60
80
100RT: 38.0
Figure 3. The chromatogram for benzo[a]pyrene in olive oil added 1 µg kg
-1 PAH
standard (left) and the corresponding internal standard benzo[a]pyrene D12 (right).
Page 31 of 31
http://mc.manuscriptcentral.com/tfac Email: [email protected]
Food Additives and Contaminants
123456789101112131415161718192021222324252627282930313233343536373839404142434445464748495051525354555657585960
peer
-005
7753
8, v
ersi
on 1
- 17
Mar
201
1
![Polycyclic aromatic hydrocarbons (PAH) guidance · Polycyclic aromatic hydrocarbons (Benzo[a]pyrene) General Information Key Points Identity The term polycyclic aromatic hydrocarbons](https://img.pdfslide.us/doc/110x75/5af498db7f8b9a8d1c8c6b2b/polycyclic-aromatic-hydrocarbons-pah-guidance-aromatic-hydrocarbons-benzoapyrene.jpg)