Embed Size (px)
Citation preview
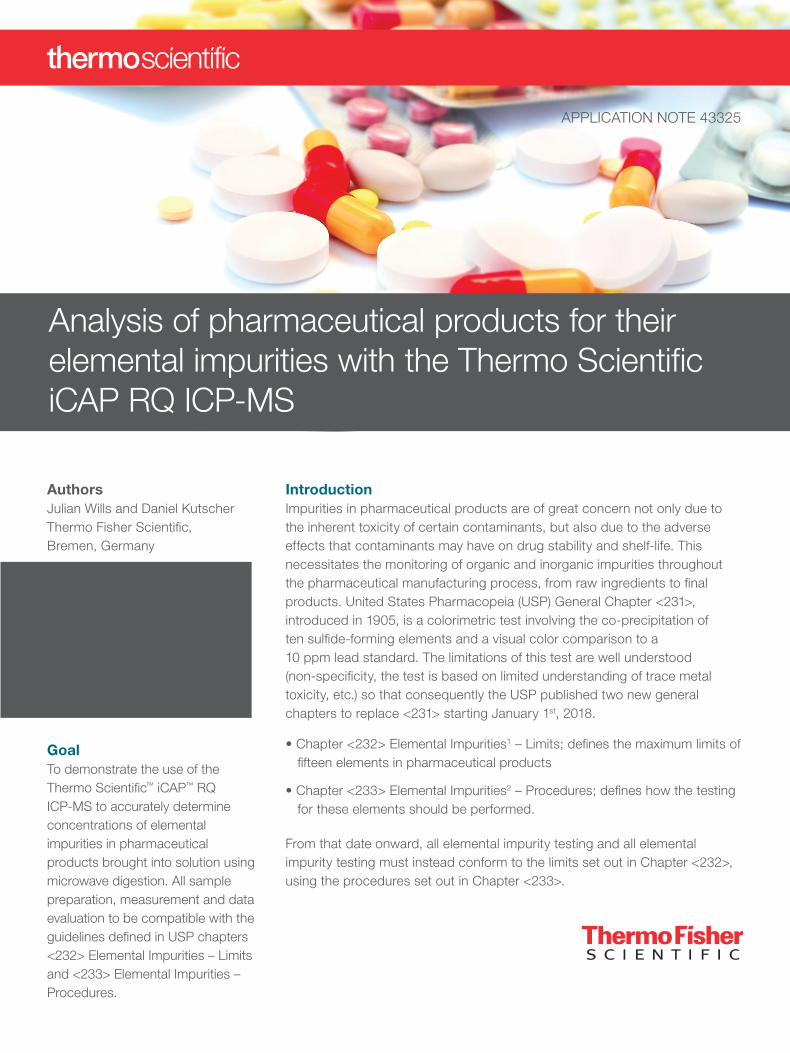
Analysis of pharmaceutical products for their elemental impurities with the Thermo Scientific iCAP RQ ICP-MS
AuthorsJulian Wills and Daniel Kutscher Thermo Fisher Scientific, Bremen, Germany
KeywordsFDA 21 CFR part 11, Microwave digestion, Pharmaceutical compliance, Pharmaceutical preparations, United States pharmacopeia, USP 232, USP 233
IntroductionImpurities in pharmaceutical products are of great concern not only due to the inherent toxicity of certain contaminants, but also due to the adverse effects that contaminants may have on drug stability and shelf-life. This necessitates the monitoring of organic and inorganic impurities throughout the pharmaceutical manufacturing process, from raw ingredients to final products. United States Pharmacopeia (USP) General Chapter <231>, introduced in 1905, is a colorimetric test involving the co-precipitation of ten sulfide-forming elements and a visual color comparison to a 10 ppm lead standard. The limitations of this test are well understood (non-specificity, the test is based on limited understanding of trace metal toxicity, etc.) so that consequently the USP published two new general chapters to replace <231> starting January 1st, 2018.
• Chapter <232> Elemental Impurities1 – Limits; defines the maximum limits of fifteen elements in pharmaceutical products
• Chapter <233> Elemental Impurities2 – Procedures; defines how the testing for these elements should be performed.
From that date onward, all elemental impurity testing and all elemental impurity testing must instead conform to the limits set out in Chapter <232>, using the procedures set out in Chapter <233>.
APPLICATION NOTE 43325
GoalTo demonstrate the use of the Thermo Scientific™ iCAP™ RQ ICP-MS to accurately determine concentrations of elemental impurities in pharmaceutical products brought into solution using microwave digestion. All sample preparation, measurement and data evaluation to be compatible with the guidelines defined in USP chapters <232> Elemental Impurities – Limits and <233> Elemental Impurities – Procedures.
In addition to the requirements described in the USP documents, any analytical system used for the creation of analysis data for pharmaceuticals must also comply with the US Food and Drug Administration’s (FDA) 21 CFR Part 11 regulations regarding electronic records and validation of electronic signatures. These regulations are concerned with ensuring the integrity and authenticity of any electronic records and electronic signatures that ‘persons create, modify, maintain, archive, retrieve or transmit’3. Control software used by analytical instruments in pharmaceutical production must therefore incorporate tools to maintain the integrity of the analytical method and subsequent results. In order to provide a transparent pathway to data generation, the control software should include support for audit trails and electronic signatures as well as security features to ensure that alterations cannot be made without clear indication of what has been changed, who changed it and why.
This note describes the effective application of the Thermo Scientific™ iCAP™ RQ single quadrupole (SQ) ICP-MS, to the detection and quantification of the 15 target elements specified in USP <232>, in accordance with the ICP-MS procedures described in USP <233>. In order to generate data compliant with the procedures described in 21 CFR Part 11, the Thermo Scientific Qtegra™ Intelligent Scientific Data Solution™ (ISDS) Software includes comprehensive features for the pharmaceutical industry, such as user access levels, audit trails, support for electronic signatures as well as integrated, secure data management.Sample preparation It has been demonstrated that direct aqueous dissolution is suited for the preparation of water soluble pharmaceutical samples before subsequent USP <233> compliant ICP-MS analysis. Indirect dissolution via closed vessel microwave digestion, however, is recognized as the most universal sample preparation method for materials for subsequent elemental analysis by ICP-MS. An important advantage of the closed vessel microwave approach is the retention of volatile elements, in particular mercury that might otherwise be lost.
Three pharmaceutical products were selected for analysis as part of this study: Drug A: a phytotherapeutic (herbal) medicine Drug B: a vascular medicine Drug C: an antianxiety medicine
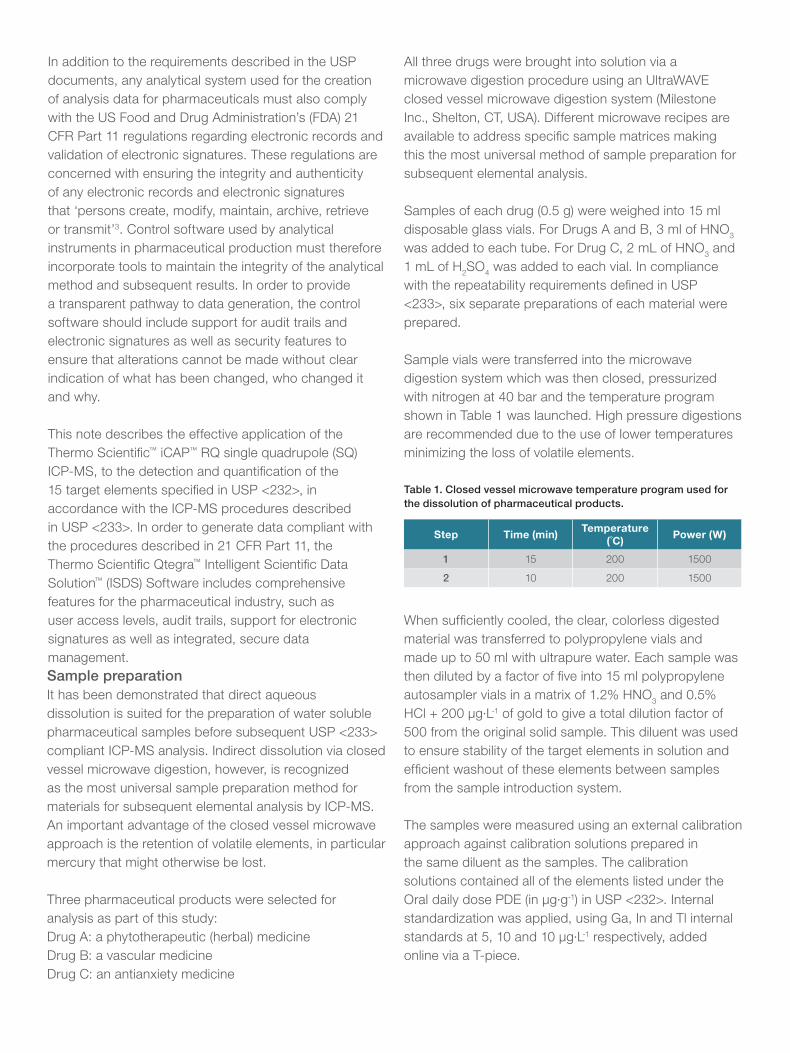
Table 1. Closed vessel microwave temperature program used forthe dissolution of pharmaceutical products.
Step Time (min)Temperature
( ˚C)Power (W)
1 15 200 1500
2 10 200 1500
All three drugs were brought into solution via a microwave digestion procedure using an UltraWAVE closed vessel microwave digestion system (Milestone Inc., Shelton, CT, USA). Different microwave recipes are available to address specific sample matrices making this the most universal method of sample preparation for subsequent elemental analysis.
Samples of each drug (0.5 g) were weighed into 15 ml disposable glass vials. For Drugs A and B, 3 ml of HNO3 was added to each tube. For Drug C, 2 mL of HNO3 and 1 mL of H2SO4 was added to each vial. In compliance with the repeatability requirements defined in USP <233>, six separate preparations of each material were prepared.
Sample vials were transferred into the microwave digestion system which was then closed, pressurized with nitrogen at 40 bar and the temperature program shown in Table 1 was launched. High pressure digestions are recommended due to the use of lower temperatures minimizing the loss of volatile elements.
When sufficiently cooled, the clear, colorless digested material was transferred to polypropylene vials and made up to 50 ml with ultrapure water. Each sample was then diluted by a factor of five into 15 ml polypropylene autosampler vials in a matrix of 1.2% HNO3 and 0.5% HCl + 200 μg·L-1 of gold to give a total dilution factor of 500 from the original solid sample. This diluent was used to ensure stability of the target elements in solution and efficient washout of these elements between samples from the sample introduction system.
The samples were measured using an external calibration approach against calibration solutions prepared in the same diluent as the samples. The calibration solutions contained all of the elements listed under the Oral daily dose PDE (in µg·g-1) in USP <232>. Internal standardization was applied, using Ga, In and Tl internal standards at 5, 10 and 10 µg·L-1 respectively, added online via a T-piece.
With this target limit taken into account, and as the samples were diluted by a factor of 500 from the original sample, two multielemental calibration solutions were prepared at the concentration levels 0.5J and 2J in 2% HNO3.
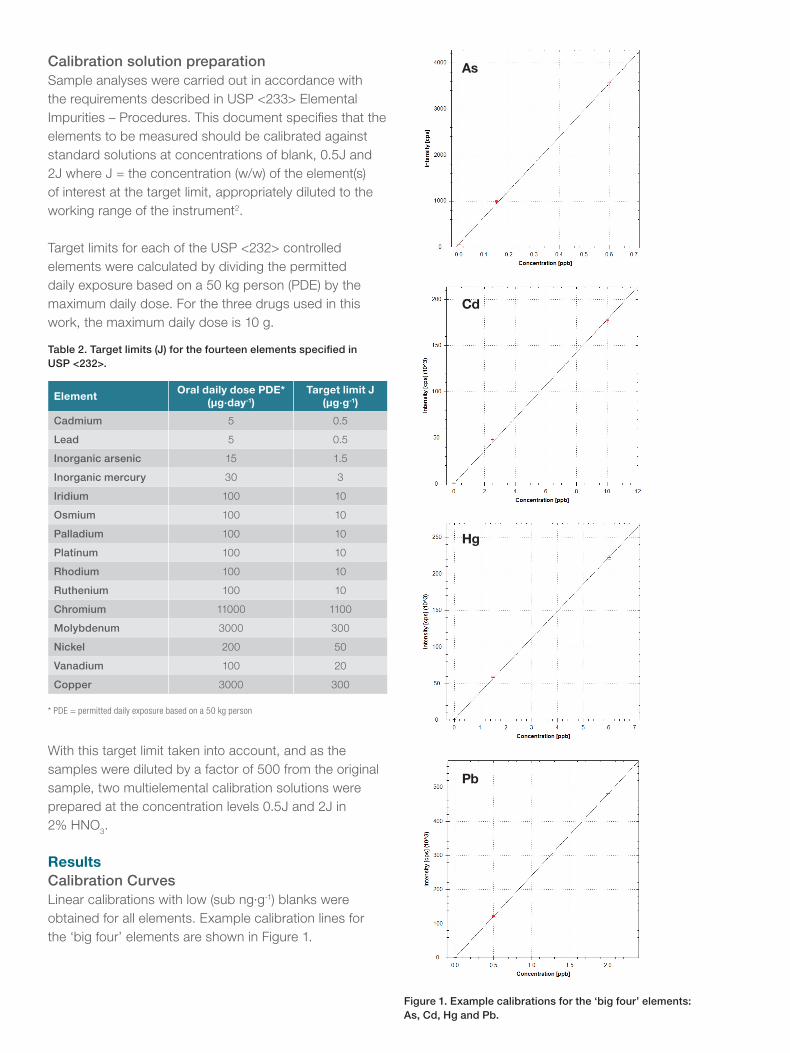
ResultsCalibration CurvesLinear calibrations with low (sub ng·g-1) blanks were obtained for all elements. Example calibration lines for the ‘big four’ elements are shown in Figure 1.
Table 2. Target limits (J) for the fourteen elements specified in USP <232>.
* PDE = permitted daily exposure based on a 50 kg person
ElementOral daily dose PDE*
(µg·day-1)Target limit J
(µg·g-1)
Cadmium 5 0.5
Lead 5 0.5
Inorganic arsenic 15 1.5
Inorganic mercury 30 3
Iridium 100 10
Osmium 100 10
Palladium 100 10
Platinum 100 10
Rhodium 100 10
Ruthenium 100 10
Chromium 11000 1100
Molybdenum 3000 300
Nickel 200 50
Vanadium 100 20
Copper 3000 300
Calibration solution preparationSample analyses were carried out in accordance with the requirements described in USP <233> Elemental Impurities – Procedures. This document specifies that the elements to be measured should be calibrated against standard solutions at concentrations of blank, 0.5J and 2J where J = the concentration (w/w) of the element(s) of interest at the target limit, appropriately diluted to the working range of the instrument2.
Target limits for each of the USP <232> controlled elements were calculated by dividing the permitted daily exposure based on a 50 kg person (PDE) by the maximum daily dose. For the three drugs used in this work, the maximum daily dose is 10 g.
Figure 1. Example calibrations for the ‘big four’ elements: As, Cd, Hg and Pb.
As
Cd
Hg
Pb
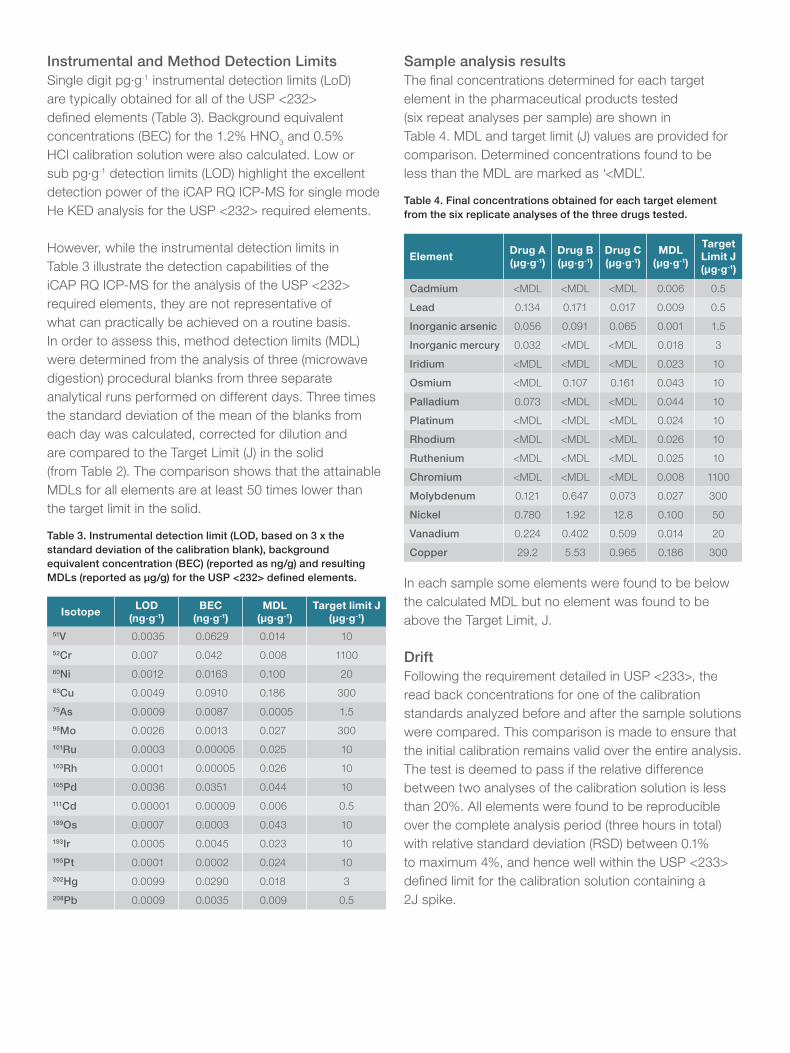
Instrumental and Method Detection LimitsSingle digit pg·g-1 instrumental detection limits (LoD) are typically obtained for all of the USP <232> defined elements (Table 3). Background equivalent concentrations (BEC) for the 1.2% HNO3 and 0.5% HCl calibration solution were also calculated. Low or sub pg·g-1 detection limits (LOD) highlight the excellent detection power of the iCAP RQ ICP-MS for single mode He KED analysis for the USP <232> required elements.
However, while the instrumental detection limits in Table 3 illustrate the detection capabilities of the iCAP RQ ICP-MS for the analysis of the USP <232> required elements, they are not representative of what can practically be achieved on a routine basis. In order to assess this, method detection limits (MDL) were determined from the analysis of three (microwave digestion) procedural blanks from three separate analytical runs performed on different days. Three times the standard deviation of the mean of the blanks from each day was calculated, corrected for dilution and are compared to the Target Limit (J) in the solid (from Table 2). The comparison shows that the attainable MDLs for all elements are at least 50 times lower than the target limit in the solid.
Table 3. Instrumental detection limit (LOD, based on 3 x thestandard deviation of the calibration blank), backgroundequivalent concentration (BEC) (reported as ng/g) and resultingMDLs (reported as μg/g) for the USP <232> defined elements.
IsotopeLOD
(ng·g-1)BEC
(ng·g-1)MDL
(µg·g-1)Target limit J
(µg·g-1)51V 0.0035 0.0629 0.014 1052Cr 0.007 0.042 0.008 110060Ni 0.0012 0.0163 0.100 2063Cu 0.0049 0.0910 0.186 30075As 0.0009 0.0087 0.0005 1.595Mo 0.0026 0.0013 0.027 300101Ru 0.0003 0.00005 0.025 10103Rh 0.0001 0.00005 0.026 10105Pd 0.0036 0.0351 0.044 10111Cd 0.00001 0.00009 0.006 0.5189Os 0.0007 0.0003 0.043 10193Ir 0.0005 0.0045 0.023 10195Pt 0.0001 0.0002 0.024 10202Hg 0.0099 0.0290 0.018 3208Pb 0.0009 0.0035 0.009 0.5
Sample analysis resultsThe final concentrations determined for each target element in the pharmaceutical products tested (six repeat analyses per sample) are shown in Table 4. MDL and target limit (J) values are provided for comparison. Determined concentrations found to be less than the MDL are marked as ‘<MDL’.
Table 4. Final concentrations obtained for each target element from the six replicate analyses of the three drugs tested.
ElementDrug A (µg·g-1)
Drug B (µg·g-1)
Drug C (µg·g-1)
MDL (µg·g-1)
Target Limit J (µg·g-1)
Cadmium <MDL <MDL <MDL 0.006 0.5
Lead 0.134 0.171 0.017 0.009 0.5
Inorganic arsenic 0.056 0.091 0.065 0.001 1.5
Inorganic mercury 0.032 <MDL <MDL 0.018 3
Iridium <MDL <MDL <MDL 0.023 10
Osmium <MDL 0.107 0.161 0.043 10
Palladium 0.073 <MDL <MDL 0.044 10
Platinum <MDL <MDL <MDL 0.024 10
Rhodium <MDL <MDL <MDL 0.026 10
Ruthenium <MDL <MDL <MDL 0.025 10
Chromium <MDL <MDL <MDL 0.008 1100
Molybdenum 0.121 0.647 0.073 0.027 300
Nickel 0.780 1.92 12.8 0.100 50
Vanadium 0.224 0.402 0.509 0.014 20
Copper 29.2 5.53 0.965 0.186 300
In each sample some elements were found to be below the calculated MDL but no element was found to be above the Target Limit, J.
DriftFollowing the requirement detailed in USP <233>, the read back concentrations for one of the calibration standards analyzed before and after the sample solutions were compared. This comparison is made to ensure that the initial calibration remains valid over the entire analysis. The test is deemed to pass if the relative difference between two analyses of the calibration solution is less than 20%. All elements were found to be reproducible over the complete analysis period (three hours in total) with relative standard deviation (RSD) between 0.1% to maximum 4%, and hence well within the USP <233> defined limit for the calibration solution containing a 2J spike.
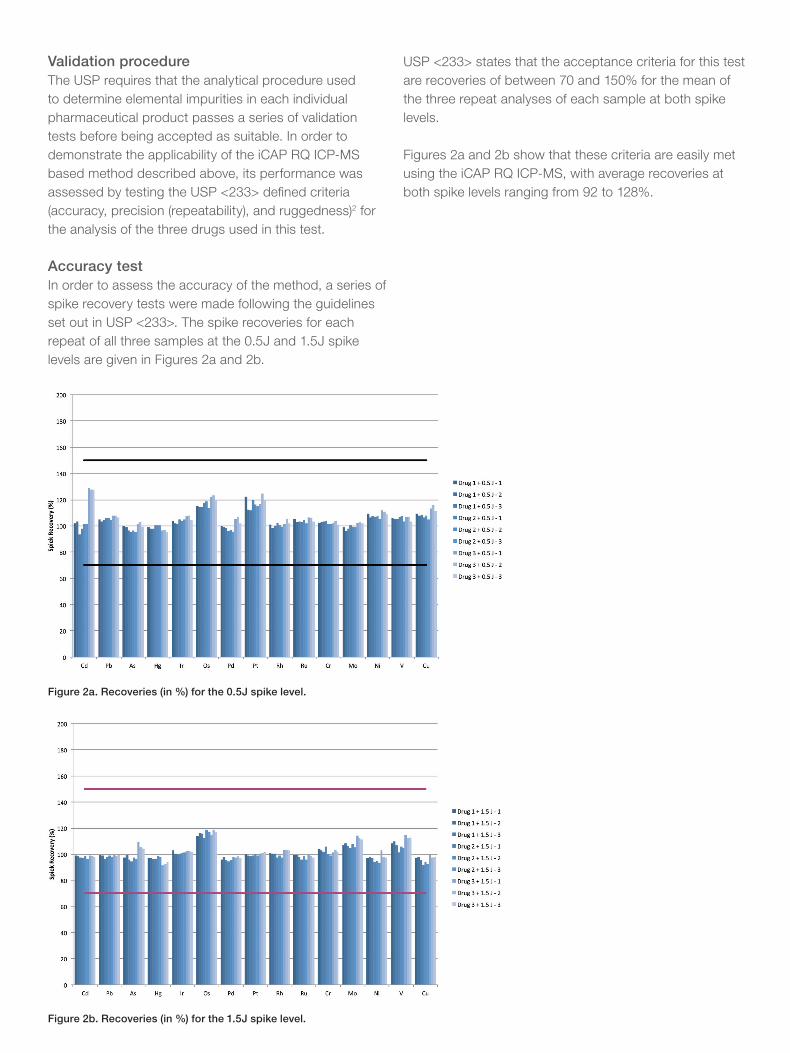
Figure 2a. Recoveries (in %) for the 0.5J spike level.
Figure 2b. Recoveries (in %) for the 1.5J spike level.
Figures 2a and 2b show that these criteria are easily met using the iCAP RQ ICP-MS, with average recoveries at both spike levels ranging from 92 to 128%.
Validation procedureThe USP requires that the analytical procedure used to determine elemental impurities in each individual pharmaceutical product passes a series of validation tests before being accepted as suitable. In order to demonstrate the applicability of the iCAP RQ ICP-MS based method described above, its performance was assessed by testing the USP <233> defined criteria (accuracy, precision (repeatability), and ruggedness)2 for the analysis of the three drugs used in this test.
Accuracy testIn order to assess the accuracy of the method, a series of spike recovery tests were made following the guidelines set out in USP <233>. The spike recoveries for each repeat of all three samples at the 0.5J and 1.5J spike levels are given in Figures 2a and 2b.
USP <233> states that the acceptance criteria for this test are recoveries of between 70 and 150% for the mean of the three repeat analyses of each sample at both spike levels.
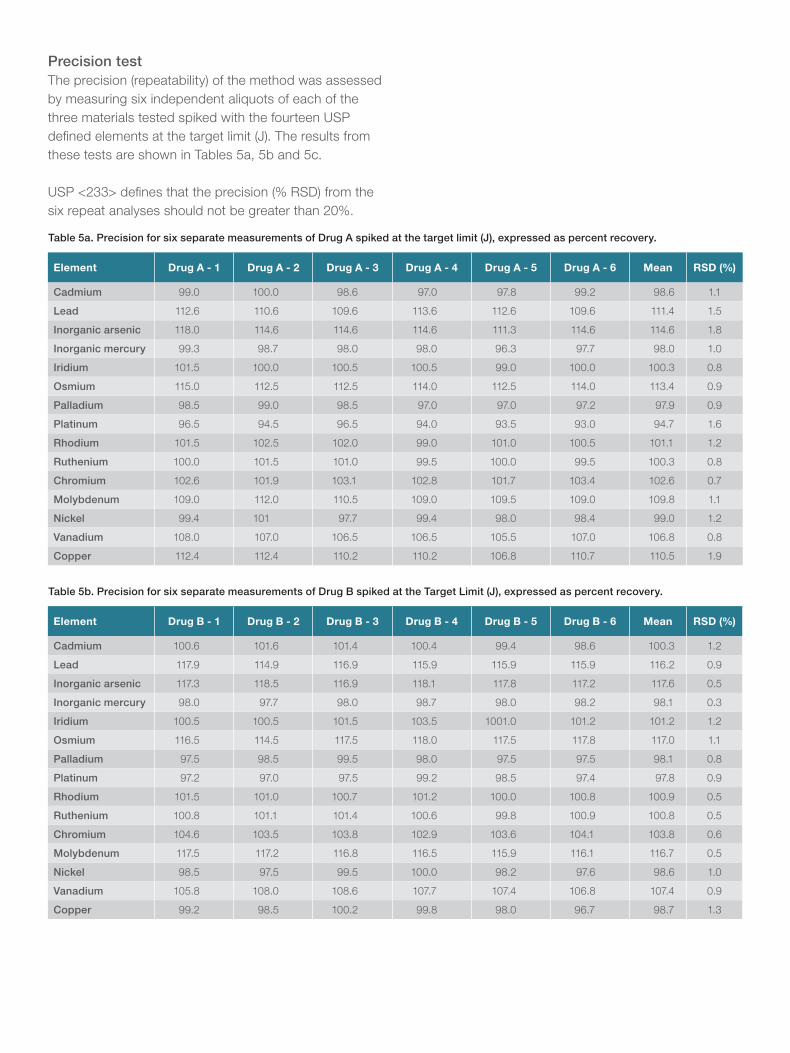
Precision testThe precision (repeatability) of the method was assessed by measuring six independent aliquots of each of the three materials tested spiked with the fourteen USP defined elements at the target limit (J). The results from these tests are shown in Tables 5a, 5b and 5c.
USP <233> defines that the precision (% RSD) from the six repeat analyses should not be greater than 20%.
Table 5a. Precision for six separate measurements of Drug A spiked at the target limit (J), expressed as percent recovery.
Table 5b. Precision for six separate measurements of Drug B spiked at the Target Limit (J), expressed as percent recovery.
Element Drug A - 1 Drug A - 2 Drug A - 3 Drug A - 4 Drug A - 5 Drug A - 6 Mean RSD (%)
Cadmium 99.0 100.0 98.6 97.0 97.8 99.2 98.6 1.1
Lead 112.6 110.6 109.6 113.6 112.6 109.6 111.4 1.5
Inorganic arsenic 118.0 114.6 114.6 114.6 111.3 114.6 114.6 1.8
Inorganic mercury 99.3 98.7 98.0 98.0 96.3 97.7 98.0 1.0
Iridium 101.5 100.0 100.5 100.5 99.0 100.0 100.3 0.8
Osmium 115.0 112.5 112.5 114.0 112.5 114.0 113.4 0.9
Palladium 98.5 99.0 98.5 97.0 97.0 97.2 97.9 0.9
Platinum 96.5 94.5 96.5 94.0 93.5 93.0 94.7 1.6
Rhodium 101.5 102.5 102.0 99.0 101.0 100.5 101.1 1.2
Ruthenium 100.0 101.5 101.0 99.5 100.0 99.5 100.3 0.8
Chromium 102.6 101.9 103.1 102.8 101.7 103.4 102.6 0.7
Molybdenum 109.0 112.0 110.5 109.0 109.5 109.0 109.8 1.1
Nickel 99.4 101 97.7 99.4 98.0 98.4 99.0 1.2
Vanadium 108.0 107.0 106.5 106.5 105.5 107.0 106.8 0.8
Copper 112.4 112.4 110.2 110.2 106.8 110.7 110.5 1.9
Element Drug B - 1 Drug B - 2 Drug B - 3 Drug B - 4 Drug B - 5 Drug B - 6 Mean RSD (%)
Cadmium 100.6 101.6 101.4 100.4 99.4 98.6 100.3 1.2
Lead 117.9 114.9 116.9 115.9 115.9 115.9 116.2 0.9
Inorganic arsenic 117.3 118.5 116.9 118.1 117.8 117.2 117.6 0.5
Inorganic mercury 98.0 97.7 98.0 98.7 98.0 98.2 98.1 0.3
Iridium 100.5 100.5 101.5 103.5 1001.0 101.2 101.2 1.2
Osmium 116.5 114.5 117.5 118.0 117.5 117.8 117.0 1.1
Palladium 97.5 98.5 99.5 98.0 97.5 97.5 98.1 0.8
Platinum 97.2 97.0 97.5 99.2 98.5 97.4 97.8 0.9
Rhodium 101.5 101.0 100.7 101.2 100.0 100.8 100.9 0.5
Ruthenium 100.8 101.1 101.4 100.6 99.8 100.9 100.8 0.5
Chromium 104.6 103.5 103.8 102.9 103.6 104.1 103.8 0.6
Molybdenum 117.5 117.2 116.8 116.5 115.9 116.1 116.7 0.5
Nickel 98.5 97.5 99.5 100.0 98.2 97.6 98.6 1.0
Vanadium 105.8 108.0 108.6 107.7 107.4 106.8 107.4 0.9
Copper 99.2 98.5 100.2 99.8 98.0 96.7 98.7 1.3
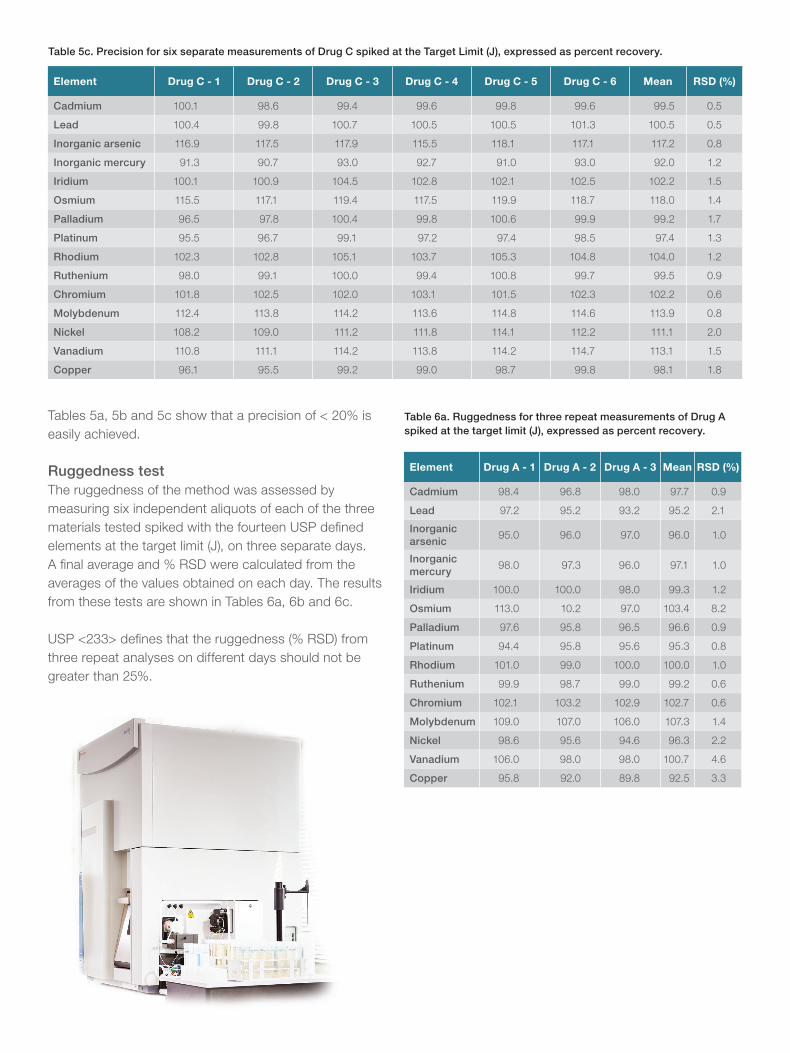
Tables 5a, 5b and 5c show that a precision of < 20% is easily achieved.
Ruggedness testThe ruggedness of the method was assessed by measuring six independent aliquots of each of the three materials tested spiked with the fourteen USP defined elements at the target limit (J), on three separate days. A final average and % RSD were calculated from the averages of the values obtained on each day. The results from these tests are shown in Tables 6a, 6b and 6c.
USP <233> defines that the ruggedness (% RSD) from three repeat analyses on different days should not be greater than 25%.
Table 5c. Precision for six separate measurements of Drug C spiked at the Target Limit (J), expressed as percent recovery.
Table 6a. Ruggedness for three repeat measurements of Drug A spiked at the target limit (J), expressed as percent recovery.
Element Drug C - 1 Drug C - 2 Drug C - 3 Drug C - 4 Drug C - 5 Drug C - 6 Mean RSD (%)
Cadmium 100.1 98.6 99.4 99.6 99.8 99.6 99.5 0.5
Lead 100.4 99.8 100.7 100.5 100.5 101.3 100.5 0.5
Inorganic arsenic 116.9 117.5 117.9 115.5 118.1 117.1 117.2 0.8
Inorganic mercury 91.3 90.7 93.0 92.7 91.0 93.0 92.0 1.2
Iridium 100.1 100.9 104.5 102.8 102.1 102.5 102.2 1.5
Osmium 115.5 117.1 119.4 117.5 119.9 118.7 118.0 1.4
Palladium 96.5 97.8 100.4 99.8 100.6 99.9 99.2 1.7
Platinum 95.5 96.7 99.1 97.2 97.4 98.5 97.4 1.3
Rhodium 102.3 102.8 105.1 103.7 105.3 104.8 104.0 1.2
Ruthenium 98.0 99.1 100.0 99.4 100.8 99.7 99.5 0.9
Chromium 101.8 102.5 102.0 103.1 101.5 102.3 102.2 0.6
Molybdenum 112.4 113.8 114.2 113.6 114.8 114.6 113.9 0.8
Nickel 108.2 109.0 111.2 111.8 114.1 112.2 111.1 2.0
Vanadium 110.8 111.1 114.2 113.8 114.2 114.7 113.1 1.5
Copper 96.1 95.5 99.2 99.0 98.7 99.8 98.1 1.8
Element Drug A - 1 Drug A - 2 Drug A - 3 Mean RSD (%)
Cadmium 98.4 96.8 98.0 97.7 0.9
Lead 97.2 95.2 93.2 95.2 2.1
Inorganic arsenic
95.0 96.0 97.0 96.0 1.0
Inorganic mercury
98.0 97.3 96.0 97.1 1.0
Iridium 100.0 100.0 98.0 99.3 1.2
Osmium 113.0 10.2 97.0 103.4 8.2
Palladium 97.6 95.8 96.5 96.6 0.9
Platinum 94.4 95.8 95.6 95.3 0.8
Rhodium 101.0 99.0 100.0 100.0 1.0
Ruthenium 99.9 98.7 99.0 99.2 0.6
Chromium 102.1 103.2 102.9 102.7 0.6
Molybdenum 109.0 107.0 106.0 107.3 1.4
Nickel 98.6 95.6 94.6 96.3 2.2
Vanadium 106.0 98.0 98.0 100.7 4.6
Copper 95.8 92.0 89.8 92.5 3.3
For Research Use Only. Not for use in diagnostic procedures. ©2017 Thermo Fisher Scientific Inc. All rights reserved. UltraWAVE is used in commerce by Milestone Inc. USP is a trademark of the United States Pharmacopeia. All other trademarks are the property of Thermo Fisher Scientific and its subsidiaries. This information is presented as an example of the capabilities of Thermo Fisher Scientific products. It is not intended to encourage use of these products in any manners that might infringe the intellectual property rights of others. Specifications, terms and pricing are subject to change. Not all products are available in all countries. Please consult your local sales representative for details. AN43325-EN 1217
Find out more at thermofisher.com/SQ-ICP-MS
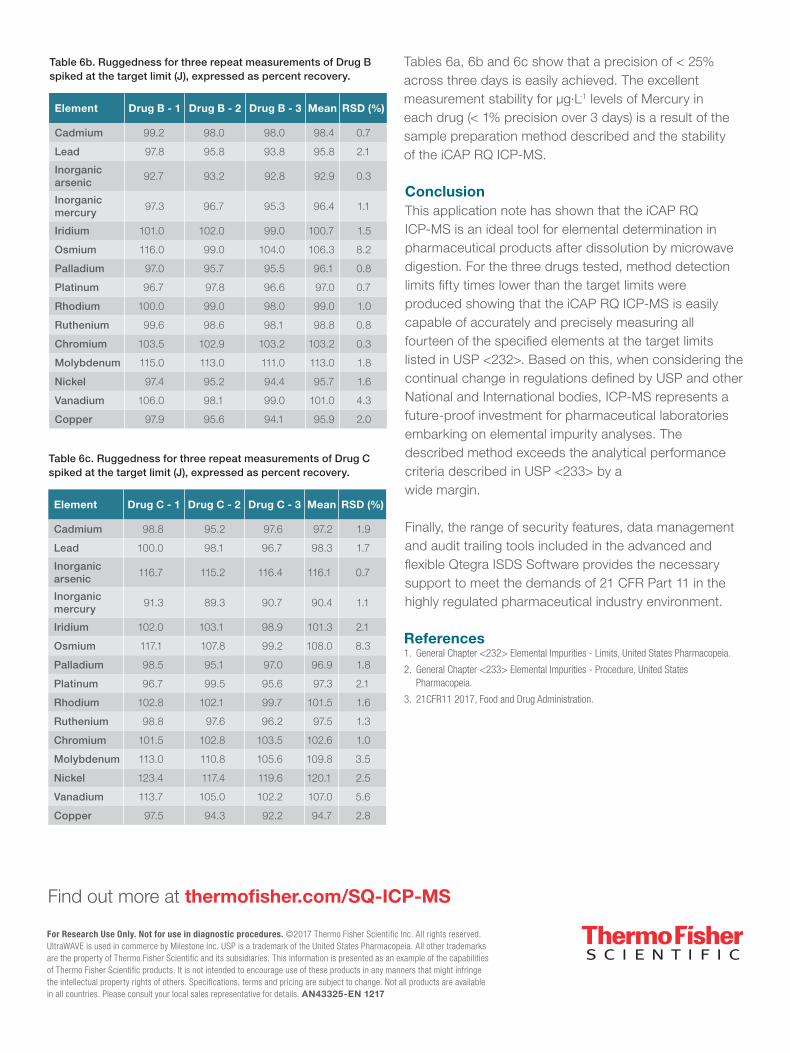
ConclusionThis application note has shown that the iCAP RQ ICP-MS is an ideal tool for elemental determination in pharmaceutical products after dissolution by microwave digestion. For the three drugs tested, method detection limits fifty times lower than the target limits were produced showing that the iCAP RQ ICP-MS is easily capable of accurately and precisely measuring all fourteen of the specified elements at the target limits listed in USP <232>. Based on this, when considering the continual change in regulations defined by USP and other National and International bodies, ICP-MS represents a future-proof investment for pharmaceutical laboratories embarking on elemental impurity analyses. The described method exceeds the analytical performance criteria described in USP <233> by a wide margin.
Finally, the range of security features, data management and audit trailing tools included in the advanced and flexible Qtegra ISDS Software provides the necessary support to meet the demands of 21 CFR Part 11 in the highly regulated pharmaceutical industry environment.
References1. General Chapter <232> Elemental Impurities - Limits, United States Pharmacopeia.
2. General Chapter <233> Elemental Impurities - Procedure, United States Pharmacopeia.
3. 21CFR11 2017, Food and Drug Administration.
Tables 6a, 6b and 6c show that a precision of < 25% across three days is easily achieved. The excellent measurement stability for µg·L-1 levels of Mercury in each drug (< 1% precision over 3 days) is a result of the sample preparation method described and the stability of the iCAP RQ ICP-MS.
Table 6b. Ruggedness for three repeat measurements of Drug B spiked at the target limit (J), expressed as percent recovery.
Table 6c. Ruggedness for three repeat measurements of Drug C spiked at the target limit (J), expressed as percent recovery.
Element Drug B - 1 Drug B - 2 Drug B - 3 Mean RSD (%)
Cadmium 99.2 98.0 98.0 98.4 0.7
Lead 97.8 95.8 93.8 95.8 2.1
Inorganic arsenic
92.7 93.2 92.8 92.9 0.3
Inorganic mercury
97.3 96.7 95.3 96.4 1.1
Iridium 101.0 102.0 99.0 100.7 1.5
Osmium 116.0 99.0 104.0 106.3 8.2
Palladium 97.0 95.7 95.5 96.1 0.8
Platinum 96.7 97.8 96.6 97.0 0.7
Rhodium 100.0 99.0 98.0 99.0 1.0
Ruthenium 99.6 98.6 98.1 98.8 0.8
Chromium 103.5 102.9 103.2 103.2 0.3
Molybdenum 115.0 113.0 111.0 113.0 1.8
Nickel 97.4 95.2 94.4 95.7 1.6
Vanadium 106.0 98.1 99.0 101.0 4.3
Copper 97.9 95.6 94.1 95.9 2.0
Element Drug C - 1 Drug C - 2 Drug C - 3 Mean RSD (%)
Cadmium 98.8 95.2 97.6 97.2 1.9
Lead 100.0 98.1 96.7 98.3 1.7
Inorganic arsenic
116.7 115.2 116.4 116.1 0.7
Inorganic mercury
91.3 89.3 90.7 90.4 1.1
Iridium 102.0 103.1 98.9 101.3 2.1
Osmium 117.1 107.8 99.2 108.0 8.3
Palladium 98.5 95.1 97.0 96.9 1.8
Platinum 96.7 99.5 95.6 97.3 2.1
Rhodium 102.8 102.1 99.7 101.5 1.6
Ruthenium 98.8 97.6 96.2 97.5 1.3
Chromium 101.5 102.8 103.5 102.6 1.0
Molybdenum 113.0 110.8 105.6 109.8 3.5
Nickel 123.4 117.4 119.6 120.1 2.5
Vanadium 113.7 105.0 102.2 107.0 5.6
Copper 97.5 94.3 92.2 94.7 2.8