Embed Size (px)
Citation preview

Analysis of Noise for FTIR Difference Spectroscopy18
3
Analysis of Noise for Rapid-scan and Step-scanMethods of FT-IR Difference Spectroscopy
Reprinted with permission from:
Andrews, S.S.; Boxer, S.G. Appl. Spectrosc. 2001, in press.
I am shut off from the natural world and sealed up, encapsulated,
in a box of artificial light and tyrannical noise.
— Edward Abbey
Desert Solitaire
The Measurement and Physics of Vibrational Stark Effect 19
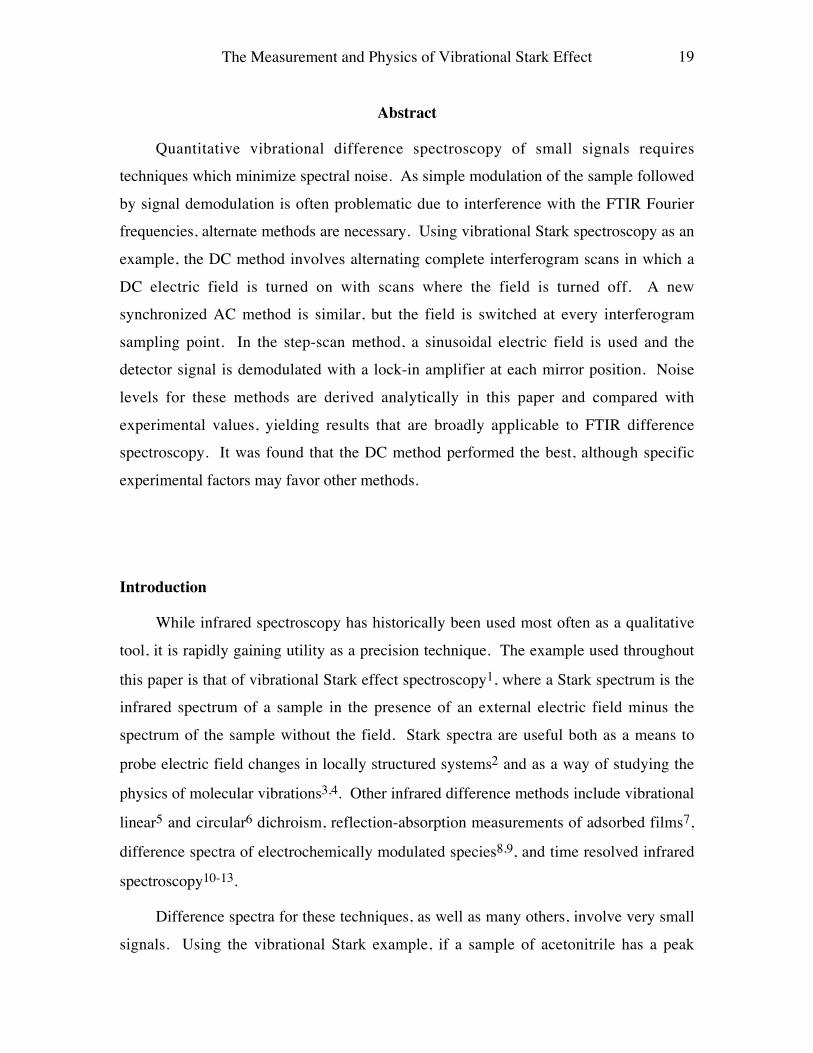
Abstract
Quantitative vibrational difference spectroscopy of small signals requirestechniques which minimize spectral noise. As simple modulation of the sample followed
by signal demodulation is often problematic due to interference with the FTIR Fourierfrequencies, alternate methods are necessary. Using vibrational Stark spectroscopy as an
example, the DC method involves alternating complete interferogram scans in which a
DC electric field is turned on with scans where the field is turned off. A newsynchronized AC method is similar, but the field is switched at every interferogram
sampling point. In the step-scan method, a sinusoidal electric field is used and thedetector signal is demodulated with a lock-in amplifier at each mirror position. Noise
levels for these methods are derived analytically in this paper and compared with
experimental values, yielding results that are broadly applicable to FTIR differencespectroscopy. It was found that the DC method performed the best, although specific
experimental factors may favor other methods.
Introduction
While infrared spectroscopy has historically been used most often as a qualitative
tool, it is rapidly gaining utility as a precision technique. The example used throughout
this paper is that of vibrational Stark effect spectroscopy1, where a Stark spectrum is theinfrared spectrum of a sample in the presence of an external electric field minus the
spectrum of the sample without the field. Stark spectra are useful both as a means to
probe electric field changes in locally structured systems2 and as a way of studying the
physics of molecular vibrations3,4. Other infrared difference methods include vibrational
linear5 and circular6 dichroism, reflection-absorption measurements of adsorbed films7,
difference spectra of electrochemically modulated species8,9, and time resolved infrared
spectroscopy10-13.
Difference spectra for these techniques, as well as many others, involve very small
signals. Using the vibrational Stark example, if a sample of acetonitrile has a peak
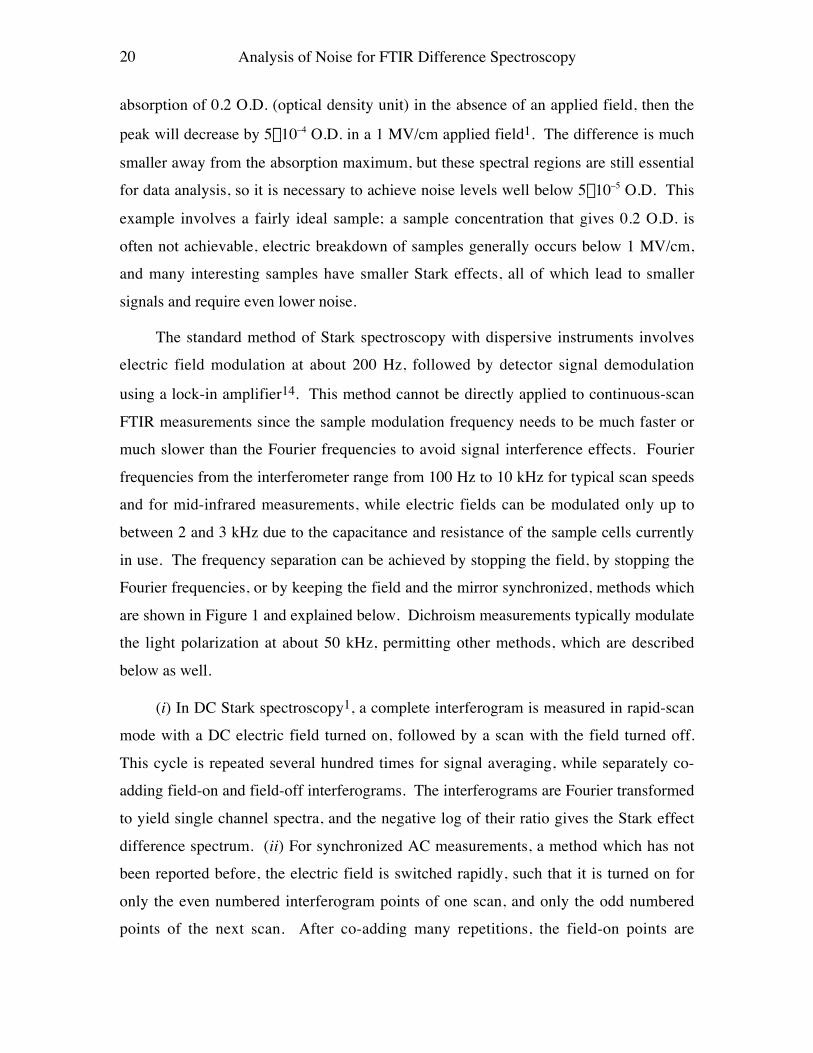
Analysis of Noise for FTIR Difference Spectroscopy20
absorption of 0.2 O.D. (optical density unit) in the absence of an applied field, then the
peak will decrease by 5¥10–4 O.D. in a 1 MV/cm applied field1. The difference is much
smaller away from the absorption maximum, but these spectral regions are still essentialfor data analysis, so it is necessary to achieve noise levels well below 5¥10–5 O.D. This
example involves a fairly ideal sample; a sample concentration that gives 0.2 O.D. is
often not achievable, electric breakdown of samples generally occurs below 1 MV/cm,and many interesting samples have smaller Stark effects, all of which lead to smaller
signals and require even lower noise.
The standard method of Stark spectroscopy with dispersive instruments involveselectric field modulation at about 200 Hz, followed by detector signal demodulation
using a lock-in amplifier14. This method cannot be directly applied to continuous-scan
FTIR measurements since the sample modulation frequency needs to be much faster ormuch slower than the Fourier frequencies to avoid signal interference effects. Fourier
frequencies from the interferometer range from 100 Hz to 10 kHz for typical scan speedsand for mid-infrared measurements, while electric fields can be modulated only up to
between 2 and 3 kHz due to the capacitance and resistance of the sample cells currently
in use. The frequency separation can be achieved by stopping the field, by stopping theFourier frequencies, or by keeping the field and the mirror synchronized, methods which
are shown in Figure 1 and explained below. Dichroism measurements typically modulatethe light polarization at about 50 kHz, permitting other methods, which are described
below as well.
(i) In DC Stark spectroscopy1, a complete interferogram is measured in rapid-scanmode with a DC electric field turned on, followed by a scan with the field turned off.
This cycle is repeated several hundred times for signal averaging, while separately co-adding field-on and field-off interferograms. The interferograms are Fourier transformed
to yield single channel spectra, and the negative log of their ratio gives the Stark effect
difference spectrum. (ii) For synchronized AC measurements, a method which has notbeen reported before, the electric field is switched rapidly, such that it is turned on for
only the even numbered interferogram points of one scan, and only the odd numberedpoints of the next scan. After co-adding many repetitions, the field-on points are

The Measurement and Physics of Vibrational Stark Effect 21
collected into one interferogram and the field-off points are collected to a different
interferogram; the interferograms are analyzed as for the DC method. (iii) For the step-scan method, the moving mirror is stopped and then stepped sequentially to each of the
sample positions15,16. At each retardation, the electric field is modulated sinusoidallyand a lock-in amplifier measures the detector output at twice the field frequency (which is
the frequency with maximum sample response since the response is proportional to the
square of the field). The output signal from the lock-in comprises a differenceinterferogram, which is Fourier transformed and divided by the total light intensity
through the sample (measured separately) to yield a Stark effect difference spectrum. For
Figure 1. Schematic diagram of vibrational Stark spectroscopy methods. TheP.C. box represents both a computer and some FTIR electronics. In thesynchronized AC diagram, the 0↑ and 0Ø symbols represent starting states withthe field off, followed by a positive or negative field at the next point,respectively.
Analysis of Noise for FTIR Difference Spectroscopy22
situations in which the sample modulation is too slow for high detectivity, phase
modulation, in which the moving mirror is rapidly dithered during a step-scan
measurement15, can be used to provide a high frequency carrier signal.
It is not immediately obvious which difference spectroscopy method should givethe best signal-to-noise ratio. This paper presents calculations of the noise levels for the
three methods as well as experimentally measured noise levels. The calculations are
useful because they show how various experimental parameters affect signal-to-noiseratios, which greatly simplifies the optimization of experiments and also shows what
experiments are feasible. While this paper focuses on measurements of the vibrationalStark effect, results are broadly applicable to other types of infrared difference
spectroscopy.
Other types of FTIR difference spectroscopy are available for dichroismmeasurements or other techniques that allow fast sample modulation. For double
modulation17,18, the sample is modulated at high frequency while the interferometer is inrapid-scan mode, using a slow mirror speed. The detector is demodulated with a lock-in
amplifier set to the sample modulation frequency to yield a difference interferogram,
which is analyzed as for the step-scan method. Signal-to-noise ratios for doublemodulation in the mid-infrared region have been shown to be similar to those for the
step-scan method19. For frequencies above 2000 cm–1, double modulation isprogressively more difficult since shorter lock-in time constants are required to pass the
higher Fourier frequencies16. An adaptation of the double modulation method has been
presented7 in which the signal is demodulated not with a lock-in amplifier, butsynchronously with the sample modulation using video sample-and-hold amplifiers and
summing amplifiers. This allows the use of a faster mirror speed and eliminates someartifacts associated with double modulation. A wide variety of methods for time resolved
spectroscopy have been presented as well10,12,20-23, several of which are conceptually
analogous to ones presented above.
Experimental
Spectra were measured with a Bruker IFS 66V/S FTIR with an externally mountedEG&G narrow band MCT detector (model J15D14-M204B-S01M). The detector has a 1

The Measurement and Physics of Vibrational Stark Effect 23
mm2 detector element and a D* value of 3.4¥1010 cm(Hz)1/2W–1. To prevent detector
saturation, light was limited with a 2 mm diameter aperture and with a room-temperature
variable interference filter positioned to transmit light between 1400 and 2330 cm–1
placed between the sample and the detector. The Stark effect set-up is described
elsewhere1. The sample was a dilute solution of methyl-vinyl-ketone dissolved in 2-methyl-tetrahydrofuran, and frozen to create a uniform isotropic glass. The carbonyl
stretch mode of methyl-vinyl-ketone has a Stark difference dipole of 0.049 D/f, yielding a
Stark effect between those found for many nitriles1 and those for carbon monoxide bound
to heme proteins2. In terms of the detector response, light intensity through the sample
was 7.4 mV/cm–1 at 1750 cm–1. Applied electric fields were 0.50 MV/cm for the DCmethod and synchronized AC method, and 0.36 rms MV/cm for step-scan (peak field of
0.50 MV/cm). To maximize uniformity, all spectra presented were measured with 40
minutes of signal averaging, 1 cm–1 resolution, single-sided data acquisition, using thesame sample, and during the same day. Fourier transforms used a zero-filling factor of 2,
Mertz phase correction (signed Mertz with stored zero-phase-difference for step-scan),and the Blackman-Harris 3-term apodization function. Absorption noise is calculated as
the rms value of difference spectra between 1700 and 1800 cm–1, a region where there are
no Stark effect signals.
For DC and synchronized AC spectra, the interferogram was sampled at every laser
zero-crossing, yielding 29324 interferogram points and spectra over the full 0–15798cm–1 acquisition range. As shown below, this interferogram oversampling reduces the
spectral noise. DC measurements used a 20 kHz mirror speed (the temporal frequency of
the HeNe laser signal) and co-added 1206 scans (1206 field-on scans and 1206 field-offscans). AC measurements used a 5 kHz mirror speed and 286 scans. A 16 kHz low-pass
electronic filter was used for the DC method, although comparison with other
measurements shows that it did not help significantly.
For step-scan spectra, the acquisition range was reduced to 1216–2430 cm–1, which
is the smallest range possible with the interference filter used; this required 2225interferogram points. A Stanford Research Systems SR850 lock-in amplifier was used
for generation of the 2 kHz electric field signal and for detector signal demodulation
Analysis of Noise for FTIR Difference Spectroscopy24
(phase modulation was not used). The lock-in was configured to have a 100 ms time
constant and 12 dB/octave roll-off on the output low-pass filter, which gave a 1.2 Hznoise equivalent bandwidth. Since a large transient detector signal is created at each
mirror step, the lock-in was allowed to stabilize for 1 second after each step before datacollection, which was found to be the minimum stabilization time that yielded difference
spectra without artifacts. (The mirror is effectively stationary after about 20 ms, so the
vast majority of this time is used for signal averaging by the lock-in.)
Double modulation was attempted as well. In this case, a 1.6 kHz mirror speed was
used, 212 scans, a 2 kHz electric field, and either a 100 ms or a 300 ms lock-in time
constant. While signal-to-noise ratios were nearly as good as for other methods, results
were inconsistent and disagreed with other results, leading us to believe that they weredominated by artifacts. Since we could not separate the frequencies further, double
modulation was not pursued and is not discussed below.
For measurements of detector noise, the interference filter was removed and a black
card was immersed in liquid nitrogen at the sample position. The card effectively
blocked all incident light and, being cold, had little emission of its own.
Results
Sources of noise. Noise sources in FTIR measurements include light sourcefluctuations, background light fluctuations, sample fluctuations, interferogram sampling
at slightly unequal retardation intervals, amplifier noise, and bit noise on the analog-to-
digital converter24. On most commercial FTIRs, great care has been taken to reduce allthe forms of noise as much as possible, leaving the sample and detector as the dominant
sources. For the experiments presented here, sample fluctuations were examined bycomparing interferogram noise between scans with and without the sample and cryostat
in the beampath. They were essentially the same, showing that sample fluctuations add a
negligible contribution to the total noise. To examine bit noise, a pair of identicalinterferograms was measured with a single scan each. The difference showed noise with
no digitization effects, indicating that bit noise is negligible as well.

The Measurement and Physics of Vibrational Stark Effect 25
For quantum type infrared detectors, such as InSb and MCT detectors, noise is
often dominated by statistical photon fluctuations of background infrared light. Thislight, which is simply the thermal radiation of anything within the detector’s field of
view, leads to white noise in the spectrum (the same amount of noise at all frequencies).If the background fluctuations are eliminated, the remaining sources of detector noise are
noise due to the detector current25, which has a 1/f frequency dependence, and the
Johnson noise of the detector26, which is white noise. We measured the frequencydistribution of noise for our MCT detector with the detector facing a 77 K black card, as
described above, over frequencies from 0.25 Hz to 80 kHz. This method excludes allsources of noise other than that from the detector and amplifiers. Noise was nearly
constant up to 20 kHz and then decreased, reaching a factor of 3 decrease by 80 kHz.
Using the same data, but in the time domain, the rms noise was 1.3¥10–4 V.
DC Stark spectroscopy. The measured detector voltage after the pre-amplifier hasboth a “noise-free” component, V(d), which is proportional to the light intensity, and a
noise component, N(d)X, where d is the mirror retardation. N(d) is the rms noise level
and X is a random variable with unit variance. The measured voltage comprises an
interferogram,
†
Vmeas. d( ) = V d( ) + N d( )X . (1)
The Fourier transform of the interferogram, with appropriate apodization and phase
correction, yields a single channel spectrum24,
†
Bmeas. n ( ) =2
nptsVmeas. d j( )exp -2pid jn ( )
j =1
npts
 (2)
†
= B n ( ) +2
nptsN f( )X . (3)
The factor of 2 in the Fourier transform arises from basic FTIR signal analysis for a
single sided interferogram. f is the modulation frequency of wavenumber n , called theFourier frequency (f=2vn , where v is the mirror velocity), and npts is the number of points
in the interferogram. B(n ) can be understood as the “noise-free” detector voltage which
would be observed if the interferometer were replaced with a perfect monochromator that

Analysis of Noise for FTIR Difference Spectroscopy26
just passed light between n and n +Dn , where Dn is the spectral resolution. N(f) is the
rms noise of the detector signal at frequency f. From the central limit theorem, thevariance of the sum of npts uncorrelated random variables, each with unit variance, is npts.
In the Fourier transform, half of the result is imaginary, leading to a variance of the realcomponent of npts/2, a real rms value of (2npts)–1/2, and thence the final result given above.
This analysis depends upon the assumptions that the noise is white noise and that it is
additive rather than multiplicative; from the discussion above, these are valid for thedominant portion of the noise in these experiments.
In the case of Stark measurements using a DC field technique, the differenceabsorption is the negative log of the ratio of the field-on single channel spectrum and the
field-off single channel spectrum. Including noise effects, the measured Stark absorption
spectrum for a single pair of scans is
†
DAmeas. n ( ) = -logBon n ( ) +
2npts
Non f( )X
Boff n ( ) +2
nptsNoff f( )X
. (4)
Since the Stark effect yields a small absorption change, Bon(n ) is very similar to Boff(n ).
Also, the noise voltages are much smaller than the signal voltages. These simplify Eq. 4
to
†
DAmeas. n ( ) = DA n ( ) -2DN f( )
ln 10( ) nptsBoff n ( )X , (5)
where ∆A(n ) is the “noise-free” Stark spectrum and ∆ N(f) is Non(f)–Noff(f). ∆ N(f) is a
factor of 21/2 larger than the noise in a single spectrum since it is the difference between apair of uncorrelated noise values. If nsc reference scans are averaged together and nsc
sample scans are averaged together, the average noise values decrease by a factor of nsc1/2,
again due to the lack of noise correlations between different scans. These factors areincluded to give the final result for multiple co-added scans,
†
DAmeas. n ( ) = DA n ( ) -2N f( )
ln 10( ) n scnpts Boff n ( )X . (6)

The Measurement and Physics of Vibrational Stark Effect 27
This result does not depend on the order of field-on and field-off scans, which can
be traced to the assumption of white noise. However, there is actually slightly morenoise at very low frequencies than elsewhere, due to the detector current and detector
drift. These factors were nearly eliminated by interleaving sample and reference scans.
0
10
20
1660 1680 1700 1720 1740
DA
¥ 1
04 (O
.D.)
Frequency (cm–1)
DC
AC
SS
Figure 2. Raw data for vibrational Stark spectra of methyl-vinyl-ketonemeasured with each method. Spectra for the DC method and synchronized ACmethod are offset for clarity. All spectra were measured at 77K, with a 0.5MV/cm peak field, 1 cm–1 resolution, and with 40 minutes of signal averaging.
Using just the experimental detector noise, along with the measurement parameters
given above, the absorption noise is calculated for a 40 minute measurement to be
3.6¥10–6 O.D., in good agreement with the experimental noise (Fig. 2), 4.6¥10–6 O.D.
The close agreement shows that most of the noise in the measured Stark spectrum is fromthe detector.

Analysis of Noise for FTIR Difference Spectroscopy28
Synchronized AC spectroscopy. The synchronized AC method gets around the
restriction that the frequencies be well separated by having the field synchronized to thesampling of the interferogram. However, the mirror still had to be slowed down to give
the Stark cell time to fully charge or discharge between interferogram sampling points.Looking back to Eqs. 1 to 6, it can be seen that they also apply for synchronized AC
measurements. The only differences are that f is now approximately twice the field
frequency to account for the modulation and nsc is reduced due to the slower mirrorspeed. The result is that the expected noise doubles, giving a value of 7.5¥10–6 O.D. of
noise in a 40 minute measurement. The measured noise was somewhat larger, with a
value of 12.6¥10–6 O.D.
While the noise in synchronized AC measurements is consistently larger than that
for DC measurements, the AC method is still useful. While developing Starkspectroscopy methods, we showed that sample molecules did not become aligned with an
external electric field on timescales longer than 1 second1, suggesting, but not proving,that the sample was fully immobilized. As the synchronized AC method yields results
that are identical to previous ones, which used the DC method, it is now seen that there is
negligible sample alignment on timescales as short as 0.4 ms, allowing increasedconfidence in the original data and in comparable data. A second benefit of the AC
method is that it is less susceptible to low frequency noise. As a result, baselines are notoffset from zero, as they are sometimes for DC measurements, and baselines are also
significantly flatter. This is especially valuable for difference spectroscopy of very broad
peaks, such as a mid-infrared electronic transition in the photosynthetic reaction center27
for which it would be useful to have Stark effect results28.
Step-scan Stark spectroscopy. Using the same notation as before, a differenceinterferogram in the presence of noise for the step-scan method is
†
DVmeas. d( ) = DV d( ) + DN d( )X . (7)
In this case, the noise term is the noise that passes through the lock-in amplifier. It can be
estimated by using the measured rms noise for the MCT detector, 1.3¥10–4 V, and the
approximate frequency range over which white noise was observed, 20 kHz, to yield a
detector noise density, en, of 9¥10–7 V(Hz)–1/2. The equivalent noise bandwidth of the

The Measurement and Physics of Vibrational Stark Effect 29
lock-in, ∆flock-in, was 1.2 Hz, yielding transmitted noise of 1¥10–6 V. Fourier
transforming, as in Eq. 3, yields the difference single channel spectrum,
†
DBmeas. n ( ) = DB n ( ) +1npts
en Dflock -in X . (8)
The noise term here is a factor of 21/2 smaller than it was for the DC method because half
the noise appears in the lock-in quadrature signal, and so does not appear in thedifference spectrum.
A reference intensity, Boff(n ), is measured separately in rapid-scan mode with the
electric field turned off. Since ∆Bmeas.(n ) is much smaller than Boff(n ), the Starkabsorption spectrum can be approximated as
†
DAmeas. n ( ) = -2 2DBmeas. n ( )ln 10( )Boff n ( )
, (9)
where the factor of 2 2 accounts for the difference between rms and peak voltage and
for the second harmonic of the field14. Combining Eqs. 8 and 9 yields the final result
†
DAmeas. n ( ) = DA n ( ) -2 2en f( ) Dflock -in
ln 10( ) npts Boff n ( )X . (10)
Using this equation and the assumptions above, the noise is calculated to be 3.5¥10–6
O.D. which can be compared to 8.4¥10–6 O.D. of experimental noise.
Discussion
It is seen that experimental noise was consistently larger than the calculated noise.
A contributing factor for all the methods is that the detector noise was measured withessentially no incident light and minimal detector current, whereas the Stark experiments
involved a probe light and a significant detector current, thereby adding some noise.Also, Stark measurements included random background thermal emission from the
interference filter. Step-scan experiments are subject to a variety of other noise sources
as well which were not included in the calculation. They are known to be very sensitiveto instrument vibrations from building motion and acoustic noise, to low frequency
Analysis of Noise for FTIR Difference Spectroscopy30
multiplicative fluctuations such as source drift29, and to lock-in limitations, which can be
reduced by replacing the lock-in amplifier with a digital signal processor30,31.
Eqs. 6 and 10 have several dependencies in common, which can be used for
understanding and minimizing experimental noise. Noise is inversely proportional toBoff(n ), implying that noise can be reduced by maximizing the light throughput at the
frequency of interest. In practice, detector noise increases with increasing light, but as
the noise does not increase as fast as the signal over most of the available intensity range,it is advantageous to use high light throughputs*. The noise is also inversely proportional
to npts1/2. This implies that for the DC and synchronized AC methods, oversampling of
the interferogram is a simple way to reduce noise without taking any more scan time. On
the other hand, each interferogram point takes a fixed amount of time in the step-scan
method, so in that case, one wants to sample the fewest points possible, by using anarrow optical bandpass filter. Thus, the DC and synchronized AC methods are best for
broad spectral ranges whereas step-scan is best for narrow spectral ranges. Doubling theresolution (halving ∆n ) while maintaining a constant measurement time affects several
factors: npts is doubled, nsc is halved, ∆flock-in is doubled, and B(n ) is halved. Thus, for all
the methods, doubling the resolution doubles the rms noise. However, when the data areanalyzed, this yields twice as many data points in a spectral region, so fit errors only
increase by a factor of 21/2.
In DC and synchronized AC methods, low noise is achieved by averaging many
data points over many scans. They also make use of the multiplexing advantage, in
which all frequencies incident on the detector are collected and used. The step-scanmethod, by contrast, uses relatively few data points, does not make use of signal
multiplexing, and spends a large fraction of the total scan time waiting for the lock-in to
settle. However, the excellent noise rejection of the lock-in amplifier (which is a direct
* A cooled interference filter, which passes just the spectral region of interest, can beplaced over the detector element to block unnecessary light and reduce detector noise. Italso does not emit much light since it is cooled, and it moves the interferogram intensityaway from the centerburst and into the wings, which allows the use of a brighter lightsource, larger aperture, and greater amplification of the detector signal.
The Measurement and Physics of Vibrational Stark Effect 31
consequence of the long settling time and the lack of multiplexing) makes up for the
other factors, yielding very similar noise results in the end for the parameters used here.
The data presented here show that our original method of measuring vibrational
Stark spectra on an FTIR, using a DC field, performs better than either synchronized ACor step-scan methods. However, the differences in signal-to-noise values are small, so
specific situations may favor the other methods. In particular, the synchronized AC
method can be used over a large spectral range but still yields very flat baselines whilethe step-scan method should perform the best for narrow spectral ranges. It is possible to
predict quantitative noise levels for any of the three experimental methods from Eqs. 6and 10, which are seen to approximate measured values moderately well.
Acknowledgements
We thank Eunice Park for the methyl-vinyl-ketone sample and Joe Rolfe for
helping to design and build the field controller. This work was supported in part by
grants from the NSF Chemistry Division and the NIH. The FTIR facilities are supportedby the Medical Free Electron Laser Program of the Office of Naval Research under
Contract N00014-94-1-1024.
Analysis of Noise for FTIR Difference Spectroscopy32
References
(1) S. S. Andrews and S. G. Boxer, J. Phys. Chem. A 104, 11853 (2000).
(2) E. S. Park, S. S. Andrews, R. B. Hu and S. G. Boxer, J. Phys. Chem. B 103, 9813
(1999).
(3) N. S. Hush and J. R. Reimers, J. Phys. Chem. 99, 15798 (1995).
(4) S. S. Andrews and S. G. Boxer, Submitted to J. Phys. Chem. A (2001).
(5) V. Abetz, G. G. Fuller and R. Stadler, Polymer Bulletin 23, 447 (1990).
(6) L. A. Nafie, Appl. Spectrosc. 50, 14A (1996).
(7) M. J. Green, B. J. Barner and R. M. Corn, Rev. Sci. Instrum. 62, 1426 (1991).
(8) B. O. Budevska and P. R. Griffiths, Anal. Chem. 65, 2963 (1993).
(9) C. Korzeniewski, Crit. Rev. Anal. Chem. 27, 81 (1997).
(10) X. Hu, H. Frei and T. G. Spiro, Biochem. 35, 13001 (1996).
(11) I. Noda, A. E. Dowrey, C. Marcott, G. M. Story and Y. Ozaki, Appl. Spectrosc.
54, 236A (2000).
(12) S. E. Plunkett, J. L. Chao, T. J. Tague and R. A. Palmer, Appl. Spectrosc. 49, 702(1995).
(13) S. V. Shilov, S. Okretic, H. W. Siesler and M. A. Czarnecki, Appl. Spectrosc.Rev. 31, 125 (1996).
(14) G. U. Bublitz and S. G. Boxer, Annu. Rev. Phys. Chem. 48, 213 (1997).
(15) R. A. Palmer, J. L. Chao, R. M. Dittmar, V. G. Gregoriou and S. E. Plunkett,Appl. Spectrosc. 47, 1297 (1993).
(16) F. Long, T. B. Freedman, T. J. Tague and L. A. Nafie, Appl. Spectrosc. 51, 508(1997).
(17) E. D. Lipp, C. G. Zimba and L. A. Nafie, Chem. Phys. Lett. 90, 1 (1982).
(18) E. D. Lipp and L. A. Nafie, Appl. Spectrosc. 38, 20 (1984).
The Measurement and Physics of Vibrational Stark Effect 33
(19) F. Long, T. B. Freedman, R. Hapanowicz and L. A. Nafie, Appl. Spectrosc. 51,
504 (1997).
(20) P. A. Berg and J. J. Sloan, Rev. Sci. Instrum. 64, 2508 (1993).
(21) J. Lindner, J. K. Lundberg, R. M. Williams and S. R. Leone, Rev. Sci. Instrum.66, 2812 (1995).
(22) K. Masutani, H. Sugisawa, A. Yokota, Y. Furukawa and M. Tasumi, Appl.
Spectrosc. 46, 560 (1992).
(23) K. Masutani, K. Numahata, K. Nishimura, S. Ochiai, Y. Nagasaki, N. Katayama
and Y. Ozaki, Appl. Spectrosc. 53, 588 (1999).
(24) P. R. Griffiths and J. A. deHaseth, Fourier Transform Infrared Spectrometry
(John Wiley & Sons, New York, 1986) .
(25) A. L. Vinson and E. L. Dereniak, SPIE 572, 109 (1985).
(26) D. N. B. Hall, R. S. Aikens, R. Joyce and T. W. McCurnin, Applied Optics 14,
450 (1975).
(27) J. Breton, E. Nabedryk and W. W. Parson, Biochem. 31, 7503 (1992).
(28) J. R. Reimers, M. C. Hutter and N. S. Hush, Photosynth. Res. 55, 163 (1998).
(29) C. J. Manning and P. R. Griffiths, Appl. Spectrosc. 51, 1092 (1997).
(30) C. J. Manning and P. R. Griffiths, Appl. Spectrosc. 47, 1345 (1993).
(31) D. L. Drapcho, R. Curbelo, E. Y. Jiang, R. A. Crocombe and W. J. McCarthy,
Appl. Spectrosc. 51, 453 (1997).