Embed Size (px)
Citation preview
Analysis of NMR Spectra Part 2 -1-
Analysis of NMR Spectra Part 2
"Things should be made as simple as possible, but not any simpler."Albert Einstein
1.1 Review of Basic NMR Concepts
NMR analysis is a complex topic, from both the spectral interpretation andfundamental physics points of view. This section supplements the text on both ofthese fronts by first providing a concise summary of important general material,followed by the background necessary to interpret 1H-NMR spectra formolecules that have more complex signal splitting patterns. We assume that youare already familiar with the material in the text.
A. The Classsic 1H-NMR ExperimentIn the classic 1H-NMR experiment, a sample is placed in a strong magnetic field.The absorption of electromagnetic radiation is measured as different 1H nucleiare excited from their +1/2 spin states to their –1/2 spin states, a process referredto as resonance. The +1/2 nuclear spin state is the lower energy spin state inwhich the 1H nuclear spin is aligned with the strong external magnetic field. The–1/2 nuclear spin state is the other “allowed” nuclear spin state, and correspondsto the higher energy situation in which the nuclear spin is aligned against theexternal magnetic field. You should refer to Figure 13.1 of the text.
There are two fundamental physical principles that are essential forunderstanding NMR as it relates to the determination of molecular structure.
1. The energy difference between +1/2 and -1/2 nuclear spin states isproportional to the strength of the magnetic field at the nucleus (Figure13.2 of the text). This means that electromagnetic radiation of higherenergy is required for resonance in a stronger magnetic field, and viceversa.
2. The electron density around a nucleus is induced to circulate by theexternal magnetic field, and the induced electronic circulation sets upit own small magnetic field that directly opposes the strong externalmagnetic field. This induced magnetic field effectively shields theunderlying nucleus a small but measurable amount from the externalmagnetic field.
Combining these two fundamental principles, the more electron density around anucleus, the greater the shielding from the external magnetic field. The greater theshielding, the lower the energy of electromagnetic radiation required to bring a nucleusinto resonance, in other words, “flip its spin”. Energy is proportional toelectromagnetic radiation frequency, and it is the resonance frequencies that areplotted on an NMR spectrum.
Putting all of these ideas together, a nucleus that is surrounded by greaterelectron density will generally resonate at lower frequency than a nucleussurrounded by less electron density. To make spectra comparable from machines
Analysis of NMR Spectra Part 2 -2-
of different magnetic field strength, the frequency of resonance is plotted as achemical shift. A chemical shift is the resonance frequency of a particularnucleus compared to that of a standard molecule, TMS in 1H-NMR, scaled to themagnetic field strength of the NMR spectrometer and reported as parts permillion, ppm. The units here are parts per million because the chemical shiftchanges associated with electron density differences are about one millionth aslarge as the external magnetic field used in an NMR spectrometer.
Besides differences in electron density, hybridization state and the natureof any adjacent pi bonding electron density influences chemical shift. Hydrogenatoms attached to aromatic rings are influenced the most due to the induced ringcurrent of the aromatic pi electrons. H atoms attached to aromatic rings appearin the 6.5 ppm to 8.5 ppm range. Vinyl H atoms, i.e. those attached to alkenes,appear between 4.6 ppm and 5.7 ppm.
In a 1H-NMR spectrum, a signal with a chemical shift that is larger, forexample 4.8 ppm, corresponds to an H atom that either has relatively littleelectron density around it (it is adjacent to electronegative atoms or electronwithdrawing groups) or is one that is attached to a carbon atom taking part in api bond. A signal with a smaller chemical shift, for example 1.8 ppm, is due to anH atom that has greater electron density around it, indicating it is not adjacent toany electronegative atoms, electron withdrawing groups, or pi bonds.
Different functional groups have different characteristic chemical shifts, socomparing a given signal in an NMR spectrum to a reference table of chemical shifts(Table 13.2 in the text) allows the identification of functional groups in a molecule.
B. Signal Splitting – The Short VersionIn 1H-NMR spectra, signals are split into several peaks by other H atoms that arenot more than 3 bonds away. The signal splitting is caused by spin-spincoupling between adjacent nuclei. Signal splitting allows the determination of howdifferent functional groups are connected in a molecule, because atoms of only adjacentfunctional groups can split each other. The general rule is that a signal will be splitinto n + 1 peaks if there are n H atoms three bonds away. For example, the signalfor an H atom with 2 H atoms that are three bonds away will be split into 2 + 1 =3 peaks. The three peaks will appear in relative size ratios of 1:2:1, in accord withPascal’s triangle (Figure 13.12 in the text). Three adjacent H atoms would split asignal into 4 peaks of relative ratios 1:3:3:1, and so on.
Two H atoms on the same C atom will not split each other if that C atom isfreely rotating and sp3 hybridized, because the rapid bond rotation means that,on average, the two H atoms see the same chemical environment. These two Hatoms are said to be equivalent and give rise to only one signal in an NMRspectrum, with an area that integrates to a relative value of 2 H atoms. Recallthat in 1H-NMR spectra, relative signal integrations (i.e. the area under thesignals) are proportional to the number of equivalent H atoms giving rise to thatsignal. The three H atoms on a freely rotating –CH3 group are also equivalentand their signal will integrate to a relative value of 3 H atoms.
For example, the two equivalent H atoms of a –CH2- bonded to a –CH2- onone side and a –CH3 on the other has a total of 5 H atoms that are three bonds
Analysis of NMR Spectra Part 2 -3-
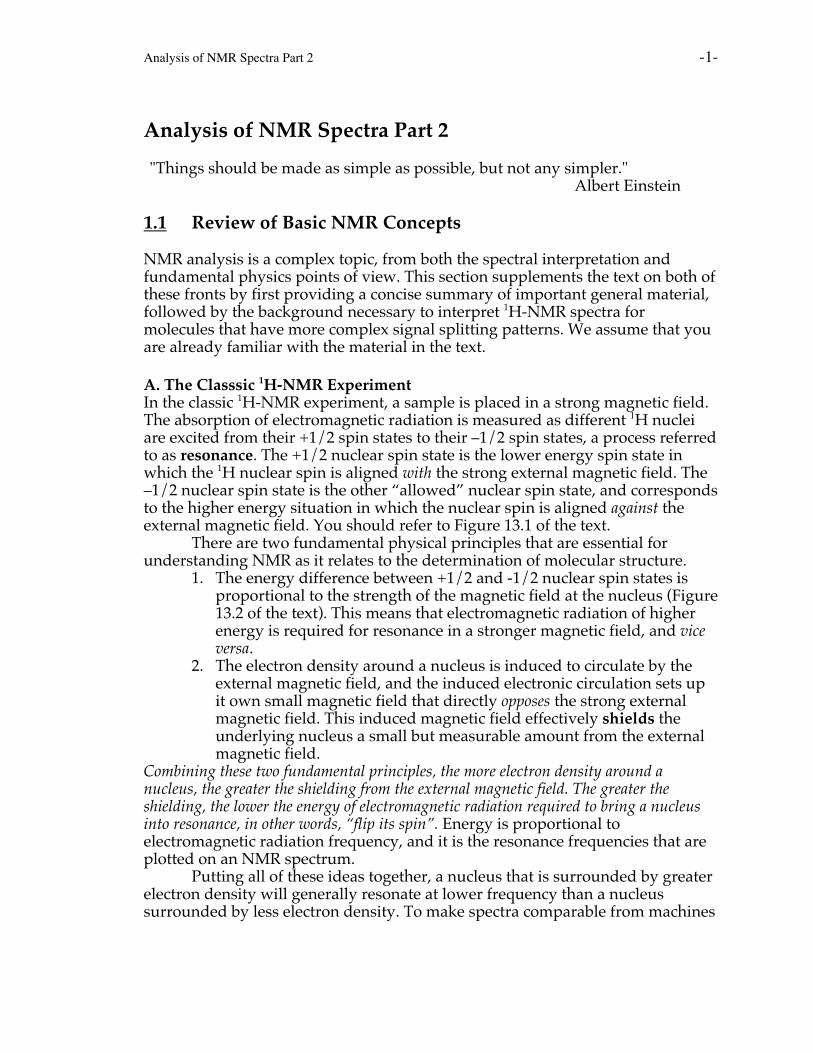
away. The signal for this central –CH2- group is therefore predicted to be splitinto 5 + 1 = 6 peaks and will integrate to a relative value of 2 H atoms. The 100MHz spectrum for 1-chloropropane, Cl–CH2-CH2-CH3, is shown in Figure 1. Thecentral –CH2- of 1-chloropropane, labeled as “b” in Figure 1, is indeed split into 6peaks and integrates to a relative value of 2 H atoms. Similarly, the signal for the–CH2- bonded to Cl, labeled as “a” in Figure 1, is spit into 2 + 1 = 3 peaks andintegrates to 2 H atoms. The signal for the –CH3 , labeled as “c”, is split into 2 + 1= 3 peaks and integrates to 3 H atoms. The signals are expanded and plotted asinsets on the spectrum to clarify the splitting patterns.
Figure 1 100 MHz 1H-NMR spectrum of 1-chloropropane.
The signal for the –CH2- group attached to the electronegative Cl atom,labeled as “a”, appears at a higher chemical shift (referred to as being downfield)compared to the other signals. Being closer to an electronegative atom, there isless electron density around the “a” H atoms. Recall from the discussion abovethat less electron density means less shielding and therefore a stronger magneticfield at the nucleus and a higher frequency required for resonance.
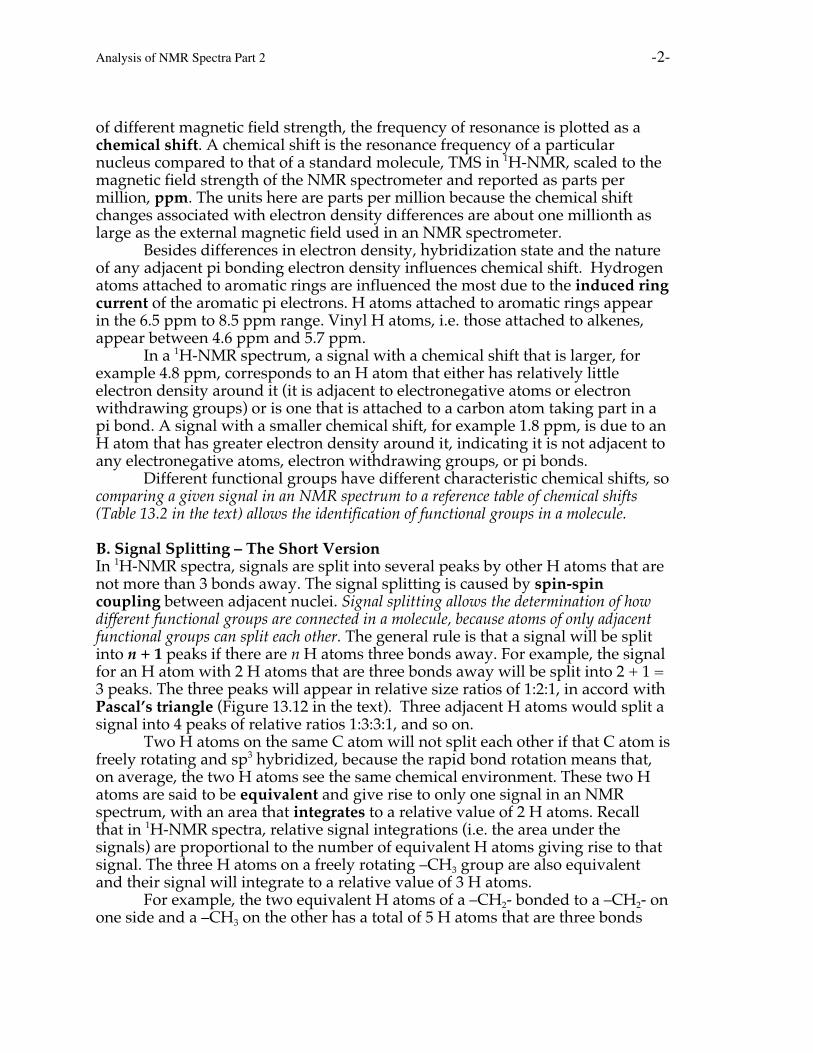
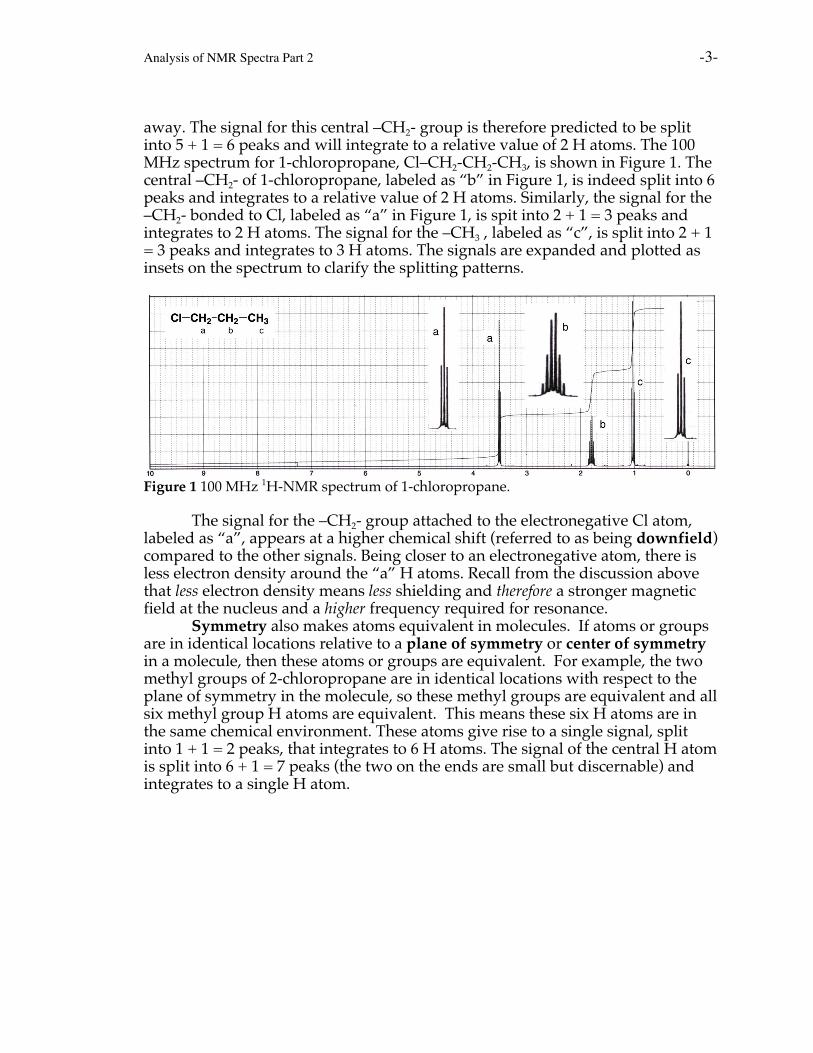
Symmetry also makes atoms equivalent in molecules. If atoms or groupsare in identical locations relative to a plane of symmetry or center of symmetryin a molecule, then these atoms or groups are equivalent. For example, the twomethyl groups of 2-chloropropane are in identical locations with respect to theplane of symmetry in the molecule, so these methyl groups are equivalent and allsix methyl group H atoms are equivalent. This means these six H atoms are inthe same chemical environment. These atoms give rise to a single signal, splitinto 1 + 1 = 2 peaks, that integrates to 6 H atoms. The signal of the central H atomis split into 6 + 1 = 7 peaks (the two on the ends are small but discernable) andintegrates to a single H atom.
Analysis of NMR Spectra Part 2 -4-
C
Cl
H3C
H
CH3
Plane ofSymmetry
Figure 2 Structure of 2-chloropropane showing the planeof symmetry responsible for making the two methylgroups, and therefore the six methyl group H atoms,equivalent.
Figure 3 100 MHz 1H-NMR spectrum of 2-chloropropane.
C. General MethodThe only way to get proficient at molecular structure determination using NMR is topractice. There are numerous problems in the text at the end of Chapter 13, aswell as subsequent chapters. A general method for analyzing NMR spectra canbe described as follows:
1. Compare signal chemical shifts with reference tables to determinewhich functional groups may be present.
2. Evaluate signal integrations to determine the number of equivalent Hatoms represented by the signals.
3. Construct possible molecules from the functional groups present, theirrelative signal integrations, and any other information you are given,especially the molecular formula and any other spectra.
4. Evaluate signal splitting to see if your proposed molecule is consistentwith which functional groups are adjacent to each other as evidencedby the splitting.
D. Exceptions to the n + 1 RuleThe general n + 1 rule is useful for determining the structures of simplemolecules, but there are many exceptions to this oversimplified rule. Important
Analysis of NMR Spectra Part 2 -5-
examples of exceptions are unsymmetrical molecules with restricted bondrotation such as alkenes or molecule with rings, as well as molecules for whichstereochemistry is important (Section 13.11). To understand the complex signalsplitting that occurs in these exceptions, the origins of spin-spin coupling mustbe examined. The following sections of this supplement describe in greater detailspin-spin coupling, and how it leads to complex signal splitting in alkenes andcyclic molecules. For the sake of completeness, signal splitting in alkyl groups isalso explained in greater detail.
1.2 A Closer Look at Signal Splitting
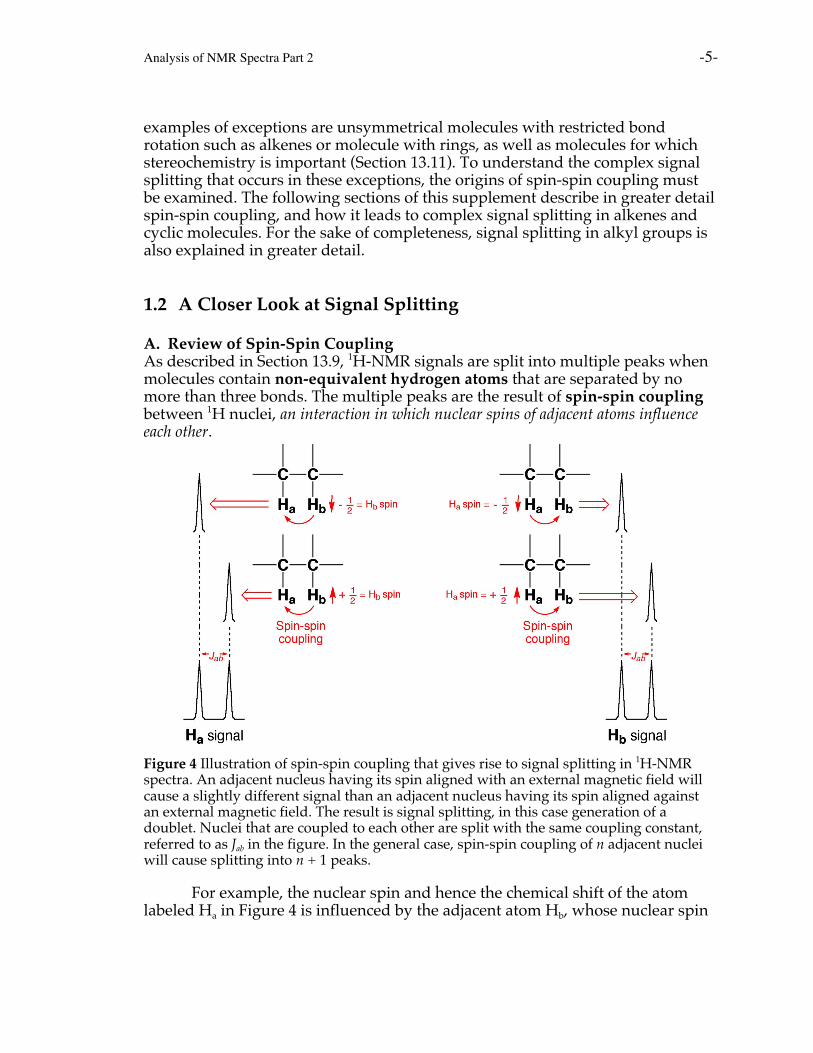
A. Review of Spin-Spin CouplingAs described in Section 13.9, 1H-NMR signals are split into multiple peaks whenmolecules contain non-equivalent hydrogen atoms that are separated by nomore than three bonds. The multiple peaks are the result of spin-spin couplingbetween 1H nuclei, an interaction in which nuclear spins of adjacent atoms influenceeach other.
Figure 4 Illustration of spin-spin coupling that gives rise to signal splitting in 1H-NMRspectra. An adjacent nucleus having its spin aligned with an external magnetic field willcause a slightly different signal than an adjacent nucleus having its spin aligned againstan external magnetic field. The result is signal splitting, in this case generation of adoublet. Nuclei that are coupled to each other are split with the same coupling constant,referred to as Jab in the figure. In the general case, spin-spin coupling of n adjacent nucleiwill cause splitting into n + 1 peaks.
For example, the nuclear spin and hence the chemical shift of the atomlabeled Ha in Figure 4 is influenced by the adjacent atom Hb, whose nuclear spin
Analysis of NMR Spectra Part 2 -6-
might be aligned with or against an external magnetic field in a 1H-NMRspectrometer. Because of spin-spin coupling, alignment of the Hb nuclear spinwith the external magnetic field results in a slightly different chemical shift of thesignal for Ha compared to the situation in which the Hb nuclear spin is alignedagainst the external magnetic field. Across the population of molecules in asample, there will be similar numbers of molecules having each spin alignmentfor Hb. Any single molecule gives rise to a single signal for Ha, but the spectrumof the entire sample shows both. The result is that the signal for the Ha atomappears in the spectrum as a doublet. In this hypothetical example, the signal forHb will also be split into a similar doublet due to Ha because the effect operates inboth directions.
We have already mentioned that in the general case, n equivalent H atomswill cause signal splitting into n + 1 peaks, the relative intensities of which arepredicted by Pascal’s triangle. This splitting arises because there are n + 1different possible combinations of n spins aligning with or against an externalmagnetic field. The probability of a molecule having a given set of spins is proportionalto the number of possible spin alignments giving rise to that spin state. The red arrowsin Table 13.5 are particularly helpful in understanding this very importantconcept, each red arrow representing the spin alignment of a 1H nucleus. Refer toTable 13.5 to confirm this concept is clear in your mind. Recall that the couplingconstant, J, is the quantitative measure of the extent of spin-spin couplingbetween two nuclei and corresponds to the distance in Hz between peaks of asplit signal in a 1H-NMR spectrum.
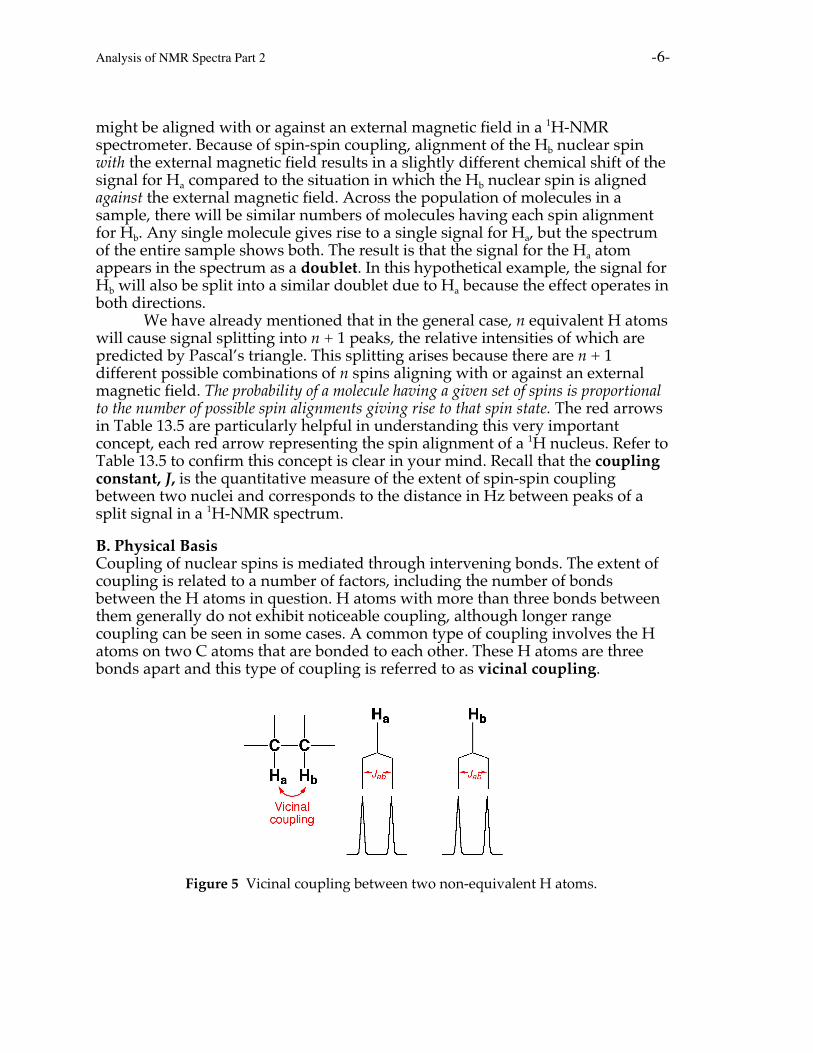
B. Physical BasisCoupling of nuclear spins is mediated through intervening bonds. The extent ofcoupling is related to a number of factors, including the number of bondsbetween the H atoms in question. H atoms with more than three bonds betweenthem generally do not exhibit noticeable coupling, although longer rangecoupling can be seen in some cases. A common type of coupling involves the Hatoms on two C atoms that are bonded to each other. These H atoms are threebonds apart and this type of coupling is referred to as vicinal coupling.
Figure 5 Vicinal coupling between two non-equivalent H atoms.
Analysis of NMR Spectra Part 2 -7-
An important factor in vicinal coupling is the angle α between the C-Hsigma bonds and whether or not it is fixed. Coupling is maximized when theangle α is 0° and 180°, and is minimized when α is 90°. Bonds that rotate rapidlyat room temperature do not have a fixed angle between adjacent C-H bonds, soan average angle and an average coupling is observed. This latter concept is veryimportant for the interpretation of 1H-NMR spectra for alkanes and other flexiblemolecules.
Figure 6 Illustration of the angle α between C-H bondsthat is important for determining the strength of spin-spincoupling between adjacent H atoms.
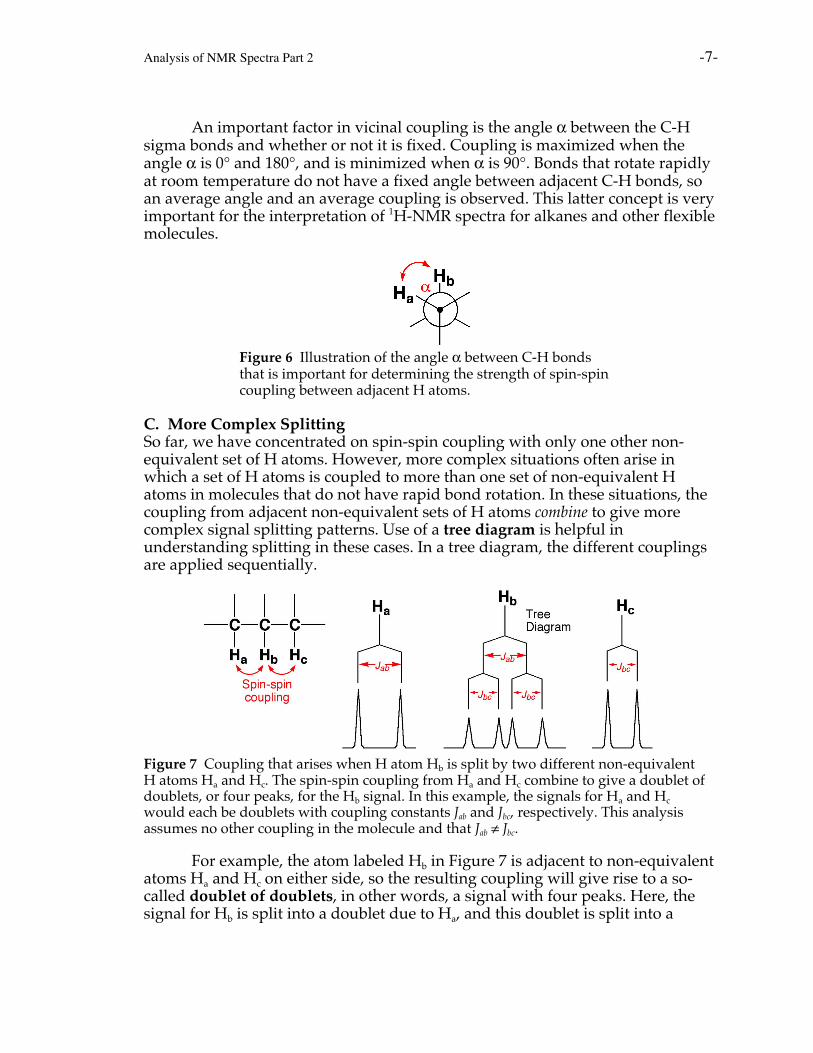
C. More Complex SplittingSo far, we have concentrated on spin-spin coupling with only one other non-equivalent set of H atoms. However, more complex situations often arise inwhich a set of H atoms is coupled to more than one set of non-equivalent Hatoms in molecules that do not have rapid bond rotation. In these situations, thecoupling from adjacent non-equivalent sets of H atoms combine to give morecomplex signal splitting patterns. Use of a tree diagram is helpful inunderstanding splitting in these cases. In a tree diagram, the different couplingsare applied sequentially.
Figure 7 Coupling that arises when H atom Hb is split by two different non-equivalentH atoms Ha and Hc. The spin-spin coupling from Ha and Hc combine to give a doublet ofdoublets, or four peaks, for the Hb signal. In this example, the signals for Ha and Hc
would each be doublets with coupling constants Jab and Jbc, respectively. This analysisassumes no other coupling in the molecule and that Jab ≠ Jbc.
For example, the atom labeled Hb in Figure 7 is adjacent to non-equivalentatoms Ha and Hc on either side, so the resulting coupling will give rise to a so-called doublet of doublets, in other words, a signal with four peaks. Here, thesignal for Hb is split into a doublet due to Ha, and this doublet is split into a
Analysis of NMR Spectra Part 2 -8-
doublet of doublets by Hc. If there were no other H atoms in the molecule to beconsidered, then the signal for Ha would be a doublet with coupling constant Jab
and the signal for Hc would be a doublet with coupling constant Jbc. This analysisassumes that the Ha-Hb and Hb-Hc coupling constants, Jab and Jbc, are differentfrom each other.
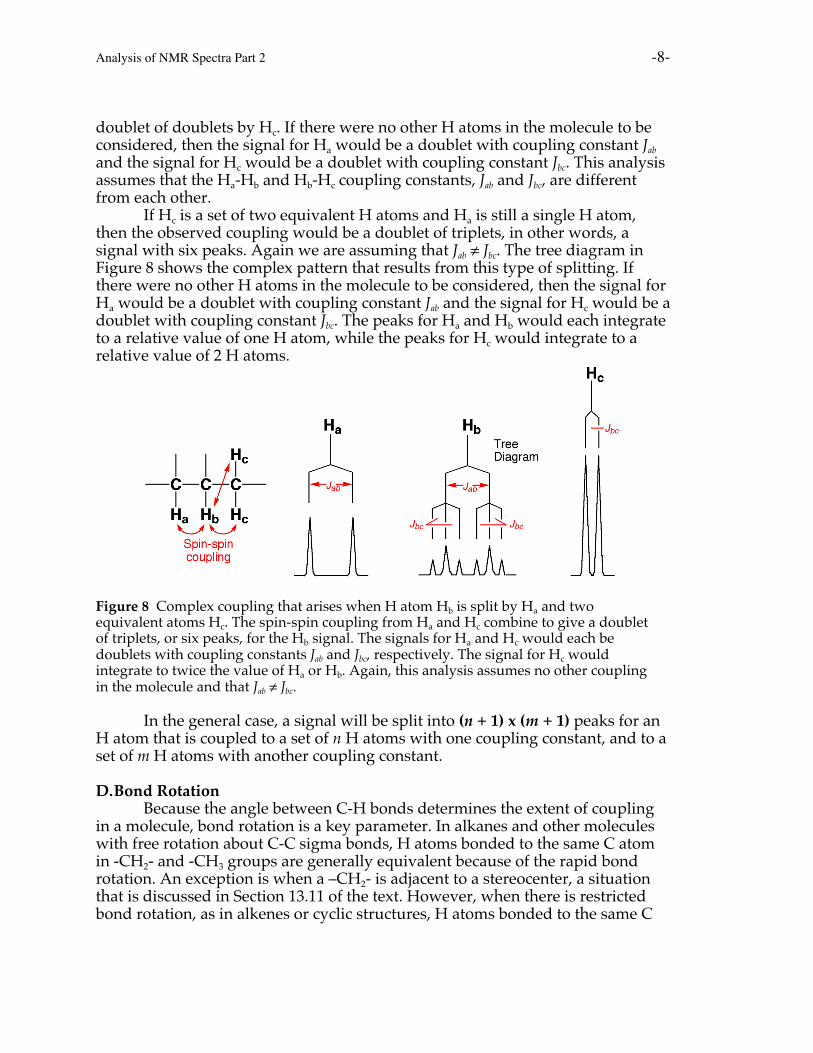
If Hc is a set of two equivalent H atoms and Ha is still a single H atom,then the observed coupling would be a doublet of triplets, in other words, asignal with six peaks. Again we are assuming that Jab ≠ Jbc. The tree diagram inFigure 8 shows the complex pattern that results from this type of splitting. Ifthere were no other H atoms in the molecule to be considered, then the signal forHa would be a doublet with coupling constant Jab and the signal for Hc would be adoublet with coupling constant Jbc. The peaks for Ha and Hb would each integrateto a relative value of one H atom, while the peaks for Hc would integrate to arelative value of 2 H atoms.
Figure 8 Complex coupling that arises when H atom Hb is split by Ha and twoequivalent atoms Hc. The spin-spin coupling from Ha and Hc combine to give a doubletof triplets, or six peaks, for the Hb signal. The signals for Ha and Hc would each bedoublets with coupling constants Jab and Jbc, respectively. The signal for Hc wouldintegrate to twice the value of Ha or Hb. Again, this analysis assumes no other couplingin the molecule and that Jab ≠ Jbc.
In the general case, a signal will be split into (n + 1) x (m + 1) peaks for anH atom that is coupled to a set of n H atoms with one coupling constant, and to aset of m H atoms with another coupling constant.
D. Bond RotationBecause the angle between C-H bonds determines the extent of coupling
in a molecule, bond rotation is a key parameter. In alkanes and other moleculeswith free rotation about C-C sigma bonds, H atoms bonded to the same C atomin -CH2- and -CH3 groups are generally equivalent because of the rapid bondrotation. An exception is when a –CH2- is adjacent to a stereocenter, a situationthat is discussed in Section 13.11 of the text. However, when there is restrictedbond rotation, as in alkenes or cyclic structures, H atoms bonded to the same C
Analysis of NMR Spectra Part 2 -9-
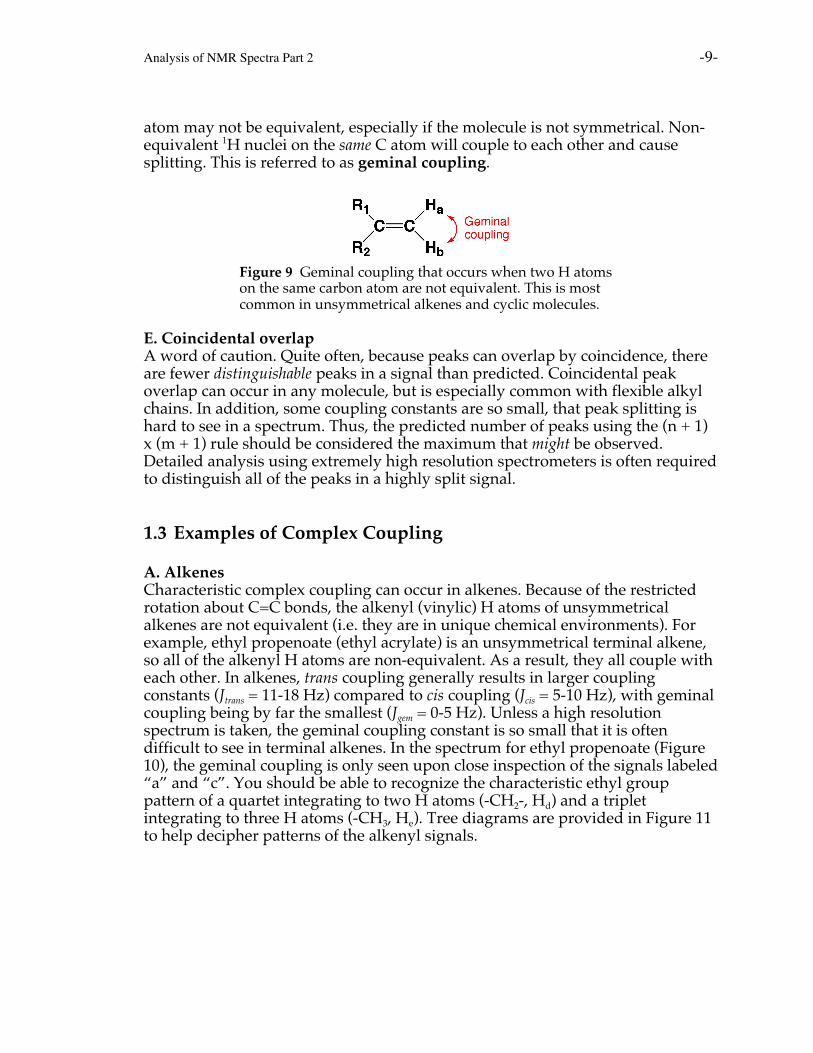
atom may not be equivalent, especially if the molecule is not symmetrical. Non-equivalent 1H nuclei on the same C atom will couple to each other and causesplitting. This is referred to as geminal coupling.
Figure 9 Geminal coupling that occurs when two H atomson the same carbon atom are not equivalent. This is mostcommon in unsymmetrical alkenes and cyclic molecules.
E. Coincidental overlapA word of caution. Quite often, because peaks can overlap by coincidence, thereare fewer distinguishable peaks in a signal than predicted. Coincidental peakoverlap can occur in any molecule, but is especially common with flexible alkylchains. In addition, some coupling constants are so small, that peak splitting ishard to see in a spectrum. Thus, the predicted number of peaks using the (n + 1)x (m + 1) rule should be considered the maximum that might be observed.Detailed analysis using extremely high resolution spectrometers is often requiredto distinguish all of the peaks in a highly split signal.
1.3 Examples of Complex Coupling
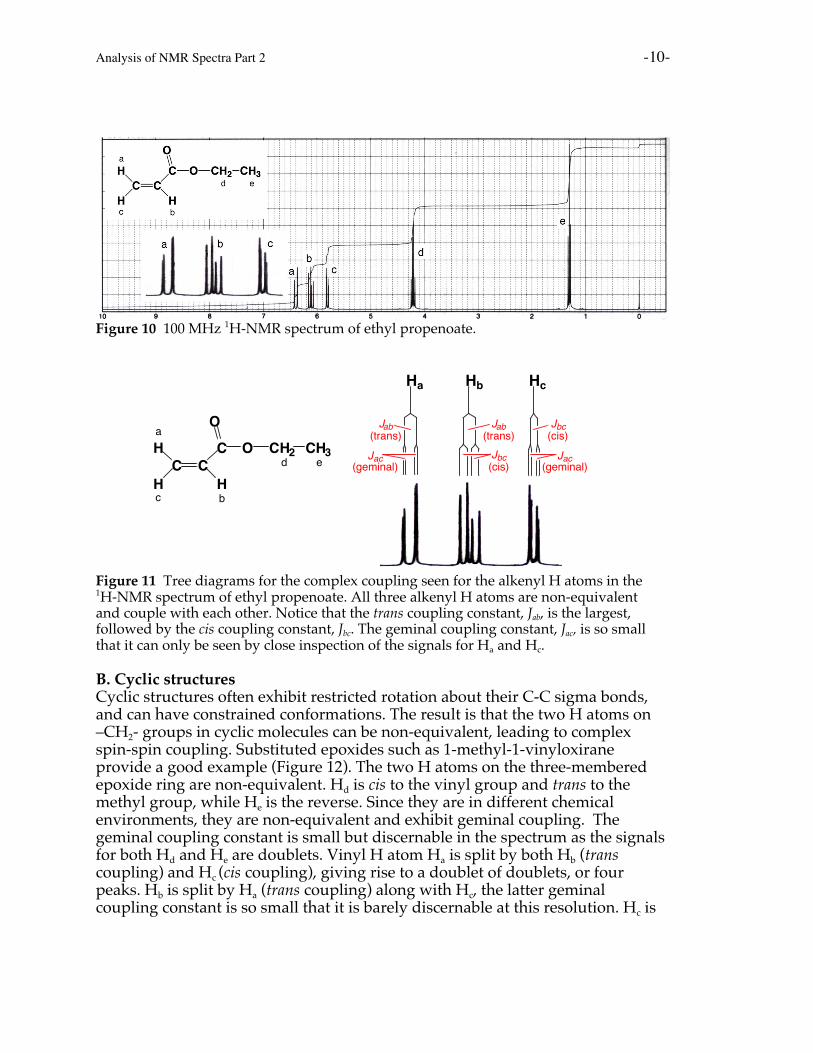
A. AlkenesCharacteristic complex coupling can occur in alkenes. Because of the restrictedrotation about C=C bonds, the alkenyl (vinylic) H atoms of unsymmetricalalkenes are not equivalent (i.e. they are in unique chemical environments). Forexample, ethyl propenoate (ethyl acrylate) is an unsymmetrical terminal alkene,so all of the alkenyl H atoms are non-equivalent. As a result, they all couple witheach other. In alkenes, trans coupling generally results in larger couplingconstants (Jtrans = 11-18 Hz) compared to cis coupling (Jcis = 5-10 Hz), with geminalcoupling being by far the smallest (Jgem = 0-5 Hz). Unless a high resolutionspectrum is taken, the geminal coupling constant is so small that it is oftendifficult to see in terminal alkenes. In the spectrum for ethyl propenoate (Figure10), the geminal coupling is only seen upon close inspection of the signals labeled“a” and “c”. You should be able to recognize the characteristic ethyl grouppattern of a quartet integrating to two H atoms (-CH2-, Hd) and a tripletintegrating to three H atoms (-CH3, He). Tree diagrams are provided in Figure 11to help decipher patterns of the alkenyl signals.
Analysis of NMR Spectra Part 2 -10-
Figure 10 100 MHz 1H-NMR spectrum of ethyl propenoate.
C CH
H
H
C
O
O CH2 CH3a
bc
d e
Jbc(cis)
Jac(geminal)
Jab(trans)
Jab(trans)
Jbc(cis)
Jac(geminal)
Ha Hb Hc
Figure 11 Tree diagrams for the complex coupling seen for the alkenyl H atoms in the1H-NMR spectrum of ethyl propenoate. All three alkenyl H atoms are non-equivalentand couple with each other. Notice that the trans coupling constant, Jab, is the largest,followed by the cis coupling constant, Jbc. The geminal coupling constant, Jac, is so smallthat it can only be seen by close inspection of the signals for Ha and Hc.
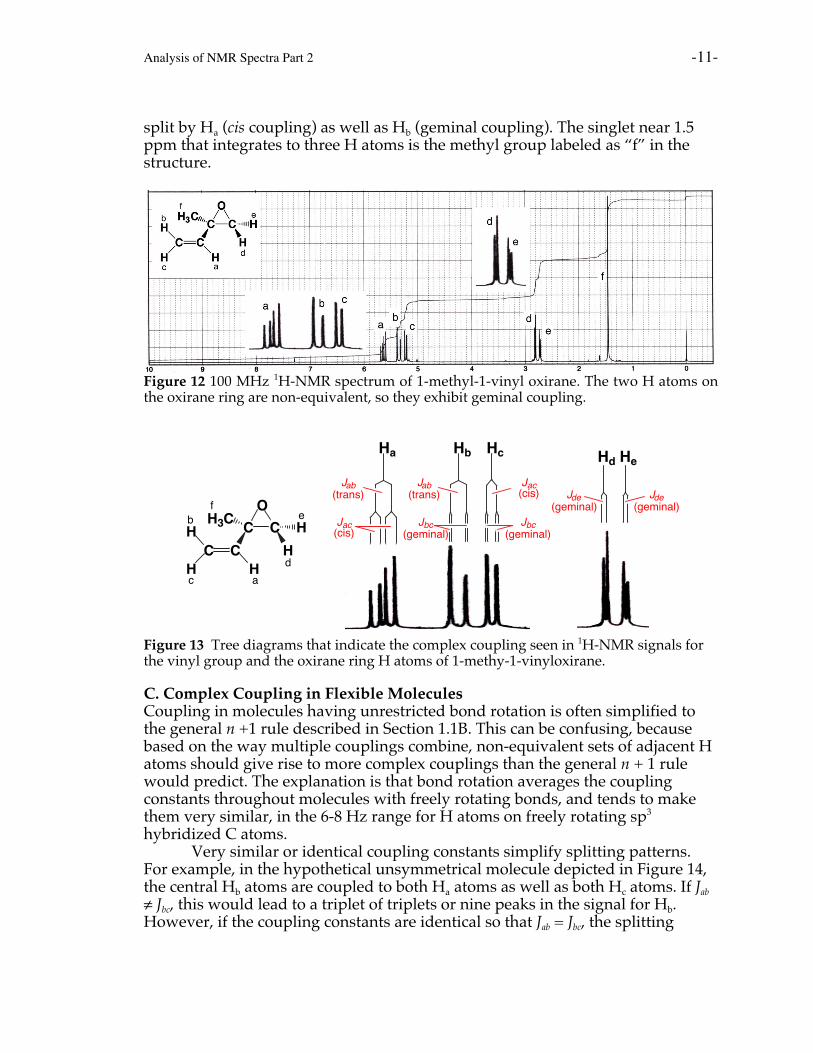
B. Cyclic structuresCyclic structures often exhibit restricted rotation about their C-C sigma bonds,and can have constrained conformations. The result is that the two H atoms on–CH2- groups in cyclic molecules can be non-equivalent, leading to complexspin-spin coupling. Substituted epoxides such as 1-methyl-1-vinyloxiraneprovide a good example (Figure 12). The two H atoms on the three-memberedepoxide ring are non-equivalent. Hd is cis to the vinyl group and trans to themethyl group, while He is the reverse. Since they are in different chemicalenvironments, they are non-equivalent and exhibit geminal coupling. Thegeminal coupling constant is small but discernable in the spectrum as the signalsfor both Hd and He are doublets. Vinyl H atom Ha is split by both Hb (transcoupling) and Hc (cis coupling), giving rise to a doublet of doublets, or fourpeaks. Hb is split by Ha (trans coupling) along with Hc, the latter geminalcoupling constant is so small that it is barely discernable at this resolution. Hc is
Analysis of NMR Spectra Part 2 -11-
split by Ha (cis coupling) as well as Hb (geminal coupling). The singlet near 1.5ppm that integrates to three H atoms is the methyl group labeled as “f” in thestructure.
Figure 12 100 MHz 1H-NMR spectrum of 1-methyl-1-vinyl oxirane. The two H atoms onthe oxirane ring are non-equivalent, so they exhibit geminal coupling.
C
O
C
H
HH3C
CCH H
H
a
b
c
f
d
eJbc
(geminal)
Jab(trans) Jde
(geminal)
Ha Hb Hc
Jab(trans)
Jac(cis)
Jbc(geminal)
Jac(cis)
Hd He
Jde(geminal)
Figure 13 Tree diagrams that indicate the complex coupling seen in 1H-NMR signals forthe vinyl group and the oxirane ring H atoms of 1-methy-1-vinyloxirane.
C. Complex Coupling in Flexible MoleculesCoupling in molecules having unrestricted bond rotation is often simplified tothe general n +1 rule described in Section 1.1B. This can be confusing, becausebased on the way multiple couplings combine, non-equivalent sets of adjacent Hatoms should give rise to more complex couplings than the general n + 1 rulewould predict. The explanation is that bond rotation averages the couplingconstants throughout molecules with freely rotating bonds, and tends to makethem very similar, in the 6-8 Hz range for H atoms on freely rotating sp3
hybridized C atoms.Very similar or identical coupling constants simplify splitting patterns.
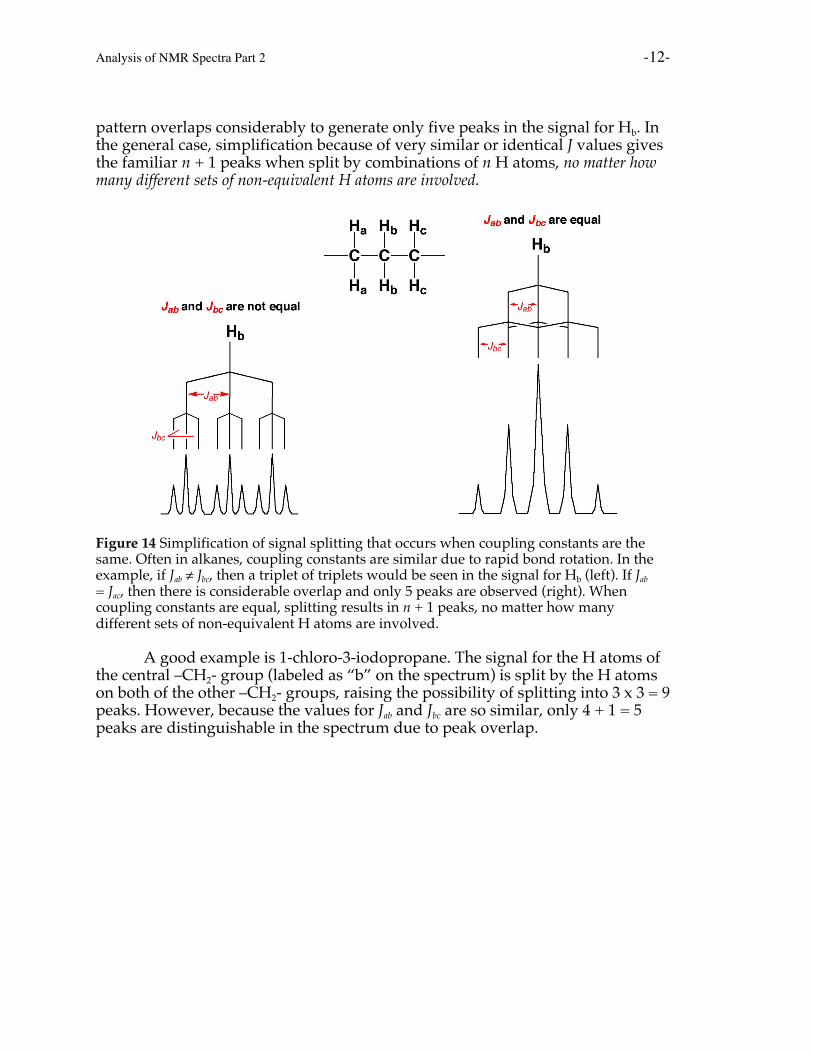
For example, in the hypothetical unsymmetrical molecule depicted in Figure 14,the central Hb atoms are coupled to both Ha atoms as well as both Hc atoms. If Jab
≠ Jbc, this would lead to a triplet of triplets or nine peaks in the signal for Hb.However, if the coupling constants are identical so that Jab = Jbc, the splitting
Analysis of NMR Spectra Part 2 -12-
pattern overlaps considerably to generate only five peaks in the signal for Hb. Inthe general case, simplification because of very similar or identical J values givesthe familiar n + 1 peaks when split by combinations of n H atoms, no matter howmany different sets of non-equivalent H atoms are involved.
Figure 14 Simplification of signal splitting that occurs when coupling constants are thesame. Often in alkanes, coupling constants are similar due to rapid bond rotation. In theexample, if Jab ≠ Jbc, then a triplet of triplets would be seen in the signal for Hb (left). If Jab
= Jac, then there is considerable overlap and only 5 peaks are observed (right). Whencoupling constants are equal, splitting results in n + 1 peaks, no matter how manydifferent sets of non-equivalent H atoms are involved.
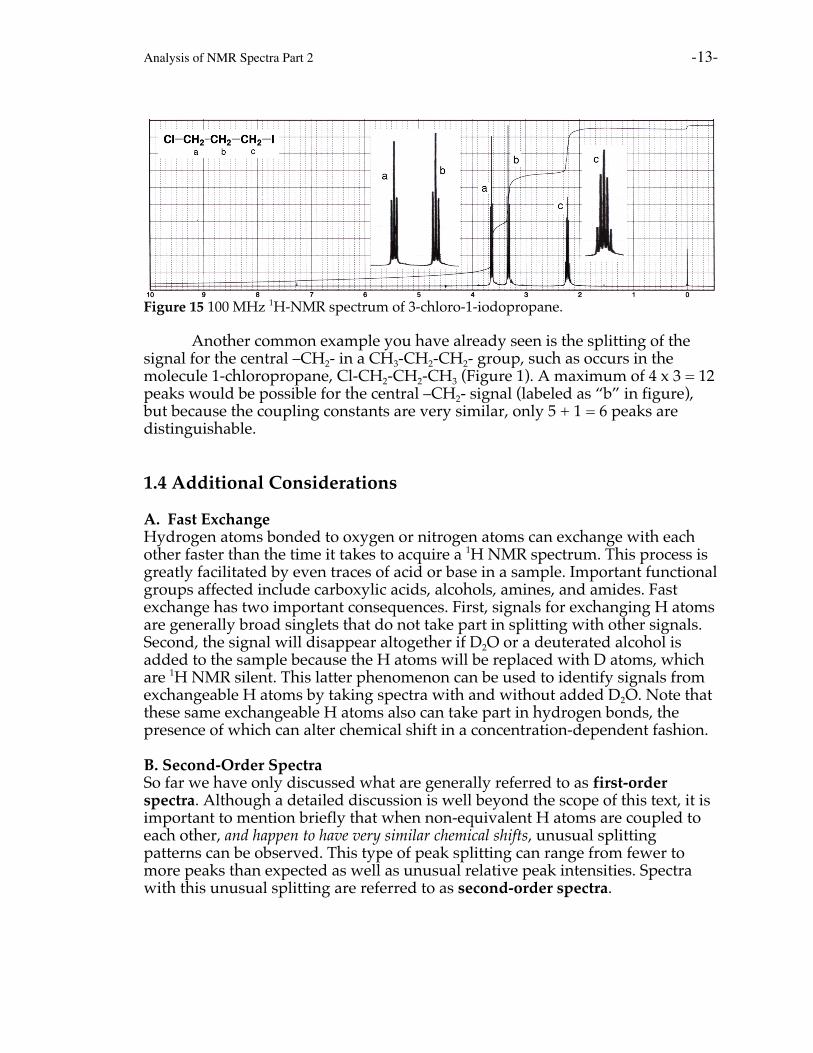
A good example is 1-chloro-3-iodopropane. The signal for the H atoms ofthe central –CH2- group (labeled as “b” on the spectrum) is split by the H atomson both of the other –CH2- groups, raising the possibility of splitting into 3 x 3 = 9peaks. However, because the values for Jab and Jbc are so similar, only 4 + 1 = 5peaks are distinguishable in the spectrum due to peak overlap.
Analysis of NMR Spectra Part 2 -13-
Figure 15 100 MHz 1H-NMR spectrum of 3-chloro-1-iodopropane.
Another common example you have already seen is the splitting of thesignal for the central –CH2- in a CH3-CH2-CH2- group, such as occurs in themolecule 1-chloropropane, Cl-CH2-CH2-CH3 (Figure 1). A maximum of 4 x 3 = 12peaks would be possible for the central –CH2- signal (labeled as “b” in figure),but because the coupling constants are very similar, only 5 + 1 = 6 peaks aredistinguishable.
1.4 Additional Considerations
A. Fast ExchangeHydrogen atoms bonded to oxygen or nitrogen atoms can exchange with eachother faster than the time it takes to acquire a 1H NMR spectrum. This process isgreatly facilitated by even traces of acid or base in a sample. Important functionalgroups affected include carboxylic acids, alcohols, amines, and amides. Fastexchange has two important consequences. First, signals for exchanging H atomsare generally broad singlets that do not take part in splitting with other signals.Second, the signal will disappear altogether if D2O or a deuterated alcohol isadded to the sample because the H atoms will be replaced with D atoms, whichare 1H NMR silent. This latter phenomenon can be used to identify signals fromexchangeable H atoms by taking spectra with and without added D2O. Note thatthese same exchangeable H atoms also can take part in hydrogen bonds, thepresence of which can alter chemical shift in a concentration-dependent fashion.
B. Second-Order SpectraSo far we have only discussed what are generally referred to as first-orderspectra. Although a detailed discussion is well beyond the scope of this text, it isimportant to mention briefly that when non-equivalent H atoms are coupled toeach other, and happen to have very similar chemical shifts, unusual splittingpatterns can be observed. This type of peak splitting can range from fewer tomore peaks than expected as well as unusual relative peak intensities. Spectrawith this unusual splitting are referred to as second-order spectra.
Analysis of NMR Spectra Part 2 -14-
C. A Final WordWe have barely scratched the surface of what NMR can do. Something called thenuclear Overhauser enhancement (NOE) can determine distances between atomsin molecules that are near each other in three-dimensional space even if there aremore than three bonds separating them. In addition, using modern instruments,spectra can be produced that examine multiple parameters simultaneously toyield immense amounts of information about even very complicated molecules.Such spectra are plotted on more than one axis so they are referred to as multi-dimensional spectra. Multi-dimensional spectra are used to deduce structure andconformation of molecules ranging from small synthetic molecules to largebiological macromolecules such as proteins, DNA, and RNA.
1.5 Examples
Following are three 1H-NMR spectra along with their signal assignments. Thespectra are of three carboxylic acids, and have been chosen to illustrate the keyissues discussed in this supplement.
A. Pentanoic acid (valeric acid)
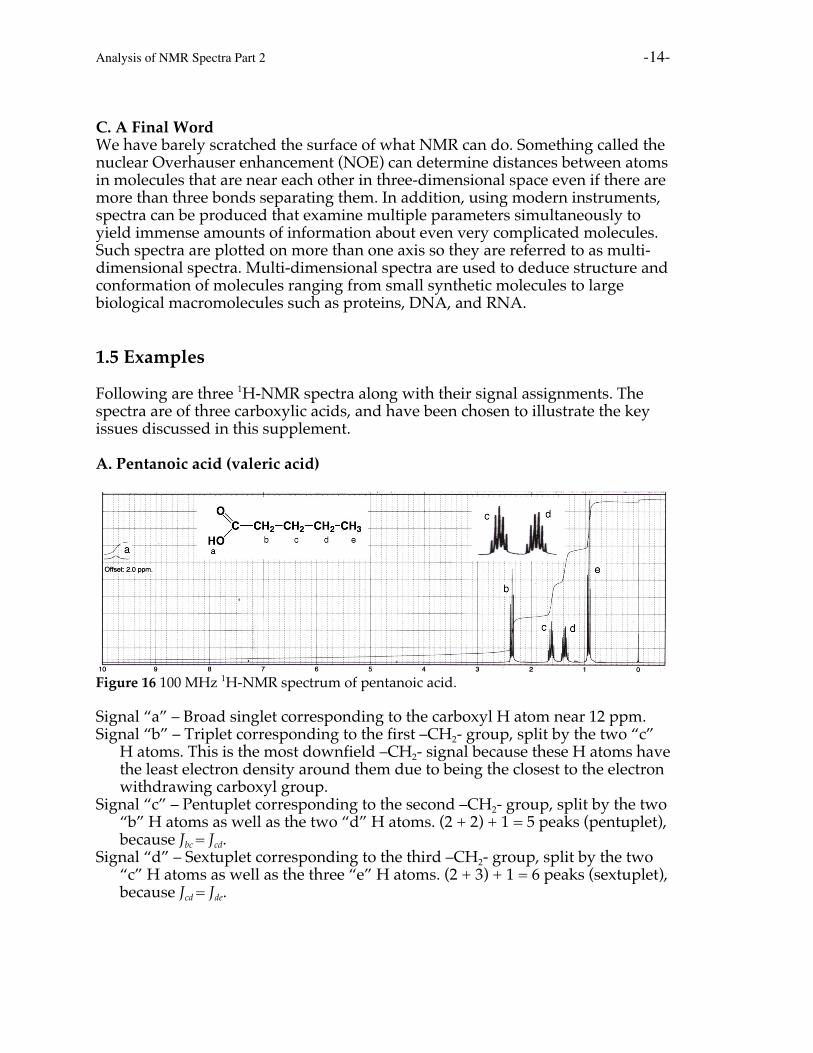
Figure 16 100 MHz 1H-NMR spectrum of pentanoic acid.
Signal “a” – Broad singlet corresponding to the carboxyl H atom near 12 ppm.Signal “b” – Triplet corresponding to the first –CH2- group, split by the two “c”
H atoms. This is the most downfield –CH2- signal because these H atoms havethe least electron density around them due to being the closest to the electronwithdrawing carboxyl group.
Signal “c” – Pentuplet corresponding to the second –CH2- group, split by the two“b” H atoms as well as the two “d” H atoms. (2 + 2) + 1 = 5 peaks (pentuplet),because Jbc = Jcd.
Signal “d” – Sextuplet corresponding to the third –CH2- group, split by the two“c” H atoms as well as the three “e” H atoms. (2 + 3) + 1 = 6 peaks (sextuplet),because Jcd = Jde.
Analysis of NMR Spectra Part 2 -15-
Signal “e” – Triplet corresponding to the –CH3 group, split by the two “d” Hatoms.
B. Trans-2-hexenoic acid
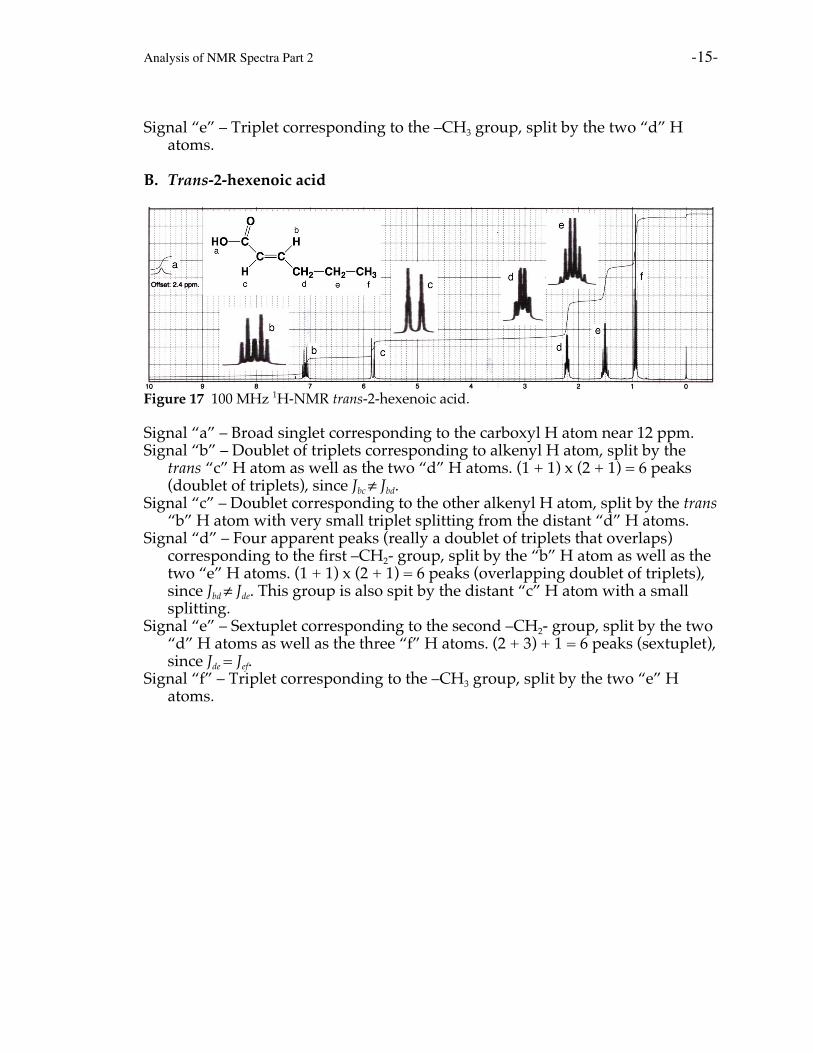
Figure 17 100 MHz 1H-NMR trans-2-hexenoic acid.
Signal “a” – Broad singlet corresponding to the carboxyl H atom near 12 ppm.Signal “b” – Doublet of triplets corresponding to alkenyl H atom, split by the
trans “c” H atom as well as the two “d” H atoms. (1 + 1) x (2 + 1) = 6 peaks(doublet of triplets), since Jbc ≠ Jbd.
Signal “c” – Doublet corresponding to the other alkenyl H atom, split by the trans“b” H atom with very small triplet splitting from the distant “d” H atoms.
Signal “d” – Four apparent peaks (really a doublet of triplets that overlaps)corresponding to the first –CH2- group, split by the “b” H atom as well as thetwo “e” H atoms. (1 + 1) x (2 + 1) = 6 peaks (overlapping doublet of triplets),since Jbd ≠ Jde. This group is also spit by the distant “c” H atom with a smallsplitting.
Signal “e” – Sextuplet corresponding to the second –CH2- group, split by the two“d” H atoms as well as the three “f” H atoms. (2 + 3) + 1 = 6 peaks (sextuplet),since Jde = Jef.
Signal “f” – Triplet corresponding to the –CH3 group, split by the two “e” Hatoms.
Analysis of NMR Spectra Part 2 -16-
C. Cyclobutanecarboxylic acid
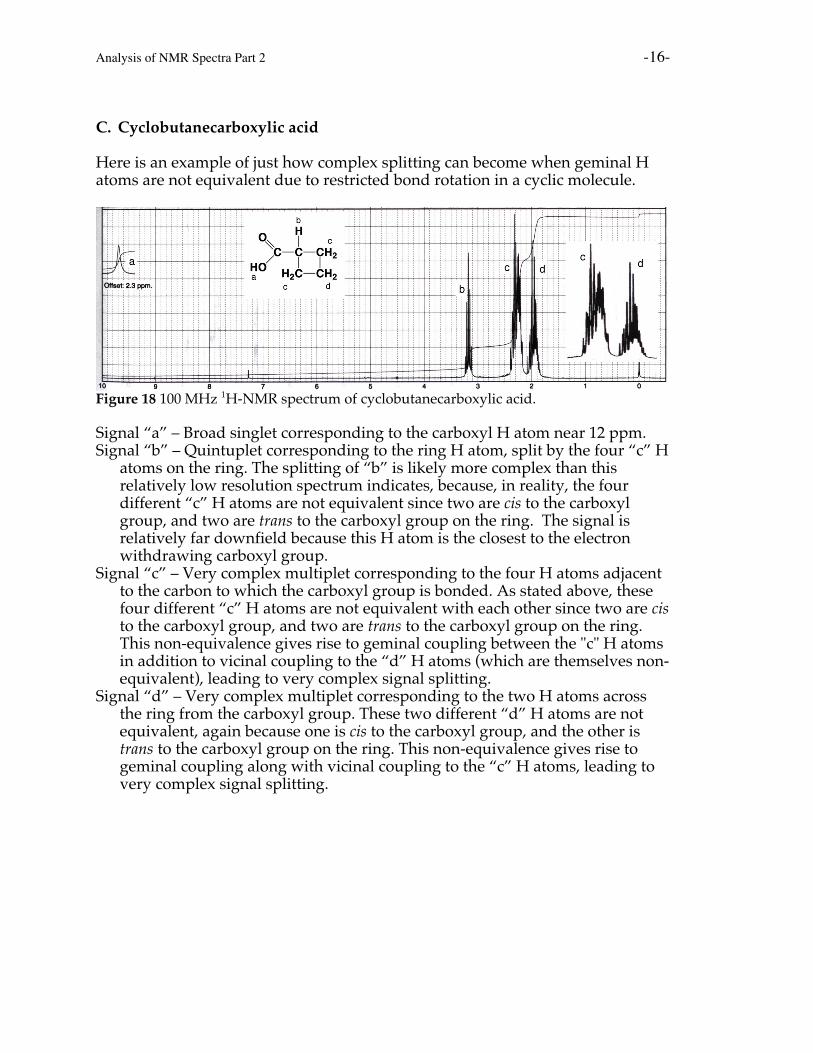
Here is an example of just how complex splitting can become when geminal Hatoms are not equivalent due to restricted bond rotation in a cyclic molecule.
Figure 18 100 MHz 1H-NMR spectrum of cyclobutanecarboxylic acid.
Signal “a” – Broad singlet corresponding to the carboxyl H atom near 12 ppm.Signal “b” – Quintuplet corresponding to the ring H atom, split by the four “c” H
atoms on the ring. The splitting of “b” is likely more complex than thisrelatively low resolution spectrum indicates, because, in reality, the fourdifferent “c” H atoms are not equivalent since two are cis to the carboxylgroup, and two are trans to the carboxyl group on the ring. The signal isrelatively far downfield because this H atom is the closest to the electronwithdrawing carboxyl group.
Signal “c” – Very complex multiplet corresponding to the four H atoms adjacentto the carbon to which the carboxyl group is bonded. As stated above, thesefour different “c” H atoms are not equivalent with each other since two are cisto the carboxyl group, and two are trans to the carboxyl group on the ring.This non-equivalence gives rise to geminal coupling between the "c" H atomsin addition to vicinal coupling to the “d” H atoms (which are themselves non-equivalent), leading to very complex signal splitting.
Signal “d” – Very complex multiplet corresponding to the two H atoms acrossthe ring from the carboxyl group. These two different “d” H atoms are notequivalent, again because one is cis to the carboxyl group, and the other istrans to the carboxyl group on the ring. This non-equivalence gives rise togeminal coupling along with vicinal coupling to the “c” H atoms, leading tovery complex signal splitting.
Analysis of NMR Spectra Part 2 -17-
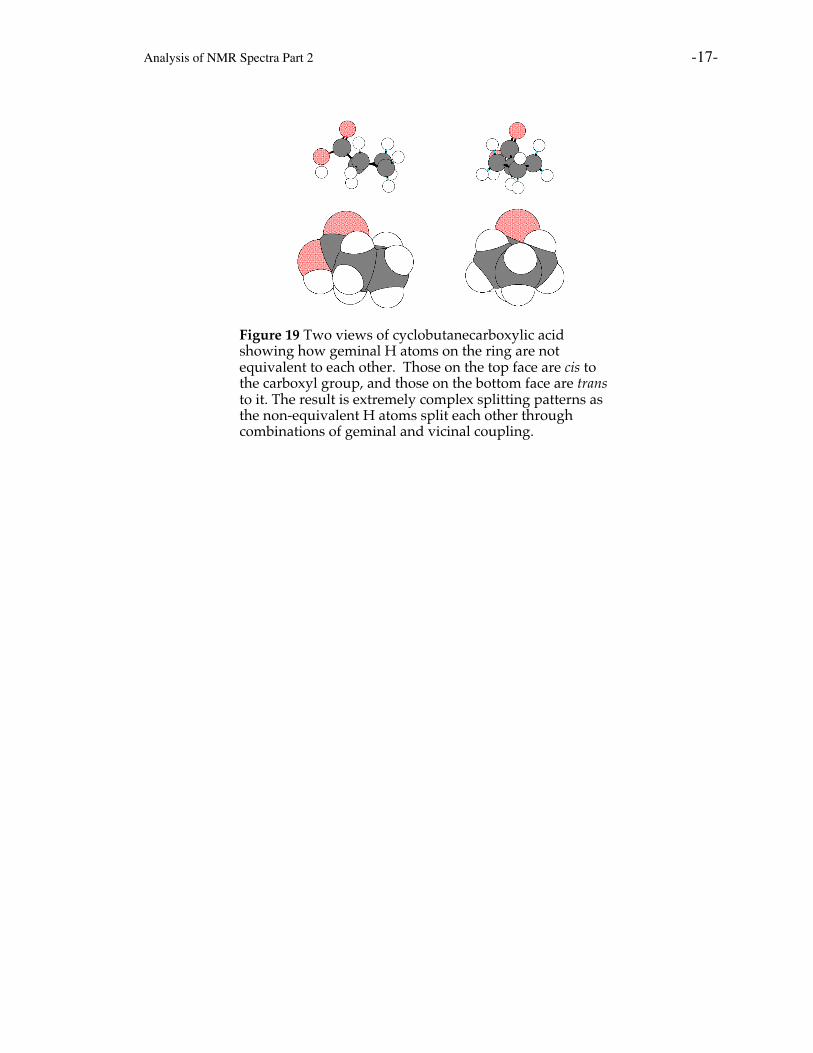
Figure 19 Two views of cyclobutanecarboxylic acidshowing how geminal H atoms on the ring are notequivalent to each other. Those on the top face are cis tothe carboxyl group, and those on the bottom face are transto it. The result is extremely complex splitting patterns asthe non-equivalent H atoms split each other throughcombinations of geminal and vicinal coupling.