Embed Size (px)
Citation preview
Renewable Eneryy Vol. 3, No. 8, pp. 935 939. 1993 096(~1481/93 $6.00 +.00 Printed in Great Britain. Pergamon Press Ltd
DATA BANK
Analysis of monthly average daily global radiation and monthly average sunshine duration at two tropical locations
P. K . VEERAN a n d S. K U M A R
School of Energy, Environment and Natural Resources, Madurai Kamaraj University, Madurai 625 021, India
(Received 17 December 1992; accepted 12 Januao' 1993)
A b s t r a c ~ T h e monthly average daily totals of global solar radiation on a horizontal surface at Madras (13 0 'N, 80"11'E) and Kodaikanal (10 14'N, 77~'28'E) during the period 1983 1987 have been processed, analysed and presented: The regression coefficients, a and b, of Angstrom linear type correlations for the monthly mean daily global solar radiation have been determined for these two locations. A comparison of average global radiation and sunshine duration obtained here (5 years) with long term data (more than 15 years) shows that a min imum of 5 years is sufficient to obtain average values for radiation, whereas the same does not hold true for the duration of sunshine.
i. I N T R O D U C T I O N
The monthly average of the daily global solar radiation at a location is an important parameter for the design and prediction of solar system performance, thermal or photo- voltaic. Information on solar radiation at a location is obtained by measuring sunshine duration : hourly and daily values of global, direct and diffuse radiation. Sunshine duration is the most commonly measured parameter and, therefore, scientists have used various methods to correlate global radiation with sunshine duration. Recent data on sunshine duration and hourly global radiation were made available [l] for Madras and Kodaikanal in India, and this paper presents the results o f the analyses conducted based on these data.
The aim of this paper is to present the regression coefficients a and b for Madras and Kodaikanal, and secondly, to compare the 5-years data (present study) with those of Mani and Rangarajan [2] (21 years for Madras and 16 years for Kodaikanal) in order to see whether 5-years data is sufficient to predict the average values of daily global radiation and sunshine duration. This study is important since it is not always clear how many years data is necessary to estimate average values, though for solar radiation, a min imum of 4 years is considered necessary [2]. Earlier stud- ies [2 6] on solar radiation in India are discussed briefly as follows.
An excellent analysis has been performed by Mani and Rangarajan [2] who have used data from 1957 to 1978 and given radiation data for 145 locations in India. Gupta et al. [3] have published monthly average daily global radiation values for 12 locations based on data recorded (sunshine duration and radiation) between 1958 and 1964. Garg and Garg ]4] have included the ambient temperature and relative humidity and have based their analysis on 14 locations. Gopinathan [5] has used latitude as a parameter to calculate the regression coefficients and has shown that this method yields accurate results for six locations used in his study. Vijay Modi and Sukhatme [6] analysed the insolation and weather data for a large number of cities in India. In this
study, in order to increase the accuracy of the prediction of correlations, India was divided into two regions on the basis of the climatic characteristic of the winter monsoon, and it was found that per cent possible sunshine, all clouds and precipitation could be used to estimate insolation with low error.
2. DATA
The daily global solar radiation and sunshine hours data of Madras and Kodaikanal for the period 1983-1987 were used in the study. Table 1 gives information regarding the location and the number of months and data used in the study. It should be mentioned that Madras is a coastal location, while Kodaikanal, a hilly location, lies in the interior. The radiation values were recorded at local apparent time (LAT), i.e. solar time. Before using the raw data for analysis, the given data were scrutinized as follows: (1) a day with even one missing hourly reading during the period 6 a.m. to 6 p.m. was excluded ; and (2) data which gave very high (K > 0.85) or very low (K < 0.15) values were excluded.
The Meteorological Department provided data for 16 h~ i.e. from 4 a.m. to 8 p.m. The data recorded from 4 a.m. to 6 a.m. and from 6 p.m. to 8 p.m. for all days in this 5-year period were not used since the radiation recorded during this period was very low and in some cases had missing values. This exclusion should not influence the result as their values were only a fraction of the daily total. The radiation values observed between 6 a.m. and 6 p.m., and daily sunshine
Table I. Location and data used in this study
Madras Kodaikanal
Latitude 13~N 10 14'N Longitude 80: I I 'E 77 28'E Altitude (m) 16 2345 Months of data used 57 60
935
936 Data Bank
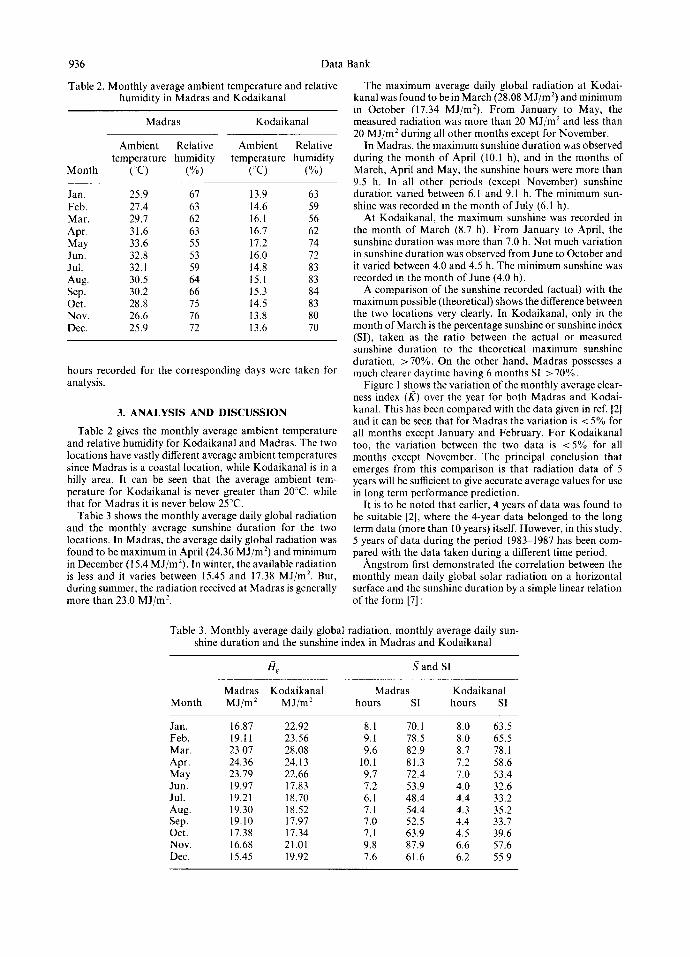
Table 2. Monthly average ambient temperature and relative humidity in Madras and Kodaikanal
Month
Madras Kodaikanal
Ambient Relative Ambient Relative temperature humidity temperature humidity
(c) (%) (c) (%)
Jan. 25.9 67 13.9 63 Feb. 27.4 63 14.6 59 Mar. 29.7 62 16.1 56 Apr. 31.6 63 16.7 62 May 33.6 55 17.2 74 Jun. 32.8 53 16.0 72 Jul. 32.1 59 14.8 83 Aug. 30.5 64 15.1 83 Sep. 30.2 66 15.3 84 Oct. 28.8 75 14.5 83 Nov. 26.6 76 13.8 80 Dec. 25.9 72 13.6 70
hours recorded for the corresponding days were taken for analysis.
3. ANALYSIS AND DISCUSSION
Table 2 gives the monthly average ambient temperature and relative humidity for Kodaikanal and Madras. The two locations have vastly different average ambient temperatures since Madras is a coastal location, while Kodaikanal is in a hilly area. It can be seen that the average ambient tem- perature for Kodaikanal is never greater than 20°C, while that for Madras it is never below 25"~'C.
Table 3 shows the monthly average daily global radiation and the monthly average sunshine duration for the two locations. In Madras, the average daily global radiation was found to be maximum in April (24.36 MJ/m 2) and minimum in December (15.4 MJ/m 2). In winter, the available radiation is less and it varies between 15.45 and 17.38 MJ/m 2. But, during summer, the radiation received at Madras is generally more than 23.0 MJ/m 2.
The maximum average daily global radiation at Kodai- kanal was found to be in March (28.08 MJ/m 2) and minimum in October (17.34 MJ/m2). From January to May, the measured radiation was more than 20 MJ/m 2 and less than 20 MJ/m 2 during all other months except for November.
In Madras, the maximum sunshine duration was observed during the month of April (10.1 h), and in the months of March, April and May, the sunshine hours were more than 9.5 h. In all other periods (except November) sunshine duration varied between 6.1 and 9.1 h. The minimum sun- shine was recorded in the month of July (6.1 h).
At Kodaikanal, the maximum sunshine was recorded in the month of March (8.7 h). From January to April, the sunshine duration was more than 7.0 h. Not much variation in sunshine duration was observed from June to October and it varied between 4.0 and 4.5 h. The minimum sunshine was recorded in the month of June (4.0 h).
A comparison of the sunshine recorded (actual) with the maximum possible (theoretical) shows the difference between the two locations very clearly. In Kodaikanal, only in the month of March is the percentage sunshine or sunshine index (SI), taken as the ratio between the actual or measured sunshine duration to the theoretical maximum sunshine duration, >70%. On the other hand, Madras possesses a much clearer daytime having 6 months SI > 70%.
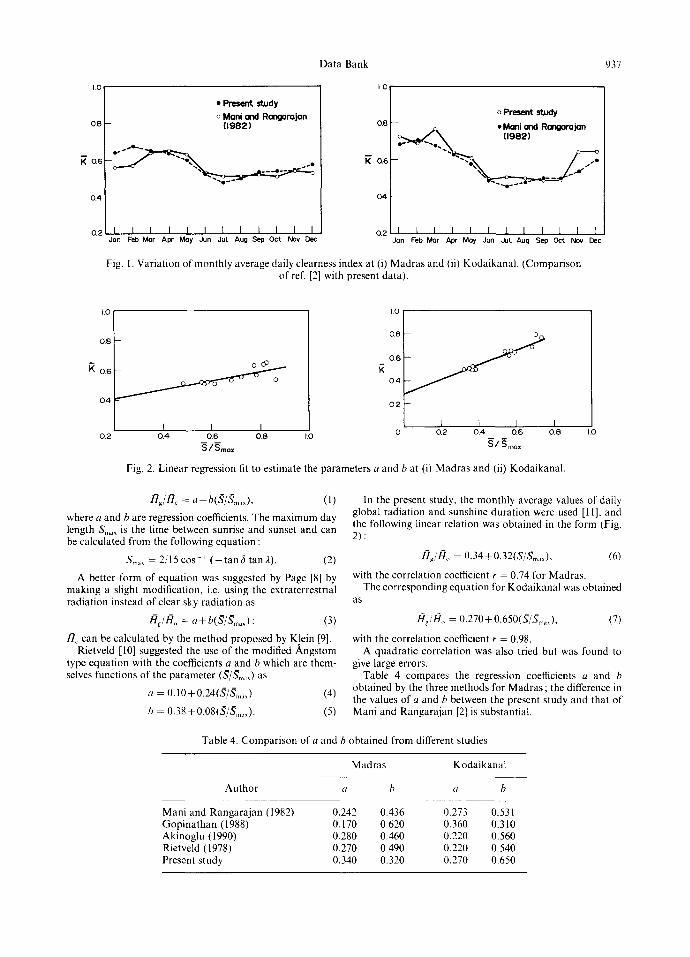
Figure 1 shows the variation of the monthly average clear- ness index (/() over the year for both Madras and Kodai- kanal. This has been compared with the data given in ref. [2] and it can be seen that for Madras the variation is < 5% for all months except January and February. For Kodaikanal too, the variation between the two data is < 5 % for all months except November. The principal conclusion that emerges from this comparison is that radiation data of 5 years will be sufficient to give accurate average values for use in long term performance prediction.
It is to be noted that earlier, 4 years of data was found to be suitable [2], where the 4-year data belonged to the long term data (more than 10 years) itself. However, in this study, 5 years of data during the period 1983 1987 has been com- pared with the data taken during a different time period.
Angstrom first demonstrated the correlation between the monthly mean daily global solar radiation on a horizontal surface and the sunshine duration by a simple linear relation of the form [7] :
Table 3. Monthly average daily global radiation, monthly average daily sun- shine duration and the sunshine index in Madras and Kodaikanal
Hg ~q and SI
Madras Kodaikanal Madras Month MJ/m 2 MJ/m 2 hours SI
Kodaikanal hours SI
Jan. 16.87 22.92 Feb. 19.11 23.56 Mar. 23.07 28.08 Apr. 24.36 24.13 May 23.79 22.66 Jun. 19.97 17.83 Jul. 19.21 18.70 Aug. 19.30 18.52 Sep. 19.10 17.97 Oct. 17.38 17.34 Nov. 16.68 21.01 Dec. 15.45 19.92
8.1 70.1 8.0 63.5 9.1 78.5 8.0 65.5 9.6 82.9 8.7 78.1
10.I 81.3 7.2 58.6 9.7 72.4 7.0 53.4 7.2 53.9 4.0 32.6 6.1 48.4 4.4 33.2 7.1 54.4 4.3 35.2 7.0 52.5 4.4 33.7 7.1 63.9 4.5 39.6 9.8 87.9 6.6 57.6 7.6 61.6 6.2 55.9
Data Bank 937
,-01 Q8
• P r e s e n t study o Mani end Rongarojan
(1982)
0.6
0.4
0.2
~ 8
0.6
Q4
o Present study
• Moni and Rangorajon (1982)
I I I I [ I I I I I L I o 2 I [ I I I I I I I I I I Jan Feb Mor Apt Moy Jun Jut Aug Sep Oct Nov Dec Jan Feb Mar Apr Moy Jun JuL Aug Sep Oct Nov Dec
Fig. I. Variation of monthly average daily clearness index at (i) Madras and (ii) Kodaikanal. (Comparison of ref. [2] with present data).
I 0
0.8
0.6
0.4
0.2 t L I
0.4 0.6 0.8
S / S m o x
t.O
tO
Q8
0 6
0 4
Q2
I I I I 0.2 0.4 0.6 0 8
S / S r n o x
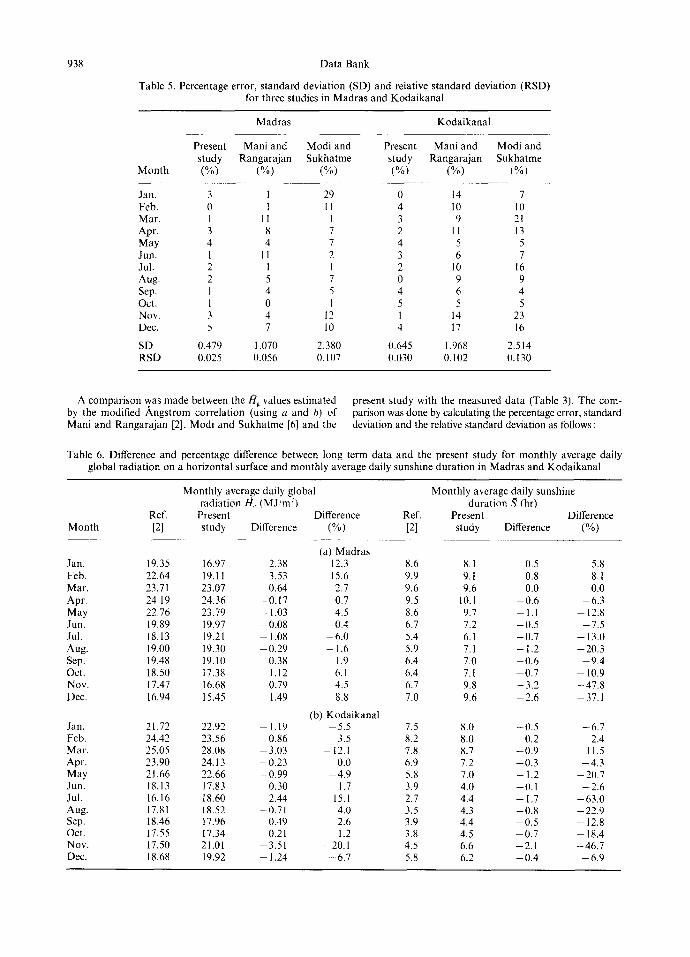
Fig. 2. Linear regression fit to estimate the parameters a and b at (i) Madras and (ii) Kodaikanal.
LO
t7tg/t71~ = a+b(S /Sm, ,O , (1)
where a and b are regression coefficients. The maximum day length Sm,,x is the time between sunrise and sunset and can be calculated from the following equation :
S .... = 2 / 1 5 c o s ~ ( - t a n 6 t a n 2 ) . (2)
A better form of equation was suggested by Page [8] by making a slight modification, i.e. using the extraterrestrial radiation instead of clear sky radiation as
IZlj tTlo = a + b( S/$m~,,) , (3)
/t,, can be calculated by the method proposed by Klein [9]. Rietveld [10] suggested the use of the modified ,~ngstom
type equation with the coefficients a and b which are them- selves functions of the parameter (S/S,,~:,) as
a - 0.10+0.24(S/Sm,,) (4)
h - 0.38 +0.08(,q/S,,,~,0. (5)
In the present study, the monthly average values of daily global radiation and sunshine duration were used [11], and the following linear relation was obtained in the form (Fig. 2):
Hg/Ho = 0.34+0.32(S/~emdx), (6)
with the correlation coefficient r = 0.74 for Madras. The corresponding equation for Kodaikanal was obtained
a s
/~ / / to - 0.270+0.650(S/Sm,,0, (7)
with the correlation coefficient r = 0.98. A quadratic correlation was also tried but was found to
give large errors. Table 4 compares the regression coefficients a and b
obtained by the three methods for Madras ; the difference in the values of a and b between the present study and that of Mani and Rangarajan [2] is substantial.
Table 4. Comparison of a and b obtained from different studies
Madras Kodaikanal
Author a h a b
Mani and Rangarajan (1982) 0,242 0.436 0.273 0.531 Gopinathan (1988) 0,170 0.620 0.360 0.310 Akinoglu (1990) 0,280 0.460 0.220 0.560 Rietveld (1978) 0,270 0.490 0.220 0.540 Present study 0,340 0.320 0.270 0.650
938 Data Bank
Table 5. Percentage error, standard deviation (SD) and relative standard deviation (RSD) for three studies in Madras and Kodaikanal
Month
Madras Kodaikanal
Present Mani and Modi and Present Mani and Modi and study Rangarajan Sukhatme study Rangarajan Sukhatme (%) (%) (%) (%) (%) (%)
Jan. 3 1 29 0 t4 7 Feb. 0 1 1l 4 10 10 Mar. 1 11 I 3 9 21 Apr. 3 8 7 2 11 13 May 4 4 7 4 5 5 Jun. 1 11 2 3 6 7 Jul. 2 I 1 2 10 16 Aug. 2 5 7 0 9 9 Sep. 1 4 5 4 6 4 Oct. 1 0 1 5 5 5 Nov. 3 4 12 1 14 23 Dec. 5 7 10 4 17 16
SD 0.479 1.070 2.380 0.645 1.968 2.514 RSD 0.025 0.056 0.107 0.030 0.102 0.130
A comparison was made between the/tg values estimated by the modified /~ngstrom correlation (using a and b) of Mani and Rangarajan [2], Modi and Sukhatme [6] and the
present study with the measured data (Table 3). The com- parison was done by calculating the percentage error, standard deviation and the relative standard deviation as follows :
Table 6. Difference and percentage difference between long term data and the present study for monthly average daily global radiation on a horizontal surface and monthly average daily sunshine duration in Madras and Kodaikanal
Month
Monthly average daily global Monthly average daily sunshine radiation/4~ (MJ/m 2) duration ,~ (hr)
Ref. Present Difference Ref. Present Difference [2] study Difference (%) [2] study Difference (%)
(a) Madras Jan. 19.35 16.97 2.38 12.3 8.6 8.1 0.5 5.8 Feb. 22.64 19.1 ! 3.53 15.6 9.9 9.1 0.8 8.1 Mar. 23.71 23.07 0.64 2.7 9.6 9.6 0.0 0.0 Apr. 24.19 24.36 -0 .17 0.7 9.5 10.1 - 0 . 6 -6 .3 May 22.76 23.79 -1 .03 4.5 8.6 9.7 -1 .1 -12 .8 Jun. 19.89 19.97 0.08 - 0 . 4 6.7 7.2 - 0 . 5 -7 .5 Jul. 18.13 19.21 -1 .08 - 6 . 0 5.4 6.1 - 0 . 7 -13 .0 Aug. 19.00 19.30 -0 .29 - 1.6 5.9 7.1 - 1.2 -20.3 Sep. 19.48 19.10 0.38 1.9 6.4 7.0 - 0 . 6 - 9 . 4 Oct. 18.50 17.38 1.12 6.1 6.4 7.1 - 0 . 7 - 10.9 Nov. 17.47 16.68 0.79 4.5 6.7 9.8 - 3.2 - 47.8 Dec. 16.94 15.45 1.49 8.8 7.0 9.6 - 2 . 6 -37.1
(b) Kodaikanal Jan. 21.72 22.92 1.19 5.5 7.5 8.0 - 0.5 - 6.7 Feb. 24.42 23.56 0.86 3.5 8.2 8.0 0.2 2.4 Mar. 25.05 28.08 -3 .03 - 12.1 7.8 8.7 - 0 . 9 11.5 Apr. 23.90 24.13 -0 .23 0.0 6.9 7.2 -0 .3 -4 .3 May 21.66 22.66 -0 .99 - 4 . 9 5.8 7.0 - 1.2 20.7 Jun. 18.13 17.83 0.30 1.7 3.9 4.0 - 0.1 - 2.6 Jul. 16.16 18.60 -2 .44 - 15.1 2.7 4.4 - 1.7 -63 .0 Aug. 17.81 18.52 -0.71 4.0 3.5 4.3 -0 .8 -22 .9 Sep. 18.46 17.96 0.49 2.6 3.9 4.4 - 0 . 5 - 12.8 Oct. 17.55 17.34 0.21 1.2 3.8 4.5 -0 .7 - 18.4 Nov. 17.50 21.01 -3.51 -20.1 4.5 6.6 -2 .1 -46 .7 Dec. 18.68 19.92 - 1.24 - 6 . 7 5.8 6.2 - 0 . 4 - 6 . 9
Data Bank
percentage error :: : ~ x 100, (8) (Hg.~)
1 ~ (/tgd --/lg~)~' (9) standard deviation (SD) = n " "
and the relative standard deviation (RSD)
& / : J (lo)
The results are given in Table 5 for both Madras and Kodaikanal. It can be seen that the correlation given by the present study (equations 6 and 7) gives the least error. A careful study of the data and the analysis made by refs [2] and [6], indicate in ref. [6] that India has been divided into two district zones. On the other hand, the number of years of data used in ref. [2] was much larger. This probably illustrates why the SD and RSD in ref. [2] is closer to the present study than that of ref. [6].
This led to a study of comparing the data base of the present study (5 years) with that of ref. [21 (more than 15 years) and the results are given in Table 6 for both Madras and Kodaikanal. The comparison was made by studying the difference and the percentage difference as
difference = .~ (ref. 2) )7 (present study) 11 l)
(ref. 2) .~ (present study) and % differcnce= _~ × 100,
X (ref. 2) (12)
where )7 represents ei ther/1 or S. It can be seen that the variation between the long term
data [2] and the present study is < __+ 10% for 10 months at Madras and 9 months at Kodaikanal for /4g values, while the corresponding values are only 5 months and 6 months for ;9 values. Moreover, the max imum percentage difference for/ t~ values is about 20%, while for S values the maximum percentage difference is > 50%.
It is therefore clear that average radiation values can be taken by using a min imum of 5-years data. However, in the case of sunshine duration, due to the difficulty in the exact quantification, a small error in a day, instrument or other- wise, of the order of few minutes can lead to large errors. when average values are calculated using long term data. This, therefore, illustrates clearly the reason for the difference in a and h values obtained from ref. [2] and the present study.
4. C O N C L U S I O N
The regression analysis was carried out to correlate the monthly average daily global solar radiation on a horizontal surface in Madras and Kodaikanal with the sunshine hours recorded for the period 1983 1987. The regression constants a and b have been determined and compared with the values reported by different authors for these two locations. A study on the number of years of data necessary for long term calculation of radiation and sunshine duration has shown that 5-years data will be sufficient for radiation analysis. whereas the same could not be said for sunshine duration.
939
N O M E N C L A T U R E
a, b = regression constants, eqn (2) H~ - clear sky daily global radiation on a horizontal sur-
face (MJ/m 2) /q~ = monthly average daily global radiation on a hori-
zontal surface (M J/m=) /?~.~ = calculated value of monthly average daily global
radiation on a horizontal surface (MJ/m 2) /?~.,~ = measured value of monthly average daily global
radiation on a horizontal surface (MJ/m ~) /7, = monthly average daily extraterrestrial radiation on
a horizontal surface (MJ/m ~) K - clearness index (Hg/H~,) R = monthly average clearness index (/4f'/to) n = numbdr of months in a year (12), eqs (9) and (10). ~q - monthly average actual daily sunshine duration (h)
~,,,:,, = monthly average maximum sunshine hours, i.e. the day length, calculated for the mean day of the month (h)
SI = sunshine index, given as the ratio between the monthly average sunshine duration and the maximum possible sunshine duration (,~/~,,,,,,)
6 = declination of the sun (degrees) ;, - latitude of the location (degrees).
R E F E R E N C E S
1. Indian Meteorological Department, Pune, Personal Communicat ion (1990).
2. A. Mani and S. Rangarajan, Solar Radiation over India. Allied Publishers, India (1982).
3. C. L. Gupta, K. Usha Rao and T. A. Reddy, Radiation design data for solar energy applications. Energy Man- agement Oct Dec, 299 313 (1979).
4. H. P. Garg and S. N. Garg, Prediction of global solar radiation from bright sunshine hours and other meteoro- logical data. EIl¢'r.(]y Conversion and Management 2 3 ,
II3 118(1983). 5. K. K. Gopinathan, Solar radiation m o d e l s - a com-
parative study. RERIC Int. Energy J. 10, 51 60 (1988). 6. V. Modi and S. P. Sukhatme, Estimation of daily total
and diffuse insolation in India from weather data. S o h , Energy 22. 407 411 (1979),
7. M. lqbal, An httroduction to Solar Radiation. Academic Press, Canada (1983).
8. S. P. Sukhatme, Solar Energy- Principles o[' Thermal Collection and S1ot'a~le. Tata McGraw-Hill, New Delhi (1987).
9. S. A. Klein, Calculation of monthly average insolation on tilted surfaces. Soh," Energy 19. 325 (1977).
10. M. R. Rictveld, A new method for estimating the regression coefficients in the formula relating solar radi- ation to sunshine. Agricultural Meteorology 19. 243 252 (1978).
11. P. K. Veeran, Solar radiation analysis for Tamil Nadu. Unpublished M.Phil. dissertation. Madurai Kamaraj University, Madurai, India (1993).