Embed Size (px)
Citation preview
Analysis of Molecular Interactions between Yoghurt Bacteria by an Integrated Genomics Approach
Sander Sieuwerts
Thesis committee Thesis supervisor Prof. Dr. W. M. de Vos Professor of Microbiology Wageningen University Thesis co-supervisor Dr. J. E. T. van Hylckama Vlieg Group leader Gut and Microbiology platform Danone Research, Palaiseau, France Other members Prof. Dr. Ir. M.H. Zwietering, Wageningen University Prof. Dr. J. Hugenholtz, University of Amsterdam Dr. J.-W. Sanders, Unilever Research & Development Vlaardingen Dr. V. Monnet, INRA, Jouy en Josas, France This research was conducted under the auspices of the Graduate School VLAG.
2
Analysis of Molecular Interactions between Yoghurt Bacteria by an Integrated Genomics Approach
Sander Sieuwerts
Thesis submitted in partial fulfillment of the requirements for the degree of doctor
at Wageningen University by the authority of the Rector Magnificus
Prof. dr. M. J. Kropff, in the presence of the
Thesis Committee appointed by the Doctorate Board to be defended in public
on Tuesday 27 October 2009 at 1:30 PM in the Aula.
3
Sander Sieuwerts Analysis of molecular interactions between yoghurt bacteria by an integrated genomics approach 224 pages PhD thesis Wageningen University, Wageningen, the Netherlands (2009) With references, with summaries in Dutch and English ISBN 978-90-8585-465-4
4

5 5

6
Table of contents Abstract 9
Chapter 1 General introduction 13
Chapter 2 Unraveling microbial interactions in food fermentations; from classical to genomics approaches
35
Chapter 3 A simple and fast method for determining colony formingunits
65
Chapter 4 Mixed culture transcriptome analysis reveals the molecularbasis of co-culture growth and its consequences inStreptococcus thermophilus and Lactobacillus bulgaricus
73
Chapter 5 Experimental evolution of yoghurt cultures improves co-culture growth and interactions
129
Chapter 6 A genome-scale metabolic model of mixed culture growth of
S. thermophilus and L. bulgaricus
171
Chapter 7 Summary, discussion and future perspectives 191
Dutch summary – Nederlandse samenvatting 209
List of publications 213
Acknowledgements 215
About the author 219
Overview of completed training activities 221
7

8
Abstract The lactic acid bacteria (LAB) are a group of Gram-positive bacteria that ferment sugars such as lactose to produce mainly lactic acid. LAB are a group of industrially important microorganisms that are applied for the production of many fermented foods. These include foods produced with substrates from plant origin (e.g. sauerkraut and wine) and animal origin (e.g. fermented meats and dairy products such as yoghurt). The current market trends regarding sustainability and health-promoting foods demand more efficient and a more diverse range of fermentations. Most fermentations are carried out by multiple strains of different species. The interactions between consortium members are at the base of the performances of the individual microorganisms within a microbial ecosystem and therewith of the whole fermentation. These microbial interactions are often poorly understood. Streptococcus thermophilus and Lactobacillus delbrueckii subsp. bulgaricus are two LAB species that upon fermentation convert (bovine) milk into yoghurt. These two bacteria stimulate each other in growth and acid production. They produce exopolysaccharides (EPS), important for the texture of yoghurt, and characteristic flavor compounds such as acetaldehyde and diacetyl. However, the molecular basis of the mutualistic interactions between these two bacteria was poorly characterized.
In this thesis research, a combination was used of screening, mixed culture transcription profiling, whole-genome metabolic modeling, experimental evolution and next-generation sequencing. This was done to unravel the molecular basis of the interactions between S. thermophilus and L. bulgaricus in milk. The results showed that interactions were primarily based on the exchange of metabolites. Moreover, it was shown which genes or pathways were affected. Evidence was found that S. thermophilus provided L. bulgaricus with formic acid, folic acid (both involved in purine metabolism), long-chain fatty acids (by the action of lipolytic enzymes to break down milk fat) and CO2. The proteolysis by the exoprotease of L. bulgaricus, in turn, provided both species peptides, which are taken up by the cell and broken down into amino acids (AA) by intracellular peptidases. However, this probably did not yield a sufficient supply of branched-chain and sulfur AA, leading to a higher expression of the genes for biosynthesis of these AA in both species when grown in mixed culture. Moreover, EPS biosynthesis genes were induced in the mixed culture, leading to increased EPS production and a higher viscosity of the yoghurt.
A mixed culture genome-scale metabolic model confirmed that cross-feeding interactions between the yoghurt bacteria were based on purine and AA
9
metabolism. Moreover, this model was used to show that the interactions provided a significant benefit to both bacteria, i.e. their biomass yield on lactose increased by around 50% in mixed culture.
Experimental evolution revealed that it is possible to co-adapt a novel combination of strains of S. thermophilus and L. bulgaricus. It was shown that their mutual stimulation increased by optimizing their interactions by fine-tuning expression of pathways involved in the interactions. Furthermore, as little as ~1000 generations of co-culture was sufficient to transform the relatively slow growing mixed culture into one that showed similar performance as commercial starters with respect to key characteristics such as acidification rate and viscosity.
Improved understanding of the described interactions that are at the base of the yoghurt fermentation provides us targets for the rational optimization of existing mixed culture fermentations and the rational development of industrially relevant mixed cultures, such as those containing probiotics. Moreover, the results are in particular interesting for the field of microbial ecology as they show how mutual nutritional dependencies evolve and structure the microbial composition of this ecosystem.
10

11

1212
Chapter 1
General introduction
13
Chapter 1
Historically, many food products were preserved by fermentation by lactic acid bacteria (LAB). For a large part this can be attributed to the desired functionalities of LAB, such as fast growth and the production of acids, volatile compounds and exopolysaccharides. This makes fermentation by LAB the method of choice for improving the taste and structure of food products. With the industrialization of the fermentation processes during the last century, LAB have even gained importance. For example, the cheese market has a worldwide turnover of more than 75 billion US $ and the yoghurt market is worth over 35 billion US $ (59). Most fermentations are carried out by a mixture of species or strains and the last decades it has become clear that the molecular interactions between these different LAB are of key importance for the success of fermentations. In order to control the fermentations and to develop new products, it is important to unravel these interactions. Yoghurt is a relatively well-studied mixed culture fermentation that involves Streptococcus thermophilus and Lactobacillus bulgaricus, but the interactions between the two species are only poorly understood. The low complexity in terms of number of species involved and the high economical value make yoghurt a good model system to study the molecular interactions between the consortium members.
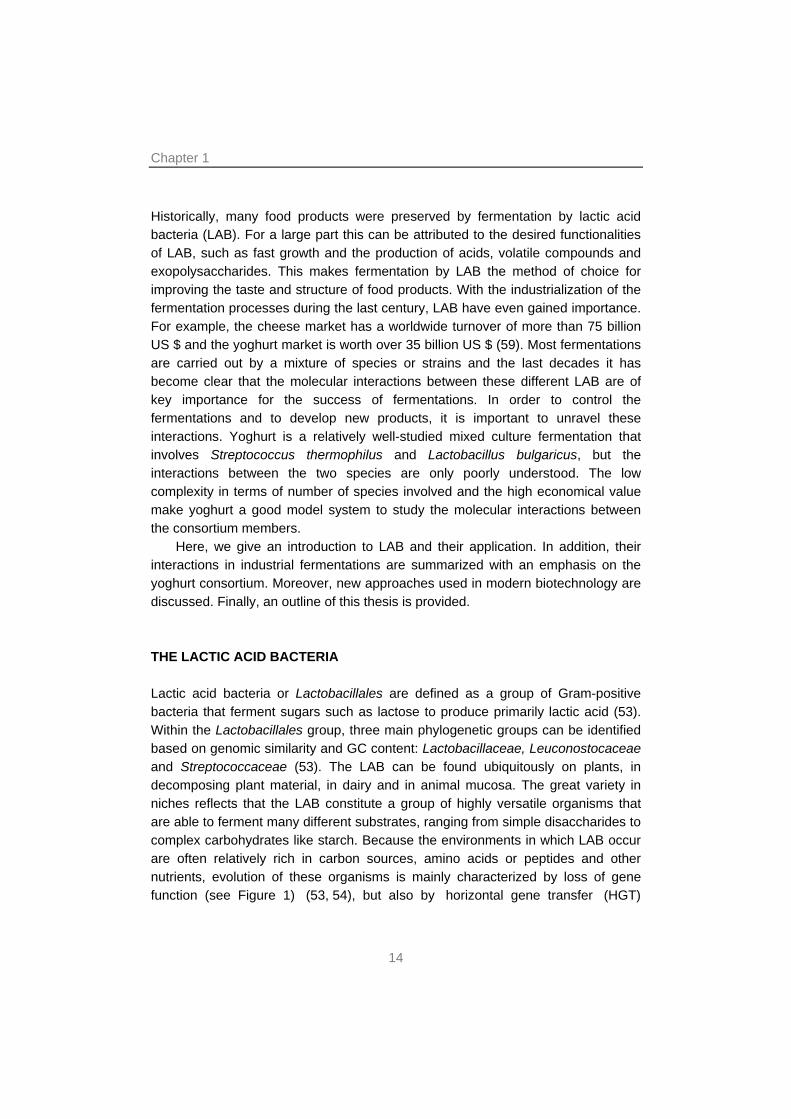
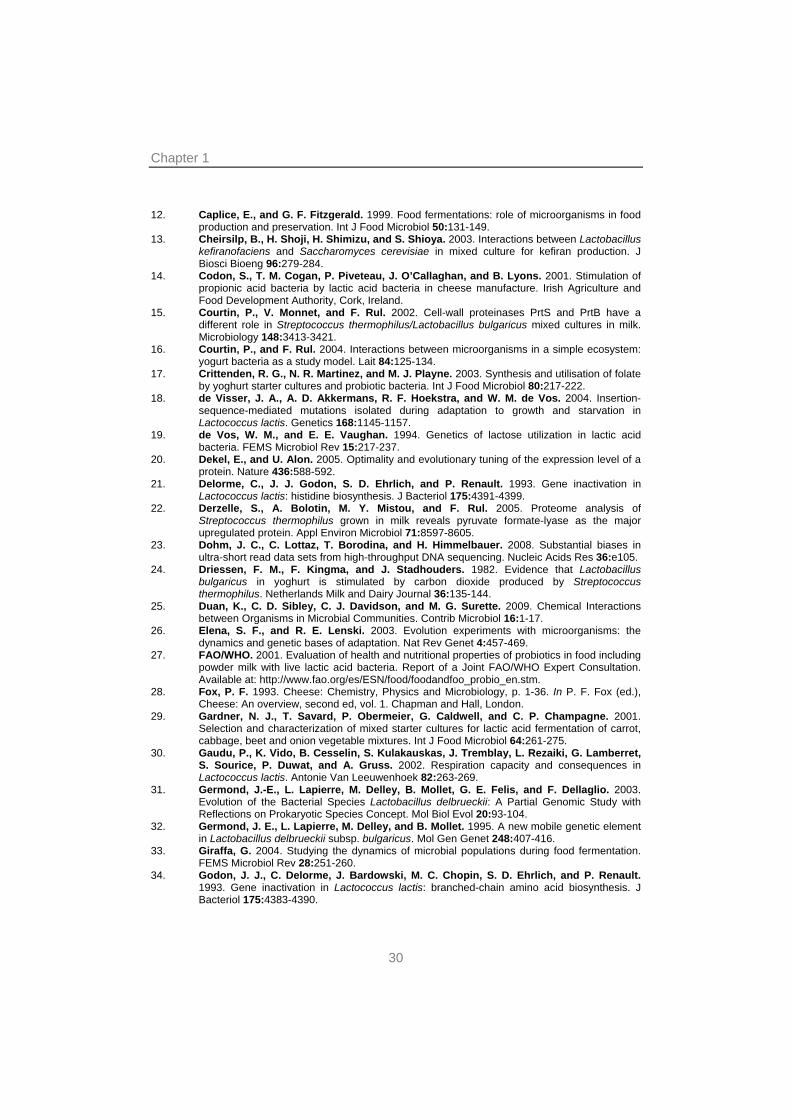
Here, we give an introduction to LAB and their application. In addition, their interactions in industrial fermentations are summarized with an emphasis on the yoghurt consortium. Moreover, new approaches used in modern biotechnology are discussed. Finally, an outline of this thesis is provided. THE LACTIC ACID BACTERIA Lactic acid bacteria or Lactobacillales are defined as a group of Gram-positive bacteria that ferment sugars such as lactose to produce primarily lactic acid (53). Within the Lactobacillales group, three main phylogenetic groups can be identified based on genomic similarity and GC content: Lactobacillaceae, Leuconostocaceae and Streptococcaceae (53). The LAB can be found ubiquitously on plants, in decomposing plant material, in dairy and in animal mucosa. The great variety in niches reflects that the LAB constitute a group of highly versatile organisms that are able to ferment many different substrates, ranging from simple disaccharides to complex carbohydrates like starch. Because the environments in which LAB occur are often relatively rich in carbon sources, amino acids or peptides and other nutrients, evolution of these organisms is mainly characterized by loss of gene function (see Figure 1) (53, 54), but also by horizontal gene transfer (HGT)
14
General introduction
Figure 1. Reconstruction of gene content evolution in Lactobacillales. The tree is rooted by using Bacillus subtilis as the outgroup. For each species and each internal node of the tree, the inferred number of LaCOGs (Lactobacillales-specific clusters of orthologous genes – genes in two species that have a common ancestor gene) present, and the numbers of LaCOGs gained (+) and lost (-) along the branch leading to the given node (species) are indicated. Especially note the low amounts of LaCOGs in Lactobacillus delbrueckii (1278) and Streptococcus thermophilus (1300) that are caused by reductive evolution in these species (indicated in bold). Figure adapted from Makarova et al. (53). between different LAB species. It was suggested that the last common ancestor of Lactobacillales (estimated genome size 2100 to 2200 genes) has lost 600 to 1200 genes (25 to 30%) and gained less than 100 genes after diverging from the Bacilli ancestor (genome size 2700 to 3700 genes), an event that has taken place billions rather than millions of years ago (54). Only since the rise of mammalian life, i.e. the only natural source of lactose, LAB have become the specialized lactose-utilizing bacteria (19). The adaptation to the relatively nutrient-rich and constant dairy environment was the cause of the reductive evolution (70). An illustrative example of reductive evolution is the case of Lactococcus lactis. This species includes strains that are found on plants while other strains are specifically adapted to the dairy environment and are used for the industrial production of cheese. Genomic and physiological studies have shown that the dairy Lc. lactis strains have lost the ability to ferment many carbohydrates while retaining the capacity to utilize efficiently the milk sugar lactose; conversely, the plant-derived Lc. lactis strains are not capable of fast growth on lactose but have a large capacity to degrade a variety of sugars (58, 81). Similarly, adaptation to milk was shown to often lead to auxotrophy for histidine and branched chain amino acids (BCAA) as a result of the accumulation of mutations mainly in the promoter regions of his genes (21), and nonsense mutations and small deletions in the ile and val genes (34).
15
Chapter 1
Expression of genes has both costs and benefits, and therefore optimizing the gene repertoire and its expression for a given niche will determine the evolutionary success of a strain (3, 20). In nutritionally-rich environments, it may be advantageous to harvest compounds required for biosynthesis from the medium rather than expressing biochemical pathways needed for de novo biosynthesis. As a result these pathways are often not functional in many LAB and one can observe genome decay through the accumulation of mutations that result in loss of function, usually by introducing stop codons by frame shifts. These non-functional genes are annotated as pseudogenes. In addition, gene loss may occur, a process in which genes or major parts of these are completely deleted. Moreover, microorganisms that have a long history of growing together may have optimized their genetic repertoire to support associated growth and develop nutritional interactions. This also occurs frequently among LAB, leading to complex cross-feeding relationships and cooperative behavior as for instance in different types of cheese (73), plant-based food products (29, 82) and beverages (55, 77). Similarly, the close proximities in space and time of different species have facilitated horizontal gene transfer (HGT) leading to genomes containing regions with a deviating GC content originating from other species in the same habitat (4, 5, 53).
LAB ferment sugars in a homofermentative (leading to lactic acid) or heterofermentative (leading to a mixture of lactic acid, carbon dioxide, acetic acid and ethanol) way (40). Most Lactobacillales are microaerophilic, meaning that they are oxygen tolerant, but do not perform well in an oxygen-rich (i.e. atmospheric) environment. Recently, it was found that several LAB may respire when cultured in the presence of specific cofactors or their precursors (9, 30). Respiration yields additional ATP per mol of substrate but LAB do not respire in a energy-rich environment such as milk as they have lost the ability to synthesize heme (9, 63). This indicates that the evolutionary strategy followed by most LAB is to optimize their growth and acid production rate rather than their yield (79). The resulting high acidification rate combined with the high acid tolerance makes LAB successful for the preservation of food products by fermentation (12).
16
General introduction
INDUSTRIAL FERMENTATIONS WITH LACTIC ACID BACTERIA LAB have a history of being safely applied in the preservation of food for thousands of years (56). Many LAB species are considered safe for application in fermented food and have acquired the “qualified presumption of safety” (QPS) status in the European Union and the “generally regarded as safe” (GRAS) status in the United states of America dependent on the food they are applied in (43). Since the start of human civilization fermentation has been applied to preserve milk, meat and vegetables and to improve the organoleptic characteristics of foods (12, 28). Initially, these fermentations occurred naturally, but later were started by inoculating the substrate with a small sample of the fermented product. The knowledge on the appropriate techniques was transferred from generation to generation. Only since the rapid scientific progress in the field of microbiology in the 19th century the processes executed by microorganisms that occur during fermentation are being understood (12). It was found that many fermentations relied on the action of mixed cultures of yeasts, filamentous fungi and different species of LAB. The industrialization in the late 19th century together with the isolation and identification of these species in the mid 20th century paved the way for large-scale food production by fermentation to support the increasing growth of the human population (see Table 1). This process continued in the 2nd half of the 20th century with the use of starter cultures to achieve a constant and reproducible quality of the fermented products. These starter cultures, for instance those used for the production of cheese and other fermented dairy products, consisted of either a single strain, multiple strains of one species, or multiple strains of multiple species. The fact that interactions between consortium members play a key role in the performance of a fermentation has only been recognized in the last decades. This notion implies that in the design of starter cultures for mixed fermentations not only single strain traits have to be addressed, but also the interaction potential needs to be included. Mixed strain fermentations have received additional attention with the emergence and rapid growth of the consumer interest in fermented foods containing LAB marketed as probiotics. These probiotics are defined as live microorganisms which, when administered in adequate amounts, confer a health benefit on the host (27). Although some novel probiotic products contain only one – the probiotic – strain, there is much interest in novel strain combinations that typically consist of a traditional starter in combination with one or more probiotic strains. In addition, the probiotic activity may be modulated by the strain’s ability to grow in the desired substrate and its interactions with the starter culture. Similar
17
Chapter 1
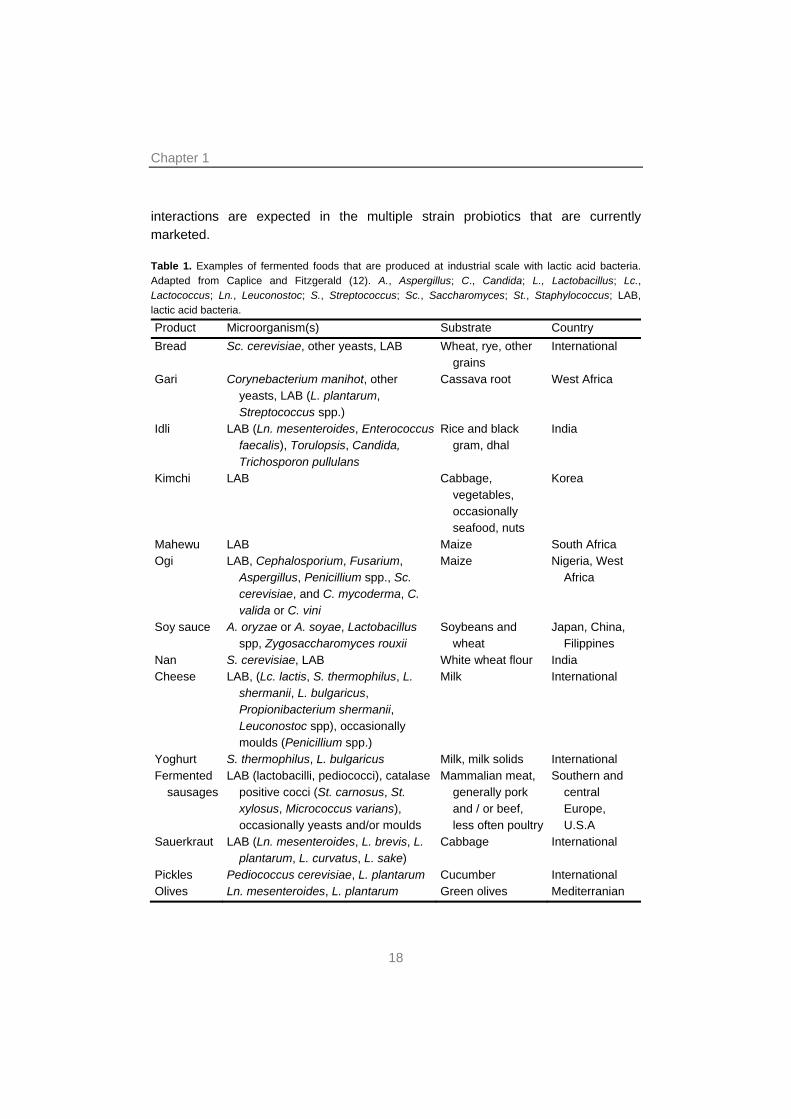
interactions are expected in the multiple strain probiotics that are currently marketed. Table 1. Examples of fermented foods that are produced at industrial scale with lactic acid bacteria. Adapted from Caplice and Fitzgerald (12). A., Aspergillus; C., Candida; L., Lactobacillus; Lc., Lactococcus; Ln., Leuconostoc; S., Streptococcus; Sc., Saccharomyces; St., Staphylococcus; LAB, lactic acid bacteria.
Product Microorganism(s) Substrate Country Bread Sc. cerevisiae, other yeasts, LAB Wheat, rye, other
grains International
Gari Corynebacterium manihot, other yeasts, LAB (L. plantarum, Streptococcus spp.)
Cassava root West Africa
Idli LAB (Ln. mesenteroides, Enterococcus faecalis), Torulopsis, Candida, Trichosporon pullulans
Rice and black gram, dhal
India
Kimchi LAB Cabbage, vegetables, occasionally seafood, nuts
Korea
Mahewu LAB Maize South Africa Ogi LAB, Cephalosporium, Fusarium,
Aspergillus, Penicillium spp., Sc. cerevisiae, and C. mycoderma, C. valida or C. vini
Maize Nigeria, West Africa
Soy sauce A. oryzae or A. soyae, Lactobacillus spp, Zygosaccharomyces rouxii
Soybeans and wheat
Japan, China, Filippines
Nan S. cerevisiae, LAB White wheat flour India Cheese LAB, (Lc. lactis, S. thermophilus, L.
shermanii, L. bulgaricus, Propionibacterium shermanii, Leuconostoc spp), occasionally moulds (Penicillium spp.)
Milk International
Yoghurt S. thermophilus, L. bulgaricus Milk, milk solids International Fermented
sausages LAB (lactobacilli, pediococci), catalase
positive cocci (St. carnosus, St. xylosus, Micrococcus varians), occasionally yeasts and/or moulds
Mammalian meat, generally pork and / or beef, less often poultry
Southern and central Europe, U.S.A
Sauerkraut LAB (Ln. mesenteroides, L. brevis, L. plantarum, L. curvatus, L. sake)
Cabbage International
Pickles Pediococcus cerevisiae, L. plantarum Cucumber International Olives Ln. mesenteroides, L. plantarum Green olives Mediterranian
18
General introduction
INTERACTIONS BETWEEN MICROORGANISMS IN INDUSTRIAL FERMENTATIONS Because of their ecological importance, there has been considerable interest in defining the nature of the interactions between microbes (25, 33). A total of six classes of interactions have been defined, which are distinguished based on differences in mutual effects on fitness that can occur between microorganisms: neutralism, competition, amensalism, commensalism, parasitism and mutualism (38, 72). Neutralism is the absence of interactions. Therefore, neutralism is not truly considered a class of interaction. In reality, this will not occur often in industrial fermentations because any action of a microorganism (e.g. the consumption of substrate or the production of metabolites) will inevitably have an effect on its neighboring microorganisms. Competition is perhaps the most obvious mode of interaction. Two microorganisms competing for a substrate will negatively affect each other in case the substrate becomes growth limiting. Amensalism is the type of interaction in which one organism adversely affects the other organism without being affected itself. This occurs frequently in mixed culture fermentations (49). Examples include the production of carboxylic acids such as lactic or acetic acid, alcohols (12, 49) and bacteriocins (1, 51). In contrast, when one species benefits from the other, while the second is not affected, it is called commensalism. Examples are fermentations where one microorganism consumes a product that is produced by another (14, 57). Such a trophic interaction can be very valuable in an applied context when a stable combination needs to be obtained or in the cases where a fermentation end metabolite needs to be removed because it is detrimental to the product characteristics. In surface-ripened cheeses, lactic acid is consumed by yeasts. This leads to de-acidification of the cheese surface enabling the outgrowth of aerobic bacteria necessary for the cheese its characteristic flavor (57). In parasitism, one species benefits at the expense of another. Perhaps the most frequently occurring examples are the bacteriophages. Phage attacks have been a longstanding problem. Still today, in an era of increased awareness of the importance of hygiene, it leads to major losses in the food industry. This resulted in the emergence of a complete field of research in mastering phages (76). Finally, mutualistic interactions are positive for both microorganism involved. Many industrial fermentations rely on the mutualistic interactions among LAB species or between LAB, other bacteria and eukaryotes (i.e. yeasts and filamentous fungi). One of the best known mutualistic interactions is that between Streptococcus thermophilus and Lactobacillus bulgaricus, which was reclassified two decades ago into L. delbrueckiii subsp. bulgaricus (31, 83). Amensalism, commensalism,
19
Chapter 1
parasitism and mutualism typically result from co-evolution as is exemplified by the co-evolution of S. thermophilus and bacteriophages (11). A more extensive overview of these interactions is presented in Chapter 2. YOGHURT, A MILK PRODUCT FERMENTED BY TWO STRAINS Yoghurt is a dairy product mostly made from bovine milk that is fermented by the lactic acid bacteria S. thermophilus and L. bulgaricus. Records of the application of yoghurt as a food product date back to as much as 8000 years ago (28, 77). Only during the last century the two species responsible for this fermentation were identified. In recent years, the genomes of several yoghurt strains have been characterized as is discussed below. Streptococcus thermophilus To date, there are three complete genome sequences available of S. thermophilus, namely strains CNRZ1066, LMG18311 (4) and LMD-9 (53). The S. thermophilus genome is approximately 1.8 Mb large and is predicted to contain 1915 protein-coding genes in strain CNRZ1066, the first strain to be characterized at the genome level (see Table 2 and Figure 2a).
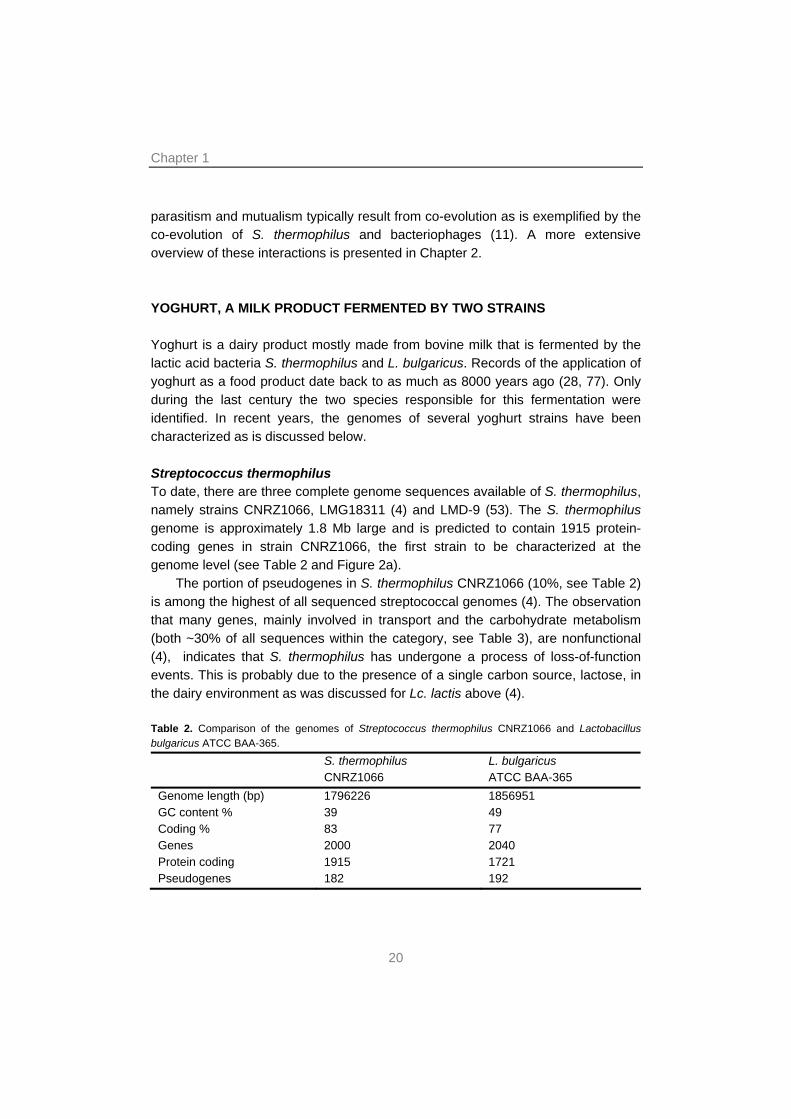
The portion of pseudogenes in S. thermophilus CNRZ1066 (10%, see Table 2) is among the highest of all sequenced streptococcal genomes (4). The observation that many genes, mainly involved in transport and the carbohydrate metabolism (both ~30% of all sequences within the category, see Table 3), are nonfunctional (4), indicates that S. thermophilus has undergone a process of loss-of-function events. This is probably due to the presence of a single carbon source, lactose, in the dairy environment as was discussed for Lc. lactis above (4). Table 2. Comparison of the genomes of Streptococcus thermophilus CNRZ1066 and Lactobacillus bulgaricus ATCC BAA-365.
S. thermophilus CNRZ1066
L. bulgaricus ATCC BAA-365
Genome length (bp) 1796226 1856951 GC content % 39 49 Coding % 83 77 Genes 2000 2040 Protein coding 1915 1721 Pseudogenes 182 192
20
General introduction
A B
S. thermophilus CNRZ1066
L. bulgaricus ATCC BAA-365
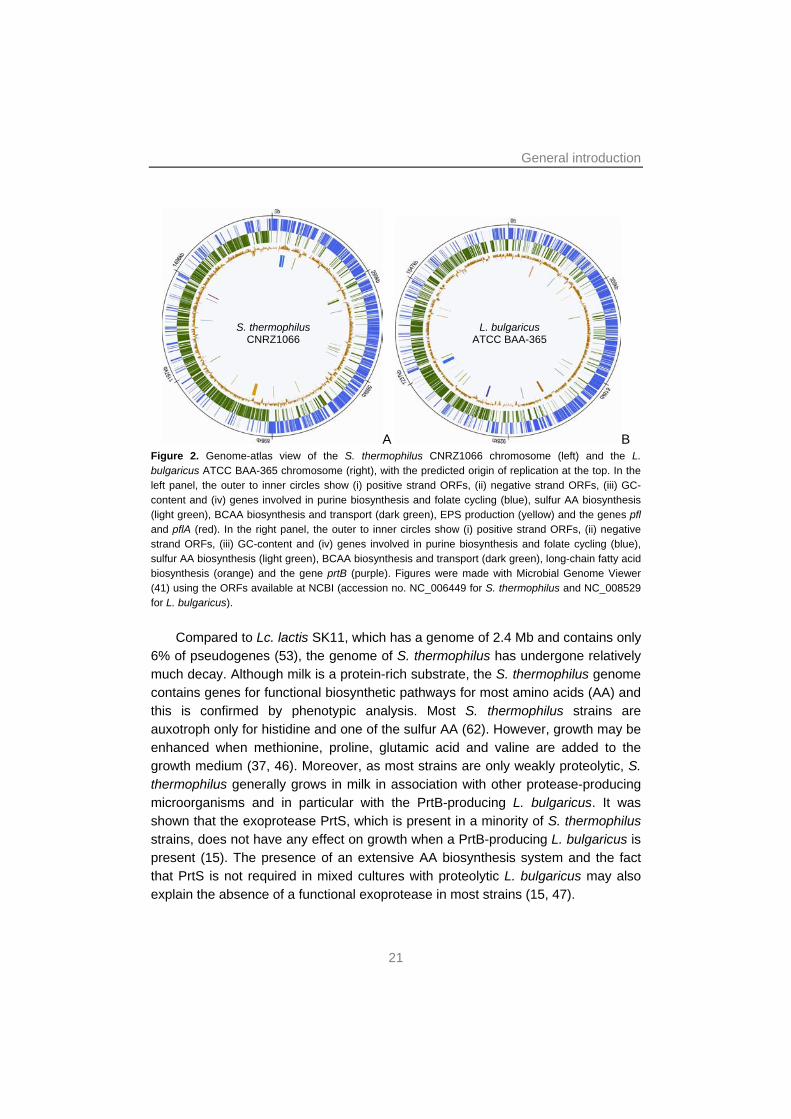
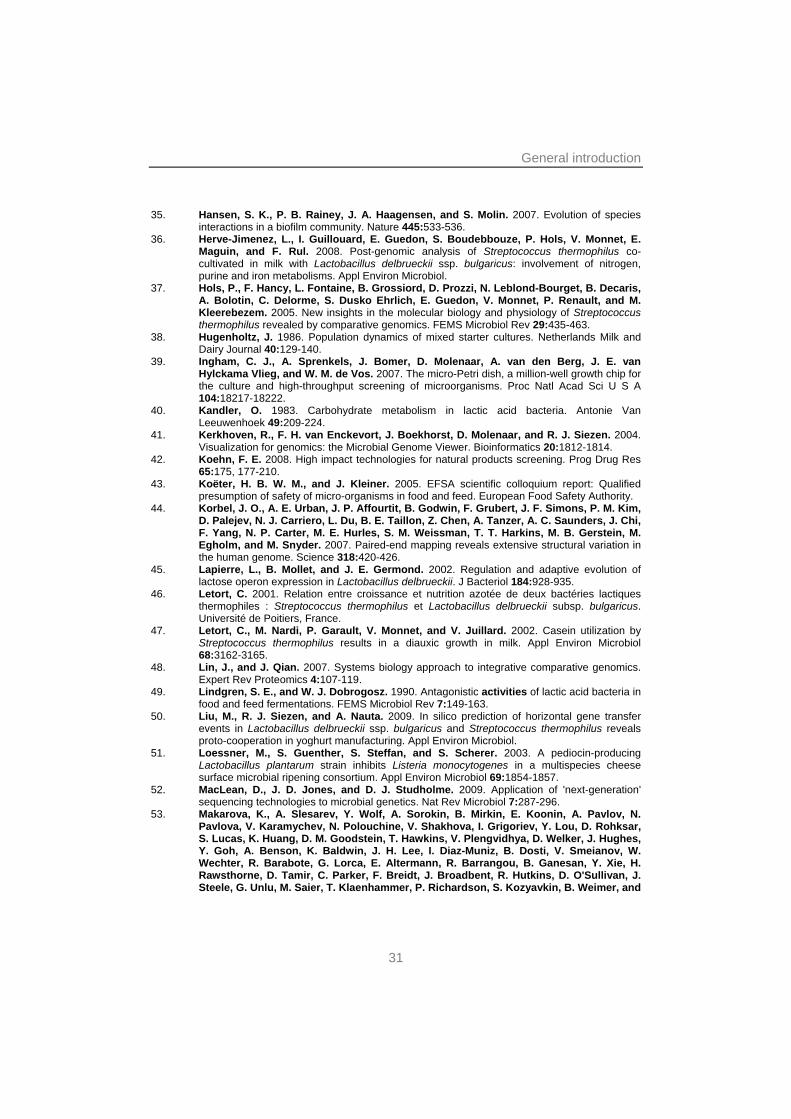
Figure 2. Genome-atlas view of the S. thermophilus CNRZ1066 chromosome (left) and the L. bulgaricus ATCC BAA-365 chromosome (right), with the predicted origin of replication at the top. In the left panel, the outer to inner circles show (i) positive strand ORFs, (ii) negative strand ORFs, (iii) GC-content and (iv) genes involved in purine biosynthesis and folate cycling (blue), sulfur AA biosynthesis (light green), BCAA biosynthesis and transport (dark green), EPS production (yellow) and the genes pfl and pflA (red). In the right panel, the outer to inner circles show (i) positive strand ORFs, (ii) negative strand ORFs, (iii) GC-content and (iv) genes involved in purine biosynthesis and folate cycling (blue), sulfur AA biosynthesis (light green), BCAA biosynthesis and transport (dark green), long-chain fatty acid biosynthesis (orange) and the gene prtB (purple). Figures were made with Microbial Genome Viewer (41) using the ORFs available at NCBI (accession no. NC_006449 for S. thermophilus and NC_008529 for L. bulgaricus).
Compared to Lc. lactis SK11, which has a genome of 2.4 Mb and contains only 6% of pseudogenes (53), the genome of S. thermophilus has undergone relatively much decay. Although milk is a protein-rich substrate, the S. thermophilus genome contains genes for functional biosynthetic pathways for most amino acids (AA) and this is confirmed by phenotypic analysis. Most S. thermophilus strains are auxotroph only for histidine and one of the sulfur AA (62). However, growth may be enhanced when methionine, proline, glutamic acid and valine are added to the growth medium (37, 46). Moreover, as most strains are only weakly proteolytic, S. thermophilus generally grows in milk in association with other protease-producing microorganisms and in particular with the PrtB-producing L. bulgaricus. It was shown that the exoprotease PrtS, which is present in a minority of S. thermophilus strains, does not have any effect on growth when a PrtB-producing L. bulgaricus is present (15). The presence of an extensive AA biosynthesis system and the fact that PrtS is not required in mixed cultures with proteolytic L. bulgaricus may also explain the absence of a functional exoprotease in most strains (15, 47).
21
Chapter 1
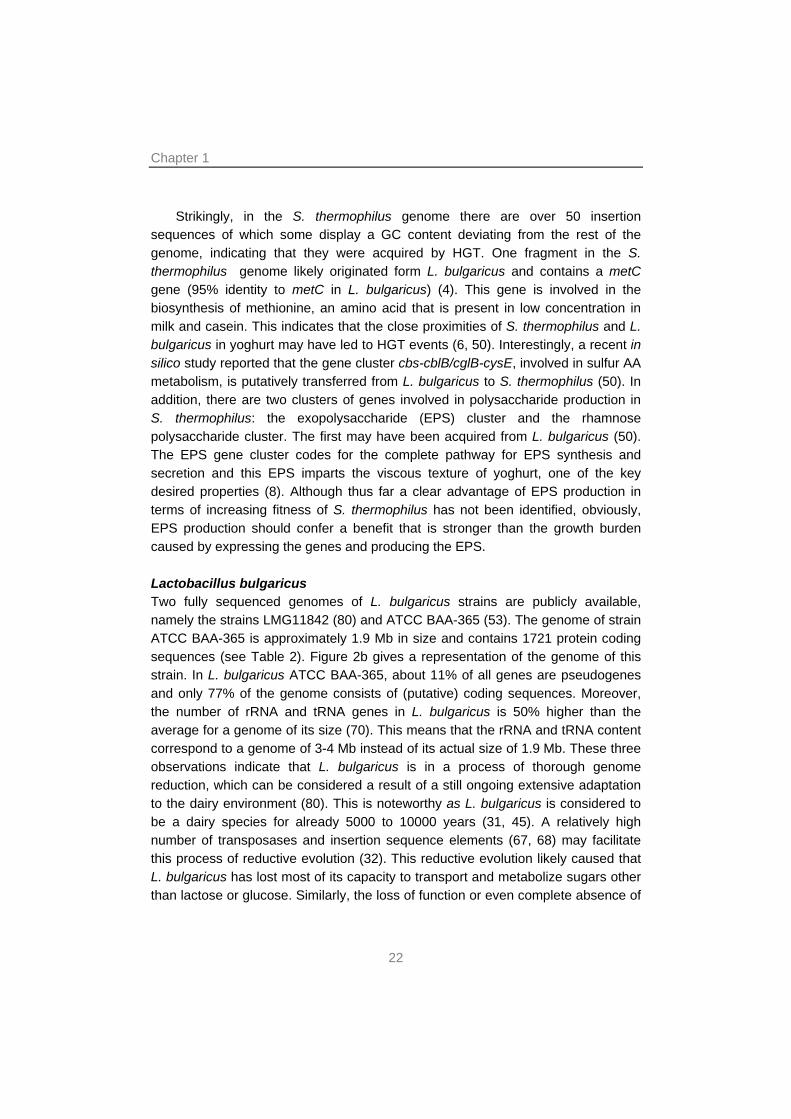
Strikingly, in the S. thermophilus genome there are over 50 insertion sequences of which some display a GC content deviating from the rest of the genome, indicating that they were acquired by HGT. One fragment in the S. thermophilus genome likely originated form L. bulgaricus and contains a metC gene (95% identity to metC in L. bulgaricus) (4). This gene is involved in the biosynthesis of methionine, an amino acid that is present in low concentration in milk and casein. This indicates that the close proximities of S. thermophilus and L. bulgaricus in yoghurt may have led to HGT events (6, 50). Interestingly, a recent in silico study reported that the gene cluster cbs-cblB/cglB-cysE, involved in sulfur AA metabolism, is putatively transferred from L. bulgaricus to S. thermophilus (50). In addition, there are two clusters of genes involved in polysaccharide production in S. thermophilus: the exopolysaccharide (EPS) cluster and the rhamnose polysaccharide cluster. The first may have been acquired from L. bulgaricus (50). The EPS gene cluster codes for the complete pathway for EPS synthesis and secretion and this EPS imparts the viscous texture of yoghurt, one of the key desired properties (8). Although thus far a clear advantage of EPS production in terms of increasing fitness of S. thermophilus has not been identified, obviously, EPS production should confer a benefit that is stronger than the growth burden caused by expressing the genes and producing the EPS. Lactobacillus bulgaricus Two fully sequenced genomes of L. bulgaricus strains are publicly available, namely the strains LMG11842 (80) and ATCC BAA-365 (53). The genome of strain ATCC BAA-365 is approximately 1.9 Mb in size and contains 1721 protein coding sequences (see Table 2). Figure 2b gives a representation of the genome of this strain. In L. bulgaricus ATCC BAA-365, about 11% of all genes are pseudogenes and only 77% of the genome consists of (putative) coding sequences. Moreover, the number of rRNA and tRNA genes in L. bulgaricus is 50% higher than the average for a genome of its size (70). This means that the rRNA and tRNA content correspond to a genome of 3-4 Mb instead of its actual size of 1.9 Mb. These three observations indicate that L. bulgaricus is in a process of thorough genome reduction, which can be considered a result of a still ongoing extensive adaptation to the dairy environment (80). This is noteworthy as L. bulgaricus is considered to be a dairy species for already 5000 to 10000 years (31, 45). A relatively high number of transposases and insertion sequence elements (67, 68) may facilitate this process of reductive evolution (32). This reductive evolution likely caused that L. bulgaricus has lost most of its capacity to transport and metabolize sugars other than lactose or glucose. Similarly, the loss of function or even complete absence of
22
General introduction
pathways involved in AA biosynthesis reflects the steady protein-rich environment L. bulgaricus resides in. The availability of the PrtB exoprotease in a protein-rich milk environment can provide a sufficient supply of most AA.
The L. bulgaricus genome encodes a complete pathway for the production of EPS and this is the cause of the slimy texture of yoghurt.
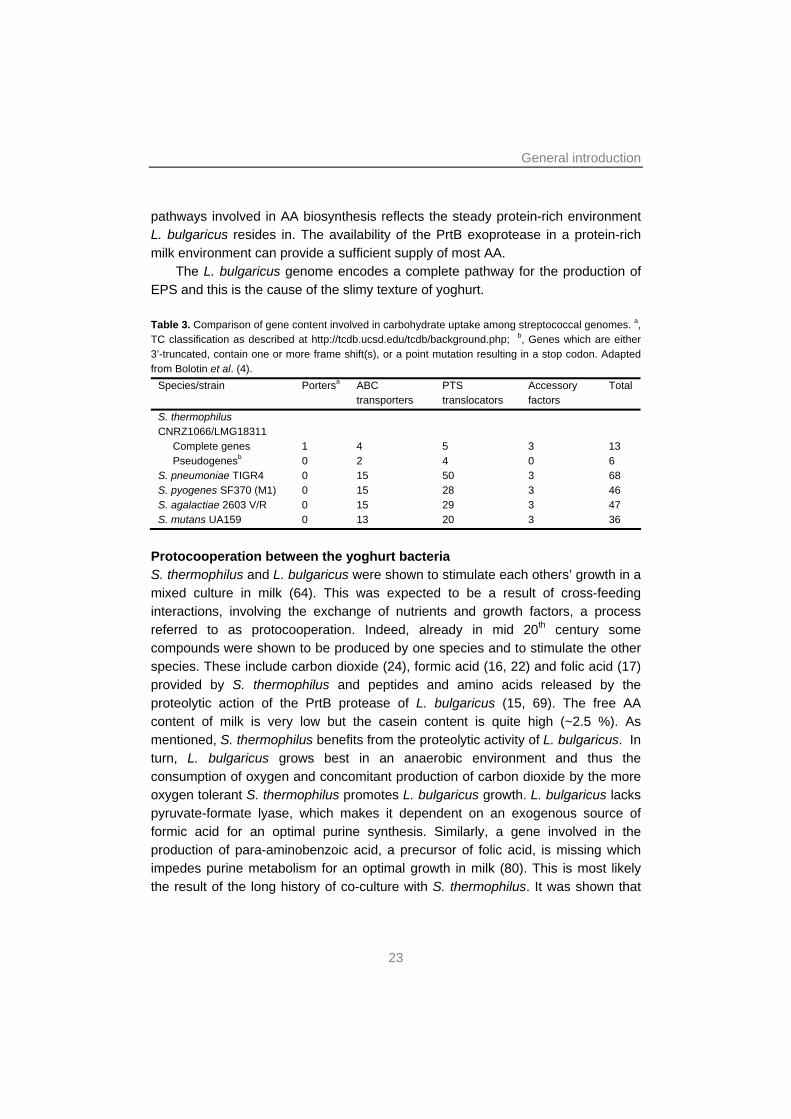
Table 3. Comparison of gene content involved in carbohydrate uptake among streptococcal genomes. a, TC classification as described at http://tcdb.ucsd.edu/tcdb/background.php; b, Genes which are either 3’-truncated, contain one or more frame shift(s), or a point mutation resulting in a stop codon. Adapted from Bolotin et al. (4).
Species/strain Portersa ABC transporters
PTS translocators
Accessory factors
Total
S. thermophilus CNRZ1066/LMG18311
Complete genes 1 4 5 3 13 Pseudogenesb 0 2 4 0 6 S. pneumoniae TIGR4 0 15 50 3 68 S. pyogenes SF370 (M1) 0 15 28 3 46 S. agalactiae 2603 V/R 0 15 29 3 47 S. mutans UA159 0 13 20 3 36
Protocooperation between the yoghurt bacteria S. thermophilus and L. bulgaricus were shown to stimulate each others’ growth in a mixed culture in milk (64). This was expected to be a result of cross-feeding interactions, involving the exchange of nutrients and growth factors, a process referred to as protocooperation. Indeed, already in mid 20th century some compounds were shown to be produced by one species and to stimulate the other species. These include carbon dioxide (24), formic acid (16, 22) and folic acid (17) provided by S. thermophilus and peptides and amino acids released by the proteolytic action of the PrtB protease of L. bulgaricus (15, 69). The free AA content of milk is very low but the casein content is quite high (~2.5 %). As mentioned, S. thermophilus benefits from the proteolytic activity of L. bulgaricus. In turn, L. bulgaricus grows best in an anaerobic environment and thus the consumption of oxygen and concomitant production of carbon dioxide by the more oxygen tolerant S. thermophilus promotes L. bulgaricus growth. L. bulgaricus lacks pyruvate-formate lyase, which makes it dependent on an exogenous source of formic acid for an optimal purine synthesis. Similarly, a gene involved in the production of para-aminobenzoic acid, a precursor of folic acid, is missing which impedes purine metabolism for an optimal growth in milk (80). This is most likely the result of the long history of co-culture with S. thermophilus. It was shown that
23
Chapter 1
folate is secreted by most S. thermophilus strains and consumed by L. bulgaricus (17). Therefore, exchange of folate is hypothesized as another mode of interaction. In addition, the production of EPS could confer advantages by facilitating exchange of these components by strained close proximities (13). A more detailed overview of the interactions between the yoghurt consortium members can be found in Chapter 2. Yet other modes of interaction exist and these are not all discovered or fully understood. With the classical microbiological methods that were available until the eighties of last century, it was quite difficult to deepen our understanding of interactions in the yoghurt consortium to the molecular level. This has changed with the emergence of genomics technologies that enable more holistic approaches to this well-defined ecosystem. TRENDS IN MODERN BIOTECHNOLOGY: SCREENING, ~OMICS, MODELING AND EVOLUTION The last decade the face of biotechnology changed rapidly due to developments that opened new avenues to so far unexplored research lines. One of the most powerful changes is the emergence of whole-genome sequencing and the ~omics technologies, i.e. transcriptomics, proteomics and metabolomics and more recently interactomics (84). The sequencing and annotation of complete genomes have provided insights in cellular regulation, the phylogeny of organisms and the molecular processes that lead to the evolution of species and strain diversity. The field of metagenomics studies the collective genomes of microbial communities, which sheds light on the molecular mechanisms responsible for structuring these communities (66, 84). In that sense, studying the regulation of genes specific for co-culture is essential. Transcription profiling with DNA microarrays is a powerful way of studying genome-wide responses (36). However, the application of microarrays has two major drawbacks in multi-species microbial communities: (i) it is limited to communities of which the genomes of their members is already known and (ii) the lack of variation between genes impedes proper profiling of the expression in closely related species or strains (7). Here, transcriptome profiling using next-generation sequencing (see below) may circumvent these drawbacks (2, 7, 75). Although transcription profiling is very informative for investigating the molecular basis behind responses on changing environmental factors, it does not necessarily reflect the cell’s response at protein and metabolite level as these are also dependent on regulation at the posttranslational level, flux kinetics and thermodynamics. The field of proteomics studies the whole protein content of the
24
General introduction
cell and can be used to determine the differences in protein content upon changing environmental factors and has been applied to S. thermophilus for physiological comparison of growth in a complex substrate (milk) with growth in a chemically defined laboratory medium (22). Metabolomics is defined as the study of all metabolites associated with the cell, i.e. substrates, products and intermediates. In order for any ~omics study to make sense, it should be combined with an overview of the reactions occurring in a cell. Taking together the cells’ metabolites and protein-coding genes, it is possible to make a genome-scale metabolic model. By integrating ~omics data and, for instance, fermentation data, the link between molecules and physiology is made (10, 48). The field of research performing such analyses, constructing and applying these genome-scale models is systems biology. There are several genome-scale metabolic models available of LAB (60, 61, 78), but never before have these been used to describe co-culture growth or to predict molecular interactions between consortium members.
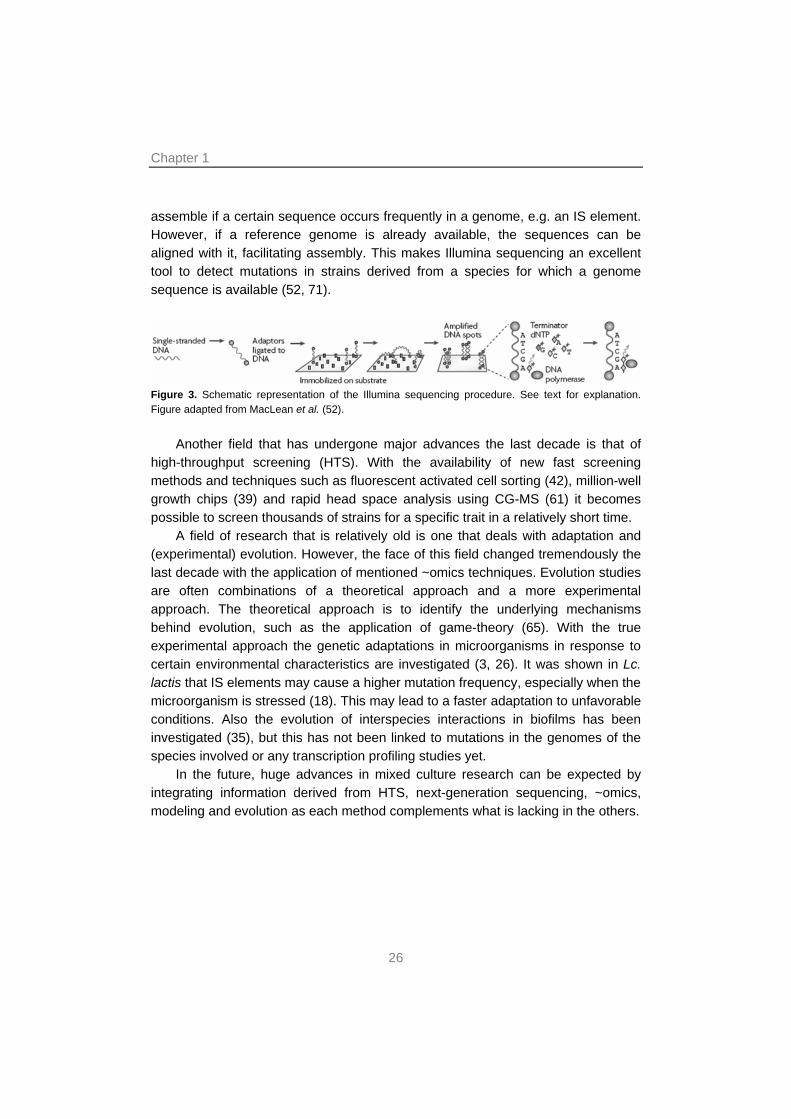
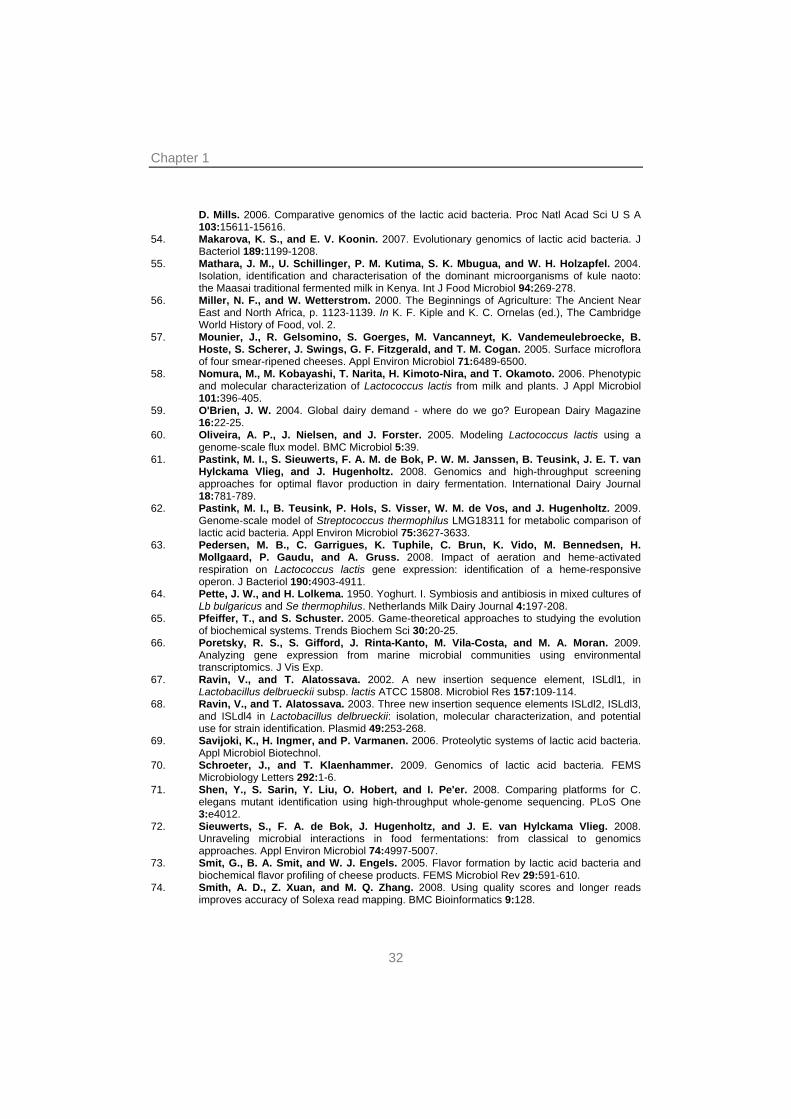
The sequencing of whole genomes has rapidly increased. With only two fully sequenced genomes in 1995, the amount has risen to an estimated amount of approximately 1500 of completed sequences and approximately 5000 incomplete sequences by the end of 2009 (GOLD database, http://genomesonline.org/). Similarly, the sequencing methods have developed from traditional Sanger sequencing to next-generation technologies such as Roche 454 sequencing and Illumina sequencing (52, 75). The latter is used in this thesis and will be discussed here in more detail (see Figure 3). In short, oligonucleotide adaptors are ligated to fragmented DNA and used for immobilizing the fragments to a substrate by binding. Subsequently, fold-back PCR results in isolated spots of amplified DNA. Fluorescently labeled terminator nucleotides and DNA polymerase are then used to create a complementary-strand DNA leading to fluorescent signals. Images are collected during each cycle. Stacking the images displays the sequence of the fragmented DNA. With Illumina sequencing typically reads of 36 bp are produced, although reads up to 100 bp are possible with optimized procedures (52). Moreover, pair-end sequencing can be applied and offers another option to assemble de novo sequences (44).
Because the method uses an amplification step by PCR, there is a bias in the distribution of sequence reads as amplification is never uniform for all sequences. This results in sequences with high and low coverage (52). Therefore, it is important to acquire a high average coverage, i.e. in the order of 102 in order to be able to assemble the short sequences properly. A high coverage (>20) and a high quality score (i.e. a high cut-off for the quality of the reads) are also necessary to reduce read errors (23, 74). Furthermore, the small sequences may prove hard to
25
Chapter 1
assemble if a certain sequence occurs frequently in a genome, e.g. an IS element. However, if a reference genome is already available, the sequences can be aligned with it, facilitating assembly. This makes Illumina sequencing an excellent tool to detect mutations in strains derived from a species for which a genome sequence is available (52, 71).
Figure 3. Schematic representation of the Illumina sequencing procedure. See text for explanation. Figure adapted from MacLean et al. (52).
Another field that has undergone major advances the last decade is that of high-throughput screening (HTS). With the availability of new fast screening methods and techniques such as fluorescent activated cell sorting (42), million-well growth chips (39) and rapid head space analysis using CG-MS (61) it becomes possible to screen thousands of strains for a specific trait in a relatively short time.
A field of research that is relatively old is one that deals with adaptation and (experimental) evolution. However, the face of this field changed tremendously the last decade with the application of mentioned ~omics techniques. Evolution studies are often combinations of a theoretical approach and a more experimental approach. The theoretical approach is to identify the underlying mechanisms behind evolution, such as the application of game-theory (65). With the true experimental approach the genetic adaptations in microorganisms in response to certain environmental characteristics are investigated (3, 26). It was shown in Lc. lactis that IS elements may cause a higher mutation frequency, especially when the microorganism is stressed (18). This may lead to a faster adaptation to unfavorable conditions. Also the evolution of interspecies interactions in biofilms has been investigated (35), but this has not been linked to mutations in the genomes of the species involved or any transcription profiling studies yet.
In the future, huge advances in mixed culture research can be expected by integrating information derived from HTS, next-generation sequencing, ~omics, modeling and evolution as each method complements what is lacking in the others.
26
General introduction
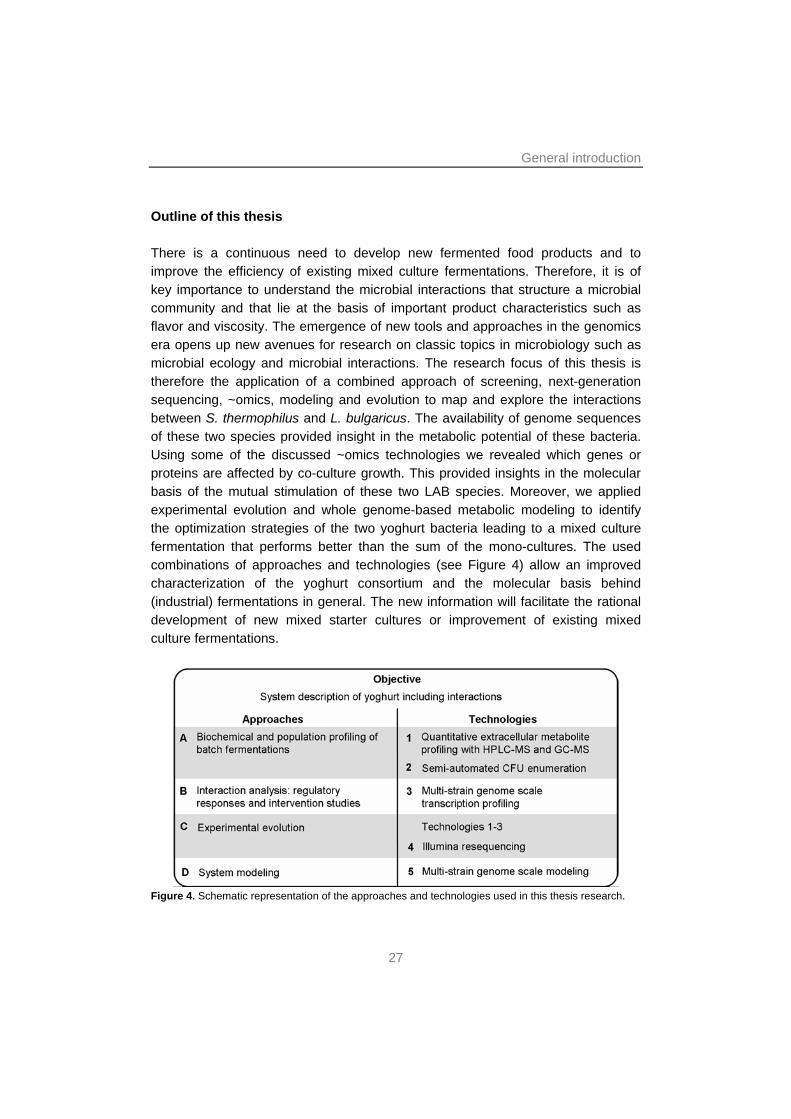
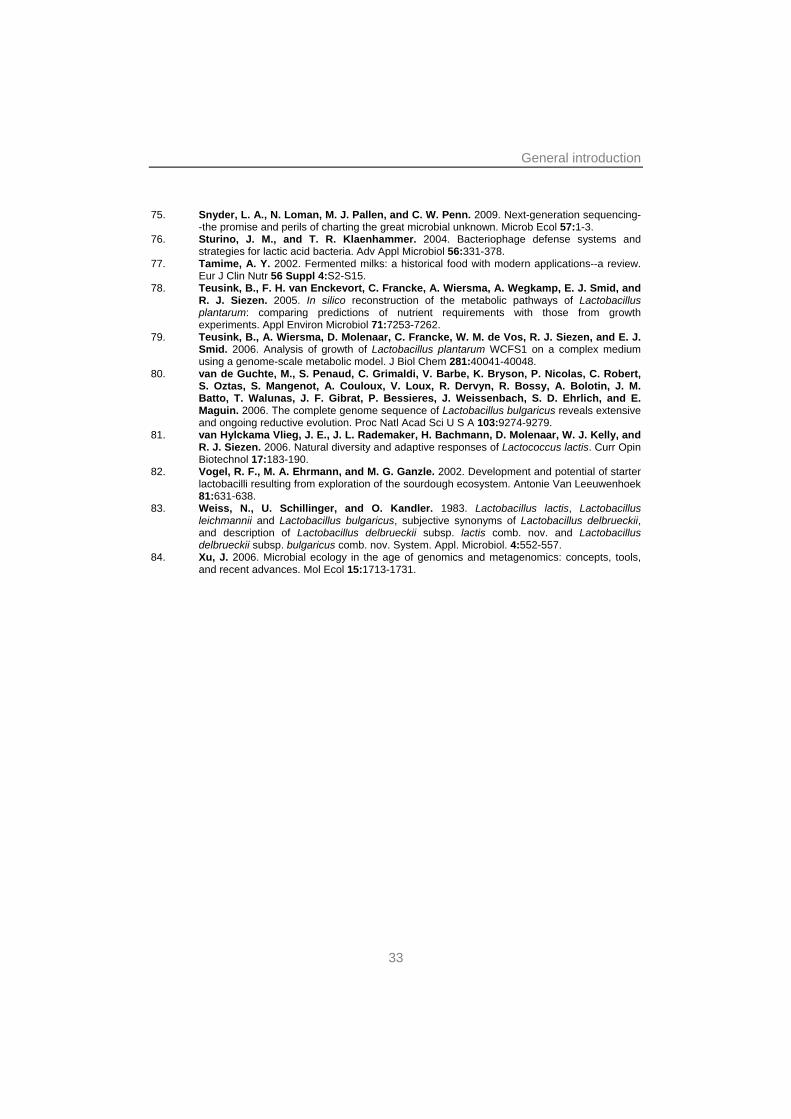
Outline of this thesis There is a continuous need to develop new fermented food products and to improve the efficiency of existing mixed culture fermentations. Therefore, it is of key importance to understand the microbial interactions that structure a microbial community and that lie at the basis of important product characteristics such as flavor and viscosity. The emergence of new tools and approaches in the genomics era opens up new avenues for research on classic topics in microbiology such as microbial ecology and microbial interactions. The research focus of this thesis is therefore the application of a combined approach of screening, next-generation sequencing, ~omics, modeling and evolution to map and explore the interactions between S. thermophilus and L. bulgaricus. The availability of genome sequences of these two species provided insight in the metabolic potential of these bacteria. Using some of the discussed ~omics technologies we revealed which genes or proteins are affected by co-culture growth. This provided insights in the molecular basis of the mutual stimulation of these two LAB species. Moreover, we applied experimental evolution and whole genome-based metabolic modeling to identify the optimization strategies of the two yoghurt bacteria leading to a mixed culture fermentation that performs better than the sum of the mono-cultures. The used combinations of approaches and technologies (see Figure 4) allow an improved characterization of the yoghurt consortium and the molecular basis behind (industrial) fermentations in general. The new information will facilitate the rational development of new mixed starter cultures or improvement of existing mixed culture fermentations.
Figure 4. Schematic representation of the approaches and technologies used in this thesis research.
27
Chapter 1
An overview of the current knowledge on microbial interactions in food fermentations is given in Chapter 2. Here, in more detail, is described what is the relevance of mixed cultures in industry and which considerations regarding the ecology should be made when designing or applying mixed cultures in food fermentations. Clearly, interactions between the consortium members are of key importance for the performance of the fermentation. Different types of interactions and their effects on mixed cultures are listed as well as what is known about the interactions affecting the yoghurt consortium. Finally the new developments in ~omics and genome-scale metabolic modeling and their possible uses in mixed culture research are further elaborated.
Although ~omics tools and genome scale metabolic modeling have become important and common tools the last decade, classical microbiology remains important and high-throughput screening has also undergone great developments in the past years. One of the methods that determine the amount of screening work that can be done in a fixed amount of time is determining viable counts by plating dilutions of cultures. Therefore, a relatively simple faster method for plating and plate counting was developed that can be incorporated in most laboratories without the need for special equipment. This method is described in Chapter 3.
Chapter 4 focuses on the interactions in the yoghurt consortium. Here, transcription profiles of mono and mixed cultures of S. thermophilus and L. bulgaricus in four different growth phases are compared to each other. These data are underpinned by transcription studies of cultures with additional formic acid and of yoghurt biofilms, and by studies of the effects of components suggested or proven to be involved in or influence the protocooperation.
A new topic in mixed culture research is the application of experimental evolution to unravel interactions between consortium members. Chapter 5 explains the adaptation of two unfamiliar strains of S. thermophilus and L. bulgaricus to each other in the course of ~1000 generations under a very strict growth regime. A combination of phenotyping, in silico mutation analysis using Illumina sequencing and mixed culture transcription analysis sheds light on the optimization of interactions and shows that as little as 1000 generations can change a relatively inferior mixed culture (i.e. one with a low acidification rate and a low EPS production) into one that is comparable to a commercial starter.
Genome-scale metabolic models of S. thermophilus and L. bulgaricus are described in Chapter 6. Moreover, predictions in terms of growth and metabolite consumption/production (i.e. the carbon and nitrogen fluxes) from these models are compared to fermentation data. Notably the possibility is addressed to combine the
28
General introduction
models of both bacteria in order to acquire a mixed culture “system” model that can be used for the prediction of molecular interactions.
Finally, in Chapter 7 all the information on the interactions from chapters 2 to 6 is gathered and this (i) gives an improved understanding of known interactions between the yoghurt consortium members, (ii) sheds light on the nature of thus far unknown or only expected modes of interaction in this consortium and (iii) provides general concepts for the events that occur in mixed ecosystems, facilitating the rational improvement of existing or design of new industrial fermentations. ACKNOWLEDGEMENTS We want to thank Michiel Wels for making the genome wheels of S. thermophilus and L. bulgaricus. REFERENCES 1. Allende, A., B. Martinez, V. Selma, M. I. Gil, J. E. Suarez, and A. Rodriguez. 2007. Growth
and bacteriocin production by lactic acid bacteria in vegetable broth and their effectiveness at reducing Listeria monocytogenes in vitro and in fresh-cut lettuce. Food Microbiol 24:759-766.
2. Asmann, Y. W., M. B. Wallace, and E. A. Thompson. 2008. Transcriptome profiling using next-generation sequencing. Gastroenterology 135:1466-1468.
3. Babu, M. M., and L. Aravind. 2006. Adaptive evolution by optimizing expression levels in different environments. Trends Microbiol 14:11-14.
4. Bolotin, A., B. Quinquis, P. Renault, A. Sorokin, S. D. Ehrlich, S. Kulakauskas, A. Lapidus, E. Goltsman, M. Mazur, G. D. Pusch, M. Fonstein, R. Overbeek, N. Kyprides, B. Purnelle, D. Prozzi, K. Ngui, D. Masuy, F. Hancy, S. Burteau, M. Boutry, J. Delcour, A. Goffeau, and P. Hols. 2004. Complete sequence and comparative genome analysis of the dairy bacterium Streptococcus thermophilus. Nat Biotechnol 22:1554-1558.
5. Bolotin, A., B. Quinquis, A. Sorokin, and D. S. Ehrlich. 2004. Recent genetic transfer between Lactococcus lactis and enterobacteria. J Bacteriol 186:6671-6677.
6. Bolotin, A., P. Wincker, S. Mauger, O. Jaillon, K. Malarme, J. Weissenbach, S. D. Ehrlich, and A. Sorokin. 2001. The complete genome sequence of the lactic acid bacterium Lactococcus lactis ssp. lactis IL1403. Genome Res 11:731-753.
7. Booijink, C. C. G. M. 2009. Analysis of diversity and finction of the human intestinal microbiota. Wageningen University, Wageningen.
8. Broadbent, J. R., D. J. McMahon, D. L. Welker, C. J. Oberg, and S. Moineau. 2003. Biochemistry, genetics, and applications of exopolysaccharide production in Streptococcus thermophilus: a review. J Dairy Sci 86:407-423.
9. Brooijmans, R. J. W. 2008. Electron transport chains of lactic acid bacteria. Wageningen UR.
10. Bruggeman, F. J., and H. V. Westerhoff. 2007. The nature of systems biology. Trends Microbiol 15:45-50.
11. Brussow, H., A. Bruttin, F. Desiere, S. Lucchini, and S. Foley. 1998. Molecular ecology and evolution of Streptococcus thermophilus bacteriophages--a review. Virus Genes 16:95-109.
29
Chapter 1
12. Caplice, E., and G. F. Fitzgerald. 1999. Food fermentations: role of microorganisms in food production and preservation. Int J Food Microbiol 50:131-149.
13. Cheirsilp, B., H. Shoji, H. Shimizu, and S. Shioya. 2003. Interactions between Lactobacillus kefiranofaciens and Saccharomyces cerevisiae in mixed culture for kefiran production. J Biosci Bioeng 96:279-284.
14. Codon, S., T. M. Cogan, P. Piveteau, J. O’Callaghan, and B. Lyons. 2001. Stimulation of propionic acid bacteria by lactic acid bacteria in cheese manufacture. Irish Agriculture and Food Development Authority, Cork, Ireland.
15. Courtin, P., V. Monnet, and F. Rul. 2002. Cell-wall proteinases PrtS and PrtB have a different role in Streptococcus thermophilus/Lactobacillus bulgaricus mixed cultures in milk. Microbiology 148:3413-3421.
16. Courtin, P., and F. Rul. 2004. Interactions between microorganisms in a simple ecosystem: yogurt bacteria as a study model. Lait 84:125-134.
17. Crittenden, R. G., N. R. Martinez, and M. J. Playne. 2003. Synthesis and utilisation of folate by yoghurt starter cultures and probiotic bacteria. Int J Food Microbiol 80:217-222.
18. de Visser, J. A., A. D. Akkermans, R. F. Hoekstra, and W. M. de Vos. 2004. Insertion-sequence-mediated mutations isolated during adaptation to growth and starvation in Lactococcus lactis. Genetics 168:1145-1157.
19. de Vos, W. M., and E. E. Vaughan. 1994. Genetics of lactose utilization in lactic acid bacteria. FEMS Microbiol Rev 15:217-237.
20. Dekel, E., and U. Alon. 2005. Optimality and evolutionary tuning of the expression level of a protein. Nature 436:588-592.
21. Delorme, C., J. J. Godon, S. D. Ehrlich, and P. Renault. 1993. Gene inactivation in Lactococcus lactis: histidine biosynthesis. J Bacteriol 175:4391-4399.
22. Derzelle, S., A. Bolotin, M. Y. Mistou, and F. Rul. 2005. Proteome analysis of Streptococcus thermophilus grown in milk reveals pyruvate formate-lyase as the major upregulated protein. Appl Environ Microbiol 71:8597-8605.
23. Dohm, J. C., C. Lottaz, T. Borodina, and H. Himmelbauer. 2008. Substantial biases in ultra-short read data sets from high-throughput DNA sequencing. Nucleic Acids Res 36:e105.
24. Driessen, F. M., F. Kingma, and J. Stadhouders. 1982. Evidence that Lactobacillus bulgaricus in yoghurt is stimulated by carbon dioxide produced by Streptococcus thermophilus. Netherlands Milk and Dairy Journal 36:135-144.
25. Duan, K., C. D. Sibley, C. J. Davidson, and M. G. Surette. 2009. Chemical Interactions between Organisms in Microbial Communities. Contrib Microbiol 16:1-17.
26. Elena, S. F., and R. E. Lenski. 2003. Evolution experiments with microorganisms: the dynamics and genetic bases of adaptation. Nat Rev Genet 4:457-469.
27. FAO/WHO. 2001. Evaluation of health and nutritional properties of probiotics in food including powder milk with live lactic acid bacteria. Report of a Joint FAO/WHO Expert Consultation. Available at: http://www.fao.org/es/ESN/food/foodandfoo_probio_en.stm.
28. Fox, P. F. 1993. Cheese: Chemistry, Physics and Microbiology, p. 1-36. In P. F. Fox (ed.), Cheese: An overview, second ed, vol. 1. Chapman and Hall, London.
29. Gardner, N. J., T. Savard, P. Obermeier, G. Caldwell, and C. P. Champagne. 2001. Selection and characterization of mixed starter cultures for lactic acid fermentation of carrot, cabbage, beet and onion vegetable mixtures. Int J Food Microbiol 64:261-275.
30. Gaudu, P., K. Vido, B. Cesselin, S. Kulakauskas, J. Tremblay, L. Rezaiki, G. Lamberret, S. Sourice, P. Duwat, and A. Gruss. 2002. Respiration capacity and consequences in Lactococcus lactis. Antonie Van Leeuwenhoek 82:263-269.
31. Germond, J.-E., L. Lapierre, M. Delley, B. Mollet, G. E. Felis, and F. Dellaglio. 2003. Evolution of the Bacterial Species Lactobacillus delbrueckii: A Partial Genomic Study with Reflections on Prokaryotic Species Concept. Mol Biol Evol 20:93-104.
32. Germond, J. E., L. Lapierre, M. Delley, and B. Mollet. 1995. A new mobile genetic element in Lactobacillus delbrueckii subsp. bulgaricus. Mol Gen Genet 248:407-416.
33. Giraffa, G. 2004. Studying the dynamics of microbial populations during food fermentation. FEMS Microbiol Rev 28:251-260.
34. Godon, J. J., C. Delorme, J. Bardowski, M. C. Chopin, S. D. Ehrlich, and P. Renault. 1993. Gene inactivation in Lactococcus lactis: branched-chain amino acid biosynthesis. J Bacteriol 175:4383-4390.
30
General introduction
35. Hansen, S. K., P. B. Rainey, J. A. Haagensen, and S. Molin. 2007. Evolution of species interactions in a biofilm community. Nature 445:533-536.
36. Herve-Jimenez, L., I. Guillouard, E. Guedon, S. Boudebbouze, P. Hols, V. Monnet, E. Maguin, and F. Rul. 2008. Post-genomic analysis of Streptococcus thermophilus co-cultivated in milk with Lactobacillus delbrueckii ssp. bulgaricus: involvement of nitrogen, purine and iron metabolisms. Appl Environ Microbiol.
37. Hols, P., F. Hancy, L. Fontaine, B. Grossiord, D. Prozzi, N. Leblond-Bourget, B. Decaris, A. Bolotin, C. Delorme, S. Dusko Ehrlich, E. Guedon, V. Monnet, P. Renault, and M. Kleerebezem. 2005. New insights in the molecular biology and physiology of Streptococcus thermophilus revealed by comparative genomics. FEMS Microbiol Rev 29:435-463.
38. Hugenholtz, J. 1986. Population dynamics of mixed starter cultures. Netherlands Milk and Dairy Journal 40:129-140.
39. Ingham, C. J., A. Sprenkels, J. Bomer, D. Molenaar, A. van den Berg, J. E. van Hylckama Vlieg, and W. M. de Vos. 2007. The micro-Petri dish, a million-well growth chip for the culture and high-throughput screening of microorganisms. Proc Natl Acad Sci U S A 104:18217-18222.
40. Kandler, O. 1983. Carbohydrate metabolism in lactic acid bacteria. Antonie Van Leeuwenhoek 49:209-224.
41. Kerkhoven, R., F. H. van Enckevort, J. Boekhorst, D. Molenaar, and R. J. Siezen. 2004. Visualization for genomics: the Microbial Genome Viewer. Bioinformatics 20:1812-1814.
42. Koehn, F. E. 2008. High impact technologies for natural products screening. Prog Drug Res 65:175, 177-210.
43. Koëter, H. B. W. M., and J. Kleiner. 2005. EFSA scientific colloquium report: Qualified presumption of safety of micro-organisms in food and feed. European Food Safety Authority.
44. Korbel, J. O., A. E. Urban, J. P. Affourtit, B. Godwin, F. Grubert, J. F. Simons, P. M. Kim, D. Palejev, N. J. Carriero, L. Du, B. E. Taillon, Z. Chen, A. Tanzer, A. C. Saunders, J. Chi, F. Yang, N. P. Carter, M. E. Hurles, S. M. Weissman, T. T. Harkins, M. B. Gerstein, M. Egholm, and M. Snyder. 2007. Paired-end mapping reveals extensive structural variation in the human genome. Science 318:420-426.
45. Lapierre, L., B. Mollet, and J. E. Germond. 2002. Regulation and adaptive evolution of lactose operon expression in Lactobacillus delbrueckii. J Bacteriol 184:928-935.
46. Letort, C. 2001. Relation entre croissance et nutrition azotée de deux bactéries lactiques thermophiles : Streptococcus thermophilus et Lactobacillus delbrueckii subsp. bulgaricus. Université de Poitiers, France.
47. Letort, C., M. Nardi, P. Garault, V. Monnet, and V. Juillard. 2002. Casein utilization by Streptococcus thermophilus results in a diauxic growth in milk. Appl Environ Microbiol 68:3162-3165.
48. Lin, J., and J. Qian. 2007. Systems biology approach to integrative comparative genomics. Expert Rev Proteomics 4:107-119.
49. Lindgren, S. E., and W. J. Dobrogosz. 1990. Antagonistic activities of lactic acid bacteria in food and feed fermentations. FEMS Microbiol Rev 7:149-163.
50. Liu, M., R. J. Siezen, and A. Nauta. 2009. In silico prediction of horizontal gene transfer events in Lactobacillus delbrueckii ssp. bulgaricus and Streptococcus thermophilus reveals proto-cooperation in yoghurt manufacturing. Appl Environ Microbiol.
51. Loessner, M., S. Guenther, S. Steffan, and S. Scherer. 2003. A pediocin-producing Lactobacillus plantarum strain inhibits Listeria monocytogenes in a multispecies cheese surface microbial ripening consortium. Appl Environ Microbiol 69:1854-1857.
52. MacLean, D., J. D. Jones, and D. J. Studholme. 2009. Application of 'next-generation' sequencing technologies to microbial genetics. Nat Rev Microbiol 7:287-296.
53. Makarova, K., A. Slesarev, Y. Wolf, A. Sorokin, B. Mirkin, E. Koonin, A. Pavlov, N. Pavlova, V. Karamychev, N. Polouchine, V. Shakhova, I. Grigoriev, Y. Lou, D. Rohksar, S. Lucas, K. Huang, D. M. Goodstein, T. Hawkins, V. Plengvidhya, D. Welker, J. Hughes, Y. Goh, A. Benson, K. Baldwin, J. H. Lee, I. Diaz-Muniz, B. Dosti, V. Smeianov, W. Wechter, R. Barabote, G. Lorca, E. Altermann, R. Barrangou, B. Ganesan, Y. Xie, H. Rawsthorne, D. Tamir, C. Parker, F. Breidt, J. Broadbent, R. Hutkins, D. O'Sullivan, J. Steele, G. Unlu, M. Saier, T. Klaenhammer, P. Richardson, S. Kozyavkin, B. Weimer, and
31
Chapter 1
D. Mills. 2006. Comparative genomics of the lactic acid bacteria. Proc Natl Acad Sci U S A 103:15611-15616.
54. Makarova, K. S., and E. V. Koonin. 2007. Evolutionary genomics of lactic acid bacteria. J Bacteriol 189:1199-1208.
55. Mathara, J. M., U. Schillinger, P. M. Kutima, S. K. Mbugua, and W. H. Holzapfel. 2004. Isolation, identification and characterisation of the dominant microorganisms of kule naoto: the Maasai traditional fermented milk in Kenya. Int J Food Microbiol 94:269-278.
56. Miller, N. F., and W. Wetterstrom. 2000. The Beginnings of Agriculture: The Ancient Near East and North Africa, p. 1123-1139. In K. F. Kiple and K. C. Ornelas (ed.), The Cambridge World History of Food, vol. 2.
57. Mounier, J., R. Gelsomino, S. Goerges, M. Vancanneyt, K. Vandemeulebroecke, B. Hoste, S. Scherer, J. Swings, G. F. Fitzgerald, and T. M. Cogan. 2005. Surface microflora of four smear-ripened cheeses. Appl Environ Microbiol 71:6489-6500.
58. Nomura, M., M. Kobayashi, T. Narita, H. Kimoto-Nira, and T. Okamoto. 2006. Phenotypic and molecular characterization of Lactococcus lactis from milk and plants. J Appl Microbiol 101:396-405.
59. O'Brien, J. W. 2004. Global dairy demand - where do we go? European Dairy Magazine 16:22-25.
60. Oliveira, A. P., J. Nielsen, and J. Forster. 2005. Modeling Lactococcus lactis using a genome-scale flux model. BMC Microbiol 5:39.
61. Pastink, M. I., S. Sieuwerts, F. A. M. de Bok, P. W. M. Janssen, B. Teusink, J. E. T. van Hylckama Vlieg, and J. Hugenholtz. 2008. Genomics and high-throughput screening approaches for optimal flavor production in dairy fermentation. International Dairy Journal 18:781-789.
62. Pastink, M. I., B. Teusink, P. Hols, S. Visser, W. M. de Vos, and J. Hugenholtz. 2009. Genome-scale model of Streptococcus thermophilus LMG18311 for metabolic comparison of lactic acid bacteria. Appl Environ Microbiol 75:3627-3633.
63. Pedersen, M. B., C. Garrigues, K. Tuphile, C. Brun, K. Vido, M. Bennedsen, H. Mollgaard, P. Gaudu, and A. Gruss. 2008. Impact of aeration and heme-activated respiration on Lactococcus lactis gene expression: identification of a heme-responsive operon. J Bacteriol 190:4903-4911.
64. Pette, J. W., and H. Lolkema. 1950. Yoghurt. I. Symbiosis and antibiosis in mixed cultures of Lb bulgaricus and Se thermophilus. Netherlands Milk Dairy Journal 4:197-208.
65. Pfeiffer, T., and S. Schuster. 2005. Game-theoretical approaches to studying the evolution of biochemical systems. Trends Biochem Sci 30:20-25.
66. Poretsky, R. S., S. Gifford, J. Rinta-Kanto, M. Vila-Costa, and M. A. Moran. 2009. Analyzing gene expression from marine microbial communities using environmental transcriptomics. J Vis Exp.
67. Ravin, V., and T. Alatossava. 2002. A new insertion sequence element, ISLdl1, in Lactobacillus delbrueckii subsp. lactis ATCC 15808. Microbiol Res 157:109-114.
68. Ravin, V., and T. Alatossava. 2003. Three new insertion sequence elements ISLdl2, ISLdl3, and ISLdl4 in Lactobacillus delbrueckii: isolation, molecular characterization, and potential use for strain identification. Plasmid 49:253-268.
69. Savijoki, K., H. Ingmer, and P. Varmanen. 2006. Proteolytic systems of lactic acid bacteria. Appl Microbiol Biotechnol.
70. Schroeter, J., and T. Klaenhammer. 2009. Genomics of lactic acid bacteria. FEMS Microbiology Letters 292:1-6.
71. Shen, Y., S. Sarin, Y. Liu, O. Hobert, and I. Pe'er. 2008. Comparing platforms for C. elegans mutant identification using high-throughput whole-genome sequencing. PLoS One 3:e4012.
72. Sieuwerts, S., F. A. de Bok, J. Hugenholtz, and J. E. van Hylckama Vlieg. 2008. Unraveling microbial interactions in food fermentations: from classical to genomics approaches. Appl Environ Microbiol 74:4997-5007.
73. Smit, G., B. A. Smit, and W. J. Engels. 2005. Flavor formation by lactic acid bacteria and biochemical flavor profiling of cheese products. FEMS Microbiol Rev 29:591-610.
74. Smith, A. D., Z. Xuan, and M. Q. Zhang. 2008. Using quality scores and longer reads improves accuracy of Solexa read mapping. BMC Bioinformatics 9:128.
32
General introduction
33
75. Snyder, L. A., N. Loman, M. J. Pallen, and C. W. Penn. 2009. Next-generation sequencing--the promise and perils of charting the great microbial unknown. Microb Ecol 57:1-3.
76. Sturino, J. M., and T. R. Klaenhammer. 2004. Bacteriophage defense systems and strategies for lactic acid bacteria. Adv Appl Microbiol 56:331-378.
77. Tamime, A. Y. 2002. Fermented milks: a historical food with modern applications--a review. Eur J Clin Nutr 56 Suppl 4:S2-S15.
78. Teusink, B., F. H. van Enckevort, C. Francke, A. Wiersma, A. Wegkamp, E. J. Smid, and R. J. Siezen. 2005. In silico reconstruction of the metabolic pathways of Lactobacillus plantarum: comparing predictions of nutrient requirements with those from growth experiments. Appl Environ Microbiol 71:7253-7262.
79. Teusink, B., A. Wiersma, D. Molenaar, C. Francke, W. M. de Vos, R. J. Siezen, and E. J. Smid. 2006. Analysis of growth of Lactobacillus plantarum WCFS1 on a complex medium using a genome-scale metabolic model. J Biol Chem 281:40041-40048.
80. van de Guchte, M., S. Penaud, C. Grimaldi, V. Barbe, K. Bryson, P. Nicolas, C. Robert, S. Oztas, S. Mangenot, A. Couloux, V. Loux, R. Dervyn, R. Bossy, A. Bolotin, J. M. Batto, T. Walunas, J. F. Gibrat, P. Bessieres, J. Weissenbach, S. D. Ehrlich, and E. Maguin. 2006. The complete genome sequence of Lactobacillus bulgaricus reveals extensive and ongoing reductive evolution. Proc Natl Acad Sci U S A 103:9274-9279.
81. van Hylckama Vlieg, J. E., J. L. Rademaker, H. Bachmann, D. Molenaar, W. J. Kelly, and R. J. Siezen. 2006. Natural diversity and adaptive responses of Lactococcus lactis. Curr Opin Biotechnol 17:183-190.
82. Vogel, R. F., M. A. Ehrmann, and M. G. Ganzle. 2002. Development and potential of starter lactobacilli resulting from exploration of the sourdough ecosystem. Antonie Van Leeuwenhoek 81:631-638.
83. Weiss, N., U. Schillinger, and O. Kandler. 1983. Lactobacillus lactis, Lactobacillus leichmannii and Lactobacillus bulgaricus, subjective synonyms of Lactobacillus delbrueckii, and description of Lactobacillus delbrueckii subsp. lactis comb. nov. and Lactobacillus delbrueckii subsp. bulgaricus comb. nov. System. Appl. Microbiol. 4:552-557.
84. Xu, J. 2006. Microbial ecology in the age of genomics and metagenomics: concepts, tools, and recent advances. Mol Ecol 15:1713-1731.

Chapter 2
Unraveling microbial interactions in food fermentations; from classical to genomics approaches
Sander Sieuwerts, Frank A.M. de Bok, Jeroen Hugenholtz and Johan E.T. van
Hylckama Vlieg
This chapter has been published as AEM 2008 Aug;74(16):4997-5007
35
Chapter 2
Fermentation, the microbial degradation of organic compounds without net oxidation, is an important process in the global carbon cycle and is also exploited worldwide for the production and preservation of food. It is one of the oldest food processing technologies known with some records dating back to 6000 BC (50). The link between food and microbiology was laid by Pasteur who found that yeasts were responsible for alcoholic fermentation (106). Since that discovery the scientific and industrial interest in food microbiology started to grow and continues to increase until today. The number of food products that rely on fermentation in one or more steps of their production is tremendous. They form an important constituent of the daily diet and rank among the most innovative product categories in the food industry.
Most of the important microorganisms applied in the production of fermented foods have been studied for decades yielding a wealth of information on their physiology and genetics in relation to product functionalities such as the development of flavor, taste and texture. The recent emergence of genomics has opened new avenues for the systematic analysis of microbial metabolism and the responses of microorganisms to their environment. Additionally, genomics has boosted research on important food microbes (22, 90, 93). Much of this research focuses on the performance of a single strain including its interactions with the food matrix. However, food fermentations are typically carried out by mixed cultures consisting of multiple strains or species. Population dynamics plays a crucial role in the performance of mixed culture fermentations. For many years studies on mixed culture food fermentations have focused on analyzing population dynamics using classical and molecular methods. Many of these studies are mainly descriptive and relatively little is known about the mechanisms governing population dynamics in general and the molecular interactions that occur between the consortium members in particular. The availability of genome sequences for several species that are of industrial importance as well as technological advances in functional genomics enable new approaches to study food microbiology beyond the single species level and allow an integral analysis of interactions and metabolic activity in mixed cultures.
Here we review the current knowledge of important food fermentation processes focusing on the bacterial interactions. In addition, we illustrate how genomics approaches may contribute to the elucidation of the interaction networks between microbes including interactions with the food environment. This information may find application in industry through rational optimization and increased control over mixed culture fermentations.
36
Unraveling microbial interactions using genomics
MIXED CULTURE FOOD FERMENTATIONS – INDUSTRIAL PRACTICE AND CHALLENGES Traditional fermentation processes relied on transfer of knowledge and methodologies associated with manufacturing from generation to generation. The industrialization of food production together with the blossoming of microbiology in the middle of the 19th century led to optimization and upscaling of many fermentation processes. Similarly, industrially produced starter cultures have emerged, leading to improved and reproducible product quality. Nowadays, the total economic value of fermented food products is huge and the worldwide turnover of fermented fresh products in the dairy segment alone represents a total economic value of 54.2 billion US $ annually whereas the cheese market is even larger (see Table 1) (111). In recent years there has been massive product diversification and many prebiotic and probiotic products with a high added-value emerged. Simultaneously, artisanal products have gained popularity due to their particular flavor and aroma characteristics (23). Table 1. Overview of the total turnover in billion US $ worldwide in 2007 of three categories fermented fresh dairy products and cheese as estimated by Euromonitor International (111).
Category Turnover (bln US $)
Yoghurt 34 Fermented dairy drinks 4.3 Fromage frais and quark 7.4 Cheese 74.4
At least two distinct product categories can be distinguished where control of
mixed culture performance directly relates to key challenges of innovators in the food industry. The first relates to the dairy market, which includes important products such as cheese and fermented milks. This market is characterized by rapid growth of product varieties with distinct organoleptic properties. Examples include numerous applications in semihard cheeses where adjunct cultures are added to introduce additional flavor notes (49, 114). Additionally, there is an increasing number of products appearing in response to current health trends, such as low-fat and low-salt product varieties (46). Here, it is important to develop such products while maintaining good organoleptic properties. In low-fat cheese texture may be improved by the application of EPS-producing starter cultures (34). In fermented milks and yoghurts containing probiotic microbes off-flavor problems
37
Chapter 2
may appear due to undesired metabolic activities (99, 152). Furthermore, the success of replacement or addition of the desired probiotic strain in mixed culture fermentation may largely depend on the interaction of this strain with the other strains in the starter culture (64). In general high numbers of viable probiotic bacteria are desired in these products at the moment of consumption. Typically between 5 and 8 logs CFU (Colony Forming Units) per gram of product is considered acceptable (99). Therefore, the growth, survival and activity of the probiotic strain in the product environment is of key importance and these traits are influenced both by specific environmental conditions (35, 152) and by interactions with the starter organisms (72, 99).
A second important product category is formed by food ingredients. Fermentation is widely applied to produce a broad range of ingredients such as amino acids and organic acids. Some of these fermentations are carried out with mixed cultures (54, 155). Challenges in this area include improvement of productivity and stability, and the elimination of unwanted by-products that interfere with down-stream processing. Moreover, such processes may become economically more attractive if cheaper raw substrates can be used with new (combinations of) strains. An example here is improved production of lactic acid from glucose by a mixed culture of Lactobacillus delbrueckii NRRL-B445 and Lactobacillus helveticus NRRL-B1937, of which the first is a good lactate producer and stimulated by the latter (86). Another example deals with a S. cerevisiae strain that was engineered with L-arabinose utilization genes from Lactobacillus plantarum, allowing it to utilize the L-arabinose moiety of lignocellulosic fractions of plant derived biomass (174).
Finally, we are seeing a rapid increase of industrialization of non-western fermented food products in Asia, Latin America and Africa (2, 144). As a result of demographic changes in Europe such products are also of increasing importance in the western market, especially since some are believed to bring specific health benefits (48, 113). Examples include fermented products produced from dairy, cassava, cereals, beans, meat, and fish (7, 167). Challenges here relate to the stability, reproducibility and productivity of fermentations.
38
Unraveling microbial interactions using genomics
MIXED CULTURES VERSUS PURE CULTURES - ECOLOGICAL CONSIDERATIONS With few exceptions food fermentations rely on mixed cultures of microorganisms. There is a number of important considerations that are at the basis of the ecological success of mixed cultures and these will be discussed in this section. Microorganisms evolve to optimize their fitness and this is often achieved by specialization, e.g. optimization of their metabolism. This is exemplified in a number of elegant experimental evolution studies with Escherichia coli in well-defined and homogeneous laboratory systems. In one study in a continuous culture sequentially fed with glucose and acetate this organism differentiated into two ecotypes that displayed a large difference in lag phase when switching to growth on acetate after depletion of glucose (142). Another example with E. coli is that a single strain cultured for a prolonged period at glucose limitation diverged into two or three clonal variants in which one variant ferments the glucose and the fermentation products acetate and glycerol serve as growth substrates for the other strains (65, 132).
Most substrates for food fermentations have a highly heterogeneous physico-chemical composition which offers the possibility for simultaneous occupation of multiple niches by “specialized” strains, for instance through the utilization of different carbon sources. In these substrates coexisting strains often interact through trophic or nutritional relations via multiple mechanisms as will be discussed below.
Many food fermentations rely on spontaneous fermentation by the indigenous microbiota present in the food substrate. This implies that variations in the indigenous biota may affect the composition and activity of the fermenting community. This has a direct effect on product quality and the reproducibility of fermentations. A recent study showed large variations in the flavor and texture profiles of cheddar blocks produced at different factories (24). This is at least partially due to variations in proteolysis in the cheddar blocks. The application of starter cultures reduces the chance of unexpected population shifts and thereby ensures constant product characteristics and quality. Moreover, in combination with sterilization or pasteurization it allows the food to be fermented by species or strains that would be out competed otherwise.
39
Chapter 2
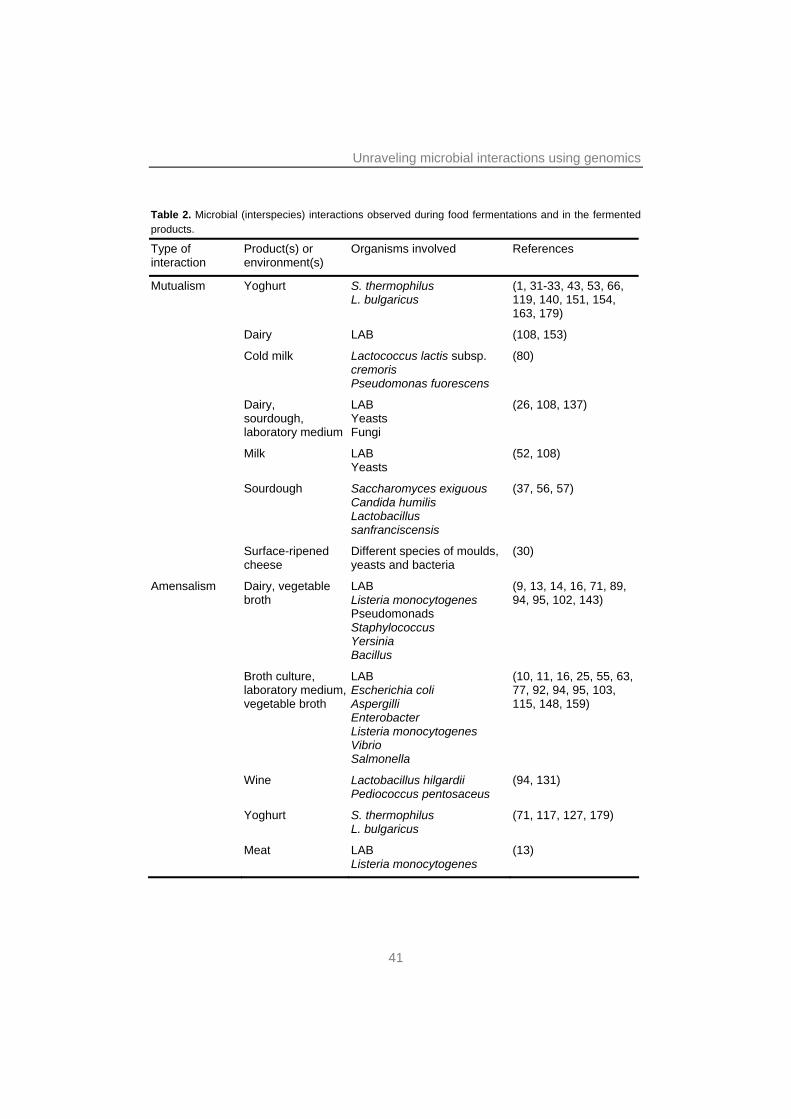
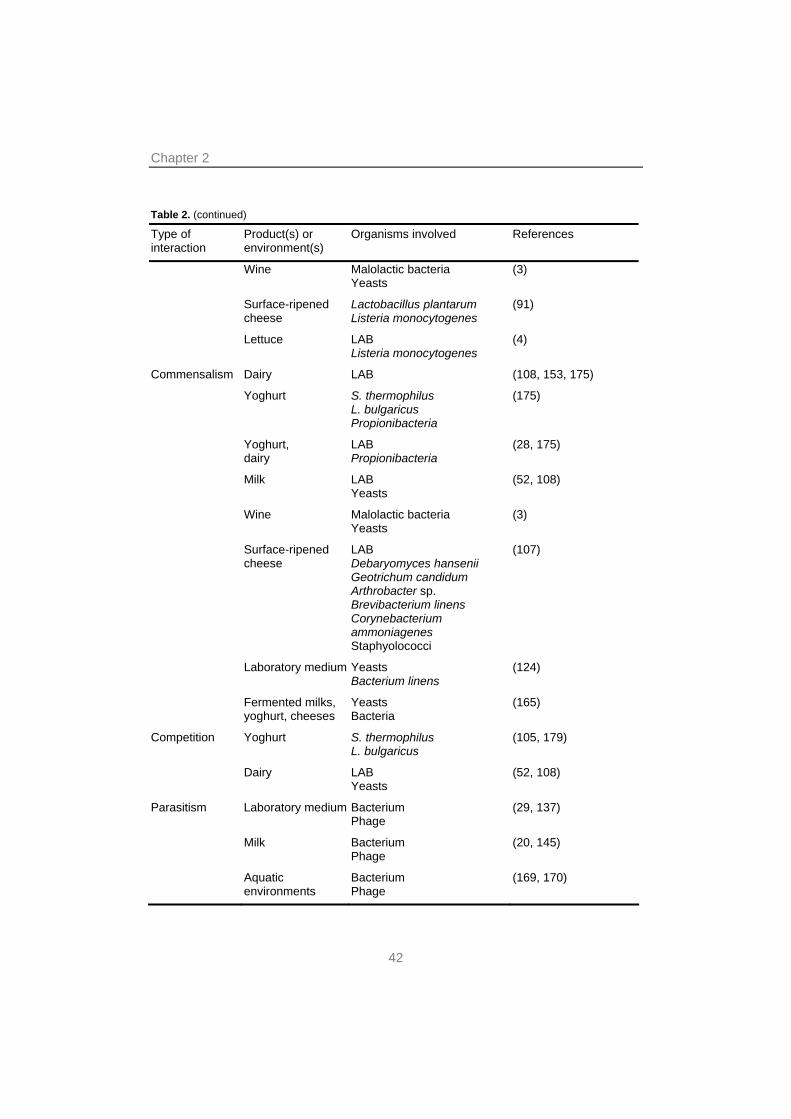
CLASSIFYING INTERACTIONS ON THE BASIS OF MUTUALLY BENEFICIAL AND DETRIMENTAL EFFECTS ON FITNESS Microbial interactions in mixed cultures occur via multiple mechanisms. Such interactions may be direct, as for instance through physical contact or via signaling molecules. Alternatively, indirect interactions may occur where changes in the physico-chemical properties of the environment induced by one strain trigger a response in another strain (21, 51). The effects of such interactions on the fitness of the strains involved may either be positive, neutral or negative. Mutual effects on fitness between interacting strains are an effective means of classifying interactions (68). These can be divided into five main classes – amensalism, competition, commensalism, parasitism and mutualism – all of which will be discussed below and illustrated with relevant examples from food fermentations (see Table 2).
Amensalism is an interspecies interaction in which one organism adversely affects the other organism without being affected itself. It frequently occurs in food fermentations since major end products of primary metabolism such as carboxylic acids and alcohols are effective growth inhibitors of the indigenous microbiota and spoilage organisms (23, 89). In fact, the lactic acid bacterial (LAB) metabolism is optimized for fast acid production rather than efficient growth (158). Another example is the production of antimicrobial compounds, such as bacteriocins, that are produced by many food-fermenting LAB and that play an important role in mixed culture population dynamics. Typically, bacteriocin-producing strains produce a dedicated immunity system that protects the host from detrimental effects. Lantibiotics, a special class of bacteriocins produced by LAB and other Gram-positives, have drawn specific attention. Nisin is a well-known lantibiotic produced by Lactococcus lactis and broadly applied as a food preservative. Its activity is based on the permeabilization of the cytoplasmic membrane leading to its depolarization (47, 70). Other potent bacteriocins include plantaricin and pediocin which are widely distributed among L. plantarum and Pediococci, respectively (41, 172). The broad activity spectrum of bacteriocins has been exploited for the inhibition of outgrowth of spoilage microbes and pathogens (4, 91).
The second class of interactions is competition. Microorganisms compete for energy sources and nutrients during fermentation. Carbon sources are often present in high concentrations in food substrates and competition therefore relates to rapid uptake of nutrients and conversion into biomass. In dairy fermentations, nitrogen is limiting and here organisms initially compete for the free amino acids and small peptides available in milk.
40
Unraveling microbial interactions using genomics
Table 2. Microbial (interspecies) interactions observed during food fermentations and in the fermented products.
Type of interaction
Product(s) or environment(s)
Organisms involved References
Mutualism Yoghurt S. thermophilus L. bulgaricus
(1, 31-33, 43, 53, 66, 119, 140, 151, 154, 163, 179)
Dairy LAB (108, 153)
Cold milk Lactococcus lactis subsp. cremoris Pseudomonas fuorescens
(80)
Dairy, sourdough, laboratory medium
LAB Yeasts Fungi
(26, 108, 137)
Milk LAB Yeasts
(52, 108)
Sourdough Saccharomyces exiguous Candida humilis Lactobacillus sanfranciscensis
(37, 56, 57)
Surface-ripened cheese
Different species of moulds, yeasts and bacteria
(30)
Amensalism Dairy, vegetable broth
LAB Listeria monocytogenes Pseudomonads Staphylococcus Yersinia Bacillus
(9, 13, 14, 16, 71, 89, 94, 95, 102, 143)
Broth culture, laboratory medium, vegetable broth
LAB Escherichia coli Aspergilli Enterobacter Listeria monocytogenes Vibrio Salmonella
(10, 11, 16, 25, 55, 63, 77, 92, 94, 95, 103, 115, 148, 159)
Wine Lactobacillus hilgardii Pediococcus pentosaceus
(94, 131)
Yoghurt S. thermophilus L. bulgaricus
(71, 117, 127, 179)
Meat LAB Listeria monocytogenes
(13)
41
Chapter 2
Table 2. (continued)
Type of interaction
Product(s) or environment(s)
Organisms involved References
Wine Malolactic bacteria Yeasts
(3)
Surface-ripened cheese
Lactobacillus plantarum Listeria monocytogenes
(91)
Lettuce LAB Listeria monocytogenes
(4)
Commensalism Dairy LAB (108, 153, 175)
Yoghurt S. thermophilus L. bulgaricus Propionibacteria
(175)
Yoghurt, dairy
LAB Propionibacteria
(28, 175)
Milk LAB Yeasts
(52, 108)
Wine Malolactic bacteria Yeasts
(3)
Surface-ripened cheese
LAB Debaryomyces hansenii Geotrichum candidum Arthrobacter sp. Brevibacterium linens Corynebacterium ammoniagenes Staphyolococci
(107)
Laboratory medium Yeasts Bacterium linens
(124)
Fermented milks, yoghurt, cheeses
Yeasts Bacteria
(165)
Competition Yoghurt S. thermophilus L. bulgaricus
(105, 179)
Dairy LAB Yeasts
(52, 108)
Parasitism Laboratory medium Bacterium Phage
(29, 137)
Milk Bacterium Phage
(20, 145)
Aquatic environments
Bacterium Phage
(169, 170)
42
Unraveling microbial interactions using genomics
In the later stages of fermentation they compete for the peptides released by the action of proteolytic enzymes. For this, they produce proteases, transport systems and peptidases. Growth rate and population dynamics in mixed dairy fermentations are largely determined by the ability to utilize amino acids efficiently (73, 75). Micronutrients such as iron have also been reported to be limiting for strains in the biota of smear cheeses. Strains compete for iron pools through the use of specialized molecular systems for harvesting iron including siderophores (109).
Commensalism is the third class of interactions. This is a situation in which one organism benefits from the interaction while the other strain is not affected. This also occurs in many food fermentations, for instance through trophic interactions. In Swiss-type cheeses propionic acid bacteria utilize the lactic acid produced by LAB starter bacteria (28). Similarly, in surface-ripened cheeses lactic acid is consumed by yeasts, in particular Debaryomyces hansenii, and by the filamentous fungus Geotrichum candidum (107). This leads to de-acidification of the cheese surface enabling the outgrowth of aerobic bacteria such as Arthrobacter species, Brevibacterium linens, Corynebacterium ammoniagenes, and staphylococci. One could argue that in this case the aerobic bacteria benefit while D. hansenii and G. candidum are unaffected. However, it may be difficult to prove that there is no effect if it can not be measured in terms of growth or survival. Another possible form of commensalism takes place in starters for Gouda cheese where PrtP- Lc. lactis strains benefit from the peptides that are released from milk protein through the action of extracellular proteases (PrtP) produced by PrtP+ strains (69, 74) whilst the PrtP+ strains do not directly seem affected. In milk, PrtP+ strains produce more biomass than their isogenic PrtP- variants lacking plasmids containing the protease gene, but growth is slower due to the cost of expressing this protease (173). In pure cultures of PrtP+ strains grown in milk, PrtP- variants rapidly occur. The outcome of long-term propagation of PrtP+ and PrtP- strains in a protein-containing medium like milk is that the strain that makes the least use of the resources in the medium, namely the PrtP- strain, will become dominant. In this case the immediate gain for the PrtP- strain is traded for the long-term community benefit. This particular example is also known as the “prisoner’s dilemma” in evolutionary game theory (6, 120). The population dynamics of PrtP+ and PrtP- isolates is highly dependent on the growth conditions that influence the costs and benefits of the proteolytic phenotype (69).
The fourth class of interactions is known as parasitism. Parasitism is the interaction in which one species benefits at the expense of another. A well-known example of parasitism in the microbial world is represented by bacteriophages. It is
43
Chapter 2
well established that food fermentations, especially those repeatedly carried out in the same equipment, are highly vulnerable to phages. Phage attack may suddenly inactivate dominant strains in a fermenting culture leading to failure and product losses in industrial fermentations (145). In recent years our understanding of phage biology and the interactions with their hosts has increased significantly. The biology of bacteriophages has been studied extensively for LAB such as Lc. lactis and Streptococcus thermophilus (20, 145). This work has benefited much from genome sequencing efforts as for instance the genomes of at least seven phages specific for S. thermophilus have been sequenced (146). The diversity and fast evolution of phages typically results in the appearance of strains harboring different phage resistance phenotypes (170). Moreover, the recombination machinery of bacteriophages and their ability to transfer DNA from one bacterial cell to another may accelerate evolutionary processes in bacterial communities and contributes to the diversity in mixed culture fermentation processes, especially when back slopping, the sequential transfer of cultures to fresh medium, is applied (169, 170). Recent studies showed a thus far unknown system present in archaea and bacteria, amongst which S. thermophilus, that is involved in phage resistance (12, 40). In this CRISPR system, bacteria acquire resistance to phages by incorporating phage-specific short transcribed nucleotide sequences into regions of clustered regularly interspaced short palindromic repeats. It was shown that these regions evolve very rapidly, probably driven by the rapid evolution of phages (161).
Finally, during mutualism both participating microorganisms derive a benefit from the interaction. Many food fermentations rely on mutualistic interactions. Probably the best example is the yoghurt consortium, consisting of the LAB S. thermophilus and Lactobacillus delbrueckii subsp. bulgaricus, which will be discussed in detail in the next section. The interactions between the yoghurt bacteria are also often referred to as synergism or protocooperation, interactions in which enhanced growth rate is the main mutual benefit. Cultures consisting of yeasts, LAB and filamentous fungi are of key importance in a broad range of fermented foods in which mutualism is an important mode of interaction. For instance in kefir granules S. cerevisiae raises the pH by utilizing the lactic acid produced by Lactobacillus kefiranofaciens as carbon source enabling more growth of L. kefiranofaciens (26). In the sourdough fermentation there is a synergistic interaction between yeasts such as Saccharomyces exiguous or Candida humilis and LAB, especially Lactobacillus sanfranciscensis (56, 57). Yeast amylase releases maltose from starch which is fermented by L. sanfranciscensis. Part of the glucose derived from maltose is excreted by L. sanfranciscensis and is used as a carbon source by maltose-negative yeasts. In return, the yeasts stimulate growth of
44
Unraveling microbial interactions using genomics
L. sanfranciscensis by increasing the availability of amino acids and peptides, either through proteolysis or as a consequence of accelerated autolysis (37, 56). In wine interactions between yeasts and LAB also play a major role and these have been reviewed recently by Alexandre et al. (3) YOGHURT CULTURES – THE MIXED CULTURE PARADIGM IN FOOD FERMENTATION Yoghurt is the product of milk fermented by a defined mixed culture of two thermophilic LAB, Streptococcus thermophilus (15) and Lactobacillus delbrueckii subsp. bulgaricus (93, 163). There are also many fermented milk products that contain only one or neither of these strains, but the name yoghurt is in several countries only allowed for those products that are produced with cultures containing both (82, 151, 179). Nowadays many yoghurts and yoghurt-based drinks are produced that contain probiotic strains, but these do not necessarily contribute to the fermentation. This mixed culture fermentation is of huge economic importance (see Table 1). It represents an attractive model system for research on interactions due to its relatively small complexicity. Some aspects of the yoghurt microbiology have already been reviewed elsewhere (23, 62, 151, 179). Here we present an updated review on comparative analysis with other mixed culture food fermentations.
Although S. thermophilus and L. bulgaricus are also able to ferment the milk individually, both species were found to be stimulated in growth and acid production in mixed cultures compared to single-strain cultures (119). Proteolysis plays an important role in yoghurt as is illustrated by growth of proteolytic S. thermophilus strains in milk (88). After inoculation the cells start growing exponentially using the amino acids, dipeptides, tripeptides and oligopeptides that are freely available. Subsequently, amino acids become limiting and the culture enters a non-exponential growth phase in which the synthesis of extracellular protease is initiated. Finally, in a second exponential phase, the proteolytic system is able to supply sufficient peptides for exponential growth but here the growth rate is lower than in the first exponential phase, probably due to a limited capacity of the peptide uptake system (88).
Most commonly, yoghurt cultures consist of proteolytic L. bulgaricus and non-proteolytic S. thermophilus (32, 119). During the first exponential phase of S. thermophilus, almost no growth of L. bulgaricus is observed. In the second phase, S. thermophilus growth decreases while L. bulgaricus starts to grow exponentially
45
Chapter 2
and protease expression is initiated. The cell-wall anchored protease PrtB mainly catalyzes the hydrolysis of the hydrophobic caseins into small peptides, which are subsequently taken up using various peptide transport systems (76, 118). In the cytoplasm the peptides are further hydrolyzed into free amino acids by several endopeptidases and aminopeptidases (133, 135). Growth of L. bulgaricus continues in the third growth phase. At this stage the peptides released from milk casein also serve as a source of amino acids for S. thermophilus supporting a second exponential growth phase (31, 179).
Most S. thermophilus strains exhibit few amino acid auxotrophies and the fact that they have fewer nutritional requirements than L. bulgaricus may explain their preferential growth in milk. Only histidine is required by most strains and growth may be enhanced when methionine, proline, glutamic acid and valine are added to growth media (67, 87). With few exceptions, S. thermophilus strains do not possess extra-cellular proteases (31, 67). As a result growth of most S. thermophilus strains, except some highly proteolytic strains, is strongly stimulated in co-cultures with L. bulgaricus strains expressing prtB (31, 136).
The mutualistic coexistence of S. thermophilus and L. bulgaricus is also based on other interactions such as the exchange of several growth stimulating factors (see Figure 1). S. thermophilus provides L. bulgaricus with formic acid, pyruvic acid, folic acid (33) and carbon dioxide (43). The positive effects of formic acid and folic acid on growth of L. bulgaricus are related to the biosynthesis of purines (53). Formic acid is a precursor for purine synthesis and L. bulgaricus lacks a pyruvate-formate lyase, which may explain why it relies on other sources for formate (32). Pyruvate-formate lyase is a highly abundant protein in S. thermophilus grown in milk indicating that S. thermophilus may supply L. bulgaricus with formate during co-cultivation (39). Folic acid is involved as a cofactor in purine and amino acid biosynthesis (149, 168) and was shown to be excreted by S. thermophilus and consumed by L. bulgaricus (33). Genome sequence analysis of L. bulgaricus strain ATCC11842 has shown the absence of a biosynthetic pathway for para-aminobenzoic acid and therefore the biosynthetic pathway for folate in this strain is incomplete (163). S. thermophilus is capable of producing both para-aminobenzoic acid and folate and hence L. bulgaricus may benefit from elevated levels of either compound. A recent report on Lc. lactis shows the involvement of folate in the stimulation of a proteinase positive strain by a proteinase negative strain (121). Carbon dioxide is a precursor for the synthesis of aspartate (128, 166), glutamate (100), arginine and nucleotides (17). In heat-treated milk carbon dioxide levels may be too low for L. bulgaricus (43) and therefore it profits from the carbon dioxide released by S. thermophilus from the urea that is present in milk. In addition, the
46
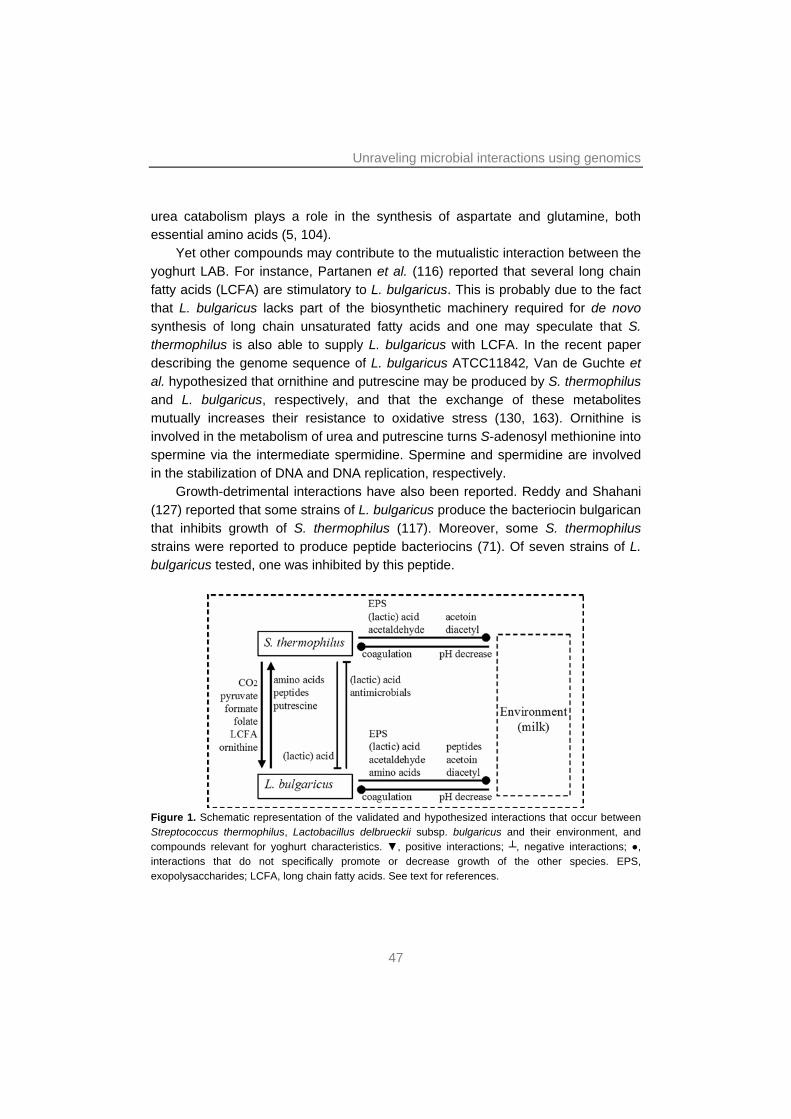
Unraveling microbial interactions using genomics
urea catabolism plays a role in the synthesis of aspartate and glutamine, both essential amino acids (5, 104).
Yet other compounds may contribute to the mutualistic interaction between the yoghurt LAB. For instance, Partanen et al. (116) reported that several long chain fatty acids (LCFA) are stimulatory to L. bulgaricus. This is probably due to the fact that L. bulgaricus lacks part of the biosynthetic machinery required for de novo synthesis of long chain unsaturated fatty acids and one may speculate that S. thermophilus is also able to supply L. bulgaricus with LCFA. In the recent paper describing the genome sequence of L. bulgaricus ATCC11842, Van de Guchte et al. hypothesized that ornithine and putrescine may be produced by S. thermophilus and L. bulgaricus, respectively, and that the exchange of these metabolites mutually increases their resistance to oxidative stress (130, 163). Ornithine is involved in the metabolism of urea and putrescine turns S-adenosyl methionine into spermine via the intermediate spermidine. Spermine and spermidine are involved in the stabilization of DNA and DNA replication, respectively.
Growth-detrimental interactions have also been reported. Reddy and Shahani (127) reported that some strains of L. bulgaricus produce the bacteriocin bulgarican that inhibits growth of S. thermophilus (117). Moreover, some S. thermophilus strains were reported to produce peptide bacteriocins (71). Of seven strains of L. bulgaricus tested, one was inhibited by this peptide.
Figure 1. Schematic representation of the validated and hypothesized interactions that occur between Streptococcus thermophilus, Lactobacillus delbrueckii subsp. bulgaricus and their environment, and compounds relevant for yoghurt characteristics. ▼, positive interactions; ┴, negative interactions; ●, interactions that do not specifically promote or decrease growth of the other species. EPS, exopolysaccharides; LCFA, long chain fatty acids. See text for references.
47
Chapter 2
A key sensory attribute that is introduced with fermentation during yoghurt production is its texture. Due to the acidification by the LAB, proteins coagulate and thereby change the viscosity of the milk. Furthermore, the bacteria, and mainly S. thermophilus, produce exopolysaccharides (EPS) that form a matrix with the milk proteins resulting in the final yoghurt structure. In kefir, kefiran production by LAB is stimulated by the presence of yeasts induced via direct physical contact (26). Similarly, interactions between yoghurt strains may influence EPS production as for instance by increasing the availability of nitrogen sources or through the interaction with non-EPS-producing S. thermophilus strains (38, 177). In general, associations of yeasts and lactic acid bacteria are of key importance for a broad range of fermented foods. However, surprisingly little information is available about molecular interaction mechanisms (165). QUORUM SENSING AND PHYSICAL INTERACTIONS Besides the interactions mentioned so far microorganisms may produce diffusible chemicals for the purpose of communication. This includes a process referred to as quorum sensing (QS) that is widely spread among Gram-negatives and Gram-positives and allows regulation at the population level of a wide range of traits, including competence, virulence, and stress responses (58, 78, 150). Two recent reviews link quorum sensing to motility, EPS production, biofilm formation, and toxin production, which are all important phenotypes in food fermentation (44, 59). As described previously, lantibiotics may play an important role in mixed culture population dynamics and their production is often regulated in a density-dependent way via quorum sensing (125, 129). Nisin production in Lc. lactis has been studied extensively and it has been shown that it acts as an autoinducer. It regulates its own production at the transcriptional level with the involvement of a two-component regulatory system (for a review see (83)). More recently, the involvement of QS in the regulation in EPS production and monospecies biofilms formation by L. plantarum and Lactobacillus rhamnosus was reported (85, 147).
Whereas intraspecies communication is quite common, fewer examples exist of interspecies communication and most examples are not related to food microbiology (78). An example of chemical communication has been observed in dental biofilms where Veillonella atypica and Streptococcus gordonii degrade complex carbohydrates in a way that benefits both species. V. atypica produces a yet to be identified signal molecule that induces amylase production in S. gordonii and thereby increases the degradation rate (45). A QS system that is present in a
48
Unraveling microbial interactions using genomics
major fraction of the bacterial population and allows interspecies signaling is the LuxS system. The LuxS enzyme is responsible for the production of a precursor of autoinducer-2, a signaling molecule involved the regulation of gene expression of for instance virulence factors, competence for genetic transformation, the production of antibiotics and secondary metabolites, and biofilm formation (36, 176). In co-cultures of the hyperthermophiles Thermotoga maritima and Methanococcus jannaschii, growth and EPS production of the former was stimulated by the presence of the latter. Additionally, a QS signaling peptide in T. maritima was upregulated. It was shown that EPS expression was enhanced in presence of this signaling peptide (72). Similar processes may also play an important role in biofilm formation in mixed culture food fermentations.
An example of interspecies communication via QS among lactic acid bacteria is represented by L. plantarum NC8, where not only plantaricin itself but also plantaricin-like peptides produced by other Gram-positive bacteria were shown to induce production of plantaricin by L. plantarum (96, 97).
Microbes may also interact and influence each others metabolism via physical contact and a few examples of such interactions have been described for mixed culture food fermentations. Cheirsilp et al. demonstrated that production of the capsular EPS kefiran was enhanced by physical contact between Lactobacillus kefiranofaciens and S. cerevisiae (26). The molecular basis of this effect remains to be established. It was postulated that the bacteria and yeasts may benefit from the enhanced kefiran production through interactions that occur in the kefir granules where interspecies contact or the exchange of growth factors is facilitated through physical contact. GENOMICS APPROACHES FOR MIXED CULTURE RESEARCH The genomic revolution has opened new avenues for research on mixed cultures. For an increasing number of relevant LAB genome sequences are available (90, 93). In several LAB genomes, amongst which L. plantarum (84), S. thermophilus (15) and Lactobacillus salivarius subsp. salivarius (27), there is evidence for horizontal gene transfer (HGT). Interestingly in many cases the acquired sequences appear to originate from species that frequently co-exists and interact. In the genome of L. bulgaricus ATCC11842 a region with a GC content of 38 % carrying an operon encoding an ABC transporter that could serve as an uptake transporter for putrescine and/or spermidine was found and proposed to be involved in the interactions between S. thermophilus and L. bulgaricus (163). This
49
Chapter 2
GC content is significantly lower than the average value of 49.7% observed for the entire genome. Interestingly, this locus has only been found in a few bacterial genomes whereas it is not even present in the genome of another L. bulgaricus strain, ATCC BAA-365 (93) indicating that it may have been acquired recently via HGT (163).
Only a limited number of studies is available where genomics approaches are used to study the interactions in mixed culture food fermentations. Such studies pose at least two technical challenges that need to be addressed. The first relates to the complexity of most food fermentation substrates. The physicochemical composition and especially the high protein or fat content may interfere with experimental procedures for RNA and protein isolation that work well with laboratory media. A number of studies have appeared that describe successful transcriptome or proteome analyses on samples from fermented substrates and even from highly complex material such as fecal samples (81, 178). Most studies on dairy fermentations use skim milk where the precipitation of casein may be prevented by pretreatment with sodium citrate (126, 139). These studies have revealed several previously undescribed metabolic adaptations upon growth in milk such as the induction of pyruvate-formate lyase in S. thermophilus that may serve as a supply of formate required for the biosynthesis of purine bases or other anabolic processes (39) (see also Figure 1). A recent study deals with transcriptome analysis of Lc. lactis grown in milk in co-culture with S. cerevisiae (98). Although no difference in growth was observed compared to a Lc. lactis mono culture, a number of genes was differentially expressed, in particular genes involved in pyrimidine metabolism. Several other regulatory responses could be assigned to the ethanol produced by the yeast.
The potential of using functional genomics approaches for analyzing interactions is well illustrated by recent studies describing the genome-wide analysis of interactions of commensal or pathogenic microbes with their hosts. With the availability of microarray platforms for several plant species and soil bacteria it is possible to elucidate the response of both the host and the microorganism upon interactions as exemplified by the induction of defense proteins in Arabidopsis thaliana by Agrobacterium tumefaciens (42). Host-microbe interactions in the gastro-intestinal tract are of crucial importance for human health. The overwhelming complexity of this system with respect to composition and activity of the microbiota as well as its heterogeneity and poor accessibility to sampling requires inventive research approaches. The use of germ-free animal models has greatly facilitated the analysis of genome-wide responses of micro-organisms as well as the host upon colonization (18, 134). Other studies report the in vivo time
50
Unraveling microbial interactions using genomics
and spatial resolution of the expression of genes specifically expressed in the GI tract in the model probiotic L. plantarum (19). Recently, Sonnenburg et al. have extended these approaches in a study where they co-colonized germ-free mice with Bacteroides thetaiotaomicron, a prominent component of the adult gut microbiota, and Bifidobacterium longum, a frequently used probiotic microorganism. The results showed that co-colonization prompted B. thetaiotaomicron to increase expression of genes involved in the acquisition and metabolism of polysaccharides (141).
Most studies described above relate to the performance to the interactions of microbes in simplified model systems or defined systems composed of a limited microbial complexity. Recent advances in the field of metagenomics provide a radically new approach for very complex ecosystems as well as for ecosystems dominated by a moderate number of species and strains (162, 164). Random sequencing of environmental samples supplies information on the (amount of) species present in an environment, including uncultured microorganisms, as well as information on known and previously unknown genes that occur in that environment. By comparing habitat-specific fingerprints of genes present in various known environments, it is possible to interpret other environments. Tringe et al. (160) clustered similar environmental samples together and found only few genes specific for a certain environment. Based on relative abundance, it was clear that systems for transport of ions and inorganic compounds, energy production and (interspecies) communication were most discriminative between samples from the Sargasso sea, deep sea whale fall and farm soil. Currently, various groups are sequencing metagenomes of gut and oral microbiota (http://www.genomesonline.org/gold.cgi?want=Metagenomes), which will undoubtly boost research on dynamics and interactions within these complex microbial populations and support the development of prebiotics and probiotics. DESCRIPTIVE AND PREDICTIVE MODELING IN THE GENOMICS ERA Modeling has played an important role in food microbiology and an extensive review describing different modeling categories has been published recently (156). Historically, most of these studies aim at developing predictive models for the growth of desired or undesired microorganisms in the food matrix. As the demand for minimally processed foods increases, the risk of outgrowth of spoilage or pathogenic microbes rises. Accurate empirical models are of great value as they assist in the definition of processing conditions minimizing the risk of growth of
51
Chapter 2
these bacteria such as Bacillus cereus, lactobacilli, or E. coli (95, 101, 122). Similarly, Sodini et al. used black box modeling for predicting the acidification of mixed cultures of S. thermophilus and L. bulgaricus and quantifying the interactions between the two species (140). In another example growth dynamics in a mixed yeast culture of killer and sensitive strains was reported (123). Here, the lethal action of the killer strain showed a lag phase probably due to the necessary accumulation of the toxin before it reached a lethal dose. The existing model was adapted for this effect.
Despite the value of such models in process optimization their predictive value is often limited to specific substrates and conditions and they do not provide additional mechanistic insight as for instance interaction effects. Other modeling strategies aim at predicting the performances of microbes in fermentations on the basis of their metabolic pathways and networks. Such “white box” or mechanistic models have been successfully applied for the optimization of industrial fermentations including food ingredients such as lactic acid and amino acids (8, 138). To our knowledge there are no examples of the integration of interaction effects in such models to the level where they can be used to predict the performance of mixed culture fermentations. However, Gregory et al. developed a computing system that allows the modelling of interactions and evolution in bacterial communities (60, 61). This model includes several aspects such as growth stimulatory interactions, antibiotic sensitivity, occurrence of antibiotic resistant mutants and growth on nutrients derived from killed cells in one model.
With the emergence of genomics a radically different modeling approach has drawn increasing attention (see (156) and references therein). Here, genome-scale metabolic models are constructed that allow a systematic exploration of the metabolic capacities and a number of such models have appeared in recent years for important microbes in mixed culture food fermentations like L. plantarum and Lc. lactis (112, 157). These may serve as references for future metabolic models thereby accelerating the process of model construction (110). A genome-scale metabolic model and associated constraint-based modeling techniques were used to analyze the physiology of growth of L. plantarum in a complex medium revealing the importance of amino acid catabolic pathways previously not associated with free-energy metabolism (158). With respect to mixed culture fermentations it will be interesting to see whether it is possible to connect genome-scale metabolic models of the individual components of mixed cultures through a limited number of interactions. Such “multi genome” scale models should be effective tools for the optimization of mixed culture performance with respect to growth and metabolite production.
52
Unraveling microbial interactions using genomics
CONCLUSIONS AND FUTURE PROSPECTS Mixed culture food fermentations are of primary economic importance. The performance of such cultures, consisting of lactic acid bacteria, yeasts and/or filamentous fungi, is not the simple result of ‘adding up’ the individual single strain functionalities, but is largely determined by interactions at the level of substrates, exchange of metabolites and growth factors or inhibiting compounds.
Technological breakthroughs in the post-genomic era open up new avenues to study microbial communities and interaction networks beyond simple descriptive models. These are now mainly applied for ecological studies on highly complex systems such as the GI-tract or complex environmental ecosystems. On the other hand studies aiming at understanding more fundamental ecological principals underlying the success of evolutionary strategies typically make use of more artificial laboratory strains and ecosystems (79, 120). Food fermentations may provide a valuable alternative model with a high practical relevance. They typically have moderate microbial complexity and offer excellent possibilities for process control. Moreover, the availability of advanced genomics and genetic tools will allow the integration of mechanistic and evolutionary approaches (171). REFERENCES 1. Accolas, J. P., M. Veaux, and J. Auclaur. 1971. Etude des interactions entre diverses
bactéries lactiques thermophiles et mésophiles, en relation avec la fabrication des fromages à pâté cuite. Lait 57:1-23.
2. Aidoo, K. E., M. J. Nout, and P. K. Sarkar. 2006. Occurrence and function of yeasts in Asian indigenous fermented foods. FEMS Yeast Res 6:30-39.
3. Alexandre, H., P. J. Costello, F. Remize, J. Guzzo, and M. Guilloux-Benatier. 2004. Saccharomyces cerevisiae - Oenococcus oeni interactions in wine: current knowledge and perspectives. Int J of Food Microbiol 93:141-154.
4. Allende, A., B. Martinez, V. Selma, M. I. Gil, J. E. Suarez, and A. Rodriguez. 2007. Growth and bacteriocin production by lactic acid bacteria in vegetable broth and their effectiveness at reducing Listeria monocytogenes in vitro and in fresh-cut lettuce. Food Microbiol 24:759-766.
5. Arioli, S., C. Monnet, S. Guglielmetti, C. Parini, I. De Noni, J. Hogenboom, P. M. Halami, and D. Mora. 2007. Aspartate biosynthesis is essential for the growth of Streptococcus thermophilus in milk, and aspartate availability modulates the level of urease activity. Appl Environ Microbiol 73:5789-5796.
6. Axelrod, R., and W. D. Hamilton. 1981. The evolution of cooperation. Science 211:1390-1396.
7. Azokpota, P., D. J. Hounhouigan, and M. C. Nago. 2006. Microbiological and chemical changes during the fermentation of African locust bean (Parkia biglobosa) to produce afitin, iru and sonru, three traditional condiments produced in Benin. Int J Food Microbiol 107:304-309.
8. Bai, D. M., X. M. Zhao, X. G. Li, and S. M. Xu. 2004. Strain improvement and metabolic flux analysis in the wild-type and a mutant Lactobacillus lactis strain for L(+)-lactic acid production. Biotechnol Bioeng 88:681-689.
53
Chapter 2
9. Balasubramanyam, B. V., and M. C. Varadaraj. 1998. Cultural conditions for the production of bacteriocin by a native isolate of Lactobacillus delbruecki ssp. bulgaricus CFR 2028 in milk medium. J Appl Microbiol 84:97-102.
10. Barefoot, S. F., and T. R. Klaenhammer. 1983. Detection and activity of lactacin B, a bacteriocin produced by Lactobacillus acidophilus. Appl Environ Microbiol 45:1808-1815.
11. Barefoot, S. F., and T. R. Klaenhammer. 1984. Purification and characterization of the Lactobacillus acidophilus bacteriocin lactacin B. Antimicrob Agents Chemother 26:328-334.
12. Barrangou, R., C. Fremaux, H. Deveau, M. Richards, P. Boyaval, S. Moineau, D. A. Romero, and P. Horvath. 2007. CRISPR provides acquired resistance against viruses in prokaryotes. Science 315:1709-1712.
13. Benkerroum, N., A. Daoudi, T. Hamraoui, H. Ghalfi, C. Thiry, M. Duroy, P. Evrart, D. Roblain, and P. Thonart. 2005. Lyophilized preparations of bacteriocinogenic Lactobacillus curvatus and Lactococcus lactis subsp. lactis as potential protective adjuncts to control Listeria monocytogenes in dry-fermented sausages. J Appl Microbiol 98:56-63.
14. Benkerroum, N., H. Oubel, and L. B. Mimoun. 2002. Behavior of Listeria monocytogenes and Staphylococcus aureus in yogurt fermented with a bacteriocin-producing thermophilic starter. J Food Prot 65:799-805.
15. Bolotin, A., B. Quinquis, P. Renault, A. Sorokin, S. D. Ehrlich, S. Kulakauskas, A. Lapidus, E. Goltsman, M. Mazur, G. D. Pusch, M. Fonstein, R. Overbeek, N. Kyprides, B. Purnelle, D. Prozzi, K. Ngui, D. Masuy, F. Hancy, S. Burteau, M. Boutry, J. Delcour, A. Goffeau, and P. Hols. 2004. Complete sequence and comparative genome analysis of the dairy bacterium Streptococcus thermophilus. Nat Biotechnol 22:1554-1558.
16. Breidt, F., and H. P. Fleming. 1998. Modeling of the competitive growth of Listeria monocytogenes and Lactococcus lactis in vegetable broth. Appl Environ Microbiol 64:3159-3165.
17. Bringel, F., and J. C. Hubert. 2003. Extent of genetic lesions of the arginine and pyrimidine biosynthetic pathways in Lactobacillus plantarum, L. paraplantarum, L. pentosus, and L. casei: prevalence of CO(2)-dependent auxotrophs and characterization of deficient arg genes in L. plantarum. Appl Environ Microbiol 69:2674-2683.
18. Bron, P. A., C. Grangette, A. Mercenier, W. M. de Vos, and M. Kleerebezem. 2004. Identification of Lactobacillus plantarum genes that are induced in the gastrointestinal tract of mice. J Bacteriol 186:5721-5729.
19. Brosch, R., A. S. Pym, S. V. Gordon, and S. T. Cole. 2001. The evolution of mycobacterial pathogenicity: clues from comparative genomics. Trends Microbiol 9:452-458.
20. Brussow, H. 2001. Phages of dairy bacteria. Annu Rev Microbiol 55:283-303. 21. Bull, A. T., and J. H. Slater. 1982. Microbial Interactions and Communities. Academic Press,
London. 22. Canchaya, C., M. J. Claesson, G. F. Fitzgerald, D. van Sinderen, and W. O'Toole P. 2006.
Diversity of the genus Lactobacillus revealed by comparative genomics of five species. Microbiology 152:3185-3196.
23. Caplice, E., and G. F. Fitzgerald. 1999. Food fermentations: role of microorganisms in food production and preservation. Int J Food Microbiol 50:131-149.
24. Carunchia Whetstine, M. E., P. J. Luck, M. A. Drake, E. A. Foegeding, P. D. Gerard, and D. M. Barbano. 2007. Characterization of flavor and texture development within large (291 kg) blocks of Cheddar cheese. J Dairy Sci 90:3091-3109.
25. Chapuis, C., and J. P. Flandrois. 1994. Mathematical-Model of the Interactions between Micrococcus Spp and Pseudomonas-Aeruginosa on Agar Surface. Journal of Applied Bacteriology 77:727-732.
26. Cheirsilp, B., H. Shoji, H. Shimizu, and S. Shioya. 2003. Interactions between Lactobacillus kefiranofaciens and Saccharomyces cerevisiae in mixed culture for kefiran production. J Biosci Bioeng 96:279-284.
27. Claesson, M. J., Y. Li, S. Leahy, C. Canchaya, J. P. van Pijkeren, A. M. Cerdeno-Tarraga, J. Parkhill, S. Flynn, G. C. O'Sullivan, J. K. Collins, D. Higgins, F. Shanahan, G. F. Fitzgerald, D. van Sinderen, and P. W. O'Toole. 2006. Multireplicon genome architecture of Lactobacillus salivarius. Proc Natl Acad Sci U S A 103:6718-6723.
54
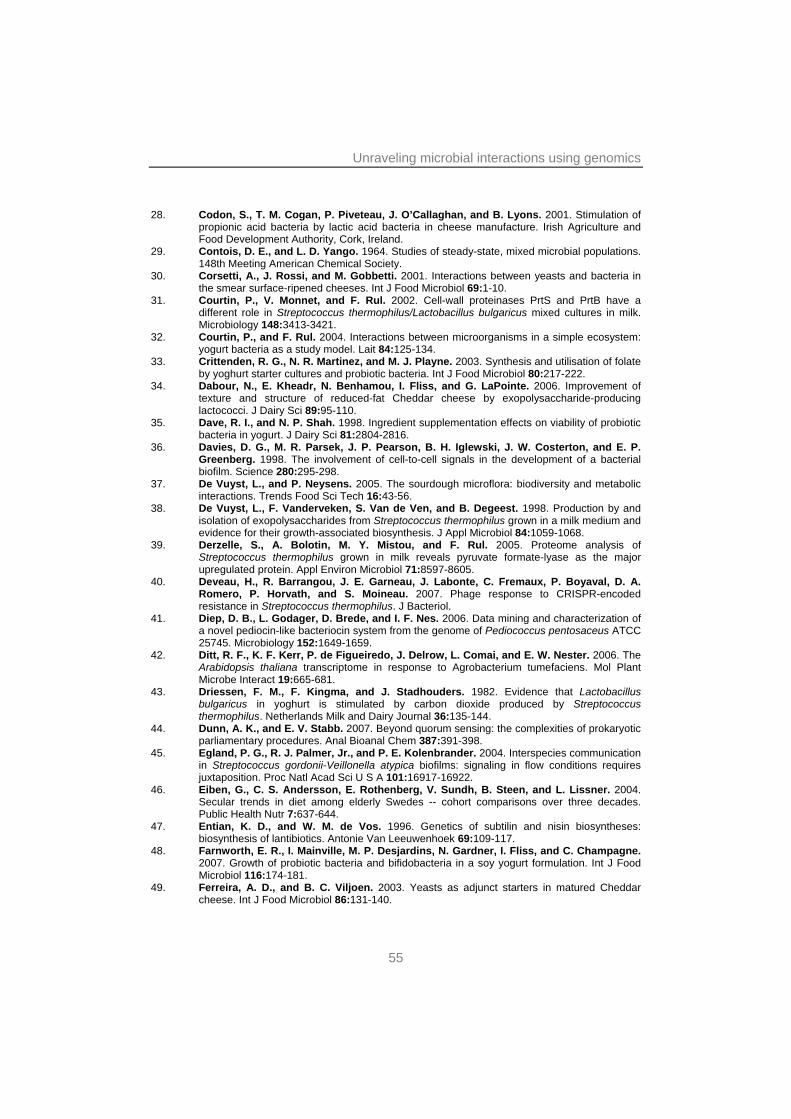
Unraveling microbial interactions using genomics
28. Codon, S., T. M. Cogan, P. Piveteau, J. O’Callaghan, and B. Lyons. 2001. Stimulation of propionic acid bacteria by lactic acid bacteria in cheese manufacture. Irish Agriculture and Food Development Authority, Cork, Ireland.
29. Contois, D. E., and L. D. Yango. 1964. Studies of steady-state, mixed microbial populations. 148th Meeting American Chemical Society.
30. Corsetti, A., J. Rossi, and M. Gobbetti. 2001. Interactions between yeasts and bacteria in the smear surface-ripened cheeses. Int J Food Microbiol 69:1-10.
31. Courtin, P., V. Monnet, and F. Rul. 2002. Cell-wall proteinases PrtS and PrtB have a different role in Streptococcus thermophilus/Lactobacillus bulgaricus mixed cultures in milk. Microbiology 148:3413-3421.
32. Courtin, P., and F. Rul. 2004. Interactions between microorganisms in a simple ecosystem: yogurt bacteria as a study model. Lait 84:125-134.
33. Crittenden, R. G., N. R. Martinez, and M. J. Playne. 2003. Synthesis and utilisation of folate by yoghurt starter cultures and probiotic bacteria. Int J Food Microbiol 80:217-222.
34. Dabour, N., E. Kheadr, N. Benhamou, I. Fliss, and G. LaPointe. 2006. Improvement of texture and structure of reduced-fat Cheddar cheese by exopolysaccharide-producing lactococci. J Dairy Sci 89:95-110.
35. Dave, R. I., and N. P. Shah. 1998. Ingredient supplementation effects on viability of probiotic bacteria in yogurt. J Dairy Sci 81:2804-2816.
36. Davies, D. G., M. R. Parsek, J. P. Pearson, B. H. Iglewski, J. W. Costerton, and E. P. Greenberg. 1998. The involvement of cell-to-cell signals in the development of a bacterial biofilm. Science 280:295-298.
37. De Vuyst, L., and P. Neysens. 2005. The sourdough microflora: biodiversity and metabolic interactions. Trends Food Sci Tech 16:43-56.
38. De Vuyst, L., F. Vanderveken, S. Van de Ven, and B. Degeest. 1998. Production by and isolation of exopolysaccharides from Streptococcus thermophilus grown in a milk medium and evidence for their growth-associated biosynthesis. J Appl Microbiol 84:1059-1068.
39. Derzelle, S., A. Bolotin, M. Y. Mistou, and F. Rul. 2005. Proteome analysis of Streptococcus thermophilus grown in milk reveals pyruvate formate-lyase as the major upregulated protein. Appl Environ Microbiol 71:8597-8605.
40. Deveau, H., R. Barrangou, J. E. Garneau, J. Labonte, C. Fremaux, P. Boyaval, D. A. Romero, P. Horvath, and S. Moineau. 2007. Phage response to CRISPR-encoded resistance in Streptococcus thermophilus. J Bacteriol.
41. Diep, D. B., L. Godager, D. Brede, and I. F. Nes. 2006. Data mining and characterization of a novel pediocin-like bacteriocin system from the genome of Pediococcus pentosaceus ATCC 25745. Microbiology 152:1649-1659.
42. Ditt, R. F., K. F. Kerr, P. de Figueiredo, J. Delrow, L. Comai, and E. W. Nester. 2006. The Arabidopsis thaliana transcriptome in response to Agrobacterium tumefaciens. Mol Plant Microbe Interact 19:665-681.
43. Driessen, F. M., F. Kingma, and J. Stadhouders. 1982. Evidence that Lactobacillus bulgaricus in yoghurt is stimulated by carbon dioxide produced by Streptococcus thermophilus. Netherlands Milk and Dairy Journal 36:135-144.
44. Dunn, A. K., and E. V. Stabb. 2007. Beyond quorum sensing: the complexities of prokaryotic parliamentary procedures. Anal Bioanal Chem 387:391-398.
45. Egland, P. G., R. J. Palmer, Jr., and P. E. Kolenbrander. 2004. Interspecies communication in Streptococcus gordonii-Veillonella atypica biofilms: signaling in flow conditions requires juxtaposition. Proc Natl Acad Sci U S A 101:16917-16922.
46. Eiben, G., C. S. Andersson, E. Rothenberg, V. Sundh, B. Steen, and L. Lissner. 2004. Secular trends in diet among elderly Swedes -- cohort comparisons over three decades. Public Health Nutr 7:637-644.
47. Entian, K. D., and W. M. de Vos. 1996. Genetics of subtilin and nisin biosyntheses: biosynthesis of lantibiotics. Antonie Van Leeuwenhoek 69:109-117.
48. Farnworth, E. R., I. Mainville, M. P. Desjardins, N. Gardner, I. Fliss, and C. Champagne. 2007. Growth of probiotic bacteria and bifidobacteria in a soy yogurt formulation. Int J Food Microbiol 116:174-181.
49. Ferreira, A. D., and B. C. Viljoen. 2003. Yeasts as adjunct starters in matured Cheddar cheese. Int J Food Microbiol 86:131-140.
55
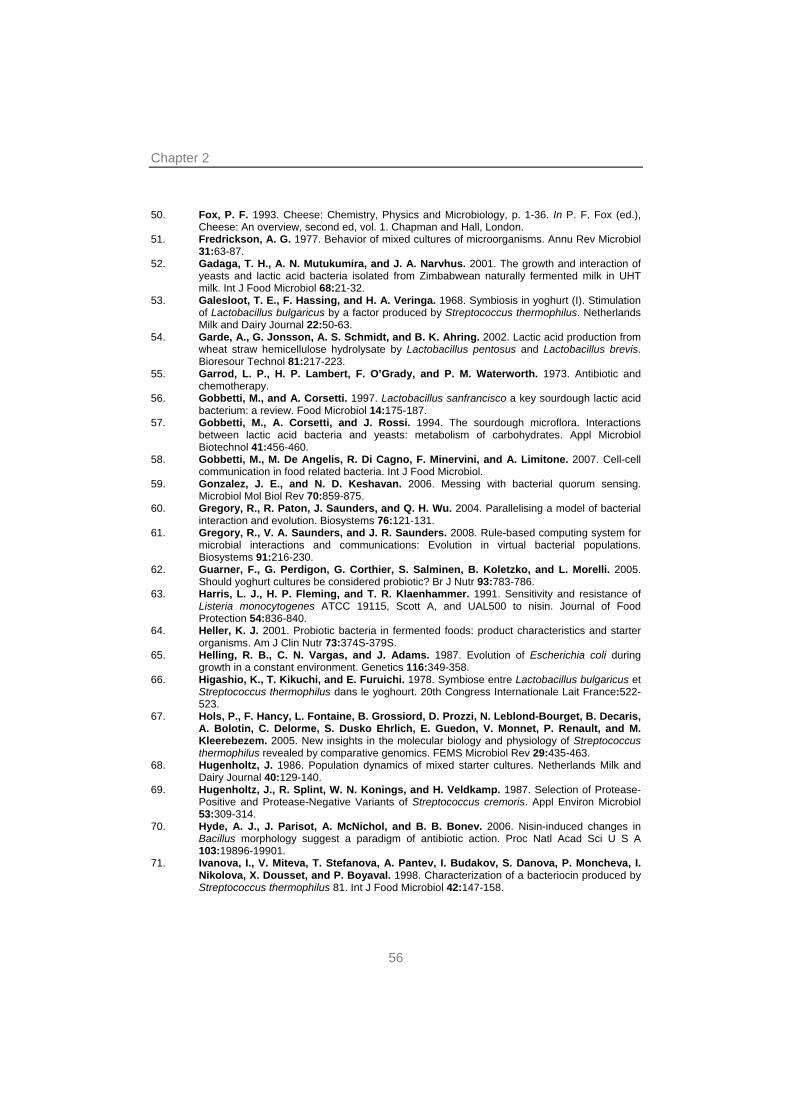
Chapter 2
50. Fox, P. F. 1993. Cheese: Chemistry, Physics and Microbiology, p. 1-36. In P. F. Fox (ed.), Cheese: An overview, second ed, vol. 1. Chapman and Hall, London.
51. Fredrickson, A. G. 1977. Behavior of mixed cultures of microorganisms. Annu Rev Microbiol 31:63-87.
52. Gadaga, T. H., A. N. Mutukumira, and J. A. Narvhus. 2001. The growth and interaction of yeasts and lactic acid bacteria isolated from Zimbabwean naturally fermented milk in UHT milk. Int J Food Microbiol 68:21-32.
53. Galesloot, T. E., F. Hassing, and H. A. Veringa. 1968. Symbiosis in yoghurt (I). Stimulation of Lactobacillus bulgaricus by a factor produced by Streptococcus thermophilus. Netherlands Milk and Dairy Journal 22:50-63.
54. Garde, A., G. Jonsson, A. S. Schmidt, and B. K. Ahring. 2002. Lactic acid production from wheat straw hemicellulose hydrolysate by Lactobacillus pentosus and Lactobacillus brevis. Bioresour Technol 81:217-223.
55. Garrod, L. P., H. P. Lambert, F. O’Grady, and P. M. Waterworth. 1973. Antibiotic and chemotherapy.
56. Gobbetti, M., and A. Corsetti. 1997. Lactobacillus sanfrancisco a key sourdough lactic acid bacterium: a review. Food Microbiol 14:175-187.
57. Gobbetti, M., A. Corsetti, and J. Rossi. 1994. The sourdough microflora. Interactions between lactic acid bacteria and yeasts: metabolism of carbohydrates. Appl Microbiol Biotechnol 41:456-460.
58. Gobbetti, M., M. De Angelis, R. Di Cagno, F. Minervini, and A. Limitone. 2007. Cell-cell communication in food related bacteria. Int J Food Microbiol.
59. Gonzalez, J. E., and N. D. Keshavan. 2006. Messing with bacterial quorum sensing. Microbiol Mol Biol Rev 70:859-875.
60. Gregory, R., R. Paton, J. Saunders, and Q. H. Wu. 2004. Parallelising a model of bacterial interaction and evolution. Biosystems 76:121-131.
61. Gregory, R., V. A. Saunders, and J. R. Saunders. 2008. Rule-based computing system for microbial interactions and communications: Evolution in virtual bacterial populations. Biosystems 91:216-230.
62. Guarner, F., G. Perdigon, G. Corthier, S. Salminen, B. Koletzko, and L. Morelli. 2005. Should yoghurt cultures be considered probiotic? Br J Nutr 93:783-786.
63. Harris, L. J., H. P. Fleming, and T. R. Klaenhammer. 1991. Sensitivity and resistance of Listeria monocytogenes ATCC 19115, Scott A, and UAL500 to nisin. Journal of Food Protection 54:836-840.
64. Heller, K. J. 2001. Probiotic bacteria in fermented foods: product characteristics and starter organisms. Am J Clin Nutr 73:374S-379S.
65. Helling, R. B., C. N. Vargas, and J. Adams. 1987. Evolution of Escherichia coli during growth in a constant environment. Genetics 116:349-358.
66. Higashio, K., T. Kikuchi, and E. Furuichi. 1978. Symbiose entre Lactobacillus bulgaricus et Streptococcus thermophilus dans le yoghourt. 20th Congress Internationale Lait France:522-523.
67. Hols, P., F. Hancy, L. Fontaine, B. Grossiord, D. Prozzi, N. Leblond-Bourget, B. Decaris, A. Bolotin, C. Delorme, S. Dusko Ehrlich, E. Guedon, V. Monnet, P. Renault, and M. Kleerebezem. 2005. New insights in the molecular biology and physiology of Streptococcus thermophilus revealed by comparative genomics. FEMS Microbiol Rev 29:435-463.
68. Hugenholtz, J. 1986. Population dynamics of mixed starter cultures. Netherlands Milk and Dairy Journal 40:129-140.
69. Hugenholtz, J., R. Splint, W. N. Konings, and H. Veldkamp. 1987. Selection of Protease-Positive and Protease-Negative Variants of Streptococcus cremoris. Appl Environ Microbiol 53:309-314.
70. Hyde, A. J., J. Parisot, A. McNichol, and B. B. Bonev. 2006. Nisin-induced changes in Bacillus morphology suggest a paradigm of antibiotic action. Proc Natl Acad Sci U S A 103:19896-19901.
71. Ivanova, I., V. Miteva, T. Stefanova, A. Pantev, I. Budakov, S. Danova, P. Moncheva, I. Nikolova, X. Dousset, and P. Boyaval. 1998. Characterization of a bacteriocin produced by Streptococcus thermophilus 81. Int J Food Microbiol 42:147-158.
56
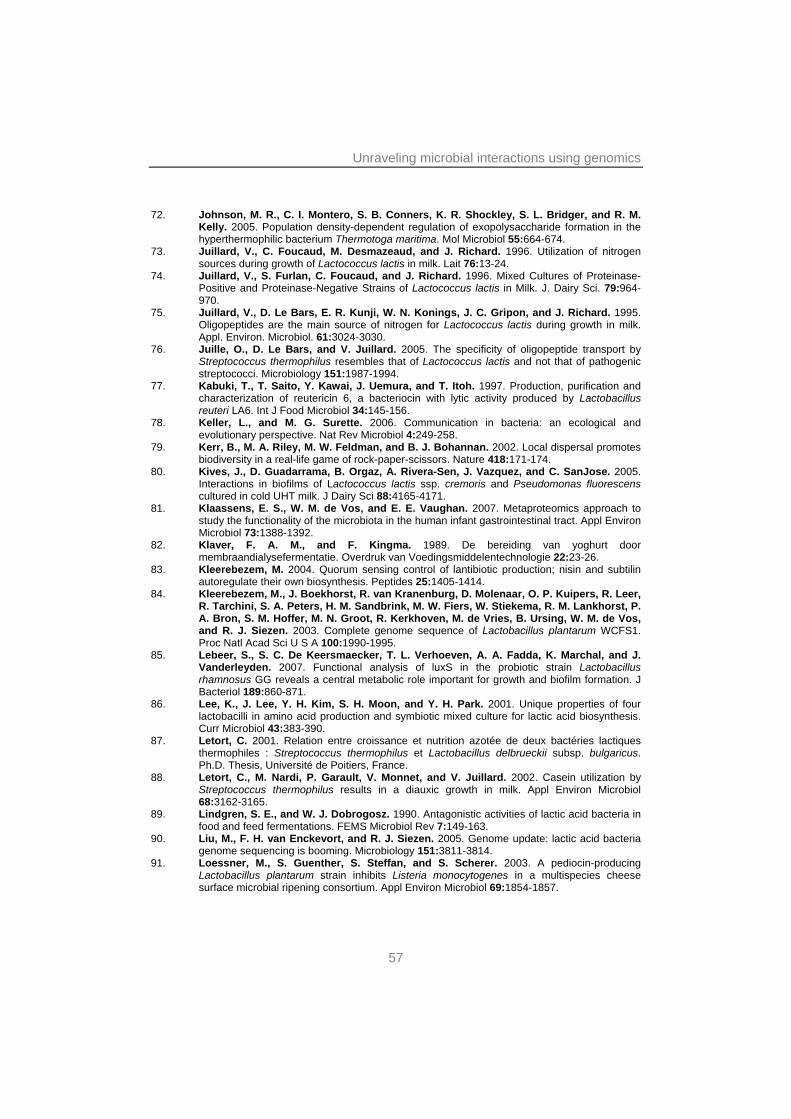
Unraveling microbial interactions using genomics
72. Johnson, M. R., C. I. Montero, S. B. Conners, K. R. Shockley, S. L. Bridger, and R. M. Kelly. 2005. Population density-dependent regulation of exopolysaccharide formation in the hyperthermophilic bacterium Thermotoga maritima. Mol Microbiol 55:664-674.
73. Juillard, V., C. Foucaud, M. Desmazeaud, and J. Richard. 1996. Utilization of nitrogen sources during growth of Lactococcus lactis in milk. Lait 76:13-24.
74. Juillard, V., S. Furlan, C. Foucaud, and J. Richard. 1996. Mixed Cultures of Proteinase-Positive and Proteinase-Negative Strains of Lactococcus lactis in Milk. J. Dairy Sci. 79:964-970.
75. Juillard, V., D. Le Bars, E. R. Kunji, W. N. Konings, J. C. Gripon, and J. Richard. 1995. Oligopeptides are the main source of nitrogen for Lactococcus lactis during growth in milk. Appl. Environ. Microbiol. 61:3024-3030.
76. Juille, O., D. Le Bars, and V. Juillard. 2005. The specificity of oligopeptide transport by Streptococcus thermophilus resembles that of Lactococcus lactis and not that of pathogenic streptococci. Microbiology 151:1987-1994.
77. Kabuki, T., T. Saito, Y. Kawai, J. Uemura, and T. Itoh. 1997. Production, purification and characterization of reutericin 6, a bacteriocin with lytic activity produced by Lactobacillus reuteri LA6. Int J Food Microbiol 34:145-156.
78. Keller, L., and M. G. Surette. 2006. Communication in bacteria: an ecological and evolutionary perspective. Nat Rev Microbiol 4:249-258.
79. Kerr, B., M. A. Riley, M. W. Feldman, and B. J. Bohannan. 2002. Local dispersal promotes biodiversity in a real-life game of rock-paper-scissors. Nature 418:171-174.
80. Kives, J., D. Guadarrama, B. Orgaz, A. Rivera-Sen, J. Vazquez, and C. SanJose. 2005. Interactions in biofilms of Lactococcus lactis ssp. cremoris and Pseudomonas fluorescens cultured in cold UHT milk. J Dairy Sci 88:4165-4171.
81. Klaassens, E. S., W. M. de Vos, and E. E. Vaughan. 2007. Metaproteomics approach to study the functionality of the microbiota in the human infant gastrointestinal tract. Appl Environ Microbiol 73:1388-1392.
82. Klaver, F. A. M., and F. Kingma. 1989. De bereiding van yoghurt door membraandialysefermentatie. Overdruk van Voedingsmiddelentechnologie 22:23-26.
83. Kleerebezem, M. 2004. Quorum sensing control of lantibiotic production; nisin and subtilin autoregulate their own biosynthesis. Peptides 25:1405-1414.
84. Kleerebezem, M., J. Boekhorst, R. van Kranenburg, D. Molenaar, O. P. Kuipers, R. Leer, R. Tarchini, S. A. Peters, H. M. Sandbrink, M. W. Fiers, W. Stiekema, R. M. Lankhorst, P. A. Bron, S. M. Hoffer, M. N. Groot, R. Kerkhoven, M. de Vries, B. Ursing, W. M. de Vos, and R. J. Siezen. 2003. Complete genome sequence of Lactobacillus plantarum WCFS1. Proc Natl Acad Sci U S A 100:1990-1995.
85. Lebeer, S., S. C. De Keersmaecker, T. L. Verhoeven, A. A. Fadda, K. Marchal, and J. Vanderleyden. 2007. Functional analysis of luxS in the probiotic strain Lactobacillus rhamnosus GG reveals a central metabolic role important for growth and biofilm formation. J Bacteriol 189:860-871.
86. Lee, K., J. Lee, Y. H. Kim, S. H. Moon, and Y. H. Park. 2001. Unique properties of four lactobacilli in amino acid production and symbiotic mixed culture for lactic acid biosynthesis. Curr Microbiol 43:383-390.
87. Letort, C. 2001. Relation entre croissance et nutrition azotée de deux bactéries lactiques thermophiles : Streptococcus thermophilus et Lactobacillus delbrueckii subsp. bulgaricus. Ph.D. Thesis, Université de Poitiers, France.
88. Letort, C., M. Nardi, P. Garault, V. Monnet, and V. Juillard. 2002. Casein utilization by Streptococcus thermophilus results in a diauxic growth in milk. Appl Environ Microbiol 68:3162-3165.
89. Lindgren, S. E., and W. J. Dobrogosz. 1990. Antagonistic activities of lactic acid bacteria in food and feed fermentations. FEMS Microbiol Rev 7:149-163.
90. Liu, M., F. H. van Enckevort, and R. J. Siezen. 2005. Genome update: lactic acid bacteria genome sequencing is booming. Microbiology 151:3811-3814.
91. Loessner, M., S. Guenther, S. Steffan, and S. Scherer. 2003. A pediocin-producing Lactobacillus plantarum strain inhibits Listeria monocytogenes in a multispecies cheese surface microbial ripening consortium. Appl Environ Microbiol 69:1854-1857.
57
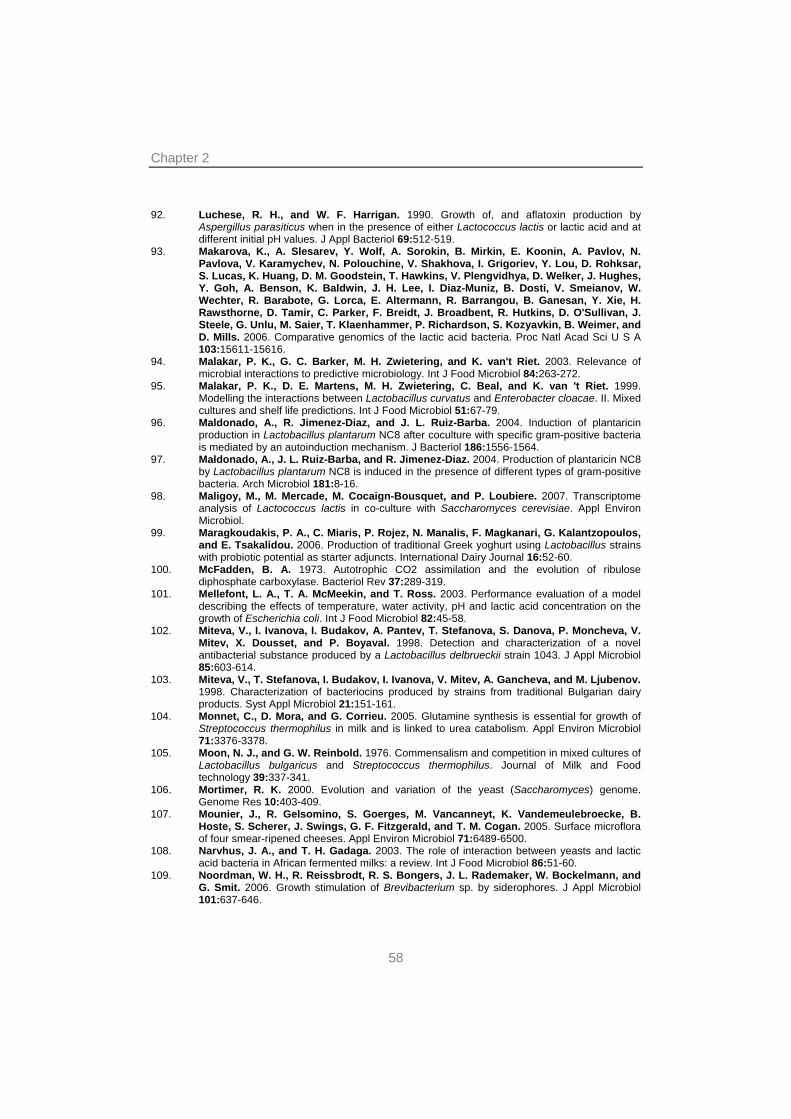
Chapter 2
92. Luchese, R. H., and W. F. Harrigan. 1990. Growth of, and aflatoxin production by Aspergillus parasiticus when in the presence of either Lactococcus lactis or lactic acid and at different initial pH values. J Appl Bacteriol 69:512-519.
93. Makarova, K., A. Slesarev, Y. Wolf, A. Sorokin, B. Mirkin, E. Koonin, A. Pavlov, N. Pavlova, V. Karamychev, N. Polouchine, V. Shakhova, I. Grigoriev, Y. Lou, D. Rohksar, S. Lucas, K. Huang, D. M. Goodstein, T. Hawkins, V. Plengvidhya, D. Welker, J. Hughes, Y. Goh, A. Benson, K. Baldwin, J. H. Lee, I. Diaz-Muniz, B. Dosti, V. Smeianov, W. Wechter, R. Barabote, G. Lorca, E. Altermann, R. Barrangou, B. Ganesan, Y. Xie, H. Rawsthorne, D. Tamir, C. Parker, F. Breidt, J. Broadbent, R. Hutkins, D. O'Sullivan, J. Steele, G. Unlu, M. Saier, T. Klaenhammer, P. Richardson, S. Kozyavkin, B. Weimer, and D. Mills. 2006. Comparative genomics of the lactic acid bacteria. Proc Natl Acad Sci U S A 103:15611-15616.
94. Malakar, P. K., G. C. Barker, M. H. Zwietering, and K. van't Riet. 2003. Relevance of microbial interactions to predictive microbiology. Int J Food Microbiol 84:263-272.
95. Malakar, P. K., D. E. Martens, M. H. Zwietering, C. Beal, and K. van 't Riet. 1999. Modelling the interactions between Lactobacillus curvatus and Enterobacter cloacae. II. Mixed cultures and shelf life predictions. Int J Food Microbiol 51:67-79.
96. Maldonado, A., R. Jimenez-Diaz, and J. L. Ruiz-Barba. 2004. Induction of plantaricin production in Lactobacillus plantarum NC8 after coculture with specific gram-positive bacteria is mediated by an autoinduction mechanism. J Bacteriol 186:1556-1564.
97. Maldonado, A., J. L. Ruiz-Barba, and R. Jimenez-Diaz. 2004. Production of plantaricin NC8 by Lactobacillus plantarum NC8 is induced in the presence of different types of gram-positive bacteria. Arch Microbiol 181:8-16.
98. Maligoy, M., M. Mercade, M. Cocaign-Bousquet, and P. Loubiere. 2007. Transcriptome analysis of Lactococcus lactis in co-culture with Saccharomyces cerevisiae. Appl Environ Microbiol.
99. Maragkoudakis, P. A., C. Miaris, P. Rojez, N. Manalis, F. Magkanari, G. Kalantzopoulos, and E. Tsakalidou. 2006. Production of traditional Greek yoghurt using Lactobacillus strains with probiotic potential as starter adjuncts. International Dairy Journal 16:52-60.
100. McFadden, B. A. 1973. Autotrophic CO2 assimilation and the evolution of ribulose diphosphate carboxylase. Bacteriol Rev 37:289-319.
101. Mellefont, L. A., T. A. McMeekin, and T. Ross. 2003. Performance evaluation of a model describing the effects of temperature, water activity, pH and lactic acid concentration on the growth of Escherichia coli. Int J Food Microbiol 82:45-58.
102. Miteva, V., I. Ivanova, I. Budakov, A. Pantev, T. Stefanova, S. Danova, P. Moncheva, V. Mitev, X. Dousset, and P. Boyaval. 1998. Detection and characterization of a novel antibacterial substance produced by a Lactobacillus delbrueckii strain 1043. J Appl Microbiol 85:603-614.
103. Miteva, V., T. Stefanova, I. Budakov, I. Ivanova, V. Mitev, A. Gancheva, and M. Ljubenov. 1998. Characterization of bacteriocins produced by strains from traditional Bulgarian dairy products. Syst Appl Microbiol 21:151-161.
104. Monnet, C., D. Mora, and G. Corrieu. 2005. Glutamine synthesis is essential for growth of Streptococcus thermophilus in milk and is linked to urea catabolism. Appl Environ Microbiol 71:3376-3378.
105. Moon, N. J., and G. W. Reinbold. 1976. Commensalism and competition in mixed cultures of Lactobacillus bulgaricus and Streptococcus thermophilus. Journal of Milk and Food technology 39:337-341.
106. Mortimer, R. K. 2000. Evolution and variation of the yeast (Saccharomyces) genome. Genome Res 10:403-409.
107. Mounier, J., R. Gelsomino, S. Goerges, M. Vancanneyt, K. Vandemeulebroecke, B. Hoste, S. Scherer, J. Swings, G. F. Fitzgerald, and T. M. Cogan. 2005. Surface microflora of four smear-ripened cheeses. Appl Environ Microbiol 71:6489-6500.
108. Narvhus, J. A., and T. H. Gadaga. 2003. The role of interaction between yeasts and lactic acid bacteria in African fermented milks: a review. Int J Food Microbiol 86:51-60.
109. Noordman, W. H., R. Reissbrodt, R. S. Bongers, J. L. Rademaker, W. Bockelmann, and G. Smit. 2006. Growth stimulation of Brevibacterium sp. by siderophores. J Appl Microbiol 101:637-646.
58
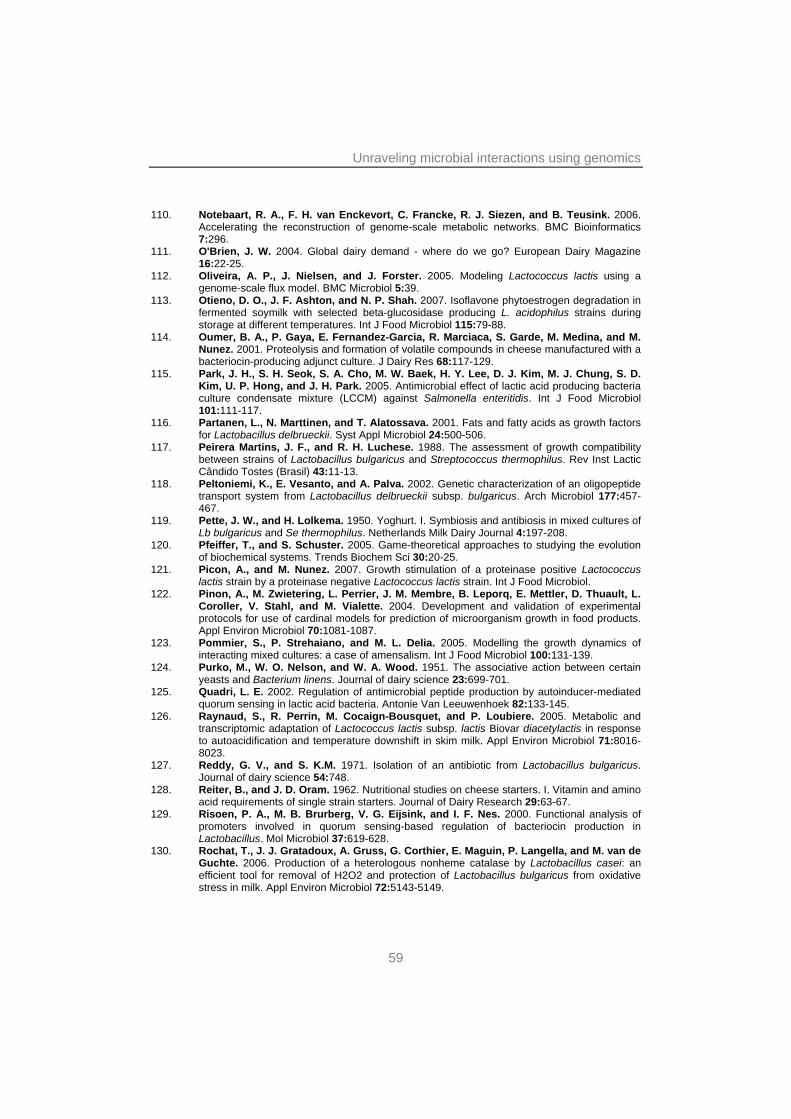
Unraveling microbial interactions using genomics
110. Notebaart, R. A., F. H. van Enckevort, C. Francke, R. J. Siezen, and B. Teusink. 2006. Accelerating the reconstruction of genome-scale metabolic networks. BMC Bioinformatics 7:296.
111. O'Brien, J. W. 2004. Global dairy demand - where do we go? European Dairy Magazine 16:22-25.
112. Oliveira, A. P., J. Nielsen, and J. Forster. 2005. Modeling Lactococcus lactis using a genome-scale flux model. BMC Microbiol 5:39.
113. Otieno, D. O., J. F. Ashton, and N. P. Shah. 2007. Isoflavone phytoestrogen degradation in fermented soymilk with selected beta-glucosidase producing L. acidophilus strains during storage at different temperatures. Int J Food Microbiol 115:79-88.
114. Oumer, B. A., P. Gaya, E. Fernandez-Garcia, R. Marciaca, S. Garde, M. Medina, and M. Nunez. 2001. Proteolysis and formation of volatile compounds in cheese manufactured with a bacteriocin-producing adjunct culture. J Dairy Res 68:117-129.
115. Park, J. H., S. H. Seok, S. A. Cho, M. W. Baek, H. Y. Lee, D. J. Kim, M. J. Chung, S. D. Kim, U. P. Hong, and J. H. Park. 2005. Antimicrobial effect of lactic acid producing bacteria culture condensate mixture (LCCM) against Salmonella enteritidis. Int J Food Microbiol 101:111-117.
116. Partanen, L., N. Marttinen, and T. Alatossava. 2001. Fats and fatty acids as growth factors for Lactobacillus delbrueckii. Syst Appl Microbiol 24:500-506.
117. Peirera Martins, J. F., and R. H. Luchese. 1988. The assessment of growth compatibility between strains of Lactobacillus bulgaricus and Streptococcus thermophilus. Rev Inst Lactic Cândido Tostes (Brasil) 43:11-13.
118. Peltoniemi, K., E. Vesanto, and A. Palva. 2002. Genetic characterization of an oligopeptide transport system from Lactobacillus delbrueckii subsp. bulgaricus. Arch Microbiol 177:457-467.
119. Pette, J. W., and H. Lolkema. 1950. Yoghurt. I. Symbiosis and antibiosis in mixed cultures of Lb bulgaricus and Se thermophilus. Netherlands Milk Dairy Journal 4:197-208.
120. Pfeiffer, T., and S. Schuster. 2005. Game-theoretical approaches to studying the evolution of biochemical systems. Trends Biochem Sci 30:20-25.
121. Picon, A., and M. Nunez. 2007. Growth stimulation of a proteinase positive Lactococcus lactis strain by a proteinase negative Lactococcus lactis strain. Int J Food Microbiol.
122. Pinon, A., M. Zwietering, L. Perrier, J. M. Membre, B. Leporq, E. Mettler, D. Thuault, L. Coroller, V. Stahl, and M. Vialette. 2004. Development and validation of experimental protocols for use of cardinal models for prediction of microorganism growth in food products. Appl Environ Microbiol 70:1081-1087.
123. Pommier, S., P. Strehaiano, and M. L. Delia. 2005. Modelling the growth dynamics of interacting mixed cultures: a case of amensalism. Int J Food Microbiol 100:131-139.
124. Purko, M., W. O. Nelson, and W. A. Wood. 1951. The associative action between certain yeasts and Bacterium linens. Journal of dairy science 23:699-701.
125. Quadri, L. E. 2002. Regulation of antimicrobial peptide production by autoinducer-mediated quorum sensing in lactic acid bacteria. Antonie Van Leeuwenhoek 82:133-145.
126. Raynaud, S., R. Perrin, M. Cocaign-Bousquet, and P. Loubiere. 2005. Metabolic and transcriptomic adaptation of Lactococcus lactis subsp. lactis Biovar diacetylactis in response to autoacidification and temperature downshift in skim milk. Appl Environ Microbiol 71:8016-8023.
127. Reddy, G. V., and S. K.M. 1971. Isolation of an antibiotic from Lactobacillus bulgaricus. Journal of dairy science 54:748.
128. Reiter, B., and J. D. Oram. 1962. Nutritional studies on cheese starters. I. Vitamin and amino acid requirements of single strain starters. Journal of Dairy Research 29:63-67.
129. Risoen, P. A., M. B. Brurberg, V. G. Eijsink, and I. F. Nes. 2000. Functional analysis of promoters involved in quorum sensing-based regulation of bacteriocin production in Lactobacillus. Mol Microbiol 37:619-628.
130. Rochat, T., J. J. Gratadoux, A. Gruss, G. Corthier, E. Maguin, P. Langella, and M. van de Guchte. 2006. Production of a heterologous nonheme catalase by Lactobacillus casei: an efficient tool for removal of H2O2 and protection of Lactobacillus bulgaricus from oxidative stress in milk. Appl Environ Microbiol 72:5143-5149.
59
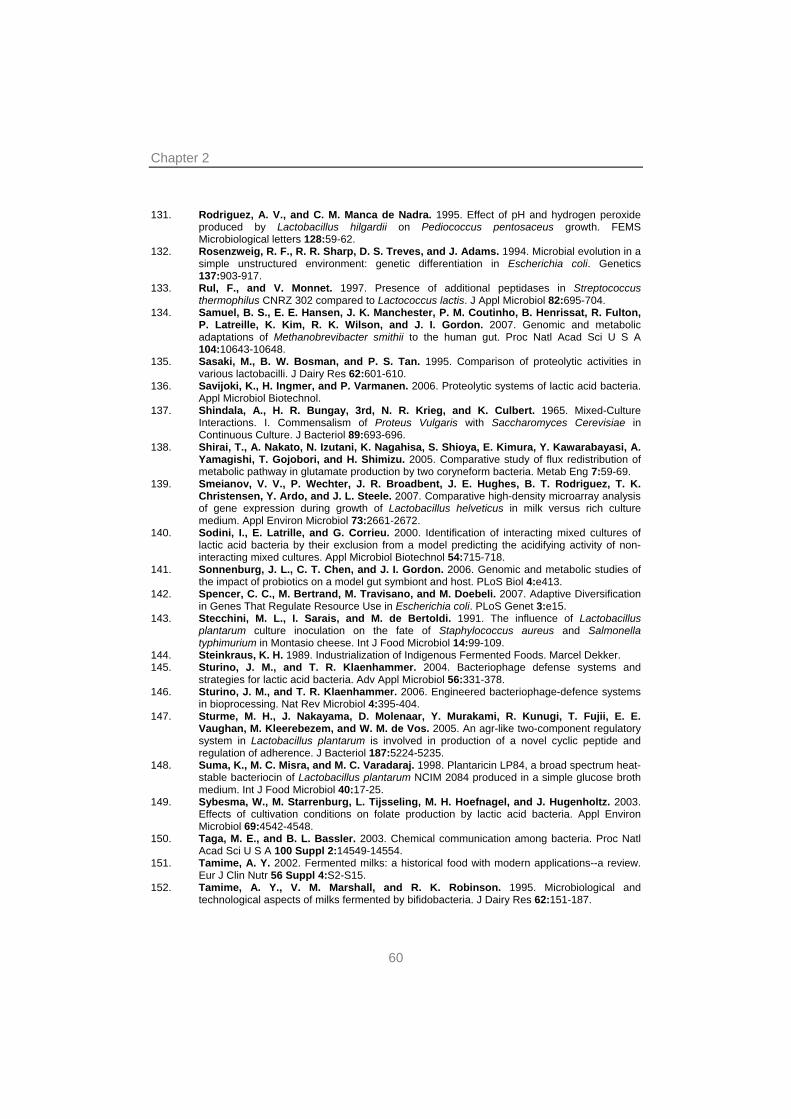
Chapter 2
131. Rodriguez, A. V., and C. M. Manca de Nadra. 1995. Effect of pH and hydrogen peroxide produced by Lactobacillus hilgardii on Pediococcus pentosaceus growth. FEMS Microbiological letters 128:59-62.
132. Rosenzweig, R. F., R. R. Sharp, D. S. Treves, and J. Adams. 1994. Microbial evolution in a simple unstructured environment: genetic differentiation in Escherichia coli. Genetics 137:903-917.
133. Rul, F., and V. Monnet. 1997. Presence of additional peptidases in Streptococcus thermophilus CNRZ 302 compared to Lactococcus lactis. J Appl Microbiol 82:695-704.
134. Samuel, B. S., E. E. Hansen, J. K. Manchester, P. M. Coutinho, B. Henrissat, R. Fulton, P. Latreille, K. Kim, R. K. Wilson, and J. I. Gordon. 2007. Genomic and metabolic adaptations of Methanobrevibacter smithii to the human gut. Proc Natl Acad Sci U S A 104:10643-10648.
135. Sasaki, M., B. W. Bosman, and P. S. Tan. 1995. Comparison of proteolytic activities in various lactobacilli. J Dairy Res 62:601-610.
136. Savijoki, K., H. Ingmer, and P. Varmanen. 2006. Proteolytic systems of lactic acid bacteria. Appl Microbiol Biotechnol.
137. Shindala, A., H. R. Bungay, 3rd, N. R. Krieg, and K. Culbert. 1965. Mixed-Culture Interactions. I. Commensalism of Proteus Vulgaris with Saccharomyces Cerevisiae in Continuous Culture. J Bacteriol 89:693-696.
138. Shirai, T., A. Nakato, N. Izutani, K. Nagahisa, S. Shioya, E. Kimura, Y. Kawarabayasi, A. Yamagishi, T. Gojobori, and H. Shimizu. 2005. Comparative study of flux redistribution of metabolic pathway in glutamate production by two coryneform bacteria. Metab Eng 7:59-69.
139. Smeianov, V. V., P. Wechter, J. R. Broadbent, J. E. Hughes, B. T. Rodriguez, T. K. Christensen, Y. Ardo, and J. L. Steele. 2007. Comparative high-density microarray analysis of gene expression during growth of Lactobacillus helveticus in milk versus rich culture medium. Appl Environ Microbiol 73:2661-2672.
140. Sodini, I., E. Latrille, and G. Corrieu. 2000. Identification of interacting mixed cultures of lactic acid bacteria by their exclusion from a model predicting the acidifying activity of non-interacting mixed cultures. Appl Microbiol Biotechnol 54:715-718.
141. Sonnenburg, J. L., C. T. Chen, and J. I. Gordon. 2006. Genomic and metabolic studies of the impact of probiotics on a model gut symbiont and host. PLoS Biol 4:e413.
142. Spencer, C. C., M. Bertrand, M. Travisano, and M. Doebeli. 2007. Adaptive Diversification in Genes That Regulate Resource Use in Escherichia coli. PLoS Genet 3:e15.
143. Stecchini, M. L., I. Sarais, and M. de Bertoldi. 1991. The influence of Lactobacillus plantarum culture inoculation on the fate of Staphylococcus aureus and Salmonella typhimurium in Montasio cheese. Int J Food Microbiol 14:99-109.
144. Steinkraus, K. H. 1989. Industrialization of Indigenous Fermented Foods. Marcel Dekker. 145. Sturino, J. M., and T. R. Klaenhammer. 2004. Bacteriophage defense systems and
strategies for lactic acid bacteria. Adv Appl Microbiol 56:331-378. 146. Sturino, J. M., and T. R. Klaenhammer. 2006. Engineered bacteriophage-defence systems
in bioprocessing. Nat Rev Microbiol 4:395-404. 147. Sturme, M. H., J. Nakayama, D. Molenaar, Y. Murakami, R. Kunugi, T. Fujii, E. E.
Vaughan, M. Kleerebezem, and W. M. de Vos. 2005. An agr-like two-component regulatory system in Lactobacillus plantarum is involved in production of a novel cyclic peptide and regulation of adherence. J Bacteriol 187:5224-5235.
148. Suma, K., M. C. Misra, and M. C. Varadaraj. 1998. Plantaricin LP84, a broad spectrum heat-stable bacteriocin of Lactobacillus plantarum NCIM 2084 produced in a simple glucose broth medium. Int J Food Microbiol 40:17-25.
149. Sybesma, W., M. Starrenburg, L. Tijsseling, M. H. Hoefnagel, and J. Hugenholtz. 2003. Effects of cultivation conditions on folate production by lactic acid bacteria. Appl Environ Microbiol 69:4542-4548.
150. Taga, M. E., and B. L. Bassler. 2003. Chemical communication among bacteria. Proc Natl Acad Sci U S A 100 Suppl 2:14549-14554.
151. Tamime, A. Y. 2002. Fermented milks: a historical food with modern applications--a review. Eur J Clin Nutr 56 Suppl 4:S2-S15.
152. Tamime, A. Y., V. M. Marshall, and R. K. Robinson. 1995. Microbiological and technological aspects of milks fermented by bifidobacteria. J Dairy Res 62:151-187.
60
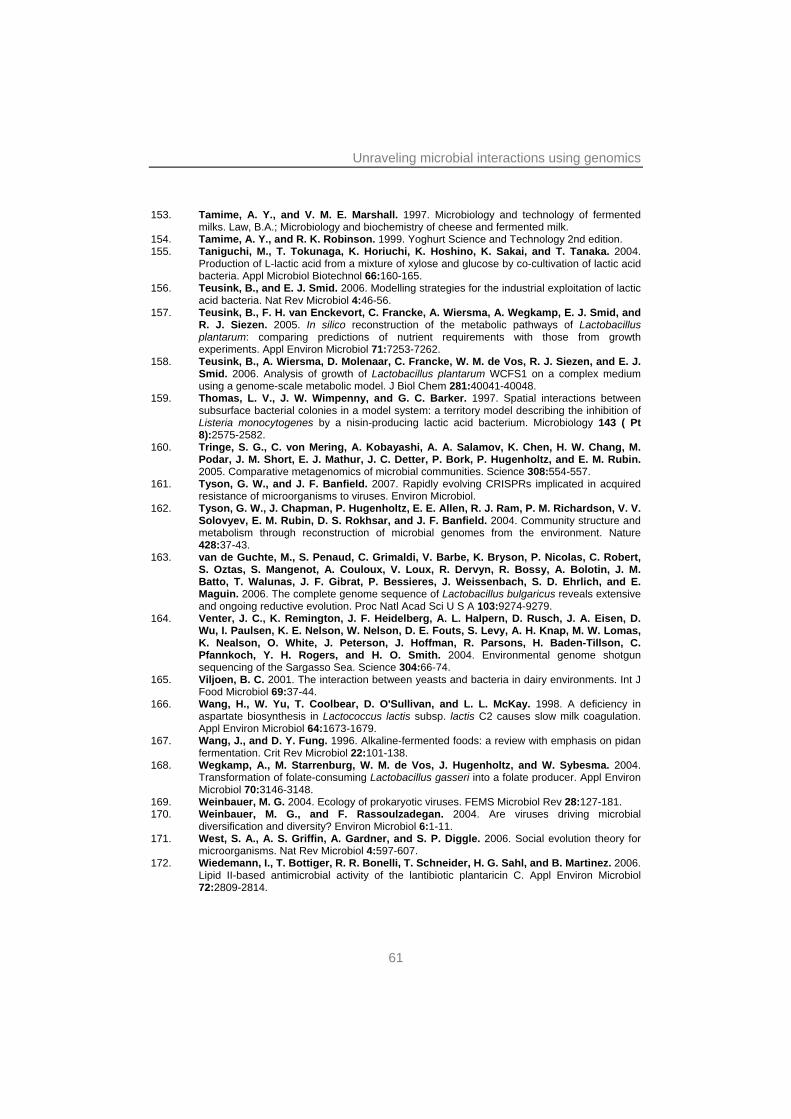
Unraveling microbial interactions using genomics
153. Tamime, A. Y., and V. M. E. Marshall. 1997. Microbiology and technology of fermented milks. Law, B.A.; Microbiology and biochemistry of cheese and fermented milk.
154. Tamime, A. Y., and R. K. Robinson. 1999. Yoghurt Science and Technology 2nd edition. 155. Taniguchi, M., T. Tokunaga, K. Horiuchi, K. Hoshino, K. Sakai, and T. Tanaka. 2004.
Production of L-lactic acid from a mixture of xylose and glucose by co-cultivation of lactic acid bacteria. Appl Microbiol Biotechnol 66:160-165.
156. Teusink, B., and E. J. Smid. 2006. Modelling strategies for the industrial exploitation of lactic acid bacteria. Nat Rev Microbiol 4:46-56.
157. Teusink, B., F. H. van Enckevort, C. Francke, A. Wiersma, A. Wegkamp, E. J. Smid, and R. J. Siezen. 2005. In silico reconstruction of the metabolic pathways of Lactobacillus plantarum: comparing predictions of nutrient requirements with those from growth experiments. Appl Environ Microbiol 71:7253-7262.
158. Teusink, B., A. Wiersma, D. Molenaar, C. Francke, W. M. de Vos, R. J. Siezen, and E. J. Smid. 2006. Analysis of growth of Lactobacillus plantarum WCFS1 on a complex medium using a genome-scale metabolic model. J Biol Chem 281:40041-40048.
159. Thomas, L. V., J. W. Wimpenny, and G. C. Barker. 1997. Spatial interactions between subsurface bacterial colonies in a model system: a territory model describing the inhibition of Listeria monocytogenes by a nisin-producing lactic acid bacterium. Microbiology 143 ( Pt 8):2575-2582.
160. Tringe, S. G., C. von Mering, A. Kobayashi, A. A. Salamov, K. Chen, H. W. Chang, M. Podar, J. M. Short, E. J. Mathur, J. C. Detter, P. Bork, P. Hugenholtz, and E. M. Rubin. 2005. Comparative metagenomics of microbial communities. Science 308:554-557.
161. Tyson, G. W., and J. F. Banfield. 2007. Rapidly evolving CRISPRs implicated in acquired resistance of microorganisms to viruses. Environ Microbiol.
162. Tyson, G. W., J. Chapman, P. Hugenholtz, E. E. Allen, R. J. Ram, P. M. Richardson, V. V. Solovyev, E. M. Rubin, D. S. Rokhsar, and J. F. Banfield. 2004. Community structure and metabolism through reconstruction of microbial genomes from the environment. Nature 428:37-43.
163. van de Guchte, M., S. Penaud, C. Grimaldi, V. Barbe, K. Bryson, P. Nicolas, C. Robert, S. Oztas, S. Mangenot, A. Couloux, V. Loux, R. Dervyn, R. Bossy, A. Bolotin, J. M. Batto, T. Walunas, J. F. Gibrat, P. Bessieres, J. Weissenbach, S. D. Ehrlich, and E. Maguin. 2006. The complete genome sequence of Lactobacillus bulgaricus reveals extensive and ongoing reductive evolution. Proc Natl Acad Sci U S A 103:9274-9279.
164. Venter, J. C., K. Remington, J. F. Heidelberg, A. L. Halpern, D. Rusch, J. A. Eisen, D. Wu, I. Paulsen, K. E. Nelson, W. Nelson, D. E. Fouts, S. Levy, A. H. Knap, M. W. Lomas, K. Nealson, O. White, J. Peterson, J. Hoffman, R. Parsons, H. Baden-Tillson, C. Pfannkoch, Y. H. Rogers, and H. O. Smith. 2004. Environmental genome shotgun sequencing of the Sargasso Sea. Science 304:66-74.
165. Viljoen, B. C. 2001. The interaction between yeasts and bacteria in dairy environments. Int J Food Microbiol 69:37-44.
166. Wang, H., W. Yu, T. Coolbear, D. O'Sullivan, and L. L. McKay. 1998. A deficiency in aspartate biosynthesis in Lactococcus lactis subsp. lactis C2 causes slow milk coagulation. Appl Environ Microbiol 64:1673-1679.
167. Wang, J., and D. Y. Fung. 1996. Alkaline-fermented foods: a review with emphasis on pidan fermentation. Crit Rev Microbiol 22:101-138.
168. Wegkamp, A., M. Starrenburg, W. M. de Vos, J. Hugenholtz, and W. Sybesma. 2004. Transformation of folate-consuming Lactobacillus gasseri into a folate producer. Appl Environ Microbiol 70:3146-3148.
169. Weinbauer, M. G. 2004. Ecology of prokaryotic viruses. FEMS Microbiol Rev 28:127-181. 170. Weinbauer, M. G., and F. Rassoulzadegan. 2004. Are viruses driving microbial
diversification and diversity? Environ Microbiol 6:1-11. 171. West, S. A., A. S. Griffin, A. Gardner, and S. P. Diggle. 2006. Social evolution theory for
microorganisms. Nat Rev Microbiol 4:597-607. 172. Wiedemann, I., T. Bottiger, R. R. Bonelli, T. Schneider, H. G. Sahl, and B. Martinez. 2006.
Lipid II-based antimicrobial activity of the lantibiotic plantaricin C. Appl Environ Microbiol 72:2809-2814.
61
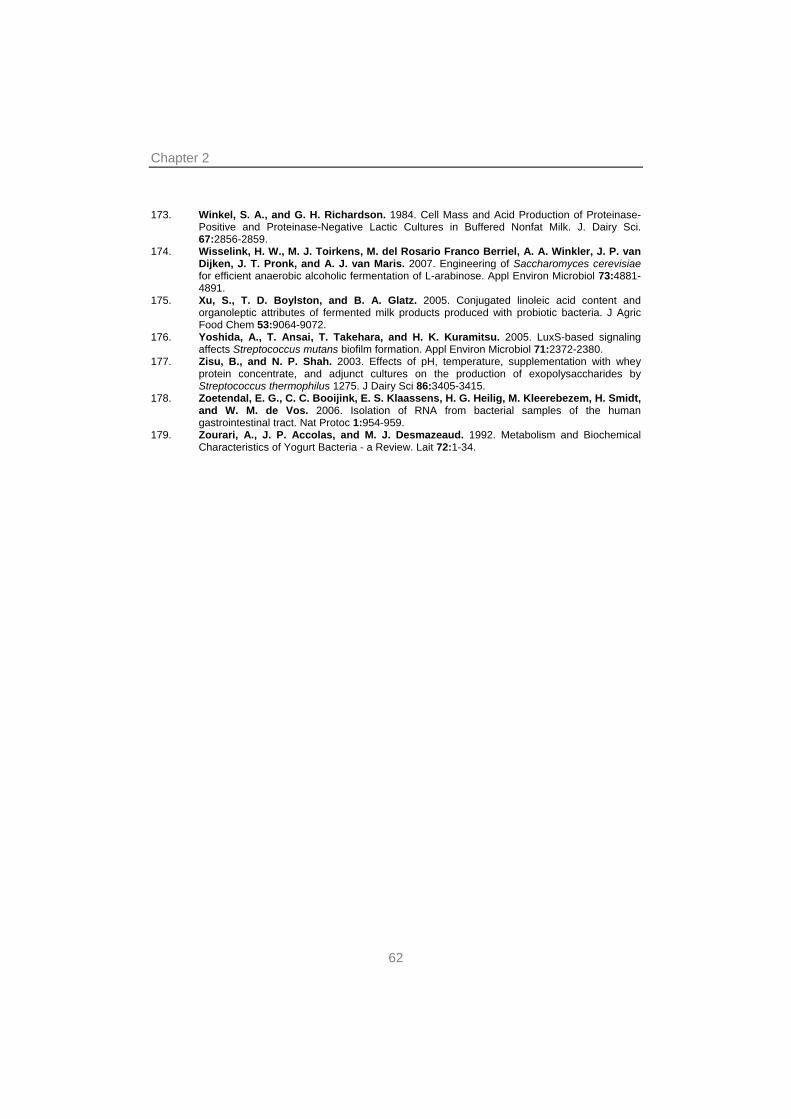
Chapter 2
62
173. Winkel, S. A., and G. H. Richardson. 1984. Cell Mass and Acid Production of Proteinase-Positive and Proteinase-Negative Lactic Cultures in Buffered Nonfat Milk. J. Dairy Sci. 67:2856-2859.
174. Wisselink, H. W., M. J. Toirkens, M. del Rosario Franco Berriel, A. A. Winkler, J. P. van Dijken, J. T. Pronk, and A. J. van Maris. 2007. Engineering of Saccharomyces cerevisiae for efficient anaerobic alcoholic fermentation of L-arabinose. Appl Environ Microbiol 73:4881-4891.
175. Xu, S., T. D. Boylston, and B. A. Glatz. 2005. Conjugated linoleic acid content and organoleptic attributes of fermented milk products produced with probiotic bacteria. J Agric Food Chem 53:9064-9072.
176. Yoshida, A., T. Ansai, T. Takehara, and H. K. Kuramitsu. 2005. LuxS-based signaling affects Streptococcus mutans biofilm formation. Appl Environ Microbiol 71:2372-2380.
177. Zisu, B., and N. P. Shah. 2003. Effects of pH, temperature, supplementation with whey protein concentrate, and adjunct cultures on the production of exopolysaccharides by Streptococcus thermophilus 1275. J Dairy Sci 86:3405-3415.
178. Zoetendal, E. G., C. C. Booijink, E. S. Klaassens, H. G. Heilig, M. Kleerebezem, H. Smidt, and W. M. de Vos. 2006. Isolation of RNA from bacterial samples of the human gastrointestinal tract. Nat Protoc 1:954-959.
179. Zourari, A., J. P. Accolas, and M. J. Desmazeaud. 1992. Metabolism and Biochemical Characteristics of Yogurt Bacteria - a Review. Lait 72:1-34.


Chapter 3
A simple and fast method for determining colony forming units
Sander Sieuwerts, Frank A.M. de Bok, Erik Mols, Willem M. de Vos and Johan E.T.
van Hylckama Vlieg
This chapter has been published as LAM 2008 Oct;47(4):275-278
65
Chapter 3
ABSTRACT Aims: To develop a flexible and fast colony-forming unit (CFU) quantification method that can be operated in a standard microbiology laboratory. Methods and results: A miniaturized plating method is reported where droplets of bacterial cultures are spotted on agar plates. Subsequently, minicolony spots are imaged with a digital camera and quantified using a dedicated plug-in developed for the freeware program ImageJ. A comparison between conventional and minicolony plating of industrial microorganisms including lactic acid bacteria, Escherichia coli and Saccharomyces cerevisiae showed that there was no significant difference in the results obtained with the methods. Conclusion: The presented method allows downscaling of plating by 100-fold, is flexible, easy-to-use and is more labor-efficient and cost-efficient than conventional plating methods. Significance and impact of the study: The method can be used for rapid assessment of viable counts of microorganisms similar to conventional plating using standard laboratory equipment. It is faster and cheaper than conventional plating methods. KEYWORDS Colony-forming units, plating, faster enumeration, lactic acid bacteria, Saccharomyces cerevisiae, Escherichia coli The growth and maintenance of microbes on agar-containing media in Petri dishes has since long been common practice in microbiology. Traditionally, the preferred method for quantitative population analysis of pure and mixed cultures relies on plating of serial dilutions and subsequent counting of colony forming units (CFUs). In recent years a range of alternative, high-throughput (HT), methods relying on quantitative PCR (5, 14), fluorescent labeling (2, 8) or genome probing with micro arrays (1) have gained popularity (9). However, most of these methods measure different entities, i.e. all cells, including non-viable cells. Moreover, these methods may require the use of special equipment or extensive protocol development. In addition, some of these methods are poorly compatible with complex substrates and environmental samples. This largely explains why enumeration of microbes by colony counting is still a widely applied methodology. Presently, microbiology is increasingly moving towards HT analyses, which may require the use of large
66
Miniaturised plating of microbes
quantities of plates. This results in serious drawbacks when using conventional plating and colony counting techniques. The preparation of media and plates as well as the counting of colonies is time-consuming and labor-intensive. Moreover, large volumes may lead to significant costs, in particular when expensive indicator or reporter substrates are used. Finally, many methods consume large amounts of materials including disposables, compromising their sustainability.
Several reports describe alternative plating technologies in which the required volumes are down-scaled (6, 7, 13, 16) or the colony counting process is automated (3, 12, 15). However, these examples require equipment that is not present in standard microbiology laboratories (4, 10), may result only in limited downscaling (4, 6, 7), or are poorly suited for automation (6, 13). Building upon this work, we report a simple and flexible method for determining cell counts capitalizing on microtiter plate formats. It integrates rapid miniaturized plating and (semi-) automated counting of minicolonies allowing 100-fold downscaling of the process compared to conventional CFU counting procedures. It can be fully operated with little more than a multichannel pipet, a digital camera and ImageJ, an image processing package that is available as freeware (http://rsb.info.nih.gov/ij/). A number of examples is presented to illustrate the power of the approach for rapid assessment of viable counts of important prokaryotic and eukaryotic industrial microorganisms.
For plating we used 10-fold serial dilutions that were prepared in 96-well micro plates using a Genex Alpha twelve channel pipet. For each dilution, samples of five µl were pipeted onto a plate containing agar medium using the same pipet. Typically, 60 to 120 droplets were applied per square 12 cm plate. The plates were air dried and then incubated until colonies were visible with an average size of 200 to 500 µm. Subsequently, these minicolonies were photographed with a Canon EOS 350D high resolution digital camera (Canon 0020X665, Canon Nederland NV) equipped with a Sigma 105 mm macro lens (AF 105MM F2.8 EX MACRO F, Sigma Corporation). Plates were put on a black surface and illuminated from the side in order to achieve a large contrast between colonies and background.
Digital images were further processed in ImageJ using a newly developed plug-in that can be downloaded as supplementary material. The counting process is schematically represented in Figure 1. Briefly, the color images were converted into eight-bit grayscale and inverted. By manual intervention using the ‘threshold’ function of ImageJ, colonies were selected from the background. Then all pictures were stacked. After inversion, the median was taken from each pixel with its neighboring pixels for noise reduction. The ’watershed’ function was used to separate merged colonies and the ‘analyze particles’ function was used for
67
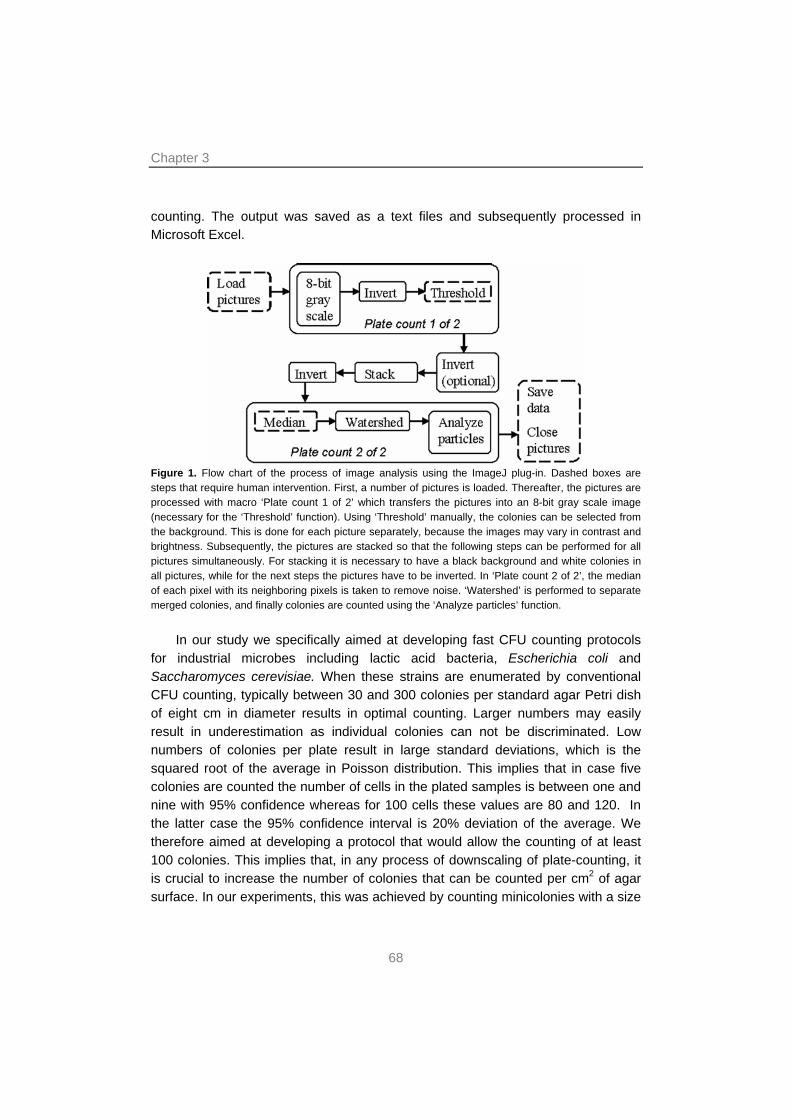
Chapter 3
counting. The output was saved as a text files and subsequently processed in Microsoft Excel.
Figure 1. Flow chart of the process of image analysis using the ImageJ plug-in. Dashed boxes are steps that require human intervention. First, a number of pictures is loaded. Thereafter, the pictures are processed with macro ‘Plate count 1 of 2’ which transfers the pictures into an 8-bit gray scale image (necessary for the ‘Threshold’ function). Using ‘Threshold’ manually, the colonies can be selected from the background. This is done for each picture separately, because the images may vary in contrast and brightness. Subsequently, the pictures are stacked so that the following steps can be performed for all pictures simultaneously. For stacking it is necessary to have a black background and white colonies in all pictures, while for the next steps the pictures have to be inverted. In ‘Plate count 2 of 2’, the median of each pixel with its neighboring pixels is taken to remove noise. ‘Watershed’ is performed to separate merged colonies, and finally colonies are counted using the ‘Analyze particles’ function.
In our study we specifically aimed at developing fast CFU counting protocols for industrial microbes including lactic acid bacteria, Escherichia coli and Saccharomyces cerevisiae. When these strains are enumerated by conventional CFU counting, typically between 30 and 300 colonies per standard agar Petri dish of eight cm in diameter results in optimal counting. Larger numbers may easily result in underestimation as individual colonies can not be discriminated. Low numbers of colonies per plate result in large standard deviations, which is the squared root of the average in Poisson distribution. This implies that in case five colonies are counted the number of cells in the plated samples is between one and nine with 95% confidence whereas for 100 cells these values are 80 and 120. In the latter case the 95% confidence interval is 20% deviation of the average. We therefore aimed at developing a protocol that would allow the counting of at least 100 colonies. This implies that, in any process of downscaling of plate-counting, it is crucial to increase the number of colonies that can be counted per cm2 of agar surface. In our experiments, this was achieved by counting minicolonies with a size
68
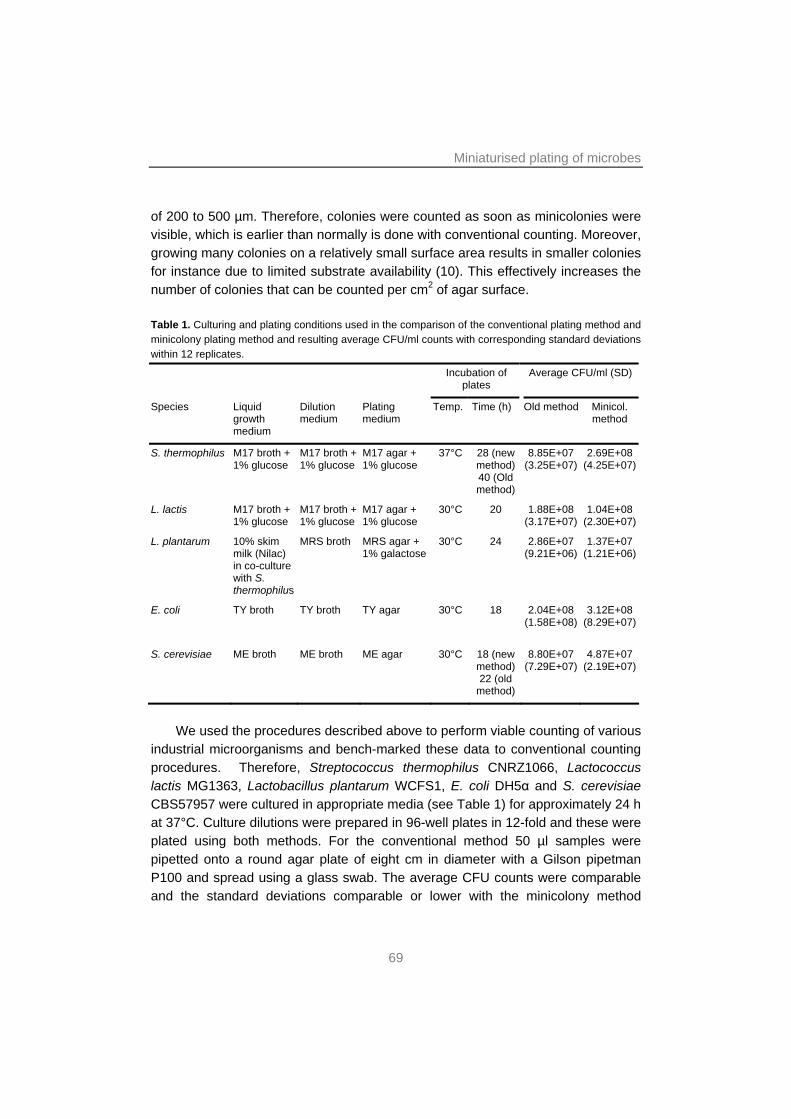
Miniaturised plating of microbes
of 200 to 500 µm. Therefore, colonies were counted as soon as minicolonies were visible, which is earlier than normally is done with conventional counting. Moreover, growing many colonies on a relatively small surface area results in smaller colonies for instance due to limited substrate availability (10). This effectively increases the number of colonies that can be counted per cm2 of agar surface. Table 1. Culturing and plating conditions used in the comparison of the conventional plating method and minicolony plating method and resulting average CFU/ml counts with corresponding standard deviations within 12 replicates.
Incubation of plates
Average CFU/ml (SD)
Species Liquid growth medium
Dilution medium
Plating medium
Temp. Time (h) Old method Minicol. method
S. thermophilus M17 broth + 1% glucose
M17 broth + 1% glucose
M17 agar + 1% glucose
37°C 28 (new method) 40 (Old method)
8.85E+07 (3.25E+07)
2.69E+08 (4.25E+07)
L. lactis M17 broth + 1% glucose
M17 broth + 1% glucose
M17 agar + 1% glucose
30°C 20 1.88E+08 (3.17E+07)
1.04E+08 (2.30E+07)
L. plantarum 10% skim milk (Nilac) in co-culture with S. thermophilus
MRS broth MRS agar + 1% galactose
30°C 24 2.86E+07 (9.21E+06)
1.37E+07 (1.21E+06)
E. coli TY broth TY broth TY agar 30°C 18 2.04E+08 (1.58E+08)
3.12E+08 (8.29E+07)
S. cerevisiae ME broth ME broth ME agar 30°C 18 (new method) 22 (old
method)
8.80E+07 (7.29E+07)
4.87E+07 (2.19E+07)
We used the procedures described above to perform viable counting of various
industrial microorganisms and bench-marked these data to conventional counting procedures. Therefore, Streptococcus thermophilus CNRZ1066, Lactococcus lactis MG1363, Lactobacillus plantarum WCFS1, E. coli DH5α and S. cerevisiae CBS57957 were cultured in appropriate media (see Table 1) for approximately 24 h at 37°C. Culture dilutions were prepared in 96-well plates in 12-fold and these were plated using both methods. For the conventional method 50 µl samples were pipetted onto a round agar plate of eight cm in diameter with a Gilson pipetman P100 and spread using a glass swab. The average CFU counts were comparable and the standard deviations comparable or lower with the minicolony method
69
Chapter 3
confirming the suitability of the method for rapid CFU counting. From the standard deviations in Table 1, it can be concluded that the sensitivity of the fast method is comparable to the conventional method, although the variation between counts may differ with the type of pipets used, as argued previously by Jett et al. (7).
For example, L. plantarum spots containing minicolonies were around nine mm in diameter and therefore it is possible to count up to 200 colonies per cm2 efficiently on MRS-galactose agar, which is typically one to two orders of magnitude higher than with conventional plating. We found that the sizes of spots and minicolonies may vary with the type of agar medium, drying time, sample matrice and species of interest (not shown). It may affect the number of colonies that can be enumerated per five µl spot, typically in the range between 10 and 150, but not on the number of colonies that can be counted per cm2 for this certain species. The detection limit of the minicolony method is similar to that of the conventional method. The dynamic range of the new method was found equal to the conventional method (data not shown).
In recent years high-throughput alternatives and variants have been developed for many conventional microbiological techniques. The best examples are probably liquid batch cultivations for which various multi-well alternatives belong to standard laboratory equipment nowadays. Also several HT alternatives for counting of colony forming units are reported (3, 10, 15). Throughputs are increased by focusing either on automation of the counting process or on the miniaturization of the plating itself. The novelty of the method reported here relies on the integration of these aspects while it requires only standard laboratory equipment, a digital camera, imaging software that is available as freeware, and a dedicated plug-in that is available as supplemental material to this paper at the LAM website. The resulting fast plating and counting protocol is suitable for a quick determination of viable cell counts. The method is highly flexible, because it can easily be implemented for different microbial species and it is easy-to-use. Due to its miniaturization it reduces the amount of necessary materials by approximately 100-fold, which makes it a cost and labor efficient alternative for conventional methods. Because the counting is partially automated, the user can monitor critical steps in data acquisition and processing without the variability encountered from manual counting of CFUs (11). We anticipate that this protocol is a valuable tool for routine enumeration of industrial microbes in research and quality control laboratories.
70
Miniaturised plating of microbes
71
ACKNOWLEDGEMENTS We want to thank Colin Ingham and Patrick Janssen for technical suggestions. REFERENCES 1. Bae, J. W., S. K. Rhee, J. R. Park, W. H. Chung, Y. D. Nam, I. Lee, H. Kim, and Y. H. Park.
2005. Development and evaluation of genome-probing microarrays for monitoring lactic acid bacteria. Appl Environ Microbiol 71:8825-8835.
2. Blasco, L., S. Ferrer, and I. Pardo. 2003. Development of specific fluorescent oligonucleotide probes for in situ identification of wine lactic acid bacteria. FEMS Microbiol Lett 225:115-123.
3. Dahle, J., M. Kakar, H. B. Steen, and O. Kaalhus. 2004. Automated counting of mammalian cell colonies by means of a flat bed scanner and image processing. Cytometry A 60:182-188.
4. Gilchrist, J. E., J. E. Campbell, C. B. Donnelly, J. T. Peeler, and J. M. Delaney. 1973. Spiral plate method for bacterial determination. Appl Microbiol 25:244-252.
5. Haarman, M., and J. Knol. 2006. Quantitative real-time PCR analysis of fecal Lactobacillus species in infants receiving a prebiotic infant formula. Appl Environ Microbiol 72:2359-2365.
6. Hamilton, C. M., M. Anderson, J. Lape, E. Creech, and J. Woessner. 2002. Multichannel plating unit for high-throughput plating of cell cultures. Biotechniques 33:420-423.
7. Jett, B. D., K. L. Hatter, M. M. Huycke, and M. S. Gilmore. 1997. Simplified agar plate method for quantifying viable bacteria. Biotechniques 23:648-650.
8. Lay, C., M. Sutren, V. Rochet, K. Saunier, J. Dore, and L. Rigottier-Gois. 2005. Design and validation of 16S rRNA probes to enumerate members of the Clostridium leptum subgroup in human faecal microbiota. Environ Microbiol 7:933-946.
9. Liu, B., S. Li, and J. Hu. 2004. Technological advances in high-throughput screening. Am J Pharmacogenomics 4:263-276.
10. Liu, X., S. Wang, L. Sendi, and M. J. Caulfield. 2004. High-throughput imaging of bacterial colonies grown on filter plates with application to serum bactericidal assays. J Immunol Methods 292:187-193.
11. Lumley, M. A., R. Burgess, L. J. Billingham, D. F. McDonald, and D. W. Milligan. 1997. Colony counting is a major source of variation in CFU-GM results between centres. Br J Haematol 97:481-484.
12. Marotz, J., C. Lubbert, and W. Eisenbeiss. 2001. Effective object recognition for automated counting of colonies in Petri dishes (automated colony counting). Comput Methods Programs Biomed 66:183-198.
13. McNulty, J. J., and J. J. Dunn. 1999. High-throughput transformation and plating using petristrips. Biotechniques 26:390-392.
14. Neeley, E. T., T. G. Phister, and D. A. Mills. 2005. Differential real-time PCR assay for enumeration of lactic acid bacteria in wine. Appl Environ Microbiol 71:8954-8957.
15. Putman, M., R. Burton, and M. H. Nahm. 2005. Simplified method to automatically count bacterial colony forming unit. J Immunol Methods 302:99-102.
16. Tornero, P., and J. L. Dangl. 2001. A high-throughput method for quantifying growth of phytopathogenic bacteria in Arabidopsis thaliana. Plant J 28:475-481.

73
Chapter 4
Mixed culture transcriptome analysis reveals the molecular basis of co-culture growth and its consequences in
Streptococcus thermophilus and Lactobacillus bulgaricus
Sander Sieuwerts, Douwe Molenaar, Sacha A.F.T. van Hijum, Colin J. Ingham,
Marke Beerthuyzen, Marc J.A. Stevens, Patrick W.M. Janssen, Frank A.M. de Bok, Willem M. de Vos and Johan E.T. van Hylckama Vlieg
Chapter 4
74
ABSTRACT Many industrial food fermentations are carried out by mixed cultures of lactic acid bacteria. Interactions between different strains are of key importance for the performance of these fermentations. The yoghurt fermentation, in which bovine milk is fermented by Streptococcus thermophilus and Lactobacillus delbrueckii subsp. bulgaricus, is one of the best-described mixed culture fermentations. These species are known to stimulate each other’s growth by the exchange of metabolites such as folic acid and carbon dioxide. Recently, postgenomic studies have been applied to reveal the global physiological response to mixed culture growth in S. thermophilus (19, 20) but an in-depth molecular analysis of mixed culture growth of both strains remains to be established. Here we report the application of mixed culture transcriptome profiling to unravel the molecular responses associated with co-culture growth of S. thermophilus and L. bulgaricus in milk. The results indicate that the interactions between these bacteria are primarily based on purine, amino acid and long-chain fatty acid metabolism. That is, formic acid and folic acid are provided by S. thermophilus, amino acids by proteolysis executed by L. bulgaricus and long-chain fatty acids possibly by lipolytic action of S. thermophilus. Moreover, we observed that genes involved in iron uptake in S. thermophilus are affected by co-culture growth, and that genes coding for exopolysaccharide production are higher expressed in both organisms in mixed culture. INTRODUCTION Many food products are fermented by mixed cultures consisting of bacteria, yeasts or filamentous fungi. Fermented dairy products are typically produced with lactic acid bacteria (LAB), a prominent group of Gram-positive bacteria. Yoghurt is bovine milk fermented by the LAB Streptococcus thermophilus and Lactobacillus delbrueckii subsp. bulgaricus (L. bulgaricus). During fermentation, both species contribute to the texture and the flavor of the product by (i) acidifying the medium leading to coagulation of the milk proteins, (ii) producing exopolysaccharides (EPS) and (iii) generating characteristic flavor compounds, such as acetaldehyde and diacetyl (43). S. thermophilus and L. bulgaricus stimulate each others’ growth and acid production in a mixed milk culture, a process also referred to as protocooperation (12). This mutual stimulation is based on the exchange of growth enhancing metabolites (for a recent review, see (35)). S. thermophilus provides L. bulgaricus with pyruvic acid, formic acid (14) and folic acid (13, 42) and carbon
Mixed culture transcriptome analysis
75
dioxide (16), compounds that are all associated to purine biosynthesis either as precursors or cofactors. L. bulgaricus lacks pyruvate-formate lyase (PFL) and 2-amino-4-hydroxy-6-hydroxymethyldihydropteridine diphosphokinase, an essential gene in the biosynthetic pathway of folic acid (13, 45). Other metabolic interactions exist at the level of nitrogen metabolism. Milk contains low levels of free amino acids (AA) and small peptides but milk proteins provide a rich source of AA that can be liberated through the action of extracellular proteolytic enzymes. Typically, the non-proteolytic S. thermophilus profits from the proteolytic action of the membrane-resident protease prtB of L. bulgaricus (11, 34, 37). Similarly, L. bulgaricus was reported to be stimulated by long chain fatty acids (LCFA) such as oleic acid and lauric acid (29), but it remains to be established whether these are provided by S. thermophilus in mixed culture.
The metabolic interactions between the yoghurt bacteria have been elucidated mostly with classical microbiological approaches. More recently two postgenomic studies addressed the global response of S. thermophilus LMG18311 to growth in milk as a mono or mixed culture with L. bulgaricus ATCC11842 (19, 20). These studies revealed several additional metabolic responses to co-culture growth. The down-regulation of genes associated with purine metabolism and the upregulation of stu0336, a xanthine/uracil permease, suggested that purine (precursors) were provided by L. bulgaricus and consumed by S. thermophilus. Additionally the pathways for the biosynthesis of arginine and branched-chain AA (BCAA) were strongly upregulated in S. thermophilus in mixed culture. Finally there was a pronounced response in iron metabolism. The authors showed that in response to H2O2 produced by L. bulgaricus, S. thermophilus shows multiple responses that may lead to lower intracellular iron concentrations. (19). In this way S. thermophilus appears to minimize damage by reactive oxygen species (ROS) that are generated in the Fenton reaction.
The postgenomic analyses described above are only performed in S thermophilus. The global response to mixed culture growth in L. bulgaricus remains to be established. In this study we aimed at analyzing the global regulatory responses to co-cultivation in milk in both strains simultaneously. The correlation of the global responses with population dynamics in intervention studies and metabolite production confirmed the importance of purine and AA metabolism, but also showed that L. bulgaricus LCFA production genes are down-regulated in mixed culture despite its higher growth rate. This indicates that these LCFA were directly or indirectly provided by S. thermophilus. Similarly, the induction of genes responsible for EPS production in both species in co-culture shows a role for EPS in the protocooperation. These results provide further insight in the global
Chapter 4
76
physiology of the yoghurt mixed culture fermentation and may facilitate rational improvement of other fermentations or the development of new (industrial) mixed cultures, for instance by providing targets for engineered nutritional dependencies. MATERIALS AND METHODS Strains and culture conditions. Streptococcus thermophilus CNRZ1066 (3) and Lactobacillus delbrueckii subsp bulgaricus ATCC BAA-365 (25) were maintained as frozen stocks in M17 broth (Difco) and MRS broth (Difco), respectively with 22% glycerol (Scharlau) at -80 °C. Precultures were made as mono-cultures in UHT treated 10% reconstituted skim milk (Nilac, NIZO food research, the Netherlands) for 22 h at 42°C. Final liquid cultures were made by inoculating pre-warmed milk at the same conditions with, precultures of S. thermophilus and L. bulgaricus to density of approximately 1*105 and 2*104 CFU/mL, respectively.
For biofilm growth, S. thermophilus and L. bulgaricus mono-cultures in milk were incubated for 1-2 days at 42°C and subsequently pipeted together or separately onto an anopore slide (22) placed on top of a milk agar plate (8% skim milk and 1-1,5% agar). Plates were incubated anaerobically at 42°C for 2-4 days before staining procedures were carried out (see below) or at 45°C for 2 days for transcriptome analysis. Cell density of the inoculum was quantified by plating on MRS agar for L. bulgaricus and M17 agar supplemented with 1% (w/v) glucose for S. thermophilus.
In order to calculate the amount of lactic acid produced by the different cultures, uninoculated milk was acidified to various pH values with lactic acid. These recorded amounts of added lactic acid were used to calculate the lactic acid content of a culture at a certain pH. Intervention studies. Cultures of S. thermophilus, L. bulgaricus and the mixed culture were prepared in 0.8 volume reconstituted skim milk with 0.2 volume of a solution with compounds for which it has been established or hypothesized that they are involved in interaction (35): Na-pyruvate (1.82 mM), Na-formate (1.47 mM), folic acid (1 mM), nucleobases (10 mg/L each) (all representing purine and pyrimidine metabolism), Tween-20 (105.9 µM) (as a supply of lauric acid (15, 23)), Tween-80 (110 mg/L) (as a supply of oleic acid (23)), casitone (4 g/L), histidine (650 µM) (both representing proteolysis), L-ornithine monohydrochloride (590 µM) and putrescine
Mixed culture transcriptome analysis
77
(1.13 mM) (both involved in arginine metabolism, urea cycle and tolerance to oxidative stress (7, 35, 45)). Here after these compounds are referred to as ‘interaction compounds’. The LCFAs oleic acid and lauric acid are poorly soluble and therefore we used Tween-20 and Tween-80 (29). The effect of each of all interaction compounds on growth and acidification was tested in a single addition and a single omission strategy. Paired comparisons were made of a single compound versus nothing added (neg. control), and of all compounds minus one added versus all (pos. control). Acidification of quadruplicate cultures of 250 μL was measured at 37 °C for 19 h in hydroplates (PreSens - Precision Sensing GmbH, Germany) where after CFU counts were determined using a rapid miniplating method (36). Significant differences in acidification were determined by comparing the maximal acidification rate using a two-tailed Students t-test (p=0.05). Similarly, significant differences were calculated between the final pH values and between the colony-forming units. Metabolite analyses.
Free amino acid content was determined as follows. Samples (100 µL) were diluted 10x by adding 100 µL 2.5 mM norvaline (Aldrich) as internal standard and 800 µL 0.1 M HCl (Fluka) / 0.2% (w/v) 3,3-thiodipropionic acid (Fluka). In order to remove proteins, this was filtered in a 3000 Da Microcon Ultracel YM-3 microcentrifuge filter (Sigma) by filtration at 3500 G for 30 min. 20 µL of this was mixed with 180 µL of a solution containing 0.15 M NaHCO3 pH 8.6 to buffer pH. 200 µL 12.4 M dabsyl chloride (Fluka) in acetone (Sigma) was added. The samples were incubated for 15 min at 70°C and mixed with a vortex mixer after 0, 1 and 12 min to derivate the amino acids. This reaction was stopped by placing the samples on ice. The samples were centrifuged at 10000 G for 10 s, where after 400 µL of a solution was added consisting of 50% (v/v) acetonitrile (Sigma), 25% (v/v) ethanol (Sigma) and 25% (v/v) Eluens A (9 M NaH2PO4 pH 7.0 and 0.16% (v/v) triethylamine (Sigma)). The samples were mixed by vortexing and centrifuged at 15000 G for 5 min. Of the supernatants 10 µL was injected in the column for analysis with a Phenomenex ODS (C18), 3 µm SphereClone column and reversed-phase HPLC (detection at 436 nm with 738 A (VIS4205) (Applied Biosystems)). The concentrations were calculated by comparing the peak surface with that of a standard series.
For volatile compound analyses Solid Phase Dynamic Extraction (SPDE) head space analysis was performed similar to as described by Bachmann et al. (1). In short, triplicate cultures of 5 mL prepared in glass flasks were grown at 37°C for 24 h and subsequently frozen at -80°C. The flasks were incubated at 60°C and 1 mL
Chapter 4
78
headspace was used for the SPDE (PDMS and 1% AC). The volatiles were fixed by cryofixation at -150°C for 0.5 min. Subsequently, the components were separated on a Factor Four V1ms column using a helium flow of 1.5 mL/min. The oven temperature was held at 40°C for 5 min, was increased to 50°C using a ramp rate of 10°C/min, brought to 60°C by 2°C/min, then brought to 150°C by 10°C/min and finally brought to 225°C for 4 min with a ramp rate of 50°C/min. Peak areas were determined and compounds were identified using the mainlib, replib and wiley7 (Nist) libraries in Xcalibur™ (Thermo Fisher Scientific Inc, Waltham, MA, USA). Quantification of components was performed by comparing peak areas with those of calibration series. Exopolysaccharide isolation. Different 275 mL yoghurt cultures were grown at 37°C for 24 h. Of this, 80 g was used for EPS isolation. The samples were incubated at 55°C to release all EPS from the cells, where after 5.3 mL of a 60% Na3Citrate (Merck) solution was added. After stirring at RT for 1 h, the samples were centrifuged for 30 min at 6000 G and 4°C. The supernatant was applied to a flask and adjusted to pH 4.0 with 10 M NaOH (VWR). Dialysis tubes (Medicell International Ltd., England) were boiled in water with a spoon Na2CO3 for 5-10 minutes, rinsed with water and boiled in water for 5 min. The samples were applied to the tubes. Dialysis was performed in flowing tap water for 24 h and twice in MQ water for 3 h. Dialyzed samples were freeze dried in an ilShin freeze dryer (IlShin, South Korea) until all water had evaporated. Microarray design. Microarrays were spotted on the Agilent 8x15K platform (Agilent Technologies, Santa Clara, CA, USA) with a custom probe design (AMADID 015342) comprising the sequences of both S. thermophilus CNRZ1066 (released by NCBI, genbank accession no. NC_006449) and L. bulgaricus ATCC BAA-365 (released by JGI, genbank accession no. NC_008529). The probes were designed with the objective to minimize cross-hybridization: the probes were species-specific, i.e. all probes were designed as 60-mers with a target score of 100% to the target gene, allowing no binding of cDNA that is 1 base different (mismatch) if the correct hybridization temperature (65°C) and washing temperature (37°C) are used. In total there are 5438 probes representing 1899 genes of S. thermophilus and 4028 spots representing 1709 genes of L. bulgaricus. Most genes are represented by 3 probes or more. Only 55 genes in S. thermophilus and 77 in L. bulgaricus are represented by one probe and only 5 genes of S. thermophilus and 31 genes of L. bulgaricus
Mixed culture transcriptome analysis
79
are lacking. The selectivity of strain specific gene detection was tested by a series of transcriptome profiling experiments of samples from MRS-grown mono-cultures of both strains. Comparative analysis of separate hybridizations and hybridization of a mixture of both samples showed that on average the probes showed 100-fold higher hybridization with RNA samples from the target strain. It was concluded that for a small number of genes strain specific gene expression analysis was not possible. These genes included rRNA genes (14 in S. thermophilus, 19 in L. bulgaricus), ribosomal proteins (4 and 12, respectively) and hypothetical proteins (8 and 2, respectively). They were excluded from further analysis. RNA isolation from cultures grown in milk. The high protein content of milk and the polysaccharide production by the grown microorganisms make cell harvesting problematic. Furthermore, sampling and quenching need to be carried out rapidly in order to prevent the introduction of technical errors in a transcriptomics experiment (10). Several procedures have been developed to “clear” the milk to enable cell harvest by centrifugation without the contamination with milk solids. However, milk cleaning procedures are time consuming and require drastic changes in pH and the addition of large quantities of sodium citrate (9). We considered that this procedure is prone to lead to changes in the transcriptome. Therefore, we developed an alternative method for cell harvesting and RNA extraction from yoghurt cultures suitable for transcriptomic profiling. Yoghurt cultures were quenched in 3 volumes 60% glycerol of -40°C leading to immediate arrest of cellular processes (32) and kept at -20°C for 0.5 h. Then pH was adjusted to 6.5 – 7.0 with 1 M NaOH and the medium was cleared with 4 mL 25% (w/v) Na3Citrate per 100 mL at -20°C for 0.5 h with gently mixing each 5 min. Cells were spinned down at -20°C and 23000 G for 16 min and dissolved in a solution comprised off 50% (w/v) guanidinethiocyanate (Sigma), 0.5% (w/v) N-laurylsarcosine (Sigma) and 2.5% (v/v) of a 1 M sodium-citrate solution, adjusted to pH 7.0 with 0.1 M NaOH. After another centrifugation, the cells were resuspended in 500 µL 1xTE and applied to an RNA extraction tube containing 250 µL acidic phenol (Sigma), 250 µL chloroform (sigma), 30 µL NaAc (Merck) pH 5.2, 30 µL 10% SDS (Sigma) and 500 mg zirconium beads with 0.1 mm diameter (Biospec products Inc., OK, USA) which was immediately frozen in liquid nitrogen and kept at -80°C until RNA extraction.
For RNA isolation, a method was used that was already established for isolation from lactobacilli (39). Briefly, cells were disrupted 3 times 45 s in a Fastprep (Qbiogene Inc., France) at 5.5 m/s separated by 1 min on ice. After centrifugation for 1 min at 20800 G, 500 μL of the aqueous phase was purified with
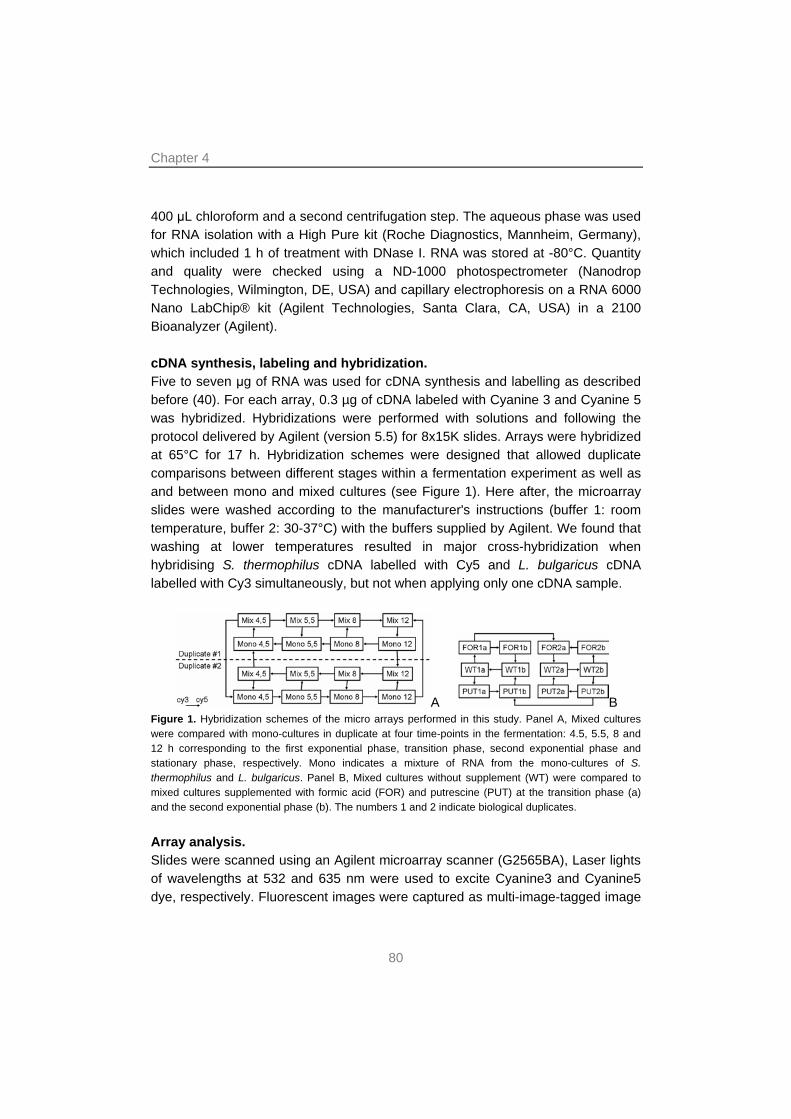
Chapter 4
80
400 μL chloroform and a second centrifugation step. The aqueous phase was used for RNA isolation with a High Pure kit (Roche Diagnostics, Mannheim, Germany), which included 1 h of treatment with DNase I. RNA was stored at -80°C. Quantity and quality were checked using a ND-1000 photospectrometer (Nanodrop Technologies, Wilmington, DE, USA) and capillary electrophoresis on a RNA 6000 Nano LabChip® kit (Agilent Technologies, Santa Clara, CA, USA) in a 2100 Bioanalyzer (Agilent). cDNA synthesis, labeling and hybridization. Five to seven μg of RNA was used for cDNA synthesis and labelling as described before (40). For each array, 0.3 µg of cDNA labeled with Cyanine 3 and Cyanine 5 was hybridized. Hybridizations were performed with solutions and following the protocol delivered by Agilent (version 5.5) for 8x15K slides. Arrays were hybridized at 65°C for 17 h. Hybridization schemes were designed that allowed duplicate comparisons between different stages within a fermentation experiment as well as and between mono and mixed cultures (see Figure 1). Here after, the microarray slides were washed according to the manufacturer's instructions (buffer 1: room temperature, buffer 2: 30-37°C) with the buffers supplied by Agilent. We found that washing at lower temperatures resulted in major cross-hybridization when hybridising S. thermophilus cDNA labelled with Cy5 and L. bulgaricus cDNA labelled with Cy3 simultaneously, but not when applying only one cDNA sample.
A B Figure 1. Hybridization schemes of the micro arrays performed in this study. Panel A, Mixed cultures were compared with mono-cultures in duplicate at four time-points in the fermentation: 4.5, 5.5, 8 and 12 h corresponding to the first exponential phase, transition phase, second exponential phase and stationary phase, respectively. Mono indicates a mixture of RNA from the mono-cultures of S. thermophilus and L. bulgaricus. Panel B, Mixed cultures without supplement (WT) were compared to mixed cultures supplemented with formic acid (FOR) and putrescine (PUT) at the transition phase (a) and the second exponential phase (b). The numbers 1 and 2 indicate biological duplicates. Array analysis. Slides were scanned using an Agilent microarray scanner (G2565BA), Laser lights of wavelengths at 532 and 635 nm were used to excite Cyanine3 and Cyanine5 dye, respectively. Fluorescent images were captured as multi-image-tagged image
Mixed culture transcriptome analysis
81
file format and analyzed with Imagene software (Axon) (BioDiscovery, Marina del Rey, USA). The extent of hybridization was derived from a median value of pixel-by-pixel ratios. S. thermophilus and L. bulgaricus spots were normalised separately using Lowess (47). Differential regulation was determined by false-discovery rate (FDR) from the Cyber-T p-values by means of multiple testing connection (2, 48). Differential regulation was defined as a two-fold or higher differential expression with a FDR cut-off value of 0.05 or lower. Regulated genes were divided into functional classes as described by NCBI (S. thermophilus) and JGI (L. bulgaricus). Using Hierarchical clustering, principle component analysis and MicroPreP (46), the quality of the different hybridizations was verified. Finally, results were visualized by plotting onto KEGG maps, Simpheny (Genomatica Inc., San Diego, CA) metabolic maps (30, 44) and Minomics (6). Staining, imaging and processing of biofilms. For SybrGold staining, anopore strips containing minicolonies were transferred right-side up to a microscope slide covered with a 1-mm-thick film of 1% (w/v) solidified low-melting-point agarose (Sigma, The Netherlands) containing 1µl/10ml 10000x concentrated SybrGold (Invitrogen, The Netherlands). Staining was for 20 min at room temperature. These procedures allowed staining of the organisms on the anopore surface through the pores without disruption of the microcolonies. Strips were then imaged directly (without coverslip, immersion oil, or fixative) using an Olympus BX-41 fluorescence microscope equipped with U-MWIBA filters (excitation spectrum of 460 to 490 nm, diachronic mirror splitting at 505 nm, and an emission spectrum of 515 to 550 nm, used for SybrGold) (Olympus, Japan). Scanning and examination of microcolonies were performed with 4x and 10x UMPlanF1 objective lenses, and observation of individual cells used a 50x UMPlanF1 objective (Olympus). Image capture was done with a charge-coupled
device (CCD) camera controlled by Kappa Image Base software (Kappa, Germany). Scanning electron microscopy (SEM) of biofilms. Samples were cultured on anopore strips on milk agar plates for 2-4 days and fixed in situ by placing the anopore strips on MRS agar plates with 2.5% glutaraldehyde (w/v) for at least 2-3 hours. The strips were then washed three times with MQ water. Here after, samples were stained with 1% osmium in water for 15 min, and dehydrated through a series of ethanol/water mixtures with increasing ethanol content (10, 30, 50, 70, 90, 100%) for 10 min per treatment (twice with 100%) and then critical point dried.
Chapter 4
82
Anopore strips cultured with bacteria were glued on a sample holder with conductive carbon cement (Leit-C, Neubauer Chemicalien) and frozen in liquid nitrogen. Samples were transferred under vacuum to the dedicated cryo-preparation chamber (Oxford Cryo-system, CT 1500 HF) onto a sample stage at -90°C. The samples were freeze-dried for 4 min at -90°C in a 3x10⁻⁷ Pa vacuum to remove water vapor contamination. Subsequently, the sample surface was sputter-coated with 10 nm platinum, and it was transferred to the cold sample stage (-190°C) inside the Cryo-FESEM (JEOL 6300F Field Emission SEM) and subsequently analyzed with an accelerating voltage of 5 kV. Images were digitally recorded (Orion, E.L.I.). RESULTS Population dynamics of S. thermophilus and L. bulgaricus. To study the interaction of S. thermophilus and L. bulgaricus in milk growth and acid production in mono-cultures and in a mixed culture were compared (see Figure 2). While the L. bulgaricus mono-culture showed only one exponential phase, a typical 4 growth-phase behavior, following the lag phase, was observed in the S. thermophilus and the mixed cultures: (i) a first exponential phase, (ii) a transition phase at which the growth rate decreased, (iii) a second exponential phase, and (iv) a stationary phase (12, 24). Intervention studies. Several compounds are known or hypothesized to play a role in the interaction between the two yoghurt bacteria. We systematically analyzed the effect of these compounds on acidification and outgrowth in mono and mixed cultures. Therefore, mono and mixed cultures were prepared with single additions, a mixture of all components added, and all components with single omissions. The effects of these medium interventions on the evolution of pH were analyzed by scoring effect of key parameters of the acidification profile. That is, the maximal or minimal acidification rate in each growth phase (see Figure 2B) and the final pH. The final viable counts were also taken as measures for the paired comparisons (see Table 1). A higher cell count, lower final pH, higher acidification rate and a shorter time to reach this rate are considered stimulatory effect of the intervention compared to the control.
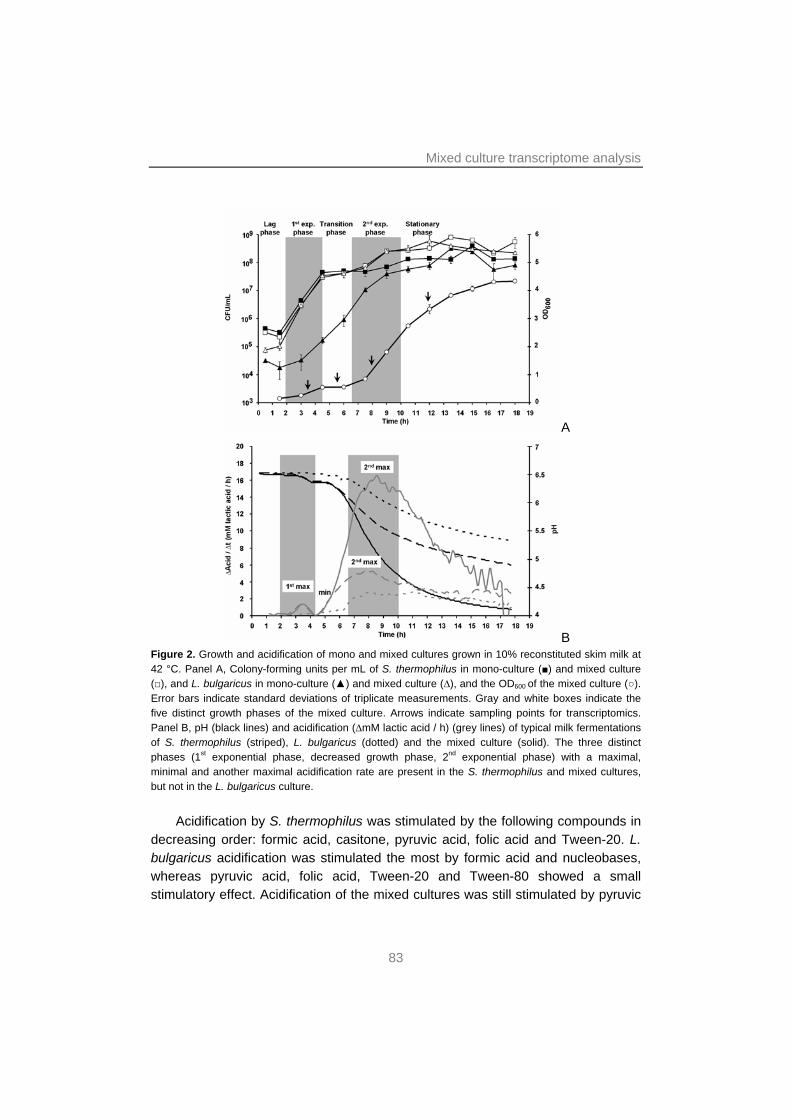
Mixed culture transcriptome analysis
83
A
B Figure 2. Growth and acidification of mono and mixed cultures grown in 10% reconstituted skim milk at 42 °C. Panel A, Colony-forming units per mL of S. thermophilus in mono-culture (■) and mixed culture (□), and L. bulgaricus in mono-culture (▲) and mixed culture (∆), and the OD600 of the mixed culture (○). Error bars indicate standard deviations of triplicate measurements. Gray and white boxes indicate the five distinct growth phases of the mixed culture. Arrows indicate sampling points for transcriptomics. Panel B, pH (black lines) and acidification (∆mM lactic acid / h) (grey lines) of typical milk fermentations of S. thermophilus (striped), L. bulgaricus (dotted) and the mixed culture (solid). The three distinct phases (1st exponential phase, decreased growth phase, 2nd exponential phase) with a maximal, minimal and another maximal acidification rate are present in the S. thermophilus and mixed cultures, but not in the L. bulgaricus culture.
Acidification by S. thermophilus was stimulated by the following compounds in
decreasing order: formic acid, casitone, pyruvic acid, folic acid and Tween-20. L. bulgaricus acidification was stimulated the most by formic acid and nucleobases, whereas pyruvic acid, folic acid, Tween-20 and Tween-80 showed a small stimulatory effect. Acidification of the mixed cultures was still stimulated by pyruvic
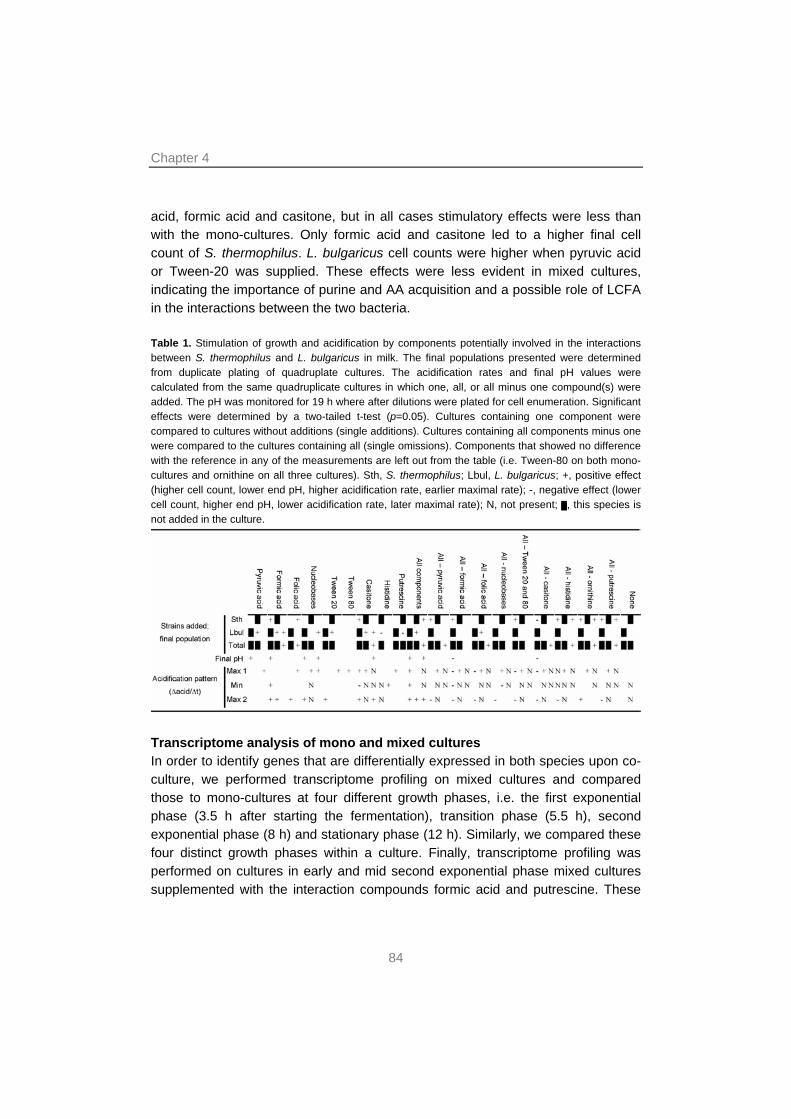
Chapter 4
84
acid, formic acid and casitone, but in all cases stimulatory effects were less than with the mono-cultures. Only formic acid and casitone led to a higher final cell count of S. thermophilus. L. bulgaricus cell counts were higher when pyruvic acid or Tween-20 was supplied. These effects were less evident in mixed cultures, indicating the importance of purine and AA acquisition and a possible role of LCFA in the interactions between the two bacteria. Table 1. Stimulation of growth and acidification by components potentially involved in the interactions between S. thermophilus and L. bulgaricus in milk. The final populations presented were determined from duplicate plating of quadruplate cultures. The acidification rates and final pH values were calculated from the same quadruplicate cultures in which one, all, or all minus one compound(s) were added. The pH was monitored for 19 h where after dilutions were plated for cell enumeration. Significant effects were determined by a two-tailed t-test (p=0.05). Cultures containing one component were compared to cultures without additions (single additions). Cultures containing all components minus one were compared to the cultures containing all (single omissions). Components that showed no difference with the reference in any of the measurements are left out from the table (i.e. Tween-80 on both mono-cultures and ornithine on all three cultures). Sth, S. thermophilus; Lbul, L. bulgaricus; +, positive effect (higher cell count, lower end pH, higher acidification rate, earlier maximal rate); -, negative effect (lower cell count, higher end pH, lower acidification rate, later maximal rate); N, not present; █, this species is not added in the culture.
Transcriptome analysis of mono and mixed cultures In order to identify genes that are differentially expressed in both species upon co-culture, we performed transcriptome profiling on mixed cultures and compared those to mono-cultures at four different growth phases, i.e. the first exponential phase (3.5 h after starting the fermentation), transition phase (5.5 h), second exponential phase (8 h) and stationary phase (12 h). Similarly, we compared these four distinct growth phases within a culture. Finally, transcriptome profiling was performed on cultures in early and mid second exponential phase mixed cultures supplemented with the interaction compounds formic acid and putrescine. These
Mixed culture transcriptome analysis
85
studies allowed analysis of global regulatory responses and the development of the interactions throughout the fermentation. DNA micro arrays were used that contained probes targeting strain-specific sequences ensuring minimal cross-hybridization for the genomes of both S. thermophilus CNRZ1066 and L. bulgaricus ATCC BAA-365. An RNA extraction method based on quenching by rapid freezing the culture and clarification by citrate was specifically designed for these experiments and proved to be crucial for the acquisition of high quality RNA samples from yoghurt cultures. Although we defined genes that were two-fold or more up or down-regulated with a FDR value of lower than 0.05 as significantly differentially expressed, also the more general effects were considered (e.g. all genes in a pathway are significantly upregulated by 1.5-fold).
Differential expression between mixed and mono-cultures was high in all four growth stages (see Table 2, Supplementary Tables 1 and 2 provide an overview of all significantly differentially expressed genes). The interactions affected S. thermophilus mainly in the second exponential phase (23% of all genes was more than 2-fold differentially expressed), which is in agreement with the observation that only at this growth phase S. thermophilus is profoundly stimulated by L. bulgaricus (see Figure 2A) (19). The major functional groups affected included ‘Amino acid transport and metabolism’ (15-42% of the genes in the category), ‘Inorganic ion transport and metabolism’ (14-32%) and ‘Nucleotide transport and metabolism’ (10-47%). The presence of S. thermophilus stimulates L. bulgaricus growth already in the early stages of the fermentation, which is exemplified by the higher portion of differentially expressed genes in L. bulgaricus in the two early growth phases compared to S. thermophilus (24% versus 7% in the transition phase). A major part of the differential expression in both species could be attributed to the increased growth rate as is exemplified by the induction of primary metabolism including the genes involved in the production of important end products such as diacetyl, contributing to the typical yoghurt flavor. Indeed, this compound was present in larger quantities in mixed culture than in mono-culture (see Table 3). The major affected functional groups related to interactions included ‘Amino acid transport and metabolism’ (21-36% of the genes in the category), ‘Inorganic ion transport and metabolism’ (20-28%) and ‘Nucleotide transport and metabolism’ (18-44%).
Below we will first describe the global physiological responses of both strains. Subsequently, regulatory responses for the major pathways affected will be described in more detail.
Chapter 4
86
Global regulatory responses analysis of L. bulgaricus. In the L. bulgaricus mono-culture there was little difference in gene expression between the different growth phases except that from 8 h on (growth slows down and the culture enters stationary phase, see Figure 2A) many pathways were down-regulated, especially those associated with the biosynthesis of folic acid, purines, LCFA and AA and genes related directly related to growth such as those encoding ribosomal proteins and enzymes involved in cell wall biosynthesis. In the mixed culture there was a clear lower expression of genes associated with folic acid and purine biosynthesis, LCFA biosynthesis and sulfur AA metabolism in the transition phase compared to the first exponential phase. This may be due to the lower growth rate in the transition phase. In the second exponential phase, however, expression of purine and LCFA biosynthesis genes remained at a low level despite the higher growth rate compared to the transition phase. Moreover, LBUL_0106, encoding 1-acyl-sn-glycerol-3-phosphate acyltransferase was expressed 13-fold higher, suggesting that this acyltransferase was loaded with LCFA harvested from the medium. In addition, genes involved in EPS and sulfur AA metabolism were higher expressed in the second exponential phase than in the transition phase.
Global regulatory responses in S. thermophilus. In the S. thermophilus
mono-culture, the gene pflA (4.6-fold) for the production of formic acid and the pathway for purine biosynthesis were higher expressed in the transition phase compared to the first exponential phase despite the lower growth rate. Similarly, BCAA import and production genes were 2.9-3.0-fold higher expressed in the transition phase suggesting a shortage of these AA relatively early in the fermentation. Expression of genes for the production of other AA was in general lower in the transition phase compared to the first exponential phase. There was little difference in the second exponential phase compared to the transition phase except the up regulation of sulfur AA metabolism, as was also described by Hervé-Jimenez et al. (20). The trends in differential expression between the first exponential phase and the transition phase were comparable in S. thermophilus in mixed culture and the mono-culture, except for the fact that the higher expression of BCAA acquisition genes did not occur in the mixed culture. In the second exponential phase in mixed culture, purine biosynthesis genes were lower expressed than in the transition phase, but many pathways involved in AA acquisition were higher expressed, especially those for BCAA (2-3.1-fold) and sulfur AA (2.2-61.5-fold) suggesting an increased requirement for these AA. In the stationary phase, growth-related pathways were lower expressed. It is noteworthy that EPS biosynthesis genes of S. thermophilus were significantly higher
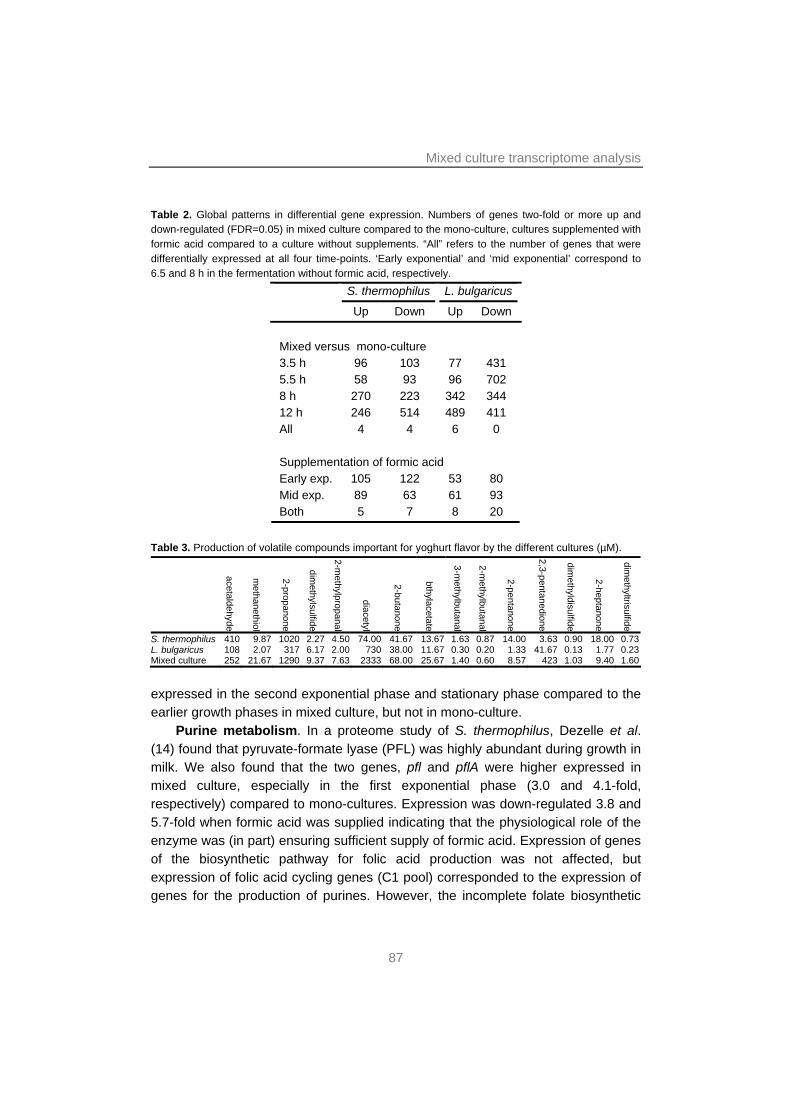
Mixed culture transcriptome analysis
87
Table 2. Global patterns in differential gene expression. Numbers of genes two-fold or more up and down-regulated (FDR=0.05) in mixed culture compared to the mono-culture, cultures supplemented with formic acid compared to a culture without supplements. “All” refers to the number of genes that were differentially expressed at all four time-points. ‘Early exponential’ and ‘mid exponential’ correspond to 6.5 and 8 h in the fermentation without formic acid, respectively.
S. thermophilus L. bulgaricus
Up Down Up Down Mixed versus mono-culture 3.5 h 96 103 77 431 5.5 h 58 93 96 702 8 h 270 223 342 344 12 h 246 514 489 411 All 4 4 6 0 Supplementation of formic acid Early exp. 105 122 53 80 Mid exp. 89 63 61 93 Both 5 7 8 20
Table 3. Production of volatile compounds important for yoghurt flavor by the different cultures (µM).
acetaldehyde
methanethiol
2-propanone
dimethylsulfide
2-methylpropanal
diacetyl
2-butanone
bthylacetate
3-methylbutanal
2-methylbutanal
2-pentanone
2,3-pentanedione
dimethyldisulfide
2-heptanone
dimethyltrisulfide
S. thermophilus 410 9.87 1020 2.27 4.50 74.00 41.67 13.67 1.63 0.87 14.00 3.63 0.90 18.00 0.73 L. bulgaricus 108 2.07 317 6.17 2.00 730 38.00 11.67 0.30 0.20 1.33 41.67 0.13 1.77 0.23 Mixed culture 252 21.67 1290 9.37 7.63 2333 68.00 25.67 1.40 0.60 8.57 423 1.03 9.40 1.60
expressed in the second exponential phase and stationary phase compared to the earlier growth phases in mixed culture, but not in mono-culture.
Purine metabolism. In a proteome study of S. thermophilus, Dezelle et al. (14) found that pyruvate-formate lyase (PFL) was highly abundant during growth in milk. We also found that the two genes, pfl and pflA were higher expressed in mixed culture, especially in the first exponential phase (3.0 and 4.1-fold, respectively) compared to mono-cultures. Expression was down-regulated 3.8 and 5.7-fold when formic acid was supplied indicating that the physiological role of the enzyme was (in part) ensuring sufficient supply of formic acid. Expression of genes of the biosynthetic pathway for folic acid production was not affected, but expression of folic acid cycling genes (C1 pool) corresponded to the expression of genes for the production of purines. However, the incomplete folate biosynthetic
Chapter 4
88
pathway in L. bulgaricus was lower expressed, especially at the first two growth stages. Genes in the purine biosynthesis pathway in S. thermophilus were higher expressed in the mixed culture in the two earlier growth stages, but, in accordance to the study by Hervé-Jimenez et al. (19), less expressed in the second exponential phase despite the higher growth rate. Similarly, purine metabolism in L. bulgaricus was lower expressed in mixed culture, especially after 5.5 h, potentially due to the lower growth rate in mixed culture at this phase (see Figure 2A). When formic acid was supplied, expression of genes involved in biosynthesis of purines and folic acid cycling was lower in the early (second) exponential phase but higher in the mid exponential phase in both species.
Amino acid and carbon dioxide metabolism. Interactions occur at the level of nitrogen metabolism (proteolysis (19) and carbon dioxide utilization(16)). Nitrogen metabolism was poorly affected in L. bulgaricus with few exceptions. In co-culture we observed considerable higher expression levels of the prtB gene, LBUL_1105, which was 8.9-fold higher expressed in the second exponential phase in co-culture. This can be explained by the fact that peptides generated upon casein hydrolysis by the protease are more rapidly consumed when S. thermophilus is also present. This demands higher protease activity to sustain growth of both bacteria. In addition, genes involved in the biosynthesis of the sulfur AA cysteine and methionine were highly upregulated in mixed culture, e.g. the gene that converts O-acetyl-L-serine into cysteine, LBUL_1235, was expressed 23.1-fold higher in the mixed culture during the second exponential phase (see Figure 3A). This indicates that the proteolysis of casein does not allow the supply of sufficient cysteine for both organisms. Indeed, the cysteine content of casein is only 0.35% (41). Moreover, the free methionine content of a milk culture is negligible and the free cysteine is rapidly consumed, i.e. cysteine does not accumulate in L. bulgaricus mono-culture and mixed culture, while several other AA do (for an overview, see Supplementary Table 1). In S. thermophilus, the higher peptide abundance due to the proteolysis executed by the protease that is produced by L. bulgaricus led to the upregulation of peptide import systems, such as the ABC transport system encoded by amiC, amiD, amiE and amiF1 (2.5-2.8-fold), and peptidolysis, as exemplified by the upregulation of the gene encoding peptidase PepN (2.4-fold) in the second exponential phase. In addition, genes encoding the biosynthesis of the three BCAA (2.0-fold) and uptake (1.0-1.3-fold) were slightly higher expressed in mixed culture. Similarly, in L. bulgaricus in mixed culture LBUL_0431, encoding a branched-chain amino acid permease, was 2.3-fold higher expressed during the second exponential phase. That was anticipated since especially the S. thermophilus mono-culture and the mixed culture displayed
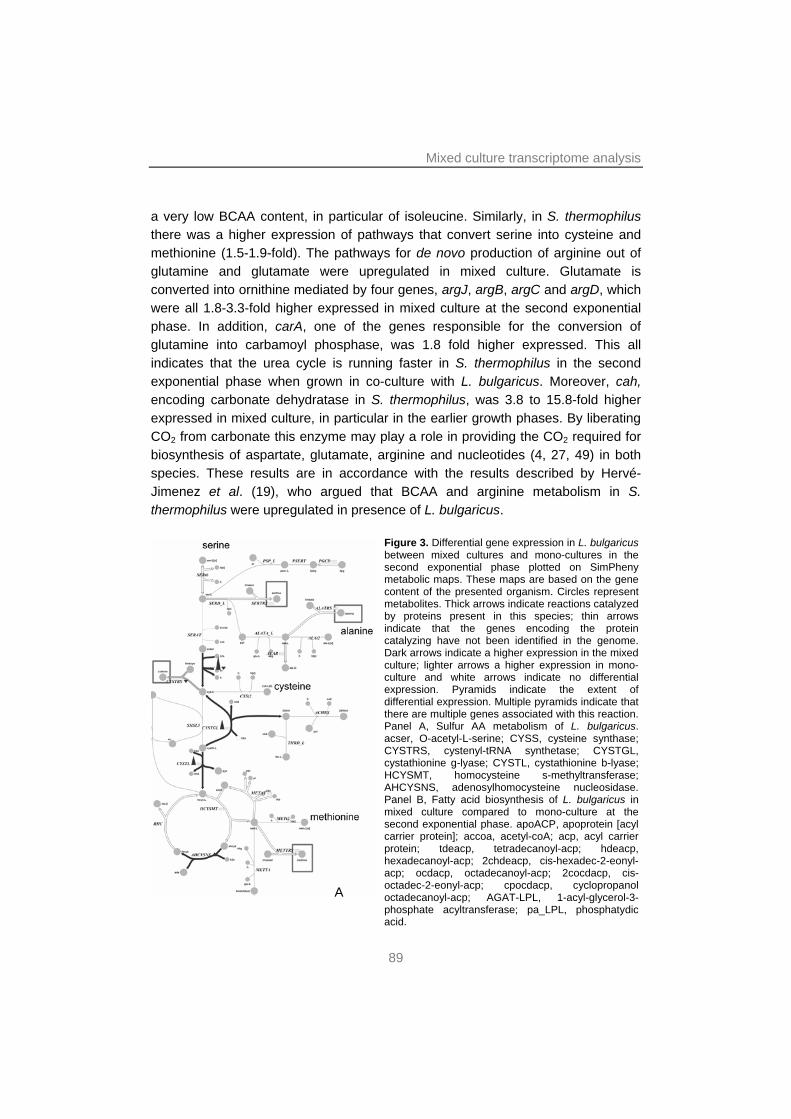
Mixed culture transcriptome analysis
89
a very low BCAA content, in particular of isoleucine. Similarly, in S. thermophilus there was a higher expression of pathways that convert serine into cysteine and methionine (1.5-1.9-fold). The pathways for de novo production of arginine out of glutamine and glutamate were upregulated in mixed culture. Glutamate is converted into ornithine mediated by four genes, argJ, argB, argC and argD, which were all 1.8-3.3-fold higher expressed in mixed culture at the second exponential phase. In addition, carA, one of the genes responsible for the conversion of glutamine into carbamoyl phosphase, was 1.8 fold higher expressed. This all indicates that the urea cycle is running faster in S. thermophilus in the second exponential phase when grown in co-culture with L. bulgaricus. Moreover, cah, encoding carbonate dehydratase in S. thermophilus, was 3.8 to 15.8-fold higher expressed in mixed culture, in particular in the earlier growth phases. By liberating CO2 from carbonate this enzyme may play a role in providing the CO2 required for biosynthesis of aspartate, glutamate, arginine and nucleotides (4, 27, 49) in both species. These results are in accordance with the results described by Hervé-Jimenez et al. (19), who argued that BCAA and arginine metabolism in S. thermophilus were upregulated in presence of L. bulgaricus.
Figure 3. Differential gene expression in L. bulgaricus between mixed cultures and mono-cultures in the second exponential phase plotted on SimPheny metabolic maps. These maps are based on the gene content of the presented organism. Circles represent metabolites. Thick arrows indicate reactions catalyzed by proteins present in this species; thin arrows indicate that the genes encoding the protein catalyzing have not been identified in the genome. Dark arrows indicate a higher expression in the mixed culture; lighter arrows a higher expression in mono-culture and white arrows indicate no differential expression. Pyramids indicate the extent of differential expression. Multiple pyramids indicate that there are multiple genes associated with this reaction. Panel A, Sulfur AA metabolism of L. bulgaricus. acser, O-acetyl-L-serine; CYSS, cysteine synthase; CYSTRS, cystenyl-tRNA synthetase; CYSTGL, cystathionine g-lyase; CYSTL, cystathionine b-lyase; HCYSMT, homocysteine s-methyltransferase; AHCYSNS, adenosylhomocysteine nucleosidase. Panel B, Fatty acid biosynthesis of L. bulgaricus in mixed culture compared to mono-culture at the second exponential phase. apoACP, apoprotein [acyl carrier protein]; accoa, acetyl-coA; acp, acyl carrier protein; tdeacp, tetradecanoyl-acp; hdeacp, hexadecanoyl-acp; 2chdeacp, cis-hexadec-2-eonyl-acp; ocdacp, octadecanoyl-acp; 2cocdacp, cis-octadec-2-eonyl-acp; cpocdacp, cyclopropanol octadecanoyl-acp; AGAT-LPL, 1-acyl-glycerol-3-phosphate acyltransferase; pa_LPL, phosphatydic acid.
A
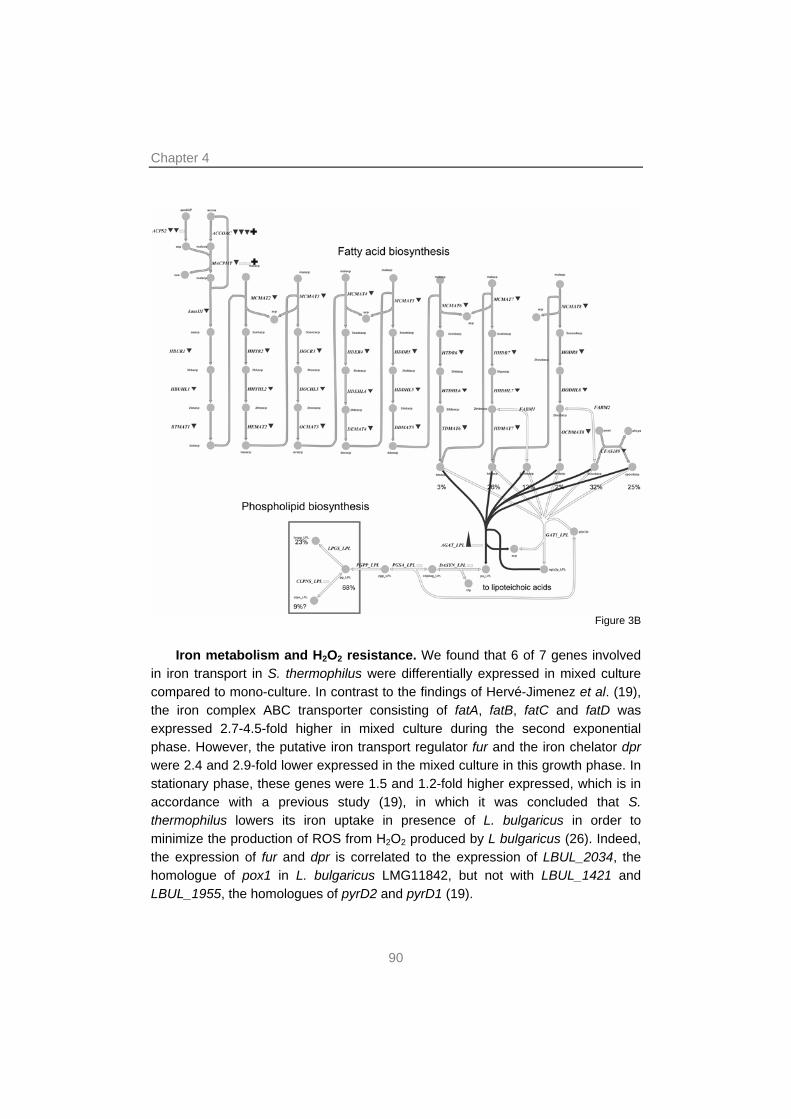
Chapter 4
90
Figure 3B
Iron metabolism and H2O2 resistance. We found that 6 of 7 genes involved in iron transport in S. thermophilus were differentially expressed in mixed culture compared to mono-culture. In contrast to the findings of Hervé-Jimenez et al. (19), the iron complex ABC transporter consisting of fatA, fatB, fatC and fatD was expressed 2.7-4.5-fold higher in mixed culture during the second exponential phase. However, the putative iron transport regulator fur and the iron chelator dpr were 2.4 and 2.9-fold lower expressed in the mixed culture in this growth phase. In stationary phase, these genes were 1.5 and 1.2-fold higher expressed, which is in accordance with a previous study (19), in which it was concluded that S. thermophilus lowers its iron uptake in presence of L. bulgaricus in order to minimize the production of ROS from H2O2 produced by L bulgaricus (26). Indeed, the expression of fur and dpr is correlated to the expression of LBUL_2034, the homologue of pox1 in L. bulgaricus LMG11842, but not with LBUL_1421 and LBUL_1955, the homologues of pyrD2 and pyrD1 (19).
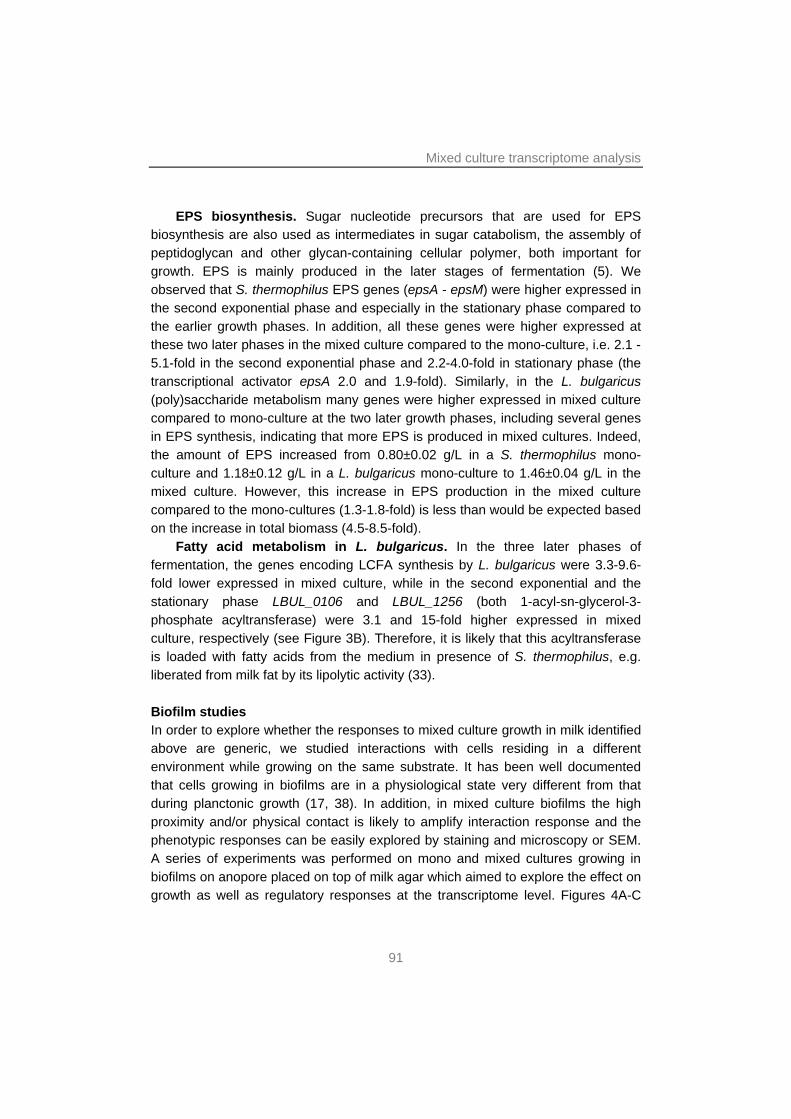
Mixed culture transcriptome analysis
91
EPS biosynthesis. Sugar nucleotide precursors that are used for EPS biosynthesis are also used as intermediates in sugar catabolism, the assembly of peptidoglycan and other glycan-containing cellular polymer, both important for growth. EPS is mainly produced in the later stages of fermentation (5). We observed that S. thermophilus EPS genes (epsA - epsM) were higher expressed in the second exponential phase and especially in the stationary phase compared to the earlier growth phases. In addition, all these genes were higher expressed at these two later phases in the mixed culture compared to the mono-culture, i.e. 2.1 - 5.1-fold in the second exponential phase and 2.2-4.0-fold in stationary phase (the transcriptional activator epsA 2.0 and 1.9-fold). Similarly, in the L. bulgaricus (poly)saccharide metabolism many genes were higher expressed in mixed culture compared to mono-culture at the two later growth phases, including several genes in EPS synthesis, indicating that more EPS is produced in mixed cultures. Indeed, the amount of EPS increased from 0.80±0.02 g/L in a S. thermophilus mono-culture and 1.18±0.12 g/L in a L. bulgaricus mono-culture to 1.46±0.04 g/L in the mixed culture. However, this increase in EPS production in the mixed culture compared to the mono-cultures (1.3-1.8-fold) is less than would be expected based on the increase in total biomass (4.5-8.5-fold).
Fatty acid metabolism in L. bulgaricus. In the three later phases of fermentation, the genes encoding LCFA synthesis by L. bulgaricus were 3.3-9.6-fold lower expressed in mixed culture, while in the second exponential and the stationary phase LBUL_0106 and LBUL_1256 (both 1-acyl-sn-glycerol-3-phosphate acyltransferase) were 3.1 and 15-fold higher expressed in mixed culture, respectively (see Figure 3B). Therefore, it is likely that this acyltransferase is loaded with fatty acids from the medium in presence of S. thermophilus, e.g. liberated from milk fat by its lipolytic activity (33). Biofilm studies In order to explore whether the responses to mixed culture growth in milk identified above are generic, we studied interactions with cells residing in a different environment while growing on the same substrate. It has been well documented that cells growing in biofilms are in a physiological state very different from that during planctonic growth (17, 38). In addition, in mixed culture biofilms the high proximity and/or physical contact is likely to amplify interaction response and the phenotypic responses can be easily explored by staining and microscopy or SEM. A series of experiments was performed on mono and mixed cultures growing in biofilms on anopore placed on top of milk agar which aimed to explore the effect on growth as well as regulatory responses at the transcriptome level. Figures 4A-C
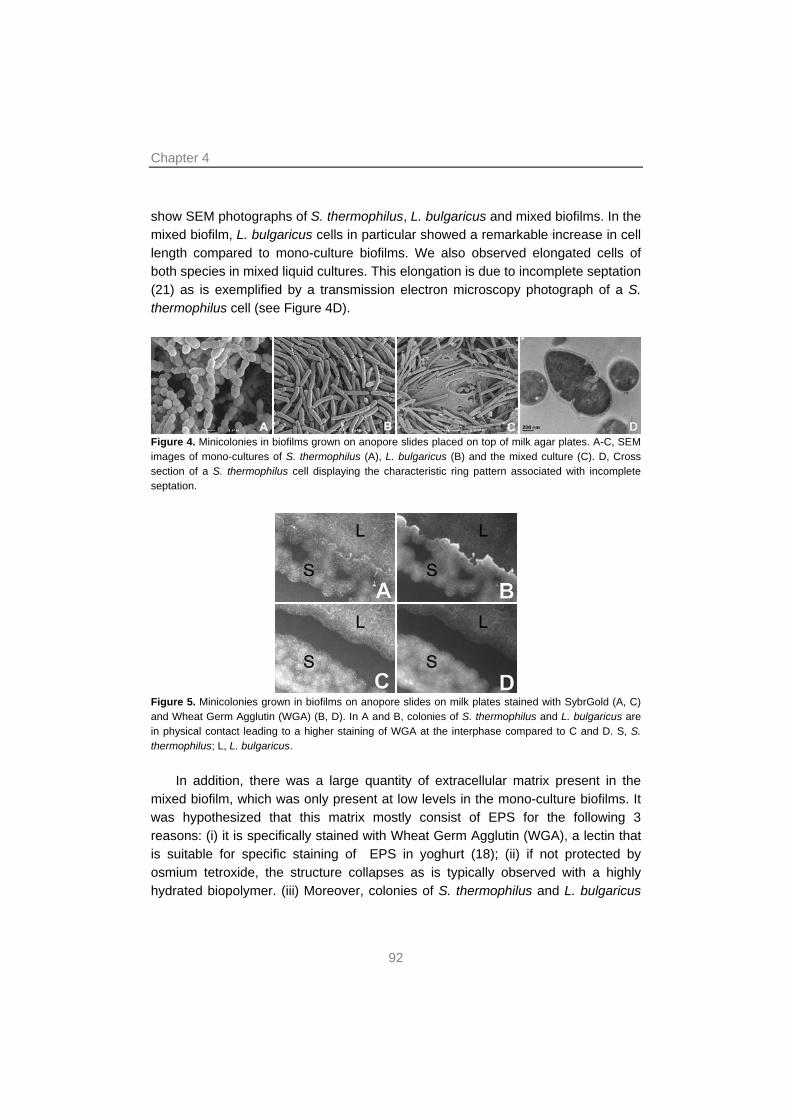
Chapter 4
92
show SEM photographs of S. thermophilus, L. bulgaricus and mixed biofilms. In the mixed biofilm, L. bulgaricus cells in particular showed a remarkable increase in cell length compared to mono-culture biofilms. We also observed elongated cells of both species in mixed liquid cultures. This elongation is due to incomplete septation (21) as is exemplified by a transmission electron microscopy photograph of a S. thermophilus cell (see Figure 4D).
Figure 4. Minicolonies in biofilms grown on anopore slides placed on top of milk agar plates. A-C, SEM images of mono-cultures of S. thermophilus (A), L. bulgaricus (B) and the mixed culture (C). D, Cross section of a S. thermophilus cell displaying the characteristic ring pattern associated with incomplete septation.
Figure 5. Minicolonies grown in biofilms on anopore slides on milk plates stained with SybrGold (A, C) and Wheat Germ Agglutin (WGA) (B, D). In A and B, colonies of S. thermophilus and L. bulgaricus are in physical contact leading to a higher staining of WGA at the interphase compared to C and D. S, S. thermophilus; L, L. bulgaricus.
In addition, there was a large quantity of extracellular matrix present in the
mixed biofilm, which was only present at low levels in the mono-culture biofilms. It was hypothesized that this matrix mostly consist of EPS for the following 3 reasons: (i) it is specifically stained with Wheat Germ Agglutin (WGA), a lectin that is suitable for specific staining of EPS in yoghurt (18); (ii) if not protected by osmium tetroxide, the structure collapses as is typically observed with a highly hydrated biopolymer. (iii) Moreover, colonies of S. thermophilus and L. bulgaricus
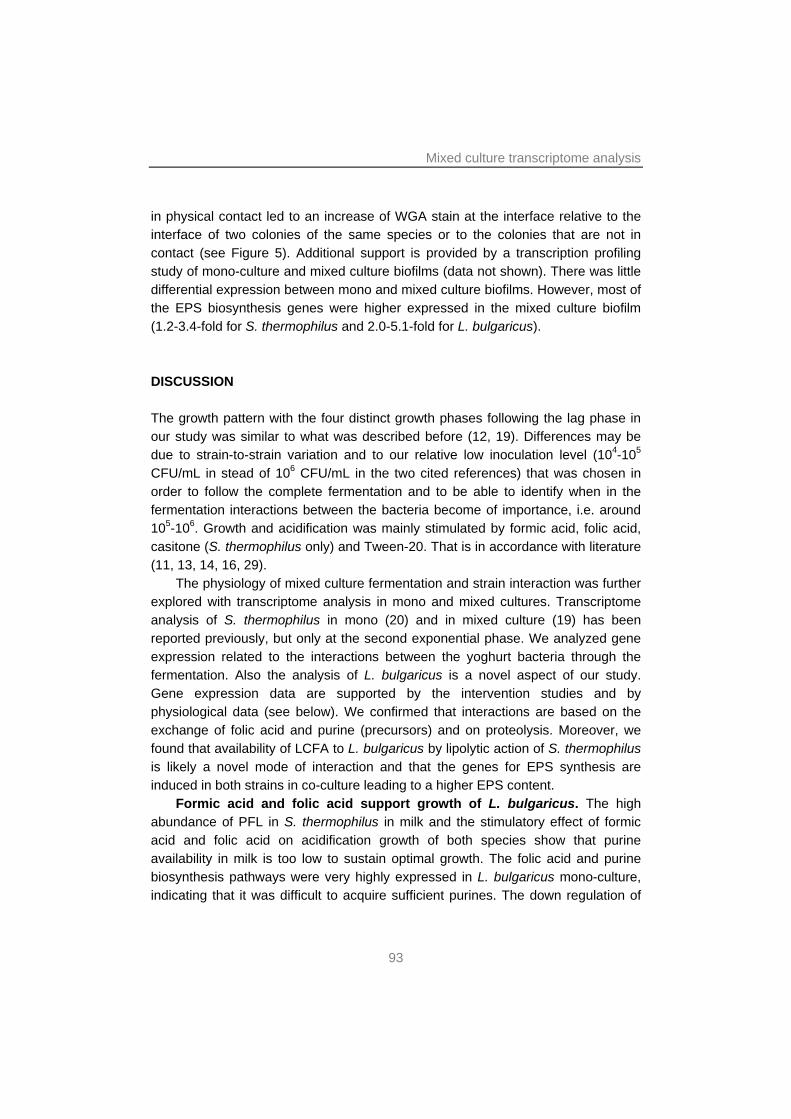
Mixed culture transcriptome analysis
93
in physical contact led to an increase of WGA stain at the interface relative to the interface of two colonies of the same species or to the colonies that are not in contact (see Figure 5). Additional support is provided by a transcription profiling study of mono-culture and mixed culture biofilms (data not shown). There was little differential expression between mono and mixed culture biofilms. However, most of the EPS biosynthesis genes were higher expressed in the mixed culture biofilm (1.2-3.4-fold for S. thermophilus and 2.0-5.1-fold for L. bulgaricus). DISCUSSION The growth pattern with the four distinct growth phases following the lag phase in our study was similar to what was described before (12, 19). Differences may be due to strain-to-strain variation and to our relative low inoculation level (104-105 CFU/mL in stead of 106 CFU/mL in the two cited references) that was chosen in order to follow the complete fermentation and to be able to identify when in the fermentation interactions between the bacteria become of importance, i.e. around 105-106. Growth and acidification was mainly stimulated by formic acid, folic acid, casitone (S. thermophilus only) and Tween-20. That is in accordance with literature (11, 13, 14, 16, 29).
The physiology of mixed culture fermentation and strain interaction was further explored with transcriptome analysis in mono and mixed cultures. Transcriptome analysis of S. thermophilus in mono (20) and in mixed culture (19) has been reported previously, but only at the second exponential phase. We analyzed gene expression related to the interactions between the yoghurt bacteria through the fermentation. Also the analysis of L. bulgaricus is a novel aspect of our study. Gene expression data are supported by the intervention studies and by physiological data (see below). We confirmed that interactions are based on the exchange of folic acid and purine (precursors) and on proteolysis. Moreover, we found that availability of LCFA to L. bulgaricus by lipolytic action of S. thermophilus is likely a novel mode of interaction and that the genes for EPS synthesis are induced in both strains in co-culture leading to a higher EPS content.
Formic acid and folic acid support growth of L. bulgaricus. The high abundance of PFL in S. thermophilus in milk and the stimulatory effect of formic acid and folic acid on acidification growth of both species show that purine availability in milk is too low to sustain optimal growth. The folic acid and purine biosynthesis pathways were very highly expressed in L. bulgaricus mono-culture, indicating that it was difficult to acquire sufficient purines. The down regulation of
Chapter 4
94
these pathways in combination with the up regulation of PFL and folic acid production in S. thermophilus show that formic acid and folic acid were indeed provided by S. thermophilus for L. bulgaricus. These two components support L. bulgaricus growth already during the first exponential phase. The stimulatory effect of nucleobases is evident as they are the end products of purine (and pyrimidine) metabolism.
Amino acid and carbon dioxide metabolism. The proteolytic activity of L. bulgaricus plays a key role in the co-fermentation of S. thermophilus and L. bulgaricus as is exemplified by the large stimulatory effect of addition of hydrolyzed casein to a S. thermophilus culture and the smaller effect to a mixed culture. L. bulgaricus has a very degraded AA synthesis system, which makes the bacterium highly dependent on its proteolytic activity when growing in milk (45) both in mono-culture and in mixed culture. That may explain the relatively small number of changes in the expression of AA biosynthetic genes between mono-culture and mixed culture. The cleavage of casein into peptides by PrtB and the higher expression of peptidases in S. thermophilus support higher growth rates of both species in mixed culture. However, the upregulation of BCAA (present 6-7% w/w in casein), arginine (4%) and cysteine (0.35%) biosynthesis pathways shows that the proteolysis by PrtB did not supply a sufficient amount of these AA, as they are relatively highly abundant in the predicted proteins of S. thermophilus (19) and L. bulgaricus (http://www.cbs.dtu.dk/services/GenomeAtlas) compared to their content in casein (41). It was reported before that sulfur AA become limiting for growth of S. thermophilus in the second exponential phase in mono-culture (20) and BCAA in mixed culture as well (19). Our study confirms this observation for S. thermophilus. In addition, cysteine and methionine biosynthesis were overexpressed by both organisms in mixed culture indicating a shortage of these AA in mixed culture. This may also explain why BCAA and sulfur AA pathways remained functional in L. bulgaricus unlike many other AA biosynthetic pathways. The up regulation of the urea cycle and carbonate dehydratase shows that CO2 production is stimulated in mixed culture which favors growth of L. bulgaricus (16).
Iron metabolism and H2O2 resistance. In stationary phase of the mixed culture, dpr and fur were higher expressed than in the S. thermophilus mono-culture. It was shown before that this relates to the expression of pyrD1 and pyrD2 and the concomitant production of H2O2 by L. bulgaricus LMG11842 (19). In our study differential expression of fur and dpr was comparable to the differential expression of pyruvate oxidase, LBUL_2034, in strain ATCC BAA-365. Thus, the intake of iron by S. thermophilus is negatively correlated to H2O2 production by L. bulgaricus, minimizing the damage caused by ROS.
Mixed culture transcriptome analysis
95
EPS biosynthesis increases upon co-culture. Previously, it was found that EPS production increases in the late exponential and stationary phase in fermentation in mono-culture as well as in mixed culture, but no induction of expression of EPS related genes was observed (20), contradicting our results. We clearly observed the upregulation of genes coding for EPS biosynthesis and secretion in both S. thermophilus and in L. bulgaricus in liquid mixed culture compared to mono-culture. This was confirmed in biofilm growth using polysaccharide staining, SEM and transcriptome profiling. The higher EPS synthesis may be a direct response to the lower pH in the mixed species systems, since low pH was shown to trigger EPS production by L. bulgaricus (31). To date, there has not been assigned a biological function for EPS production by these microbes in yoghurt, but it is not unlikely that EPS causes increased acid resistance (28) or facilitates exchange of metabolites by forcing close proximities or even physical contact between the two species, as is the case in kefir (8, 35).
In conclusion, we have performed a gene expression study of the whole
yoghurt system and provided evidence for the involvement of purine metabolism (formic acid and folic acid), proteolysis and LCFA in the interactions between the two consortium members. In addition, we showed that in mixed culture genes for EPS formation are induced leading to a higher EPS content of yoghurt. Finally, iron uptake by S. thermophilus is correlated to its growth rate, but decreased in the later stages of co-fermentation due to the increased production of H2O2 by L. bulgaricus. The stimulatory effect of pyruvic acid can be easily explained as this compound plays a central role in the primary metabolism and many other pathways but we found no evidence that the exchange of pyruvic acid is a mode of interaction. Putrescine and ornithine did not show any positive effect on acidification and outgrowth. Neither did we find any obvious differential regulation in transport or processing related to these two compounds between both mono-cultures and the mixed culture, nor any differential expression when putrescine was or was not added to the culture. However, it can not be excluded that there is exchange of these compounds despite the absence of regulatory responses at the RNA level.
Our study provides important information on the molecular basis of this mixed culture fermentation in an industrial or natural environment rather than a laboratory medium. These findings may help to understand other mixed culture systems and provide prospects for engineering interacting mixed cultures, for instance by introducing nutritional dependencies in dairy systems containing probiotics.
Chapter 4
96
ACKNOWLEDGEMENTS The authors want to thank Eline Klaassens for her work on biofilm transcriptomics. REFERENCES 1. Bachmann, H., Z. Kruijswijk, D. Molenaar, M. Kleerebezem, and J. E. T. Van Hylckama
Vlieg. 2009. A high throughput cheese manaufacturing model for effective cheese starter culture screening. Manuscript in preparation.
2. Baldi, P., and A. D. Long. 2001. A Bayesian framework for the analysis of microarray expression data: regularized t -test and statistical inferences of gene changes. Bioinformatics 17:509-519.
3. Bolotin, A., B. Quinquis, P. Renault, A. Sorokin, S. D. Ehrlich, S. Kulakauskas, A. Lapidus, E. Goltsman, M. Mazur, G. D. Pusch, M. Fonstein, R. Overbeek, N. Kyprides, B. Purnelle, D. Prozzi, K. Ngui, D. Masuy, F. Hancy, S. Burteau, M. Boutry, J. Delcour, A. Goffeau, and P. Hols. 2004. Complete sequence and comparative genome analysis of the dairy bacterium Streptococcus thermophilus. Nat Biotechnol 22:1554-1558.
4. Bringel, F., and J. C. Hubert. 2003. Extent of genetic lesions of the arginine and pyrimidine biosynthetic pathways in Lactobacillus plantarum, L. paraplantarum, L. pentosus, and L. casei: prevalence of CO(2)-dependent auxotrophs and characterization of deficient arg genes in L. plantarum. Appl Environ Microbiol 69:2674-2683.
5. Broadbent, J. R., D. J. McMahon, D. L. Welker, C. J. Oberg, and S. Moineau. 2003. Biochemistry, genetics, and applications of exopolysaccharide production in Streptococcus thermophilus: a review. J Dairy Sci 86:407-423.
6. Brouwer, R. W., S. A. F. T. van Hijum, and O. P. Kuipers. 2009. MINOMICS: visualizing prokaryote transcriptomics and proteomics data in a genomic context. Bioinformatics 25:139-140.
7. Chattopadhyay, M. K., C. W. Tabor, and H. Tabor. 2003. Polyamines protect Escherichia coli cells from the toxic effect of oxygen. Proc Natl Acad Sci U S A 100:2261-2265.
8. Cheirsilp, B., H. Shimizu, and S. Shioya. 2003. Enhanced kefiran production by mixed culture of Lactobacillus kefiranofaciens and Saccharomyces cerevisiae. J Biotechnol 100:43-53.
9. Chopard, M. A., M. Schmitt, E. Perreard, and J. F. Chamba. 2001. Aspect qualitatif de l’activité protéolytique des lactobacilles thermophiles utilisés en fabrication de fromage à pâte pressée cuite. Lait 81:183-194.
10. Churchill, G. A. 2002. Fundamentals of experimental design for cDNA microarrays. Nat Genet 32 Suppl:490-495.
11. Courtin, P., V. Monnet, and F. Rul. 2002. Cell-wall proteinases PrtS and PrtB have a different role in Streptococcus thermophilus/Lactobacillus bulgaricus mixed cultures in milk. Microbiology 148:3413-3421.
12. Courtin, P., and F. Rul. 2004. Interactions between microorganisms in a simple ecosystem: yogurt bacteria as a study model. Lait 84:125-134.
13. Crittenden, R. G., N. R. Martinez, and M. J. Playne. 2003. Synthesis and utilisation of folate by yoghurt starter cultures and probiotic bacteria. Int J Food Microbiol 80:217-222.
14. Derzelle, S., A. Bolotin, M. Y. Mistou, and F. Rul. 2005. Proteome analysis of Streptococcus thermophilus grown in milk reveals pyruvate formate-lyase as the major upregulated protein. Appl Environ Microbiol 71:8597-8605.
15. Donbrow, M., E. Azaz, and A. Pillersdorf. 1978. Autoxidation of polysorbates. J Pharm Sci 67:1676-1681.
16. Driessen, F. M., F. Kingma, and J. Stadhouders. 1982. Evidence that Lactobacillus bulgaricus in yoghurt is stimulated by carbon dioxide produced by Streptococcus thermophilus. Netherlands Milk and Dairy Journal 36:135-144.
Mixed culture transcriptome analysis
97
17. Egan, S., T. Thomas, and S. Kjelleberg. 2008. Unlocking the diversity and biotechnological potential of marine surface associated microbial communities. Curr Opin Microbiol 11:219-225.
18. Hassan, A. N., J. F. Frank, and K. B. Qvist. 2002. Direct observation of bacterial exopolysaccharides in dairy products using confocal scanning laser microscopy. J Dairy Sci 85:1705-1708.
19. Herve-Jimenez, L., I. Guillouard, E. Guedon, S. Boudebbouze, P. Hols, V. Monnet, E. Maguin, and F. Rul. 2008. Post-genomic analysis of Streptococcus thermophilus co-cultivated in milk with Lactobacillus delbrueckii ssp. bulgaricus: involvement of nitrogen, purine and iron metabolisms. Appl Environ Microbiol.
20. Herve-Jimenez, L., I. Guillouard, E. Guedon, C. Gautier, S. Boudebbouze, P. Hols, V. Monnet, F. Rul, and E. Maguin. 2008. Physiology of Streptococcus thermophilus during the late stage of milk fermentation with special regard to sulfur amino-acid metabolism. Proteomics 8:4273-4286.
21. Ingham, C. J., M. Beerthuyzen, and J. van Hylckama Vlieg. 2008. Population heterogeneity of Lactobacillus plantarum WCFS1 microcolonies in response to and recovery from acid stress. Appl Environ Microbiol 74:7750-7758.
22. Ingham, C. J., M. van den Ende, D. Pijnenburg, P. C. Wever, and P. M. Schneeberger. 2005. Growth and Multiplexed Analysis of Microorganisms on a Subdivided, Highly Porous, Inorganic Chip Manufactured from Anopore. Appl. Environ. Microbiol. 71:8978-8981.
23. Kerwin, B. A. 2008. Polysorbates 20 and 80 used in the formulation of protein biotherapeutics: structure and degradation pathways. J Pharm Sci 97:2924-2935.
24. Letort, C., M. Nardi, P. Garault, V. Monnet, and V. Juillard. 2002. Casein utilization by Streptococcus thermophilus results in a diauxic growth in milk. Appl Environ Microbiol 68:3162-3165.
25. Makarova, K., A. Slesarev, Y. Wolf, A. Sorokin, B. Mirkin, E. Koonin, A. Pavlov, N. Pavlova, V. Karamychev, N. Polouchine, V. Shakhova, I. Grigoriev, Y. Lou, D. Rohksar, S. Lucas, K. Huang, D. M. Goodstein, T. Hawkins, V. Plengvidhya, D. Welker, J. Hughes, Y. Goh, A. Benson, K. Baldwin, J. H. Lee, I. Diaz-Muniz, B. Dosti, V. Smeianov, W. Wechter, R. Barabote, G. Lorca, E. Altermann, R. Barrangou, B. Ganesan, Y. Xie, H. Rawsthorne, D. Tamir, C. Parker, F. Breidt, J. Broadbent, R. Hutkins, D. O'Sullivan, J. Steele, G. Unlu, M. Saier, T. Klaenhammer, P. Richardson, S. Kozyavkin, B. Weimer, and D. Mills. 2006. Comparative genomics of the lactic acid bacteria. Proc Natl Acad Sci U S A 103:15611-15616.
26. Marty-Teysset, C., F. de la Torre, and J. R. Garel. 2000. Increased Production of Hydrogen Peroxide by Lactobacillus delbrueckii subsp. bulgaricus upon Aeration: Involvement of an NADH Oxidase in Oxidative Stress. Appl. Environ. Microbiol. 66:262-267.
27. McFadden, B. A. 1973. Autotrophic CO2 assimilation and the evolution of ribulose diphosphate carboxylase. Bacteriol Rev 37:289-319.
28. Mozzi, F., E. Gerbino, G. Font de Valdez, and M. I. Torino. 2009. Functionality of exopolysaccharides produced by lactic acid bacteria in an in vitro gastric system. J Appl Microbiol 107:56-64.
29. Partanen, L., N. Marttinen, and T. Alatossava. 2001. Fats and fatty acids as growth factors for Lactobacillus delbrueckii. Syst Appl Microbiol 24:500-506.
30. Pastink, M. I., B. Teusink, P. Hols, S. Visser, W. M. de Vos, and J. Hugenholtz. 2009. Genome-scale model of Streptococcus thermophilus LMG18311 for metabolic comparison of lactic acid bacteria. Appl Environ Microbiol 75:3627-3633.
31. Petry, S., S. Furlan, M. J. Crepeau, J. Cerning, and M. Desmazeaud. 2000. Factors affecting exocellular polysaccharide production by Lactobacillus delbrueckii subsp. bulgaricus grown in a chemically defined medium. Appl Environ Microbiol 66:3427-3431.
32. Pieterse, B., R. H. Jellema, and M. J. van der Werf. 2006. Quenching of microbial samples for increased reliability of microarray data. J Microbiol Methods 64:207-216.
33. Rao, D. R., and J. C. Reddy. 1984. Effects of Lactic Fermentation of Milk on Milk Lipids. Journal of Food Science 49:748-750.
34. Savijoki, K., H. Ingmer, and P. Varmanen. 2006. Proteolytic systems of lactic acid bacteria. Appl Microbiol Biotechnol.
Chapter 4
98
35. Sieuwerts, S., F. A. M. de Bok, J. Hugenholtz, and J. E. T. van Hylckama Vlieg. 2008. Unraveling microbial interactions in food fermentations: from classical to genomics approaches. Appl Environ Microbiol 74:4997-5007.
36. Sieuwerts, S., F. A. M. de Bok, E. Mols, W. M. de Vos, and J. E. T. van Hylckama Vlieg. 2008. A simple and fast method for determining colony forming units. Lett Appl Microbiol 47:275-278.
37. Siezen, R. J. 1999. Multi-domain, cell-envelope proteinases of lactic acid bacteria. Antonie Van Leeuwenhoek 76:139-155.
38. Spormann, A. M. 2008. Physiology of microbes in biofilms. Curr Top Microbiol Immunol 322:17-36.
39. Stevens, M. J., A. Wiersma, W. M. de Vos, O. P. Kuipers, E. J. Smid, D. Molenaar, and M. Kleerebezem. 2008. Improvement of Lactobacillus plantarum aerobic growth as directed by comprehensive transcriptome analysis. Appl Environ Microbiol 74:4776-4778.
40. Stevens, M. J. A. 2008. Transcriptome response of Lactobacillus plantarum to global regulator deficiency, stress and other environmental conditions. Wageningen University, Wageningen, The Netherlands.
41. Sundararajan, T. A., and P. S. Sarma. 1957. Preparation and amino acid composition of enzymically dephosphorylated casein. Biochem J 65:261-266.
42. Sybesma, W., M. Starrenburg, L. Tijsseling, M. H. Hoefnagel, and J. Hugenholtz. 2003. Effects of cultivation conditions on folate production by lactic acid bacteria. Appl Environ Microbiol 69:4542-4548.
43. Tamime, A. Y., and H. C. Deeth. 1980. Yogurt - technology and biochemistry Journal of Food Protection 43:939-977.
44. Teusink, B., F. H. van Enckevort, C. Francke, A. Wiersma, A. Wegkamp, E. J. Smid, and R. J. Siezen. 2005. In silico reconstruction of the metabolic pathways of Lactobacillus plantarum: comparing predictions of nutrient requirements with those from growth experiments. Appl Environ Microbiol 71:7253-7262.
45. van de Guchte, M., S. Penaud, C. Grimaldi, V. Barbe, K. Bryson, P. Nicolas, C. Robert, S. Oztas, S. Mangenot, A. Couloux, V. Loux, R. Dervyn, R. Bossy, A. Bolotin, J. M. Batto, T. Walunas, J. F. Gibrat, P. Bessieres, J. Weissenbach, S. D. Ehrlich, and E. Maguin. 2006. The complete genome sequence of Lactobacillus bulgaricus reveals extensive and ongoing reductive evolution. Proc Natl Acad Sci U S A 103:9274-9279.
46. van Hijum, S. A., J. Garcia de la Nava, O. Trelles, J. Kok, and O. P. Kuipers. 2003. MicroPreP: a cDNA microarray data pre-processing framework. Appl Bioinformatics 2:241-244.
47. van Hijum, S. A. F. T., R. J. Baerends, A. L. Zomer, H. A. Karsens, V. Martin-Requena, O. Trelles, J. Kok, and O. P. Kuipers. 2008. Supervised Lowess normalization of comparative genome hybridization data--application to lactococcal strain comparisons. BMC Bioinformatics 9:93.
48. van Hijum, S. A. F. T., A. de Jong, R. J. Baerends, H. A. Karsens, N. E. Kramer, R. Larsen, C. D. den Hengst, C. J. Albers, J. Kok, and O. P. Kuipers. 2005. A generally applicable validation scheme for the assessment of factors involved in reproducibility and quality of DNA-microarray data. BMC Genomics 6:77.
49. Wang, H., W. Yu, T. Coolbear, D. O'Sullivan, and L. L. McKay. 1998. A deficiency in aspartate biosynthesis in Lactococcus lactis subsp. lactis C2 causes slow milk coagulation. Appl Environ Microbiol 64:1673-1679.
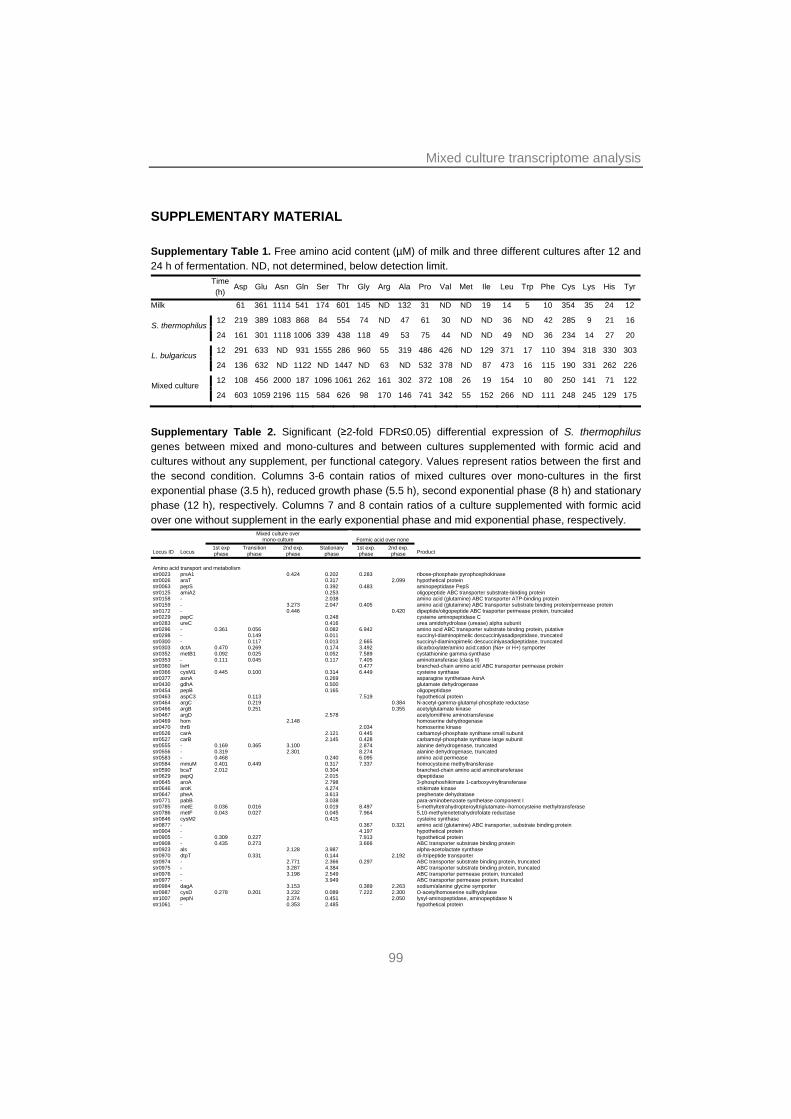
Mixed culture transcriptome analysis
99
SUPPLEMENTARY MATERIAL Supplementary Table 1. Free amino acid content (µM) of milk and three different cultures after 12 and 24 h of fermentation. ND, not determined, below detection limit.
Time (h)
Asp Glu Asn Gln Ser Thr Gly Arg Ala Pro Val Met Ile Leu Trp Phe Cys Lys His Tyr
Milk 61 361 1114 541 174 601 145 ND 132 31 ND ND 19 14 5 10 354 35 24 12
12 219 389 1083 868 84 554 74 ND 47 61 30 ND ND 36 ND 42 285 9 21 16 S. thermophilus
24 161 301 1118 1006 339 438 118 49 53 75 44 ND ND 49 ND 36 234 14 27 20
12 291 633 ND 931 1555 286 960 55 319 486 426 ND 129 371 17 110 394 318 330 303 L. bulgaricus
24 136 632 ND 1122 ND 1447 ND 63 ND 532 378 ND 87 473 16 115 190 331 262 226
12 108 456 2000 187 1096 1061 262 161 302 372 108 26 19 154 10 80 250 141 71 122 Mixed culture
24 603 1059 2196 115 584 626 98 170 146 741 342 55 152 266 ND 111 248 245 129 175
Supplementary Table 2. Significant (≥2-fold FDR≤0.05) differential expression of S. thermophilus genes between mixed and mono-cultures and between cultures supplemented with formic acid and cultures without any supplement, per functional category. Values represent ratios between the first and the second condition. Columns 3-6 contain ratios of mixed cultures over mono-cultures in the first exponential phase (3.5 h), reduced growth phase (5.5 h), second exponential phase (8 h) and stationary phase (12 h), respectively. Columns 7 and 8 contain ratios of a culture supplemented with formic acid over one without supplement in the early exponential phase and mid exponential phase, respectively.
Mixed culture over mono-culture Formic acid over none
Locus ID Locus 1st exp phase
Transition phase
2nd exp. phase
Stationary phase
1st exp. phase
2nd exp. phase Product
Amino acid transport and metabolism str0023 prsA1 0.424 0.202 0.283 ribose-phosphate pyrophosphokinase str0026 araT 0.317 2.099 hypothetical protein str0063 pepS 0.392 0.483 aminopeptidase PepS str0125 amiA2 0.253 oligopeptide ABC transporter substrate-binding protein str0158 - 2.038 amino acid (glutamine) ABC transporter ATP-binding protein str0159 - 3.273 2.047 0.405 amino acid (glutamine) ABC transporter substrate binding protein/permease protein str0172 - 0.446 0.420 dipeptide/oligopeptide ABC trasporter permease protein, truncated str0229 pepC 0.248 cysteine aminopeptidase C str0283 ureC 0.416 urea amidohydrolase (urease) alpha subunit str0296 - 0.361 0.056 0.082 6.942 amino acid ABC transporter substrate binding protein, putative str0298 - 0.149 0.011 succinyl-diaminopimelic descuccinlyasadipeptidase, truncated str0300 - 0.117 0.013 2.665 succinyl-diaminopimelic descuccinlyasadipeptidase, truncated str0303 dctA 0.470 0.269 0.174 3.492 dicarboxylate/amino acid:cation (Na+ or H+) symporter str0352 metB1 0.092 0.025 0.052 7.589 cystathionine gamma-synthase str0353 - 0.111 0.045 0.117 7.405 aminotransferase (class II) str0360 livH 0.477 branched-chain amino acid ABC transporter permease protein str0366 cysM1 0.445 0.100 0.314 6.449 cysteine synthase str0377 asnA 0.269 asparagine synthetase AsnA str0430 gdhA 0.500 glutamate dehydrogenase str0454 pepB 0.165 oligopeptidase str0463 aspC3 0.113 7.519 hypothetical protein str0464 argC 0.219 0.384 N-acetyl-gamma-glutamyl-phosphate reductase str0466 argB 0.251 0.355 acetylglutamate kinase str0467 argD 2.578 acetylornithine aminotransferase str0469 hom 2.148 homoserine dehydrogenase str0470 thrB 2.034 homoserine kinase str0526 carA 2.121 0.445 carbamoyl-phosphate synthase small subunit str0527 carB 2.145 0.428 carbamoyl-phosphate synthase large subunit str0555 - 0.169 0.365 3.100 2.874 alanine dehydrogenase, truncated str0556 - 0.319 2.301 8.274 alanine dehydrogenase, truncated str0583 - 0.468 0.240 6.095 amino acid permease str0584 mmuM 0.401 0.449 0.317 7.337 homocysteine methyltransferase str0590 bcaT 2.012 0.304 branched-chain amino acid aminotransferase str0629 pepQ 2.015 dipeptidase str0645 aroA 2.798 3-phosphoshikimate 1-carboxyvinyltransferase str0646 aroK 4.274 shikimate kinase str0647 pheA 3.613 prephenate dehydratase str0771 pabB 3.038 para-aminobenzoate synthetase component I str0785 metE 0.036 0.016 0.019 8.497 5-methyltetrahydropteroyltriglutamate--homocysteine methyltransferase str0786 metF 0.043 0.027 0.045 7.964 5,10-methylenetetrahydrofolate reductase str0846 cysM2 0.415 cysteine synthase str0877 - 0.367 0.321 amino acid (glutamine) ABC transporter, substrate binding protein str0904 - 4.197 hypothetical protein str0905 - 0.309 0.227 7.913 hypothetical protein str0908 - 0.435 0.273 3.666 ABC transporter substrate binding protein str0923 als 2.128 3.987 alpha-acetolactate synthase str0970 dtpT 0.331 0.144 2.192 di-/tripeptide transporter str0974 - 2.771 2.366 0.297 ABC transporter substrate binding protein, truncated str0975 - 3.287 4.384 ABC transporter substrate binding protein, truncated str0976 - 3.198 2.549 ABC transporter permease protein, truncated str0977 - 3.949 ABC transporter permease protein, truncated str0984 dagA 3.153 0.389 2.263 sodium/alanine glycine symporter str0987 cysD 0.278 0.201 3.232 0.089 7.222 2.300 O-acetylhomoserine sulfhydrylase str1007 pepN 2.374 0.451 2.050 lysyl-aminopeptidase, aminopeptidase N str1061 - 0.353 2.485 hypothetical protein
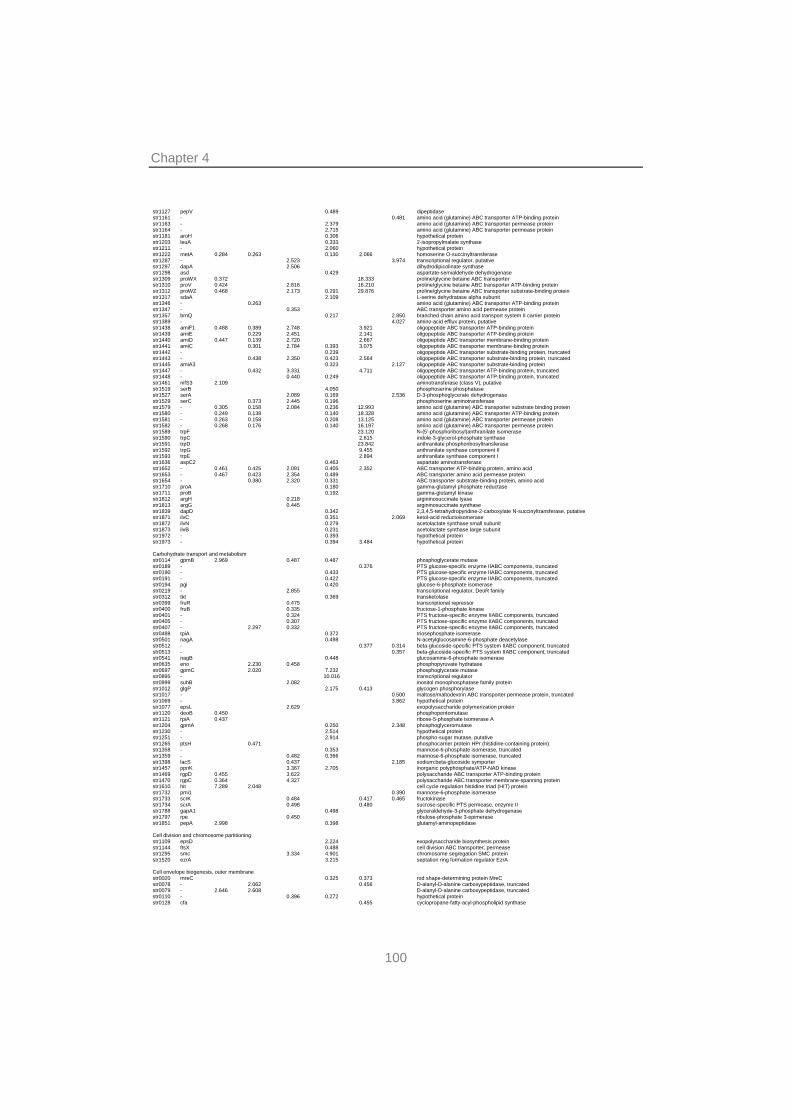
Chapter 4
100
str1127 pepV 0.489 dipeptidase str1161 - 0.481 amino acid (glutamine) ABC transporter ATP-binding protein str1163 - 2.379 amino acid (glutamine) ABC transporter permease protein str1164 - 2.715 amino acid (glutamine) ABC transporter permease protein str1181 aroH 0.306 hypothetical protein str1203 leuA 0.333 2-isopropylmalate synthase str1211 - 2.060 hypothetical protein str1222 metA 0.284 0.263 0.130 2.066 homoserine O-succinyltransferase str1287 - 2.523 3.974 transcriptional regulator, putative str1297 dapA 2.506 dihydrodipicolinate synthase str1298 asd 0.429 aspartate-semialdehyde dehydrogenase str1309 proWX 0.372 18.333 proline/glycine betaine ABC transporter str1310 proV 0.424 2.816 16.210 proline/glycine betaine ABC transporter ATP-binding protein str1312 proWZ 0.468 2.173 0.291 29.876 proline/glycine betaine ABC transporter substrate-binding protein str1317 sdaA 2.109 L-serine dehydratase alpha subunit str1346 - 0.263 amino acid (glutamine) ABC transporter ATP-binding protein str1347 - 0.353 ABC transporter amino acid permease protein str1357 brnQ 0.217 2.850 branched chain amino acid transport system II carrier protein str1389 - 4.027 amino-acid efflux protein, putative str1438 amiF1 0.488 0.389 2.748 3.921 oligopeptide ABC transporter ATP-binding protein str1439 amiE 0.229 2.451 2.141 oligopeptide ABC transporter ATP-binding protein str1440 amiD 0.447 0.139 2.720 2.667 oligopeptide ABC transporter membrane-binding protein str1441 amiC 0.301 2.784 0.393 3.075 oligopeptide ABC transporter membrane-binding protein str1442 - 0.239 oligopeptide ABC transporter substrate-binding protein, truncated str1443 - 0.438 2.350 0.423 2.564 oligopeptide ABC transporter substrate-binding protein, truncated str1445 amiA3 0.323 2.127 oligopeptide ABC transporter substrate-binding protein str1447 - 0.432 3.331 4.711 oligopeptide ABC transporter ATP-binding protein, truncated str1448 - 0.440 0.249 oligopeptide ABC transporter ATP-binding protein, truncated str1461 nifS3 2.109 aminotransferase (class V), putative str1519 serB 4.050 phosphoserine phosphatase str1527 serA 2.089 0.169 2.536 D-3-phosphoglycerate dehydrogenase str1529 serC 0.373 2.445 0.196 phosphoserine aminotransferase str1579 - 0.305 0.158 2.084 0.236 12.993 amino acid (glutamine) ABC transporter substrate binding protein str1580 - 0.249 0.138 0.140 18.328 amino acid (glutamine) ABC transporter ATP-binding protein str1581 - 0.263 0.158 0.208 13.125 amino acid (glutamine) ABC transporter permease protein str1582 - 0.268 0.176 0.140 16.197 amino acid (glutamine) ABC transporter permease protein str1589 trpF 23.120 N-(5'-phosphoribosyl)anthranilate isomerase str1590 trpC 2.615 indole-3-glycerol-phosphate synthase str1591 trpD 23.842 anthranilate phosphoribosyltransferase str1592 trpG 9.455 anthranilate synthase component II str1593 trpE 2.894 anthranilate synthase component I str1636 aspC2 0.463 aspartate aminotransferase str1652 - 0.461 0.425 2.091 0.405 2.352 ABC transporter ATP-binding protein, amino acid str1653 - 0.467 0.423 2.354 0.489 ABC transporter amino acid permease protein str1654 - 0.380 2.320 0.331 ABC transporter substrate-binding protein, amino acid str1710 proA 0.180 gamma-glutamyl phosphate reductase str1711 proB 0.192 gamma-glutamyl kinase str1812 argH 0.218 argininosuccinate lyase str1813 argG 0.445 argininosuccinate synthase str1839 dapD 0.342 2,3,4,5-tetrahydropyridine-2-carboxylate N-succinyltransferase, putative str1871 ilvC 0.351 2.069 ketol-acid reductoisomerase str1872 ilvN 0.279 acetolactate synthase small subunit str1873 ilvB 0.231 acetolactate synthase large subunit str1972 - 0.393 hypothetical protein str1973 - 0.394 3.484 hypothetical protein Carbohydrate transport and metabolism str0114 gpmB 2.969 0.487 0.487 phosphoglycerate mutase str0189 - 0.376 PTS glucose-specific enzyme IIABC components, truncated str0190 - 0.433 PTS glucose-specific enzyme IIABC components, truncated str0191 - 0.422 PTS glucose-specific enzyme IIABC components, truncated str0194 pgi 0.420 glucose-6-phosphate isomerase str0219 - 2.855 transcriptional regulator, DeoR family str0312 tkt 0.369 transketolase str0399 fruR 0.475 transcriptional repressor str0400 fruB 0.335 fructose-1-phosphate kinase str0401 - 0.324 PTS fructose-specific enzyme IIABC components, truncated str0405 - 0.307 PTS fructose-specific enzyme IIABC components, truncated str0407 - 2.297 0.332 PTS fructose-specific enzyme IIABC components, truncated str0488 tpiA 0.372 triosephosphate isomerase str0501 nagA 0.498 N-acetylglucosamine-6-phosphate deacetylase str0512 - 0.377 0.314 beta-glucoside-specific PTS system IIABC component, truncated str0513 - 0.357 beta-glucoside-specific PTS system IIABC component, truncated str0541 nagB 0.448 glucosamine-6-phosphate isomerase str0635 eno 2.230 0.458 phosphopyruvate hydratase str0697 gpmC 2.020 7.232 phosphoglycerate mutase str0895 - 10.016 transcriptional regulator str0999 suhB 2.082 inositol monophosphatase family protein str1012 glgP 2.175 0.413 glycogen phosphorylase str1017 - 0.500 maltose/maltodextrin ABC transporter permease protein, truncated str1069 - 3.862 hypothetical protein str1077 epsL 2.629 exopolysaccharide polymerization protein str1120 deoB 0.450 phosphopentomutase str1121 rpiA 0.437 ribose-5-phosphate isomerase A str1204 gpmA 0.250 2.348 phosphoglyceromutase str1230 - 2.514 hypothetical protein str1251 - 2.914 phospho-sugar mutase, putative str1265 ptsH 0.471 phosphocarrier protein HPr (histidine-containing protein) str1358 - 0.353 mannose-6-phosphate isomerase, truncated str1359 - 0.482 0.366 mannose-6-phosphate isomerase, truncated str1398 lacS 0.437 2.185 sodium:beta-glucoside symporter str1457 ppnK 3.367 2.705 inorganic polyphosphate/ATP-NAD kinase str1469 rgpD 0.455 3.622 polysaccharide ABC transporter ATP-binding protein str1470 rgpC 0.364 4.327 polysaccharide ABC transporter membrane-spanning protein str1610 hit 7.289 2.048 cell cycle regulation histidine triad (HIT) protein str1732 pmi1 0.390 mannose-6-phosphate isomerase str1733 scrK 0.484 0.417 0.465 fructokinase str1734 scrA 0.498 0.480 sucrose-specific PTS permease, enzyme II str1788 gapA1 0.498 glyceraldehyde-3-phosphate dehydrogenase str1797 rpe 0.450 ribulose-phosphate 3-epimerase str1851 pepA 2.998 0.398 glutamyl-aminopeptidase Cell division and chromosome partitioning str1109 epsD 2.224 exopolysaccharide biosynthesis protein str1144 ftsX 0.488 cell division ABC transporter, permease str1295 smc 3.334 4.901 chromosome segregation SMC protein str1520 ezrA 3.215 septation ring formation regulator EzrA Cell envelope biogenesis, outer membrane str0020 mreC 0.325 0.373 rod shape-determining protein MreC str0078 - 2.062 0.456 D-alanyl-D-alanine carboxypeptidase, truncated str0079 - 2.646 2.608 D-alanyl-D-alanine carboxypeptidase, truncated str0110 - 0.396 0.272 hypothetical protein str0128 cfa 0.455 cyclopropane-fatty-acyl-phospholipid synthase
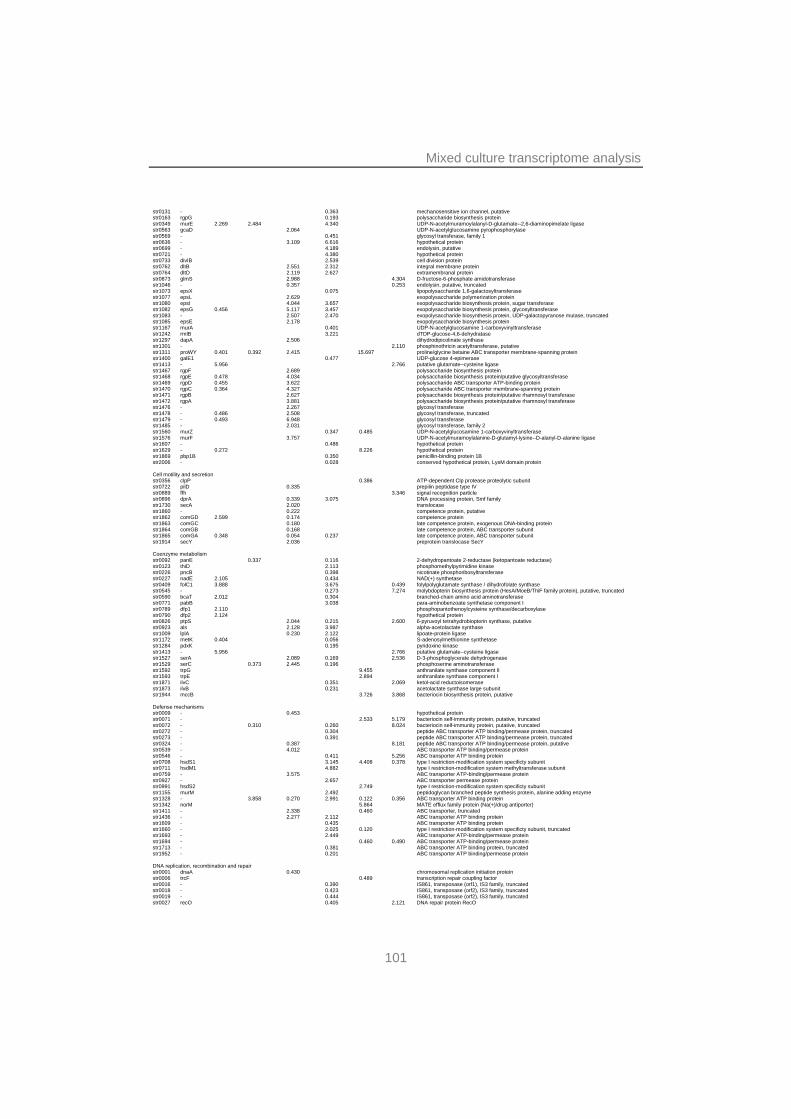
Mixed culture transcriptome analysis
101
str0131 - 0.363 mechanosensitive ion channel, putative str0163 rgpG 0.193 polysaccharide biosynthesis protein str0349 murE 2.269 2.484 4.340 UDP-N-acetylmuramoylalanyl-D-glutamate--2,6-diaminopimelate ligase str0563 gcaD 2.064 UDP-N-acetylglucosamine pyrophosphorylase str0569 - 0.451 glycosyl transferase, family 1 str0636 - 3.109 6.616 hypothetical protein str0699 - 4.189 endolysin, putative str0721 - 4.380 hypothetical protein str0733 divIB 2.539 cell division protein str0762 dltB 2.551 2.312 integral membrane protein str0764 dltD 2.119 2.627 extramembranal protein str0873 glmS 2.988 4.304 D-fructose-6-phosphate amidotransferase str1046 - 0.357 0.253 endolysin, putative, truncated str1073 epsX 0.075 lipopolysaccharide 1,6-galactosyltransferase str1077 epsL 2.629 exopolysaccharide polymerization protein str1080 epsI 4.044 3.657 exopolysaccharide biosynthesis protein, sugar transferase str1082 epsG 0.456 5.117 3.457 exopolysaccharide biosynthesis protein, glycosyltransferase str1083 - 2.507 2.470 exopolysaccharide biosynthesis protein, UDP-galactopyranose mutase, truncated str1085 epsE 2.178 exopolysaccharide biosynthesis protein str1167 murA 0.401 UDP-N-acetylglucosamine 1-carboxyvinyltransferase str1242 rmlB 3.221 dTDP-glucose-4,6-dehydratase str1297 dapA 2.506 dihydrodipicolinate synthase str1301 - 2.110 phosphinothricin acetyltransferase, putative str1311 proWY 0.401 0.392 2.415 15.697 proline/glycine betaine ABC transporter membrane-spanning protein str1400 galE1 0.477 UDP-glucose 4-epimerase str1413 - 5.956 2.766 putative glutamate--cysteine ligase str1467 rgpF 2.689 polysaccharide biosynthesis protein str1468 rgpE 0.478 4.034 polysaccharide biosynthesis protein/putative glycosyltransferase str1469 rgpD 0.455 3.622 polysaccharide ABC transporter ATP-binding protein str1470 rgpC 0.364 4.327 polysaccharide ABC transporter membrane-spanning protein str1471 rgpB 2.627 polysaccharide biosynthesis protein/putative rhamnosyl transferase str1472 rgpA 3.881 polysaccharide biosynthesis protein/putative rhamnosyl transferase str1476 - 2.267 glycosyl transferase str1478 - 0.486 2.508 glycosyl transferase, truncated str1479 - 0.493 6.948 glycosyl transferase str1485 - 2.031 glycosyl transferase, family 2 str1560 murZ 0.347 0.485 UDP-N-acetylglucosamine 1-carboxyvinyltransferase str1576 murF 3.757 UDP-N-acetylmuramoylalanine-D-glutamyl-lysine--D-alanyl-D-alanine ligase str1607 - 0.486 hypothetical protein str1629 - 0.272 8.226 hypothetical protein str1869 pbp1B 0.350 penicillin-binding protein 1B str2006 - 0.028 conserved hypothetical protein, LysM domain protein Cell motility and secretion str0356 clpP 0.386 ATP-dependent Clp protease proteolytic subunit str0722 pilD 0.335 prepilin peptidase type IV str0889 ffh 3.346 signal recognition particle str0896 dprA 0.339 3.075 DNA processing protein, Smf family str1730 secA 2.020 translocase str1860 - 0.222 competence protein, putative str1862 comGD 2.599 0.174 competence protein str1863 comGC 0.180 late competence protein, exogenous DNA-binding protein str1864 comGB 0.168 late competence protein, ABC transporter subunit str1865 comGA 0.348 0.054 0.237 late competence protein, ABC transporter subunit str1914 secY 2.036 preprotein translocase SecY Coenzyme metabolism str0092 panE 0.337 0.116 2-dehydropantoate 2-reductase (ketopantoate reductase) str0123 thiD 2.113 phosphomethylpyrimidine kinase str0226 pncB 0.398 nicotinate phosphoribosyltransferase str0227 nadE 2.105 0.434 NAD(+) synthetase str0409 folC1 3.888 3.675 0.439 folylpolyglutamate synthase / dihydrofolate synthase str0545 - 0.273 7.274 molybdopterin biosynthesis protein (HesA/MoeB/ThiF family protein), putative, truncated str0590 bcaT 2.012 0.304 branched-chain amino acid aminotransferase str0771 pabB 3.038 para-aminobenzoate synthetase component I str0789 dfp1 2.110 phosphopantothenoylcysteine synthase/decarboxylase str0790 dfp2 2.124 hypothetical protein str0826 ptpS 2.044 0.215 2.600 6-pyruvoyl tetrahydrobiopterin synthase, putative str0923 als 2.128 3.987 alpha-acetolactate synthase str1009 lplA 0.230 2.122 lipoate-protein ligase str1172 metK 0.404 0.056 S-adenosylmethionine synthetase str1284 pdxK 0.195 pyridoxine kinase str1413 - 5.956 2.766 putative glutamate--cysteine ligase str1527 serA 2.089 0.169 2.536 D-3-phosphoglycerate dehydrogenase str1529 serC 0.373 2.445 0.196 phosphoserine aminotransferase str1592 trpG 9.455 anthranilate synthase component II str1593 trpE 2.894 anthranilate synthase component I str1871 ilvC 0.351 2.069 ketol-acid reductoisomerase str1873 ilvB 0.231 acetolactate synthase large subunit str1944 mccB 3.726 3.868 bacteriocin biosynthesis protein, putative Defense mechanisms str0009 - 0.453 hypothetical protein str0071 - 2.533 5.179 bacteriocin self-immunity protein, putative, truncated str0072 - 0.310 0.260 8.024 bacteriocin self-immunity protein, putative, truncated str0272 - 0.304 peptide ABC transporter ATP binding/permease protein, truncated str0273 - 0.391 peptide ABC transporter ATP binding/permease protein, truncated str0324 - 0.387 8.181 peptide ABC transporter ATP binding/permease protein, putative str0539 - 4.012 ABC transporter ATP binding/permease protein str0546 - 0.411 5.256 ABC transporter ATP binding protein str0708 hsdS1 3.145 4.408 0.378 type I restriction-modification system specificty subunit str0711 hsdM1 4.882 type I restriction-modification system methyltransferase subunit str0759 - 3.575 ABC transporter ATP-binding/permease protein str0927 - 2.657 ABC transporter permease protein str0991 hsdS2 2.749 type I restriction-modification system specificty subunit str1155 murM 2.492 peptidoglycan branched peptide synthesis protein, alanine adding enzyme str1328 - 3.858 0.270 2.991 0.122 0.356 ABC transporter ATP binding protein str1342 norM 5.864 MATE efflux family protein (Na(+)/drug antiporter) str1411 - 2.338 0.460 ABC transporter, truncated str1436 - 2.277 2.112 ABC transporter ATP binding protein str1609 - 0.435 ABC transporter ATP binding protein str1660 - 2.025 0.120 type I restriction-modification system specificty subunit, truncated str1693 - 2.449 ABC transporter ATP-binding/permease protein str1694 - 0.460 0.490 ABC transporter ATP-binding/permease protein str1713 - 0.381 ABC transporter ATP binding protein, truncated str1952 - 0.201 ABC transporter ATP binding/permease protein DNA replication, recombination and repair str0001 dnaA 0.430 chromosomal replication initiation protein str0006 trcF 0.489 transcription repair coupling factor str0016 - 0.390 IS861, transposase (orf1), IS3 family, truncated str0018 - 0.423 IS861, transposase (orf2), IS3 family, truncated str0019 - 0.444 IS861, transposase (orf2), IS3 family, truncated str0027 recO 0.405 2.121 DNA repair protein RecO
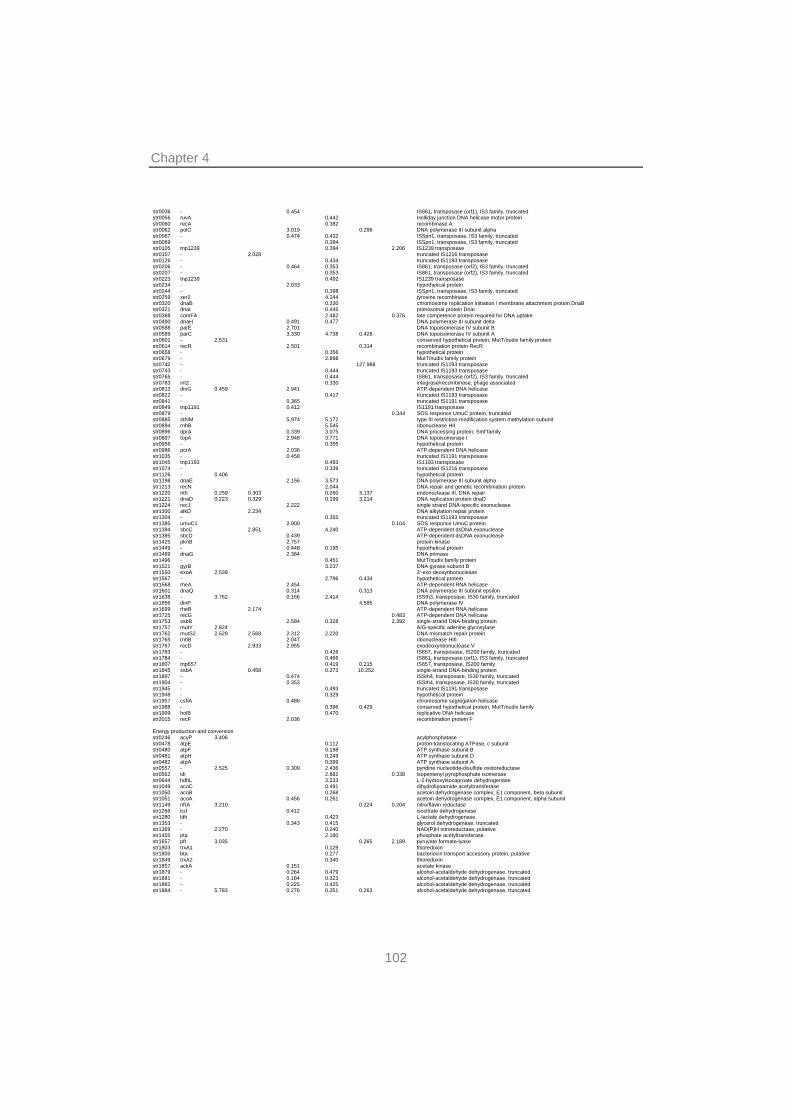
Chapter 4
102
str0036 - 0.454 IS861, transposase (orf1), IS3 family, truncated str0056 ruvA 0.442 Holliday junction DNA helicase motor protein str0060 recA 0.382 recombinase A str0062 polC 3.019 0.296 DNA polymerase III subunit alpha str0067 - 0.474 0.432 ISSpn1, transposase, IS3 family, truncated str0069 - 0.394 ISSpn1, transposase, IS3 family, truncated str0105 tnp1239 0.394 2.206 IS1239 transposase str0107 - 2.028 truncated IS1216 transposase str0126 - 0.434 truncated IS1193 transposase str0206 - 0.464 0.353 IS861, transposase (orf2), IS3 family, truncated str0207 - 0.353 IS861, transposase (orf2), IS3 family, truncated str0223 tnp1239 0.492 IS1239 transposase str0234 - 2.033 hypothetical protein str0244 - 0.398 ISSpn1, transposase, IS3 family, truncated str0259 xer2 4.244 tyrosine recombinase str0320 dnaB 0.330 chromosome replication initiation / membrane attachment protein DnaB str0321 dnaI 0.445 primosomal protein DnaI str0368 comFA 2.482 0.376 late competence protein required for DNA uptake str0490 dnaH 0.491 0.477 DNA polymerase III subunit delta str0588 parE 2.701 DNA topoisomerase IV subunit B str0589 parC 3.330 4.738 0.428 DNA topoisomerase IV subunit A str0601 - 2.531 conserved hypothetical protein, MutT/nudix family protein str0614 recR 2.501 0.314 recombination protein RecR str0658 - 0.356 hypothetical protein str0679 - 2.898 MutT/nudix family protein str0742 - 127.988 truncated IS1193 transposase str0743 - 0.444 truncated IS1193 transposase str0765 - 0.444 IS861, transposase (orf2), IS3 family, truncated str0783 int2 0.330 integrase/recombinase, phage associated str0813 dinG 0.459 2.941 ATP-dependent DNA helicase str0822 - 0.417 truncated IS1193 transposase str0841 - 0.365 truncated IS1191 transposase str0849 tnp1191 0.412 IS1191 transposase str0879 - 0.344 SOS responce UmuC protein, truncated str0885 sthIM 5.974 5.172 type III restriction-modification system methylation subunit str0894 rnhB 5.545 ribonuclease HII str0896 dprA 0.339 3.075 DNA processing protein, Smf family str0897 topA 2.948 3.771 DNA topoisomerase I str0956 - 0.355 hypothetical protein str0986 pcrA 2.036 ATP-dependent DNA helicase str1035 - 0.458 truncated IS1191 transposase str1045 tnp1193 0.493 IS1193 transposase str1074 - 0.339 truncated IS1216 transposase str1126 - 0.406 hypothetical protein str1198 dnaE 2.156 3.573 DNA polymerase III subunit alpha str1213 recN 2.044 DNA repair and genetic recombination protein str1220 nth 0.259 0.303 0.260 3.137 endonuclease III, DNA repair str1221 dnaD 0.223 0.329 0.199 3.214 DNA replication protein dnaD str1224 recJ 2.222 single strand DNA-specific exonuclease str1300 alkD 2.234 DNA alkylation repair protein str1304 - 0.355 truncated IS1193 transposase str1385 umuC1 2.900 0.104 SOS responce UmuC protein str1394 sbcC 2.851 4.240 ATP-dependent dsDNA exonuclease str1395 sbcD 0.439 ATP-dependent dsDNA exonuclease str1425 pknB 2.757 protein kinase str1449 - 0.448 0.195 hypothetical protein str1489 dnaG 2.384 DNA primase str1496 - 0.451 MutT/nudix family protein str1521 gyrB 3.237 DNA gyrase subunit B str1550 exoA 2.539 3'-exo-deoxyribonuclease str1567 - 2.796 0.434 hypothetical protein str1568 rheA 2.454 ATP-dependent RNA helicase str1601 dnaQ 0.314 0.313 DNA polymerase III subunit epsilon str1638 - 3.762 0.166 2.414 ISSth3, transposase, IS30 family, truncated str1656 dinP 4.585 DNA polymerase IV str1699 rheB 2.174 ATP-dependent RNA helicase str1725 recG 0.483 ATP-dependent DNA helicase str1753 ssbB 2.584 0.328 2.392 single-strand DNA-binding protein str1757 mutY 2.824 A/G-specific adenine glycosylase str1762 mutS2 2.529 2.568 2.312 2.220 DNA mismatch repair protein str1765 rnhB 2.047 ribonuclease HIII str1767 recD 2.933 2.955 exodeoxyribonuclease V str1783 - 0.426 IS657, transposase, IS200 family, truncated str1784 - 0.466 IS861, transposase (orf1), IS3 family, truncated str1807 tnp657 0.419 0.215 IS657, transposase, IS200 family str1845 ssbA 0.458 0.273 10.252 single-strand DNA-binding protein str1897 - 0.474 ISSth4, transposase, IS30 family, truncated str1904 - 0.353 ISSth4, transposase, IS30 family, truncated str1945 - 0.493 truncated IS1191 transposase str1948 - 0.329 hypothetical protein str1957 cshA 0.486 chromosome segregation helicase str1988 - 0.396 0.429 conserved hypothetical protein, MutT/nudix family str1999 holB 0.470 replicative DNA helicase str2015 recF 2.036 recombination protein F Energy production and conversion str0246 acyP 3.406 acylphosphatase str0478 atpE 0.112 proton-translocating ATPase, c subunit str0480 atpF 0.198 ATP synthase subunit B str0481 atpH 0.249 ATP synthase subunit D str0482 atpA 0.399 ATP synthase subunit A str0557 - 2.525 0.309 2.436 pyridine nucleotide-disulfide oxidoreductase str0562 idi 2.882 0.338 isopentenyl pyrophosphate isomerase str0644 hdhL 3.233 L-2-hydroxyisocaproate dehydrogenase str1049 acoC 0.491 dihydrolipoamide acetyltransferase str1050 acoB 0.268 acetoin dehydrogenase complex, E1 component, beta subunit str1051 acoA 0.456 0.261 acetoin dehydrogenase complex, E1 component, alpha subunit str1149 nfrA 3.210 0.224 0.204 nitro/flavin reductase str1266 icd 0.412 isocitrate dehydrogenase str1280 ldh 0.423 L-lactate dehydrogenase str1353 - 0.343 0.415 glycerol dehydrogenase, truncated str1369 - 2.270 0.240 NAD(P)H nitroreductase, putative str1455 pta 2.180 phosphate acetyltransferase str1657 pfl 3.035 0.265 2.189 pyruvate formate-lyase str1803 trxA1 0.129 thioredoxin str1805 bta 0.277 bacteriocin transport accessory protein, putative str1849 trxA2 0.340 thioredoxin str1857 ackA 0.151 acetate kinase str1879 - 0.264 0.479 alcohol-acetaldehyde dehydrogenase, truncated str1881 - 0.184 0.323 alcohol-acetaldehyde dehydrogenase, truncated str1882 - 0.225 0.425 alcohol-acetaldehyde dehydrogenase, truncated str1884 - 5.783 0.276 0.351 0.263 alcohol-acetaldehyde dehydrogenase, truncated
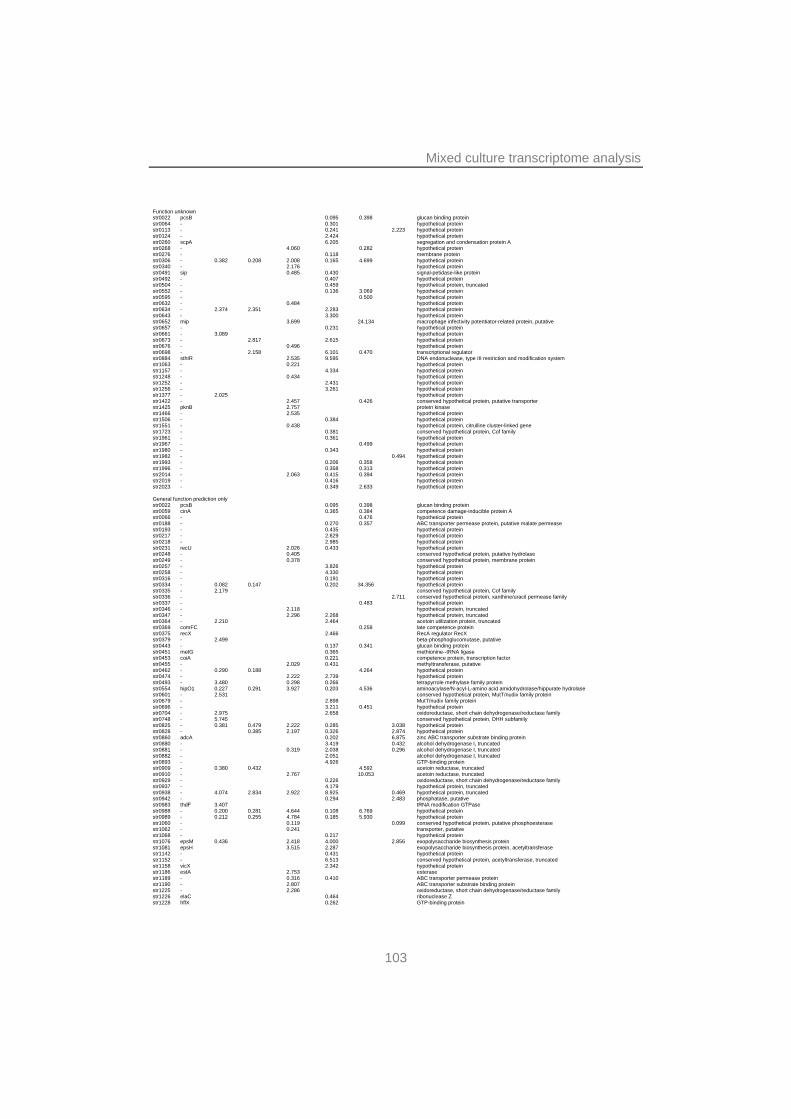
Mixed culture transcriptome analysis
103
Function unknown str0022 pcsB 0.095 0.398 glucan binding protein str0064 - 0.301 hypothetical protein str0113 - 0.241 2.223 hypothetical protein str0124 - 2.424 hypothetical protein str0260 scpA 6.205 segregation and condensation protein A str0268 - 4.060 0.282 hypothetical protein str0276 - 0.118 membrane protein str0306 - 0.382 0.208 2.008 0.165 4.699 hypothetical protein str0340 - 2.176 hypothetical protein str0491 sip 0.485 0.430 signal-petidase-like protein str0492 - 0.407 hypothetical protein str0504 - 0.459 hypothetical protein, truncated str0552 - 0.136 3.069 hypothetical protein str0595 - 0.500 hypothetical protein str0632 - 0.484 hypothetical protein str0634 - 2.374 2.351 2.283 hypothetical protein str0643 - 3.300 hypothetical protein str0652 mip 3.699 24.134 macrophage infectivity potentiator-related protein, putative str0657 - 0.231 hypothetical protein str0661 - 3.089 hypothetical protein str0673 - 2.817 2.615 hypothetical protein str0676 - 0.496 hypothetical protein str0698 - 2.158 6.101 0.470 transcriptional regulator str0884 sthIR 2.535 9.595 DNA endonuclease, type III restriction and modification system str1063 - 0.221 hypothetical protein str1157 - 4.334 hypothetical protein str1248 - 0.434 hypothetical protein str1252 - 2.431 hypothetical protein str1256 - 3.261 hypothetical protein str1377 - 2.025 hypothetical protein str1422 - 2.457 0.426 conserved hypothetical protein, putative transporter str1425 pknB 2.757 protein kinase str1466 - 2.535 hypothetical protein str1506 - 0.384 hypothetical protein str1551 - 0.438 hypothetical protein, citrulline cluster-linked gene str1723 - 0.381 conserved hypothetical protein, Cof family str1961 - 0.361 hypothetical protein str1967 - 0.499 hypothetical protein str1980 - 0.343 hypothetical protein str1982 - 0.494 hypothetical protein str1993 - 0.206 0.358 hypothetical protein str1996 - 0.358 0.313 hypothetical protein str2014 - 2.063 0.415 0.394 hypothetical protein str2019 - 0.416 hypothetical protein str2023 - 0.349 2.633 hypothetical protein General function prediction only str0022 pcsB 0.095 0.398 glucan binding protein str0059 cinA 0.365 0.384 competence damage-inducible protein A str0066 - 0.476 hypothetical protein str0188 - 0.270 0.357 ABC transporter permease protein, putative malate permease str0193 - 0.435 hypothetical protein str0217 - 2.829 hypothetical protein str0218 - 2.985 hypothetical protein str0231 recU 2.026 0.433 hypothetical protein str0248 - 0.405 conserved hypothetical protein, putative hydrolase str0249 - 0.378 conserved hypothetical protein, membrane protein str0257 - 3.826 hypothetical protein str0258 - 4.330 hypothetical protein str0316 - 0.191 hypothetical protein str0334 - 0.082 0.147 0.202 34.356 hypothetical protein str0335 - 2.179 conserved hypothetical protein, Cof family str0336 - 2.711 conserved hypothetical protein, xanthine/uracil permease family str0337 - 0.483 hypothetical protein str0346 - 2.118 hypothetical protein, truncated str0347 - 2.296 2.268 hypothetical protein, truncated str0364 - 2.210 2.464 acetoin utilization protein, truncated str0369 comFC 0.258 late competence protein str0375 recX 2.466 RecA regulator RecX str0379 - 2.499 beta-phosphoglucomutase, putative str0443 - 0.137 0.341 glucan binding protein str0451 metG 0.365 methionine--tRNA ligase str0453 coiA 0.221 competence protein, transcription factor str0455 - 2.029 0.431 methyltransferase, putative str0462 - 0.290 0.188 4.264 hypothetical protein str0474 - 2.222 2.739 hypothetical protein str0493 - 3.480 0.298 0.266 tetrapyrrole methylase family protein str0554 hipO1 0.227 0.291 3.927 0.203 4.536 aminoacylase/N-acyl-L-amino acid amidohydrolase/hippurate hydrolase str0601 - 2.531 conserved hypothetical protein, MutT/nudix family protein str0679 - 2.898 MutT/nudix family protein str0696 - 3.211 0.451 hypothetical protein str0704 - 2.975 2.658 oxidoreductase, short chain dehydrogenase/reductase family str0748 - 5.745 conserved hypothetical protein, DHH subfamily str0825 - 0.381 0.479 2.222 0.285 3.038 hypothetical protein str0828 - 0.385 2.197 0.326 2.874 hypothetical protein str0860 adcA 0.202 6.875 zinc ABC transporter substrate binding protein str0880 - 3.419 0.432 alcohol dehydrogenase I, truncated str0881 - 0.319 2.038 0.296 alcohol dehydrogenase I, truncated str0882 - 2.051 alcohol dehydrogenase I, truncated str0893 - 4.926 GTP-binding protein str0909 - 0.380 0.432 4.592 acetoin reductase, truncated str0910 - 2.767 10.053 acetoin reductase, truncated str0929 - 0.226 oxidoreductase, short chain dehydrogenase/reductase family str0937 - 4.179 hypothetical protein, truncated str0938 - 4.074 2.834 2.922 8.925 0.469 hypothetical protein, truncated str0942 - 0.294 2.483 phosphatase, putative str0983 thdF 3.407 tRNA modification GTPase str0988 - 0.200 0.281 4.644 0.108 6.769 hypothetical protein str0989 - 0.212 0.255 4.784 0.185 5.930 hypothetical protein str1060 - 0.119 0.099 conserved hypothetical protein, putative phosphoesterase str1062 - 0.241 transporter, putative str1068 - 0.217 hypothetical protein str1076 epsM 0.436 2.418 4.000 2.856 exopolysaccharide biosynthesis protein str1081 epsH 3.515 2.287 exopolysaccharide biosynthesis protein, acetyltransferase str1142 - 0.431 hypothetical protein str1152 - 6.513 conserved hypothetical protein, acetyltransferase, truncated str1158 vicX 2.342 hypothetical protein str1186 estA 2.753 esterase str1189 - 0.316 0.410 ABC transporter permease protein str1190 - 2.807 ABC transporter substrate binding protein str1225 - 2.286 oxidoreductase, short chain dehydrogenase/reductase family str1226 elaC 0.464 ribonuclease Z str1228 hflX 0.262 GTP-binding protein
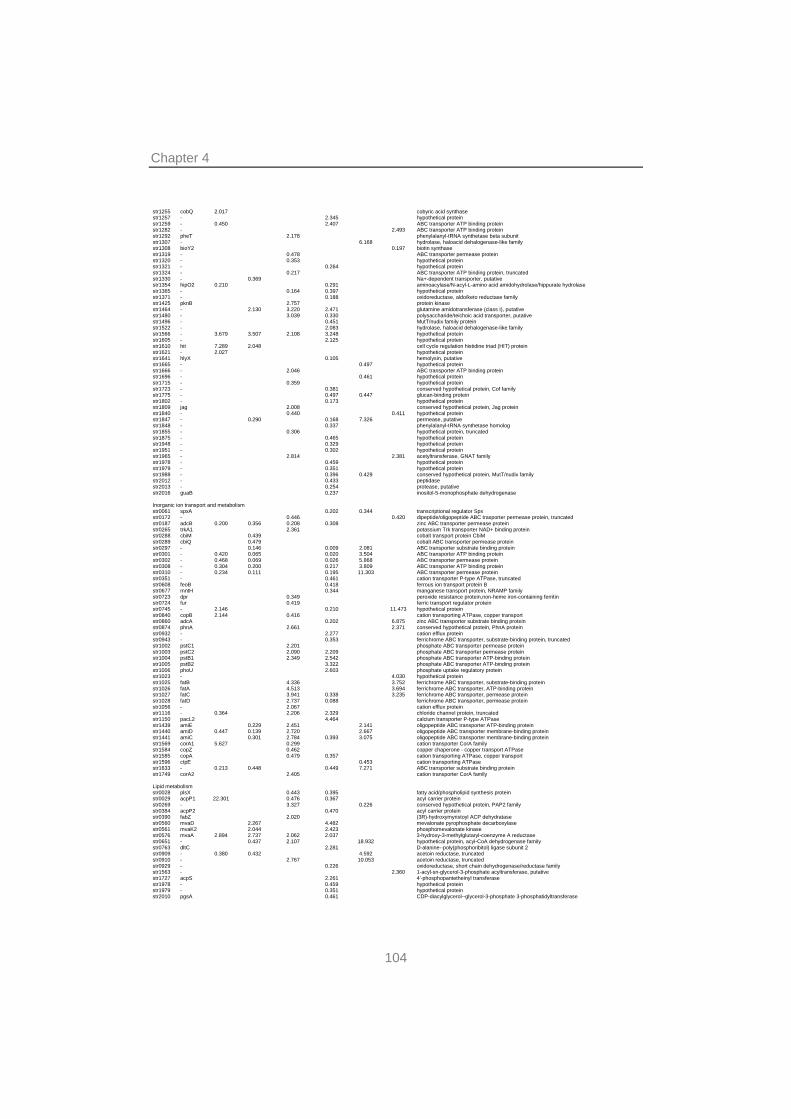
Chapter 4
104
str1255 cobQ 2.017 cobyric acid synthase str1257 - 2.345 hypothetical protein str1259 - 0.450 2.407 ABC transporter ATP binding protein str1282 - 2.493 ABC transporter ATP binding protein str1292 pheT 2.178 phenylalanyl-tRNA synthetase beta subunit str1307 - 6.168 hydrolase, haloacid dehalogenase-like family str1308 bioY2 0.197 biotin synthase str1319 - 0.478 ABC transporter permease protein str1320 - 0.353 hypothetical protein str1321 - 0.264 hypothetical protein str1324 - 0.217 ABC transporter ATP binding protein, truncated str1330 - 0.369 Na+-dependent transporter, putative str1354 hipO2 0.210 0.291 aminoacylase/N-acyl-L-amino acid amidohydrolase/hippurate hydrolase str1365 - 0.164 0.397 hypothetical protein str1371 - 0.188 oxidoreductase, aldo/keto reductase family str1425 pknB 2.757 protein kinase str1464 - 2.130 3.220 2.471 glutamine amidotransferase (class I), putative str1480 - 3.039 0.330 polysaccharide/teichoic acid transporter, putative str1496 - 0.451 MutT/nudix family protein str1522 - 2.083 hydrolase, haloacid dehalogenase-like family str1566 - 3.679 3.507 2.108 3.248 hypothetical protein str1605 - 2.125 hypothetical protein str1610 hit 7.289 2.048 cell cycle regulation histidine triad (HIT) protein str1621 - 2.027 hypothetical protein str1641 hlyX 0.105 hemolysin, putative str1665 - 0.497 hypothetical protein str1666 - 2.046 ABC transporter ATP binding protein str1696 - 0.461 hypothetical protein str1715 - 0.359 hypothetical protein str1723 - 0.381 conserved hypothetical protein, Cof family str1775 - 0.497 0.447 glucan-binding protein str1802 - 0.173 hypothetical protein str1809 jag 2.008 conserved hypothetical protein, Jag protein str1840 - 0.440 0.411 hypothetical protein str1847 - 0.290 0.168 7.326 permease, putative str1848 - 0.337 phenylalanyl-tRNA synthetase homolog str1855 - 0.306 hypothetical protein, truncated str1875 - 0.465 hypothetical protein str1948 - 0.329 hypothetical protein str1951 - 0.302 hypothetical protein str1965 - 2.814 2.381 acetyltransferase, GNAT family str1978 - 0.459 hypothetical protein str1979 - 0.351 hypothetical protein str1988 - 0.396 0.429 conserved hypothetical protein, MutT/nudix family str2012 - 0.433 peptidase str2013 - 0.254 protease, putative str2016 guaB 0.237 inositol-5-monophosphate dehydrogenase Inorganic ion transport and metabolism str0061 spxA 0.202 0.344 transcriptional regulator Spx str0172 - 0.446 0.420 dipeptide/oligopeptide ABC trasporter permease protein, truncated str0187 adcB 0.200 0.356 0.208 0.308 zinc ABC transporter permease protein str0265 trkA1 2.361 potassium Trk transporter NAD+ binding protein str0288 cbiM 0.439 cobalt transport protein CbiM str0289 cbiQ 0.479 cobalt ABC transporter permease protein str0297 - 0.146 0.009 2.081 ABC transporter substrate binding protein str0301 - 0.420 0.065 0.020 3.504 ABC transporter ATP binding protein str0302 - 0.468 0.069 0.026 5.868 ABC transporter permease protein str0308 - 0.304 0.200 0.217 3.809 ABC transporter ATP binding protein str0310 - 0.234 0.111 0.195 11.303 ABC transporter permease protein str0351 - 0.461 cation transporter P-type ATPase, truncated str0608 feoB 0.418 ferrous ion transport protein B str0677 mntH 0.344 manganese transport protein, NRAMP family str0723 dpr 0.349 peroxide resistance protein,non-heme iron-containing ferritin str0724 fur 0.419 ferric transport regulator protein str0745 - 2.146 0.210 11.473 hypothetical protein str0840 copB 2.144 0.416 cation transporting ATPase, copper transport str0860 adcA 0.202 6.875 zinc ABC transporter substrate binding protein str0874 phnA 2.661 2.371 conserved hypothetical protein, PhnA protein str0932 - 2.277 cation efflux protein str0943 - 0.353 ferrichrome ABC transporter, substrate-binding protein, truncated str1002 pstC1 2.201 phosphate ABC transporter permease protein str1003 pstC2 2.090 2.209 phosphate ABC transporter permease protein str1004 pstB1 2.349 2.542 phosphate ABC transporter ATP-binding protein str1005 pstB2 3.322 phosphate ABC transporter ATP-binding protein str1006 phoU 2.603 phosphate uptake regulatory protein str1023 - 4.030 hypothetical protein str1025 fatB 4.336 3.752 ferrichrome ABC transporter, substrate-binding protein str1026 fatA 4.513 3.694 ferrichrome ABC transporter, ATP-binding protein str1027 fatC 3.941 0.338 3.235 ferrichrome ABC transporter, permease protein str1028 fatD 2.737 0.088 ferrichrome ABC transporter, permease protein str1056 - 2.067 cation efflux protein str1116 - 0.364 2.206 2.329 chloride channel protein, truncated str1150 pacL2 4.464 calcium transporter P-type ATPase str1439 amiE 0.229 2.451 2.141 oligopeptide ABC transporter ATP-binding protein str1440 amiD 0.447 0.139 2.720 2.667 oligopeptide ABC transporter membrane-binding protein str1441 amiC 0.301 2.784 0.393 3.075 oligopeptide ABC transporter membrane-binding protein str1569 corA1 5.627 0.299 cation transporter CorA family str1584 copZ 0.462 copper chaperone - copper transport ATPase str1585 copA 0.479 0.357 cation transporting ATPase, copper transport str1596 ctpE 0.453 cation transporting ATPase str1633 - 0.213 0.448 0.449 7.271 ABC transporter substrate binding protein str1749 corA2 2.405 cation transporter CorA family Lipid metabolism str0028 plsX 0.443 0.395 fatty acid/phospholipid synthesis protein str0029 acpP1 22.301 0.476 0.367 acyl carrier protein str0269 - 3.327 0.226 conserved hypothetical protein, PAP2 family str0384 acpP2 0.470 acyl carrier protein str0390 fabZ 2.020 (3R)-hydroxymyristoyl ACP dehydratase str0560 mvaD 2.267 4.482 mevalonate pyrophosphate decarboxylase str0561 mvaK2 2.044 2.423 phosphomevalonate kinase str0576 mvaA 2.894 2.737 2.062 2.037 3-hydroxy-3-methylglutaryl-coenzyme A reductase str0651 - 0.437 2.107 18.932 hypothetical protein, acyl-CoA dehydrogenase family str0763 dltC 2.281 D-alanine--poly(phosphoribitol) ligase subunit 2 str0909 - 0.380 0.432 4.592 acetoin reductase, truncated str0910 - 2.767 10.053 acetoin reductase, truncated str0929 - 0.226 oxidoreductase, short chain dehydrogenase/reductase family str1563 - 2.360 1-acyl-sn-glycerol-3-phosphate acyltransferase, putative str1727 acpS 2.261 4'-phosphopantetheinyl transferase str1978 - 0.459 hypothetical protein str1979 - 0.351 hypothetical protein str2010 pgsA 0.461 CDP-diacylglycerol--glycerol-3-phosphate 3-phosphatidyltransferase
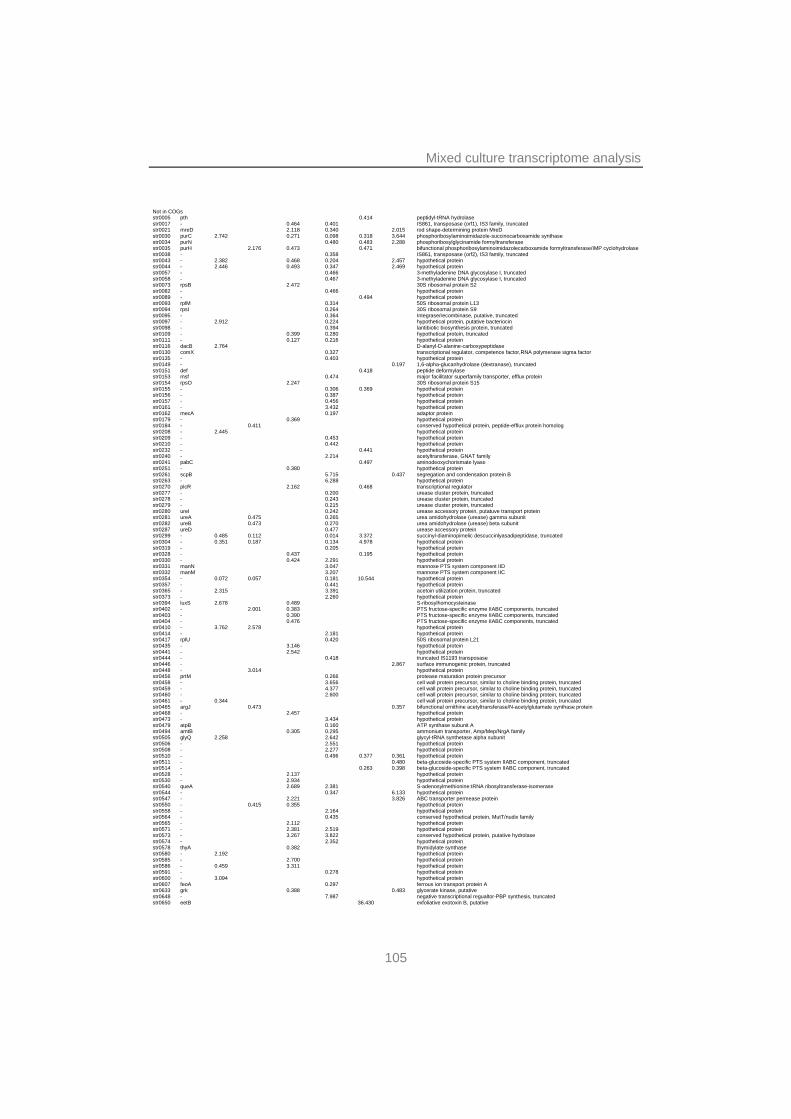
Mixed culture transcriptome analysis
105
Not in COGs str0005 pth 0.414 peptidyl-tRNA hydrolase str0017 - 0.464 0.401 IS861, transposase (orf1), IS3 family, truncated str0021 mreD 2.118 0.340 2.015 rod shape-determining protein MreD str0030 purC 2.742 0.271 0.098 0.318 3.644 phosphoribosylaminoimidazole-succinocarboxamide synthase str0034 purN 0.480 0.483 2.288 phosphoribosylglycinamide formyltransferase str0035 purH 2.176 0.473 0.471 bifunctional phosphoribosylaminoimidazolecarboxamide formyltransferase/IMP cyclohydrolase str0038 - 0.358 IS861, transposase (orf2), IS3 family, truncated str0043 - 2.382 0.468 0.204 2.457 hypothetical protein str0044 - 2.446 0.493 0.347 2.469 hypothetical protein str0057 - 0.466 3-methyladenine DNA glycosylase I, truncated str0058 - 0.467 3-methyladenine DNA glycosylase I, truncated str0073 rpsB 2.472 30S ribosomal protein S2 str0082 - 0.466 hypothetical protein str0089 - 0.494 hypothetical protein str0093 rplM 0.314 50S ribosomal protein L13 str0094 rpsI 0.264 30S ribosomal protein S9 str0095 - 0.364 Integrase/recombinase, putative, truncated str0097 - 2.912 0.224 hypothetical protein, putative bacteriocin str0098 - 0.394 lantibiotic biosynthesis protein, truncated str0109 - 0.399 0.280 hypothetical protein, truncated str0111 - 0.127 0.216 hypothetical protein str0116 dacB 2.764 D-alanyl-D-alanine-carboxypeptidase str0130 comX 0.327 transcriptional regulator, competence factor,RNA polymerase sigma factor str0135 - 0.403 hypothetical protein str0149 - 0.197 1,6-alpha-glucanhydrolase (dextranase), truncated str0151 def 0.418 peptide deformylase str0153 msf 0.474 major facilitator superfamily transporter, efflux protein str0154 rpsO 2.247 30S ribosomal protein S15 str0155 - 0.306 0.369 hypothetical protein str0156 - 0.387 hypothetical protein str0157 - 0.456 hypothetical protein str0161 - 3.432 hypothetical protein str0162 mecA 0.197 adaptor protein str0179 - 0.369 hypothetical protein str0184 - 0.411 conserved hypothetical protein, peptide-efflux protein homolog str0208 - 2.445 hypothetical protein str0209 - 0.453 hypothetical protein str0210 - 0.442 hypothetical protein str0232 - 0.441 hypothetical protein str0240 - 2.214 acetyltransferase, GNAT family str0241 pabC 0.497 aminodeoxychorismate lyase str0251 - 0.380 hypothetical protein str0261 scpB 5.715 0.437 segregation and condensation protein B str0263 - 6.288 hypothetical protein str0270 plcR 2.162 0.468 transcriptional regulator str0277 - 0.200 urease cluster protein, truncated str0278 - 0.243 urease cluster protein, truncated str0279 - 0.215 urease cluster protein, truncated str0280 ureI 0.242 urease accessory protein, putatuve transport protein str0281 ureA 0.475 0.265 urea amidohydrolase (urease) gamma subunit str0282 ureB 0.473 0.270 urea amidohydrolase (urease) beta subunit str0287 ureD 0.477 urease accessory protein str0299 - 0.485 0.112 0.014 3.372 succinyl-diaminopimelic descuccinlyasadipeptidase, truncated str0304 - 0.351 0.187 0.134 4.978 hypothetical protein str0319 - 0.205 hypothetical protein str0328 - 0.437 0.195 hypothetical protein str0330 - 0.424 2.291 hypothetical protein str0331 manN 3.047 mannose PTS system component IID str0332 manM 3.207 mannose PTS system component IIC str0354 - 0.072 0.057 0.181 10.544 hypothetical protein str0357 - 0.441 hypothetical protein str0365 - 2.315 3.391 acetoin utilization protein, truncated str0373 - 2.260 hypothetical protein str0394 luxS 2.678 0.489 S-ribosylhomocysteinase str0402 - 2.001 0.383 PTS fructose-specific enzyme IIABC components, truncated str0403 - 0.390 PTS fructose-specific enzyme IIABC components, truncated str0404 - 0.476 PTS fructose-specific enzyme IIABC components, truncated str0410 - 3.762 2.578 hypothetical protein str0414 - 2.181 hypothetical protein str0417 rplU 0.420 50S ribosomal protein L21 str0435 - 3.146 hypothetical protein str0441 - 2.542 hypothetical protein str0444 - 0.418 truncated IS1193 transposase str0446 - 2.867 surface immunogenic protein, truncated str0448 - 3.014 hypothetical protein str0456 prtM 0.266 protease maturation protein precursor str0458 - 3.656 cell wall protein precursor, similar to choline binding protein, truncated str0459 - 4.377 cell wall protein precursor, similar to choline binding protein, truncated str0460 - 2.600 cell wall protein precursor, similar to choline binding protein, truncated str0461 - 0.344 cell wall protein precursor, similar to choline binding protein, truncated str0465 argJ 0.473 0.357 bifunctional ornithine acetyltransferase/N-acetylglutamate synthase protein str0468 - 2.457 hypothetical protein str0473 - 3.434 hypothetical protein str0479 atpB 0.160 ATP synthase subunit A str0494 amtB 0.305 0.295 ammonium transporter, Amp/Mep/NrgA family str0505 glyQ 2.258 2.642 glycyl-tRNA synthetase alpha subunit str0506 - 2.551 hypothetical protein str0508 - 2.277 hypothetical protein str0510 - 0.496 0.377 0.361 hypothetical protein str0511 - 0.480 beta-glucoside-specific PTS system IIABC component, truncated str0514 - 0.263 0.398 beta-glucoside-specific PTS system IIABC component, truncated str0528 - 2.137 hypothetical protein str0530 - 2.934 hypothetical protein str0540 queA 2.689 2.381 S-adenosylmethionine:tRNA ribosyltransferase-isomerase str0544 - 0.347 6.133 hypothetical protein str0547 - 2.221 3.826 ABC transporter permease protein str0550 - 0.415 0.355 hypothetical protein str0558 - 2.164 hypothetical protein str0564 - 0.435 conserved hypothetical protein, MutT/nudix family str0565 - 2.112 hypothetical protein str0571 - 2.381 2.519 hypothetical protein str0573 - 3.267 3.822 conserved hypothetical protein, putative hydrolase str0574 - 2.352 hypothetical protein str0578 thyA 0.382 thymidylate synthase str0580 - 2.192 hypothetical protein str0585 - 2.700 hypothetical protein str0586 - 0.459 3.311 hypothetical protein str0591 - 0.278 hypothetical protein str0600 - 3.094 hypothetical protein str0607 feoA 0.297 ferrous ion transport protein A str0633 grk 0.388 0.483 glycerate kinase, putative str0648 - 7.987 negative transcriptional regualtor-PBP synthesis, truncated str0650 eetB 36.430 exfoliative exotoxin B, putative
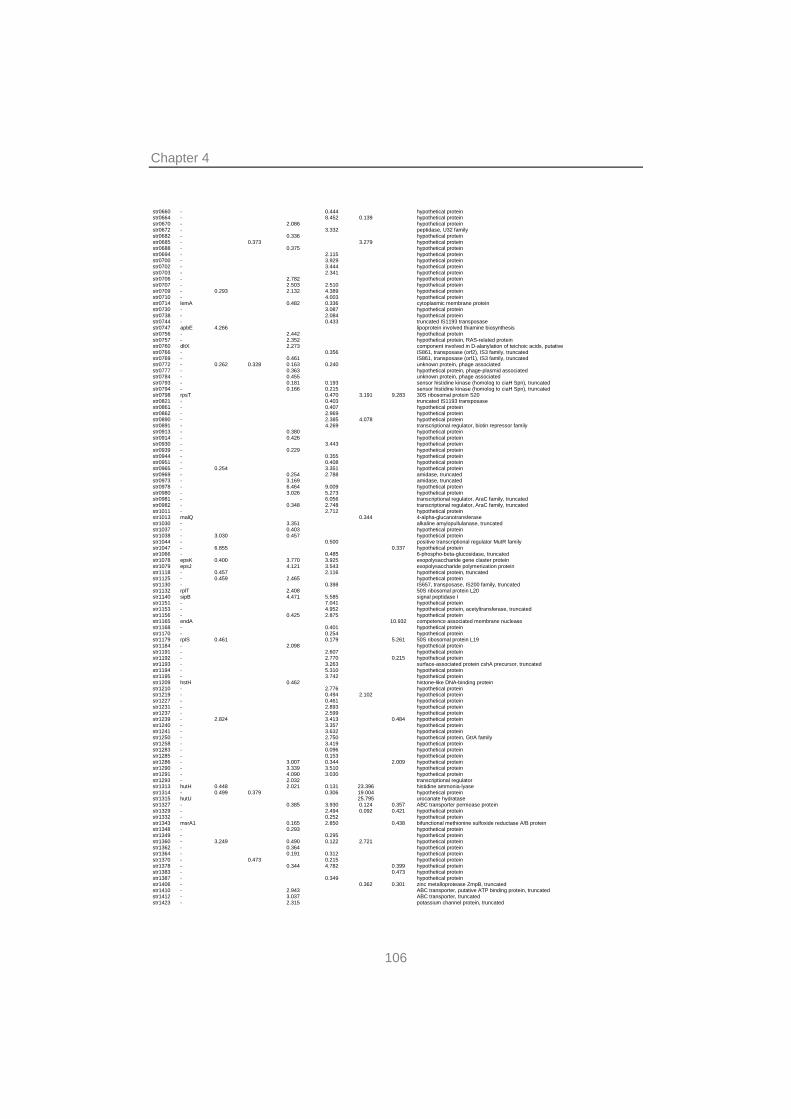
Chapter 4
106
str0660 - 0.444 hypothetical protein str0664 - 8.452 0.139 hypothetical protein str0670 - 2.086 hypothetical protein str0672 - 3.332 peptidase, U32 family str0682 - 0.336 hypothetical protein str0685 - 0.373 3.279 hypothetical protein str0688 - 0.375 hypothetical protein str0694 - 2.115 hypothetical protein str0700 - 3.929 hypothetical protein str0702 - 3.444 hypothetical protein str0703 - 2.341 hypothetical protein str0706 - 2.782 hypothetical protein str0707 - 2.503 2.510 hypothetical protein str0709 - 0.293 2.132 4.389 hypothetical protein str0710 - 4.003 hypothetical protein str0714 lemA 0.482 0.336 cytoplasmic membrane protein str0730 - 3.087 hypothetical protein str0738 - 2.084 hypothetical protein str0744 - 0.433 truncated IS1193 transposase str0747 apbE 4.266 lipoprotein involved thiamine biosynthesis str0756 - 2.442 hypothetical protein str0757 - 2.352 hypothetical protein, RAS-related protein str0760 dltX 2.273 component involved in D-alanylation of teichoic acids, putative str0766 - 0.356 IS861, transposase (orf2), IS3 family, truncated str0769 - 0.461 IS861, transposase (orf1), IS3 family, truncated str0772 - 0.262 0.328 0.163 0.240 unknown protein, phage associated str0777 - 0.363 hypothetical protein, phage-plasmid associated str0784 - 0.455 unknown protein, phage associated str0793 - 0.181 0.193 sensor histidine kinase (homolog to ciaH Spn), truncated str0794 - 0.166 0.215 sensor histidine kinase (homolog to ciaH Spn), truncated str0798 rpsT 0.470 3.191 9.283 30S ribosomal protein S20 str0821 - 0.403 truncated IS1193 transposase str0861 - 0.407 hypothetical protein str0862 - 2.969 hypothetical protein str0890 - 2.385 4.078 hypothetical protein str0891 - 4.269 transcriptional regulator, biotin repressor family str0913 - 0.380 hypothetical protein str0914 - 0.426 hypothetical protein str0930 - 3.443 hypothetical protein str0939 - 0.229 hypothetical protein str0944 - 0.355 hypothetical protein str0951 - 0.408 hypothetical protein str0965 - 0.254 3.351 hypothetical protein str0969 - 0.254 2.788 amidase, truncated str0973 - 3.169 amidase, truncated str0978 - 6.464 9.009 hypothetical protein str0980 - 3.026 5.273 hypothetical protein str0981 - 6.056 transcriptional regulator, AraC family, truncated str0982 - 0.348 2.748 transcriptional regulator, AraC family, truncated str1011 - 2.712 hypothetical protein str1013 malQ 0.344 4-alpha-glucanotransferase str1030 - 3.351 alkaline amylopullulanase, truncated str1037 - 0.403 hypothetical protein str1038 - 3.030 0.457 hypothetical protein str1044 - 0.500 positive transcriptional regulator MutR family str1047 - 6.855 0.337 hypothetical protein str1066 - 0.485 6-phospho-beta-glucosidase, truncated str1078 epsK 0.400 3.770 3.925 exopolysaccharide gene claster protein str1079 epsJ 4.121 3.543 exopolysaccharide polymerization protein str1118 - 0.457 2.116 hypothetical protein, truncated str1125 - 0.459 2.465 hypothetical protein str1130 - 0.398 IS657, transposase, IS200 family, truncated str1132 rplT 2.408 50S ribosomal protein L20 str1140 sipB 4.471 5.585 signal peptidase I str1151 - 7.041 hypothetical protein str1153 - 4.952 hypothetical protein, acetyltransferase, truncated str1156 - 0.425 2.875 hypothetical protein str1165 endA 10.932 competence associated membrane nuclease str1168 - 0.401 hypothetical protein str1170 - 0.254 hypothetical protein str1179 rplS 0.461 0.179 5.261 50S ribosomal protein L19 str1184 - 2.098 hypothetical protein str1191 - 2.607 hypothetical protein str1192 - 2.770 0.215 hypothetical protein str1193 - 3.263 surface-associated protein cshA precursor, truncated str1194 - 5.310 hypothetical protein str1195 - 3.742 hypothetical protein str1209 hstH 0.462 histone-like DNA-binding protein str1210 - 2.776 hypothetical protein str1219 - 0.494 2.102 hypothetical protein str1227 - 0.461 hypothetical protein str1231 - 2.893 hypothetical protein str1237 - 2.599 hypothetical protein str1239 - 2.824 3.413 0.484 hypothetical protein str1240 - 3.357 hypothetical protein str1241 - 3.632 hypothetical protein str1250 - 2.750 hypothetical protein, GtrA family str1258 - 3.419 hypothetical protein str1283 - 0.096 hypothetical protein str1285 - 0.153 hypothetical protein str1286 - 3.007 0.344 2.009 hypothetical protein str1290 - 3.339 3.510 hypothetical protein str1291 - 4.090 3.030 hypothetical protein str1293 - 2.032 transcriptional regulator str1313 hutH 0.448 2.021 0.131 23.396 histidine ammonia-lyase str1314 - 0.499 0.379 0.306 19.004 hypothetical protein str1315 hutU 25.795 urocanate hydratase str1327 - 0.385 3.930 0.124 0.357 ABC transporter permease protein str1329 - 2.494 0.092 0.421 hypothetical protein str1332 - 0.252 hypothetical protein str1343 msrA1 0.165 2.850 0.438 bifunctional methionine sulfoxide reductase A/B protein str1348 - 0.293 hypothetical protein str1349 - 0.295 hypothetical protein str1360 - 3.249 0.490 0.122 2.721 hypothetical protein str1362 - 0.364 hypothetical protein str1364 - 0.191 0.312 hypothetical protein str1370 - 0.473 0.215 hypothetical protein str1378 - 0.344 4.782 0.399 hypothetical protein str1383 - 0.473 hypothetical protein str1387 - 0.349 hypothetical protein str1406 - 0.362 0.301 zinc metalloprotease ZmpB, truncated str1410 - 2.943 ABC transporter, putative ATP binding protein, truncated str1412 - 3.037 ABC transporter, truncated str1423 - 2.315 potassium channel protein, truncated
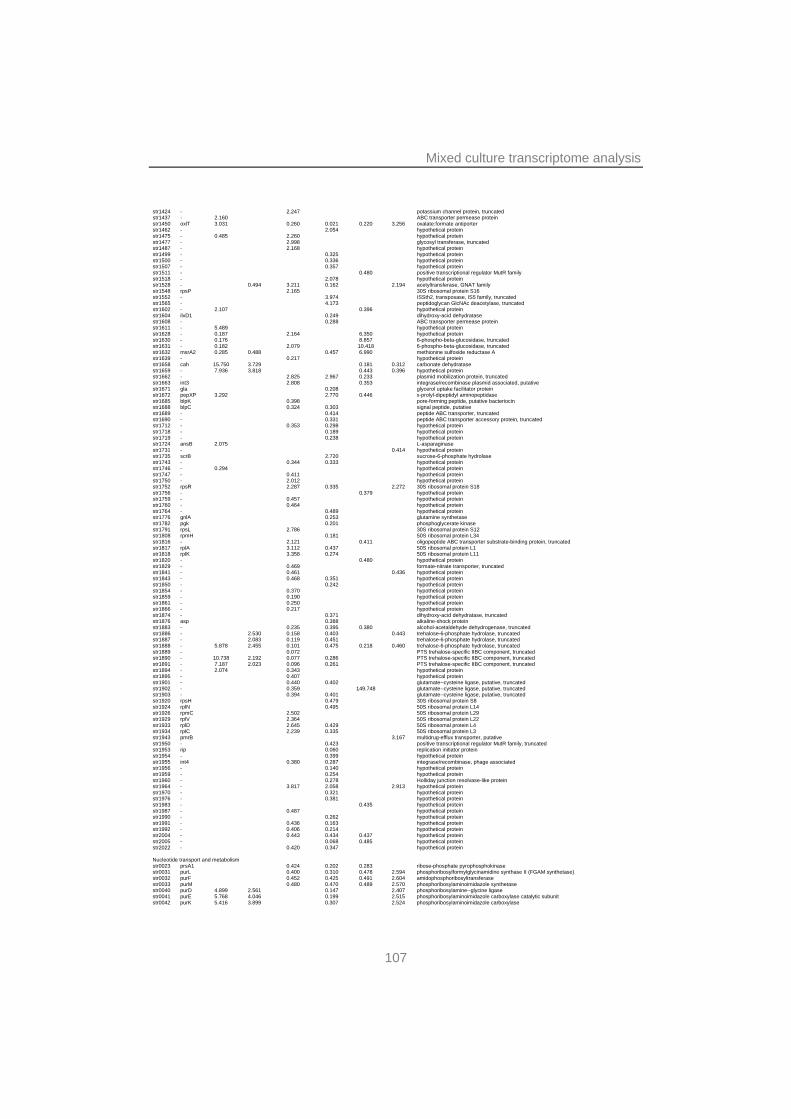
Mixed culture transcriptome analysis
107
str1424 - 2.247 potassium channel protein, truncated str1437 - 2.160 ABC transporter permease protein str1450 oxlT 3.031 0.260 0.021 0.220 3.256 oxalate:formate antiporter str1462 - 2.054 hypothetical protein str1475 - 0.485 2.260 hypothetical protein str1477 - 2.998 glycosyl transferase, truncated str1487 - 2.168 hypothetical protein str1499 - 0.325 hypothetical protein str1500 - 0.336 hypothetical protein str1507 - 0.357 hypothetical protein str1511 - 0.480 positive transcriptional regulator MutR family str1518 - 2.078 hypothetical protein str1528 - 0.494 3.211 0.162 2.194 acetyltransferase, GNAT family str1548 rpsP 2.165 30S ribosomal protein S16 str1552 - 3.974 ISSth2, transposase, IS5 family, truncated str1565 - 4.173 peptidoglycan GlcNAc deacetylase, truncated str1602 - 2.107 0.396 hypothetical protein str1604 ilvD1 0.249 dihydroxy-acid dehydratase str1608 - 0.288 ABC transporter permease protein str1611 - 5.489 hypothetical protein str1628 - 0.187 2.164 6.350 hypothetical protein str1630 - 0.176 8.857 6-phospho-beta-glucosidase, truncated str1631 - 0.182 2.079 10.418 6-phospho-beta-glucosidase, truncated str1632 msrA2 0.285 0.488 0.457 6.990 methionine sulfoxide reductase A str1639 - 0.217 hypothetical protein str1658 cah 15.750 3.729 0.181 0.312 carbonate dehydratase str1659 - 7.936 3.818 0.443 0.396 hypothetical protein str1662 - 2.825 2.967 0.233 plasmid mobilization protein, truncated str1663 int3 2.808 0.353 integrase/recombinase plasmid associated, putative str1671 gla 0.208 glycerol uptake facilitator protein str1672 pepXP 3.292 2.770 0.446 x-prolyl-dipeptidyl aminopeptidase str1685 blpK 0.398 pore-forming peptide, putative bacteriocin str1688 blpC 0.324 0.303 signal peptide, putative str1689 - 0.414 peptide ABC transporter, truncated str1690 - 0.331 peptide ABC transporter accessory protein, truncated str1712 - 0.353 0.298 hypothetical protein str1718 - 0.189 hypothetical protein str1719 - 0.238 hypothetical protein str1724 ansB 2.075 L-asparaginase str1731 - 0.414 hypothetical protein str1735 scrB 2.720 sucrose-6-phosphate hydrolase str1743 - 0.344 0.333 hypothetical protein str1746 - 0.294 hypothetical protein str1747 - 0.411 hypothetical protein str1750 - 2.012 hypothetical protein str1752 rpsR 2.287 0.335 2.272 30S ribosomal protein S18 str1756 - 0.379 hypothetical protein str1759 - 0.457 hypothetical protein str1760 - 0.464 hypothetical protein str1764 - 0.489 hypothetical protein str1776 gnlA 0.253 glutamine synthetase str1782 pgk 0.201 phosphoglycerate kinase str1791 rpsL 2.786 30S ribosomal protein S12 str1808 rpmH 0.181 50S ribosomal protein L34 str1816 - 2.121 0.411 oligopeptide ABC transporter substrate-binding protein, truncated str1817 rplA 3.112 0.437 50S ribosomal protein L1 str1818 rplK 3.358 0.274 50S ribosomal protein L11 str1820 - 0.480 hypothetical protein str1829 - 0.469 formate-nitrate transporter, truncated str1841 - 0.461 0.436 hypothetical protein str1843 - 0.468 0.351 hypothetical protein str1850 - 0.242 hypothetical protein str1854 - 0.370 hypothetical protein str1859 - 0.190 hypothetical protein str1861 - 0.250 hypothetical protein str1866 - 0.217 hypothetical protein str1874 - 0.371 dihydroxy-acid dehydratase, truncated str1876 asp 0.388 alkaline-shock protein str1883 - 0.235 0.395 0.380 alcohol-acetaldehyde dehydrogenase, truncated str1886 - 2.530 0.158 0.403 0.443 trehalose-6-phosphate hydrolase, truncated str1887 - 2.083 0.119 0.451 trehalose-6-phosphate hydrolase, truncated str1888 - 5.878 2.455 0.101 0.475 0.218 0.460 trehalose-6-phosphate hydrolase, truncated str1889 - 0.072 PTS trehalose-specific IIBC component, truncated str1890 - 10.738 2.192 0.077 0.286 PTS trehalose-specific IIBC component, truncated str1891 - 7.187 2.023 0.096 0.261 PTS trehalose-specific IIBC component, truncated str1894 - 2.074 0.343 hypothetical protein str1895 - 0.407 hypothetical protein str1901 - 0.440 0.402 glutamate--cysteine ligase, putative, truncated str1902 - 0.359 149.748 glutamate--cysteine ligase, putative, truncated str1903 - 0.394 0.401 glutamate--cysteine ligase, putative, truncated str1920 rpsH 0.479 30S ribosomal protein S8 str1924 rplN 0.495 50S ribosomal protein L14 str1926 rpmC 2.502 50S ribosomal protein L29 str1929 rplV 2.364 50S ribosomal protein L22 str1933 rplD 2.645 0.429 50S ribosomal protein L4 str1934 rplC 2.239 0.335 50S ribosomal protein L3 str1943 pmrB 3.167 multidrug-efflux transporter, putative str1950 - 0.423 positive transcriptional regulator MutR family, truncated str1953 rip 0.060 replication initiator protein str1954 - 0.399 hypothetical protein str1955 int4 0.380 0.287 integrase/recombinase, phage associated str1956 - 0.140 hypothetical protein str1959 - 0.254 hypothetical protein str1960 - 0.278 Holliday junction resolvase-like protein str1964 - 3.817 2.058 2.913 hypothetical protein str1970 - 0.321 hypothetical protein str1976 - 0.381 hypothetical protein str1983 - 0.435 hypothetical protein str1987 - 0.487 hypothetical protein str1990 - 0.262 hypothetical protein str1991 - 0.436 0.163 hypothetical protein str1992 - 0.406 0.214 hypothetical protein str2004 - 0.443 0.434 0.437 hypothetical protein str2005 - 0.068 0.485 hypothetical protein str2022 - 0.420 0.347 hypothetical protein Nucleotide transport and metabolism str0023 prsA1 0.424 0.202 0.283 ribose-phosphate pyrophosphokinase str0031 purL 0.400 0.310 0.478 2.594 phosphoribosylformylglycinamidine synthase II (FGAM synthetase) str0032 purF 0.452 0.425 0.491 2.604 amidophosphoribosyltransferase str0033 purM 0.480 0.470 0.489 2.570 phosphoribosylaminoimidazole synthetase str0040 purD 4.899 2.561 0.147 2.407 phosphoribosylamine--glycine ligase str0041 purE 5.768 4.046 0.199 2.515 phosphoribosylaminoimidazole carboxylase catalytic subunit str0042 purK 5.416 3.899 0.307 2.524 phosphoribosylaminoimidazole carboxylase
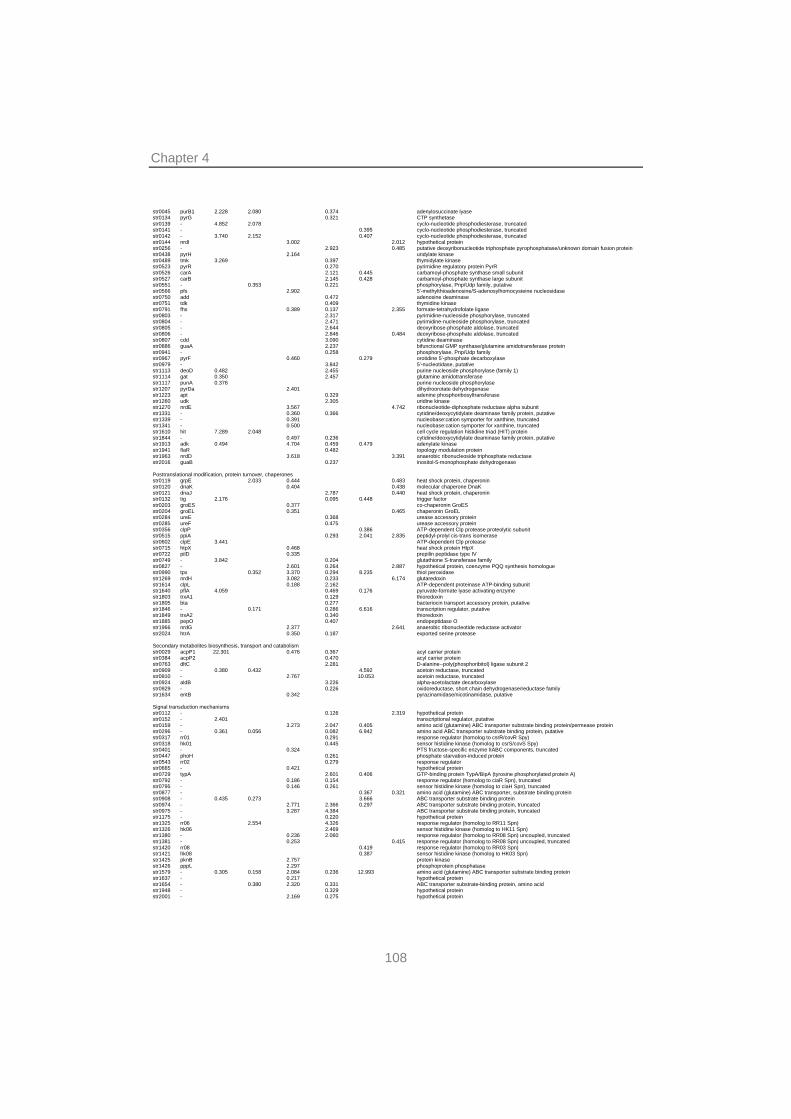
Chapter 4
108
str0045 purB1 2.228 2.080 0.374 adenylosuccinate lyase str0134 pyrG 0.321 CTP synthetase str0139 - 4.852 2.078 cyclo-nucleotide phosphodiesterase, truncated str0141 - 0.395 cyclo-nucleotide phosphodiesterase, truncated str0142 - 3.740 2.152 0.407 cyclo-nucleotide phosphodiesterase, truncated str0144 nrdI 3.002 2.012 hypothetical protein str0256 - 2.923 0.485 putative deoxyribonucleotide triphosphate pyrophosphatase/unknown domain fusion protein str0438 pyrH 2.164 uridylate kinase str0489 tmk 3.269 0.397 thymidylate kinase str0523 pyrR 0.270 pyrimidine regulatory protein PyrR str0526 carA 2.121 0.445 carbamoyl-phosphate synthase small subunit str0527 carB 2.145 0.428 carbamoyl-phosphate synthase large subunit str0551 - 0.353 0.221 phosphorylase, Pnp/Udp family, putative str0566 pfs 2.902 5'-methylthioadenosine/S-adenosylhomocysteine nucleosidase str0750 add 0.472 adenosine deaminase str0751 tdk 0.409 thymidine kinase str0791 fhs 0.389 0.137 2.355 formate-tetrahydrofolate ligase str0803 - 2.317 pyrimidine-nucleoside phosphorylase, truncated str0804 - 2.471 pyrimidine-nucleoside phosphorylase, truncated str0805 - 2.644 deoxyribose-phosphate aldolase, truncated str0806 - 2.846 0.484 deoxyribose-phosphate aldolase, truncated str0807 cdd 3.090 cytidine deaminase str0886 guaA 2.237 bifunctional GMP synthase/glutamine amidotransferase protein str0941 - 0.258 phosphorylase, Pnp/Udp family str0967 pyrF 0.460 0.279 orotidine 5'-phosphate decarboxylase str0979 - 3.842 5'-nucleotidase, putative str1113 deoD 0.482 2.455 purine nucleoside phosphorylase (family 1) str1114 gat 0.350 2.457 glutamine amidotransferase str1117 punA 0.376 purine nucleoside phosphorylase str1207 pyrDa 2.401 dihydroorotate dehydrogenase str1223 apt 0.329 adenine phosphoribosyltransferase str1260 udk 2.305 uridine kinase str1270 nrdE 3.567 4.742 ribonucleotide-diphosphate reductase alpha subunit str1331 - 0.360 0.366 cytidine/deoxycytidylate deaminase family protein, putative str1339 - 0.391 nucleobase:cation symporter for xanthine, truncated str1341 - 0.500 nucleobase:cation symporter for xanthine, truncated str1610 hit 7.289 2.048 cell cycle regulation histidine triad (HIT) protein str1844 - 0.497 0.236 cytidine/deoxycytidylate deaminase family protein, putative str1913 adk 0.494 4.704 0.459 0.479 adenylate kinase str1941 flaR 0.482 topology modulation protein str1963 nrdD 3.618 3.391 anaerobic ribonucleoside triphosphate reductase str2016 guaB 0.237 inositol-5-monophosphate dehydrogenase Posttranslational modification, protein turnover, chaperones str0119 grpE 2.033 0.444 0.483 heat shock protein, chaperonin str0120 dnaK 0.404 0.438 molecular chaperone DnaK str0121 dnaJ 2.787 0.440 heat shock protein, chaperonin str0132 tig 2.176 0.095 0.448 trigger factor str0203 groES 0.377 co-chaperonin GroES str0204 groEL 0.351 0.465 chaperonin GroEL str0284 ureE 0.368 urease accessory protein str0285 ureF 0.475 urease accessory protein str0356 clpP 0.386 ATP-dependent Clp protease proteolytic subunit str0515 ppiA 0.293 2.041 2.835 peptidyl-prolyl cis-trans isomerase str0602 clpE 3.441 ATP-dependent Clp protease str0715 htpX 0.468 heat shock protein HtpX str0722 pilD 0.335 prepilin peptidase type IV str0749 - 3.842 0.204 glutathione S-transferase family str0827 - 2.601 0.264 2.887 hypothetical protein, coenzyme PQQ synthesis homologue str0990 tpx 0.352 3.370 0.294 8.235 thiol peroxidase str1269 nrdH 3.082 0.233 6.174 glutaredoxin str1614 clpL 0.188 2.162 ATP-dependent proteinase ATP-binding subunit str1640 pflA 4.059 0.469 0.176 pyruvate-formate lyase activating enzyme str1803 trxA1 0.129 thioredoxin str1805 bta 0.277 bacteriocin transport accessory protein, putative str1846 - 0.171 0.286 6.616 transcription regulator, putative str1849 trxA2 0.340 thioredoxin str1885 pepO 0.407 endopeptidase O str1966 nrdG 2.377 2.641 anaerobic ribonucleotide reductase activator str2024 htrA 0.350 0.187 exported serine protease Secondary metabolites biosynthesis, transport and catabolism str0029 acpP1 22.301 0.476 0.367 acyl carrier protein str0384 acpP2 0.470 acyl carrier protein str0763 dltC 2.281 D-alanine--poly(phosphoribitol) ligase subunit 2 str0909 - 0.380 0.432 4.592 acetoin reductase, truncated str0910 - 2.767 10.053 acetoin reductase, truncated str0924 aldB 3.226 alpha-acetolactate decarboxylase str0929 - 0.226 oxidoreductase, short chain dehydrogenase/reductase family str1634 entB 0.342 pyrazinamidase/nicotinamidase, putative Signal transduction mechanisms str0112 - 0.126 2.319 hypothetical protein str0152 - 2.401 transcriptional regulator, putative str0159 - 3.273 2.047 0.405 amino acid (glutamine) ABC transporter substrate binding protein/permease protein str0296 - 0.361 0.056 0.082 6.942 amino acid ABC transporter substrate binding protein, putative str0317 rr01 0.291 response regulator (homolog to csrR/covR Spy) str0318 hk01 0.445 sensor histidine kinase (homolog to csrS/covS Spy) str0401 - 0.324 PTS fructose-specific enzyme IIABC components, truncated str0447 phoH 0.261 phosphate starvation-induced protein str0543 rr02 0.279 response regulator str0665 - 0.421 hypothetical protein str0729 typA 2.601 0.406 GTP-binding protein TypA/BipA (tyrosine phosphorylated protein A) str0792 - 0.186 0.154 response regulator (homolog to ciaR Spn), truncated str0795 - 0.146 0.261 sensor histidine kinase (homolog to ciaH Spn), truncated str0877 - 0.367 0.321 amino acid (glutamine) ABC transporter, substrate binding protein str0908 - 0.435 0.273 3.666 ABC transporter substrate binding protein str0974 - 2.771 2.366 0.297 ABC transporter substrate binding protein, truncated str0975 - 3.287 4.384 ABC transporter substrate binding protein, truncated str1175 - 0.220 hypothetical protein str1325 rr06 2.554 4.326 response regulator (homolog to RR11 Spn) str1326 hk06 2.469 sensor histidine kinase (homolog to HK11 Spn) str1380 - 0.236 2.060 response regulator (homolog to RR08 Spn) uncoupled, truncated str1381 - 0.253 0.415 response regulator (homolog to RR08 Spn) uncoupled, truncated str1420 rr08 0.419 response regulator (homolog to RR03 Spn) str1421 hk08 0.387 sensor histidine kinase (homolog to HK03 Spn) str1425 pknB 2.757 protein kinase str1426 pppL 2.297 phosphoprotein phosphatase str1579 - 0.305 0.158 2.084 0.236 12.993 amino acid (glutamine) ABC transporter substrate binding protein str1637 - 0.217 hypothetical protein str1654 - 0.380 2.320 0.331 ABC transporter substrate-binding protein, amino acid str1948 - 0.329 hypothetical protein str2001 - 2.169 0.275 hypothetical protein
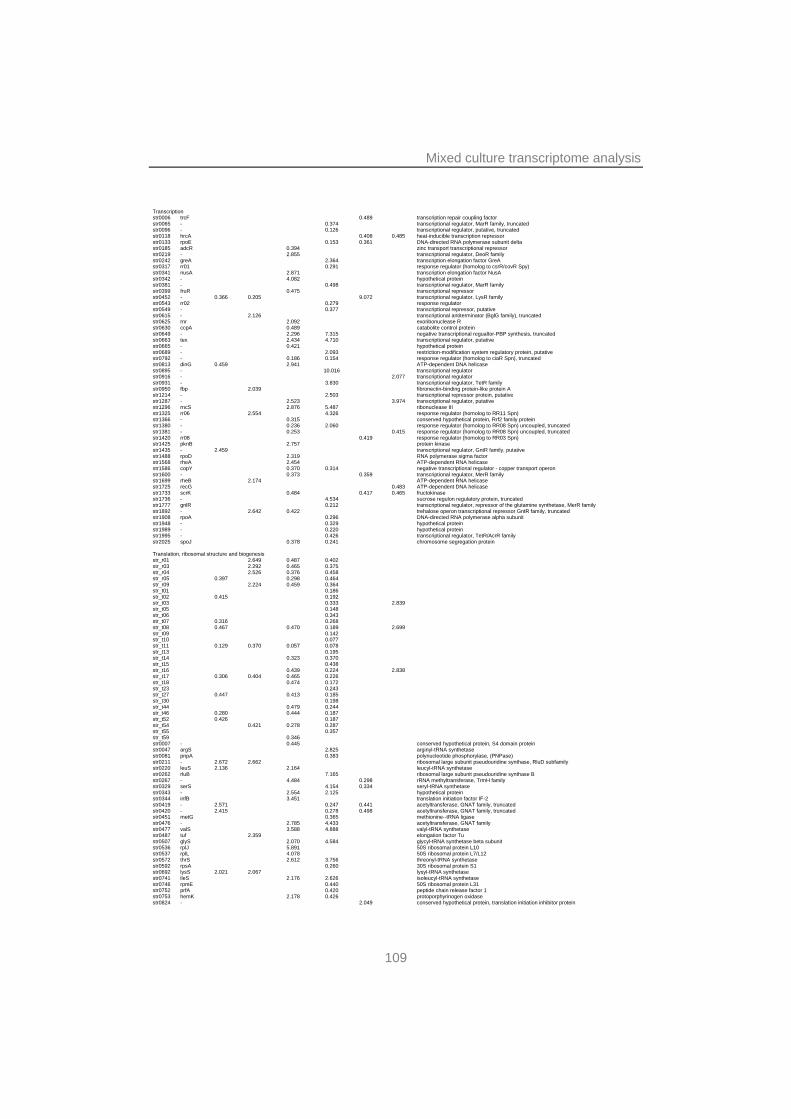
Mixed culture transcriptome analysis
109
Transcription str0006 trcF 0.489 transcription repair coupling factor str0065 - 0.374 transcriptional regulator, MarR family, truncated str0096 - 0.126 transcriptional regulator, putative, truncated str0118 hrcA 0.408 0.485 heat-inducible transcription repressor str0133 rpoE 0.153 0.361 DNA-directed RNA polymerase subunit delta str0185 adcR 0.394 zinc transport transcriptional repressor str0219 - 2.855 transcriptional regulator, DeoR family str0242 greA 2.364 transcription elongation factor GreA str0317 rr01 0.291 response regulator (homolog to csrR/covR Spy) str0341 nusA 2.871 transcription elongation factor NusA str0342 - 4.082 hypothetical protein str0381 - 0.498 transcriptional regulator, MarR family str0399 fruR 0.475 transcriptional repressor str0452 - 0.366 0.205 9.072 transcriptional regulator, LysR family str0543 rr02 0.279 response regulator str0549 - 0.377 transcriptional repressor, putative str0615 - 2.126 transcriptional antiterminator (BglG family), truncated str0625 rnr 2.092 exoribonuclease R str0630 ccpA 0.489 catabolite control protein str0649 - 2.296 7.315 negative transcriptional regualtor-PBP synthesis, truncated str0663 tex 2.434 4.710 transcriptional regulator, putative str0665 - 0.421 hypothetical protein str0689 - 2.093 restriction-modification system regulatory protein, putative str0792 - 0.186 0.154 response regulator (homolog to ciaR Spn), truncated str0813 dinG 0.459 2.941 ATP-dependent DNA helicase str0895 - 10.016 transcriptional regulator str0916 - 2.077 transcriptional regulator str0931 - 3.830 transcriptional regulator, TetR family str0950 fbp 2.039 fibronectin-binding protein-like protein A str1214 - 2.503 transcriptional repressor protein, putative str1287 - 2.523 3.974 transcriptional regulator, putative str1296 rncS 2.876 5.487 ribonuclease III str1325 rr06 2.554 4.326 response regulator (homolog to RR11 Spn) str1366 - 0.315 conserved hypothetical protein, Rrf2 family protein str1380 - 0.236 2.060 response regulator (homolog to RR08 Spn) uncoupled, truncated str1381 - 0.253 0.415 response regulator (homolog to RR08 Spn) uncoupled, truncated str1420 rr08 0.419 response regulator (homolog to RR03 Spn) str1425 pknB 2.757 protein kinase str1435 - 2.459 transcriptional regulator, GntR family, putative str1488 rpoD 2.319 RNA polymerase sigma factor str1568 rheA 2.454 ATP-dependent RNA helicase str1586 copY 0.370 0.314 negative transcriptional regulator - copper transport operon str1600 - 0.373 0.359 transcriptional regulator, MerR family str1699 rheB 2.174 ATP-dependent RNA helicase str1725 recG 0.483 ATP-dependent DNA helicase str1733 scrK 0.484 0.417 0.465 fructokinase str1736 - 4.534 sucrose regulon regulatory protein, truncated str1777 gnlR 0.212 transcriptional regulator, repressor of the glutamine synthetase, MerR family str1892 - 2.642 0.422 trehalose operon transcriptional repressor GntR family, truncated str1908 rpoA 0.296 DNA-directed RNA polymerase alpha subunit str1948 - 0.329 hypothetical protein str1989 - 0.220 hypothetical protein str1995 - 0.426 transcriptional regulator, TetR/AcrR family str2025 spoJ 0.378 0.241 chromosome segregation protein Translation, ribosomal structure and biogenesis str_r01 2.649 0.487 0.402 str_r03 2.292 0.465 0.375 str_r04 2.526 0.376 0.458 str_r05 0.397 0.298 0.464 str_r09 2.224 0.459 0.364 str_t01 0.186 str_t02 0.415 0.192 str_t03 0.333 2.839 str_t05 0.148 str_t06 0.343 str_t07 0.316 0.268 str_t08 0.467 0.470 0.189 2.699 str_t09 0.142 str_t10 0.077 str_t11 0.129 0.370 0.057 0.078 str_t13 0.195 str_t14 0.323 0.370 str_t15 0.438 str_t16 0.439 0.224 2.838 str_t17 0.306 0.404 0.465 0.226 str_t18 0.474 0.172 str_t23 0.243 str_t27 0.447 0.413 0.185 str_t30 0.198 str_t44 0.479 0.244 str_t46 0.280 0.444 0.187 str_t52 0.426 0.187 str_t54 0.421 0.278 0.287 str_t55 0.357 str_t59 0.346 str0007 - 0.445 conserved hypothetical protein, S4 domain protein str0047 argS 2.825 arginyl-tRNA synthetase str0081 pnpA 0.383 polynucleotide phosphorylase, (PNPase) str0211 - 2.672 2.662 ribosomal large subunit pseudouridine synthase, RluD subfamily str0220 leuS 2.136 2.164 leucyl-tRNA synthetase str0262 rluB 7.165 ribosomal large subunit pseudouridine synthase B str0267 - 4.484 0.298 rRNA methyltransferase, TrmH family str0329 serS 4.154 0.334 seryl-tRNA synthetase str0343 - 2.554 2.125 hypothetical protein str0344 infB 3.451 translation initiation factor IF-2 str0419 - 2.571 0.247 0.441 acetyltransferase, GNAT family, truncated str0420 - 2.415 0.278 0.498 acetyltransferase, GNAT family, truncated str0451 metG 0.365 methionine--tRNA ligase str0476 - 2.785 4.433 acetyltransferase, GNAT family str0477 valS 3.588 4.888 valyl-tRNA synthetase str0487 tuf 2.359 elongation factor Tu str0507 glyS 2.070 4.584 glycyl-tRNA synthetase beta subunit str0536 rplJ 5.891 50S ribosomal protein L10 str0537 rplL 4.078 50S ribosomal protein L7/L12 str0572 thrS 2.612 3.756 threonyl-tRNA synthetase str0592 rpsA 0.260 30S ribosomal protein S1 str0692 lysS 2.021 2.067 lysyl-tRNA synthetase str0741 ileS 2.176 2.626 isoleucyl-tRNA synthetase str0746 rpmE 0.440 50S ribosomal protein L31 str0752 prfA 0.420 peptide chain release factor 1 str0753 hemK 2.178 0.426 protoporphyrinogen oxidase str0824 - 2.049 conserved hypothetical protein, translation initiation inhibitor protein
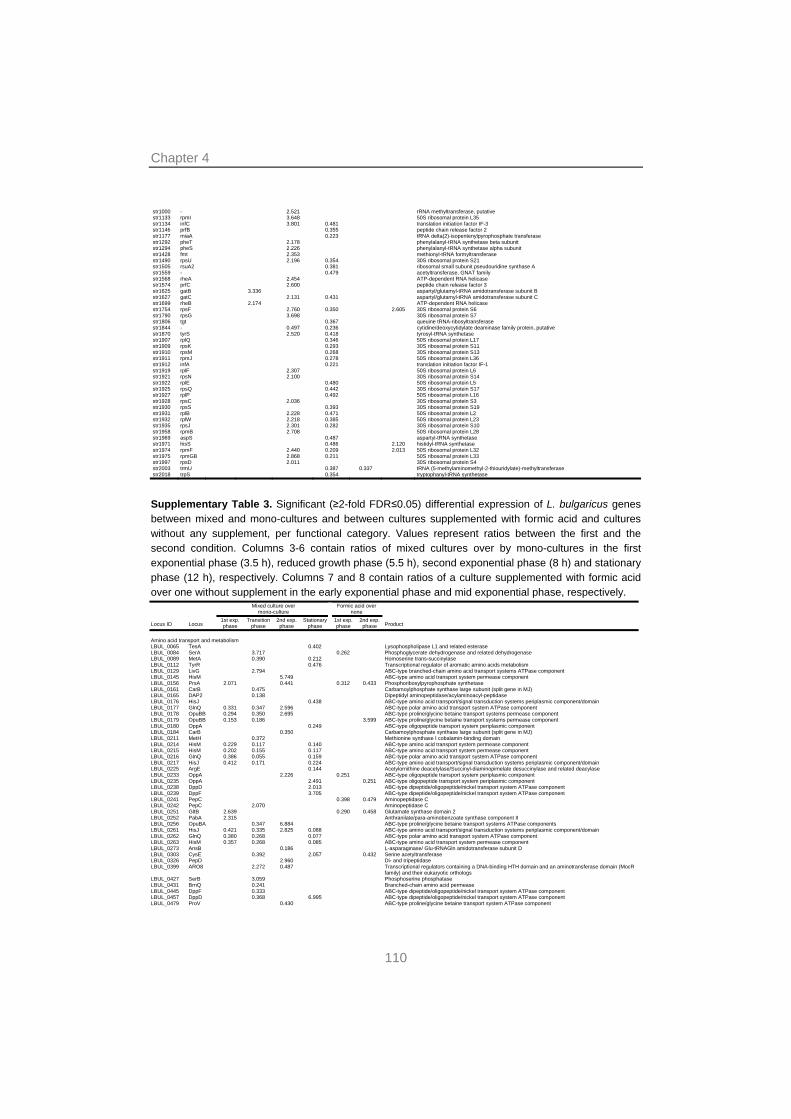
Chapter 4
110
str1000 - 2.521 rRNA methyltransferase, putative str1133 rpmI 3.648 50S ribosomal protein L35 str1134 infC 3.801 0.481 translation initiation factor IF-3 str1146 prfB 0.355 peptide chain release factor 2 str1177 miaA 0.223 tRNA delta(2)-isopentenylpyrophosphate transferase str1292 pheT 2.178 phenylalanyl-tRNA synthetase beta subunit str1294 pheS 2.226 phenylalanyl-tRNA synthetase alpha subunit str1428 fmt 2.353 methionyl-tRNA formyltransferase str1490 rpsU 2.196 0.354 30S ribosomal protein S21 str1505 rsuA2 0.381 ribosomal small subunit pseudouridine synthase A str1559 - 0.479 acetyltransferase, GNAT family str1568 rheA 2.454 ATP-dependent RNA helicase str1574 prfC 2.600 peptide chain release factor 3 str1625 gatB 3.336 aspartyl/glutamyl-tRNA amidotransferase subunit B str1627 gatC 2.131 0.431 aspartyl/glutamyl-tRNA amidotransferase subunit C str1699 rheB 2.174 ATP-dependent RNA helicase str1754 rpsF 2.760 0.350 2.605 30S ribosomal protein S6 str1790 rpsG 3.698 30S ribosomal protein S7 str1806 tgt 0.367 queuine tRNA-ribosyltransferase str1844 - 0.497 0.236 cytidine/deoxycytidylate deaminase family protein, putative str1870 tyrS 2.520 0.418 tyrosyl-tRNA synthetase str1907 rplQ 0.346 50S ribosomal protein L17 str1909 rpsK 0.293 30S ribosomal protein S11 str1910 rpsM 0.268 30S ribosomal protein S13 str1911 rpmJ 0.278 50S ribosomal protein L36 str1912 infA 0.221 translation initiation factor IF-1 str1919 rplF 2.307 50S ribosomal protein L6 str1921 rpsN 2.100 30S ribosomal protein S14 str1922 rplE 0.480 50S ribosomal protein L5 str1925 rpsQ 0.442 30S ribosomal protein S17 str1927 rplP 0.492 50S ribosomal protein L16 str1928 rpsC 2.036 30S ribosomal protein S3 str1930 rpsS 0.393 30S ribosomal protein S19 str1931 rplB 2.228 0.471 50S ribosomal protein L2 str1932 rplW 2.218 0.385 50S ribosomal protein L23 str1935 rpsJ 2.301 0.282 30S ribosomal protein S10 str1958 rpmB 2.708 50S ribosomal protein L28 str1969 aspS 0.487 aspartyl-tRNA synthetase str1971 hisS 0.486 2.120 histidyl-tRNA synthetase str1974 rpmF 2.440 0.209 2.013 50S ribosomal protein L32 str1975 rpmGB 2.868 0.211 50S ribosomal protein L33 str1997 rpsD 2.011 30S ribosomal protein S4 str2003 trmU 0.387 0.337 tRNA (5-methylaminomethyl-2-thiouridylate)-methyltransferase str2018 trpS 0.354 tryptophanyl-tRNA synthetase
Supplementary Table 3. Significant (≥2-fold FDR≤0.05) differential expression of L. bulgaricus genes between mixed and mono-cultures and between cultures supplemented with formic acid and cultures without any supplement, per functional category. Values represent ratios between the first and the second condition. Columns 3-6 contain ratios of mixed cultures over by mono-cultures in the first exponential phase (3.5 h), reduced growth phase (5.5 h), second exponential phase (8 h) and stationary phase (12 h), respectively. Columns 7 and 8 contain ratios of a culture supplemented with formic acid over one without supplement in the early exponential phase and mid exponential phase, respectively.
Mixed culture over mono-culture
Formic acid over none
Locus ID Locus 1st exp. phase
Transition phase
2nd exp. phase
Stationaryphase
1st exp. phase
2nd exp.phase Product
Amino acid transport and metabolism LBUL_0065 TesA 0.402 Lysophospholipase L1 and related esterase LBUL_0084 SerA 3.717 0.262 Phosphoglycerate dehydrogenase and related dehydrogenase LBUL_0089 MetA 0.390 0.212 Homoserine trans-succinylase LBUL_0112 TyrR 0.476 Transcriptional regulator of aromatic amino acids metabolism LBUL_0129 LivG 2.794 ABC-type branched-chain amino acid transport systems ATPase component LBUL_0145 HisM 5.749 ABC-type amino acid transport system permease component LBUL_0156 PrsA 2.071 0.441 0.312 0.433 Phosphoribosylpyrophosphate synthetase LBUL_0161 CarB 0.475 Carbamoylphosphate synthase large subunit (split gene in MJ) LBUL_0165 DAP2 0.138 Dipeptidyl aminopeptidase/acylaminoacyl-peptidase LBUL_0176 HisJ 0.438 ABC-type amino acid transport/signal transduction systems periplasmic component/domain LBUL_0177 GlnQ 0.331 0.347 2.596 ABC-type polar amino acid transport system ATPase component LBUL_0178 OpuBB 0.294 0.350 2.695 ABC-type proline/glycine betaine transport systems permease component LBUL_0179 OpuBB 0.153 0.186 3.599 ABC-type proline/glycine betaine transport systems permease component LBUL_0180 OppA 0.249 ABC-type oligopeptide transport system periplasmic component LBUL_0184 CarB 0.350 Carbamoylphosphate synthase large subunit (split gene in MJ) LBUL_0211 MetH 0.372 Methionine synthase I cobalamin-binding domain LBUL_0214 HisM 0.229 0.117 0.140 ABC-type amino acid transport system permease component LBUL_0215 HisM 0.202 0.155 0.117 ABC-type amino acid transport system permease component LBUL_0216 GlnQ 0.386 0.055 0.159 ABC-type polar amino acid transport system ATPase component LBUL_0217 HisJ 0.412 0.171 0.224 ABC-type amino acid transport/signal transduction systems periplasmic component/domain LBUL_0225 ArgE 0.144 Acetylornithine deacetylase/Succinyl-diaminopimelate desuccinylase and related deacylase LBUL_0233 OppA 2.226 0.251 ABC-type oligopeptide transport system periplasmic component LBUL_0235 OppA 2.491 0.251 ABC-type oligopeptide transport system periplasmic component LBUL_0238 DppD 2.013 ABC-type dipeptide/oligopeptide/nickel transport system ATPase component LBUL_0239 DppF 3.705 ABC-type dipeptide/oligopeptide/nickel transport system ATPase component LBUL_0241 PepC 0.398 0.479 Aminopeptidase C LBUL_0242 PepC 2.070 Aminopeptidase C LBUL_0251 GltB 2.639 0.290 0.458 Glutamate synthase domain 2 LBUL_0252 PabA 2.315 Anthranilate/para-aminobenzoate synthase component II LBUL_0256 OpuBA 0.347 6.884 ABC-type proline/glycine betaine transport systems ATPase components LBUL_0261 HisJ 0.421 0.335 2.825 0.088 ABC-type amino acid transport/signal transduction systems periplasmic component/domain LBUL_0262 GlnQ 0.380 0.268 0.077 ABC-type polar amino acid transport system ATPase component LBUL_0263 HisM 0.357 0.268 0.085 ABC-type amino acid transport system permease component LBUL_0273 AnsB 0.186 L-asparaginase/ Glu-tRNAGln amidotransferase subunit D LBUL_0303 CysE 0.392 2.057 0.432 Serine acetyltransferase LBUL_0326 PepD 2.960 Di- and tripeptidase LBUL_0399 ARO8 2.272 0.487 Transcriptional regulators containing a DNA-binding HTH domain and an aminotransferase domain (MocR
family) and their eukaryotic orthologs LBUL_0427 SerB 3.059 Phosphoserine phosphatase LBUL_0431 BrnQ 0.241 Branched-chain amino acid permease LBUL_0445 DppF 0.333 ABC-type dipeptide/oligopeptide/nickel transport system ATPase component LBUL_0457 DppD 0.368 6.995 ABC-type dipeptide/oligopeptide/nickel transport system ATPase component LBUL_0479 ProV 0.430 ABC-type proline/glycine betaine transport system ATPase component
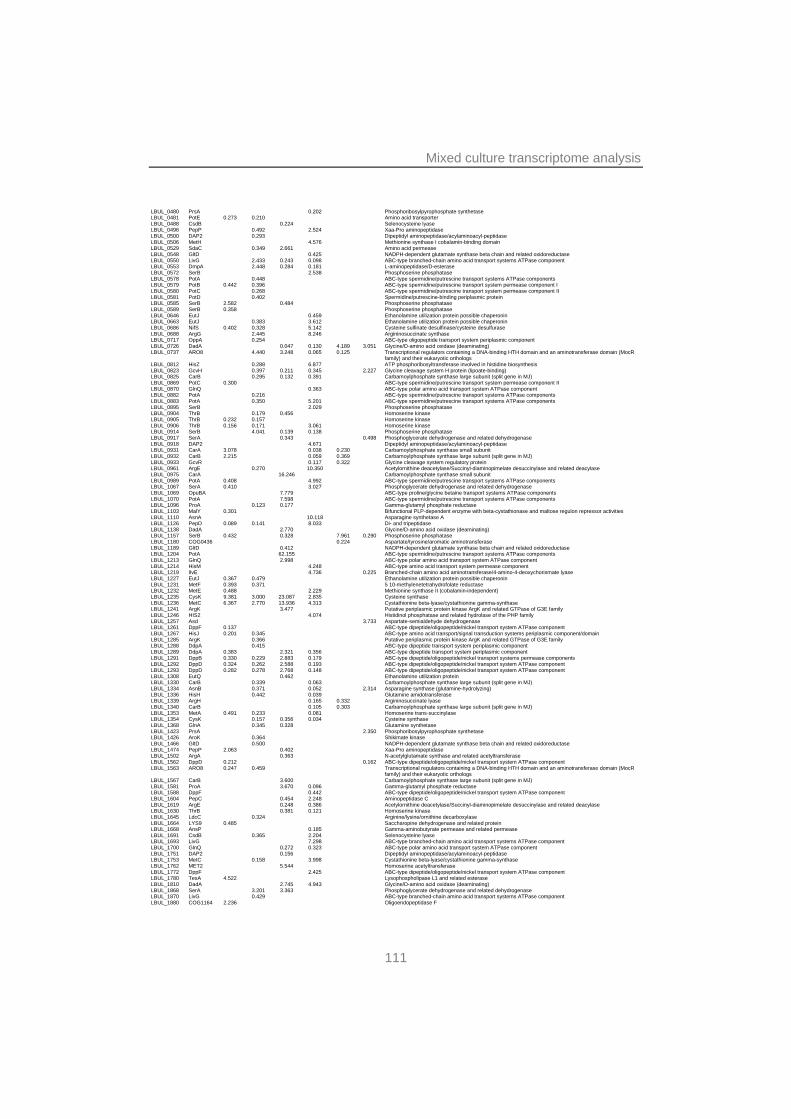
Mixed culture transcriptome analysis
111
LBUL_0480 PrsA 0.202 Phosphoribosylpyrophosphate synthetase LBUL_0481 PotE 0.273 0.210 Amino acid transporter LBUL_0488 CsdB 0.224 Selenocysteine lyase LBUL_0496 PepP 0.492 2.524 Xaa-Pro aminopeptidase LBUL_0500 DAP2 0.293 Dipeptidyl aminopeptidase/acylaminoacyl-peptidase LBUL_0506 MetH 4.576 Methionine synthase I cobalamin-binding domain LBUL_0529 SdaC 0.349 2.661 Amino acid permease LBUL_0548 GltD 0.425 NADPH-dependent glutamate synthase beta chain and related oxidoreductase LBUL_0550 LivG 2.433 0.243 0.098 ABC-type branched-chain amino acid transport systems ATPase component LBUL_0553 DmpA 2.448 0.284 0.181 L-aminopeptidase/D-esterase LBUL_0572 SerB 2.538 Phosphoserine phosphatase LBUL_0578 PotA 0.448 ABC-type spermidine/putrescine transport systems ATPase components LBUL_0579 PotB 0.442 0.396 ABC-type spermidine/putrescine transport system permease component I LBUL_0580 PotC 0.268 ABC-type spermidine/putrescine transport system permease component II LBUL_0581 PotD 0.402 Spermidine/putrescine-binding periplasmic protein LBUL_0585 SerB 2.582 0.484 Phosphoserine phosphatase LBUL_0589 SerB 0.358 Phosphoserine phosphatase LBUL_0646 EutJ 0.459 Ethanolamine utilization protein possible chaperonin LBUL_0663 EutJ 0.383 3.612 Ethanolamine utilization protein possible chaperonin LBUL_0686 NifS 0.402 0.328 5.142 Cysteine sulfinate desulfinase/cysteine desulfurase LBUL_0688 ArgG 2.445 8.246 Argininosuccinate synthase LBUL_0717 OppA 0.254 ABC-type oligopeptide transport system periplasmic component LBUL_0726 DadA 0.047 0.130 4.189 3.051 Glycine/D-amino acid oxidase (deaminating) LBUL_0737 ARO8 4.440 3.248 0.065 0.125 Transcriptional regulators containing a DNA-binding HTH domain and an aminotransferase domain (MocR
family) and their eukaryotic orthologs LBUL_0812 HisZ 0.288 6.877 ATP phosphoribosyltransferase involved in histidine biosynthesis LBUL_0823 GcvH 0.397 0.211 0.345 2.227 Glycine cleavage system H protein (lipoate-binding) LBUL_0825 CarB 0.295 0.132 0.391 Carbamoylphosphate synthase large subunit (split gene in MJ) LBUL_0869 PotC 0.300 ABC-type spermidine/putrescine transport system permease component II LBUL_0870 GlnQ 0.363 ABC-type polar amino acid transport system ATPase component LBUL_0882 PotA 0.216 ABC-type spermidine/putrescine transport systems ATPase components LBUL_0883 PotA 0.350 5.201 ABC-type spermidine/putrescine transport systems ATPase components LBUL_0895 SerB 2.029 Phosphoserine phosphatase LBUL_0904 ThrB 0.179 0.456 Homoserine kinase LBUL_0905 ThrB 0.232 0.157 Homoserine kinase LBUL_0906 ThrB 0.156 0.171 3.061 Homoserine kinase LBUL_0914 SerB 4.041 0.139 0.138 Phosphoserine phosphatase LBUL_0917 SerA 0.343 0.498 Phosphoglycerate dehydrogenase and related dehydrogenase LBUL_0918 DAP2 4.671 Dipeptidyl aminopeptidase/acylaminoacyl-peptidase LBUL_0931 CarA 3.078 0.038 0.230 Carbamoylphosphate synthase small subunit LBUL_0932 CarB 2.215 0.059 0.369 Carbamoylphosphate synthase large subunit (split gene in MJ) LBUL_0933 GcvR 0.117 0.322 Glycine cleavage system regulatory protein LBUL_0961 ArgE 0.270 10.350 Acetylornithine deacetylase/Succinyl-diaminopimelate desuccinylase and related deacylase LBUL_0975 CarA 16.246 Carbamoylphosphate synthase small subunit LBUL_0989 PotA 0.408 4.992 ABC-type spermidine/putrescine transport systems ATPase components LBUL_1067 SerA 0.410 3.027 Phosphoglycerate dehydrogenase and related dehydrogenase LBUL_1069 OpuBA 7.779 ABC-type proline/glycine betaine transport systems ATPase components LBUL_1070 PotA 7.598 ABC-type spermidine/putrescine transport systems ATPase components LBUL_1096 ProA 0.123 0.177 Gamma-glutamyl phosphate reductase LBUL_1103 MalY 0.301 Bifunctional PLP-dependent enzyme with beta-cystathionase and maltose regulon repressor activities LBUL_1110 AsnA 10.118 Asparagine synthetase A LBUL_1126 PepD 0.089 0.141 8.033 Di- and tripeptidase LBUL_1138 DadA 2.770 Glycine/D-amino acid oxidase (deaminating) LBUL_1157 SerB 0.432 0.328 7.961 0.290 Phosphoserine phosphatase LBUL_1180 COG0436 0.224 Aspartate/tyrosine/aromatic aminotransferase LBUL_1189 GltD 0.412 NADPH-dependent glutamate synthase beta chain and related oxidoreductase LBUL_1204 PotA 62.155 ABC-type spermidine/putrescine transport systems ATPase components LBUL_1213 GlnQ 2.998 ABC-type polar amino acid transport system ATPase component LBUL_1214 HisM 4.248 ABC-type amino acid transport system permease component LBUL_1219 IlvE 4.736 0.225 Branched-chain amino acid aminotransferase/4-amino-4-deoxychorismate lyase LBUL_1227 EutJ 0.367 0.479 Ethanolamine utilization protein possible chaperonin LBUL_1231 MetF 0.393 0.371 5 10-methylenetetrahydrofolate reductase LBUL_1232 MetE 0.488 2.229 Methionine synthase II (cobalamin-independent) LBUL_1235 CysK 9.381 3.000 23.087 2.835 Cysteine synthase LBUL_1236 MetC 6.367 2.770 13.936 4.313 Cystathionine beta-lyase/cystathionine gamma-synthase LBUL_1241 ArgK 3.477 Putative periplasmic protein kinase ArgK and related GTPase of G3E family LBUL_1246 HIS2 4.074 Histidinol phosphatase and related hydrolase of the PHP family LBUL_1257 Asd 3.733 Aspartate-semialdehyde dehydrogenase LBUL_1261 DppF 0.137 ABC-type dipeptide/oligopeptide/nickel transport system ATPase component LBUL_1267 HisJ 0.201 0.345 ABC-type amino acid transport/signal transduction systems periplasmic component/domain LBUL_1285 ArgK 0.366 Putative periplasmic protein kinase ArgK and related GTPase of G3E family LBUL_1288 DdpA 0.415 ABC-type dipeptide transport system periplasmic component LBUL_1289 DdpA 0.383 2.321 0.356 ABC-type dipeptide transport system periplasmic component LBUL_1291 DppB 0.330 0.229 2.883 0.179 ABC-type dipeptide/oligopeptide/nickel transport systems permease components LBUL_1292 DppD 0.324 0.262 2.588 0.193 ABC-type dipeptide/oligopeptide/nickel transport system ATPase component LBUL_1293 DppD 0.282 0.278 2.768 0.148 ABC-type dipeptide/oligopeptide/nickel transport system ATPase component LBUL_1308 EutQ 0.462 Ethanolamine utilization protein LBUL_1330 CarB 0.339 0.063 Carbamoylphosphate synthase large subunit (split gene in MJ) LBUL_1334 AsnB 0.371 0.052 2.314 Asparagine synthase (glutamine-hydrolyzing) LBUL_1336 HisH 0.442 0.039 Glutamine amidotransferase LBUL_1339 ArgH 0.165 0.332 Argininosuccinate lyase LBUL_1340 CarB 0.105 0.303 Carbamoylphosphate synthase large subunit (split gene in MJ) LBUL_1353 MetA 0.491 0.233 0.081 Homoserine trans-succinylase LBUL_1354 CysK 0.157 0.356 0.034 Cysteine synthase LBUL_1368 GlnA 0.345 0.328 Glutamine synthetase LBUL_1423 PrsA 2.350 Phosphoribosylpyrophosphate synthetase LBUL_1426 AroK 0.364 Shikimate kinase LBUL_1466 GltD 0.500 NADPH-dependent glutamate synthase beta chain and related oxidoreductase LBUL_1474 PepP 2.063 0.402 Xaa-Pro aminopeptidase LBUL_1502 ArgA 0.363 N-acetylglutamate synthase and related acetyltransferase LBUL_1562 DppD 0.212 0.162 ABC-type dipeptide/oligopeptide/nickel transport system ATPase component LBUL_1563 ARO8 0.247 0.459 Transcriptional regulators containing a DNA-binding HTH domain and an aminotransferase domain (MocR
family) and their eukaryotic orthologs LBUL_1567 CarB 3.600 Carbamoylphosphate synthase large subunit (split gene in MJ) LBUL_1581 ProA 3.670 0.096 Gamma-glutamyl phosphate reductase LBUL_1588 DppF 0.442 ABC-type dipeptide/oligopeptide/nickel transport system ATPase component LBUL_1604 PepC 0.454 2.248 Aminopeptidase C LBUL_1619 ArgE 0.248 0.386 Acetylornithine deacetylase/Succinyl-diaminopimelate desuccinylase and related deacylase LBUL_1630 ThrB 0.381 0.121 Homoserine kinase LBUL_1645 LdcC 0.324 Arginine/lysine/ornithine decarboxylase LBUL_1664 LYS9 0.485 Saccharopine dehydrogenase and related protein LBUL_1668 AnsP 0.185 Gamma-aminobutyrate permease and related permease LBUL_1691 CsdB 0.365 2.204 Selenocysteine lyase LBUL_1693 LivG 7.298 ABC-type branched-chain amino acid transport systems ATPase component LBUL_1700 GlnQ 0.272 0.323 ABC-type polar amino acid transport system ATPase component LBUL_1751 DAP2 0.156 Dipeptidyl aminopeptidase/acylaminoacyl-peptidase LBUL_1753 MetC 0.158 3.998 Cystathionine beta-lyase/cystathionine gamma-synthase LBUL_1762 MET2 5.544 Homoserine acetyltransferase LBUL_1772 DppF 2.425 ABC-type dipeptide/oligopeptide/nickel transport system ATPase component LBUL_1780 TesA 4.522 Lysophospholipase L1 and related esterase LBUL_1810 DadA 2.745 4.943 Glycine/D-amino acid oxidase (deaminating) LBUL_1868 SerA 3.201 3.363 Phosphoglycerate dehydrogenase and related dehydrogenase LBUL_1870 LivG 0.429 ABC-type branched-chain amino acid transport systems ATPase component LBUL_1880 COG1164 2.236 Oligoendopeptidase F
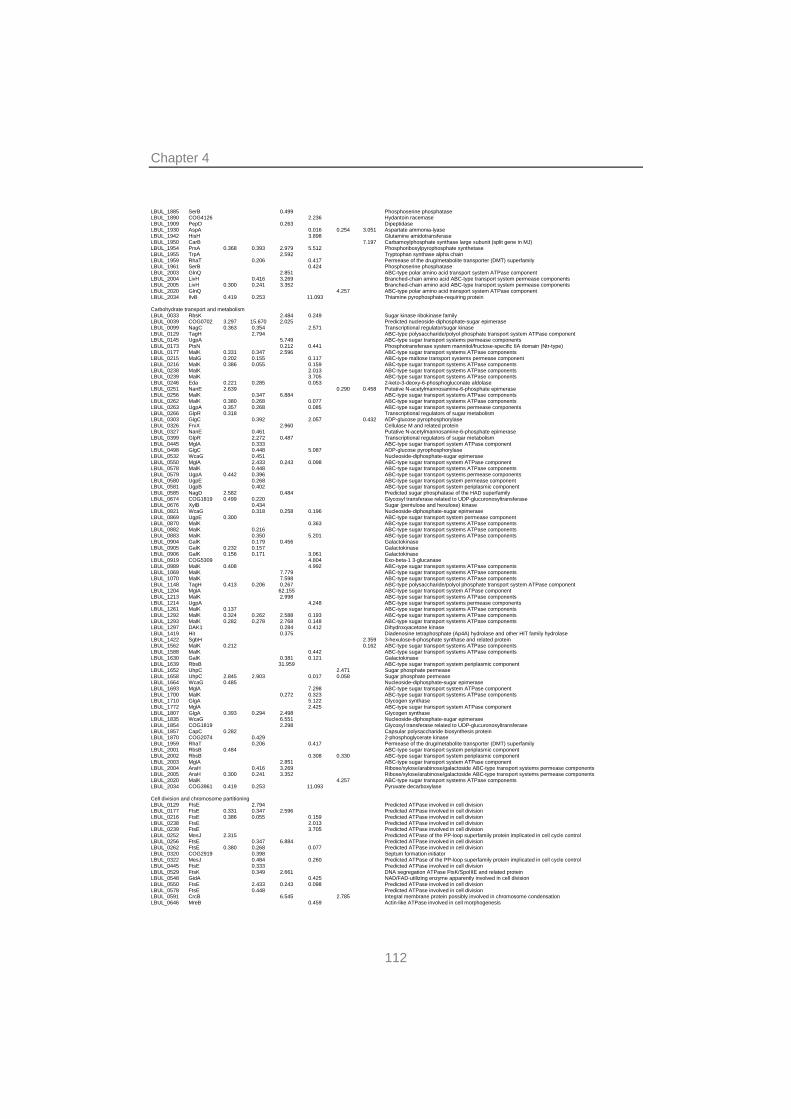
Chapter 4
112
LBUL_1885 SerB 0.499 Phosphoserine phosphatase LBUL_1890 COG4126 2.236 Hydantoin racemase LBUL_1909 PepD 0.263 Dipeptidase LBUL_1930 AspA 0.016 0.254 3.051 Aspartate ammonia-lyase LBUL_1942 HisH 3.898 Glutamine amidotransferase LBUL_1950 CarB 7.197 Carbamoylphosphate synthase large subunit (split gene in MJ) LBUL_1954 PrsA 0.368 0.393 2.979 5.512 Phosphoribosylpyrophosphate synthetase LBUL_1955 TrpA 2.592 Tryptophan synthase alpha chain LBUL_1959 RhaT 0.206 0.417 Permease of the drug/metabolite transporter (DMT) superfamily LBUL_1961 SerB 0.424 Phosphoserine phosphatase LBUL_2003 GlnQ 2.851 ABC-type polar amino acid transport system ATPase component LBUL_2004 LivH 0.416 3.269 Branched-chain amino acid ABC-type transport system permease components LBUL_2005 LivH 0.300 0.241 3.352 Branched-chain amino acid ABC-type transport system permease components LBUL_2020 GlnQ 4.257 ABC-type polar amino acid transport system ATPase component LBUL_2034 IlvB 0.419 0.253 11.093 Thiamine pyrophosphate-requiring protein
Carbohydrate transport and metabolism LBUL_0033 RbsK 2.484 0.249 Sugar kinase ribokinase family LBUL_0039 COG0702 3.297 15.670 2.025 Predicted nucleoside-diphosphate-sugar epimerase LBUL_0099 NagC 0.363 0.354 2.571 Transcriptional regulator/sugar kinase LBUL_0129 TagH 2.794 ABC-type polysaccharide/polyol phosphate transport system ATPase component LBUL_0145 UgpA 5.749 ABC-type sugar transport systems permease components LBUL_0173 PtsN 0.212 0.441 Phosphotransferase system mannitol/fructose-specific IIA domain (Ntr-type) LBUL_0177 MalK 0.331 0.347 2.596 ABC-type sugar transport systems ATPase components LBUL_0215 MalG 0.202 0.155 0.117 ABC-type maltose transport systems permease component LBUL_0216 MalK 0.386 0.055 0.159 ABC-type sugar transport systems ATPase components LBUL_0238 MalK 2.013 ABC-type sugar transport systems ATPase components LBUL_0239 MalK 3.705 ABC-type sugar transport systems ATPase components LBUL_0246 Eda 0.221 0.285 0.053 2-keto-3-deoxy-6-phosphogluconate aldolase LBUL_0251 NanE 2.639 0.290 0.458 Putative N-acetylmannosamine-6-phosphate epimerase LBUL_0256 MalK 0.347 6.884 ABC-type sugar transport systems ATPase components LBUL_0262 MalK 0.380 0.268 0.077 ABC-type sugar transport systems ATPase components LBUL_0263 UgpA 0.357 0.268 0.085 ABC-type sugar transport systems permease components LBUL_0266 GlpR 0.318 Transcriptional regulators of sugar metabolism LBUL_0303 GlgC 0.392 2.057 0.432 ADP-glucose pyrophosphorylase LBUL_0326 FrvX 2.960 Cellulase M and related protein LBUL_0327 NanE 0.461 Putative N-acetylmannosamine-6-phosphate epimerase LBUL_0399 GlpR 2.272 0.487 Transcriptional regulators of sugar metabolism LBUL_0445 MglA 0.333 ABC-type sugar transport system ATPase component LBUL_0498 GlgC 0.448 5.087 ADP-glucose pyrophosphorylase LBUL_0532 WcaG 0.451 Nucleoside-diphosphate-sugar epimerase LBUL_0550 MglA 2.433 0.243 0.098 ABC-type sugar transport system ATPase component LBUL_0578 MalK 0.448 ABC-type sugar transport systems ATPase components LBUL_0579 UgpA 0.442 0.396 ABC-type sugar transport systems permease components LBUL_0580 UgpE 0.268 ABC-type sugar transport system permease component LBUL_0581 UgpB 0.402 ABC-type sugar transport system periplasmic component LBUL_0585 NagD 2.582 0.484 Predicted sugar phosphatase of the HAD superfamily LBUL_0674 COG1819 0.499 0.220 Glycosyl transferase related to UDP-glucuronosyltransferase LBUL_0676 XylB 0.434 Sugar (pentulose and hexulose) kinase LBUL_0821 WcaG 0.318 0.258 0.196 Nucleoside-diphosphate-sugar epimerase LBUL_0869 UgpE 0.300 ABC-type sugar transport system permease component LBUL_0870 MalK 0.363 ABC-type sugar transport systems ATPase components LBUL_0882 MalK 0.216 ABC-type sugar transport systems ATPase components LBUL_0883 MalK 0.350 5.201 ABC-type sugar transport systems ATPase components LBUL_0904 GalK 0.179 0.456 Galactokinase LBUL_0905 GalK 0.232 0.157 Galactokinase LBUL_0906 GalK 0.156 0.171 3.061 Galactokinase LBUL_0919 COG5309 4.804 Exo-beta-1 3-glucanase LBUL_0989 MalK 0.408 4.992 ABC-type sugar transport systems ATPase components LBUL_1069 MalK 7.779 ABC-type sugar transport systems ATPase components LBUL_1070 MalK 7.598 ABC-type sugar transport systems ATPase components LBUL_1148 TagH 0.413 0.206 0.267 ABC-type polysaccharide/polyol phosphate transport system ATPase component LBUL_1204 MglA 62.155 ABC-type sugar transport system ATPase component LBUL_1213 MalK 2.998 ABC-type sugar transport systems ATPase components LBUL_1214 UgpA 4.248 ABC-type sugar transport systems permease components LBUL_1261 MalK 0.137 ABC-type sugar transport systems ATPase components LBUL_1292 MalK 0.324 0.262 2.588 0.193 ABC-type sugar transport systems ATPase components LBUL_1293 MalK 0.282 0.278 2.768 0.148 ABC-type sugar transport systems ATPase components LBUL_1297 DAK1 0.284 0.412 Dihydroxyacetone kinase LBUL_1419 Hit 0.375 Diadenosine tetraphosphate (Ap4A) hydrolase and other HIT family hydrolase LBUL_1422 SgbH 2.359 3-hexulose-6-phosphate synthase and related protein LBUL_1562 MalK 0.212 0.162 ABC-type sugar transport systems ATPase components LBUL_1588 MalK 0.442 ABC-type sugar transport systems ATPase components LBUL_1630 GalK 0.381 0.121 Galactokinase LBUL_1639 RbsB 31.959 ABC-type sugar transport system periplasmic component LBUL_1652 UhpC 2.471 Sugar phosphate permease LBUL_1658 UhpC 2.845 2.903 0.017 0.058 Sugar phosphate permease LBUL_1664 WcaG 0.485 Nucleoside-diphosphate-sugar epimerase LBUL_1693 MglA 7.298 ABC-type sugar transport system ATPase component LBUL_1700 MalK 0.272 0.323 ABC-type sugar transport systems ATPase components LBUL_1710 GlgA 5.122 Glycogen synthase LBUL_1772 MglA 2.425 ABC-type sugar transport system ATPase component LBUL_1807 GlgA 0.393 0.294 2.498 Glycogen synthase LBUL_1835 WcaG 6.551 Nucleoside-diphosphate-sugar epimerase LBUL_1854 COG1819 2.298 Glycosyl transferase related to UDP-glucuronosyltransferase LBUL_1857 CapC 0.282 Capsular polysaccharide biosynthesis protein LBUL_1870 COG2074 0.429 2-phosphoglycerate kinase LBUL_1959 RhaT 0.206 0.417 Permease of the drug/metabolite transporter (DMT) superfamily LBUL_2001 RbsB 0.484 ABC-type sugar transport system periplasmic component LBUL_2002 RbsB 0.308 0.330 ABC-type sugar transport system periplasmic component LBUL_2003 MglA 2.851 ABC-type sugar transport system ATPase component LBUL_2004 AraH 0.416 3.269 Ribose/xylose/arabinose/galactoside ABC-type transport systems permease components LBUL_2005 AraH 0.300 0.241 3.352 Ribose/xylose/arabinose/galactoside ABC-type transport systems permease components LBUL_2020 MalK 4.257 ABC-type sugar transport systems ATPase components LBUL_2034 COG3961 0.419 0.253 11.093 Pyruvate decarboxylase
Cell division and chromosome partitioning LBUL_0129 FtsE 2.794 Predicted ATPase involved in cell division LBUL_0177 FtsE 0.331 0.347 2.596 Predicted ATPase involved in cell division LBUL_0216 FtsE 0.386 0.055 0.159 Predicted ATPase involved in cell division LBUL_0238 FtsE 2.013 Predicted ATPase involved in cell division LBUL_0239 FtsE 3.705 Predicted ATPase involved in cell division LBUL_0252 MesJ 2.315 Predicted ATPase of the PP-loop superfamily protein implicated in cell cycle control LBUL_0256 FtsE 0.347 6.884 Predicted ATPase involved in cell division LBUL_0262 FtsE 0.380 0.268 0.077 Predicted ATPase involved in cell division LBUL_0320 COG2919 0.398 Septum formation initiator LBUL_0322 MesJ 0.484 0.260 Predicted ATPase of the PP-loop superfamily protein implicated in cell cycle control LBUL_0445 FtsE 0.333 Predicted ATPase involved in cell division LBUL_0529 FtsK 0.349 2.661 DNA segregation ATPase FtsK/SpoIIIE and related protein LBUL_0548 GidA 0.425 NAD/FAD-utilizing enzyme apparently involved in cell division LBUL_0550 FtsE 2.433 0.243 0.098 Predicted ATPase involved in cell division LBUL_0578 FtsE 0.448 Predicted ATPase involved in cell division LBUL_0591 CrcB 6.545 2.785 Integral membrane protein possibly involved in chromosome condensation LBUL_0646 MreB 0.459 Actin-like ATPase involved in cell morphogenesis
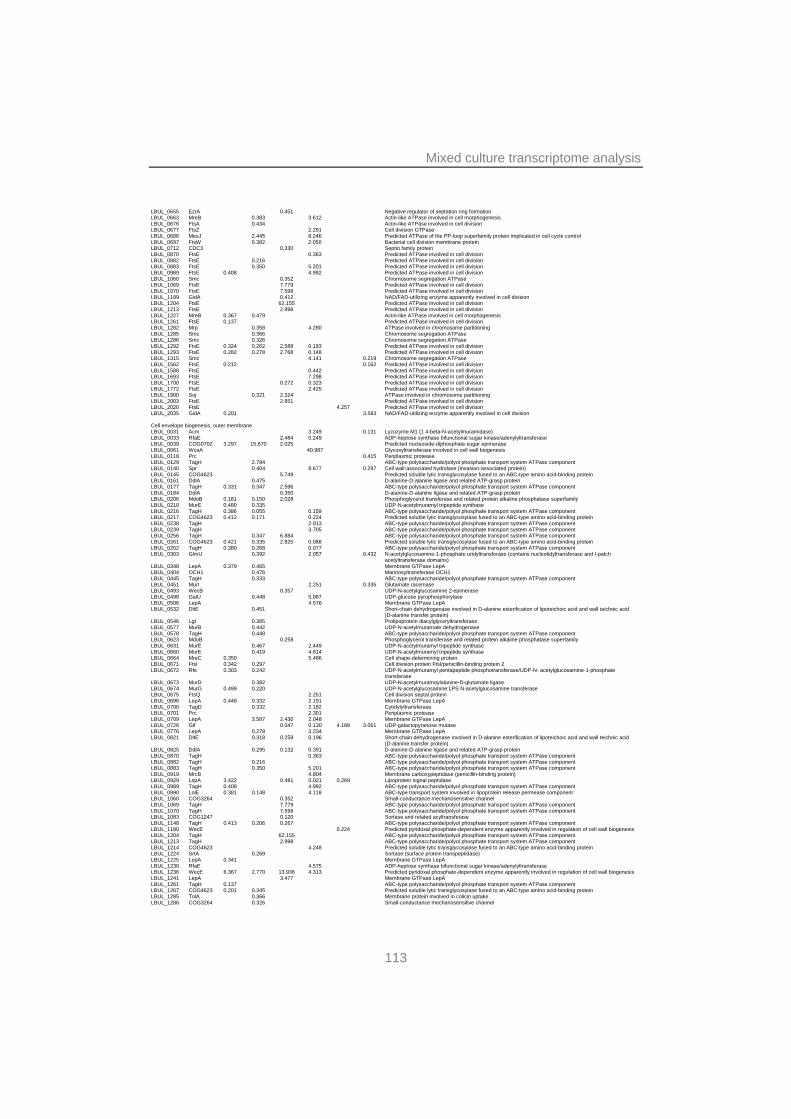
Mixed culture transcriptome analysis
113
LBUL_0655 EzrA 0.451 Negative regulator of septation ring formation LBUL_0663 MreB 0.383 3.612 Actin-like ATPase involved in cell morphogenesis LBUL_0676 FtsA 0.434 Actin-like ATPase involved in cell division LBUL_0677 FtsZ 2.291 Cell division GTPase LBUL_0688 MesJ 2.445 8.246 Predicted ATPase of the PP-loop superfamily protein implicated in cell cycle control LBUL_0697 FtsW 0.382 2.050 Bacterial cell division membrane protein LBUL_0712 CDC3 0.330 Septin family protein LBUL_0870 FtsE 0.363 Predicted ATPase involved in cell division LBUL_0882 FtsE 0.216 Predicted ATPase involved in cell division LBUL_0883 FtsE 0.350 5.201 Predicted ATPase involved in cell division LBUL_0989 FtsE 0.408 4.992 Predicted ATPase involved in cell division LBUL_1060 Smc 0.352 Chromosome segregation ATPase LBUL_1069 FtsE 7.779 Predicted ATPase involved in cell division LBUL_1070 FtsE 7.598 Predicted ATPase involved in cell division LBUL_1189 GidA 0.412 NAD/FAD-utilizing enzyme apparently involved in cell division LBUL_1204 FtsE 62.155 Predicted ATPase involved in cell division LBUL_1213 FtsE 2.998 Predicted ATPase involved in cell division LBUL_1227 MreB 0.367 0.479 Actin-like ATPase involved in cell morphogenesis LBUL_1261 FtsE 0.137 Predicted ATPase involved in cell division LBUL_1282 Mrp 0.358 4.280 ATPase involved in chromosome partitioning LBUL_1285 Smc 0.366 Chromosome segregation ATPase LBUL_1286 Smc 0.326 Chromosome segregation ATPase LBUL_1292 FtsE 0.324 0.262 2.588 0.193 Predicted ATPase involved in cell division LBUL_1293 FtsE 0.282 0.278 2.768 0.148 Predicted ATPase involved in cell division LBUL_1315 Smc 4.141 0.219 Chromosome segregation ATPase LBUL_1562 FtsE 0.212 0.162 Predicted ATPase involved in cell division LBUL_1588 FtsE 0.442 Predicted ATPase involved in cell division LBUL_1693 FtsE 7.298 Predicted ATPase involved in cell division LBUL_1700 FtsE 0.272 0.323 Predicted ATPase involved in cell division LBUL_1772 FtsE 2.425 Predicted ATPase involved in cell division LBUL_1900 Soj 0.321 2.324 ATPase involved in chromosome partitioning LBUL_2003 FtsE 2.851 Predicted ATPase involved in cell division LBUL_2020 FtsE 4.257 Predicted ATPase involved in cell division LBUL_2035 GidA 0.201 3.583 NAD/FAD-utilizing enzyme apparently involved in cell division
Cell envelope biogenesis, outer membrane LBUL_0031 Acm 3.249 0.131 Lyzozyme M1 (1 4-beta-N-acetylmuramidase) LBUL_0033 RfaE 2.484 0.249 ADP-heptose synthase bifunctional sugar kinase/adenylyltransferase LBUL_0039 COG0702 3.297 15.670 2.025 Predicted nucleoside-diphosphate-sugar epimerase LBUL_0061 WcaA 40.987 Glycosyltransferase involved in cell wall biogenesis LBUL_0118 Prc 0.415 Periplasmic protease LBUL_0129 TagH 2.794 ABC-type polysaccharide/polyol phosphate transport system ATPase component LBUL_0140 Spr 0.404 8.677 0.297 Cell wall-associated hydrolase (invasion-associated protein) LBUL_0145 COG4623 5.749 Predicted soluble lytic transglycosylase fused to an ABC-type amino acid-binding protein LBUL_0161 DdlA 0.475 D-alanine-D-alanine ligase and related ATP-grasp protein LBUL_0177 TagH 0.331 0.347 2.596 ABC-type polysaccharide/polyol phosphate transport system ATPase component LBUL_0184 DdlA 0.350 D-alanine-D-alanine ligase and related ATP-grasp protein LBUL_0206 MdoB 0.181 0.150 2.028 Phosphoglycerol transferase and related protein alkaline phosphatase superfamily LBUL_0210 MurE 0.480 0.335 UDP-N-acetylmuramyl tripeptide synthase LBUL_0216 TagH 0.386 0.055 0.159 ABC-type polysaccharide/polyol phosphate transport system ATPase component LBUL_0217 COG4623 0.412 0.171 0.224 Predicted soluble lytic transglycosylase fused to an ABC-type amino acid-binding protein LBUL_0238 TagH 2.013 ABC-type polysaccharide/polyol phosphate transport system ATPase component LBUL_0239 TagH 3.705 ABC-type polysaccharide/polyol phosphate transport system ATPase component LBUL_0256 TagH 0.347 6.884 ABC-type polysaccharide/polyol phosphate transport system ATPase component LBUL_0261 COG4623 0.421 0.335 2.825 0.088 Predicted soluble lytic transglycosylase fused to an ABC-type amino acid-binding protein LBUL_0262 TagH 0.380 0.268 0.077 ABC-type polysaccharide/polyol phosphate transport system ATPase component LBUL_0303 GlmU 0.392 2.057 0.432 N-acetylglucosamine-1-phosphate uridyltransferase (contains nucleotidyltransferase and I-patch
acetyltransferase domains) LBUL_0348 LepA 0.379 0.465 Membrane GTPase LepA LBUL_0404 OCH1 0.476 Mannosyltransferase OCH1 LBUL_0445 TagH 0.333 ABC-type polysaccharide/polyol phosphate transport system ATPase component LBUL_0451 MurI 2.251 0.335 Glutamate racemase LBUL_0493 WecB 0.357 UDP-N-acetylglucosamine 2-epimerase LBUL_0498 GalU 0.448 5.087 UDP-glucose pyrophosphorylase LBUL_0506 LepA 4.576 Membrane GTPase LepA LBUL_0532 DltE 0.451 Short-chain dehydrogenase involved in D-alanine esterification of lipoteichoic acid and wall teichoic acid
(D-alanine transfer protein) LBUL_0546 Lgt 0.385 Prolipoprotein diacylglyceryltransferase LBUL_0577 MurB 0.442 UDP-N-acetylmuramate dehydrogenase LBUL_0578 TagH 0.448 ABC-type polysaccharide/polyol phosphate transport system ATPase component LBUL_0623 MdoB 0.258 Phosphoglycerol transferase and related protein alkaline phosphatase superfamily LBUL_0631 MurE 0.467 2.449 UDP-N-acetylmuramyl tripeptide synthase LBUL_0660 MurE 0.419 4.814 UDP-N-acetylmuramyl tripeptide synthase LBUL_0664 MreC 0.350 5.486 Cell shape-determining protein LBUL_0671 FtsI 0.342 0.297 Cell division protein FtsI/penicillin-binding protein 2 LBUL_0672 Rfe 0.303 0.242 UDP-N-acetylmuramyl pentapeptide phosphotransferase/UDP-N- acetylglucosamine-1-phosphate
transferase LBUL_0673 MurD 0.382 UDP-N-acetylmuramoylalanine-D-glutamate ligase LBUL_0674 MurG 0.499 0.220 UDP-N-acetylglucosamine:LPS N-acetylglucosamine transferase LBUL_0675 FtsQ 2.251 Cell division septal protein LBUL_0696 LepA 0.448 0.332 2.191 Membrane GTPase LepA LBUL_0700 TagD 0.332 2.182 Cytidylyltransferase LBUL_0701 Prc 2.301 Periplasmic protease LBUL_0709 LepA 3.587 2.430 2.048 Membrane GTPase LepA LBUL_0726 Glf 0.047 0.130 4.189 3.051 UDP-galactopyranose mutase LBUL_0776 LepA 0.278 3.234 Membrane GTPase LepA LBUL_0821 DltE 0.318 0.258 0.196 Short-chain dehydrogenase involved in D-alanine esterification of lipoteichoic acid and wall teichoic acid
(D-alanine transfer protein) LBUL_0825 DdlA 0.295 0.132 0.391 D-alanine-D-alanine ligase and related ATP-grasp protein LBUL_0870 TagH 0.363 ABC-type polysaccharide/polyol phosphate transport system ATPase component LBUL_0882 TagH 0.216 ABC-type polysaccharide/polyol phosphate transport system ATPase component LBUL_0883 TagH 0.350 5.201 ABC-type polysaccharide/polyol phosphate transport system ATPase component LBUL_0919 MrcB 4.804 Membrane carboxypeptidase (penicillin-binding protein) LBUL_0929 LspA 3.422 0.481 0.021 0.269 Lipoprotein signal peptidase LBUL_0989 TagH 0.408 4.992 ABC-type polysaccharide/polyol phosphate transport system ATPase component LBUL_0990 LolE 0.381 0.148 4.118 ABC-type transport system involved in lipoprotein release permease component LBUL_1060 COG3264 0.352 Small-conductance mechanosensitive channel LBUL_1069 TagH 7.779 ABC-type polysaccharide/polyol phosphate transport system ATPase component LBUL_1070 TagH 7.598 ABC-type polysaccharide/polyol phosphate transport system ATPase component LBUL_1083 COG1247 0.120 Sortase and related acyltransferase LBUL_1148 TagH 0.413 0.206 0.267 ABC-type polysaccharide/polyol phosphate transport system ATPase component LBUL_1180 WecE 0.224 Predicted pyridoxal phosphate-dependent enzyme apparently involved in regulation of cell wall biogenesis LBUL_1204 TagH 62.155 ABC-type polysaccharide/polyol phosphate transport system ATPase component LBUL_1213 TagH 2.998 ABC-type polysaccharide/polyol phosphate transport system ATPase component LBUL_1214 COG4623 4.248 Predicted soluble lytic transglycosylase fused to an ABC-type amino acid-binding protein LBUL_1224 SrtA 0.269 Sortase (surface protein transpeptidase) LBUL_1225 LepA 0.341 Membrane GTPase LepA LBUL_1230 RfaE 4.575 ADP-heptose synthase bifunctional sugar kinase/adenylyltransferase LBUL_1236 WecE 6.367 2.770 13.936 4.313 Predicted pyridoxal phosphate-dependent enzyme apparently involved in regulation of cell wall biogenesis LBUL_1241 LepA 3.477 Membrane GTPase LepA LBUL_1261 TagH 0.137 ABC-type polysaccharide/polyol phosphate transport system ATPase component LBUL_1267 COG4623 0.201 0.345 Predicted soluble lytic transglycosylase fused to an ABC-type amino acid-binding protein LBUL_1285 TolA 0.366 Membrane protein involved in colicin uptake LBUL_1286 COG3264 0.326 Small-conductance mechanosensitive channel
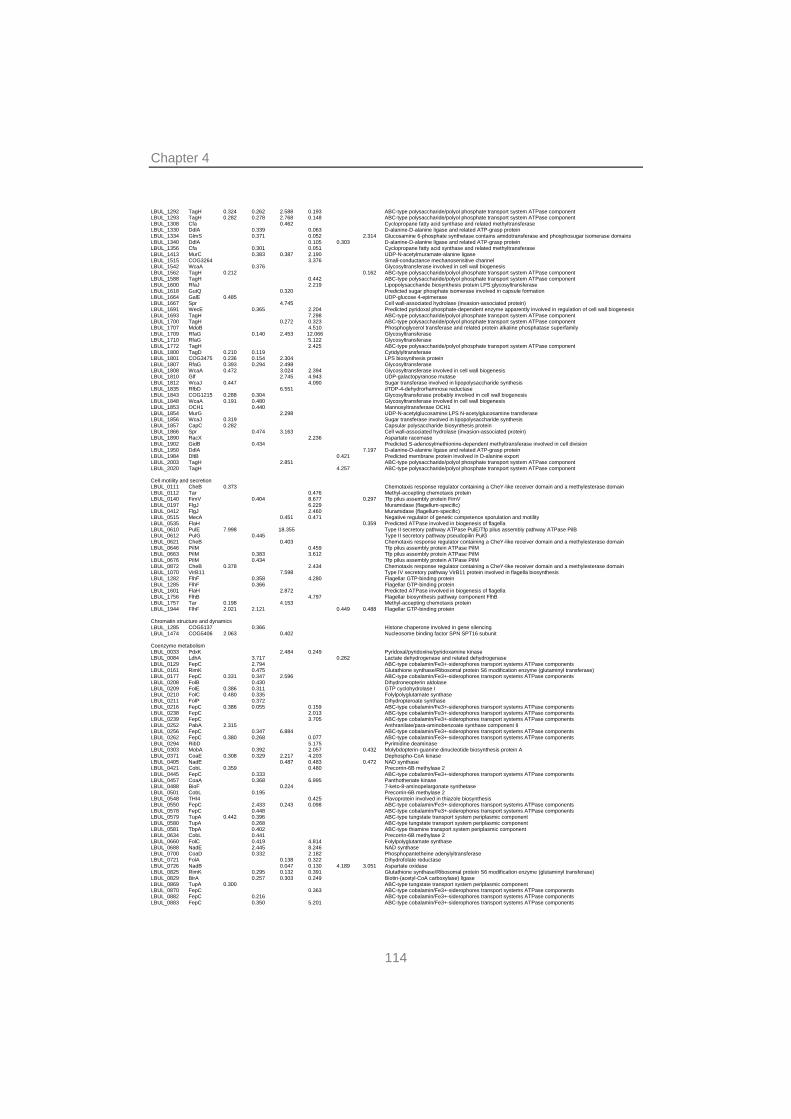
Chapter 4
114
LBUL_1292 TagH 0.324 0.262 2.588 0.193 ABC-type polysaccharide/polyol phosphate transport system ATPase component LBUL_1293 TagH 0.282 0.278 2.768 0.148 ABC-type polysaccharide/polyol phosphate transport system ATPase component LBUL_1308 Cfa 0.462 Cyclopropane fatty acid synthase and related methyltransferase LBUL_1330 DdlA 0.339 0.063 D-alanine-D-alanine ligase and related ATP-grasp protein LBUL_1334 GlmS 0.371 0.052 2.314 Glucosamine 6-phosphate synthetase contains amidotransferase and phosphosugar isomerase domains LBUL_1340 DdlA 0.105 0.303 D-alanine-D-alanine ligase and related ATP-grasp protein LBUL_1356 Cfa 0.301 0.051 Cyclopropane fatty acid synthase and related methyltransferase LBUL_1413 MurC 0.383 0.387 2.190 UDP-N-acetylmuramate-alanine ligase LBUL_1515 COG3264 3.376 Small-conductance mechanosensitive channel LBUL_1542 WcaA 0.376 Glycosyltransferase involved in cell wall biogenesis LBUL_1562 TagH 0.212 0.162 ABC-type polysaccharide/polyol phosphate transport system ATPase component LBUL_1588 TagH 0.442 ABC-type polysaccharide/polyol phosphate transport system ATPase component LBUL_1600 RfaJ 2.219 Lipopolysaccharide biosynthesis protein LPS:glycosyltransferase LBUL_1618 GutQ 0.320 Predicted sugar phosphate isomerase involved in capsule formation LBUL_1664 GalE 0.485 UDP-glucose 4-epimerase LBUL_1667 Spr 4.745 Cell wall-associated hydrolase (invasion-associated protein) LBUL_1691 WecE 0.365 2.204 Predicted pyridoxal phosphate-dependent enzyme apparently involved in regulation of cell wall biogenesis LBUL_1693 TagH 7.298 ABC-type polysaccharide/polyol phosphate transport system ATPase component LBUL_1700 TagH 0.272 0.323 ABC-type polysaccharide/polyol phosphate transport system ATPase component LBUL_1707 MdoB 4.510 Phosphoglycerol transferase and related protein alkaline phosphatase superfamily LBUL_1709 RfaG 0.140 2.453 12.066 Glycosyltransferase LBUL_1710 RfaG 5.122 Glycosyltransferase LBUL_1772 TagH 2.425 ABC-type polysaccharide/polyol phosphate transport system ATPase component LBUL_1800 TagD 0.210 0.119 Cytidylyltransferase LBUL_1801 COG3475 0.236 0.154 2.304 LPS biosynthesis protein LBUL_1807 RfaG 0.393 0.294 2.498 Glycosyltransferase LBUL_1808 WcaA 0.472 3.024 2.394 Glycosyltransferase involved in cell wall biogenesis LBUL_1810 Glf 2.745 4.943 UDP-galactopyranose mutase LBUL_1812 WcaJ 0.447 4.090 Sugar transferase involved in lipopolysaccharide synthesis LBUL_1835 RfbD 6.551 dTDP-4-dehydrorhamnose reductase LBUL_1843 COG1215 0.288 0.304 Glycosyltransferase probably involved in cell wall biogenesis LBUL_1848 WcaA 0.191 0.480 Glycosyltransferase involved in cell wall biogenesis LBUL_1853 OCH1 0.440 Mannosyltransferase OCH1 LBUL_1854 MurG 2.298 UDP-N-acetylglucosamine:LPS N-acetylglucosamine transferase LBUL_1856 WcaJ 0.319 Sugar transferase involved in lipopolysaccharide synthesis LBUL_1857 CapC 0.282 Capsular polysaccharide biosynthesis protein LBUL_1866 Spr 0.474 3.163 Cell wall-associated hydrolase (invasion-associated protein) LBUL_1890 RacX 2.236 Aspartate racemase LBUL_1902 GidB 0.434 Predicted S-adenosylmethionine-dependent methyltransferase involved in cell division LBUL_1950 DdlA 7.197 D-alanine-D-alanine ligase and related ATP-grasp protein LBUL_1984 DltB 0.421 Predicted membrane protein involved in D-alanine export LBUL_2003 TagH 2.851 ABC-type polysaccharide/polyol phosphate transport system ATPase component LBUL_2020 TagH 4.257 ABC-type polysaccharide/polyol phosphate transport system ATPase component
Cell motility and secretion LBUL_0111 CheB 0.373 Chemotaxis response regulator containing a CheY-like receiver domain and a methylesterase domain LBUL_0112 Tar 0.476 Methyl-accepting chemotaxis protein LBUL_0140 FimV 0.404 8.677 0.297 Tfp pilus assembly protein FimV LBUL_0197 FlgJ 6.229 Muramidase (flagellum-specific) LBUL_0412 FlgJ 2.460 Muramidase (flagellum-specific) LBUL_0515 MecA 0.451 0.471 Negative regulator of genetic competence sporulation and motility LBUL_0535 FlaH 0.359 Predicted ATPase involved in biogenesis of flagella LBUL_0610 PulE 7.998 18.355 Type II secretory pathway ATPase PulE/Tfp pilus assembly pathway ATPase PilB LBUL_0612 PulG 0.445 Type II secretory pathway pseudopilin PulG LBUL_0621 CheB 0.403 Chemotaxis response regulator containing a CheY-like receiver domain and a methylesterase domain LBUL_0646 PilM 0.459 Tfp pilus assembly protein ATPase PilM LBUL_0663 PilM 0.383 3.612 Tfp pilus assembly protein ATPase PilM LBUL_0676 PilM 0.434 Tfp pilus assembly protein ATPase PilM LBUL_0872 CheB 0.378 2.434 Chemotaxis response regulator containing a CheY-like receiver domain and a methylesterase domain LBUL_1070 VirB11 7.598 Type IV secretory pathway VirB11 protein involved in flagella biosynthesis LBUL_1282 FlhF 0.358 4.280 Flagellar GTP-binding protein LBUL_1285 FlhF 0.366 Flagellar GTP-binding protein LBUL_1601 FlaH 2.872 Predicted ATPase involved in biogenesis of flagella LBUL_1756 FlhB 4.797 Flagellar biosynthesis pathway component FlhB LBUL_1757 Tar 0.198 4.153 Methyl-accepting chemotaxis protein LBUL_1944 FlhF 2.021 2.121 0.449 0.488 Flagellar GTP-binding protein
Chromatin structure and dynamics LBUL_1285 COG5137 0.366 Histone chaperone involved in gene silencing LBUL_1474 COG5406 2.063 0.402 Nucleosome binding factor SPN SPT16 subunit
Coenzyme metabolism LBUL_0033 PdxK 2.484 0.249 Pyridoxal/pyridoxine/pyridoxamine kinase LBUL_0084 LdhA 3.717 0.262 Lactate dehydrogenase and related dehydrogenase LBUL_0129 FepC 2.794 ABC-type cobalamin/Fe3+-siderophores transport systems ATPase components LBUL_0161 RimK 0.475 Glutathione synthase/Ribosomal protein S6 modification enzyme (glutaminyl transferase) LBUL_0177 FepC 0.331 0.347 2.596 ABC-type cobalamin/Fe3+-siderophores transport systems ATPase components LBUL_0208 FolB 0.430 Dihydroneopterin aldolase LBUL_0209 FolE 0.386 0.311 GTP cyclohydrolase I LBUL_0210 FolC 0.480 0.335 Folylpolyglutamate synthase LBUL_0211 FolP 0.372 Dihydropteroate synthase LBUL_0216 FepC 0.386 0.055 0.159 ABC-type cobalamin/Fe3+-siderophores transport systems ATPase components LBUL_0238 FepC 2.013 ABC-type cobalamin/Fe3+-siderophores transport systems ATPase components LBUL_0239 FepC 3.705 ABC-type cobalamin/Fe3+-siderophores transport systems ATPase components LBUL_0252 PabA 2.315 Anthranilate/para-aminobenzoate synthase component II LBUL_0256 FepC 0.347 6.884 ABC-type cobalamin/Fe3+-siderophores transport systems ATPase components LBUL_0262 FepC 0.380 0.268 0.077 ABC-type cobalamin/Fe3+-siderophores transport systems ATPase components LBUL_0294 RibD 5.175 Pyrimidine deaminase LBUL_0303 MobA 0.392 2.057 0.432 Molybdopterin-guanine dinucleotide biosynthesis protein A LBUL_0371 CoaE 0.308 0.329 2.217 4.203 Dephospho-CoA kinase LBUL_0405 NadE 0.487 0.483 0.472 NAD synthase LBUL_0421 CobL 0.359 0.480 Precorrin-6B methylase 2 LBUL_0445 FepC 0.333 ABC-type cobalamin/Fe3+-siderophores transport systems ATPase components LBUL_0457 CoaA 0.368 6.995 Panthothenate kinase LBUL_0488 BioF 0.224 7-keto-8-aminopelargonate synthetase LBUL_0501 CobL 0.195 Precorrin-6B methylase 2 LBUL_0548 THI4 0.425 Flavoprotein involved in thiazole biosynthesis LBUL_0550 FepC 2.433 0.243 0.098 ABC-type cobalamin/Fe3+-siderophores transport systems ATPase components LBUL_0578 FepC 0.448 ABC-type cobalamin/Fe3+-siderophores transport systems ATPase components LBUL_0579 TupA 0.442 0.396 ABC-type tungstate transport system periplasmic component LBUL_0580 TupA 0.268 ABC-type tungstate transport system periplasmic component LBUL_0581 TbpA 0.402 ABC-type thiamine transport system periplasmic component LBUL_0634 CobL 0.441 Precorrin-6B methylase 2 LBUL_0660 FolC 0.419 4.814 Folylpolyglutamate synthase LBUL_0688 NadE 2.445 8.246 NAD synthase LBUL_0700 CoaD 0.332 2.182 Phosphopantetheine adenylyltransferase LBUL_0721 FolA 0.138 0.322 Dihydrofolate reductase LBUL_0726 NadB 0.047 0.130 4.189 3.051 Aspartate oxidase LBUL_0825 RimK 0.295 0.132 0.391 Glutathione synthase/Ribosomal protein S6 modification enzyme (glutaminyl transferase) LBUL_0829 BirA 0.257 0.303 0.249 Biotin-(acetyl-CoA carboxylase) ligase LBUL_0869 TupA 0.300 ABC-type tungstate transport system periplasmic component LBUL_0870 FepC 0.363 ABC-type cobalamin/Fe3+-siderophores transport systems ATPase components LBUL_0882 FepC 0.216 ABC-type cobalamin/Fe3+-siderophores transport systems ATPase components LBUL_0883 FepC 0.350 5.201 ABC-type cobalamin/Fe3+-siderophores transport systems ATPase components
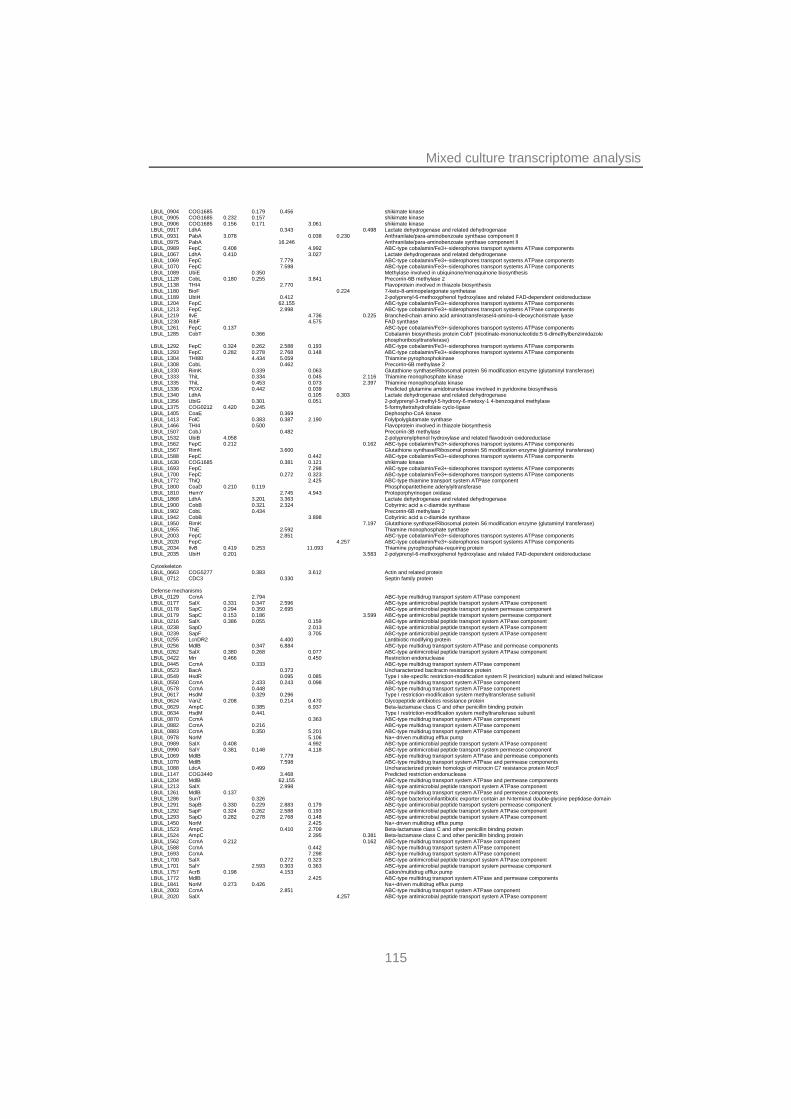
Mixed culture transcriptome analysis
115
LBUL_0904 COG1685 0.179 0.456 shikimate kinase LBUL_0905 COG1685 0.232 0.157 shikimate kinase LBUL_0906 COG1685 0.156 0.171 3.061 shikimate kinase LBUL_0917 LdhA 0.343 0.498 Lactate dehydrogenase and related dehydrogenase LBUL_0931 PabA 3.078 0.038 0.230 Anthranilate/para-aminobenzoate synthase component II LBUL_0975 PabA 16.246 Anthranilate/para-aminobenzoate synthase component II LBUL_0989 FepC 0.408 4.992 ABC-type cobalamin/Fe3+-siderophores transport systems ATPase components LBUL_1067 LdhA 0.410 3.027 Lactate dehydrogenase and related dehydrogenase LBUL_1069 FepC 7.779 ABC-type cobalamin/Fe3+-siderophores transport systems ATPase components LBUL_1070 FepC 7.598 ABC-type cobalamin/Fe3+-siderophores transport systems ATPase components LBUL_1089 UbiE 0.350 Methylase involved in ubiquinone/menaquinone biosynthesis LBUL_1128 CobL 0.180 0.255 3.841 Precorrin-6B methylase 2 LBUL_1138 THI4 2.770 Flavoprotein involved in thiazole biosynthesis LBUL_1180 BioF 0.224 7-keto-8-aminopelargonate synthetase LBUL_1189 UbiH 0.412 2-polyprenyl-6-methoxyphenol hydroxylase and related FAD-dependent oxidoreductase LBUL_1204 FepC 62.155 ABC-type cobalamin/Fe3+-siderophores transport systems ATPase components LBUL_1213 FepC 2.998 ABC-type cobalamin/Fe3+-siderophores transport systems ATPase components LBUL_1219 IlvE 4.736 0.225 Branched-chain amino acid aminotransferase/4-amino-4-deoxychorismate lyase LBUL_1230 RibF 4.575 FAD synthase LBUL_1261 FepC 0.137 ABC-type cobalamin/Fe3+-siderophores transport systems ATPase components LBUL_1285 CobT 0.366 Cobalamin biosynthesis protein CobT (nicotinate-mononucleotide:5 6-dimethylbenzimidazole
phosphoribosyltransferase) LBUL_1292 FepC 0.324 0.262 2.588 0.193 ABC-type cobalamin/Fe3+-siderophores transport systems ATPase components LBUL_1293 FepC 0.282 0.278 2.768 0.148 ABC-type cobalamin/Fe3+-siderophores transport systems ATPase components LBUL_1304 THI80 4.434 5.059 Thiamine pyrophosphokinase LBUL_1308 CobL 0.462 Precorrin-6B methylase 2 LBUL_1330 RimK 0.339 0.063 Glutathione synthase/Ribosomal protein S6 modification enzyme (glutaminyl transferase) LBUL_1333 ThiL 0.334 0.045 2.116 Thiamine monophosphate kinase LBUL_1335 ThiL 0.453 0.073 2.397 Thiamine monophosphate kinase LBUL_1336 PDX2 0.442 0.039 Predicted glutamine amidotransferase involved in pyridoxine biosynthesis LBUL_1340 LdhA 0.105 0.303 Lactate dehydrogenase and related dehydrogenase LBUL_1356 UbiG 0.301 0.051 2-polyprenyl-3-methyl-5-hydroxy-6-metoxy-1 4-benzoquinol methylase LBUL_1375 COG0212 0.420 0.245 5-formyltetrahydrofolate cyclo-ligase LBUL_1405 CoaE 0.369 Dephospho-CoA kinase LBUL_1413 FolC 0.383 0.387 2.190 Folylpolyglutamate synthase LBUL_1466 THI4 0.500 Flavoprotein involved in thiazole biosynthesis LBUL_1507 CobJ 0.482 Precorrin-3B methylase LBUL_1532 UbiB 4.058 2-polyprenylphenol hydroxylase and related flavodoxin oxidoreductase LBUL_1562 FepC 0.212 0.162 ABC-type cobalamin/Fe3+-siderophores transport systems ATPase components LBUL_1567 RimK 3.600 Glutathione synthase/Ribosomal protein S6 modification enzyme (glutaminyl transferase) LBUL_1588 FepC 0.442 ABC-type cobalamin/Fe3+-siderophores transport systems ATPase components LBUL_1630 COG1685 0.381 0.121 shikimate kinase LBUL_1693 FepC 7.298 ABC-type cobalamin/Fe3+-siderophores transport systems ATPase components LBUL_1700 FepC 0.272 0.323 ABC-type cobalamin/Fe3+-siderophores transport systems ATPase components LBUL_1772 ThiQ 2.425 ABC-type thiamine transport system ATPase component LBUL_1800 CoaD 0.210 0.119 Phosphopantetheine adenylyltransferase LBUL_1810 HemY 2.745 4.943 Protoporphyrinogen oxidase LBUL_1868 LdhA 3.201 3.363 Lactate dehydrogenase and related dehydrogenase LBUL_1900 CobB 0.321 2.324 Cobyrinic acid a c-diamide synthase LBUL_1902 CobL 0.434 Precorrin-6B methylase 2 LBUL_1942 CobB 3.898 Cobyrinic acid a c-diamide synthase LBUL_1950 RimK 7.197 Glutathione synthase/Ribosomal protein S6 modification enzyme (glutaminyl transferase) LBUL_1955 ThiE 2.592 Thiamine monophosphate synthase LBUL_2003 FepC 2.851 ABC-type cobalamin/Fe3+-siderophores transport systems ATPase components LBUL_2020 FepC 4.257 ABC-type cobalamin/Fe3+-siderophores transport systems ATPase components LBUL_2034 IlvB 0.419 0.253 11.093 Thiamine pyrophosphate-requiring protein LBUL_2035 UbiH 0.201 3.583 2-polyprenyl-6-methoxyphenol hydroxylase and related FAD-dependent oxidoreductase
Cytoskeleton LBUL_0663 COG5277 0.383 3.612 Actin and related protein LBUL_0712 CDC3 0.330 Septin family protein
Defense mechanisms LBUL_0129 CcmA 2.794 ABC-type multidrug transport system ATPase component LBUL_0177 SalX 0.331 0.347 2.596 ABC-type antimicrobial peptide transport system ATPase component LBUL_0178 SapC 0.294 0.350 2.695 ABC-type antimicrobial peptide transport system permease component LBUL_0179 SapC 0.153 0.186 3.599 ABC-type antimicrobial peptide transport system permease component LBUL_0216 SalX 0.386 0.055 0.159 ABC-type antimicrobial peptide transport system ATPase component LBUL_0238 SapD 2.013 ABC-type antimicrobial peptide transport system ATPase component LBUL_0239 SapF 3.705 ABC-type antimicrobial peptide transport system ATPase component LBUL_0255 LcnDR2 4.400 Lantibiotic modifying protein LBUL_0256 MdlB 0.347 6.884 ABC-type multidrug transport system ATPase and permease components LBUL_0262 SalX 0.380 0.268 0.077 ABC-type antimicrobial peptide transport system ATPase component LBUL_0422 Mrr 0.466 0.450 Restriction endonuclease LBUL_0445 CcmA 0.333 ABC-type multidrug transport system ATPase component LBUL_0523 BacA 0.373 Uncharacterized bacitracin resistance protein LBUL_0549 HsdR 0.095 0.085 Type I site-specific restriction-modification system R (restriction) subunit and related helicase LBUL_0550 CcmA 2.433 0.243 0.098 ABC-type multidrug transport system ATPase component LBUL_0578 CcmA 0.448 ABC-type multidrug transport system ATPase component LBUL_0617 HsdM 0.329 0.296 Type I restriction-modification system methyltransferase subunit LBUL_0624 VanZ 0.208 0.214 0.470 Glycopeptide antibiotics resistance protein LBUL_0629 AmpC 0.385 6.937 Beta-lactamase class C and other penicillin binding protein LBUL_0634 HsdM 0.441 Type I restriction-modification system methyltransferase subunit LBUL_0870 CcmA 0.363 ABC-type multidrug transport system ATPase component LBUL_0882 CcmA 0.216 ABC-type multidrug transport system ATPase component LBUL_0883 CcmA 0.350 5.201 ABC-type multidrug transport system ATPase component LBUL_0978 NorM 5.106 Na+-driven multidrug efflux pump LBUL_0989 SalX 0.408 4.992 ABC-type antimicrobial peptide transport system ATPase component LBUL_0990 SalY 0.381 0.148 4.118 ABC-type antimicrobial peptide transport system permease component LBUL_1069 MdlB 7.779 ABC-type multidrug transport system ATPase and permease components LBUL_1070 MdlB 7.598 ABC-type multidrug transport system ATPase and permease components LBUL_1088 LdcA 0.499 Uncharacterized protein homologs of microcin C7 resistance protein MccF LBUL_1147 COG3440 3.468 Predicted restriction endonuclease LBUL_1204 MdlB 62.155 ABC-type multidrug transport system ATPase and permease components LBUL_1213 SalX 2.998 ABC-type antimicrobial peptide transport system ATPase component LBUL_1261 MdlB 0.137 ABC-type multidrug transport system ATPase and permease components LBUL_1286 SunT 0.326 ABC-type bacteriocin/lantibiotic exporter contain an N-terminal double-glycine peptidase domain LBUL_1291 SapB 0.330 0.229 2.883 0.179 ABC-type antimicrobial peptide transport system permease component LBUL_1292 SapF 0.324 0.262 2.588 0.193 ABC-type antimicrobial peptide transport system ATPase component LBUL_1293 SapD 0.282 0.278 2.768 0.148 ABC-type antimicrobial peptide transport system ATPase component LBUL_1450 NorM 2.425 Na+-driven multidrug efflux pump LBUL_1523 AmpC 0.410 2.709 Beta-lactamase class C and other penicillin binding protein LBUL_1524 AmpC 2.395 0.381 Beta-lactamase class C and other penicillin binding protein LBUL_1562 CcmA 0.212 0.162 ABC-type multidrug transport system ATPase component LBUL_1588 CcmA 0.442 ABC-type multidrug transport system ATPase component LBUL_1693 CcmA 7.298 ABC-type multidrug transport system ATPase component LBUL_1700 SalX 0.272 0.323 ABC-type antimicrobial peptide transport system ATPase component LBUL_1701 SalY 2.593 0.303 0.363 ABC-type antimicrobial peptide transport system permease component LBUL_1757 AcrB 0.198 4.153 Cation/multidrug efflux pump LBUL_1772 MdlB 2.425 ABC-type multidrug transport system ATPase and permease components LBUL_1841 NorM 0.273 0.426 Na+-driven multidrug efflux pump LBUL_2003 CcmA 2.851 ABC-type multidrug transport system ATPase component LBUL_2020 SalX 4.257 ABC-type antimicrobial peptide transport system ATPase component
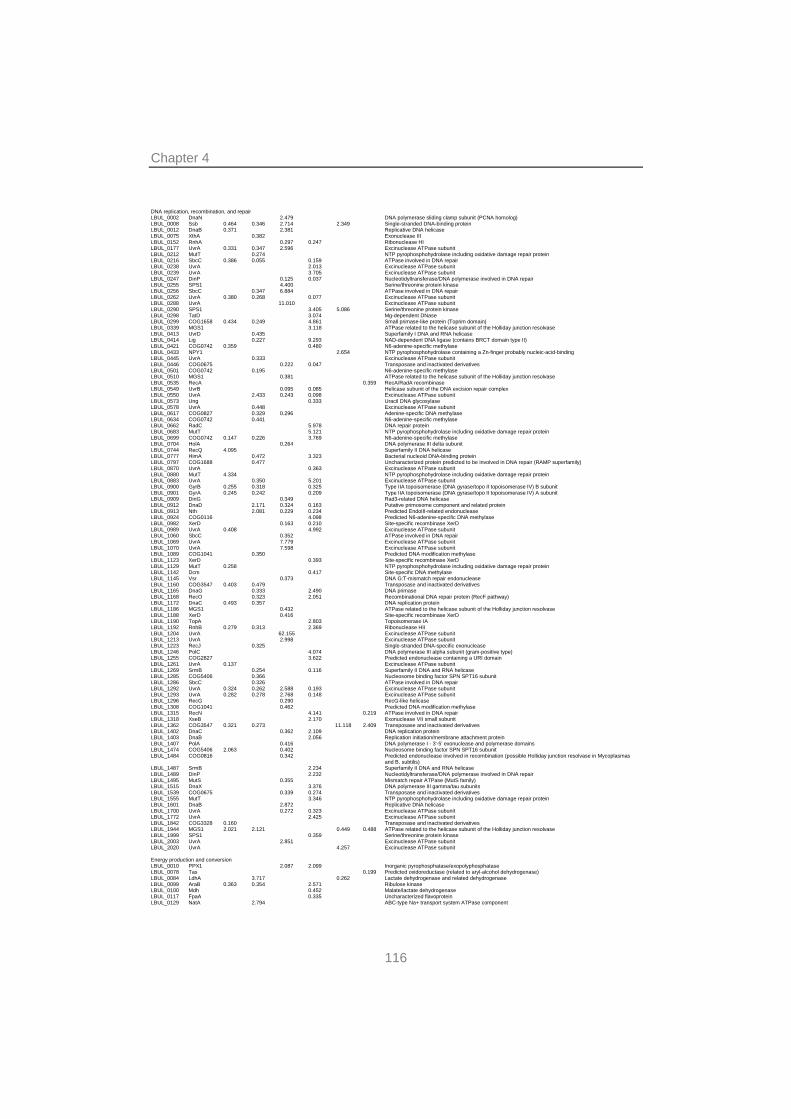
Chapter 4
116
DNA replication, recombination, and repair LBUL_0002 DnaN 2.479 DNA polymerase sliding clamp subunit (PCNA homolog) LBUL_0008 Ssb 0.464 0.346 2.714 2.349 Single-stranded DNA-binding protein LBUL_0012 DnaB 0.371 2.381 Replicative DNA helicase LBUL_0075 XthA 0.382 Exonuclease III LBUL_0152 RnhA 0.297 0.247 Ribonuclease HI LBUL_0177 UvrA 0.331 0.347 2.596 Excinuclease ATPase subunit LBUL_0212 MutT 0.274 NTP pyrophosphohydrolase including oxidative damage repair protein LBUL_0216 SbcC 0.386 0.055 0.159 ATPase involved in DNA repair LBUL_0238 UvrA 2.013 Excinuclease ATPase subunit LBUL_0239 UvrA 3.705 Excinuclease ATPase subunit LBUL_0247 DinP 0.125 0.037 Nucleotidyltransferase/DNA polymerase involved in DNA repair LBUL_0255 SPS1 4.400 Serine/threonine protein kinase LBUL_0256 SbcC 0.347 6.884 ATPase involved in DNA repair LBUL_0262 UvrA 0.380 0.268 0.077 Excinuclease ATPase subunit LBUL_0288 UvrA 11.010 Excinuclease ATPase subunit LBUL_0290 SPS1 3.405 5.086 Serine/threonine protein kinase LBUL_0298 TatD 3.074 Mg-dependent DNase LBUL_0299 COG1658 0.434 0.249 4.861 Small primase-like protein (Toprim domain) LBUL_0339 MGS1 3.118 ATPase related to the helicase subunit of the Holliday junction resolvase LBUL_0413 UvrD 0.435 Superfamily I DNA and RNA helicase LBUL_0414 Lig 0.227 9.293 NAD-dependent DNA ligase (contains BRCT domain type II) LBUL_0421 COG0742 0.359 0.480 N6-adenine-specific methylase LBUL_0433 NPY1 2.654 NTP pyrophosphohydrolase containing a Zn-finger probably nucleic-acid-binding LBUL_0445 UvrA 0.333 Excinuclease ATPase subunit LBUL_0446 COG0675 0.222 0.047 Transposase and inactivated derivatives LBUL_0501 COG0742 0.195 N6-adenine-specific methylase LBUL_0510 MGS1 0.381 ATPase related to the helicase subunit of the Holliday junction resolvase LBUL_0535 RecA 0.359 RecA/RadA recombinase LBUL_0549 UvrB 0.095 0.085 Helicase subunit of the DNA excision repair complex LBUL_0550 UvrA 2.433 0.243 0.098 Excinuclease ATPase subunit LBUL_0573 Ung 0.333 Uracil DNA glycosylase LBUL_0578 UvrA 0.448 Excinuclease ATPase subunit LBUL_0617 COG0827 0.329 0.296 Adenine-specific DNA methylase LBUL_0634 COG0742 0.441 N6-adenine-specific methylase LBUL_0662 RadC 5.978 DNA repair protein LBUL_0683 MutT 5.121 NTP pyrophosphohydrolase including oxidative damage repair protein LBUL_0699 COG0742 0.147 0.226 3.769 N6-adenine-specific methylase LBUL_0704 HolA 0.264 DNA polymerase III delta subunit LBUL_0744 RecQ 4.095 Superfamily II DNA helicase LBUL_0777 HimA 0.472 3.323 Bacterial nucleoid DNA-binding protein LBUL_0797 COG1688 0.477 Uncharacterized protein predicted to be involved in DNA repair (RAMP superfamily) LBUL_0870 UvrA 0.363 Excinuclease ATPase subunit LBUL_0880 MutT 4.334 NTP pyrophosphohydrolase including oxidative damage repair protein LBUL_0883 UvrA 0.350 5.201 Excinuclease ATPase subunit LBUL_0900 GyrB 0.255 0.318 0.325 Type IIA topoisomerase (DNA gyrase/topo II topoisomerase IV) B subunit LBUL_0901 GyrA 0.245 0.242 0.209 Type IIA topoisomerase (DNA gyrase/topo II topoisomerase IV) A subunit LBUL_0909 DinG 0.349 Rad3-related DNA helicase LBUL_0912 DnaD 2.171 0.324 0.163 Putative primosome component and related protein LBUL_0913 Nth 2.081 0.229 0.234 Predicted EndoIII-related endonuclease LBUL_0924 COG0116 4.098 Predicted N6-adenine-specific DNA methylase LBUL_0982 XerD 0.163 0.210 Site-specific recombinase XerD LBUL_0989 UvrA 0.408 4.992 Excinuclease ATPase subunit LBUL_1060 SbcC 0.352 ATPase involved in DNA repair LBUL_1069 UvrA 7.779 Excinuclease ATPase subunit LBUL_1070 UvrA 7.598 Excinuclease ATPase subunit LBUL_1089 COG1041 0.350 Predicted DNA modification methylase LBUL_1123 XerD 0.393 Site-specific recombinase XerD LBUL_1129 MutT 0.258 NTP pyrophosphohydrolase including oxidative damage repair protein LBUL_1142 Dcm 0.417 Site-specific DNA methylase LBUL_1145 Vsr 0.373 DNA G:T-mismatch repair endonuclease LBUL_1160 COG3547 0.403 0.479 Transposase and inactivated derivatives LBUL_1165 DnaG 0.333 2.490 DNA primase LBUL_1168 RecO 0.323 2.051 Recombinational DNA repair protein (RecF pathway) LBUL_1172 DnaC 0.493 0.357 DNA replication protein LBUL_1186 MGS1 0.432 ATPase related to the helicase subunit of the Holliday junction resolvase LBUL_1188 XerD 0.416 Site-specific recombinase XerD LBUL_1190 TopA 2.803 Topoisomerase IA LBUL_1192 RnhB 0.279 0.313 2.369 Ribonuclease HII LBUL_1204 UvrA 62.155 Excinuclease ATPase subunit LBUL_1213 UvrA 2.998 Excinuclease ATPase subunit LBUL_1223 RecJ 0.325 Single-stranded DNA-specific exonuclease LBUL_1246 PolC 4.074 DNA polymerase III alpha subunit (gram-positive type) LBUL_1255 COG2827 3.622 Predicted endonuclease containing a URI domain LBUL_1261 UvrA 0.137 Excinuclease ATPase subunit LBUL_1269 SrmB 0.254 0.116 Superfamily II DNA and RNA helicase LBUL_1285 COG5406 0.366 Nucleosome binding factor SPN SPT16 subunit LBUL_1286 SbcC 0.326 ATPase involved in DNA repair LBUL_1292 UvrA 0.324 0.262 2.588 0.193 Excinuclease ATPase subunit LBUL_1293 UvrA 0.282 0.278 2.768 0.148 Excinuclease ATPase subunit LBUL_1296 RecG 0.290 RecG-like helicase LBUL_1308 COG1041 0.462 Predicted DNA modification methylase LBUL_1315 RecN 4.141 0.219 ATPase involved in DNA repair LBUL_1318 XseB 2.170 Exonuclease VII small subunit LBUL_1362 COG3547 0.321 0.273 11.118 2.409 Transposase and inactivated derivatives LBUL_1402 DnaC 0.362 2.109 DNA replication protein LBUL_1403 DnaB 2.056 Replication initiation/membrane attachment protein LBUL_1407 PolA 0.416 DNA polymerase I - 3'-5' exonuclease and polymerase domains LBUL_1474 COG5406 2.063 0.402 Nucleosome binding factor SPN SPT16 subunit LBUL_1484 COG0816 0.342 Predicted endonuclease involved in recombination (possible Holliday junction resolvase in Mycoplasmas
and B. subtilis) LBUL_1487 SrmB 2.234 Superfamily II DNA and RNA helicase LBUL_1489 DinP 2.232 Nucleotidyltransferase/DNA polymerase involved in DNA repair LBUL_1495 MutS 0.355 Mismatch repair ATPase (MutS family) LBUL_1515 DnaX 3.376 DNA polymerase III gamma/tau subunits LBUL_1539 COG0675 0.339 0.274 Transposase and inactivated derivatives LBUL_1555 MutT 3.346 NTP pyrophosphohydrolase including oxidative damage repair protein LBUL_1601 DnaB 2.872 Replicative DNA helicase LBUL_1700 UvrA 0.272 0.323 Excinuclease ATPase subunit LBUL_1772 UvrA 2.425 Excinuclease ATPase subunit LBUL_1842 COG3328 0.160 Transposase and inactivated derivatives LBUL_1944 MGS1 2.021 2.121 0.449 0.488 ATPase related to the helicase subunit of the Holliday junction resolvase LBUL_1999 SPS1 0.359 Serine/threonine protein kinase LBUL_2003 UvrA 2.851 Excinuclease ATPase subunit LBUL_2020 UvrA 4.257 Excinuclease ATPase subunit
Energy production and conversion LBUL_0010 PPX1 2.087 2.099 Inorganic pyrophosphatase/exopolyphosphatase LBUL_0078 Tas 0.199 Predicted oxidoreductase (related to aryl-alcohol dehydrogenase) LBUL_0084 LdhA 3.717 0.262 Lactate dehydrogenase and related dehydrogenase LBUL_0099 AraB 0.363 0.354 2.571 Ribulose kinase LBUL_0100 Mdh 0.452 Malate/lactate dehydrogenase LBUL_0117 FpaA 0.335 Uncharacterized flavoprotein LBUL_0129 NatA 2.794 ABC-type Na+ transport system ATPase component
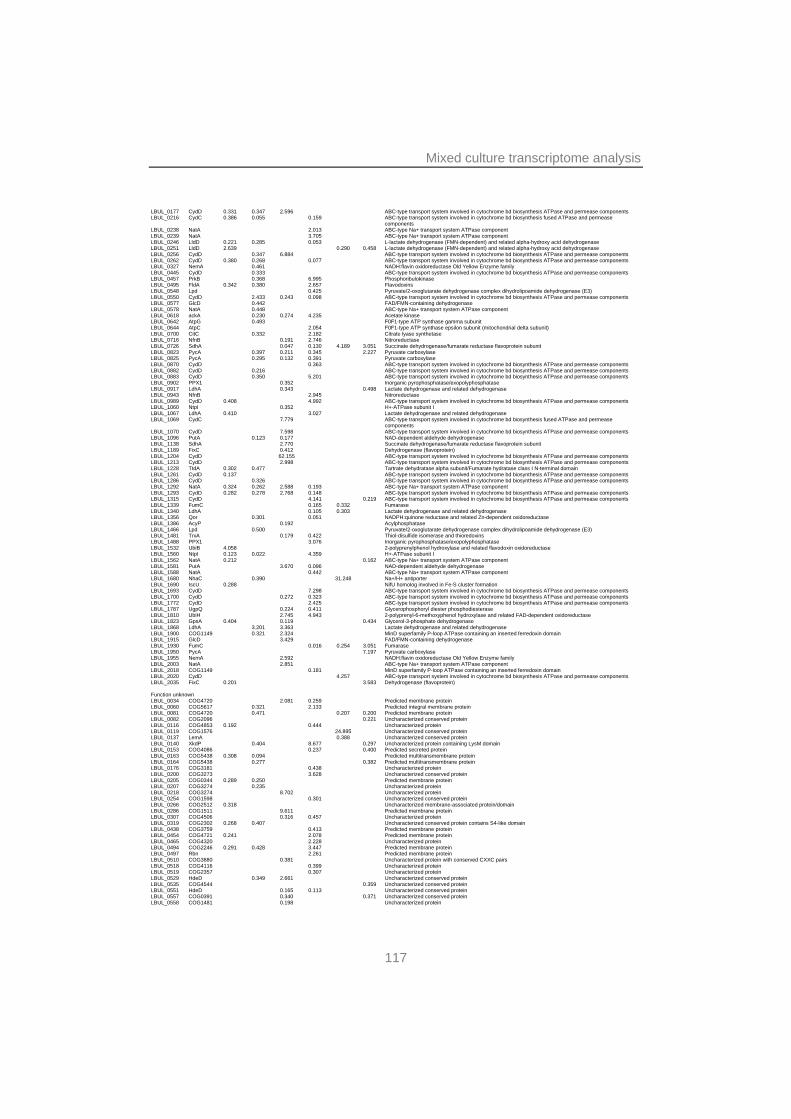
Mixed culture transcriptome analysis
117
LBUL_0177 CydD 0.331 0.347 2.596 ABC-type transport system involved in cytochrome bd biosynthesis ATPase and permease components LBUL_0216 CydC 0.386 0.055 0.159 ABC-type transport system involved in cytochrome bd biosynthesis fused ATPase and permease
components LBUL_0238 NatA 2.013 ABC-type Na+ transport system ATPase component LBUL_0239 NatA 3.705 ABC-type Na+ transport system ATPase component LBUL_0246 LldD 0.221 0.285 0.053 L-lactate dehydrogenase (FMN-dependent) and related alpha-hydroxy acid dehydrogenase LBUL_0251 LldD 2.639 0.290 0.458 L-lactate dehydrogenase (FMN-dependent) and related alpha-hydroxy acid dehydrogenase LBUL_0256 CydD 0.347 6.884 ABC-type transport system involved in cytochrome bd biosynthesis ATPase and permease components LBUL_0262 CydD 0.380 0.268 0.077 ABC-type transport system involved in cytochrome bd biosynthesis ATPase and permease components LBUL_0327 NemA 0.461 NADH:flavin oxidoreductase Old Yellow Enzyme family LBUL_0445 CydD 0.333 ABC-type transport system involved in cytochrome bd biosynthesis ATPase and permease components LBUL_0457 PrkB 0.368 6.995 Phosphoribulokinase LBUL_0495 FldA 0.342 0.380 2.657 Flavodoxins LBUL_0548 Lpd 0.425 Pyruvate/2-oxoglutarate dehydrogenase complex dihydrolipoamide dehydrogenase (E3) LBUL_0550 CydD 2.433 0.243 0.098 ABC-type transport system involved in cytochrome bd biosynthesis ATPase and permease components LBUL_0577 GlcD 0.442 FAD/FMN-containing dehydrogenase LBUL_0578 NatA 0.448 ABC-type Na+ transport system ATPase component LBUL_0618 ackA 0.230 0.274 4.235 Acetate kinase LBUL_0642 AtpG 0.493 F0F1-type ATP synthase gamma subunit LBUL_0644 AtpC 2.054 F0F1-type ATP synthase epsilon subunit (mitochondrial delta subunit) LBUL_0700 CitC 0.332 2.182 Citrate lyase synthetase LBUL_0716 NfnB 0.191 2.746 Nitroreductase LBUL_0726 SdhA 0.047 0.130 4.189 3.051 Succinate dehydrogenase/fumarate reductase flavoprotein subunit LBUL_0823 PycA 0.397 0.211 0.345 2.227 Pyruvate carboxylase LBUL_0825 PycA 0.295 0.132 0.391 Pyruvate carboxylase LBUL_0870 CydD 0.363 ABC-type transport system involved in cytochrome bd biosynthesis ATPase and permease components LBUL_0882 CydD 0.216 ABC-type transport system involved in cytochrome bd biosynthesis ATPase and permease components LBUL_0883 CydD 0.350 5.201 ABC-type transport system involved in cytochrome bd biosynthesis ATPase and permease components LBUL_0902 PPX1 0.352 Inorganic pyrophosphatase/exopolyphosphatase LBUL_0917 LdhA 0.343 0.498 Lactate dehydrogenase and related dehydrogenase LBUL_0943 NfnB 2.945 Nitroreductase LBUL_0989 CydD 0.408 4.992 ABC-type transport system involved in cytochrome bd biosynthesis ATPase and permease components LBUL_1060 NtpI 0.352 H+-ATPase subunit I LBUL_1067 LdhA 0.410 3.027 Lactate dehydrogenase and related dehydrogenase LBUL_1069 CydC 7.779 ABC-type transport system involved in cytochrome bd biosynthesis fused ATPase and permease
components LBUL_1070 CydD 7.598 ABC-type transport system involved in cytochrome bd biosynthesis ATPase and permease components LBUL_1096 PutA 0.123 0.177 NAD-dependent aldehyde dehydrogenase LBUL_1138 SdhA 2.770 Succinate dehydrogenase/fumarate reductase flavoprotein subunit LBUL_1189 FixC 0.412 Dehydrogenase (flavoprotein) LBUL_1204 CydD 62.155 ABC-type transport system involved in cytochrome bd biosynthesis ATPase and permease components LBUL_1213 CydD 2.998 ABC-type transport system involved in cytochrome bd biosynthesis ATPase and permease components LBUL_1228 TtdA 0.302 0.477 Tartrate dehydratase alpha subunit/Fumarate hydratase class I N-terminal domain LBUL_1261 CydD 0.137 ABC-type transport system involved in cytochrome bd biosynthesis ATPase and permease components LBUL_1286 CydD 0.326 ABC-type transport system involved in cytochrome bd biosynthesis ATPase and permease components LBUL_1292 NatA 0.324 0.262 2.588 0.193 ABC-type Na+ transport system ATPase component LBUL_1293 CydD 0.282 0.278 2.768 0.148 ABC-type transport system involved in cytochrome bd biosynthesis ATPase and permease components LBUL_1315 CydD 4.141 0.219 ABC-type transport system involved in cytochrome bd biosynthesis ATPase and permease components LBUL_1339 FumC 0.165 0.332 Fumarase LBUL_1340 LdhA 0.105 0.303 Lactate dehydrogenase and related dehydrogenase LBUL_1356 Qor 0.301 0.051 NADPH:quinone reductase and related Zn-dependent oxidoreductase LBUL_1386 AcyP 0.192 Acylphosphatase LBUL_1466 Lpd 0.500 Pyruvate/2-oxoglutarate dehydrogenase complex dihydrolipoamide dehydrogenase (E3) LBUL_1481 TrxA 0.179 0.422 Thiol-disulfide isomerase and thioredoxins LBUL_1488 PPX1 3.076 Inorganic pyrophosphatase/exopolyphosphatase LBUL_1532 UbiB 4.058 2-polyprenylphenol hydroxylase and related flavodoxin oxidoreductase LBUL_1560 NtpI 0.123 0.022 4.359 H+-ATPase subunit I LBUL_1562 NatA 0.212 0.162 ABC-type Na+ transport system ATPase component LBUL_1581 PutA 3.670 0.096 NAD-dependent aldehyde dehydrogenase LBUL_1588 NatA 0.442 ABC-type Na+ transport system ATPase component LBUL_1680 NhaC 0.390 31.248 Na+/H+ antiporter LBUL_1690 IscU 0.288 NifU homolog involved in Fe-S cluster formation LBUL_1693 CydD 7.298 ABC-type transport system involved in cytochrome bd biosynthesis ATPase and permease components LBUL_1700 CydD 0.272 0.323 ABC-type transport system involved in cytochrome bd biosynthesis ATPase and permease components LBUL_1772 CydD 2.425 ABC-type transport system involved in cytochrome bd biosynthesis ATPase and permease components LBUL_1787 UgpQ 0.224 0.411 Glycerophosphoryl diester phosphodiesterase LBUL_1810 UbiH 2.745 4.943 2-polyprenyl-6-methoxyphenol hydroxylase and related FAD-dependent oxidoreductase LBUL_1823 GpsA 0.404 0.119 0.434 Glycerol-3-phosphate dehydrogenase LBUL_1868 LdhA 3.201 3.363 Lactate dehydrogenase and related dehydrogenase LBUL_1900 COG1149 0.321 2.324 MinD superfamily P-loop ATPase containing an inserted ferredoxin domain LBUL_1915 GlcD 3.429 FAD/FMN-containing dehydrogenase LBUL_1930 FumC 0.016 0.254 3.051 Fumarase LBUL_1950 PycA 7.197 Pyruvate carboxylase LBUL_1955 NemA 2.592 NADH:flavin oxidoreductase Old Yellow Enzyme family LBUL_2003 NatA 2.851 ABC-type Na+ transport system ATPase component LBUL_2018 COG1149 0.181 MinD superfamily P-loop ATPase containing an inserted ferredoxin domain LBUL_2020 CydD 4.257 ABC-type transport system involved in cytochrome bd biosynthesis ATPase and permease components LBUL_2035 FixC 0.201 3.583 Dehydrogenase (flavoprotein)
Function unknown LBUL_0034 COG4720 2.081 0.259 Predicted membrane protein LBUL_0060 COG5617 0.321 2.133 Predicted integral membrane protein LBUL_0081 COG4720 0.471 0.207 0.200 Predicted membrane protein LBUL_0082 COG2096 0.221 Uncharacterized conserved protein LBUL_0116 COG4853 0.192 0.444 Uncharacterized protein LBUL_0119 COG1576 24.895 Uncharacterized conserved protein LBUL_0137 LemA 0.388 Uncharacterized conserved protein LBUL_0140 XkdP 0.404 8.677 0.297 Uncharacterized protein containing LysM domain LBUL_0153 COG4086 0.237 0.400 Predicted secreted protein LBUL_0163 COG5438 0.308 0.094 Predicted multitransmembrane protein LBUL_0164 COG5438 0.277 0.382 Predicted multitransmembrane protein LBUL_0176 COG3181 0.438 Uncharacterized protein LBUL_0200 COG3273 3.628 Uncharacterized conserved protein LBUL_0205 COG0344 0.289 0.250 Predicted membrane protein LBUL_0207 COG3274 0.235 Uncharacterized protein LBUL_0218 COG3274 8.702 Uncharacterized protein LBUL_0254 COG1598 0.301 Uncharacterized conserved protein LBUL_0266 COG2512 0.318 Uncharacterized membrane-associated protein/domain LBUL_0286 COG1511 9.611 Predicted membrane protein LBUL_0307 COG4506 0.316 0.457 Uncharacterized protein LBUL_0319 COG2302 0.268 0.407 Uncharacterized conserved protein contains S4-like domain LBUL_0438 COG3759 0.413 Predicted membrane protein LBUL_0454 COG4721 0.241 2.078 Predicted membrane protein LBUL_0465 COG4320 2.228 Uncharacterized protein LBUL_0494 COG2246 0.291 0.428 3.447 Predicted membrane protein LBUL_0497 Rbn 2.261 Predicted membrane protein LBUL_0510 COG3880 0.381 Uncharacterized protein with conserved CXXC pairs LBUL_0518 COG4116 0.399 Uncharacterized protein LBUL_0519 COG2357 0.307 Uncharacterized protein LBUL_0529 HdeD 0.349 2.661 Uncharacterized conserved protein LBUL_0535 COG4544 0.359 Uncharacterized conserved protein LBUL_0551 HdeD 0.165 0.113 Uncharacterized conserved protein LBUL_0557 COG0391 0.340 0.371 Uncharacterized conserved protein LBUL_0558 COG1481 0.198 Uncharacterized protein
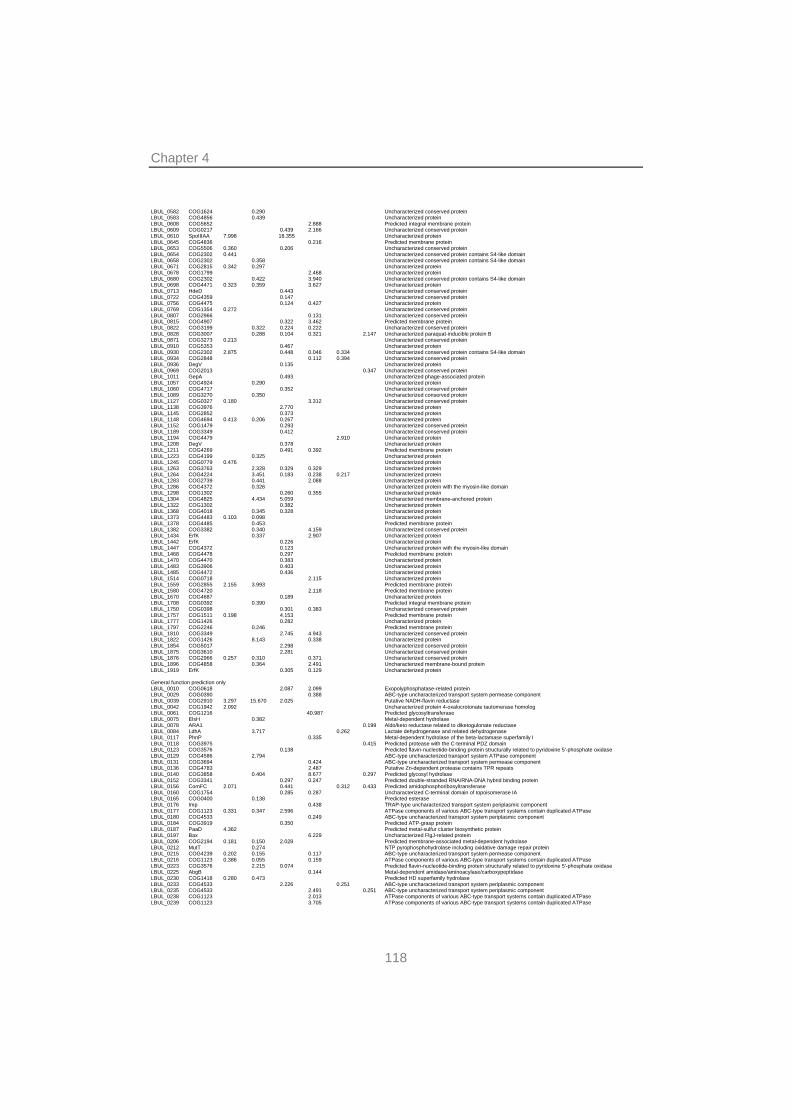
Chapter 4
118
LBUL_0582 COG1624 0.290 Uncharacterized conserved protein LBUL_0583 COG4856 0.439 Uncharacterized protein LBUL_0608 COG5652 2.888 Predicted integral membrane protein LBUL_0609 COG0217 0.439 2.166 Uncharacterized conserved protein LBUL_0610 SpoIIIAA 7.998 18.355 Uncharacterized protein LBUL_0645 COG4836 0.216 Predicted membrane protein LBUL_0653 COG5506 0.360 0.206 Uncharacterized conserved protein LBUL_0654 COG2302 0.441 Uncharacterized conserved protein contains S4-like domain LBUL_0658 COG2302 0.358 Uncharacterized conserved protein contains S4-like domain LBUL_0671 COG2815 0.342 0.297 Uncharacterized protein LBUL_0678 COG1799 2.468 Uncharacterized protein LBUL_0680 COG2302 0.422 3.940 Uncharacterized conserved protein contains S4-like domain LBUL_0698 COG4471 0.323 0.359 3.627 Uncharacterized protein LBUL_0713 HdeD 0.443 Uncharacterized conserved protein LBUL_0722 COG4359 0.147 Uncharacterized conserved protein LBUL_0756 COG4475 0.124 0.427 Uncharacterized protein LBUL_0769 COG1354 0.272 Uncharacterized conserved protein LBUL_0807 COG2966 0.131 Uncharacterized conserved protein LBUL_0815 COG4907 0.322 3.462 Predicted membrane protein LBUL_0822 COG3199 0.322 0.224 0.222 Uncharacterized conserved protein LBUL_0828 COG3007 0.288 0.104 0.321 2.147 Uncharacterized paraquat-inducible protein B LBUL_0871 COG3273 0.213 Uncharacterized conserved protein LBUL_0910 COG5353 0.467 Uncharacterized protein LBUL_0930 COG2302 2.875 0.448 0.046 0.334 Uncharacterized conserved protein contains S4-like domain LBUL_0934 COG2848 0.112 0.394 Uncharacterized conserved protein LBUL_0936 DegV 0.135 Uncharacterized protein LBUL_0969 COG2013 0.347 Uncharacterized conserved protein LBUL_1011 GepA 0.493 Uncharacterized phage-associated protein LBUL_1057 COG4924 0.290 Uncharacterized protein LBUL_1060 COG4717 0.352 Uncharacterized conserved protein LBUL_1089 COG3270 0.350 Uncharacterized conserved protein LBUL_1127 COG0327 0.180 3.312 Uncharacterized conserved protein LBUL_1138 COG3976 2.770 Uncharacterized protein LBUL_1145 COG2852 0.373 Uncharacterized protein LBUL_1148 COG4694 0.413 0.206 0.267 Uncharacterized protein LBUL_1152 COG1479 0.293 Uncharacterized conserved protein LBUL_1189 COG3349 0.412 Uncharacterized conserved protein LBUL_1194 COG4479 2.910 Uncharacterized protein LBUL_1208 DegV 0.378 Uncharacterized protein LBUL_1211 COG4269 0.491 0.392 Predicted membrane protein LBUL_1223 COG4199 0.325 Uncharacterized protein LBUL_1245 COG0779 0.476 Uncharacterized protein LBUL_1263 COG3763 2.328 0.329 0.329 Uncharacterized protein LBUL_1264 COG4224 3.451 0.183 0.238 0.217 Uncharacterized protein LBUL_1283 COG2739 0.441 2.088 Uncharacterized protein LBUL_1286 COG4372 0.326 Uncharacterized protein with the myosin-like domain LBUL_1298 COG1302 0.260 0.355 Uncharacterized protein LBUL_1304 COG4825 4.434 5.059 Uncharacterized membrane-anchored protein LBUL_1322 COG1302 0.382 Uncharacterized protein LBUL_1368 COG4018 0.345 0.328 Uncharacterized protein LBUL_1373 COG4483 0.103 0.098 Uncharacterized protein LBUL_1378 COG4485 0.453 Predicted membrane protein LBUL_1382 COG3382 0.340 4.159 Uncharacterized conserved protein LBUL_1434 ErfK 0.337 2.907 Uncharacterized protein LBUL_1442 ErfK 0.226 Uncharacterized protein LBUL_1447 COG4372 0.123 Uncharacterized protein with the myosin-like domain LBUL_1468 COG4478 0.297 Predicted membrane protein LBUL_1470 COG4470 0.383 Uncharacterized protein LBUL_1483 COG3906 0.403 Uncharacterized protein LBUL_1485 COG4472 0.436 Uncharacterized protein LBUL_1514 COG0718 2.115 Uncharacterized protein LBUL_1559 COG2855 2.155 3.993 Predicted membrane protein LBUL_1580 COG4720 2.118 Predicted membrane protein LBUL_1670 COG4687 0.189 Uncharacterized protein LBUL_1708 COG0392 0.390 Predicted integral membrane protein LBUL_1750 COG0398 0.301 0.383 Uncharacterized conserved protein LBUL_1757 COG1511 0.198 4.153 Predicted membrane protein LBUL_1777 COG1426 0.282 Uncharacterized protein LBUL_1797 COG2246 0.246 Predicted membrane protein LBUL_1810 COG3349 2.745 4.943 Uncharacterized conserved protein LBUL_1822 COG1426 8.143 0.338 Uncharacterized protein LBUL_1854 COG5017 2.298 Uncharacterized conserved protein LBUL_1875 COG3610 2.281 Uncharacterized conserved protein LBUL_1876 COG2966 0.257 0.310 0.371 Uncharacterized conserved protein LBUL_1896 COG4858 0.364 2.491 Uncharacterized membrane-bound protein LBUL_1919 ErfK 0.305 0.129 Uncharacterized protein
General function prediction only LBUL_0010 COG0618 2.087 2.099 Exopolyphosphatase-related protein LBUL_0029 COG0390 0.388 ABC-type uncharacterized transport system permease component LBUL_0039 COG2910 3.297 15.670 2.025 Putative NADH-flavin reductase LBUL_0042 COG1942 2.092 Uncharacterized protein 4-oxalocrotonate tautomerase homolog LBUL_0061 COG1216 40.987 Predicted glycosyltransferase LBUL_0075 ElsH 0.382 Metal-dependent hydrolase LBUL_0078 ARA1 0.199 Aldo/keto reductase related to diketogulonate reductase LBUL_0084 LdhA 3.717 0.262 Lactate dehydrogenase and related dehydrogenase LBUL_0117 PhnP 0.335 Metal-dependent hydrolase of the beta-lactamase superfamily I LBUL_0118 COG3975 0.415 Predicted protease with the C-terminal PDZ domain LBUL_0123 COG3576 0.138 Predicted flavin-nucleotide-binding protein structurally related to pyridoxine 5'-phosphate oxidase LBUL_0129 COG4586 2.794 ABC-type uncharacterized transport system ATPase component LBUL_0131 COG3694 0.424 ABC-type uncharacterized transport system permease component LBUL_0136 COG4783 2.487 Putative Zn-dependent protease contains TPR repeats LBUL_0140 COG3858 0.404 8.677 0.297 Predicted glycosyl hydrolase LBUL_0152 COG3341 0.297 0.247 Predicted double-stranded RNA/RNA-DNA hybrid binding protein LBUL_0156 ComFC 2.071 0.441 0.312 0.433 Predicted amidophosphoribosyltransferase LBUL_0160 COG1754 0.285 0.287 Uncharacterized C-terminal domain of topoisomerase IA LBUL_0165 COG0400 0.138 Predicted esterase LBUL_0176 Imp 0.438 TRAP-type uncharacterized transport system periplasmic component LBUL_0177 COG1123 0.331 0.347 2.596 ATPase components of various ABC-type transport systems contain duplicated ATPase LBUL_0180 COG4533 0.249 ABC-type uncharacterized transport system periplasmic component LBUL_0184 COG3919 0.350 Predicted ATP-grasp protein LBUL_0187 PaaD 4.362 Predicted metal-sulfur cluster biosynthetic protein LBUL_0197 Bax 6.229 Uncharacterized FlgJ-related protein LBUL_0206 COG2194 0.181 0.150 2.028 Predicted membrane-associated metal-dependent hydrolase LBUL_0212 MutT 0.274 NTP pyrophosphohydrolase including oxidative damage repair protein LBUL_0215 COG4239 0.202 0.155 0.117 ABC-type uncharacterized transport system permease component LBUL_0216 COG1123 0.386 0.055 0.159 ATPase components of various ABC-type transport systems contain duplicated ATPase LBUL_0223 COG3576 2.215 0.074 Predicted flavin-nucleotide-binding protein structurally related to pyridoxine 5'-phosphate oxidase LBUL_0225 AbgB 0.144 Metal-dependent amidase/aminoacylase/carboxypeptidase LBUL_0230 COG1418 0.280 0.473 Predicted HD superfamily hydrolase LBUL_0233 COG4533 2.226 0.251 ABC-type uncharacterized transport system periplasmic component LBUL_0235 COG4533 2.491 0.251 ABC-type uncharacterized transport system periplasmic component LBUL_0238 COG1123 2.013 ATPase components of various ABC-type transport systems contain duplicated ATPase LBUL_0239 COG1123 3.705 ATPase components of various ABC-type transport systems contain duplicated ATPase
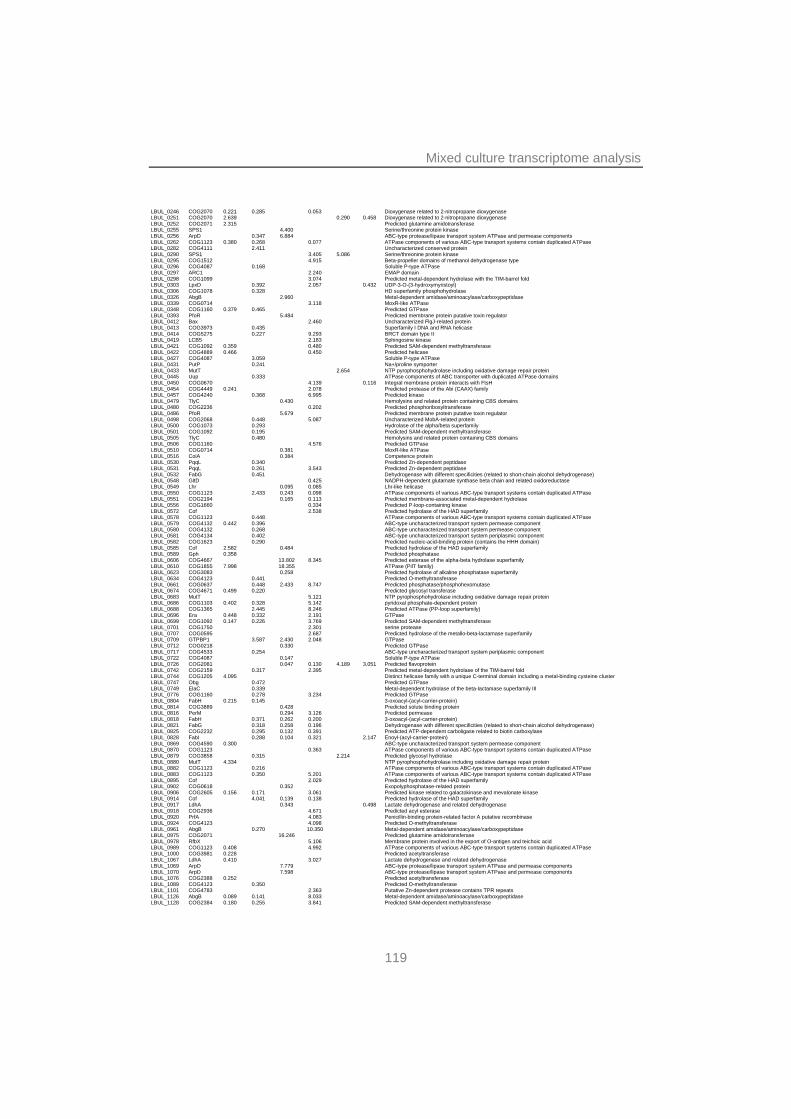
Mixed culture transcriptome analysis
119
LBUL_0246 COG2070 0.221 0.285 0.053 Dioxygenase related to 2-nitropropane dioxygenase LBUL_0251 COG2070 2.639 0.290 0.458 Dioxygenase related to 2-nitropropane dioxygenase LBUL_0252 COG2071 2.315 Predicted glutamine amidotransferase LBUL_0255 SPS1 4.400 Serine/threonine protein kinase LBUL_0256 ArpD 0.347 6.884 ABC-type protease/lipase transport system ATPase and permease components LBUL_0262 COG1123 0.380 0.268 0.077 ATPase components of various ABC-type transport systems contain duplicated ATPase LBUL_0282 COG4111 2.411 Uncharacterized conserved protein LBUL_0290 SPS1 3.405 5.086 Serine/threonine protein kinase LBUL_0295 COG1512 4.915 Beta-propeller domains of methanol dehydrogenase type LBUL_0296 COG4087 0.168 Soluble P-type ATPase LBUL_0297 ARC1 2.240 EMAP domain LBUL_0298 COG1099 3.074 Predicted metal-dependent hydrolase with the TIM-barrel fold LBUL_0303 LpxD 0.392 2.057 0.432 UDP-3-O-(3-hydroxymyristoyl) LBUL_0306 COG1078 0.328 HD superfamily phosphohydrolase LBUL_0326 AbgB 2.960 Metal-dependent amidase/aminoacylase/carboxypeptidase LBUL_0339 COG0714 3.118 MoxR-like ATPase LBUL_0348 COG1160 0.379 0.465 Predicted GTPase LBUL_0393 PfoR 5.484 Predicted membrane protein putative toxin regulator LBUL_0412 Bax 2.460 Uncharacterized FlgJ-related protein LBUL_0413 COG3973 0.435 Superfamily I DNA and RNA helicase LBUL_0414 COG5275 0.227 9.293 BRCT domain type II LBUL_0419 LCB5 2.183 Sphingosine kinase LBUL_0421 COG1092 0.359 0.480 Predicted SAM-dependent methyltransferase LBUL_0422 COG4889 0.466 0.450 Predicted helicase LBUL_0427 COG4087 3.059 Soluble P-type ATPase LBUL_0431 PutP 0.241 Na+/proline symporter LBUL_0433 MutT 2.654 NTP pyrophosphohydrolase including oxidative damage repair protein LBUL_0445 Uup 0.333 ATPase components of ABC transporter with duplicated ATPase domains LBUL_0450 COG0670 4.139 0.116 Integral membrane protein interacts with FtsH LBUL_0454 COG4449 0.241 2.078 Predicted protease of the Abi (CAAX) family LBUL_0457 COG4240 0.368 6.995 Predicted kinase LBUL_0479 TlyC 0.430 Hemolysins and related protein containing CBS domains LBUL_0480 COG2236 0.202 Predicted phosphoribosyltransferase LBUL_0486 PfoR 5.679 Predicted membrane protein putative toxin regulator LBUL_0498 COG2068 0.448 5.087 Uncharacterized MobA-related protein LBUL_0500 COG1073 0.293 Hydrolase of the alpha/beta superfamily LBUL_0501 COG1092 0.195 Predicted SAM-dependent methyltransferase LBUL_0505 TlyC 0.480 Hemolysins and related protein containing CBS domains LBUL_0506 COG1160 4.576 Predicted GTPase LBUL_0510 COG0714 0.381 MoxR-like ATPase LBUL_0516 CoiA 0.384 Competence protein LBUL_0530 PqqL 0.340 Predicted Zn-dependent peptidase LBUL_0531 PqqL 0.261 3.543 Predicted Zn-dependent peptidase LBUL_0532 FabG 0.451 Dehydrogenase with different specificities (related to short-chain alcohol dehydrogenase) LBUL_0548 GltD 0.425 NADPH-dependent glutamate synthase beta chain and related oxidoreductase LBUL_0549 Lhr 0.095 0.085 Lhr-like helicase LBUL_0550 COG1123 2.433 0.243 0.098 ATPase components of various ABC-type transport systems contain duplicated ATPase LBUL_0551 COG2194 0.165 0.113 Predicted membrane-associated metal-dependent hydrolase LBUL_0556 COG1660 0.334 Predicted P-loop-containing kinase LBUL_0572 Cof 2.538 Predicted hydrolase of the HAD superfamily LBUL_0578 COG1123 0.448 ATPase components of various ABC-type transport systems contain duplicated ATPase LBUL_0579 COG4132 0.442 0.396 ABC-type uncharacterized transport system permease component LBUL_0580 COG4132 0.268 ABC-type uncharacterized transport system permease component LBUL_0581 COG4134 0.402 ABC-type uncharacterized transport system periplasmic component LBUL_0582 COG1623 0.290 Predicted nucleic-acid-binding protein (contains the HHH domain) LBUL_0585 Cof 2.582 0.484 Predicted hydrolase of the HAD superfamily LBUL_0589 Gph 0.358 Predicted phosphatase LBUL_0606 COG4667 13.802 8.345 Predicted esterase of the alpha-beta hydrolase superfamily LBUL_0610 COG1855 7.998 18.355 ATPase (PilT family) LBUL_0623 COG3083 0.258 Predicted hydrolase of alkaline phosphatase superfamily LBUL_0634 COG4123 0.441 Predicted O-methyltransferase LBUL_0661 COG0637 0.448 2.433 8.747 Predicted phosphatase/phosphohexomutase LBUL_0674 COG4671 0.499 0.220 Predicted glycosyl transferase LBUL_0683 MutT 5.121 NTP pyrophosphohydrolase including oxidative damage repair protein LBUL_0686 COG1103 0.402 0.328 5.142 pyridoxal phosphate-dependent protein LBUL_0688 COG1365 2.445 8.246 Predicted ATPase (PP-loop superfamily) LBUL_0696 Era 0.448 0.332 2.191 GTPase LBUL_0699 COG1092 0.147 0.226 3.769 Predicted SAM-dependent methyltransferase LBUL_0701 COG1750 2.301 serine protease LBUL_0707 COG0595 2.687 Predicted hydrolase of the metallo-beta-lactamase superfamily LBUL_0709 GTPBP1 3.587 2.430 2.048 GTPase LBUL_0712 COG0218 0.330 Predicted GTPase LBUL_0717 COG4533 0.254 ABC-type uncharacterized transport system periplasmic component LBUL_0722 COG4087 0.147 Soluble P-type ATPase LBUL_0726 COG2081 0.047 0.130 4.189 3.051 Predicted flavoprotein LBUL_0742 COG2159 0.317 2.395 Predicted metal-dependent hydrolase of the TIM-barrel fold LBUL_0744 COG1205 4.095 Distinct helicase family with a unique C-terminal domain including a metal-binding cysteine cluster LBUL_0747 Obg 0.472 Predicted GTPase LBUL_0749 ElaC 0.339 Metal-dependent hydrolase of the beta-lactamase superfamily III LBUL_0776 COG1160 0.278 3.234 Predicted GTPase LBUL_0804 FabH 0.215 0.145 3-oxoacyl-(acyl-carrier-protein) LBUL_0814 COG3889 0.428 Predicted solute binding protein LBUL_0816 PerM 0.294 3.126 Predicted permease LBUL_0818 FabH 0.371 0.262 0.200 3-oxoacyl-(acyl-carrier-protein) LBUL_0821 FabG 0.318 0.258 0.196 Dehydrogenase with different specificities (related to short-chain alcohol dehydrogenase) LBUL_0825 COG2232 0.295 0.132 0.391 Predicted ATP-dependent carboligase related to biotin carboxylase LBUL_0828 FabI 0.288 0.104 0.321 2.147 Enoyl-(acyl-carrier-protein) LBUL_0869 COG4590 0.300 ABC-type uncharacterized transport system permease component LBUL_0870 COG1123 0.363 ATPase components of various ABC-type transport systems contain duplicated ATPase LBUL_0879 COG3858 0.315 2.214 Predicted glycosyl hydrolase LBUL_0880 MutT 4.334 NTP pyrophosphohydrolase including oxidative damage repair protein LBUL_0882 COG1123 0.216 ATPase components of various ABC-type transport systems contain duplicated ATPase LBUL_0883 COG1123 0.350 5.201 ATPase components of various ABC-type transport systems contain duplicated ATPase LBUL_0895 Cof 2.029 Predicted hydrolase of the HAD superfamily LBUL_0902 COG0618 0.352 Exopolyphosphatase-related protein LBUL_0906 COG2605 0.156 0.171 3.061 Predicted kinase related to galactokinase and mevalonate kinase LBUL_0914 Cof 4.041 0.139 0.138 Predicted hydrolase of the HAD superfamily LBUL_0917 LdhA 0.343 0.498 Lactate dehydrogenase and related dehydrogenase LBUL_0918 COG2936 4.671 Predicted acyl esterase LBUL_0920 PrfA 4.083 Penicillin-binding protein-related factor A putative recombinase LBUL_0924 COG4123 4.098 Predicted O-methyltransferase LBUL_0961 AbgB 0.270 10.350 Metal-dependent amidase/aminoacylase/carboxypeptidase LBUL_0975 COG2071 16.246 Predicted glutamine amidotransferase LBUL_0978 RfbX 5.106 Membrane protein involved in the export of O-antigen and teichoic acid LBUL_0989 COG1123 0.408 4.992 ATPase components of various ABC-type transport systems contain duplicated ATPase LBUL_1000 COG3981 0.228 Predicted acetyltransferase LBUL_1067 LdhA 0.410 3.027 Lactate dehydrogenase and related dehydrogenase LBUL_1069 ArpD 7.779 ABC-type protease/lipase transport system ATPase and permease components LBUL_1070 ArpD 7.598 ABC-type protease/lipase transport system ATPase and permease components LBUL_1076 COG2388 0.252 Predicted acetyltransferase LBUL_1089 COG4123 0.350 Predicted O-methyltransferase LBUL_1101 COG4783 2.363 Putative Zn-dependent protease contains TPR repeats LBUL_1126 AbgB 0.089 0.141 8.033 Metal-dependent amidase/aminoacylase/carboxypeptidase LBUL_1128 COG2384 0.180 0.255 3.841 Predicted SAM-dependent methyltransferase
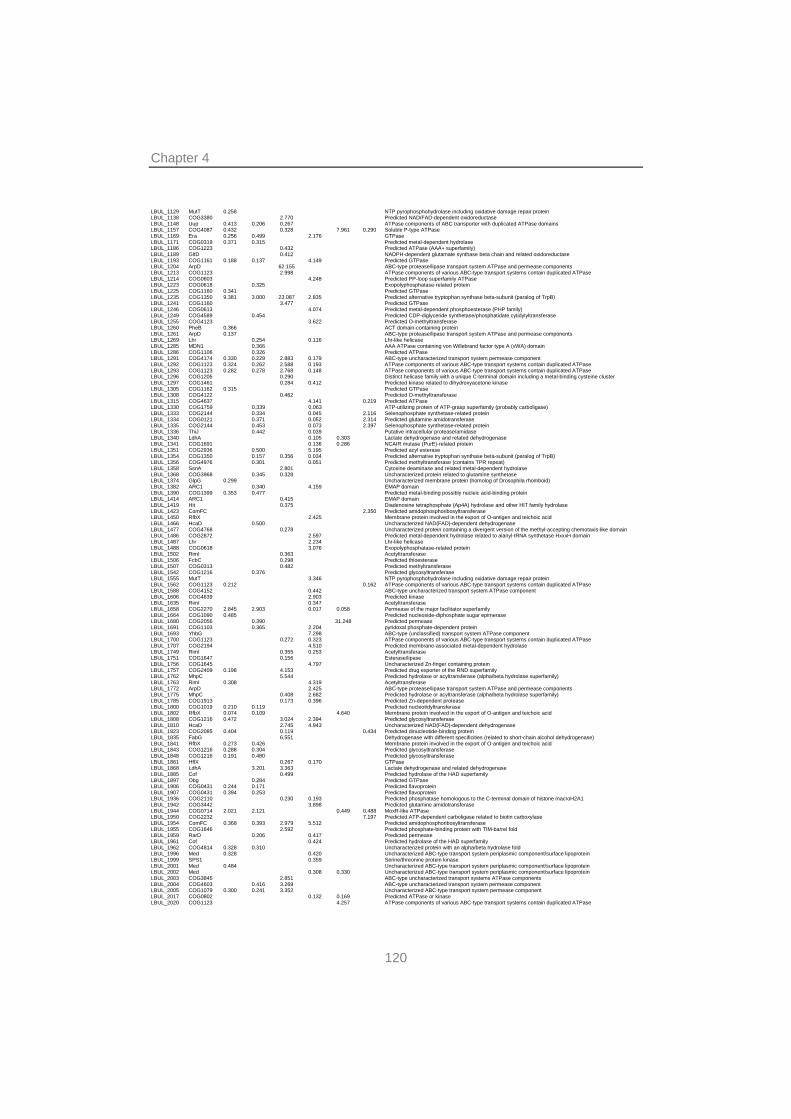
Chapter 4
120
LBUL_1129 MutT 0.258 NTP pyrophosphohydrolase including oxidative damage repair protein LBUL_1138 COG3380 2.770 Predicted NAD/FAD-dependent oxidoreductase LBUL_1148 Uup 0.413 0.206 0.267 ATPase components of ABC transporter with duplicated ATPase domains LBUL_1157 COG4087 0.432 0.328 7.961 0.290 Soluble P-type ATPase LBUL_1169 Era 0.256 0.499 2.176 GTPase LBUL_1171 COG0319 0.371 0.315 Predicted metal-dependent hydrolase LBUL_1186 COG1223 0.432 Predicted ATPase (AAA+ superfamily) LBUL_1189 GltD 0.412 NADPH-dependent glutamate synthase beta chain and related oxidoreductase LBUL_1193 COG1161 0.188 0.137 4.149 Predicted GTPase LBUL_1204 ArpD 62.155 ABC-type protease/lipase transport system ATPase and permease components LBUL_1213 COG1123 2.998 ATPase components of various ABC-type transport systems contain duplicated ATPase LBUL_1214 COG0603 4.248 Predicted PP-loop superfamily ATPase LBUL_1223 COG0618 0.325 Exopolyphosphatase-related protein LBUL_1225 COG1160 0.341 Predicted GTPase LBUL_1235 COG1350 9.381 3.000 23.087 2.835 Predicted alternative tryptophan synthase beta-subunit (paralog of TrpB) LBUL_1241 COG1160 3.477 Predicted GTPase LBUL_1246 COG0613 4.074 Predicted metal-dependent phosphoesterase (PHP family) LBUL_1249 COG4589 0.454 Predicted CDP-diglyceride synthetase/phosphatidate cytidylyltransferase LBUL_1255 COG4123 3.622 Predicted O-methyltransferase LBUL_1260 PheB 0.366 ACT domain-containing protein LBUL_1261 ArpD 0.137 ABC-type protease/lipase transport system ATPase and permease components LBUL_1269 Lhr 0.254 0.116 Lhr-like helicase LBUL_1285 MDN1 0.366 AAA ATPase containing von Willebrand factor type A (vWA) domain LBUL_1286 COG1106 0.326 Predicted ATPase LBUL_1291 COG4174 0.330 0.229 2.883 0.179 ABC-type uncharacterized transport system permease component LBUL_1292 COG1123 0.324 0.262 2.588 0.193 ATPase components of various ABC-type transport systems contain duplicated ATPase LBUL_1293 COG1123 0.282 0.278 2.768 0.148 ATPase components of various ABC-type transport systems contain duplicated ATPase LBUL_1296 COG1205 0.290 Distinct helicase family with a unique C-terminal domain including a metal-binding cysteine cluster LBUL_1297 COG1461 0.284 0.412 Predicted kinase related to dihydroxyacetone kinase LBUL_1305 COG1162 0.315 Predicted GTPase LBUL_1308 COG4122 0.462 Predicted O-methyltransferase LBUL_1315 COG4637 4.141 0.219 Predicted ATPase LBUL_1330 COG1759 0.339 0.063 ATP-utilizing protein of ATP-grasp superfamily (probably carboligase) LBUL_1333 COG2144 0.334 0.045 2.116 Selenophosphate synthetase-related protein LBUL_1334 COG0121 0.371 0.052 2.314 Predicted glutamine amidotransferase LBUL_1335 COG2144 0.453 0.073 2.397 Selenophosphate synthetase-related protein LBUL_1336 ThiJ 0.442 0.039 Putative intracellular protease/amidase LBUL_1340 LdhA 0.105 0.303 Lactate dehydrogenase and related dehydrogenase LBUL_1341 COG1691 0.136 0.286 NCAIR mutase (PurE)-related protein LBUL_1351 COG2936 0.500 5.195 Predicted acyl esterase LBUL_1354 COG1350 0.157 0.356 0.034 Predicted alternative tryptophan synthase beta-subunit (paralog of TrpB) LBUL_1356 COG4976 0.301 0.051 Predicted methyltransferase (contains TPR repeat) LBUL_1358 SsnA 2.801 Cytosine deaminase and related metal-dependent hydrolase LBUL_1368 COG3968 0.345 0.328 Uncharacterized protein related to glutamine synthetase LBUL_1374 GlpG 0.299 Uncharacterized membrane protein (homolog of Drosophila rhomboid) LBUL_1382 ARC1 0.340 4.159 EMAP domain LBUL_1390 COG1399 0.353 0.477 Predicted metal-binding possibly nucleic acid-binding protein LBUL_1414 ARC1 0.415 EMAP domain LBUL_1419 Hit 0.375 Diadenosine tetraphosphate (Ap4A) hydrolase and other HIT family hydrolase LBUL_1423 ComFC 2.350 Predicted amidophosphoribosyltransferase LBUL_1450 RfbX 2.425 Membrane protein involved in the export of O-antigen and teichoic acid LBUL_1466 HcaD 0.500 Uncharacterized NAD(FAD)-dependent dehydrogenase LBUL_1477 COG4768 0.278 Uncharacterized protein containing a divergent version of the methyl-accepting chemotaxis-like domain LBUL_1486 COG2872 2.597 Predicted metal-dependent hydrolase related to alanyl-tRNA synthetase HxxxH domain LBUL_1487 Lhr 2.234 Lhr-like helicase LBUL_1488 COG0618 3.076 Exopolyphosphatase-related protein LBUL_1502 RimI 0.363 Acetyltransferase LBUL_1506 FcbC 0.298 Predicted thioesterase LBUL_1507 COG0313 0.482 Predicted methyltransferase LBUL_1542 COG1216 0.376 Predicted glycosyltransferase LBUL_1555 MutT 3.346 NTP pyrophosphohydrolase including oxidative damage repair protein LBUL_1562 COG1123 0.212 0.162 ATPase components of various ABC-type transport systems contain duplicated ATPase LBUL_1588 COG4152 0.442 ABC-type uncharacterized transport system ATPase component LBUL_1606 COG4639 2.903 Predicted kinase LBUL_1635 RimI 0.347 Acetyltransferase LBUL_1658 COG2270 2.845 2.903 0.017 0.058 Permease of the major facilitator superfamily LBUL_1664 COG1090 0.485 Predicted nucleoside-diphosphate sugar epimerase LBUL_1680 COG2056 0.390 31.248 Predicted permease LBUL_1691 COG1103 0.365 2.204 pyridoxal phosphate-dependent protein LBUL_1693 YhbG 7.298 ABC-type (unclassified) transport system ATPase component LBUL_1700 COG1123 0.272 0.323 ATPase components of various ABC-type transport systems contain duplicated ATPase LBUL_1707 COG2194 4.510 Predicted membrane-associated metal-dependent hydrolase LBUL_1749 RimI 0.355 0.253 Acetyltransferase LBUL_1751 COG1647 0.156 Esterase/lipase LBUL_1756 COG1645 4.797 Uncharacterized Zn-finger containing protein LBUL_1757 COG2409 0.198 4.153 Predicted drug exporter of the RND superfamily LBUL_1762 MhpC 5.544 Predicted hydrolase or acyltransferase (alpha/beta hydrolase superfamily) LBUL_1763 RimI 0.308 4.319 Acetyltransferase LBUL_1772 ArpD 2.425 ABC-type protease/lipase transport system ATPase and permease components LBUL_1775 MhpC 0.408 2.682 Predicted hydrolase or acyltransferase (alpha/beta hydrolase superfamily) LBUL_1785 COG1913 0.173 0.396 Predicted Zn-dependent protease LBUL_1800 COG1019 0.210 0.119 Predicted nucleotidyltransferase LBUL_1802 RfbX 0.074 0.109 4.640 Membrane protein involved in the export of O-antigen and teichoic acid LBUL_1808 COG1216 0.472 3.024 2.394 Predicted glycosyltransferase LBUL_1810 HcaD 2.745 4.943 Uncharacterized NAD(FAD)-dependent dehydrogenase LBUL_1823 COG2085 0.404 0.119 0.434 Predicted dinucleotide-binding protein LBUL_1835 FabG 6.551 Dehydrogenase with different specificities (related to short-chain alcohol dehydrogenase) LBUL_1841 RfbX 0.273 0.426 Membrane protein involved in the export of O-antigen and teichoic acid LBUL_1843 COG1216 0.288 0.304 Predicted glycosyltransferase LBUL_1848 COG1216 0.191 0.480 Predicted glycosyltransferase LBUL_1861 HflX 0.267 0.170 GTPase LBUL_1868 LdhA 3.201 3.363 Lactate dehydrogenase and related dehydrogenase LBUL_1885 Cof 0.499 Predicted hydrolase of the HAD superfamily LBUL_1897 Obg 0.284 Predicted GTPase LBUL_1906 COG0431 0.244 0.171 Predicted flavoprotein LBUL_1907 COG0431 0.394 0.253 Predicted flavoprotein LBUL_1936 COG2110 0.230 0.193 Predicted phosphatase homologous to the C-terminal domain of histone macroH2A1 LBUL_1942 COG3442 3.898 Predicted glutamine amidotransferase LBUL_1944 COG0714 2.021 2.121 0.449 0.488 MoxR-like ATPase LBUL_1950 COG2232 7.197 Predicted ATP-dependent carboligase related to biotin carboxylase LBUL_1954 ComFC 0.368 0.393 2.979 5.512 Predicted amidophosphoribosyltransferase LBUL_1955 COG1646 2.592 Predicted phosphate-binding protein with TIM-barrel fold LBUL_1959 RarD 0.206 0.417 Predicted permease LBUL_1961 Cof 0.424 Predicted hydrolase of the HAD superfamily LBUL_1962 COG4814 0.328 0.310 Uncharacterized protein with an alpha/beta hydrolase fold LBUL_1996 Med 0.328 0.420 Uncharacterized ABC-type transport system periplasmic component/surface lipoprotein LBUL_1999 SPS1 0.359 Serine/threonine protein kinase LBUL_2001 Med 0.484 Uncharacterized ABC-type transport system periplasmic component/surface lipoprotein LBUL_2002 Med 0.308 0.330 Uncharacterized ABC-type transport system periplasmic component/surface lipoprotein LBUL_2003 COG3845 2.851 ABC-type uncharacterized transport systems ATPase components LBUL_2004 COG4603 0.416 3.269 ABC-type uncharacterized transport system permease component LBUL_2005 COG1079 0.300 0.241 3.352 Uncharacterized ABC-type transport system permease component LBUL_2017 COG0802 0.132 0.169 Predicted ATPase or kinase LBUL_2020 COG1123 4.257 ATPase components of various ABC-type transport systems contain duplicated ATPase
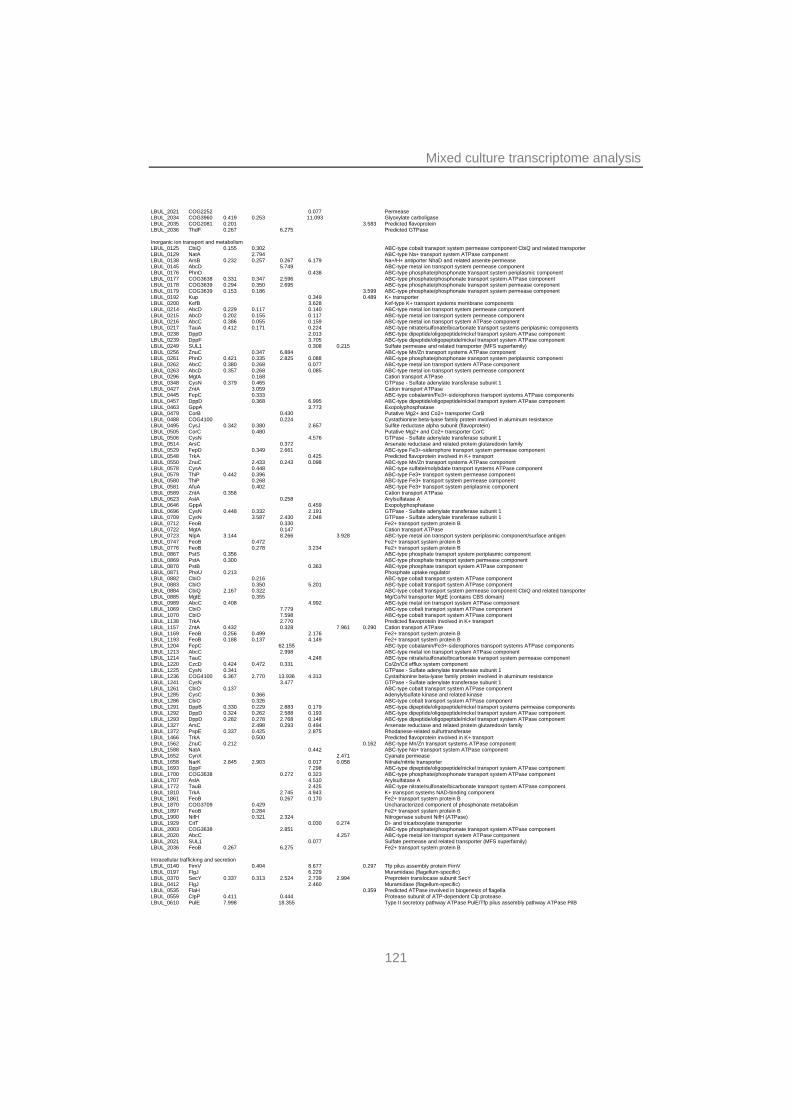
Mixed culture transcriptome analysis
121
LBUL_2021 COG2252 0.077 Permease LBUL_2034 COG3960 0.419 0.253 11.093 Glyoxylate carboligase LBUL_2035 COG2081 0.201 3.583 Predicted flavoprotein LBUL_2036 ThdF 0.267 6.275 Predicted GTPase
Inorganic ion transport and metabolism LBUL_0125 CbiQ 0.155 0.302 ABC-type cobalt transport system permease component CbiQ and related transporter LBUL_0129 NatA 2.794 ABC-type Na+ transport system ATPase component LBUL_0138 ArsB 0.232 0.257 0.267 6.179 Na+/H+ antiporter NhaD and related arsenite permease LBUL_0145 AbcD 5.749 ABC-type metal ion transport system permease component LBUL_0176 PhnD 0.438 ABC-type phosphate/phosphonate transport system periplasmic component LBUL_0177 COG3638 0.331 0.347 2.596 ABC-type phosphate/phosphonate transport system ATPase component LBUL_0178 COG3639 0.294 0.350 2.695 ABC-type phosphate/phosphonate transport system permease component LBUL_0179 COG3639 0.153 0.186 3.599 ABC-type phosphate/phosphonate transport system permease component LBUL_0192 Kup 0.349 0.489 K+ transporter LBUL_0200 KefB 3.628 Kef-type K+ transport systems membrane components LBUL_0214 AbcD 0.229 0.117 0.140 ABC-type metal ion transport system permease component LBUL_0215 AbcD 0.202 0.155 0.117 ABC-type metal ion transport system permease component LBUL_0216 AbcC 0.386 0.055 0.159 ABC-type metal ion transport system ATPase component LBUL_0217 TauA 0.412 0.171 0.224 ABC-type nitrate/sulfonate/bicarbonate transport systems periplasmic components LBUL_0238 DppD 2.013 ABC-type dipeptide/oligopeptide/nickel transport system ATPase component LBUL_0239 DppF 3.705 ABC-type dipeptide/oligopeptide/nickel transport system ATPase component LBUL_0249 SUL1 0.308 0.215 Sulfate permease and related transporter (MFS superfamily) LBUL_0256 ZnuC 0.347 6.884 ABC-type Mn/Zn transport systems ATPase component LBUL_0261 PhnD 0.421 0.335 2.825 0.088 ABC-type phosphate/phosphonate transport system periplasmic component LBUL_0262 AbcC 0.380 0.268 0.077 ABC-type metal ion transport system ATPase component LBUL_0263 AbcD 0.357 0.268 0.085 ABC-type metal ion transport system permease component LBUL_0296 MgtA 0.168 Cation transport ATPase LBUL_0348 CysN 0.379 0.465 GTPase - Sulfate adenylate transferase subunit 1 LBUL_0427 ZntA 3.059 Cation transport ATPase LBUL_0445 FepC 0.333 ABC-type cobalamin/Fe3+-siderophores transport systems ATPase components LBUL_0457 DppD 0.368 6.995 ABC-type dipeptide/oligopeptide/nickel transport system ATPase component LBUL_0463 GppA 3.773 Exopolyphosphatase LBUL_0479 CorB 0.430 Putative Mg2+ and Co2+ transporter CorB LBUL_0488 COG4100 0.224 Cystathionine beta-lyase family protein involved in aluminum resistance LBUL_0495 CysJ 0.342 0.380 2.657 Sulfite reductase alpha subunit (flavoprotein) LBUL_0505 CorC 0.480 Putative Mg2+ and Co2+ transporter CorC LBUL_0506 CysN 4.576 GTPase - Sulfate adenylate transferase subunit 1 LBUL_0514 ArsC 0.372 Arsenate reductase and related protein glutaredoxin family LBUL_0529 FepD 0.349 2.661 ABC-type Fe3+-siderophore transport system permease component LBUL_0548 TrkA 0.425 Predicted flavoprotein involved in K+ transport LBUL_0550 ZnuC 2.433 0.243 0.098 ABC-type Mn/Zn transport systems ATPase component LBUL_0578 CysA 0.448 ABC-type sulfate/molybdate transport systems ATPase component LBUL_0579 ThiP 0.442 0.396 ABC-type Fe3+ transport system permease component LBUL_0580 ThiP 0.268 ABC-type Fe3+ transport system permease component LBUL_0581 AfuA 0.402 ABC-type Fe3+ transport system periplasmic component LBUL_0589 ZntA 0.358 Cation transport ATPase LBUL_0623 AslA 0.258 Arylsulfatase A LBUL_0646 GppA 0.459 Exopolyphosphatase LBUL_0696 CysN 0.448 0.332 2.191 GTPase - Sulfate adenylate transferase subunit 1 LBUL_0709 CysN 3.587 2.430 2.048 GTPase - Sulfate adenylate transferase subunit 1 LBUL_0712 FeoB 0.330 Fe2+ transport system protein B LBUL_0722 MgtA 0.147 Cation transport ATPase LBUL_0723 NlpA 3.144 8.266 3.928 ABC-type metal ion transport system periplasmic component/surface antigen LBUL_0747 FeoB 0.472 Fe2+ transport system protein B LBUL_0776 FeoB 0.278 3.234 Fe2+ transport system protein B LBUL_0867 PstS 0.356 ABC-type phosphate transport system periplasmic component LBUL_0869 PstA 0.300 ABC-type phosphate transport system permease component LBUL_0870 PstB 0.363 ABC-type phosphate transport system ATPase component LBUL_0871 PhoU 0.213 Phosphate uptake regulator LBUL_0882 CbiO 0.216 ABC-type cobalt transport system ATPase component LBUL_0883 CbiO 0.350 5.201 ABC-type cobalt transport system ATPase component LBUL_0884 CbiQ 2.167 0.322 ABC-type cobalt transport system permease component CbiQ and related transporter LBUL_0885 MgtE 0.355 Mg/Co/Ni transporter MgtE (contains CBS domain) LBUL_0989 AbcC 0.408 4.992 ABC-type metal ion transport system ATPase component LBUL_1069 CbiO 7.779 ABC-type cobalt transport system ATPase component LBUL_1070 CbiO 7.598 ABC-type cobalt transport system ATPase component LBUL_1138 TrkA 2.770 Predicted flavoprotein involved in K+ transport LBUL_1157 ZntA 0.432 0.328 7.961 0.290 Cation transport ATPase LBUL_1169 FeoB 0.256 0.499 2.176 Fe2+ transport system protein B LBUL_1193 FeoB 0.188 0.137 4.149 Fe2+ transport system protein B LBUL_1204 FepC 62.155 ABC-type cobalamin/Fe3+-siderophores transport systems ATPase components LBUL_1213 AbcC 2.998 ABC-type metal ion transport system ATPase component LBUL_1214 TauC 4.248 ABC-type nitrate/sulfonate/bicarbonate transport system permease component LBUL_1220 CzcD 0.424 0.472 0.331 Co/Zn/Cd efflux system component LBUL_1225 CysN 0.341 GTPase - Sulfate adenylate transferase subunit 1 LBUL_1236 COG4100 6.367 2.770 13.936 4.313 Cystathionine beta-lyase family protein involved in aluminum resistance LBUL_1241 CysN 3.477 GTPase - Sulfate adenylate transferase subunit 1 LBUL_1261 CbiO 0.137 ABC-type cobalt transport system ATPase component LBUL_1285 CysC 0.366 Adenylylsulfate kinase and related kinase LBUL_1286 CbiO 0.326 ABC-type cobalt transport system ATPase component LBUL_1291 DppB 0.330 0.229 2.883 0.179 ABC-type dipeptide/oligopeptide/nickel transport systems permease components LBUL_1292 DppD 0.324 0.262 2.588 0.193 ABC-type dipeptide/oligopeptide/nickel transport system ATPase component LBUL_1293 DppD 0.282 0.278 2.768 0.148 ABC-type dipeptide/oligopeptide/nickel transport system ATPase component LBUL_1327 ArsC 2.498 0.293 0.494 Arsenate reductase and related protein glutaredoxin family LBUL_1372 PspE 0.337 0.425 2.875 Rhodanese-related sulfurtransferase LBUL_1466 TrkA 0.500 Predicted flavoprotein involved in K+ transport LBUL_1562 ZnuC 0.212 0.162 ABC-type Mn/Zn transport systems ATPase component LBUL_1588 NatA 0.442 ABC-type Na+ transport system ATPase component LBUL_1652 CynX 2.471 Cyanate permease LBUL_1658 NarK 2.845 2.903 0.017 0.058 Nitrate/nitrite transporter LBUL_1693 DppF 7.298 ABC-type dipeptide/oligopeptide/nickel transport system ATPase component LBUL_1700 COG3638 0.272 0.323 ABC-type phosphate/phosphonate transport system ATPase component LBUL_1707 AslA 4.510 Arylsulfatase A LBUL_1772 TauB 2.425 ABC-type nitrate/sulfonate/bicarbonate transport system ATPase component LBUL_1810 TrkA 2.745 4.943 K+ transport systems NAD-binding component LBUL_1861 FeoB 0.267 0.170 Fe2+ transport system protein B LBUL_1870 COG3709 0.429 Uncharacterized component of phosphonate metabolism LBUL_1897 FeoB 0.284 Fe2+ transport system protein B LBUL_1900 NifH 0.321 2.324 Nitrogenase subunit NifH (ATPase) LBUL_1929 CitT 0.030 0.274 Di- and tricarboxylate transporter LBUL_2003 COG3638 2.851 ABC-type phosphate/phosphonate transport system ATPase component LBUL_2020 AbcC 4.257 ABC-type metal ion transport system ATPase component LBUL_2021 SUL1 0.077 Sulfate permease and related transporter (MFS superfamily) LBUL_2036 FeoB 0.267 6.275 Fe2+ transport system protein B
Intracellular trafficking and secretion LBUL_0140 FimV 0.404 8.677 0.297 Tfp pilus assembly protein FimV LBUL_0197 FlgJ 6.229 Muramidase (flagellum-specific) LBUL_0370 SecY 0.337 0.313 2.524 2.739 2.994 Preprotein translocase subunit SecY LBUL_0412 FlgJ 2.460 Muramidase (flagellum-specific) LBUL_0535 FlaH 0.359 Predicted ATPase involved in biogenesis of flagella LBUL_0559 ClpP 0.411 0.444 Protease subunit of ATP-dependent Clp protease LBUL_0610 PulE 7.998 18.355 Type II secretory pathway ATPase PulE/Tfp pilus assembly pathway ATPase PilB
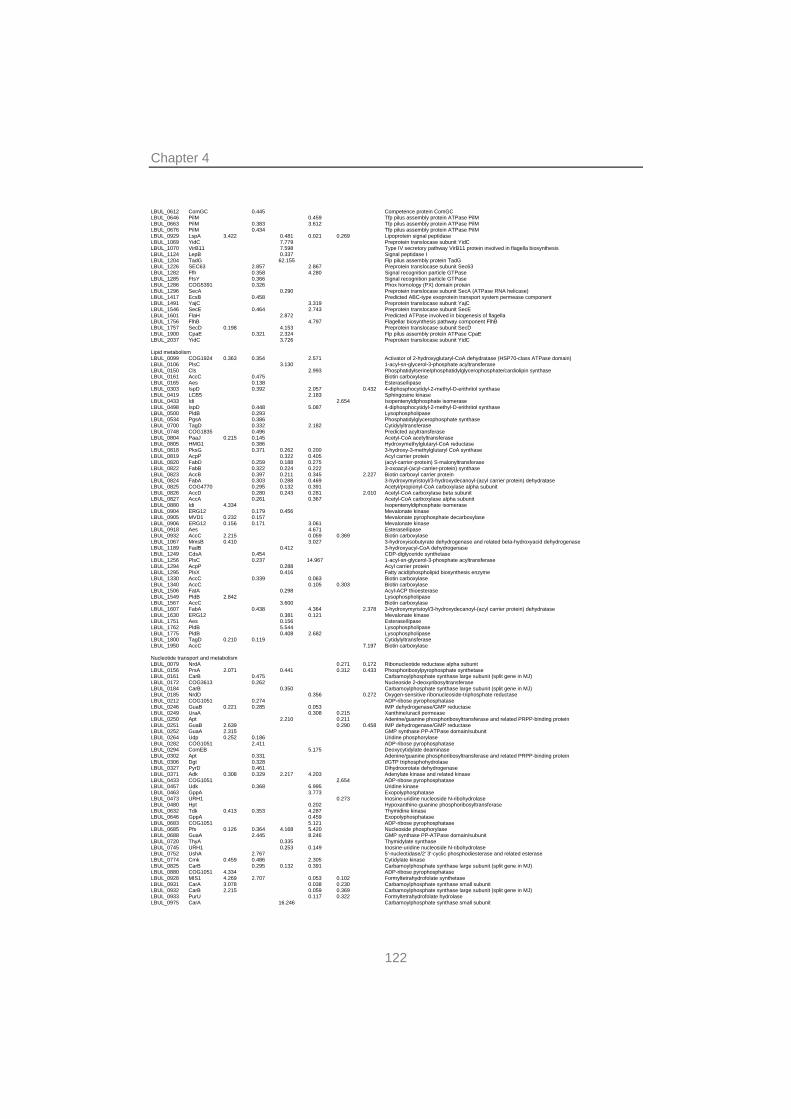
Chapter 4
122
LBUL_0612 ComGC 0.445 Competence protein ComGC LBUL_0646 PilM 0.459 Tfp pilus assembly protein ATPase PilM LBUL_0663 PilM 0.383 3.612 Tfp pilus assembly protein ATPase PilM LBUL_0676 PilM 0.434 Tfp pilus assembly protein ATPase PilM LBUL_0929 LspA 3.422 0.481 0.021 0.269 Lipoprotein signal peptidase LBUL_1069 YidC 7.779 Preprotein translocase subunit YidC LBUL_1070 VirB11 7.598 Type IV secretory pathway VirB11 protein involved in flagella biosynthesis LBUL_1124 LepB 0.337 Signal peptidase I LBUL_1204 TadG 62.155 Flp pilus assembly protein TadG LBUL_1226 SEC63 2.857 2.867 Preprotein translocase subunit Sec63 LBUL_1282 Ffh 0.358 4.280 Signal recognition particle GTPase LBUL_1285 FtsY 0.366 Signal recognition particle GTPase LBUL_1286 COG5391 0.326 Phox homology (PX) domain protein LBUL_1296 SecA 0.290 Preprotein translocase subunit SecA (ATPase RNA helicase) LBUL_1417 EcsB 0.458 Predicted ABC-type exoprotein transport system permease component LBUL_1491 YajC 3.319 Preprotein translocase subunit YajC LBUL_1546 SecE 0.464 2.743 Preprotein translocase subunit SecE LBUL_1601 FlaH 2.872 Predicted ATPase involved in biogenesis of flagella LBUL_1756 FlhB 4.797 Flagellar biosynthesis pathway component FlhB LBUL_1757 SecD 0.198 4.153 Preprotein translocase subunit SecD LBUL_1900 CpaE 0.321 2.324 Flp pilus assembly protein ATPase CpaE LBUL_2037 YidC 3.726 Preprotein translocase subunit YidC
Lipid metabolism LBUL_0099 COG1924 0.363 0.354 2.571 Activator of 2-hydroxyglutaryl-CoA dehydratase (HSP70-class ATPase domain) LBUL_0106 PlsC 3.130 1-acyl-sn-glycerol-3-phosphate acyltransferase LBUL_0150 Cls 2.993 Phosphatidylserine/phosphatidylglycerophosphate/cardiolipin synthase LBUL_0161 AccC 0.475 Biotin carboxylase LBUL_0165 Aes 0.138 Esterase/lipase LBUL_0303 IspD 0.392 2.057 0.432 4-diphosphocytidyl-2-methyl-D-erithritol synthase LBUL_0419 LCB5 2.183 Sphingosine kinase LBUL_0433 Idi 2.654 Isopentenyldiphosphate isomerase LBUL_0498 IspD 0.448 5.087 4-diphosphocytidyl-2-methyl-D-erithritol synthase LBUL_0500 PldB 0.293 Lysophospholipase LBUL_0534 PgsA 0.386 Phosphatidylglycerophosphate synthase LBUL_0700 TagD 0.332 2.182 Cytidylyltransferase LBUL_0748 COG1835 0.496 Predicted acyltransferase LBUL_0804 PaaJ 0.215 0.145 Acetyl-CoA acetyltransferase LBUL_0805 HMG1 0.386 Hydroxymethylglutaryl-CoA reductase LBUL_0818 PksG 0.371 0.262 0.200 3-hydroxy-3-methylglutaryl CoA synthase LBUL_0819 AcpP 0.322 0.405 Acyl carrier protein LBUL_0820 FabD 0.259 0.188 0.275 (acyl-carrier-protein) S-malonyltransferase LBUL_0822 FabB 0.322 0.224 0.222 3-oxoacyl-(acyl-carrier-protein) synthase LBUL_0823 AccB 0.397 0.211 0.345 2.227 Biotin carboxyl carrier protein LBUL_0824 FabA 0.303 0.288 0.469 3-hydroxymyristoyl/3-hydroxydecanoyl-(acyl carrier protein) dehydratase LBUL_0825 COG4770 0.295 0.132 0.391 Acetyl/propionyl-CoA carboxylase alpha subunit LBUL_0826 AccD 0.280 0.243 0.281 2.010 Acetyl-CoA carboxylase beta subunit LBUL_0827 AccA 0.261 0.367 Acetyl-CoA carboxylase alpha subunit LBUL_0880 Idi 4.334 Isopentenyldiphosphate isomerase LBUL_0904 ERG12 0.179 0.456 Mevalonate kinase LBUL_0905 MVD1 0.232 0.157 Mevalonate pyrophosphate decarboxylase LBUL_0906 ERG12 0.156 0.171 3.061 Mevalonate kinase LBUL_0918 Aes 4.671 Esterase/lipase LBUL_0932 AccC 2.215 0.059 0.369 Biotin carboxylase LBUL_1067 MmsB 0.410 3.027 3-hydroxyisobutyrate dehydrogenase and related beta-hydroxyacid dehydrogenase LBUL_1189 FadB 0.412 3-hydroxyacyl-CoA dehydrogenase LBUL_1249 CdsA 0.454 CDP-diglyceride synthetase LBUL_1256 PlsC 0.237 14.967 1-acyl-sn-glycerol-3-phosphate acyltransferase LBUL_1294 AcpP 0.288 Acyl carrier protein LBUL_1295 PlsX 0.416 Fatty acid/phospholipid biosynthesis enzyme LBUL_1330 AccC 0.339 0.063 Biotin carboxylase LBUL_1340 AccC 0.105 0.303 Biotin carboxylase LBUL_1506 FatA 0.298 Acyl-ACP thioesterase LBUL_1549 PldB 2.842 Lysophospholipase LBUL_1567 AccC 3.600 Biotin carboxylase LBUL_1607 FabA 0.438 4.364 2.378 3-hydroxymyristoyl/3-hydroxydecanoyl-(acyl carrier protein) dehydratase LBUL_1630 ERG12 0.381 0.121 Mevalonate kinase LBUL_1751 Aes 0.156 Esterase/lipase LBUL_1762 PldB 5.544 Lysophospholipase LBUL_1775 PldB 0.408 2.682 Lysophospholipase LBUL_1800 TagD 0.210 0.119 Cytidylyltransferase LBUL_1950 AccC 7.197 Biotin carboxylase
Nucleotide transport and metabolism LBUL_0079 NrdA 0.271 0.172 Ribonucleotide reductase alpha subunit LBUL_0156 PrsA 2.071 0.441 0.312 0.433 Phosphoribosylpyrophosphate synthetase LBUL_0161 CarB 0.475 Carbamoylphosphate synthase large subunit (split gene in MJ) LBUL_0172 COG3613 0.262 Nucleoside 2-deoxyribosyltransferase LBUL_0184 CarB 0.350 Carbamoylphosphate synthase large subunit (split gene in MJ) LBUL_0185 NrdD 0.356 0.272 Oxygen-sensitive ribonucleoside-triphosphate reductase LBUL_0212 COG1051 0.274 ADP-ribose pyrophosphatase LBUL_0246 GuaB 0.221 0.285 0.053 IMP dehydrogenase/GMP reductase LBUL_0249 UraA 0.308 0.215 Xanthine/uracil permease LBUL_0250 Apt 2.210 0.211 Adenine/guanine phosphoribosyltransferase and related PRPP-binding protein LBUL_0251 GuaB 2.639 0.290 0.458 IMP dehydrogenase/GMP reductase LBUL_0252 GuaA 2.315 GMP synthase PP-ATPase domain/subunit LBUL_0264 Udp 0.252 0.186 Uridine phosphorylase LBUL_0282 COG1051 2.411 ADP-ribose pyrophosphatase LBUL_0294 ComEB 5.175 Deoxycytidylate deaminase LBUL_0302 Apt 0.331 Adenine/guanine phosphoribosyltransferase and related PRPP-binding protein LBUL_0306 Dgt 0.328 dGTP triphosphohydrolase LBUL_0327 PyrD 0.461 Dihydroorotate dehydrogenase LBUL_0371 Adk 0.308 0.329 2.217 4.203 Adenylate kinase and related kinase LBUL_0433 COG1051 2.654 ADP-ribose pyrophosphatase LBUL_0457 Udk 0.368 6.995 Uridine kinase LBUL_0463 GppA 3.773 Exopolyphosphatase LBUL_0473 URH1 0.273 Inosine-uridine nucleoside N-ribohydrolase LBUL_0480 Hpt 0.202 Hypoxanthine-guanine phosphoribosyltransferase LBUL_0632 Tdk 0.413 0.353 4.287 Thymidine kinase LBUL_0646 GppA 0.459 Exopolyphosphatase LBUL_0683 COG1051 5.121 ADP-ribose pyrophosphatase LBUL_0685 Pfs 0.126 0.364 4.168 5.420 Nucleoside phosphorylase LBUL_0688 GuaA 2.445 8.246 GMP synthase PP-ATPase domain/subunit LBUL_0720 ThyA 0.335 Thymidylate synthase LBUL_0745 URH1 0.253 0.149 Inosine-uridine nucleoside N-ribohydrolase LBUL_0752 UshA 2.767 5'-nucleotidase/2' 3'-cyclic phosphodiesterase and related esterase LBUL_0774 Cmk 0.459 0.486 2.305 Cytidylate kinase LBUL_0825 CarB 0.295 0.132 0.391 Carbamoylphosphate synthase large subunit (split gene in MJ) LBUL_0880 COG1051 4.334 ADP-ribose pyrophosphatase LBUL_0928 MIS1 4.269 2.707 0.053 0.102 Formyltetrahydrofolate synthetase LBUL_0931 CarA 3.078 0.038 0.230 Carbamoylphosphate synthase small subunit LBUL_0932 CarB 2.215 0.059 0.369 Carbamoylphosphate synthase large subunit (split gene in MJ) LBUL_0933 PurU 0.117 0.322 Formyltetrahydrofolate hydrolase LBUL_0975 CarA 16.246 Carbamoylphosphate synthase small subunit
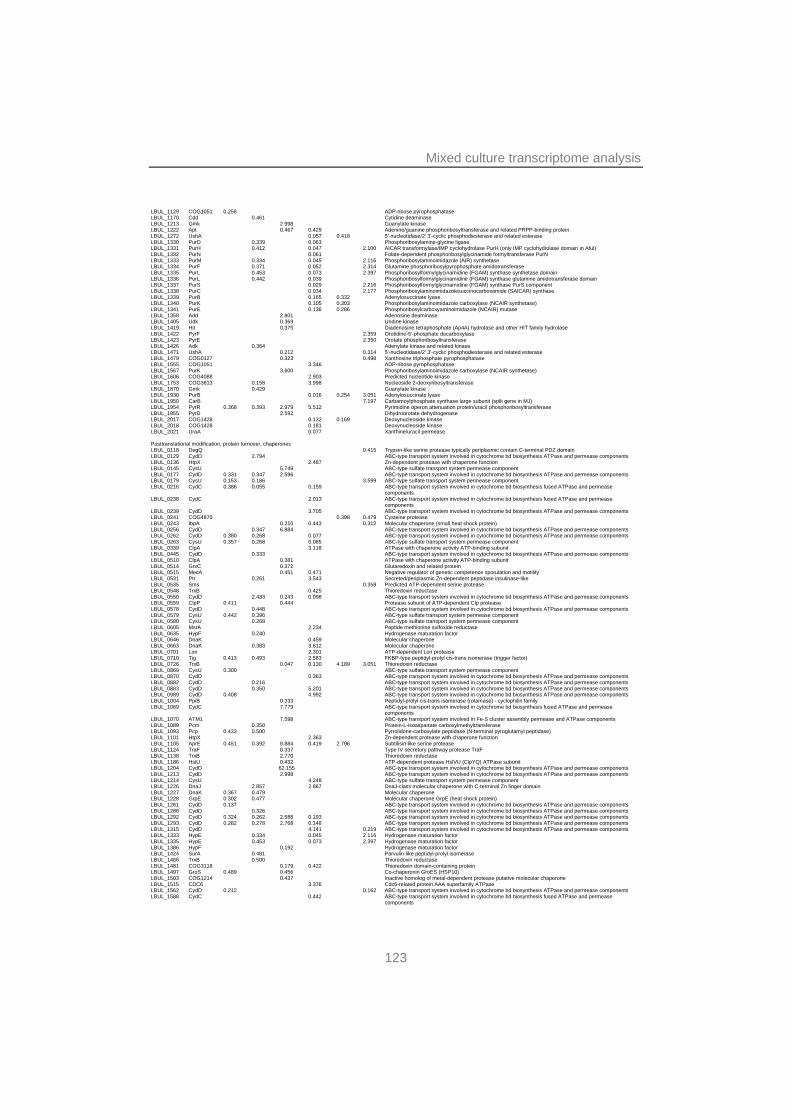
Mixed culture transcriptome analysis
123
LBUL_1129 COG1051 0.258 ADP-ribose pyrophosphatase LBUL_1170 Cdd 0.461 Cytidine deaminase LBUL_1213 Gmk 2.998 Guanylate kinase LBUL_1222 Apt 0.467 0.429 Adenine/guanine phosphoribosyltransferase and related PRPP-binding protein LBUL_1272 UshA 0.057 0.418 5'-nucleotidase/2' 3'-cyclic phosphodiesterase and related esterase LBUL_1330 PurD 0.339 0.063 Phosphoribosylamine-glycine ligase LBUL_1331 PurH 0.412 0.047 2.100 AICAR transformylase/IMP cyclohydrolase PurH (only IMP cyclohydrolase domain in Aful) LBUL_1332 PurN 0.061 Folate-dependent phosphoribosylglycinamide formyltransferase PurN LBUL_1333 PurM 0.334 0.045 2.116 Phosphoribosylaminoimidazole (AIR) synthetase LBUL_1334 PurF 0.371 0.052 2.314 Glutamine phosphoribosylpyrophosphate amidotransferase LBUL_1335 PurL 0.453 0.073 2.397 Phosphoribosylformylglycinamidine (FGAM) synthase synthetase domain LBUL_1336 PurL 0.442 0.039 Phosphoribosylformylglycinamidine (FGAM) synthase glutamine amidotransferase domain LBUL_1337 PurS 0.029 2.216 Phosphoribosylformylglycinamidine (FGAM) synthase PurS component LBUL_1338 PurC 0.034 2.177 Phosphoribosylaminoimidazolesuccinocarboxamide (SAICAR) synthase LBUL_1339 PurB 0.165 0.332 Adenylosuccinate lyase LBUL_1340 PurK 0.105 0.303 Phosphoribosylaminoimidazole carboxylase (NCAIR synthetase) LBUL_1341 PurE 0.136 0.286 Phosphoribosylcarboxyaminoimidazole (NCAIR) mutase LBUL_1358 Add 2.801 Adenosine deaminase LBUL_1405 Udk 0.369 Uridine kinase LBUL_1419 Hit 0.375 Diadenosine tetraphosphate (Ap4A) hydrolase and other HIT family hydrolase LBUL_1422 PyrF 2.359 Orotidine-5'-phosphate decarboxylase LBUL_1423 PyrE 2.350 Orotate phosphoribosyltransferase LBUL_1426 Adk 0.364 Adenylate kinase and related kinase LBUL_1471 UshA 0.212 0.314 5'-nucleotidase/2' 3'-cyclic phosphodiesterase and related esterase LBUL_1479 COG0127 0.323 0.498 Xanthosine triphosphate pyrophosphatase LBUL_1555 COG1051 3.346 ADP-ribose pyrophosphatase LBUL_1567 PurK 3.600 Phosphoribosylaminoimidazole carboxylase (NCAIR synthetase) LBUL_1606 COG4088 2.903 Predicted nucleotide kinase LBUL_1753 COG3613 0.158 3.998 Nucleoside 2-deoxyribosyltransferase LBUL_1870 Gmk 0.429 Guanylate kinase LBUL_1930 PurB 0.016 0.254 3.051 Adenylosuccinate lyase LBUL_1950 CarB 7.197 Carbamoylphosphate synthase large subunit (split gene in MJ) LBUL_1954 PyrR 0.368 0.393 2.979 5.512 Pyrimidine operon attenuation protein/uracil phosphoribosyltransferase LBUL_1955 PyrD 2.592 Dihydroorotate dehydrogenase LBUL_2017 COG1428 0.132 0.169 Deoxynucleoside kinase LBUL_2018 COG1428 0.181 Deoxynucleoside kinase LBUL_2021 UraA 0.077 Xanthine/uracil permease
Posttranslational modification, protein turnover, chaperones LBUL_0118 DegQ 0.415 Trypsin-like serine protease typically periplasmic contain C-terminal PDZ domain LBUL_0129 CydD 2.794 ABC-type transport system involved in cytochrome bd biosynthesis ATPase and permease components LBUL_0136 HtpX 2.487 Zn-dependent protease with chaperone function LBUL_0145 CysU 5.749 ABC-type sulfate transport system permease component LBUL_0177 CydD 0.331 0.347 2.596 ABC-type transport system involved in cytochrome bd biosynthesis ATPase and permease components LBUL_0179 CysU 0.153 0.186 3.599 ABC-type sulfate transport system permease component LBUL_0216 CydC 0.386 0.055 0.159 ABC-type transport system involved in cytochrome bd biosynthesis fused ATPase and permease
components LBUL_0238 CydC 2.013 ABC-type transport system involved in cytochrome bd biosynthesis fused ATPase and permease
components LBUL_0239 CydD 3.705 ABC-type transport system involved in cytochrome bd biosynthesis ATPase and permease components LBUL_0241 COG4870 0.398 0.479 Cysteine protease LBUL_0243 IbpA 0.210 0.443 0.312 Molecular chaperone (small heat shock protein) LBUL_0256 CydD 0.347 6.884 ABC-type transport system involved in cytochrome bd biosynthesis ATPase and permease components LBUL_0262 CydD 0.380 0.268 0.077 ABC-type transport system involved in cytochrome bd biosynthesis ATPase and permease components LBUL_0263 CysU 0.357 0.268 0.085 ABC-type sulfate transport system permease component LBUL_0339 ClpA 3.118 ATPase with chaperone activity ATP-binding subunit LBUL_0445 CydD 0.333 ABC-type transport system involved in cytochrome bd biosynthesis ATPase and permease components LBUL_0510 ClpA 0.381 ATPase with chaperone activity ATP-binding subunit LBUL_0514 GrxC 0.372 Glutaredoxin and related protein LBUL_0515 MecA 0.451 0.471 Negative regulator of genetic competence sporulation and motility LBUL_0531 Ptr 0.261 3.543 Secreted/periplasmic Zn-dependent peptidase insulinase-like LBUL_0535 Sms 0.359 Predicted ATP-dependent serine protease LBUL_0548 TrxB 0.425 Thioredoxin reductase LBUL_0550 CydD 2.433 0.243 0.098 ABC-type transport system involved in cytochrome bd biosynthesis ATPase and permease components LBUL_0559 ClpP 0.411 0.444 Protease subunit of ATP-dependent Clp protease LBUL_0578 CydD 0.448 ABC-type transport system involved in cytochrome bd biosynthesis ATPase and permease components LBUL_0579 CysU 0.442 0.396 ABC-type sulfate transport system permease component LBUL_0580 CysU 0.268 ABC-type sulfate transport system permease component LBUL_0605 MsrA 2.234 Peptide methionine sulfoxide reductase LBUL_0635 HypF 0.240 Hydrogenase maturation factor LBUL_0646 DnaK 0.459 Molecular chaperone LBUL_0663 DnaK 0.383 3.612 Molecular chaperone LBUL_0701 Lon 2.301 ATP-dependent Lon protease LBUL_0710 Tig 0.413 0.493 2.583 FKBP-type peptidyl-prolyl cis-trans isomerase (trigger factor) LBUL_0726 TrxB 0.047 0.130 4.189 3.051 Thioredoxin reductase LBUL_0869 CysU 0.300 ABC-type sulfate transport system permease component LBUL_0870 CydD 0.363 ABC-type transport system involved in cytochrome bd biosynthesis ATPase and permease components LBUL_0882 CydD 0.216 ABC-type transport system involved in cytochrome bd biosynthesis ATPase and permease components LBUL_0883 CydD 0.350 5.201 ABC-type transport system involved in cytochrome bd biosynthesis ATPase and permease components LBUL_0989 CydD 0.408 4.992 ABC-type transport system involved in cytochrome bd biosynthesis ATPase and permease components LBUL_1004 PpiB 0.333 Peptidyl-prolyl cis-trans isomerase (rotamase) - cyclophilin family LBUL_1069 CydC 7.779 ABC-type transport system involved in cytochrome bd biosynthesis fused ATPase and permease
components LBUL_1070 ATM1 7.598 ABC-type transport system involved in Fe-S cluster assembly permease and ATPase components LBUL_1089 Pcm 0.350 Protein-L-isoaspartate carboxylmethyltransferase LBUL_1093 Pcp 0.433 0.500 Pyrrolidone-carboxylate peptidase (N-terminal pyroglutamyl peptidase) LBUL_1101 HtpX 2.363 Zn-dependent protease with chaperone function LBUL_1105 AprE 0.451 0.392 8.884 0.419 2.796 Subtilisin-like serine protease LBUL_1124 TraF 0.337 Type IV secretory pathway protease TraF LBUL_1138 TrxB 2.770 Thioredoxin reductase LBUL_1186 HslU 0.432 ATP-dependent protease HslVU (ClpYQ) ATPase subunit LBUL_1204 CydD 62.155 ABC-type transport system involved in cytochrome bd biosynthesis ATPase and permease components LBUL_1213 CydD 2.998 ABC-type transport system involved in cytochrome bd biosynthesis ATPase and permease components LBUL_1214 CysU 4.248 ABC-type sulfate transport system permease component LBUL_1226 DnaJ 2.857 2.867 DnaJ-class molecular chaperone with C-terminal Zn finger domain LBUL_1227 DnaK 0.367 0.479 Molecular chaperone LBUL_1228 GrpE 0.302 0.477 Molecular chaperone GrpE (heat shock protein) LBUL_1261 CydD 0.137 ABC-type transport system involved in cytochrome bd biosynthesis ATPase and permease components LBUL_1286 CydD 0.326 ABC-type transport system involved in cytochrome bd biosynthesis ATPase and permease components LBUL_1292 CydD 0.324 0.262 2.588 0.193 ABC-type transport system involved in cytochrome bd biosynthesis ATPase and permease components LBUL_1293 CydD 0.282 0.278 2.768 0.148 ABC-type transport system involved in cytochrome bd biosynthesis ATPase and permease components LBUL_1315 CydD 4.141 0.219 ABC-type transport system involved in cytochrome bd biosynthesis ATPase and permease components LBUL_1333 HypE 0.334 0.045 2.116 Hydrogenase maturation factor LBUL_1335 HypE 0.453 0.073 2.397 Hydrogenase maturation factor LBUL_1386 HypF 0.192 Hydrogenase maturation factor LBUL_1424 SurA 0.481 Parvulin-like peptidyl-prolyl isomerase LBUL_1466 TrxB 0.500 Thioredoxin reductase LBUL_1481 COG3118 0.179 0.422 Thioredoxin domain-containing protein LBUL_1497 GroS 0.489 0.456 Co-chaperonin GroES (HSP10) LBUL_1503 COG1214 0.437 Inactive homolog of metal-dependent protease putative molecular chaperone LBUL_1515 CDC6 3.376 Cdc6-related protein AAA superfamily ATPase LBUL_1562 CydD 0.212 0.162 ABC-type transport system involved in cytochrome bd biosynthesis ATPase and permease components LBUL_1588 CydC 0.442 ABC-type transport system involved in cytochrome bd biosynthesis fused ATPase and permease
components
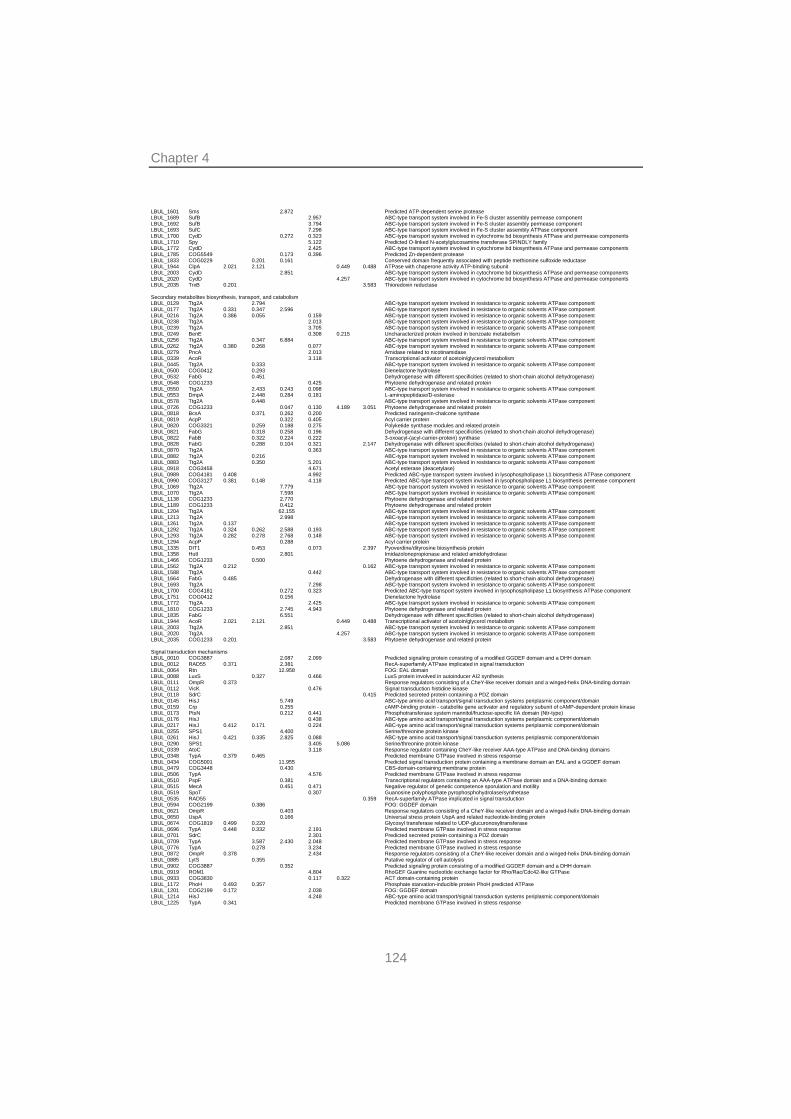
Chapter 4
124
LBUL_1601 Sms 2.872 Predicted ATP-dependent serine protease LBUL_1689 SufB 2.957 ABC-type transport system involved in Fe-S cluster assembly permease component LBUL_1692 SufB 3.794 ABC-type transport system involved in Fe-S cluster assembly permease component LBUL_1693 SufC 7.298 ABC-type transport system involved in Fe-S cluster assembly ATPase component LBUL_1700 CydD 0.272 0.323 ABC-type transport system involved in cytochrome bd biosynthesis ATPase and permease components LBUL_1710 Spy 5.122 Predicted O-linked N-acetylglucosamine transferase SPINDLY family LBUL_1772 CydD 2.425 ABC-type transport system involved in cytochrome bd biosynthesis ATPase and permease components LBUL_1785 COG5549 0.173 0.396 Predicted Zn-dependent protease LBUL_1833 COG0229 0.201 0.161 Conserved domain frequently associated with peptide methionine sulfoxide reductase LBUL_1944 ClpA 2.021 2.121 0.449 0.488 ATPase with chaperone activity ATP-binding subunit LBUL_2003 CydD 2.851 ABC-type transport system involved in cytochrome bd biosynthesis ATPase and permease components LBUL_2020 CydD 4.257 ABC-type transport system involved in cytochrome bd biosynthesis ATPase and permease components LBUL_2035 TrxB 0.201 3.583 Thioredoxin reductase
Secondary metabolites biosynthesis, transport, and catabolism LBUL_0129 Ttg2A 2.794 ABC-type transport system involved in resistance to organic solvents ATPase component LBUL_0177 Ttg2A 0.331 0.347 2.596 ABC-type transport system involved in resistance to organic solvents ATPase component LBUL_0216 Ttg2A 0.386 0.055 0.159 ABC-type transport system involved in resistance to organic solvents ATPase component LBUL_0238 Ttg2A 2.013 ABC-type transport system involved in resistance to organic solvents ATPase component LBUL_0239 Ttg2A 3.705 ABC-type transport system involved in resistance to organic solvents ATPase component LBUL_0249 BenE 0.308 0.215 Uncharacterized protein involved in benzoate metabolism LBUL_0256 Ttg2A 0.347 6.884 ABC-type transport system involved in resistance to organic solvents ATPase component LBUL_0262 Ttg2A 0.380 0.268 0.077 ABC-type transport system involved in resistance to organic solvents ATPase component LBUL_0279 PncA 2.013 Amidase related to nicotinamidase LBUL_0339 AcoR 3.118 Transcriptional activator of acetoin/glycerol metabolism LBUL_0445 Ttg2A 0.333 ABC-type transport system involved in resistance to organic solvents ATPase component LBUL_0500 COG0412 0.293 Dienelactone hydrolase LBUL_0532 FabG 0.451 Dehydrogenase with different specificities (related to short-chain alcohol dehydrogenase) LBUL_0548 COG1233 0.425 Phytoene dehydrogenase and related protein LBUL_0550 Ttg2A 2.433 0.243 0.098 ABC-type transport system involved in resistance to organic solvents ATPase component LBUL_0553 DmpA 2.448 0.284 0.181 L-aminopeptidase/D-esterase LBUL_0578 Ttg2A 0.448 ABC-type transport system involved in resistance to organic solvents ATPase component LBUL_0726 COG1233 0.047 0.130 4.189 3.051 Phytoene dehydrogenase and related protein LBUL_0818 BcsA 0.371 0.262 0.200 Predicted naringenin-chalcone synthase LBUL_0819 AcpP 0.322 0.405 Acyl carrier protein LBUL_0820 COG3321 0.259 0.188 0.275 Polyketide synthase modules and related protein LBUL_0821 FabG 0.318 0.258 0.196 Dehydrogenase with different specificities (related to short-chain alcohol dehydrogenase) LBUL_0822 FabB 0.322 0.224 0.222 3-oxoacyl-(acyl-carrier-protein) synthase LBUL_0828 FabG 0.288 0.104 0.321 2.147 Dehydrogenase with different specificities (related to short-chain alcohol dehydrogenase) LBUL_0870 Ttg2A 0.363 ABC-type transport system involved in resistance to organic solvents ATPase component LBUL_0882 Ttg2A 0.216 ABC-type transport system involved in resistance to organic solvents ATPase component LBUL_0883 Ttg2A 0.350 5.201 ABC-type transport system involved in resistance to organic solvents ATPase component LBUL_0918 COG3458 4.671 Acetyl esterase (deacetylase) LBUL_0989 COG4181 0.408 4.992 Predicted ABC-type transport system involved in lysophospholipase L1 biosynthesis ATPase component LBUL_0990 COG3127 0.381 0.148 4.118 Predicted ABC-type transport system involved in lysophospholipase L1 biosynthesis permease component LBUL_1069 Ttg2A 7.779 ABC-type transport system involved in resistance to organic solvents ATPase component LBUL_1070 Ttg2A 7.598 ABC-type transport system involved in resistance to organic solvents ATPase component LBUL_1138 COG1233 2.770 Phytoene dehydrogenase and related protein LBUL_1189 COG1233 0.412 Phytoene dehydrogenase and related protein LBUL_1204 Ttg2A 62.155 ABC-type transport system involved in resistance to organic solvents ATPase component LBUL_1213 Ttg2A 2.998 ABC-type transport system involved in resistance to organic solvents ATPase component LBUL_1261 Ttg2A 0.137 ABC-type transport system involved in resistance to organic solvents ATPase component LBUL_1292 Ttg2A 0.324 0.262 2.588 0.193 ABC-type transport system involved in resistance to organic solvents ATPase component LBUL_1293 Ttg2A 0.282 0.278 2.768 0.148 ABC-type transport system involved in resistance to organic solvents ATPase component LBUL_1294 AcpP 0.288 Acyl carrier protein LBUL_1335 DIT1 0.453 0.073 2.397 Pyoverdine/dityrosine biosynthesis protein LBUL_1358 HutI 2.801 Imidazolonepropionase and related amidohydrolase LBUL_1466 COG1233 0.500 Phytoene dehydrogenase and related protein LBUL_1562 Ttg2A 0.212 0.162 ABC-type transport system involved in resistance to organic solvents ATPase component LBUL_1588 Ttg2A 0.442 ABC-type transport system involved in resistance to organic solvents ATPase component LBUL_1664 FabG 0.485 Dehydrogenase with different specificities (related to short-chain alcohol dehydrogenase) LBUL_1693 Ttg2A 7.298 ABC-type transport system involved in resistance to organic solvents ATPase component LBUL_1700 COG4181 0.272 0.323 Predicted ABC-type transport system involved in lysophospholipase L1 biosynthesis ATPase component LBUL_1751 COG0412 0.156 Dienelactone hydrolase LBUL_1772 Ttg2A 2.425 ABC-type transport system involved in resistance to organic solvents ATPase component LBUL_1810 COG1233 2.745 4.943 Phytoene dehydrogenase and related protein LBUL_1835 FabG 6.551 Dehydrogenase with different specificities (related to short-chain alcohol dehydrogenase) LBUL_1944 AcoR 2.021 2.121 0.449 0.488 Transcriptional activator of acetoin/glycerol metabolism LBUL_2003 Ttg2A 2.851 ABC-type transport system involved in resistance to organic solvents ATPase component LBUL_2020 Ttg2A 4.257 ABC-type transport system involved in resistance to organic solvents ATPase component LBUL_2035 COG1233 0.201 3.583 Phytoene dehydrogenase and related protein
Signal transduction mechanisms LBUL_0010 COG3887 2.087 2.099 Predicted signaling protein consisting of a modified GGDEF domain and a DHH domain LBUL_0012 RAD55 0.371 2.381 RecA-superfamily ATPase implicated in signal transduction LBUL_0064 Rtn 12.958 FOG: EAL domain LBUL_0088 LuxS 0.327 0.466 LuxS protein involved in autoinducer AI2 synthesis LBUL_0111 OmpR 0.373 Response regulators consisting of a CheY-like receiver domain and a winged-helix DNA-binding domain LBUL_0112 VicK 0.476 Signal transduction histidine kinase LBUL_0118 SdrC 0.415 Predicted secreted protein containing a PDZ domain LBUL_0145 HisJ 5.749 ABC-type amino acid transport/signal transduction systems periplasmic component/domain LBUL_0159 Crp 0.255 cAMP-binding protein - catabolite gene activator and regulatory subunit of cAMP-dependent protein kinase LBUL_0173 PtsN 0.212 0.441 Phosphotransferase system mannitol/fructose-specific IIA domain (Ntr-type) LBUL_0176 HisJ 0.438 ABC-type amino acid transport/signal transduction systems periplasmic component/domain LBUL_0217 HisJ 0.412 0.171 0.224 ABC-type amino acid transport/signal transduction systems periplasmic component/domain LBUL_0255 SPS1 4.400 Serine/threonine protein kinase LBUL_0261 HisJ 0.421 0.335 2.825 0.088 ABC-type amino acid transport/signal transduction systems periplasmic component/domain LBUL_0290 SPS1 3.405 5.086 Serine/threonine protein kinase LBUL_0339 AtoC 3.118 Response regulator containing CheY-like receiver AAA-type ATPase and DNA-binding domains LBUL_0348 TypA 0.379 0.465 Predicted membrane GTPase involved in stress response LBUL_0434 COG5001 11.955 Predicted signal transduction protein containing a membrane domain an EAL and a GGDEF domain LBUL_0479 COG3448 0.430 CBS-domain-containing membrane protein LBUL_0506 TypA 4.576 Predicted membrane GTPase involved in stress response LBUL_0510 PspF 0.381 Transcriptional regulators containing an AAA-type ATPase domain and a DNA-binding domain LBUL_0515 MecA 0.451 0.471 Negative regulator of genetic competence sporulation and motility LBUL_0519 SpoT 0.307 Guanosine polyphosphate pyrophosphohydrolase/synthetase LBUL_0535 RAD55 0.359 RecA-superfamily ATPase implicated in signal transduction LBUL_0594 COG2199 0.386 FOG: GGDEF domain LBUL_0621 OmpR 0.403 Response regulators consisting of a CheY-like receiver domain and a winged-helix DNA-binding domain LBUL_0650 UspA 0.166 Universal stress protein UspA and related nucleotide-binding protein LBUL_0674 COG1819 0.499 0.220 Glycosyl transferase related to UDP-glucuronosyltransferase LBUL_0696 TypA 0.448 0.332 2.191 Predicted membrane GTPase involved in stress response LBUL_0701 SdrC 2.301 Predicted secreted protein containing a PDZ domain LBUL_0709 TypA 3.587 2.430 2.048 Predicted membrane GTPase involved in stress response LBUL_0776 TypA 0.278 3.234 Predicted membrane GTPase involved in stress response LBUL_0872 OmpR 0.378 2.434 Response regulators consisting of a CheY-like receiver domain and a winged-helix DNA-binding domain LBUL_0885 LytS 0.355 Putative regulator of cell autolysis LBUL_0902 COG3887 0.352 Predicted signaling protein consisting of a modified GGDEF domain and a DHH domain LBUL_0919 ROM1 4.804 RhoGEF Guanine nucleotide exchange factor for Rho/Rac/Cdc42-like GTPase LBUL_0933 COG3830 0.117 0.322 ACT domain-containing protein LBUL_1172 PhoH 0.493 0.357 Phosphate starvation-inducible protein PhoH predicted ATPase LBUL_1201 COG2199 0.172 2.038 FOG: GGDEF domain LBUL_1214 HisJ 4.248 ABC-type amino acid transport/signal transduction systems periplasmic component/domain LBUL_1225 TypA 0.341 Predicted membrane GTPase involved in stress response
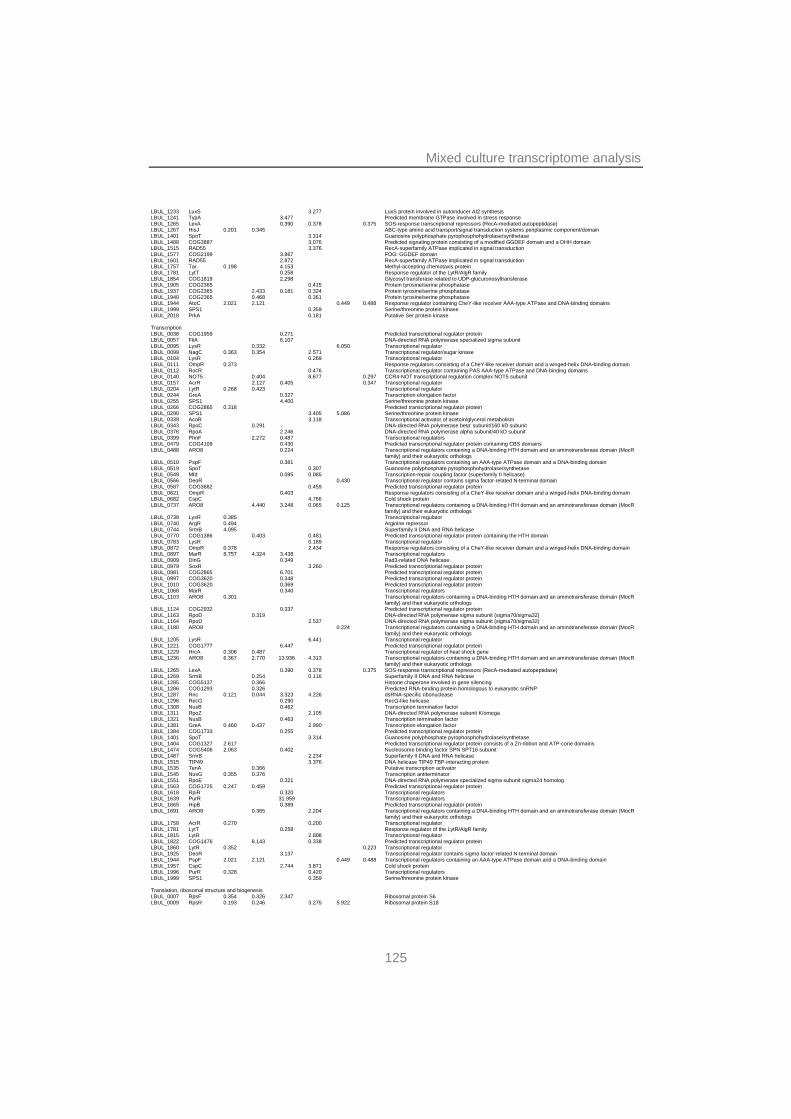
Mixed culture transcriptome analysis
125
LBUL_1233 LuxS 3.277 LuxS protein involved in autoinducer AI2 synthesis LBUL_1241 TypA 3.477 Predicted membrane GTPase involved in stress response LBUL_1265 LexA 0.390 0.378 0.375 SOS-response transcriptional repressors (RecA-mediated autopeptidase) LBUL_1267 HisJ 0.201 0.345 ABC-type amino acid transport/signal transduction systems periplasmic component/domain LBUL_1401 SpoT 3.314 Guanosine polyphosphate pyrophosphohydrolase/synthetase LBUL_1488 COG3887 3.076 Predicted signaling protein consisting of a modified GGDEF domain and a DHH domain LBUL_1515 RAD55 3.376 RecA-superfamily ATPase implicated in signal transduction LBUL_1577 COG2199 3.867 FOG: GGDEF domain LBUL_1601 RAD55 2.872 RecA-superfamily ATPase implicated in signal transduction LBUL_1757 Tar 0.198 4.153 Methyl-accepting chemotaxis protein LBUL_1781 LytT 0.258 Response regulator of the LytR/AlgR family LBUL_1854 COG1819 2.298 Glycosyl transferase related to UDP-glucuronosyltransferase LBUL_1905 COG2365 0.415 Protein tyrosine/serine phosphatase LBUL_1937 COG2365 2.433 0.181 0.324 Protein tyrosine/serine phosphatase LBUL_1940 COG2365 0.468 0.361 Protein tyrosine/serine phosphatase LBUL_1944 AtoC 2.021 2.121 0.449 0.488 Response regulator containing CheY-like receiver AAA-type ATPase and DNA-binding domains LBUL_1999 SPS1 0.359 Serine/threonine protein kinase LBUL_2018 PrkA 0.181 Putative Ser protein kinase
Transcription LBUL_0038 COG1959 0.271 Predicted transcriptional regulator protein LBUL_0057 FliA 6.107 DNA-directed RNA polymerase specialized sigma subunit LBUL_0095 LysR 0.332 6.050 Transcriptional regulator LBUL_0099 NagC 0.363 0.354 2.571 Transcriptional regulator/sugar kinase LBUL_0104 LysR 0.269 Transcriptional regulator LBUL_0111 OmpR 0.373 Response regulators consisting of a CheY-like receiver domain and a winged-helix DNA-binding domain LBUL_0112 RocR 0.476 Transcriptional regulator containing PAS AAA-type ATPase and DNA-binding domains LBUL_0140 NOT5 0.404 8.677 0.297 CCR4-NOT transcriptional regulation complex NOT5 subunit LBUL_0157 AcrR 2.127 0.405 0.347 Transcriptional regulator LBUL_0204 LytR 0.268 0.423 Transcriptional regulator LBUL_0244 GreA 0.327 Transcription elongation factor LBUL_0255 SPS1 4.400 Serine/threonine protein kinase LBUL_0266 COG2865 0.318 Predicted transcriptional regulator protein LBUL_0290 SPS1 3.405 5.086 Serine/threonine protein kinase LBUL_0339 AcoR 3.118 Transcriptional activator of acetoin/glycerol metabolism LBUL_0343 RpoC 0.291 DNA-directed RNA polymerase beta' subunit/160 kD subunit LBUL_0376 RpoA 2.246 DNA-directed RNA polymerase alpha subunit/40 kD subunit LBUL_0399 PhnF 2.272 0.487 Transcriptional regulators LBUL_0479 COG4109 0.430 Predicted transcriptional regulator protein containing CBS domains LBUL_0488 ARO8 0.224 Transcriptional regulators containing a DNA-binding HTH domain and an aminotransferase domain (MocR
family) and their eukaryotic orthologs LBUL_0510 PspF 0.381 Transcriptional regulators containing an AAA-type ATPase domain and a DNA-binding domain LBUL_0519 SpoT 0.307 Guanosine polyphosphate pyrophosphohydrolase/synthetase LBUL_0549 Mfd 0.095 0.085 Transcription-repair coupling factor (superfamily II helicase) LBUL_0566 DeoR 0.430 Transcriptional regulator contains sigma factor-related N-terminal domain LBUL_0587 COG3682 0.459 Predicted transcriptional regulator protein LBUL_0621 OmpR 0.403 Response regulators consisting of a CheY-like receiver domain and a winged-helix DNA-binding domain LBUL_0682 CspC 4.766 Cold shock protein LBUL_0737 ARO8 4.440 3.248 0.065 0.125 Transcriptional regulators containing a DNA-binding HTH domain and an aminotransferase domain (MocR
family) and their eukaryotic orthologs LBUL_0738 LysR 0.385 Transcriptional regulator LBUL_0740 ArgR 0.494 Arginine repressor LBUL_0744 SrmB 4.095 Superfamily II DNA and RNA helicase LBUL_0770 COG1386 0.403 0.481 Predicted transcriptional regulator protein containing the HTH domain LBUL_0783 LysR 0.189 Transcriptional regulator LBUL_0872 OmpR 0.378 2.434 Response regulators consisting of a CheY-like receiver domain and a winged-helix DNA-binding domain LBUL_0897 MarR 8.757 4.324 3.438 Transcriptional regulators LBUL_0909 DinG 0.349 Rad3-related DNA helicase LBUL_0979 SoxR 3.260 Predicted transcriptional regulator protein LBUL_0981 COG2865 6.701 Predicted transcriptional regulator protein LBUL_0997 COG3620 0.348 Predicted transcriptional regulator protein LBUL_1010 COG3620 0.369 Predicted transcriptional regulator protein LBUL_1068 MarR 0.340 Transcriptional regulators LBUL_1103 ARO8 0.301 Transcriptional regulators containing a DNA-binding HTH domain and an aminotransferase domain (MocR
family) and their eukaryotic orthologs LBUL_1124 COG2932 0.337 Predicted transcriptional regulator protein LBUL_1163 RpoD 0.319 DNA-directed RNA polymerase sigma subunit (sigma70/sigma32) LBUL_1164 RpoD 2.537 DNA-directed RNA polymerase sigma subunit (sigma70/sigma32) LBUL_1180 ARO8 0.224 Transcriptional regulators containing a DNA-binding HTH domain and an aminotransferase domain (MocR
family) and their eukaryotic orthologs LBUL_1205 LysR 6.441 Transcriptional regulator LBUL_1221 COG1777 6.447 Predicted transcriptional regulator protein LBUL_1229 HrcA 0.306 0.487 Transcriptional regulator of heat shock gene LBUL_1236 ARO8 6.367 2.770 13.936 4.313 Transcriptional regulators containing a DNA-binding HTH domain and an aminotransferase domain (MocR
family) and their eukaryotic orthologs LBUL_1265 LexA 0.390 0.378 0.375 SOS-response transcriptional repressors (RecA-mediated autopeptidase) LBUL_1269 SrmB 0.254 0.116 Superfamily II DNA and RNA helicase LBUL_1285 COG5137 0.366 Histone chaperone involved in gene silencing LBUL_1286 COG1293 0.326 Predicted RNA-binding protein homologous to eukaryotic snRNP LBUL_1287 Rnc 0.121 0.044 3.323 4.226 dsRNA-specific ribonuclease LBUL_1296 RecG 0.290 RecG-like helicase LBUL_1308 NusB 0.462 Transcription termination factor LBUL_1311 RpoZ 2.105 DNA-directed RNA polymerase subunit K/omega LBUL_1321 NusB 0.463 Transcription termination factor LBUL_1381 GreA 0.460 0.437 2.990 Transcription elongation factor LBUL_1384 COG1733 0.255 Predicted transcriptional regulator protein LBUL_1401 SpoT 3.314 Guanosine polyphosphate pyrophosphohydrolase/synthetase LBUL_1404 COG1327 2.617 Predicted transcriptional regulator protein consists of a Zn-ribbon and ATP-cone domains LBUL_1474 COG5406 2.063 0.402 Nucleosome binding factor SPN SPT16 subunit LBUL_1487 SrmB 2.234 Superfamily II DNA and RNA helicase LBUL_1515 TIP49 3.376 DNA helicase TIP49 TBP-interacting protein LBUL_1535 TenA 0.366 Putative transcription activator LBUL_1545 NusG 0.355 0.376 Transcription antiterminator LBUL_1551 RpoE 0.321 DNA-directed RNA polymerase specialized sigma subunit sigma24 homolog LBUL_1563 COG1725 0.247 0.459 Predicted transcriptional regulator protein LBUL_1618 RpiR 0.320 Transcriptional regulators LBUL_1639 PurR 31.959 Transcriptional regulators LBUL_1665 HipB 0.389 Predicted transcriptional regulator protein LBUL_1691 ARO8 0.365 2.204 Transcriptional regulators containing a DNA-binding HTH domain and an aminotransferase domain (MocR
family) and their eukaryotic orthologs LBUL_1758 AcrR 0.270 0.200 Transcriptional regulator LBUL_1781 LytT 0.258 Response regulator of the LytR/AlgR family LBUL_1815 LytR 2.808 Transcriptional regulator LBUL_1822 COG1476 8.143 0.338 Predicted transcriptional regulator protein LBUL_1860 LytR 0.352 0.223 Transcriptional regulator LBUL_1925 DeoR 3.137 Transcriptional regulator contains sigma factor-related N-terminal domain LBUL_1944 PspF 2.021 2.121 0.449 0.488 Transcriptional regulators containing an AAA-type ATPase domain and a DNA-binding domain LBUL_1957 CspC 2.744 3.871 Cold shock protein LBUL_1996 PurR 0.328 0.420 Transcriptional regulators LBUL_1999 SPS1 0.359 Serine/threonine protein kinase
Translation, ribosomal structure and biogenesis LBUL_0007 RpsF 0.354 0.326 2.347 Ribosomal protein S6 LBUL_0009 RpsR 0.193 0.246 3.275 5.922 Ribosomal protein S18
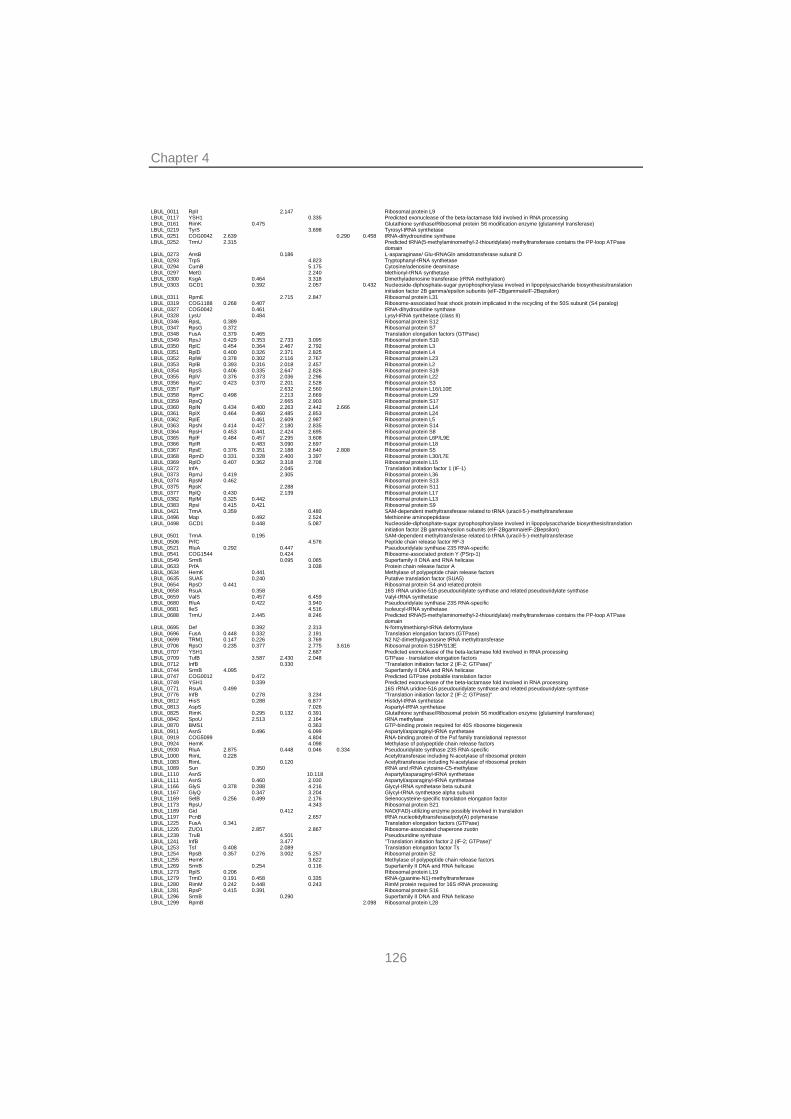
Chapter 4
126
LBUL_0011 RplI 2.147 Ribosomal protein L9 LBUL_0117 YSH1 0.335 Predicted exonuclease of the beta-lactamase fold involved in RNA processing LBUL_0161 RimK 0.475 Glutathione synthase/Ribosomal protein S6 modification enzyme (glutaminyl transferase) LBUL_0219 TyrS 3.698 Tyrosyl-tRNA synthetase LBUL_0251 COG0042 2.639 0.290 0.458 tRNA-dihydrouridine synthase LBUL_0252 TrmU 2.315 Predicted tRNA(5-methylaminomethyl-2-thiouridylate) methyltransferase contains the PP-loop ATPase
domain LBUL_0273 AnsB 0.186 L-asparaginase/ Glu-tRNAGln amidotransferase subunit D LBUL_0293 TrpS 4.823 Tryptophanyl-tRNA synthetase LBUL_0294 CumB 5.175 Cytosine/adenosine deaminase LBUL_0297 MetG 2.240 Methionyl-tRNA synthetase LBUL_0300 KsgA 0.464 3.318 Dimethyladenosine transferase (rRNA methylation) LBUL_0303 GCD1 0.392 2.057 0.432 Nucleoside-diphosphate-sugar pyrophosphorylase involved in lipopolysaccharide biosynthesis/translation
initiation factor 2B gamma/epsilon subunits (eIF-2Bgamma/eIF-2Bepsilon) LBUL_0311 RpmE 2.715 2.847 Ribosomal protein L31 LBUL_0319 COG1188 0.268 0.407 Ribosome-associated heat shock protein implicated in the recycling of the 50S subunit (S4 paralog) LBUL_0327 COG0042 0.461 tRNA-dihydrouridine synthase LBUL_0328 LysU 0.484 Lysyl-tRNA synthetase (class II) LBUL_0346 RpsL 0.389 Ribosomal protein S12 LBUL_0347 RpsG 0.372 Ribosomal protein S7 LBUL_0348 FusA 0.379 0.465 Translation elongation factors (GTPase) LBUL_0349 RpsJ 0.429 0.353 2.733 3.095 Ribosomal protein S10 LBUL_0350 RplC 0.454 0.364 2.467 2.792 Ribosomal protein L3 LBUL_0351 RplD 0.400 0.326 2.371 2.825 Ribosomal protein L4 LBUL_0352 RplW 0.378 0.302 2.116 2.767 Ribosomal protein L23 LBUL_0353 RplB 0.393 0.316 2.018 2.457 Ribosomal protein L2 LBUL_0354 RpsS 0.406 0.335 2.647 2.826 Ribosomal protein S19 LBUL_0355 RplV 0.376 0.373 2.036 2.296 Ribosomal protein L22 LBUL_0356 RpsC 0.423 0.370 2.201 2.528 Ribosomal protein S3 LBUL_0357 RplP 2.632 2.560 Ribosomal protein L16/L10E LBUL_0358 RpmC 0.498 2.213 2.669 Ribosomal protein L29 LBUL_0359 RpsQ 2.665 2.903 Ribosomal protein S17 LBUL_0360 RplN 0.434 0.400 2.263 2.442 2.666 Ribosomal protein L14 LBUL_0361 RplX 0.464 0.460 2.485 2.853 Ribosomal protein L24 LBUL_0362 RplE 0.461 2.609 2.987 Ribosomal protein L5 LBUL_0363 RpsN 0.414 0.427 2.180 2.835 Ribosomal protein S14 LBUL_0364 RpsH 0.453 0.441 2.424 2.695 Ribosomal protein S8 LBUL_0365 RplF 0.484 0.457 2.295 3.608 Ribosomal protein L6P/L9E LBUL_0366 RplR 0.483 3.090 2.697 Ribosomal protein L18 LBUL_0367 RpsE 0.376 0.351 2.188 2.640 2.808 Ribosomal protein S5 LBUL_0368 RpmD 0.331 0.328 2.400 3.397 Ribosomal protein L30/L7E LBUL_0369 RplO 0.407 0.362 3.318 2.708 Ribosomal protein L15 LBUL_0372 InfA 2.045 Translation initiation factor 1 (IF-1) LBUL_0373 RpmJ 0.419 2.305 Ribosomal protein L36 LBUL_0374 RpsM 0.462 Ribosomal protein S13 LBUL_0375 RpsK 2.288 Ribosomal protein S11 LBUL_0377 RplQ 0.430 2.139 Ribosomal protein L17 LBUL_0382 RplM 0.325 0.442 Ribosomal protein L13 LBUL_0383 RpsI 0.415 0.421 Ribosomal protein S9 LBUL_0421 TrmA 0.359 0.480 SAM-dependent methyltransferase related to tRNA (uracil-5-)-methyltransferase LBUL_0496 Map 0.492 2.524 Methionine aminopeptidase LBUL_0498 GCD1 0.448 5.087 Nucleoside-diphosphate-sugar pyrophosphorylase involved in lipopolysaccharide biosynthesis/translation
initiation factor 2B gamma/epsilon subunits (eIF-2Bgamma/eIF-2Bepsilon) LBUL_0501 TrmA 0.195 SAM-dependent methyltransferase related to tRNA (uracil-5-)-methyltransferase LBUL_0506 PrfC 4.576 Peptide chain release factor RF-3 LBUL_0521 RluA 0.292 0.447 Pseudouridylate synthase 23S RNA-specific LBUL_0541 COG1544 0.424 Ribosome-associated protein Y (PSrp-1) LBUL_0549 SrmB 0.095 0.085 Superfamily II DNA and RNA helicase LBUL_0633 PrfA 3.038 Protein chain release factor A LBUL_0634 HemK 0.441 Methylase of polypeptide chain release factors LBUL_0635 SUA5 0.240 Putative translation factor (SUA5) LBUL_0654 RpsD 0.441 Ribosomal protein S4 and related protein LBUL_0658 RsuA 0.358 16S rRNA uridine-516 pseudouridylate synthase and related pseudouridylate synthase LBUL_0659 ValS 0.457 6.459 Valyl-tRNA synthetase LBUL_0680 RluA 0.422 3.940 Pseudouridylate synthase 23S RNA-specific LBUL_0681 IleS 4.516 Isoleucyl-tRNA synthetase LBUL_0688 TrmU 2.445 8.246 Predicted tRNA(5-methylaminomethyl-2-thiouridylate) methyltransferase contains the PP-loop ATPase
domain LBUL_0695 Def 0.392 2.313 N-formylmethionyl-tRNA deformylase LBUL_0696 FusA 0.448 0.332 2.191 Translation elongation factors (GTPase) LBUL_0699 TRM1 0.147 0.226 3.769 N2 N2-dimethylguanosine tRNA methyltransferase LBUL_0706 RpsO 0.235 0.377 2.775 3.616 Ribosomal protein S15P/S13E LBUL_0707 YSH1 2.687 Predicted exonuclease of the beta-lactamase fold involved in RNA processing LBUL_0709 TufB 3.587 2.430 2.048 GTPase - translation elongation factors LBUL_0712 InfB 0.330 "Translation initiation factor 2 (IF-2; GTPase)" LBUL_0744 SrmB 4.095 Superfamily II DNA and RNA helicase LBUL_0747 COG0012 0.472 Predicted GTPase probable translation factor LBUL_0749 YSH1 0.339 Predicted exonuclease of the beta-lactamase fold involved in RNA processing LBUL_0771 RsuA 0.499 16S rRNA uridine-516 pseudouridylate synthase and related pseudouridylate synthase LBUL_0776 InfB 0.278 3.234 "Translation initiation factor 2 (IF-2; GTPase)" LBUL_0812 HisS 0.288 6.877 Histidyl-tRNA synthetase LBUL_0813 AspS 7.026 Aspartyl-tRNA synthetase LBUL_0825 RimK 0.295 0.132 0.391 Glutathione synthase/Ribosomal protein S6 modification enzyme (glutaminyl transferase) LBUL_0842 SpoU 2.513 2.164 rRNA methylase LBUL_0870 BMS1 0.363 GTP-binding protein required for 40S ribosome biogenesis LBUL_0911 AsnS 0.496 6.099 Aspartyl/asparaginyl-tRNA synthetase LBUL_0919 COG5099 4.804 RNA-binding protein of the Puf family translational repressor LBUL_0924 HemK 4.098 Methylase of polypeptide chain release factors LBUL_0930 RluA 2.875 0.448 0.046 0.334 Pseudouridylate synthase 23S RNA-specific LBUL_1000 RimL 0.228 Acetyltransferase including N-acetylase of ribosomal protein LBUL_1083 RimL 0.120 Acetyltransferase including N-acetylase of ribosomal protein LBUL_1089 Sun 0.350 tRNA and rRNA cytosine-C5-methylase LBUL_1110 AsnS 10.118 Aspartyl/asparaginyl-tRNA synthetase LBUL_1111 AsnS 0.460 2.030 Aspartyl/asparaginyl-tRNA synthetase LBUL_1166 GlyS 0.378 0.288 4.216 Glycyl-tRNA synthetase beta subunit LBUL_1167 GlyQ 0.347 3.204 Glycyl-tRNA synthetase alpha subunit LBUL_1169 SelB 0.256 0.499 2.176 Selenocysteine-specific translation elongation factor LBUL_1173 RpsU 4.343 Ribosomal protein S21 LBUL_1189 Gid 0.412 NAD(FAD)-utilizing enzyme possibly involved in translation LBUL_1197 PcnB 2.657 tRNA nucleotidyltransferase/poly(A) polymerase LBUL_1225 FusA 0.341 Translation elongation factors (GTPase) LBUL_1226 ZUO1 2.857 2.867 Ribosome-associated chaperone zuotin LBUL_1239 TruB 4.501 Pseudouridine synthase LBUL_1241 InfB 3.477 "Translation initiation factor 2 (IF-2; GTPase)" LBUL_1253 Tsf 0.408 2.089 Translation elongation factor Ts LBUL_1254 RpsB 0.357 0.276 3.002 5.257 Ribosomal protein S2 LBUL_1255 HemK 3.622 Methylase of polypeptide chain release factors LBUL_1269 SrmB 0.254 0.116 Superfamily II DNA and RNA helicase LBUL_1273 RplS 0.206 Ribosomal protein L19 LBUL_1279 TrmD 0.191 0.458 0.335 tRNA-(guanine-N1)-methyltransferase LBUL_1280 RimM 0.242 0.448 0.243 RimM protein required for 16S rRNA processing LBUL_1281 RpsP 0.415 0.391 Ribosomal protein S16 LBUL_1296 SrmB 0.290 Superfamily II DNA and RNA helicase LBUL_1299 RpmB 2.098 Ribosomal protein L28
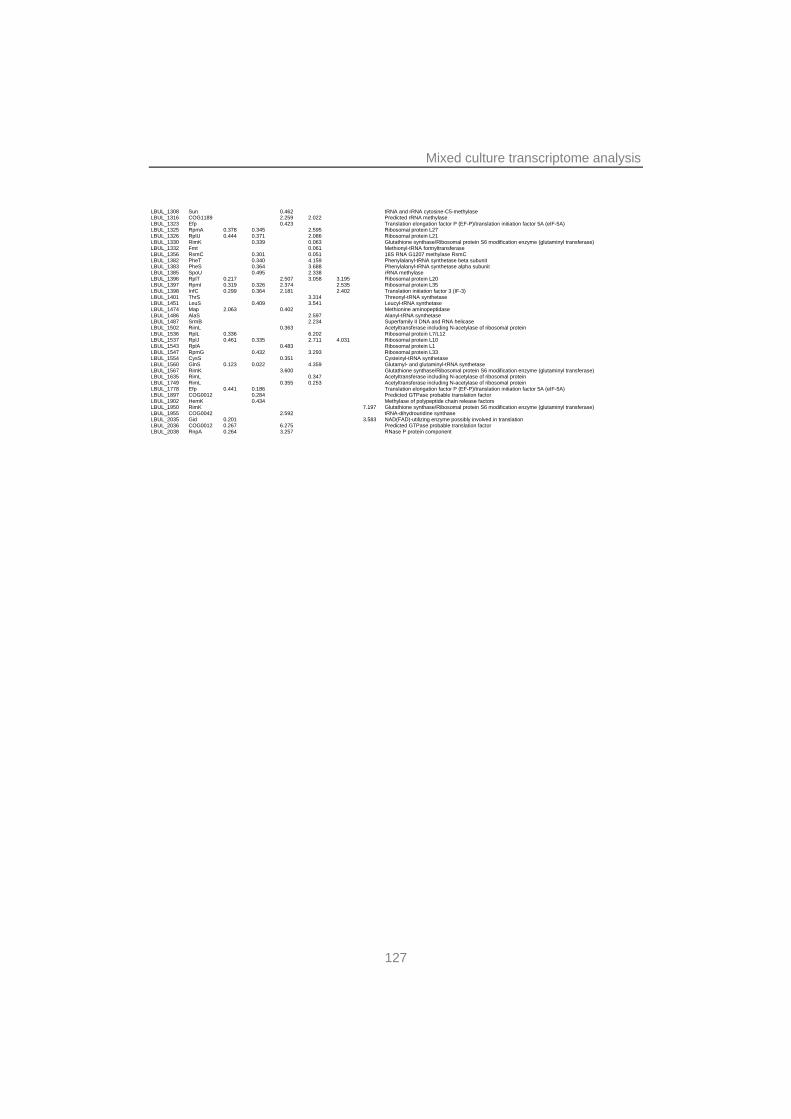
Mixed culture transcriptome analysis
127
LBUL_1308 Sun 0.462 tRNA and rRNA cytosine-C5-methylase LBUL_1316 COG1189 2.259 2.022 Predicted rRNA methylase LBUL_1323 Efp 0.423 Translation elongation factor P (EF-P)/translation initiation factor 5A (eIF-5A) LBUL_1325 RpmA 0.378 0.345 2.595 Ribosomal protein L27 LBUL_1326 RplU 0.444 0.371 2.086 Ribosomal protein L21 LBUL_1330 RimK 0.339 0.063 Glutathione synthase/Ribosomal protein S6 modification enzyme (glutaminyl transferase) LBUL_1332 Fmt 0.061 Methionyl-tRNA formyltransferase LBUL_1356 RsmC 0.301 0.051 16S RNA G1207 methylase RsmC LBUL_1382 PheT 0.340 4.159 Phenylalanyl-tRNA synthetase beta subunit LBUL_1383 PheS 0.364 3.688 Phenylalanyl-tRNA synthetase alpha subunit LBUL_1385 SpoU 0.495 2.338 rRNA methylase LBUL_1396 RplT 0.217 2.507 3.058 3.195 Ribosomal protein L20 LBUL_1397 RpmI 0.319 0.326 2.374 2.535 Ribosomal protein L35 LBUL_1398 InfC 0.299 0.364 2.181 2.402 Translation initiation factor 3 (IF-3) LBUL_1401 ThrS 3.314 Threonyl-tRNA synthetase LBUL_1451 LeuS 0.409 3.541 Leucyl-tRNA synthetase LBUL_1474 Map 2.063 0.402 Methionine aminopeptidase LBUL_1486 AlaS 2.597 Alanyl-tRNA synthetase LBUL_1487 SrmB 2.234 Superfamily II DNA and RNA helicase LBUL_1502 RimL 0.363 Acetyltransferase including N-acetylase of ribosomal protein LBUL_1536 RplL 0.336 6.202 Ribosomal protein L7/L12 LBUL_1537 RplJ 0.461 0.335 2.711 4.031 Ribosomal protein L10 LBUL_1543 RplA 0.483 Ribosomal protein L1 LBUL_1547 RpmG 0.432 3.293 Ribosomal protein L33 LBUL_1554 CysS 0.351 Cysteinyl-tRNA synthetase LBUL_1560 GlnS 0.123 0.022 4.359 Glutamyl- and glutaminyl-tRNA synthetase LBUL_1567 RimK 3.600 Glutathione synthase/Ribosomal protein S6 modification enzyme (glutaminyl transferase) LBUL_1635 RimL 0.347 Acetyltransferase including N-acetylase of ribosomal protein LBUL_1749 RimL 0.355 0.253 Acetyltransferase including N-acetylase of ribosomal protein LBUL_1778 Efp 0.441 0.186 Translation elongation factor P (EF-P)/translation initiation factor 5A (eIF-5A) LBUL_1897 COG0012 0.284 Predicted GTPase probable translation factor LBUL_1902 HemK 0.434 Methylase of polypeptide chain release factors LBUL_1950 RimK 7.197 Glutathione synthase/Ribosomal protein S6 modification enzyme (glutaminyl transferase) LBUL_1955 COG0042 2.592 tRNA-dihydrouridine synthase LBUL_2035 Gid 0.201 3.583 NAD(FAD)-utilizing enzyme possibly involved in translation LBUL_2036 COG0012 0.267 6.275 Predicted GTPase probable translation factor LBUL_2038 RnpA 0.264 3.257 RNase P protein component

129
Chapter 5
Experimental evolution of yoghurt cultures improves co-culture growth and interactions
Sander Sieuwerts, Frank A.M. de Bok, Colin J. Ingham, Marke Beerthuyzen, Sacha
A.F.T. van Hijum, Douwe Molenaar, Petronella M. Slegers, Elisabeth H. Tolls, Willem M. de Vos and Johan E.T. van Hylckama Vlieg
Chapter 5
130
ABSTRACT Most microbial ecosystems consist of many different species that influence each other. The evolutionary driving forces that shape the concomitant microbial interaction networks are poorly understood and little experimental information exists on the co-evolution of microbes. Yoghurt is milk fermented by the lactic acid bacteria Streptococcus thermophilus and Lactobacillus bulgaricus. It is one of the best studied mixed cultures and represents a simple and attractive model system for ecological and evolutionary studies. L. bulgaricus and S. thermophilus have co-evolved towards optimal growth in milk, where they stimulate each other’s growth through multiple nutritional interactions. However, how, with what speed and to what extent these nutritional interactions evolve is not known yet. To address this evolution process, we selected genomically characterized strains of S. thermophilus and L. bulgaricus that had not been grown together before and therefore are expected not to have optimized their metabolism to co-cultivation. These strains were cultivated in co-culture in milk for more than 1000 generations in sequential batch cultures under a constant growth regime. The evolved mixed culture showed improved acidification rate, survival and exopolysaccharide production, which are all important industrial traits. Moreover, combinatorial co-cultivation of the parental and evolved strains showed that co-evolution of these strains resulted in increased mutual stimulatory effects. Sequencing of the genomes and transcriptome profiling of the parental and the evolved strains revealed mutations that affected the acquisition of sulfur amino acid and branched-chain amino acids, folic acid and long-chain fatty acids. These results indicate that the canonical nutritional dependencies of S. thermophilus and L. bulgaricus in amino acid, purine and fatty acid metabolism were strengthened in this short adaptation period. As the resulting adapted co-culture has useful industrial properties, this approach not only shows that experimental evolution can be used to study microbial interaction networks but can also be a powerful tool to improve industrial traits paving the way for creating new starter cultures with improved characteristics INTRODUCTION Most microbial ecosystems, including industrial fermentations, consist of many different species that have complex interactions contributing to the ecological structure of the community (7, 16). Mutual effects on fitness between interacting
Mixed culture experimental evolution
131
microbes are an effective means of classifying these interactions (reviewed in Sieuwerts et al. (27)). A further unraveling of these interactions is the key in understanding and rationally improving industrial fermentations. Important questions are how stable communities of interacting microorganisms evolve and how the interactions influence the consortium members. Recent advances in the fields of microbial evolution (2, 34) and functional genomics (14) shed light on the mechanisms driving the evolution of interactions. Low complexity microbial ecosystems are attractive models to further study the evolution of interacting organisms. Food fermentations offer this opportunity as they are typically carried out by a small number of dominant strains. Yoghurt can be regarded as the paradigm. It is (bovine) milk fermented by the lactic acid bacteria Streptococcus thermophilus and Lactobacillus delbrueckii subsp. bulgaricus and has great industrial relevance; the worldwide turnover of yoghurt was 34 billion US $ in 2007 (20). The two lactic acid bacteria stimulate each other’s growth and acid production when grown together in milk, in a process referred to as proto-cooperation. Their interactions are mainly related to purine and amino acid (AA) metabolism. L. bulgaricus provides S. thermophilus with amino acids and peptides through the action of its exoprotease PrtB (4, 25, 35). In turn, S. thermophilus provides formic acid, folic acid (6) and carbon dioxide (9), all involved in purine and arginine metabolism. Exopolysaccharides (EPS) are also suggested to play a role in the interactions, but their exact function remains to be established (29).
In this work, we applied experimental evolution to adapt a novel strain combination of genomically characterized S. thermophilus (3) and L. bulgaricus (17) under a strict growth regime. In addition, we addressed the molecular mechanisms and phenotypical traits that form the basis of their stable proto-cooperation. For this purpose, we used a combination of genomics approaches, i.e. genome re-sequencing and transcriptome profiling, and physiological characterization, i.e. testing of acidification, growth and survival, end metabolite production and EPS production. We observed that the experimental evolution improved important functionalities, such as acid resistance and viscosity, that resemble those of a commercial starter. We linked these improvements to mutations in genes in pathways that were previously shown to be involved in the proto-cooperation between the two bacteria (29). As the resulting adapted co-culture has useful industrial properties, this approach not only shows that experimental evolution can be used to study microbial interaction networks but can also be a powerful tool to improve industrial traits paving the way for creating new starter cultures with improved characteristics.
Chapter 5
132
MATERIALS AND METHODS Strains and culture conditions. Streptococcus thermophilus CNRZ1066 (3) and Sts (from the commercial starter I-St) were maintained in M17 broth (Oxoid) containing 22% glycerol (Scharlau) at -80°C, Lactobacillus delbrueckii subsp bulgaricus ATCC BAA-365 (17) and Ib (from I-St) in MRS broth (Merck) with 22% glycerol at -80°C. Pre-cultures of both species were made as mono cultures in UHT-treated 10% (w/v) reconstituted skim milk (Nilac, NIZO food research), referred to as milk in the rest of the paper, for 24 h at 37°C. Mixed cultures for the experimental evolution studies were obtained by inoculating 10 mL of milk with pre-cultures to a density of approximately 106 cells per mL per strain. The experiments were carried out in duplicate. The cultures were propagated by transferring 1.5% (v/v) daily until a theoretical number of 1000 generations was reached (167 transfers). Acidification and final cell counts were monitored with regular intervals of approximately 3 weeks (i.e. 127 generations). After 49, 97, 133, 219, 304, 365, 456, 517, 602, 699, 809, 930 generations freezer stocks were prepared for later experimentation by mixing of 1 volume 60% glycerol with 2 volumes yoghurt. From one final culture, single colony isolates were obtained that were designated S. thermophilus NIZO3938 and L. bulgaricus NIZO3939. Single colony isolate freezer stocks were obtained by selective plating (M17 agar (Oxoid) supplemented with 1% glucose at 45°C for S. thermophilus and MRS agar (Merck) at 45°C anaerobic for L. bulgaricus). Colonies of these plates were streaked onto new plates. Single colonies from the second plates were grown in liquid media and visually inspected with a microscope for infections.
Pre-cultures in follow-up experiments were made as described above. After 24 h, the optical density at 600 nm was measured in duplicate using 1 volume of milk culture mixed with 9 volumes of a 0.2% NaEDTA (w/v) / 0.2% NaOH (w/v) solution. Final cultures were inoculated to a start OD600 of 0,005 per strain (corresponding to approximately 106 cells per mL).
For monitoring of acidification activity during the evolution process, 10 mL milk was inoculated with 1% of a 24 h old mixed culture and pH was followed at 37°C for 24 h using the Cinac system (Ysebaert, France). S. thermophilus and L. bulgaricus were enumerated by spotting serial dilutions onto agar plates as described before (28). S. thermophilus was plated onto TY agar supplemented with 1% (w/v) glucose and L. bulgaricus was plated onto MRS agar. Both were
Mixed culture experimental evolution
133
incubated at 37°C for 6 h before being transferred to 45°C for another 20 h, L. bulgaricus anaerobically.
The acidification rate (∆lactic acid/∆t in mM/h) was calculated as follows. A calibration curve of lactic acid concentration (known y values) in milk versus pH (known x values) was prepared. Using the GROWTH function in Microsoft Excel, the measured pH values in the culture (new x values) were calculated into lactic acid concentration.
Significant differences in acidification rate and CFU counts between samples were calculated with a two-tailed Students t-test (p=0.05). Viscosity measurements. For viscosity measurements 120 mL cultures were grown in milk at 37°C for 48 h. Viscosity was measured using a viscosimeter M5 (Haake Fisons) with a rotation speed of 0 increasing to 400 rotations per s at 37°C. Each strain combination was measured in duplicate. Significant differences were determined using a Students t-test (p=0.05) on the average measurements between 50 and 55 rotations per sec. EPS isolation. EPS were isolated from 275 mL cultures grown for 24 h at 37°C as described before (29). All isolations were performed in duplicate. Metabolite analysis with HPLC and GC-MS. Duplicate samples for HPLC analysis were taken from cultures and frozen at -20°C in 2 mL eppendorf tubes until analysis. For acid analysis, proteins and fat were precipitated with perchloric acid. After filtration using a Spartan 30/B (Schleicher & Schuell) filter, the liquid was used for high pressure liquid chromatography. In a HPX-87H column (BioRad 300 x 7.8 mm) column at 60°C with a flow of 0.6 mL/min 0.005 M sulfuric acid 25 µL of the solution was injected. For sugar analysis, 1 g of culture was mixed with 10 mL of a solution composed of 4.55 g/L Zn(CH3COOH)2.2H2O (BDH Analar), 2.73 g/L H3[P(W3O10)]4.xH2O (BDH Analar) and 2.9 mL/L 99.8% acetic acid (BDH Analar). After filtering this solution with a Spartan 30/B filter, was used for chromatography. In a HPX-87H column with a flow of 0.4 mL/min 0.01 (w/v) NaCl, 25 µL of the solution was injected. Components were detected using a RID-10A (Shimadzu, Japan) and ERC-7510 (Erma optical works Ltd, Japan) refraction index meter at 40°C for organic acids and sugars, respectively. Data were analyzed using Chromeleon (Dionex) and compared to standard series of desired components. GC-MS analyses were performed as described before (29).
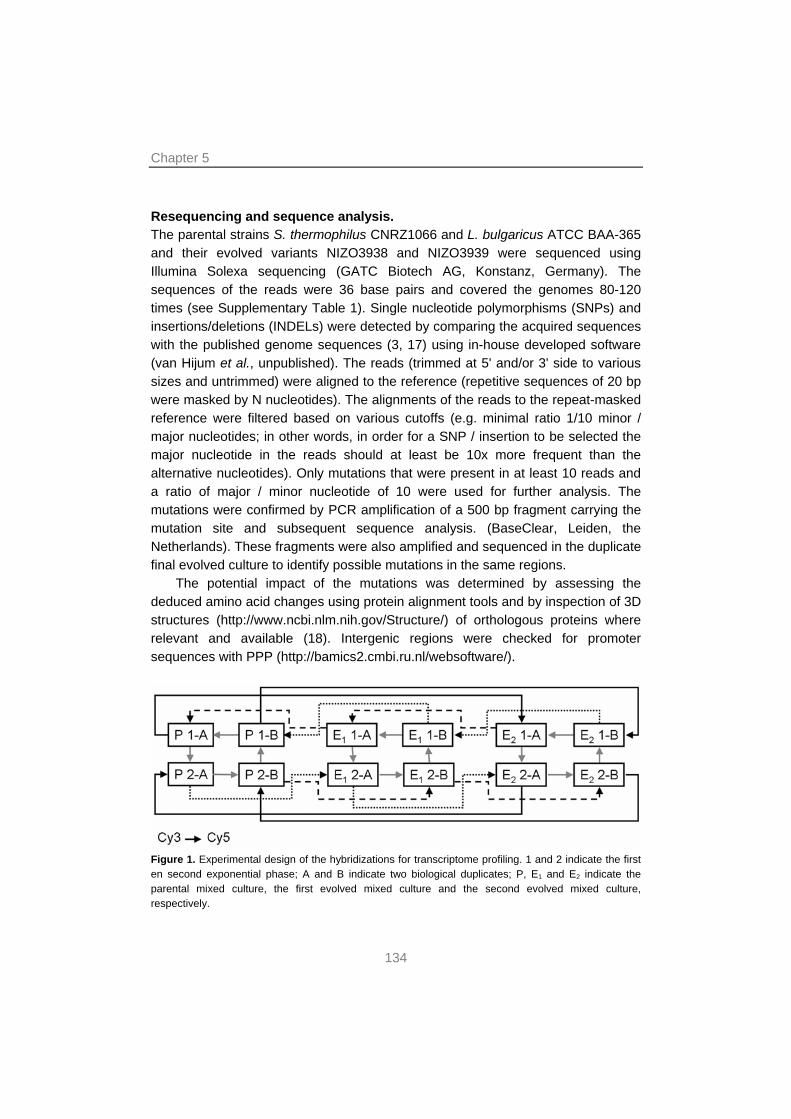
Chapter 5
134
Resequencing and sequence analysis. The parental strains S. thermophilus CNRZ1066 and L. bulgaricus ATCC BAA-365 and their evolved variants NIZO3938 and NIZO3939 were sequenced using Illumina Solexa sequencing (GATC Biotech AG, Konstanz, Germany). The sequences of the reads were 36 base pairs and covered the genomes 80-120 times (see Supplementary Table 1). Single nucleotide polymorphisms (SNPs) and insertions/deletions (INDELs) were detected by comparing the acquired sequences with the published genome sequences (3, 17) using in-house developed software (van Hijum et al., unpublished). The reads (trimmed at 5' and/or 3' side to various sizes and untrimmed) were aligned to the reference (repetitive sequences of 20 bp were masked by N nucleotides). The alignments of the reads to the repeat-masked reference were filtered based on various cutoffs (e.g. minimal ratio 1/10 minor / major nucleotides; in other words, in order for a SNP / insertion to be selected the major nucleotide in the reads should at least be 10x more frequent than the alternative nucleotides). Only mutations that were present in at least 10 reads and a ratio of major / minor nucleotide of 10 were used for further analysis. The mutations were confirmed by PCR amplification of a 500 bp fragment carrying the mutation site and subsequent sequence analysis. (BaseClear, Leiden, the Netherlands). These fragments were also amplified and sequenced in the duplicate final evolved culture to identify possible mutations in the same regions.
The potential impact of the mutations was determined by assessing the deduced amino acid changes using protein alignment tools and by inspection of 3D structures (http://www.ncbi.nlm.nih.gov/Structure/) of orthologous proteins where relevant and available (18). Intergenic regions were checked for promoter sequences with PPP (http://bamics2.cmbi.ru.nl/websoftware/).
Figure 1. Experimental design of the hybridizations for transcriptome profiling. 1 and 2 indicate the first en second exponential phase; A and B indicate two biological duplicates; P, E1 and E2 indicate the parental mixed culture, the first evolved mixed culture and the second evolved mixed culture, respectively.
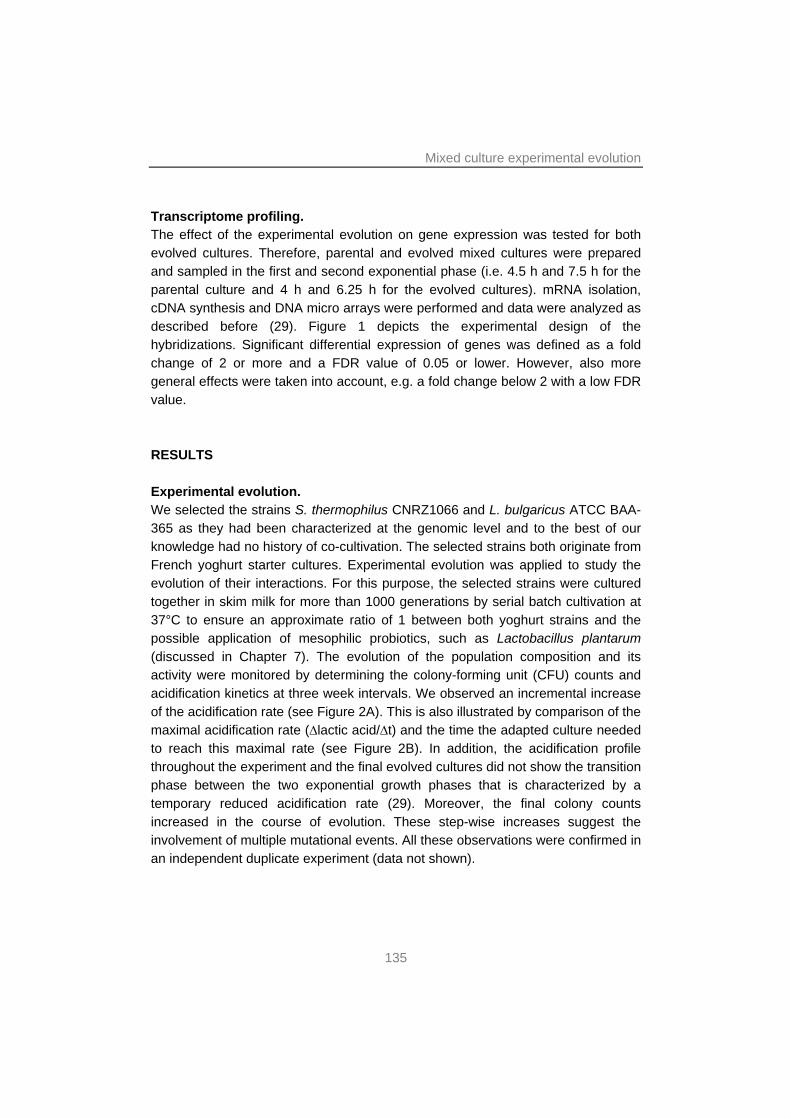
Mixed culture experimental evolution
135
Transcriptome profiling. The effect of the experimental evolution on gene expression was tested for both evolved cultures. Therefore, parental and evolved mixed cultures were prepared and sampled in the first and second exponential phase (i.e. 4.5 h and 7.5 h for the parental culture and 4 h and 6.25 h for the evolved cultures). mRNA isolation, cDNA synthesis and DNA micro arrays were performed and data were analyzed as described before (29). Figure 1 depicts the experimental design of the hybridizations. Significant differential expression of genes was defined as a fold change of 2 or more and a FDR value of 0.05 or lower. However, also more general effects were taken into account, e.g. a fold change below 2 with a low FDR value. RESULTS Experimental evolution. We selected the strains S. thermophilus CNRZ1066 and L. bulgaricus ATCC BAA-365 as they had been characterized at the genomic level and to the best of our knowledge had no history of co-cultivation. The selected strains both originate from French yoghurt starter cultures. Experimental evolution was applied to study the evolution of their interactions. For this purpose, the selected strains were cultured together in skim milk for more than 1000 generations by serial batch cultivation at 37°C to ensure an approximate ratio of 1 between both yoghurt strains and the possible application of mesophilic probiotics, such as Lactobacillus plantarum (discussed in Chapter 7). The evolution of the population composition and its activity were monitored by determining the colony-forming unit (CFU) counts and acidification kinetics at three week intervals. We observed an incremental increase of the acidification rate (see Figure 2A). This is also illustrated by comparison of the maximal acidification rate (∆lactic acid/∆t) and the time the adapted culture needed to reach this maximal rate (see Figure 2B). In addition, the acidification profile throughout the experiment and the final evolved cultures did not show the transition phase between the two exponential growth phases that is characterized by a temporary reduced acidification rate (29). Moreover, the final colony counts increased in the course of evolution. These step-wise increases suggest the involvement of multiple mutational events. All these observations were confirmed in an independent duplicate experiment (data not shown).
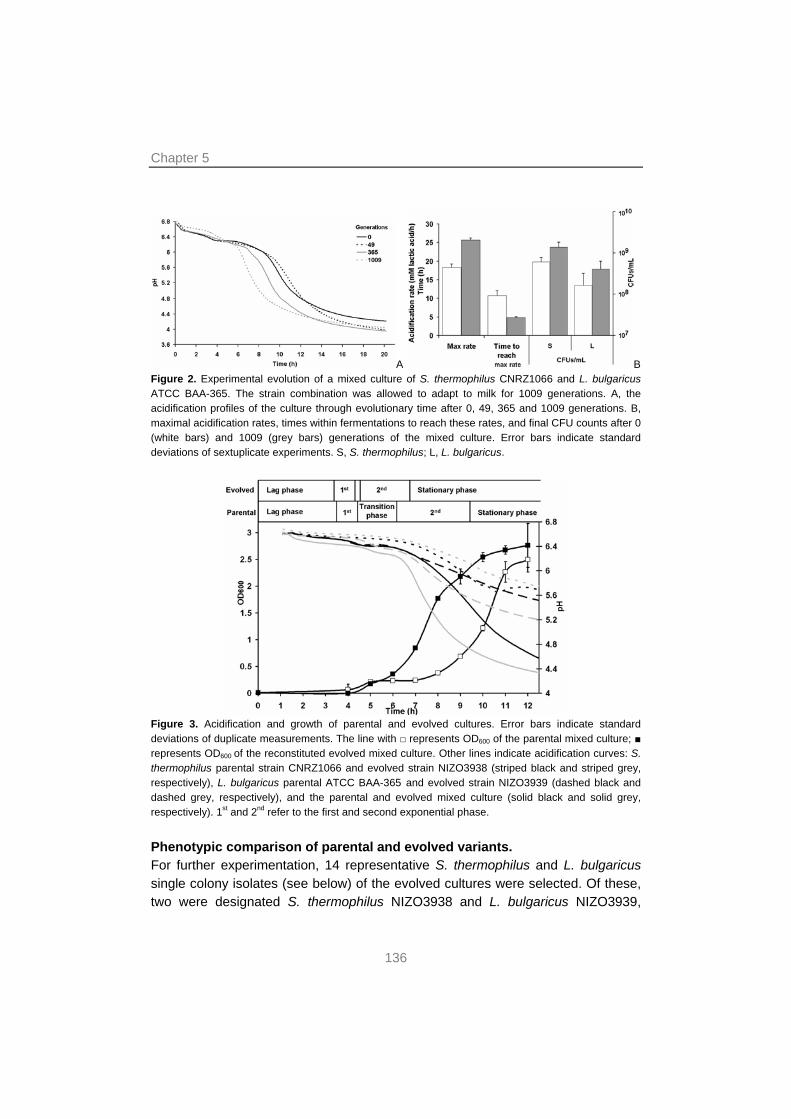
Chapter 5
136
A B Figure 2. Experimental evolution of a mixed culture of S. thermophilus CNRZ1066 and L. bulgaricus ATCC BAA-365. The strain combination was allowed to adapt to milk for 1009 generations. A, the acidification profiles of the culture through evolutionary time after 0, 49, 365 and 1009 generations. B, maximal acidification rates, times within fermentations to reach these rates, and final CFU counts after 0 (white bars) and 1009 (grey bars) generations of the mixed culture. Error bars indicate standard deviations of sextuplicate experiments. S, S. thermophilus; L, L. bulgaricus.
Figure 3. Acidification and growth of parental and evolved cultures. Error bars indicate standard deviations of duplicate measurements. The line with □ represents OD600 of the parental mixed culture; ■ represents OD600 of the reconstituted evolved mixed culture. Other lines indicate acidification curves: S. thermophilus parental strain CNRZ1066 and evolved strain NIZO3938 (striped black and striped grey, respectively), L. bulgaricus parental ATCC BAA-365 and evolved strain NIZO3939 (dashed black and dashed grey, respectively), and the parental and evolved mixed culture (solid black and solid grey, respectively). 1st and 2nd refer to the first and second exponential phase. Phenotypic comparison of parental and evolved variants. For further experimentation, 14 representative S. thermophilus and L. bulgaricus single colony isolates (see below) of the evolved cultures were selected. Of these, two were designated S. thermophilus NIZO3938 and L. bulgaricus NIZO3939,
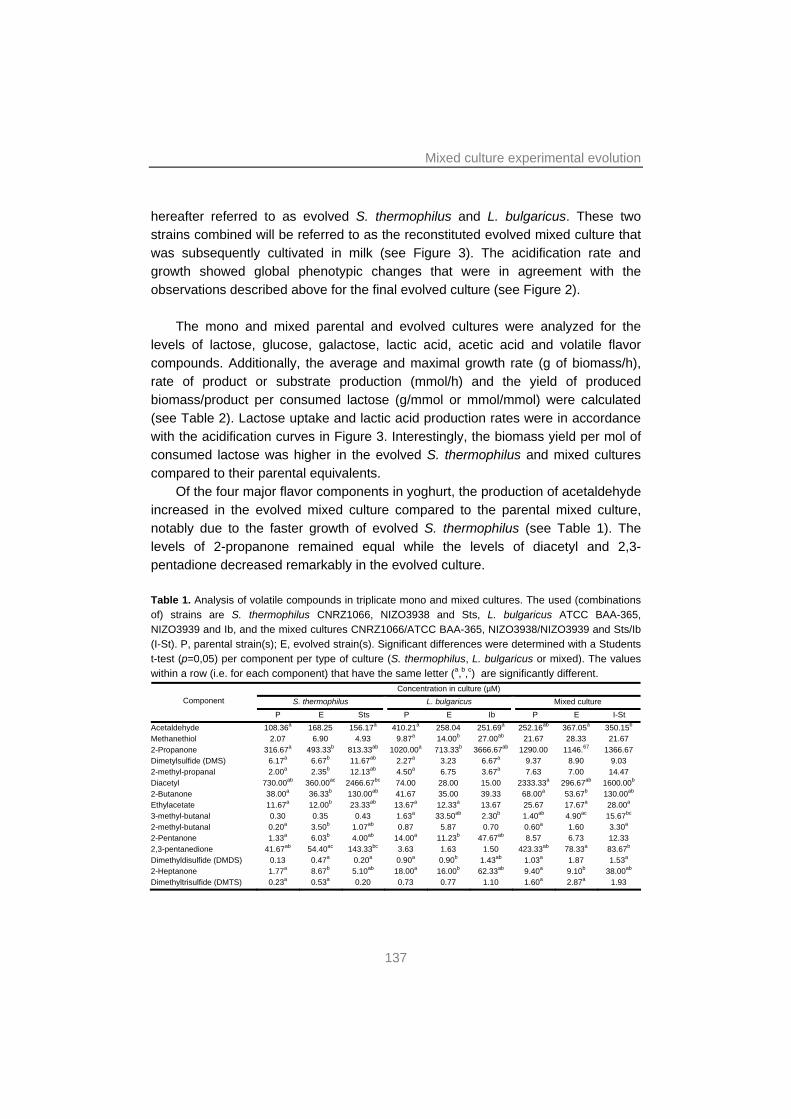
Mixed culture experimental evolution
137
hereafter referred to as evolved S. thermophilus and L. bulgaricus. These two strains combined will be referred to as the reconstituted evolved mixed culture that was subsequently cultivated in milk (see Figure 3). The acidification rate and growth showed global phenotypic changes that were in agreement with the observations described above for the final evolved culture (see Figure 2).
The mono and mixed parental and evolved cultures were analyzed for the levels of lactose, glucose, galactose, lactic acid, acetic acid and volatile flavor compounds. Additionally, the average and maximal growth rate (g of biomass/h), rate of product or substrate production (mmol/h) and the yield of produced biomass/product per consumed lactose (g/mmol or mmol/mmol) were calculated (see Table 2). Lactose uptake and lactic acid production rates were in accordance with the acidification curves in Figure 3. Interestingly, the biomass yield per mol of consumed lactose was higher in the evolved S. thermophilus and mixed cultures compared to their parental equivalents.
Of the four major flavor components in yoghurt, the production of acetaldehyde increased in the evolved mixed culture compared to the parental mixed culture, notably due to the faster growth of evolved S. thermophilus (see Table 1). The levels of 2-propanone remained equal while the levels of diacetyl and 2,3-pentadione decreased remarkably in the evolved culture. Table 1. Analysis of volatile compounds in triplicate mono and mixed cultures. The used (combinations of) strains are S. thermophilus CNRZ1066, NIZO3938 and Sts, L. bulgaricus ATCC BAA-365, NIZO3939 and Ib, and the mixed cultures CNRZ1066/ATCC BAA-365, NIZO3938/NIZO3939 and Sts/Ib (I-St). P, parental strain(s); E, evolved strain(s). Significant differences were determined with a Students t-test (p=0,05) per component per type of culture (S. thermophilus, L. bulgaricus or mixed). The values within a row (i.e. for each component) that have the same letter (a,b,c) are significantly different.
Concentration in culture (µM) S. thermophilus L. bulgaricus Mixed culture Component
P E Sts P E Ib P E I-St Acetaldehyde 108.36a 168.25 156.17a 410.21a 258.04 251.69a 252.16ab 367.05a 350.15b Methanethiol 2.07 6.90 4.93 9.87a 14.00b 27.00ab 21.67 28.33 21.67 2-Propanone 316.67a 493.33b 813.33ab 1020.00a 713.33b 3666.67ab 1290.00 1146.67 1366.67 Dimetylsulfide (DMS) 6.17a 6.67b 11.67ab 2.27a 3.23 6.67a 9.37 8.90 9.03 2-methyl-propanal 2.00a 2.35b 12.13ab 4.50a 6.75 3.67a 7.63 7.00 14.47 Diacetyl 730.00ab 360.00ac 2466.67bc 74.00 28.00 15.00 2333.33a 296.67ab 1600.00b 2-Butanone 38.00a 36.33b 130.00ab 41.67 35.00 39.33 68.00a 53.67b 130.00ab Ethylacetate 11.67a 12.00b 23.33ab 13.67a 12.33a 13.67 25.67 17.67a 28.00a 3-methyl-butanal 0.30 0.35 0.43 1.63a 33.50ab 2.30b 1.40ab 4.90ac 15.67bc 2-methyl-butanal 0.20a 3.50b 1.07ab 0.87 5.87 0.70 0.60a 1.60 3.30a 2-Pentanone 1.33a 6.03b 4.00ab 14.00a 11.23b 47.67ab 8.57 6.73 12.33 2,3-pentanedione 41.67ab 54.40ac 143.33bc 3.63 1.63 1.50 423.33ab 78.33a 83.67b Dimethyldisulfide (DMDS) 0.13 0.47a 0.20a 0.90a 0.90b 1.43ab 1.03a 1.87 1.53a 2-Heptanone 1.77a 8.67b 5.10ab 18.00a 16.00b 62.33ab 9.40a 9.10b 38.00ab Dimethyltrisulfide (DMTS) 0.23a 0.53a 0.20 0.73 0.77 1.10 1.60a 2.87a 1.93
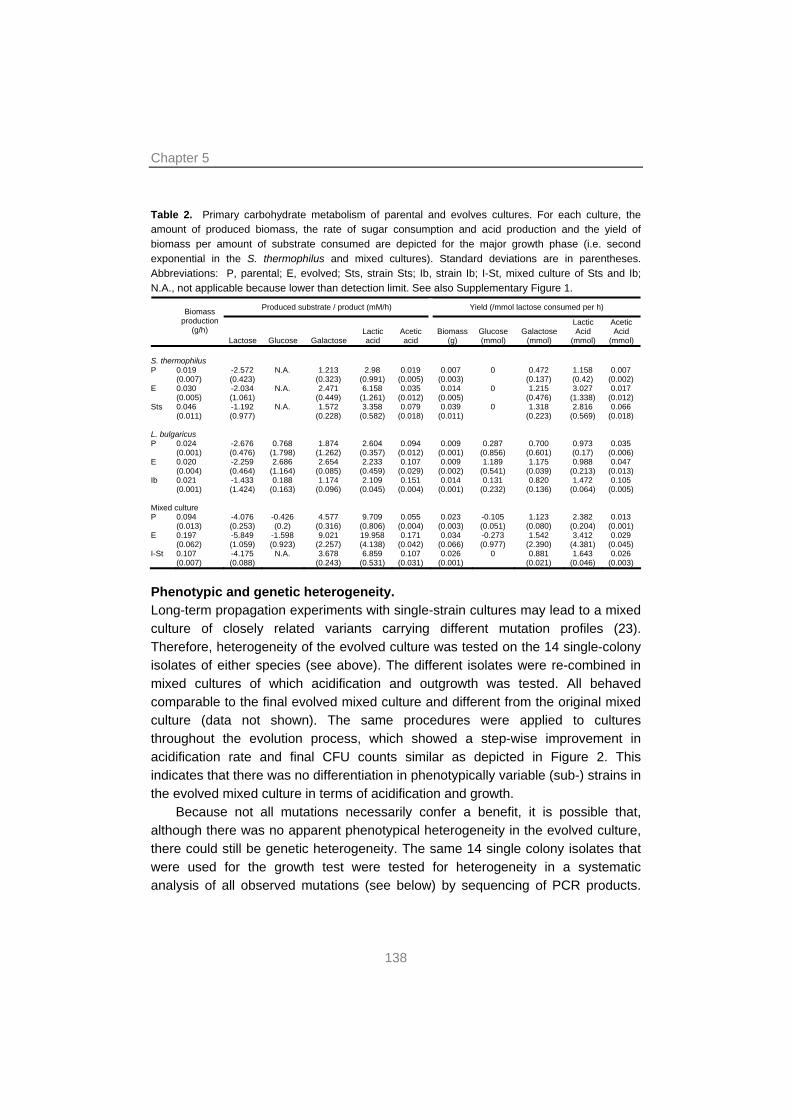
Chapter 5
138
Table 2. Primary carbohydrate metabolism of parental and evolves cultures. For each culture, the amount of produced biomass, the rate of sugar consumption and acid production and the yield of biomass per amount of substrate consumed are depicted for the major growth phase (i.e. second exponential in the S. thermophilus and mixed cultures). Standard deviations are in parentheses. Abbreviations: P, parental; E, evolved; Sts, strain Sts; Ib, strain Ib; I-St, mixed culture of Sts and Ib; N.A., not applicable because lower than detection limit. See also Supplementary Figure 1.
Produced substrate / product (mM/h) Yield (/mmol lactose consumed per h) Biomass
production (g/h)
Lactose Glucose Galactose Lactic acid
Acetic acid
Biomass (g)
Glucose (mmol)
Galactose (mmol)
Lactic Acid
(mmol)
Acetic Acid
(mmol) S. thermophilus P 0.019
(0.007) -2.572 (0.423)
N.A. 1.213 (0.323)
2.98 (0.991)
0.019 (0.005)
0.007 (0.003)
0 0.472 (0.137)
1.158 (0.42)
0.007 (0.002)
E 0.030 (0.005)
-2.034 (1.061)
N.A. 2.471 (0.449)
6.158 (1.261)
0.035 (0.012)
0.014 (0.005)
0 1.215 (0.476)
3.027 (1.338)
0.017 (0.012)
Sts 0.046 (0.011)
-1.192 (0.977)
N.A. 1.572 (0.228)
3.358 (0.582)
0.079 (0.018)
0.039 (0.011)
0 1.318 (0.223)
2.816 (0.569)
0.066 (0.018)
L. bulgaricus P 0.024
(0.001) -2.676 (0.476)
0.768 (1.798)
1.874 (1.262)
2.604 (0.357)
0.094 (0.012)
0.009 (0.001)
0.287 (0.856)
0.700 (0.601)
0.973 (0.17)
0.035 (0.006)
E 0.020 (0.004)
-2.259 (0.464)
2.686 (1.164)
2.654 (0.085)
2.233 (0.459)
0.107 (0.029)
0.009 (0.002)
1.189 (0.541)
1.175 (0.039)
0.988 (0.213)
0.047 (0.013)
Ib 0.021 (0.001)
-1.433 (1.424)
0.188 (0.163)
1.174 (0.096)
2.109 (0.045)
0.151 (0.004)
0.014 (0.001)
0.131 (0.232)
0.820 (0.136)
1.472 (0.064)
0.105 (0.005)
Mixed culture P 0.094
(0.013) -4.076 (0.253)
-0.426 (0.2)
4.577 (0.316)
9.709 (0.806)
0.055 (0.004)
0.023 (0.003)
-0.105 (0.051)
1.123 (0.080)
2.382 (0.204)
0.013 (0.001)
E 0.197 (0.062)
-5.849 (1.059)
-1.598 (0.923)
9.021 (2.257)
19.958 (4.138)
0.171 (0.042)
0.034 (0.066)
-0.273 (0.977)
1.542 (2.390)
3.412 (4.381)
0.029 (0.045)
I-St 0.107 (0.007)
-4.175 (0.088)
N.A. 3.678 (0.243)
6.859 (0.531)
0.107 (0.031)
0.026 (0.001)
0 0.881 (0.021)
1.643 (0.046)
0.026 (0.003)
Phenotypic and genetic heterogeneity. Long-term propagation experiments with single-strain cultures may lead to a mixed culture of closely related variants carrying different mutation profiles (23). Therefore, heterogeneity of the evolved culture was tested on the 14 single-colony isolates of either species (see above). The different isolates were re-combined in mixed cultures of which acidification and outgrowth was tested. All behaved comparable to the final evolved mixed culture and different from the original mixed culture (data not shown). The same procedures were applied to cultures throughout the evolution process, which showed a step-wise improvement in acidification rate and final CFU counts similar as depicted in Figure 2. This indicates that there was no differentiation in phenotypically variable (sub-) strains in the evolved mixed culture in terms of acidification and growth.
Because not all mutations necessarily confer a benefit, it is possible that, although there was no apparent phenotypical heterogeneity in the evolved culture, there could still be genetic heterogeneity. The same 14 single colony isolates that were used for the growth test were tested for heterogeneity in a systematic analysis of all observed mutations (see below) by sequencing of PCR products.
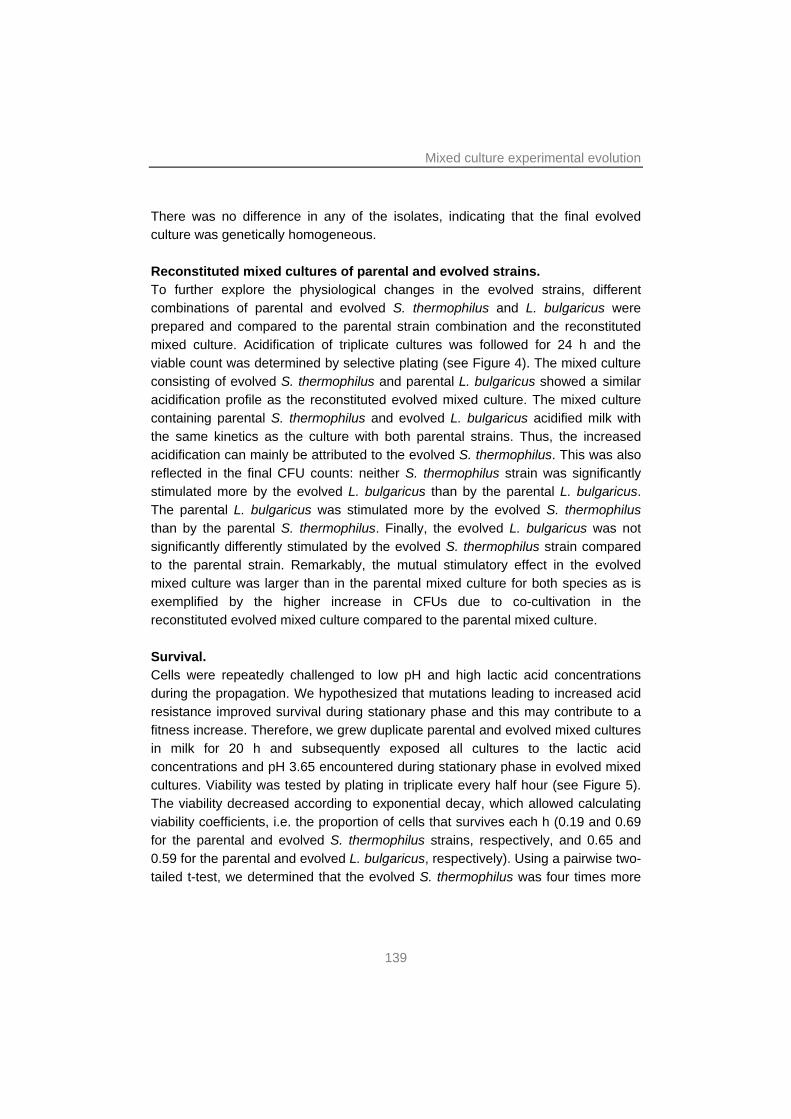
Mixed culture experimental evolution
139
There was no difference in any of the isolates, indicating that the final evolved culture was genetically homogeneous. Reconstituted mixed cultures of parental and evolved strains. To further explore the physiological changes in the evolved strains, different combinations of parental and evolved S. thermophilus and L. bulgaricus were prepared and compared to the parental strain combination and the reconstituted mixed culture. Acidification of triplicate cultures was followed for 24 h and the viable count was determined by selective plating (see Figure 4). The mixed culture consisting of evolved S. thermophilus and parental L. bulgaricus showed a similar acidification profile as the reconstituted evolved mixed culture. The mixed culture containing parental S. thermophilus and evolved L. bulgaricus acidified milk with the same kinetics as the culture with both parental strains. Thus, the increased acidification can mainly be attributed to the evolved S. thermophilus. This was also reflected in the final CFU counts: neither S. thermophilus strain was significantly stimulated more by the evolved L. bulgaricus than by the parental L. bulgaricus. The parental L. bulgaricus was stimulated more by the evolved S. thermophilus than by the parental S. thermophilus. Finally, the evolved L. bulgaricus was not significantly differently stimulated by the evolved S. thermophilus strain compared to the parental strain. Remarkably, the mutual stimulatory effect in the evolved mixed culture was larger than in the parental mixed culture for both species as is exemplified by the higher increase in CFUs due to co-cultivation in the reconstituted evolved mixed culture compared to the parental mixed culture. Survival. Cells were repeatedly challenged to low pH and high lactic acid concentrations during the propagation. We hypothesized that mutations leading to increased acid resistance improved survival during stationary phase and this may contribute to a fitness increase. Therefore, we grew duplicate parental and evolved mixed cultures in milk for 20 h and subsequently exposed all cultures to the lactic acid concentrations and pH 3.65 encountered during stationary phase in evolved mixed cultures. Viability was tested by plating in triplicate every half hour (see Figure 5). The viability decreased according to exponential decay, which allowed calculating viability coefficients, i.e. the proportion of cells that survives each h (0.19 and 0.69 for the parental and evolved S. thermophilus strains, respectively, and 0.65 and 0.59 for the parental and evolved L. bulgaricus, respectively). Using a pairwise two-tailed t-test, we determined that the evolved S. thermophilus was four times more
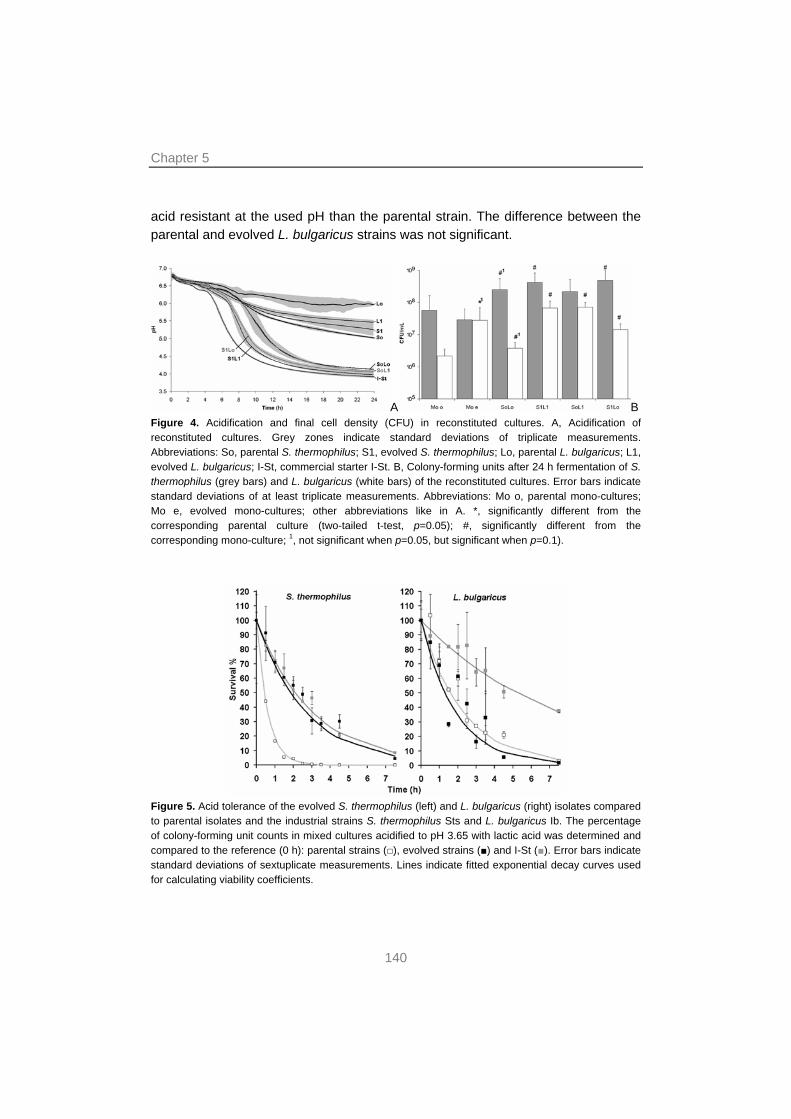
Chapter 5
140
acid resistant at the used pH than the parental strain. The difference between the parental and evolved L. bulgaricus strains was not significant.
A B Figure 4. Acidification and final cell density (CFU) in reconstituted cultures. A, Acidification of reconstituted cultures. Grey zones indicate standard deviations of triplicate measurements. Abbreviations: So, parental S. thermophilus; S1, evolved S. thermophilus; Lo, parental L. bulgaricus; L1, evolved L. bulgaricus; I-St, commercial starter I-St. B, Colony-forming units after 24 h fermentation of S. thermophilus (grey bars) and L. bulgaricus (white bars) of the reconstituted cultures. Error bars indicate standard deviations of at least triplicate measurements. Abbreviations: Mo o, parental mono-cultures; Mo e, evolved mono-cultures; other abbreviations like in A. *, significantly different from the corresponding parental culture (two-tailed t-test, p=0.05); #, significantly different from the corresponding mono-culture; 1, not significant when p=0.05, but significant when p=0.1).
Figure 5. Acid tolerance of the evolved S. thermophilus (left) and L. bulgaricus (right) isolates compared to parental isolates and the industrial strains S. thermophilus Sts and L. bulgaricus Ib. The percentage of colony-forming unit counts in mixed cultures acidified to pH 3.65 with lactic acid was determined and compared to the reference (0 h): parental strains (□), evolved strains (■) and I-St (■). Error bars indicate standard deviations of sextuplicate measurements. Lines indicate fitted exponential decay curves used for calculating viability coefficients.
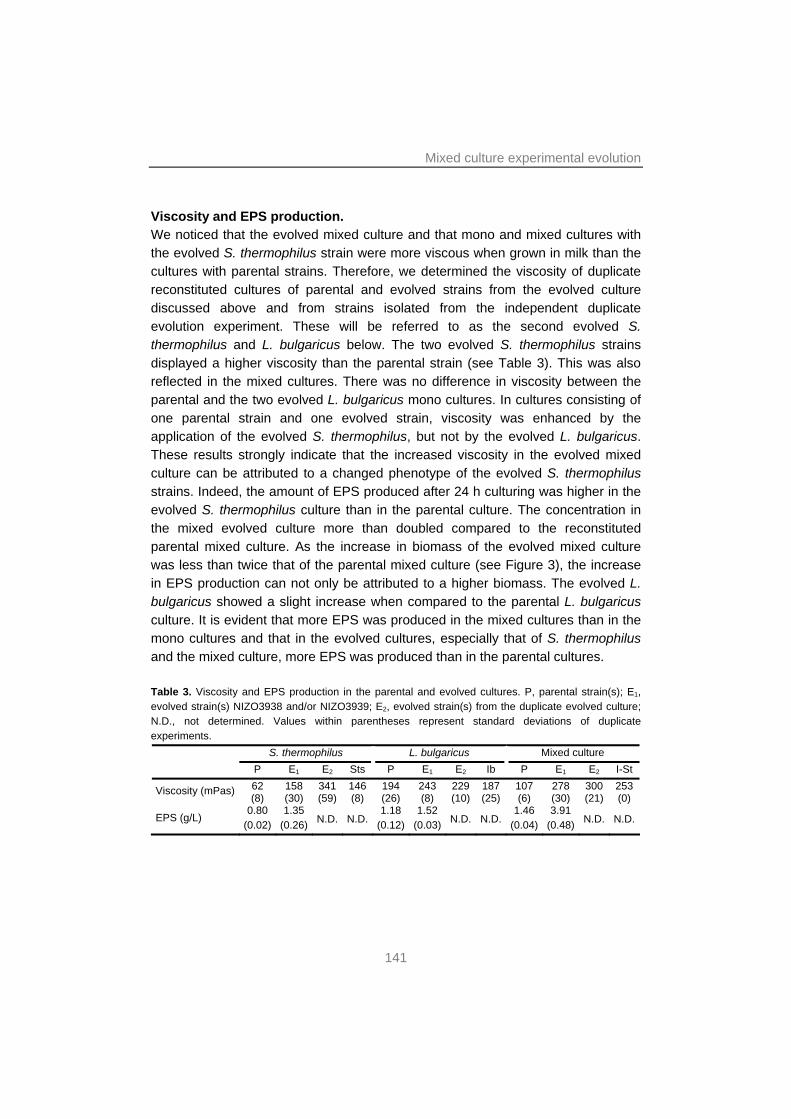
Mixed culture experimental evolution
141
Viscosity and EPS production. We noticed that the evolved mixed culture and that mono and mixed cultures with the evolved S. thermophilus strain were more viscous when grown in milk than the cultures with parental strains. Therefore, we determined the viscosity of duplicate reconstituted cultures of parental and evolved strains from the evolved culture discussed above and from strains isolated from the independent duplicate evolution experiment. These will be referred to as the second evolved S. thermophilus and L. bulgaricus below. The two evolved S. thermophilus strains displayed a higher viscosity than the parental strain (see Table 3). This was also reflected in the mixed cultures. There was no difference in viscosity between the parental and the two evolved L. bulgaricus mono cultures. In cultures consisting of one parental strain and one evolved strain, viscosity was enhanced by the application of the evolved S. thermophilus, but not by the evolved L. bulgaricus. These results strongly indicate that the increased viscosity in the evolved mixed culture can be attributed to a changed phenotype of the evolved S. thermophilus strains. Indeed, the amount of EPS produced after 24 h culturing was higher in the evolved S. thermophilus culture than in the parental culture. The concentration in the mixed evolved culture more than doubled compared to the reconstituted parental mixed culture. As the increase in biomass of the evolved mixed culture was less than twice that of the parental mixed culture (see Figure 3), the increase in EPS production can not only be attributed to a higher biomass. The evolved L. bulgaricus showed a slight increase when compared to the parental L. bulgaricus culture. It is evident that more EPS was produced in the mixed cultures than in the mono cultures and that in the evolved cultures, especially that of S. thermophilus and the mixed culture, more EPS was produced than in the parental cultures. Table 3. Viscosity and EPS production in the parental and evolved cultures. P, parental strain(s); E1, evolved strain(s) NIZO3938 and/or NIZO3939; E2, evolved strain(s) from the duplicate evolved culture; N.D., not determined. Values within parentheses represent standard deviations of duplicate experiments.
S. thermophilus L. bulgaricus Mixed culture P E1 E2 Sts P E1 E2 Ib P E1 E2 I-St
Viscosity (mPas) 62 (8)
158 (30)
341 (59)
146 (8)
194 (26)
243 (8)
229 (10)
187 (25)
107 (6)
278 (30)
300 (21)
253 (0)
EPS (g/L) 0.80
(0.02) 1.35
(0.26) N.D. N.D.1.18
(0.12)1.52
(0.03) N.D. N.D.1.46
(0.04)3.91
(0.48) N.D. N.D.
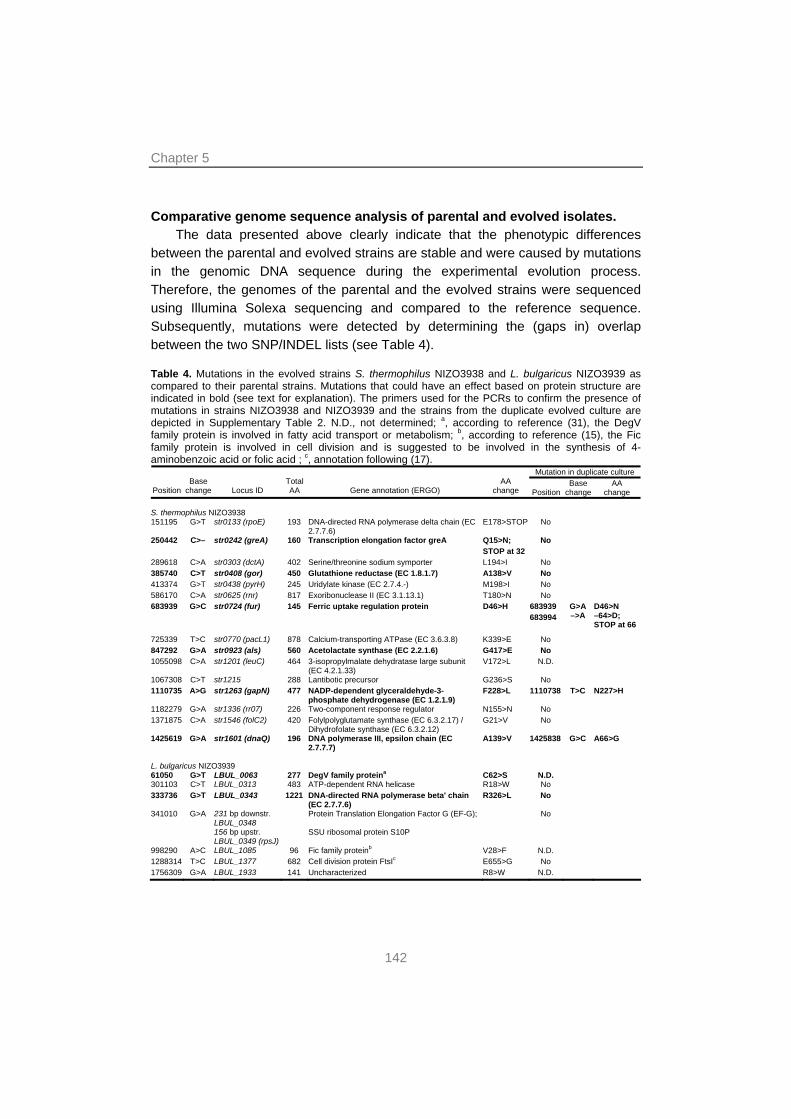
Chapter 5
142
Comparative genome sequence analysis of parental and evolved isolates. The data presented above clearly indicate that the phenotypic differences
between the parental and evolved strains are stable and were caused by mutations in the genomic DNA sequence during the experimental evolution process. Therefore, the genomes of the parental and the evolved strains were sequenced using Illumina Solexa sequencing and compared to the reference sequence. Subsequently, mutations were detected by determining the (gaps in) overlap between the two SNP/INDEL lists (see Table 4). Table 4. Mutations in the evolved strains S. thermophilus NIZO3938 and L. bulgaricus NIZO3939 as compared to their parental strains. Mutations that could have an effect based on protein structure are indicated in bold (see text for explanation). The primers used for the PCRs to confirm the presence of mutations in strains NIZO3938 and NIZO3939 and the strains from the duplicate evolved culture are depicted in Supplementary Table 2. N.D., not determined; a, according to reference (31), the DegV family protein is involved in fatty acid transport or metabolism; b, according to reference (15), the Fic family protein is involved in cell division and is suggested to be involved in the synthesis of 4-aminobenzoic acid or folic acid ; c, annotation following (17).
Mutation in duplicate culture
Position Base
change Locus ID Total AA Gene annotation (ERGO)
AA change Position
Base change
AA change
S. thermophilus NIZO3938 151195 G>T str0133 (rpoE) 193 DNA-directed RNA polymerase delta chain (EC
2.7.7.6) E178>STOP No
250442 C>– str0242 (greA) 160 Transcription elongation factor greA Q15>N; STOP at 32
No
289618 C>A str0303 (dctA) 402 Serine/threonine sodium symporter L194>I No 385740 C>T str0408 (gor) 450 Glutathione reductase (EC 1.8.1.7) A138>V No 413374 G>T str0438 (pyrH) 245 Uridylate kinase (EC 2.7.4.-) M198>I No 586170 C>A str0625 (rnr) 817 Exoribonuclease II (EC 3.1.13.1) T180>N No 683939 G>C str0724 (fur) 145 Ferric uptake regulation protein D46>H 683939
683994
G>A –>A
D46>N –64>D; STOP at 66
725339 T>C str0770 (pacL1) 878 Calcium-transporting ATPase (EC 3.6.3.8) K339>E No 847292 G>A str0923 (als) 560 Acetolactate synthase (EC 2.2.1.6) G417>E No 1055098 C>A str1201 (leuC) 464 3-isopropylmalate dehydratase large subunit
(EC 4.2.1.33) V172>L N.D.
1067308 C>T str1215 288 Lantibotic precursor G236>S No 1110735 A>G str1263 (gapN) 477 NADP-dependent glyceraldehyde-3-
phosphate dehydrogenase (EC 1.2.1.9) F228>L 1110738 T>C N227>H
1182279 G>A str1336 (rr07) 226 Two-component response regulator N155>N No 1371875 C>A str1546 (folC2) 420 Folylpolyglutamate synthase (EC 6.3.2.17) /
Dihydrofolate synthase (EC 6.3.2.12) G21>V No
1425619 G>A str1601 (dnaQ) 196 DNA polymerase III, epsilon chain (EC 2.7.7.7)
A139>V 1425838 G>C A66>G
L. bulgaricus NIZO3939 61050 G>T LBUL_0063 277 DegV family proteina C62>S N.D. 301103 C>T LBUL_0313 483 ATP-dependent RNA helicase R18>W No 333736 G>T LBUL_0343 1221 DNA-directed RNA polymerase beta' chain
(EC 2.7.7.6) R326>L No
341010 G>A 231 bp downstr. LBUL_0348 156 bp upstr. LBUL_0349 (rpsJ)
Protein Translation Elongation Factor G (EF-G); SSU ribosomal protein S10P
No
998290 A>C LBUL_1085 96 Fic family proteinb V28>F N.D. 1288314 T>C LBUL_1377 682 Cell division protein FtsIc E655>G No 1756309 G>A LBUL_1933 141 Uncharacterized R8>W N.D.
Mixed culture experimental evolution
143
In S. thermophilus, 15 mutations were identified in coding regions, 14 single nucleotide substitutions and one single nucleotide deletion. In the evolved L. bulgaricus, there were 7 single nucleotide substitutions compared to the parental strain, of which 6 occurred in coding regions and one in an upstream region. Of all mutations there were 6 in S. thermophilus and 2 in L. bulgaricus that could have changed the functionality of the enzymes, either by introducing a stop codon or by changing the AA residue in the catalytic site. The discussed mutations are complemented with gene expression data. Global gene expression is discussed below.
Mutations in S. thermophilus. In S. thermophilus, there were four mutations in coding regions that were predicted to affect the catalytic sites of the encoded proteins (GreA, Fur, Als, GapN) and hence could contribute to the observed phenotype. The single nucleotide deletion in greA results in the introduction of a stop codon at the N-terminal part of the encoded transcription elongation factor GreA and renders it non-functional. No orthologues of greB, gfh1 (8) or dksA (24), which are essential for the cleavage of RNA in order to release the transcription machinery when it is locked, have been identified in the genome of S. thermophilus CNRZ1066. Therefore, it is likely that the cleavage of RNA in order to relieve locked transcription processes will be impaired in the evolved strain. Interestingly, the greA gene was lower expressed in the evolved S. thermophilus strain that was isolated from the duplicate experimental evolution culture. The observed missense mutation in the iron-responsive genes transcriptional repressor fur in the evolved S. thermophilus strains may result in a lower affinity as it interfered with the metal binding site 2 of this enzyme (26). A multiple alignment showed that this AA residue is highly conserved among LAB. It is always an asparagine or a glutamate, indicating the importance of a polar hydrophylic AA at that site. If a mutation causes Fur to be less active, it would result in high expression of the genes involved in iron transport genes such as the fatABCD iron ABC transporter and the iron permease feoAB. These genes were much higher expressed in the evolved S. thermophilus compared to the parental strain (respectively 10.4-37.8-fold and 2.5-2.6-fold). Additional information comes from a mutation at the same location in the S. thermophilus isolated from the duplicate experimental evolution culture. Considering the limited number of SNPs in the strains it is highly unlikely that exactly the same nucleotide is mutated in two separate evolved strains. In addition, this strain carried a second mutation in this gene leading to an early stop codon rendering a truncated protein that is likely to be dysfunctional. In this strain, the fatABCD complex was also over expressed 4.7-13.8-fold and the fur gene was 2.3-3.3-fold higher expressed compared to the parental strain.
Chapter 5
144
The gene als codes for acetolactate synthase that is involved in the branched-chain amino acid (BCAA) synthesis and the production of diacetyl and acetoin. The als gene of the evolved strain contained a missense mutation, changing a glycine in a glutamic acid, at the binding site for the co-factor thiamine pyrophosphate. The exact effect of this mutation is not clear, but it is noteworthy that despite the fact that this gene was 5.0-fold higher expressed in the evolved S. thermophilus compared to the parental strain, there was no increase in production of diacetyl (see Table 1). In addition, there was a lower expression of BCAA biosynthesis genes and a higher expression of BCAA import genes in the evolved S. thermophilus compared to the parental strain. This all indicates that the mutation in als made its gene product less functional.
The observed missense mutation in gapN results in a F228L substitution that is located in the NAD binding site of the enzyme in the evolved S. thermophilus strain. GapN catalyses an important step in the glycolysis and therefore a mutation in this gene may yield a higher glycolytic flux. Interestingly, the second evolved S. thermophilus strain was found to carry a mutation resulting in the N227H substitution, just in the preceding residue. Altogether, this indicates that this region in the gapN gene has an important function and is prone to mutation.
Mutations in L. bulgaricus. In L. bulgaricus, there was one mutation affecting the catalytic site of a protein that could be involved in the interaction between S. thermophilus and L. bulgaricus. This C62S mutation in LBUL_0063 was in the fatty acid binding site of the corresponding protein (19). The exact function of this protein of the DegV family is not known, but it is suggested to play a role in fatty acid transport or synthesis as a phosphotransferase (13, 31). Interestingly, the fatty acid metabolism genes were 2.2-3.2-fold lower expressed in the evolved L. bulgaricus than in the parental L. bulgaricus, except for the 1-acyl-glycerol-3-phosphate acyltransferase LBUL_0106, which was 3-fold higher expressed. This also occurred in mixed culture compared to mono culture (29) and suggests that LBUL_0063 has a function in the acquisition of fatty acids other than de novo synthesis. The gene LBUL_0343 encoding the RNA polymerase beta chain contained a mutation close to its DNA binding site. It is not clear whether this had an effect on the transcription efficiency. Global changes in gene expression. Because the evolved mixed cultures grew faster and had mutations that caused this, the effect of the experimental evolution on the global gene expression was tested for both evolved cultures. Presented data focuses on the sequenced evolved culture and is – where appropriate – complemented with data from the
Mixed culture experimental evolution
145
second evolved culture. For an overview of all significantly differential expressed genes, see Supplementary Tables 3 and 4.
S. thermophilus. In the evolved S. thermophilus differential expression compared to the parental strain was mainly in genes involved in the purine and the AA metabolism. For instance, expression of pfl was 2.7-fold higher in the evolved strain in the second exponential phase. This was also the case for the second evolved S. thermophilus and indicates that a higher pyruvate-formate lyase activity is necessary tot sustain a higher growth rate. Interestingly, the gene responsible for CO2 production from bicarbonate, cah, was lower expressed in both evolved strains compared to the parental strain. This indicates that there was possibly less production of CO2 that aids in the purine metabolism in L. bulgaricus (see below) (9, 29). The lower CO2 production is likely caused by a lower requirement for de novo biosynthesis of arginine and aspartate (1) due to an 8.2-fold higher expression of the L. bulgaricus exoprotease gene prtB already in the first exponential phase releasing more peptides from casein. The purine biosynthesis genes and those maintaining the C1 pool in the evolved S. thermophilus were higher expressed, but there was no difference in expression of folic acid production genes between the parental and evolved S. thermophilus. The higher expression of most genes in the purine production pathway may be due to the increased growth rate. Indeed genes for peptidoglycan synthesis were higher expressed indicating a higher growth rate. There were a number of remarkable changes in the AA metabolism. The glutamine ABC transport system encoded by str1979, str1580, str1581 and str1582 was higher expressed in the evolved culture compared to the parental culture. This suggests a higher flux through the arginine biosynthesis pathway / urea cycle, although there was no differential expression observed for that pathway. Similarly, the sulfur AA production pathways and BCAA import genes were higher expressed in the evolved strain compared to the parental S. thermophilus, especially in the first exponential phase. In fact, expression of BCAA import genes was reduced in the second exponential phase, probably due to the higher expression L. bulgaricus prtB. Interestingly, the expression of EPS production genes was higher in both evolved S. thermophilus and both evolved L. bulgaricus compared to their parental strains. This may explain the higher EPS production and higher viscosity of the evolved cultures, especially in the S. thermophilus and mixed cultures.
L. bulgaricus. In the evolved L. bulgaricus the two lactate dehydrogenases genes were 2.9 and 3.3-fold lower expressed in the first exponential phase compared to the parental strain. In contrast, LBUL_2034 (pyruvate oxidase), responsible for a large portion of H2O2 production by L. bulgaricus (10, 29), was
Chapter 5
146
2.7-fold higher expressed. The resulting increased iron catalyzed production of reactive oxygen species (ROS) may be the explanation for the mutations in fur, likely to result in less iron uptake in both evolved S. thermophilus strains. The purine production pathway genes were higher expressed in the evolved strain compared to the parental strain, especially in the first exponential phase. This is in accordance with a higher growth rate resulting in a higher nucleobase requirement. Similarly, the genes for the (incomplete (32)) pathway for folic acid production were higher expressed throughout the fermentation of the evolved culture. We hypothesize that (i) the higher growth rate required more folic acid than could be acquired from the medium while there would be a sufficient amount otherwise (see (29)) or that (ii) the mutation in the evolved S. thermophilus folC2 indirectly led to a lower secretion of folate and a concomitant lower availability to L. bulgaricus. There was a lower expression of sulfur AA biosynthesis genes in both evolved L. bulgaricus strains than in the parental strain. This may be a result of the higher expression of prtB liberating more sulfur AA form casein. BCAA metabolism also showed differential expression in evolved cultures. Adaptation clearly involved an increased supply of BCAA either through increased expression of BCAA biosynthetic genes (strain NIZO3939) or increased expression of the transporter encoded by LBUL_0341 (second evolved L. bulgaricus) (10).
Finally, fatty acid metabolism was affected. The two evolved L. bulgaricus strains seem to have found different solutions to increase the supply of long-chain-fatty acids (LCFA) for lipid biosynthesis. The first evolved L. bulgaricus lowered the expression of the LCFA biosynthesis genes and increased the expression of 1-acyl-glycerol-3-phosphate acyltransferase gene compared with the parental L. bulgaricus. In the second evolved strain, in contrast, expression of the complete biosynthetic pathways increased. Both responses indicate that in the evolved cultures, L. bulgaricus required more LCFA in order to sustain a higher growth rate. However, in the first case, L. bulgaricus acquires a sufficient amount from the medium and in the second case L. bulgaricus acquires more LCFA by de novo production. Comparison of parental and evolved cultures to a commercial yoghurt starter. Important functionalities in yoghurt of the parental and evolved cultures were bench-marked by comparison with the representative commercial starter I-St. We tested acidification, survival, viscosity and end metabolite profiles (organic acids and flavor compounds) production of S. thermophilus Sts, L. bulgaricus Ib (both from the commercial starter I-St) and their mixed culture in the same conditions as
Mixed culture experimental evolution
147
in which the other strains were tested. Acidification of I-St was slightly faster (8.5 h to reach pH 4.5) than the evolved mixed culture (10 h) and this was mainly due to the shorter lag phase as the acidification rates in the second exponential phase were comparable (see Figure 4A). In fact, the maximal acidification rate in the evolved culture was higher (25.69±1.28 compared to 21.33±1.03 for I-St). The biomass yield of the evolved strains on lactose improved greatly (see Table 2). Moreover, the yield is significantly higher than that of I-St. In addition, the evolved S. thermophilus became much more acid tolerant at pH 3.65 than the original strain and was comparable to Sts (see Figure 5). The production of acetaldehyde, 2-propanone and 2,3-pentatone of the evolved cultures was closer to that of Sts, Ib and I-St than to the corresponding original cultures. DISCUSSION In this study, two strains of S. thermophilus and L. bulgaricus were co-evolved. It was shown that the evolved culture acidified faster and produced more EPS than the parental culture. Mutation analysis and gene expression studies showed that the cooperative interactions between the bacteria improved by a few mutations in genes involved in the interactions and fine-tuning gene expression of pathways related to the interactions. It is evident that interactions between consortium members influence the performance of individual bacteria that structures the whole community. In the field of microbial ecology the evolution of stable networks of interacting microorganisms is of great interest. In particular because the occurrence of cooperation is difficult to explain from an evolutionary point of view (5, 34). It was suggested that cooperative behavior, such as that between S. thermophilus and L. bulgaricus, can only occur stably if there is a direct benefit of executing this behavior (34). Moreover, the physical structure of its environment is essential for the performance of a microorganism, i.e. the density of the culture (11) and the dispersal of common goods or secreted products define the extent of interactions (12, 22). In this case, there is a positive feedback loop between the yoghurt bacteria. Because the optimal extent of this cooperative behavior is dependent on the used strains and media (30), it was expected that co-evolving two unfamiliar strains would lead to the optimization of existing interactions (2). Indeed, co-evolving S. thermophilus CNRZ1066 and L. bulgaricus ATCC BAA-365 for 1009 generations led in two independent experiments from a mixed culture that grows relatively slow to a culture that grows and acidifies at rates similar to those of
Chapter 5
148
a commercial starter while approximately maintaining the same ratio between both species.
There were three major improvements in important functionalities of the microorganisms that are likely to increase the fitness: (i) the yield on lactose of the evolved cultures had increased compared to the parental cultures, (ii) the stimulation between the yoghurt bacteria had increased, and (iii) the evolved S. thermophilus showed improved survival at a low pH. The evolved cultures also displayed differences in traits relevant for industrial applications: (i) the evolved mixed culture grew and acidified faster than the parental culture, (ii) the production of EPS was increased in the evolved culture, leading to a higher viscosity and (iii) the production of important flavor components by the evolved mixed culture more resembled that of the commercial starter I-St than that of the parental culture. These improvements could mainly be attributed to the evolved S. thermophilus as the evolved L. bulgaricus was not significantly different from its parental strain in any of the measured properties, except its EPS and volatile production and mutual stimulation with the evolved S. thermophilus. This lack of effective evolution in L. bulgaricus in this study is striking and may be related to the fact that evolution so far shaped a very reduced genome (32) that provides little possibilities for further improvement. Genetic and regulatory base underlying the adaptations. There were 15 mutations identified in the evolved S. thermophilus and 7 in the evolved L. bulgaricus compared to their parental strains. In several cases these mutations could be correlated to differential expression of pathways involved in (or affected by) the interactions and to the found differences in phenotype.
Iron metabolism. The upregulation of the H2O2-producing pyruvate oxidase gene in L. bulgaricus was likely the cause of the inactivating mutations in fur in S. thermophilus, leading to a higher expression of iron-responsive genes such as the fatABCD complex. Indeed, fatA was reported to be repressed by fur in Vibrio anguillarum (33). However, why the inactivation of fur is favorable remains unclear: a higher presence of ROS will increase the DNA-damaging Fenton reaction making high intracellular levels of iron unfavorable.
AA acquisition. BCAA availability for both bacteria is clearly a key determinant in the adaptation process as is demonstrated by the mutation in als in S. thermophilus, the increased expression of prtB and the BCAA import and de novo biosynthesis genes in L. bulgaricus. This was also reported before in mixed culture compared to mono culture (29). The higher expression of prtB appeared to supply a sufficient amount of sulfur AA for L. bulgaricus, but not for S.
Mixed culture experimental evolution
149
thermophilus. While the former down-regulated sulfur AA production pathways in the evolved strain, the latter upregulated those pathways in order to achieve the higher growth rate. However, it is anticipated that the higher availability of peptides and of formic acid are the main reasons for the disappearance of the transition phase in co-culture growth (see Figure 3). Addition of these two components was shown to yield an acidification pattern of a parental mixed culture that resembles that of the evolved mixed culture.
LCFA acquisition. For the acquisition of more LCFA L. bulgaricus strains in both cultures found different solutions: (i) a higher expression of the LCFA production pathway genes and (ii) a lower expression of this pathways genes with a higher expression of genes involved in LCFA capture from the medium, which was also suggested to occur in mixed cultures compared to mono cultures (29). In the second case, there could be an important function for the mutated protein encoded by LBUL_0063, but an exact function of this protein other than fatty acid binding has not been established yet.
EPS production. The production of EPS increased in the evolved cultures as a result of higher expression of EPS production genes. However, it is unclear what triggered this induction as there is no mutation evidently related to EPS production. It could be that the higher EPS synthesis was a response associated with the higher acidification rate, i.e. the higher acidification rate caused a (local) lower pH leading to induction of EPS synthesis (21). That would also explain the lack of extra EPS production by the evolved L. bulgaricus in mono culture compared to its parental strain.
In conclusion, our results confirm that interactions between S. thermophilus and L. bulgaricus involve proteolysis, in particular sulfur AA and BCAA, formic acid, folic acid and EPS. It was shown that these interactions can be fine-tuned by a small number of mutations. This fine-tuning of interactions is relevant for the field of microbial ecology as well as for industry. Using experimental evolution, it is possible to acquire a mixed culture with improved functionalities, such as a higher biomass yield, increased mutual stimulation, a faster acidification, higher survival and more EPS production. It is anticipated that this methodology can be routinely applied as a strategy to improve new combinations of strains in order to develop new starter cultures with interesting traits. More specific, these findings open new possibilities for the development of industrially viable fermented foods containing poor performing probiotic strains or strains with prebiotic properties.
Chapter 5
150
REFERENCES 1. Arioli, S., P. Roncada, A. M. Salzano, F. Deriu, S. Corona, S. Guglielmetti, L. Bonizzi, A.
Scaloni, and D. Mora. 2009. The relevance of carbon dioxide metabolism in Streptococcus thermophilus. Microbiology 155:1953-1965.
2. Babu, M. M., and L. Aravind. 2006. Adaptive evolution by optimizing expression levels in different environments. Trends Microbiol 14:11-14.
3. Bolotin, A., B. Quinquis, P. Renault, A. Sorokin, S. D. Ehrlich, S. Kulakauskas, A. Lapidus, E. Goltsman, M. Mazur, G. D. Pusch, M. Fonstein, R. Overbeek, N. Kyprides, B. Purnelle, D. Prozzi, K. Ngui, D. Masuy, F. Hancy, S. Burteau, M. Boutry, J. Delcour, A. Goffeau, and P. Hols. 2004. Complete sequence and comparative genome analysis of the dairy bacterium Streptococcus thermophilus. Nat Biotechnol 22:1554-1558.
4. Courtin, P., V. Monnet, and F. Rul. 2002. Cell-wall proteinases PrtS and PrtB have a different role in Streptococcus thermophilus/Lactobacillus bulgaricus mixed cultures in milk. Microbiology 148:3413-3421.
5. Crespi, B. J. 2001. The evolution of social behavior in microorganisms. Trends Ecol Evol 16:178-183.
6. Crittenden, R. G., N. R. Martinez, and M. J. Playne. 2003. Synthesis and utilisation of folate by yoghurt starter cultures and probiotic bacteria. Int J Food Microbiol 80:217-222.
7. Davey, M. E., and A. O'Toole G. 2000. Microbial biofilms: from ecology to molecular genetics. Microbiol Mol Biol Rev 64:847-867.
8. Deighan, P., and A. Hochschild. 2006. Conformational toggle triggers a modulator of RNA polymerase activity. Trends Biochem Sci 31:424-426.
9. Driessen, F. M., F. Kingma, and J. Stadhouders. 1982. Evidence that Lactobacillus bulgaricus in yoghurt is stimulated by carbon dioxide produced by Streptococcus thermophilus. Netherlands Milk and Dairy Journal 36:135-144.
10. Herve-Jimenez, L., I. Guillouard, E. Guedon, S. Boudebbouze, P. Hols, V. Monnet, E. Maguin, and F. Rul. 2008. Post-genomic analysis of Streptococcus thermophilus co-cultivated in milk with Lactobacillus delbrueckii ssp. bulgaricus: involvement of nitrogen, purine and iron metabolisms. Appl Environ Microbiol. 75(7):2062-2073
11. Johnson, M. R., C. I. Montero, S. B. Conners, K. R. Shockley, S. L. Bridger, and R. M. Kelly. 2005. Population density-dependent regulation of exopolysaccharide formation in the hyperthermophilic bacterium Thermotoga maritima. Mol Microbiol 55:664-674.
12. Kerr, B., M. A. Riley, M. W. Feldman, and B. J. Bohannan. 2002. Local dispersal promotes biodiversity in a real-life game of rock-paper-scissors. Nature 418:171-174.
13. Kinch, L. N., S. Cheek, and N. V. Grishin. 2005. EDD, a novel phosphotransferase domain common to mannose transporter EIIA, dihydroxyacetone kinase, and DegV. Protein Sci 14:360-367.
14. Klaenhammer, T. R., E. Altermann, E. Pfeiler, B. L. Buck, Y. J. Goh, S. O'Flaherty, R. Barrangou, and T. Duong. 2008. Functional genomics of probiotic Lactobacilli. J Clin Gastroenterol 42 Suppl 3 Pt 2:S160-162.
15. Komano, T., R. Utsumi, and M. Kawamukai. 1991. Functional analysis of the fic gene involved in regulation of cell division. Res Microbiol 142:269-277.
16. Kuramitsu, H. K., X. He, R. Lux, M. H. Anderson, and W. Shi. 2007. Interspecies interactions within oral microbial communities. Microbiol Mol Biol Rev 71:653-670.
17. Makarova, K., A. Slesarev, Y. Wolf, A. Sorokin, B. Mirkin, E. Koonin, A. Pavlov, N. Pavlova, V. Karamychev, N. Polouchine, V. Shakhova, I. Grigoriev, Y. Lou, D. Rohksar, S. Lucas, K. Huang, D. M. Goodstein, T. Hawkins, V. Plengvidhya, D. Welker, J. Hughes, Y. Goh, A. Benson, K. Baldwin, J. H. Lee, I. Diaz-Muniz, B. Dosti, V. Smeianov, W. Wechter, R. Barabote, G. Lorca, E. Altermann, R. Barrangou, B. Ganesan, Y. Xie, H. Rawsthorne, D. Tamir, C. Parker, F. Breidt, J. Broadbent, R. Hutkins, D. O'Sullivan, J. Steele, G. Unlu, M. Saier, T. Klaenhammer, P. Richardson, S. Kozyavkin, B. Weimer, and D. Mills. 2006. Comparative genomics of the lactic acid bacteria. Proc Natl Acad Sci U S A 103:15611-15616.
18. Marchler-Bauer, A., J. B. Anderson, F. Chitsaz, M. K. Derbyshire, C. DeWeese-Scott, J. H. Fong, L. Y. Geer, R. C. Geer, N. R. Gonzales, M. Gwadz, S. He, D. I. Hurwitz, J. D.
Mixed culture experimental evolution
151
Jackson, Z. Ke, C. J. Lanczycki, C. A. Liebert, C. Liu, F. Lu, S. Lu, G. H. Marchler, M. Mullokandov, J. S. Song, A. Tasneem, N. Thanki, R. A. Yamashita, D. Zhang, N. Zhang, and S. H. Bryant. 2009. CDD: specific functional annotation with the Conserved Domain Database. Nucleic Acids Res 37:D205-210.
19. Nan, J., Y. Zhou, C. Yang, E. Brostromer, O. Kristensen, and X. D. Su. 2009. Structure of a fatty-acid-binding protein from Bacillus subtilis determined by sulfur-SAD phasing using in-house chromium radiation. Acta Crystallogr D Biol Crystallogr 65:440-448.
20. O'Brien, J. W. 2004. Global dairy demand - where do we go? European Dairy Magazine 16:22-25.
21. Petry, S., S. Furlan, M. J. Crepeau, J. Cerning, and M. Desmazeaud. 2000. Factors affecting exocellular polysaccharide production by Lactobacillus delbrueckii subsp. bulgaricus grown in a chemically defined medium. Appl Environ Microbiol 66:3427-3431.
22. Quadri, L. E. 2002. Regulation of antimicrobial peptide production by autoinducer-mediated quorum sensing in lactic acid bacteria. Antonie Van Leeuwenhoek 82:133-145.
23. Rosenzweig, R. F., R. R. Sharp, D. S. Treves, and J. Adams. 1994. Microbial evolution in a simple unstructured environment: genetic differentiation in Escherichia coli. Genetics 137:903-917.
24. Rutherford, S. T., J. J. Lemke, C. E. Vrentas, T. Gaal, W. Ross, and R. L. Gourse. 2007. Effects of DksA, GreA, and GreB on transcription initiation: insights into the mechanisms of factors that bind in the secondary channel of RNA polymerase. J Mol Biol 366:1243-1257.
25. Savijoki, K., H. Ingmer, and P. Varmanen. 2006. Proteolytic systems of lactic acid bacteria. Appl Microbiol Biotechnol.
26. Sheikh, M. A., and G. L. Taylor. 2009. Crystal structure of the Vibrio cholerae ferric uptake regulator (Fur) reveals insights into metal co-ordination. Mol Microbiol 72:1208-1220.
27. Sieuwerts, S., F. A. de Bok, J. Hugenholtz, and J. E. van Hylckama Vlieg. 2008. Unraveling microbial interactions in food fermentations: from classical to genomics approaches. Appl Environ Microbiol 74:4997-5007.
28. Sieuwerts, S., F. A. de Bok, E. Mols, W. M. de Vos, and J. E. T. van Hylckama Vlieg. 2008. A simple and fast method for determining colony forming units. Lett Appl Microbiol 47:275-278.
29. Sieuwerts, S., D. Molenaar, S. A. F. T. van Hijum, C. Ingham, M. Beerthuyzen, M. J. A. Stevens, I. van Alen, P. W. M. Janssen, F. A. M. de Bok, W. M. de Vos, and J. E. T. van Hylckama Vlieg. 2009. Mixed culture transcriptome analysis reveals the molecular basis of co-culture growth and its consequences in Streptococcus thermophilus and Lactobacillus bulgaricus. This thesis Ch. 4.
30. Tamime, A. Y., V. M. Marshall, and R. K. Robinson. 1995. Microbiological and technological aspects of milks fermented by bifidobacteria. J Dairy Res 62:151-187.
31. Ursula Schulze-Gahmen, J. P. H. Y. R. K. S.-H. K. 2003. Crystal structure of a hypothetical protein, TM841 of Thermotoga maritima, reveals its function as a fatty acid-binding protein. Proteins: Structure, Function, and Genetics 50:526-530.
32. van de Guchte, M., S. Penaud, C. Grimaldi, V. Barbe, K. Bryson, P. Nicolas, C. Robert, S. Oztas, S. Mangenot, A. Couloux, V. Loux, R. Dervyn, R. Bossy, A. Bolotin, J. M. Batto, T. Walunas, J. F. Gibrat, P. Bessieres, J. Weissenbach, S. D. Ehrlich, and E. Maguin. 2006. The complete genome sequence of Lactobacillus bulgaricus reveals extensive and ongoing reductive evolution. Proc Natl Acad Sci U S A 103:9274-9279.
33. Waldbeser, L. S., M. E. Tolmasky, L. A. Actis, and J. H. Crosa. 1993. Mechanisms for negative regulation by iron of the fatA outer membrane protein gene expression in Vibrio anguillarum 775. J Biol Chem 268:10433-10439.
34. West, S. A., A. S. Griffin, A. Gardner, and S. P. Diggle. 2006. Social evolution theory for microorganisms. Nat Rev Microbiol 4:597-607.
35. Zourari, A., J. P. Accolas, and M. J. Desmazeaud. 1992. Metabolism and Biochemical Characteristics of Yogurt Bacteria - a Review. Lait 72:1-34.
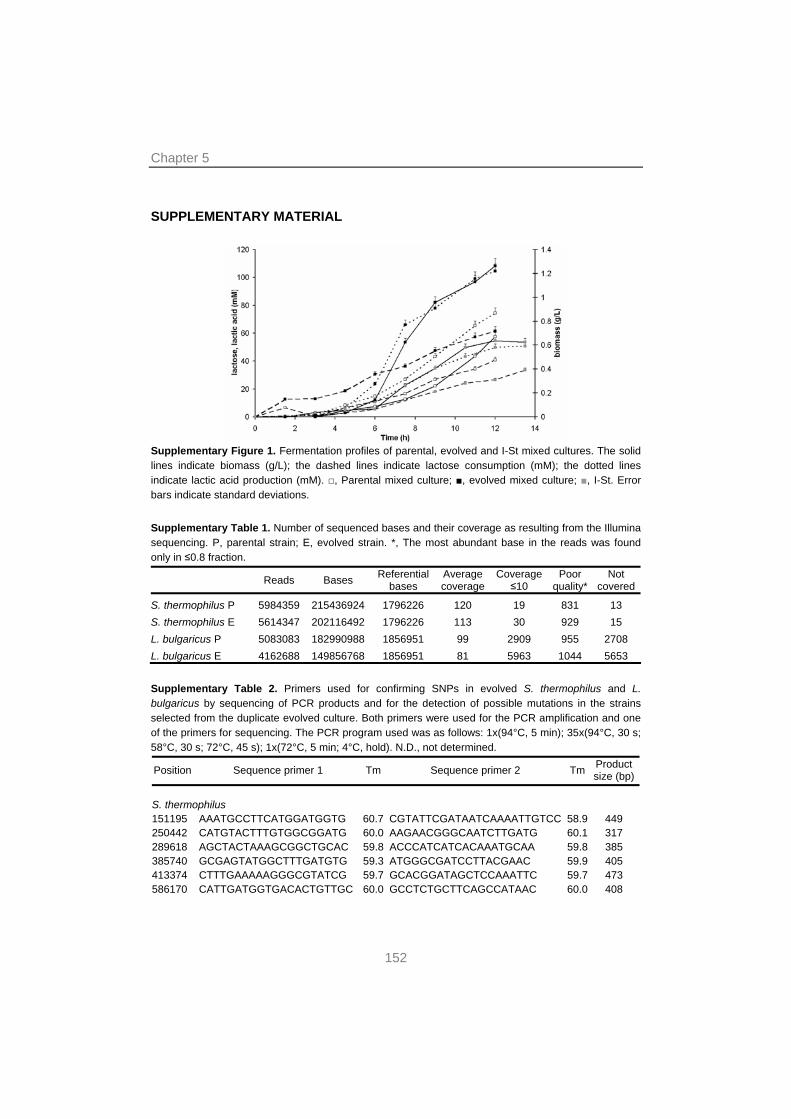
Chapter 5
152
SUPPLEMENTARY MATERIAL
Supplementary Figure 1. Fermentation profiles of parental, evolved and I-St mixed cultures. The solid lines indicate biomass (g/L); the dashed lines indicate lactose consumption (mM); the dotted lines indicate lactic acid production (mM). □, Parental mixed culture; ■, evolved mixed culture; ■, I-St. Error bars indicate standard deviations. Supplementary Table 1. Number of sequenced bases and their coverage as resulting from the Illumina sequencing. P, parental strain; E, evolved strain. *, The most abundant base in the reads was found only in ≤0.8 fraction.
Reads Bases Referential bases
Average coverage
Coverage ≤10
Poor quality*
Not covered
S. thermophilus P 5984359 215436924 1796226 120 19 831 13 S. thermophilus E 5614347 202116492 1796226 113 30 929 15 L. bulgaricus P 5083083 182990988 1856951 99 2909 955 2708 L. bulgaricus E 4162688 149856768 1856951 81 5963 1044 5653 Supplementary Table 2. Primers used for confirming SNPs in evolved S. thermophilus and L. bulgaricus by sequencing of PCR products and for the detection of possible mutations in the strains selected from the duplicate evolved culture. Both primers were used for the PCR amplification and one of the primers for sequencing. The PCR program used was as follows: 1x(94°C, 5 min); 35x(94°C, 30 s; 58°C, 30 s; 72°C, 45 s); 1x(72°C, 5 min; 4°C, hold). N.D., not determined.
Position Sequence primer 1 Tm Sequence primer 2 Tm Product size (bp)
S. thermophilus 151195 AAATGCCTTCATGGATGGTG 60.7 CGTATTCGATAATCAAAATTGTCC 58.9 449 250442 CATGTACTTTGTGGCGGATG 60.0 AAGAACGGGCAATCTTGATG 60.1 317 289618 AGCTACTAAAGCGGCTGCAC 59.8 ACCCATCATCACAAATGCAA 59.8 385 385740 GCGAGTATGGCTTTGATGTG 59.3 ATGGGCGATCCTTACGAAC 59.9 405 413374 CTTTGAAAAAGGGCGTATCG 59.7 GCACGGATAGCTCCAAATTC 59.7 473 586170 CATTGATGGTGACACTGTTGC 60.0 GCCTCTGCTTCAGCCATAAC 60.0 408
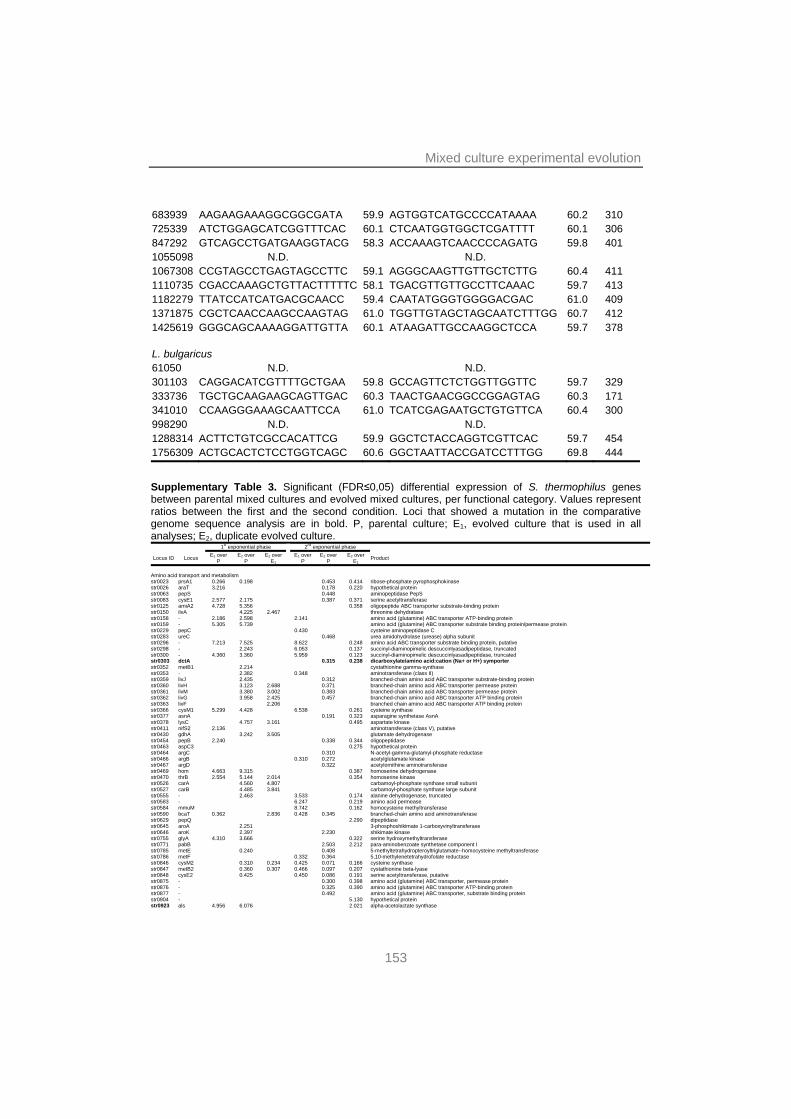
Mixed culture experimental evolution
153
683939 AAGAAGAAAGGCGGCGATA 59.9 AGTGGTCATGCCCCATAAAA 60.2 310 725339 ATCTGGAGCATCGGTTTCAC 60.1 CTCAATGGTGGCTCGATTTT 60.1 306 847292 GTCAGCCTGATGAAGGTACG 58.3 ACCAAAGTCAACCCCAGATG 59.8 401 1055098 N.D. N.D. 1067308 CCGTAGCCTGAGTAGCCTTC 59.1 AGGGCAAGTTGTTGCTCTTG 60.4 411 1110735 CGACCAAAGCTGTTACTTTTTC 58.1 TGACGTTGTTGCCTTCAAAC 59.7 413 1182279 TTATCCATCATGACGCAACC 59.4 CAATATGGGTGGGGACGAC 61.0 409 1371875 CGCTCAACCAAGCCAAGTAG 61.0 TGGTTGTAGCTAGCAATCTTTGG 60.7 412 1425619 GGGCAGCAAAAGGATTGTTA 60.1 ATAAGATTGCCAAGGCTCCA 59.7 378 L. bulgaricus 61050 N.D. N.D. 301103 CAGGACATCGTTTTGCTGAA 59.8 GCCAGTTCTCTGGTTGGTTC 59.7 329 333736 TGCTGCAAGAAGCAGTTGAC 60.3 TAACTGAACGGCCGGAGTAG 60.3 171 341010 CCAAGGGAAAGCAATTCCA 61.0 TCATCGAGAATGCTGTGTTCA 60.4 300 998290 N.D. N.D. 1288314 ACTTCTGTCGCCACATTCG 59.9 GGCTCTACCAGGTCGTTCAC 59.7 454 1756309 ACTGCACTCTCCTGGTCAGC 60.6 GGCTAATTACCGATCCTTTGG 69.8 444
Supplementary Table 3. Significant (FDR≤0,05) differential expression of S. thermophilus genes between parental mixed cultures and evolved mixed cultures, per functional category. Values represent ratios between the first and the second condition. Loci that showed a mutation in the comparative genome sequence analysis are in bold. P, parental culture; E1, evolved culture that is used in all analyses; E2, duplicate evolved culture. 1st exponential phase 2nd exponential phase
Locus ID Locus E1 over P
E2 over P
E2 over E1
E1 over P
E2 over P
E2 over E1
Product
Amino acid transport and metabolism str0023 prsA1 0.266 0.198 0.453 0.414 ribose-phosphate pyrophosphokinase str0026 araT 3.216 0.178 0.220 hypothetical protein str0063 pepS 0.448 aminopeptidase PepS str0083 cysE1 2.577 2.175 0.387 0.371 serine acetyltransferase str0125 amiA2 4.728 5.356 0.358 oligopeptide ABC transporter substrate-binding protein str0150 ilvA 4.225 2.467 threonine dehydratase str0158 - 2.186 2.598 2.141 amino acid (glutamine) ABC transporter ATP-binding protein str0159 - 5.305 5.739 amino acid (glutamine) ABC transporter substrate binding protein/permease protein str0229 pepC 0.430 cysteine aminopeptidase C str0283 ureC 0.468 urea amidohydrolase (urease) alpha subunit str0296 - 7.213 7.525 8.622 0.248 amino acid ABC transporter substrate binding protein, putative str0298 - 2.243 6.053 0.137 succinyl-diaminopimelic descuccinlyasadipeptidase, truncated str0300 - 4.360 3.360 5.959 0.123 succinyl-diaminopimelic descuccinlyasadipeptidase, truncated str0303 dctA 0.315 0.238 dicarboxylate/amino acid:cation (Na+ or H+) symporter str0352 metB1 2.214 cystathionine gamma-synthase str0353 - 2.382 0.348 aminotransferase (class II) str0359 livJ 2.435 0.312 branched-chain amino acid ABC transporter substrate-binding protein str0360 livH 3.123 2.688 0.371 branched-chain amino acid ABC transporter permease protein str0361 livM 3.380 3.002 0.383 branched-chain amino acid ABC transporter permease protein str0362 livG 3.958 2.425 0.457 branched-chain amino acid ABC transporter ATP binding protein str0363 livF 2.206 branched chain amino acid ABC transporter ATP binding protein str0366 cysM1 5.299 4.428 6.538 0.261 cysteine synthase str0377 asnA 0.191 0.323 asparagine synthetase AsnA str0378 lysC 4.757 3.161 0.495 aspartate kinase str0411 nifS2 2.136 aminotransferase (class V), putative str0430 gdhA 3.242 3.505 glutamate dehydrogenase str0454 pepB 2.240 0.338 0.344 oligopeptidase str0463 aspC3 0.275 hypothetical protein str0464 argC 0.310 N-acetyl-gamma-glutamyl-phosphate reductase str0466 argB 0.310 0.272 acetylglutamate kinase str0467 argD 0.322 acetylornithine aminotransferase str0469 hom 4.663 9.315 0.387 homoserine dehydrogenase str0470 thrB 2.554 5.144 2.014 0.354 homoserine kinase str0526 carA 4.560 4.807 carbamoyl-phosphate synthase small subunit str0527 carB 4.485 3.841 carbamoyl-phosphate synthase large subunit str0555 - 2.463 3.533 0.174 alanine dehydrogenase, truncated str0583 - 6.247 0.219 amino acid permease str0584 mmuM 8.742 0.162 homocysteine methyltransferase str0590 bcaT 0.362 2.836 0.428 0.345 branched-chain amino acid aminotransferase str0629 pepQ 2.290 dipeptidase str0645 aroA 2.251 3-phosphoshikimate 1-carboxyvinyltransferase str0646 aroK 2.397 2.230 shikimate kinase str0755 glyA 4.310 3.666 0.322 serine hydroxymethyltransferase str0771 pabB 2.503 2.212 para-aminobenzoate synthetase component I str0785 metE 0.240 0.408 5-methyltetrahydropteroyltriglutamate--homocysteine methyltransferase str0786 metF 0.332 0.364 5,10-methylenetetrahydrofolate reductase str0846 cysM2 0.310 0.234 0.425 0.071 0.166 cysteine synthase str0847 metB2 0.360 0.307 0.466 0.097 0.207 cystathionine beta-lyase str0848 cysE2 0.425 0.450 0.086 0.191 serine acetyltransferase, putative str0875 - 0.300 0.398 amino acid (glutamine) ABC transporter, permease protein str0876 - 0.325 0.390 amino acid (glutamine) ABC transporter ATP-binding protein str0877 - 0.492 amino acid (glutamine) ABC transporter, substrate binding protein str0904 - 5.130 hypothetical protein str0923 als 4.956 6.076 2.021 alpha-acetolactate synthase
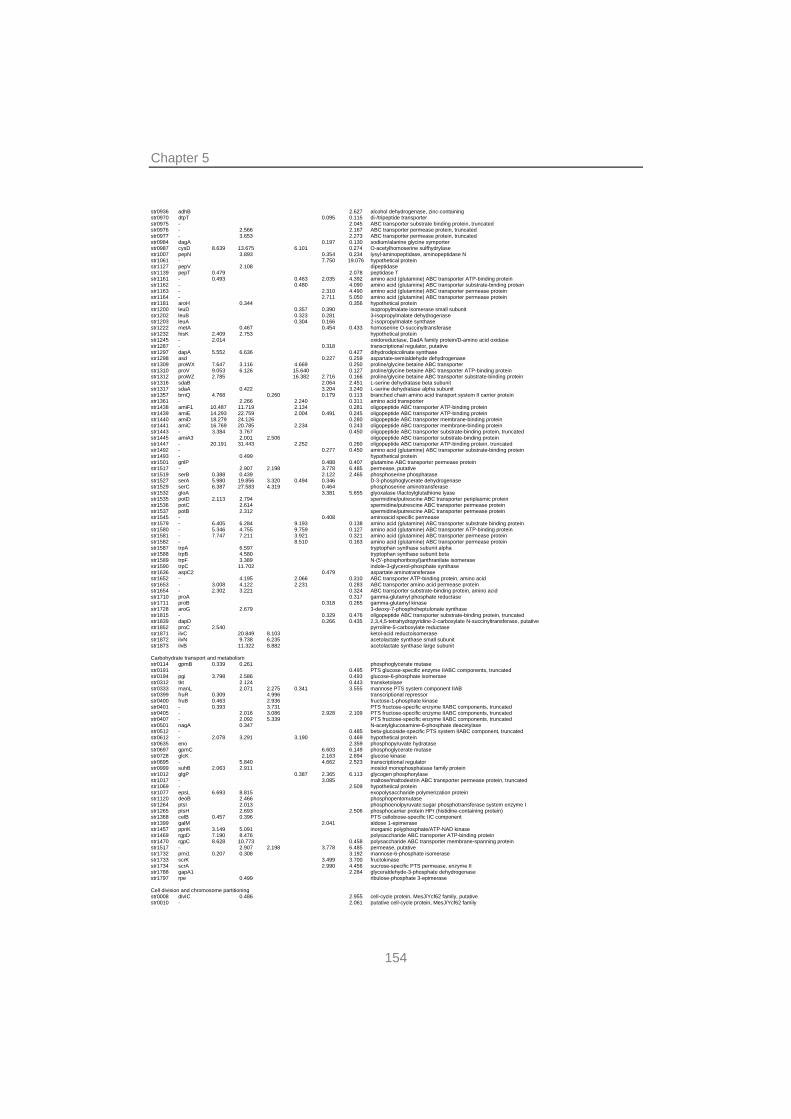
Chapter 5
154
str0936 adhB 2.627 alcohol dehydrogenase, zinc-containing str0970 dtpT 0.095 0.115 di-/tripeptide transporter str0975 - 2.045 ABC transporter substrate binding protein, truncated str0976 - 2.566 2.167 ABC transporter permease protein, truncated str0977 - 3.653 2.273 ABC transporter permease protein, truncated str0984 dagA 0.197 0.130 sodium/alanine glycine symporter str0987 cysD 8.639 13.675 6.101 0.274 O-acetylhomoserine sulfhydrylase str1007 pepN 3.893 0.354 0.234 lysyl-aminopeptidase, aminopeptidase N str1061 - 7.750 19.076 hypothetical protein str1127 pepV 2.108 dipeptidase str1139 pepT 0.479 2.078 peptidase T str1161 - 0.493 0.463 2.035 4.392 amino acid (glutamine) ABC transporter ATP-binding protein str1162 - 0.480 4.090 amino acid (glutamine) ABC transporter substrate-binding protein str1163 - 2.310 4.490 amino acid (glutamine) ABC transporter permease protein str1164 - 2.711 5.050 amino acid (glutamine) ABC transporter permease protein str1181 aroH 0.344 0.356 hypothetical protein str1200 leuD 0.357 0.390 isopropylmalate isomerase small subunit str1202 leuB 0.323 0.281 3-isopropylmalate dehydrogenase str1203 leuA 0.304 0.166 2-isopropylmalate synthase str1222 metA 0.467 0.454 0.433 homoserine O-succinyltransferase str1232 hisK 2.409 2.753 hypothetical protein str1245 - 2.014 oxidoreductase, DadA family protein/D-amino acid oxidase str1287 - 0.318 transcriptional regulator, putative str1297 dapA 5.552 6.636 0.427 dihydrodipicolinate synthase str1298 asd 0.227 0.259 aspartate-semialdehyde dehydrogenase str1309 proWX 7.647 3.116 4.669 0.250 proline/glycine betaine ABC transporter str1310 proV 9.053 6.126 15.640 0.127 proline/glycine betaine ABC transporter ATP-binding protein str1312 proWZ 2.785 16.382 2.716 0.166 proline/glycine betaine ABC transporter substrate-binding protein str1316 sdaB 2.064 2.451 L-serine dehydratase beta subunit str1317 sdaA 0.422 3.204 3.240 L-serine dehydratase alpha subunit str1357 brnQ 4.768 0.260 0.179 0.113 branched chain amino acid transport system II carrier protein str1361 - 2.266 2.240 0.311 amino acid transporter str1438 amiF1 10.487 11.719 2.134 0.281 oligopeptide ABC transporter ATP-binding protein str1439 amiE 14.293 22.759 2.004 0.491 0.245 oligopeptide ABC transporter ATP-binding protein str1440 amiD 18.279 24.126 0.280 oligopeptide ABC transporter membrane-binding protein str1441 amiC 16.769 20.785 2.234 0.243 oligopeptide ABC transporter membrane-binding protein str1443 - 3.384 3.767 0.450 oligopeptide ABC transporter substrate-binding protein, truncated str1445 amiA3 2.001 2.506 oligopeptide ABC transporter substrate-binding protein str1447 - 20.191 31.443 2.252 0.260 oligopeptide ABC transporter ATP-binding protein, truncated str1492 - 0.277 0.450 amino acid (glutamine) ABC transporter substrate-binding protein str1493 - 0.499 hypothetical protein str1501 gnlP 0.488 0.407 glutamine ABC transporter permease protein str1517 - 2.907 2.198 3.778 6.485 permease, putative str1519 serB 0.388 0.439 2.122 2.465 phosphoserine phosphatase str1527 serA 5.980 19.856 3.320 0.494 0.346 D-3-phosphoglycerate dehydrogenase str1529 serC 6.387 27.583 4.319 0.464 phosphoserine aminotransferase str1532 gloA 3.381 5.655 glyoxalase I/lactoylglutathione lyase str1535 potD 2.113 2.794 spermidine/putrescine ABC transporter periplasmic protein str1536 potC 2.614 spermidine/putrescine ABC transporter permease protein str1537 potB 2.312 spermidine/putrescine ABC transporter permease protein str1545 - 0.408 aminoacid specific permease str1579 - 6.405 6.284 9.193 0.138 amino acid (glutamine) ABC transporter substrate binding protein str1580 - 5.346 4.755 9.759 0.127 amino acid (glutamine) ABC transporter ATP-binding protein str1581 - 7.747 7.211 3.921 0.321 amino acid (glutamine) ABC transporter permease protein str1582 - 8.510 0.163 amino acid (glutamine) ABC transporter permease protein str1587 trpA 6.597 tryptophan synthase subunit alpha str1588 trpB 4.580 tryptophan synthase subunit beta str1589 trpF 3.389 N-(5'-phosphoribosyl)anthranilate isomerase str1590 trpC 11.702 indole-3-glycerol-phosphate synthase str1636 aspC2 0.479 aspartate aminotransferase str1652 - 4.195 2.066 0.310 ABC transporter ATP-binding protein, amino acid str1653 - 3.008 4.122 2.231 0.283 ABC transporter amino acid permease protein str1654 - 2.302 3.221 0.324 ABC transporter substrate-binding protein, amino acid str1710 proA 0.317 gamma-glutamyl phosphate reductase str1711 proB 0.318 0.265 gamma-glutamyl kinase str1728 aroG 2.679 3-deoxy-7-phosphoheptulonate synthase str1815 - 0.329 0.476 oligopeptide ABC transporter substrate-binding protein, truncated str1839 dapD 0.266 0.435 2,3,4,5-tetrahydropyridine-2-carboxylate N-succinyltransferase, putative str1852 proC 2.540 pyrroline-5-carboxylate reductase str1871 ilvC 20.849 8.103 ketol-acid reductoisomerase str1872 ilvN 9.738 6.235 acetolactate synthase small subunit str1873 ilvB 11.322 8.882 acetolactate synthase large subunit Carbohydrate transport and metabolism str0114 gpmB 0.339 0.261 phosphoglycerate mutase str0191 - 0.495 PTS glucose-specific enzyme IIABC components, truncated str0194 pgi 3.798 2.586 0.493 glucose-6-phosphate isomerase str0312 tkt 2.124 0.443 transketolase str0333 manL 2.071 2.275 0.341 3.555 mannose PTS system component IIAB str0399 fruR 0.309 4.996 transcriptional repressor str0400 fruB 0.463 2.936 fructose-1-phosphate kinase str0401 - 0.393 3.731 PTS fructose-specific enzyme IIABC components, truncated str0405 - 2.016 3.086 2.928 2.109 PTS fructose-specific enzyme IIABC components, truncated str0407 - 2.092 5.339 PTS fructose-specific enzyme IIABC components, truncated str0501 nagA 0.347 N-acetylglucosamine-6-phosphate deacetylase str0512 - 0.485 beta-glucoside-specific PTS system IIABC component, truncated str0612 - 2.078 3.291 3.190 0.469 hypothetical protein str0635 eno 2.359 phosphopyruvate hydratase str0697 gpmC 6.603 6.149 phosphoglycerate mutase str0728 glcK 2.163 2.694 glucose kinase str0895 - 5.840 4.662 2.523 transcriptional regulator str0999 suhB 2.063 2.911 inositol monophosphatase family protein str1012 glgP 0.387 2.365 6.113 glycogen phosphorylase str1017 - 3.085 maltose/maltodextrin ABC transporter permease protein, truncated str1069 - 2.509 hypothetical protein str1077 epsL 6.693 8.815 exopolysaccharide polymerization protein str1120 deoB 2.466 phosphopentomutase str1264 ptsI 2.013 phosphoenolpyruvate:sugar phosphotransferase system enzyme I str1265 ptsH 2.693 2.506 phosphocarrier protein HPr (histidine-containing protein) str1368 celB 0.457 0.396 PTS cellobiose-specific IIC component str1399 galM 2.041 aldose 1-epimerase str1457 ppnK 3.149 5.091 inorganic polyphosphate/ATP-NAD kinase str1469 rgpD 7.190 8.476 polysaccharide ABC transporter ATP-binding protein str1470 rgpC 8.628 10.773 0.458 polysaccharide ABC transporter membrane-spanning protein str1517 - 2.907 2.198 3.778 6.485 permease, putative str1732 pmi1 0.207 0.308 3.192 mannose-6-phosphate isomerase str1733 scrK 3.499 3.700 fructokinase str1734 scrA 2.990 4.456 sucrose-specific PTS permease, enzyme II str1788 gapA1 2.284 glyceraldehyde-3-phosphate dehydrogenase str1797 rpe 0.499 ribulose-phosphate 3-epimerase Cell division and chromosome partitioning str0008 divIC 0.486 2.955 cell-cycle protein, MesJ/Ycf62 family, putative str0010 - 2.061 putative cell-cycle protein, MesJ/Ycf62 family
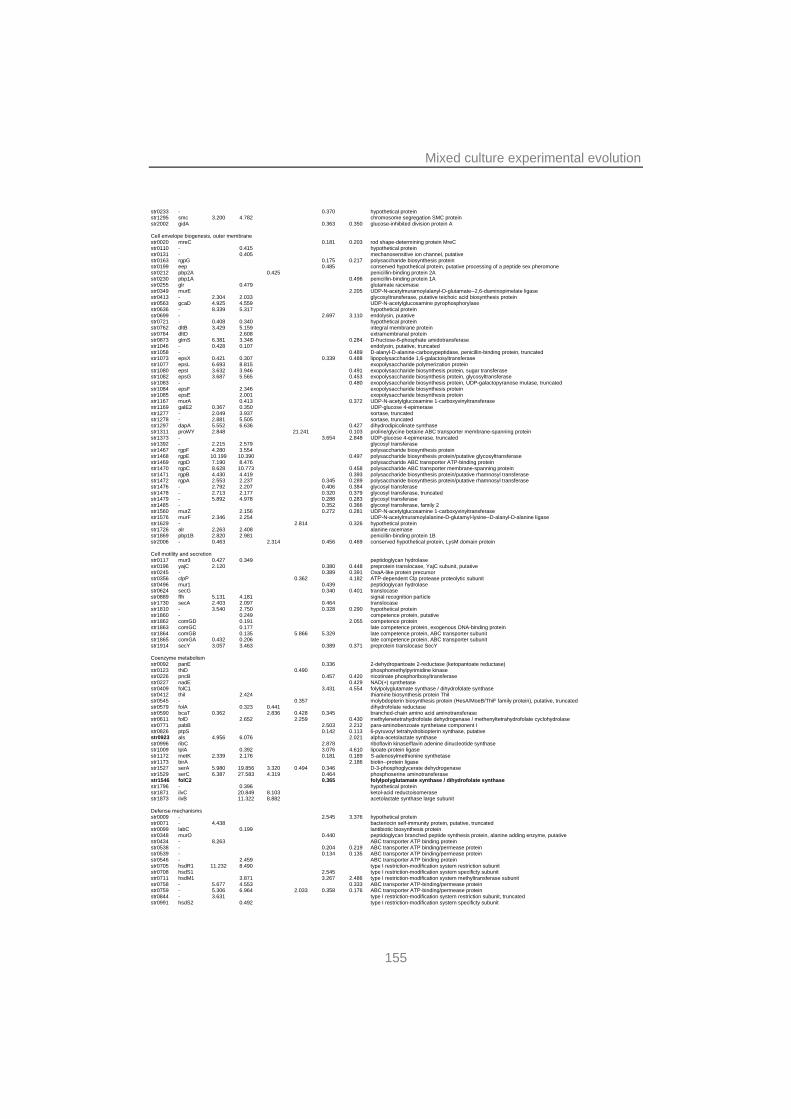
Mixed culture experimental evolution
155
str0233 - 0.370 hypothetical protein str1295 smc 3.200 4.782 chromosome segregation SMC protein str2002 gidA 0.363 0.350 glucose-inhibited division protein A Cell envelope biogenesis, outer membrane str0020 mreC 0.181 0.203 rod shape-determining protein MreC str0110 - 0.415 hypothetical protein str0131 - 0.405 mechanosensitive ion channel, putative str0163 rgpG 0.175 0.217 polysaccharide biosynthesis protein str0199 eep 0.485 conserved hypothetical protein, putative processing of a peptide sex pheromone str0212 pbp2A 0.425 penicillin-binding protein 2A str0230 pbp1A 0.496 penicillin-binding protein 1A str0255 glr 0.479 glutamate racemase str0349 murE 2.205 UDP-N-acetylmuramoylalanyl-D-glutamate--2,6-diaminopimelate ligase str0413 - 2.304 2.033 glycosyltransferase, putative teichoic acid biosynthesis protein str0563 gcaD 4.925 4.559 UDP-N-acetylglucosamine pyrophosphorylase str0636 - 8.339 5.317 hypothetical protein str0699 - 2.697 3.110 endolysin, putative str0721 - 0.408 0.340 hypothetical protein str0762 dltB 3.429 5.159 integral membrane protein str0764 dltD 2.608 extramembranal protein str0873 glmS 6.381 3.348 0.284 D-fructose-6-phosphate amidotransferase str1046 - 0.428 0.107 endolysin, putative, truncated str1058 - 0.489 D-alanyl-D-alanine-carboxypeptidase, penicillin-binding protein, truncated str1073 epsX 0.421 0.307 0.339 0.488 lipopolysaccharide 1,6-galactosyltransferase str1077 epsL 6.693 8.815 exopolysaccharide polymerization protein str1080 epsI 3.632 3.946 0.491 exopolysaccharide biosynthesis protein, sugar transferase str1082 epsG 3.687 5.565 0.453 exopolysaccharide biosynthesis protein, glycosyltransferase str1083 - 0.480 exopolysaccharide biosynthesis protein, UDP-galactopyranose mutase, truncated str1084 epsF 2.346 exopolysaccharide biosynthesis protein str1085 epsE 2.001 exopolysaccharide biosynthesis protein str1167 murA 0.413 0.372 UDP-N-acetylglucosamine 1-carboxyvinyltransferase str1169 galE2 0.367 0.350 UDP-glucose 4-epimerase str1277 - 2.049 3.937 sortase, truncated str1278 - 2.881 5.505 sortase, truncated str1297 dapA 5.552 6.636 0.427 dihydrodipicolinate synthase str1311 proWY 2.848 21.241 0.103 proline/glycine betaine ABC transporter membrane-spanning protein str1373 - 3.654 2.848 UDP-glucose 4-epimerase, truncated str1392 - 2.215 2.579 glycosyl transferase str1467 rgpF 4.280 3.554 polysaccharide biosynthesis protein str1468 rgpE 10.199 10.390 0.497 polysaccharide biosynthesis protein/putative glycosyltransferase str1469 rgpD 7.190 8.476 polysaccharide ABC transporter ATP-binding protein str1470 rgpC 8.628 10.773 0.458 polysaccharide ABC transporter membrane-spanning protein str1471 rgpB 4.430 4.419 0.393 polysaccharide biosynthesis protein/putative rhamnosyl transferase str1472 rgpA 2.553 2.237 0.345 0.289 polysaccharide biosynthesis protein/putative rhamnosyl transferase str1476 - 2.792 2.207 0.406 0.384 glycosyl transferase str1478 - 2.713 2.177 0.320 0.379 glycosyl transferase, truncated str1479 - 5.892 4.978 0.288 0.283 glycosyl transferase str1485 - 0.352 0.366 glycosyl transferase, family 2 str1560 murZ 2.156 0.272 0.281 UDP-N-acetylglucosamine 1-carboxyvinyltransferase str1576 murF 2.346 2.254 UDP-N-acetylmuramoylalanine-D-glutamyl-lysine--D-alanyl-D-alanine ligase str1629 - 2.814 0.326 hypothetical protein str1726 alr 2.263 2.408 alanine racemase str1869 pbp1B 2.820 2.981 penicillin-binding protein 1B str2006 - 0.463 2.314 0.456 0.469 conserved hypothetical protein, LysM domain protein Cell motility and secretion str0117 mur3 0.427 0.349 peptidoglycan hydrolase str0196 yajC 2.120 0.380 0.448 preprotein translocase, YajC subunit, putative str0245 - 0.389 0.391 OxaA-like protein precursor str0356 clpP 0.362 4.182 ATP-dependent Clp protease proteolytic subunit str0496 mur1 0.439 peptidoglycan hydrolase str0624 secG 0.340 0.401 translocase str0889 ffh 5.131 4.181 signal recognition particle str1730 secA 2.403 2.097 0.464 translocase str1810 - 3.540 2.750 0.328 0.290 hypothetical protein str1860 - 0.249 competence protein, putative str1862 comGD 0.191 2.055 competence protein str1863 comGC 0.177 late competence protein, exogenous DNA-binding protein str1864 comGB 0.135 5.866 5.329 late competence protein, ABC transporter subunit str1865 comGA 0.432 0.206 late competence protein, ABC transporter subunit str1914 secY 3.057 3.463 0.389 0.371 preprotein translocase SecY Coenzyme metabolism str0092 panE 0.336 2-dehydropantoate 2-reductase (ketopantoate reductase) str0123 thiD 0.490 phosphomethylpyrimidine kinase str0226 pncB 0.457 0.420 nicotinate phosphoribosyltransferase str0227 nadE 0.429 NAD(+) synthetase str0409 folC1 3.431 4.554 folylpolyglutamate synthase / dihydrofolate synthase str0412 thiI 2.424 thiamine biosynthesis protein ThiI str0545 - 0.357 molybdopterin biosynthesis protein (HesA/MoeB/ThiF family protein), putative, truncated str0579 folA 0.323 0.441 dihydrofolate reductase str0590 bcaT 0.362 2.836 0.428 0.345 branched-chain amino acid aminotransferase str0611 folD 2.652 2.259 0.430 methylenetetrahydrofolate dehydrogenase / methenyltetrahydrofolate cyclohydrolase str0771 pabB 2.503 2.212 para-aminobenzoate synthetase component I str0826 ptpS 0.142 0.113 6-pyruvoyl tetrahydrobiopterin synthase, putative str0923 als 4.956 6.076 2.021 alpha-acetolactate synthase str0996 ribC 2.878 riboflavin kinase/flavin adenine dinucleotide synthase str1009 lplA 0.392 3.076 4.610 lipoate-protein ligase str1172 metK 2.339 2.176 0.181 0.189 S-adenosylmethionine synthetase str1173 birA 2.186 biotin--protein ligase str1527 serA 5.980 19.856 3.320 0.494 0.346 D-3-phosphoglycerate dehydrogenase str1529 serC 6.387 27.583 4.319 0.464 phosphoserine aminotransferase str1546 folC2 0.365 folylpolyglutamate synthase / dihydrofolate synthase str1796 - 0.396 hypothetical protein str1871 ilvC 20.849 8.103 ketol-acid reductoisomerase str1873 ilvB 11.322 8.882 acetolactate synthase large subunit Defense mechanisms str0009 - 2.545 3.376 hypothetical protein str0071 - 4.438 bacteriocin self-immunity protein, putative, truncated str0099 labC 0.199 lantibiotic biosynthesis protein str0348 murO 0.440 peptidoglycan branched peptide synthesis protein, alanine adding enzyme, putative str0434 - 8.263 ABC transporter ATP binding protein str0538 - 0.204 0.219 ABC transporter ATP binding/permease protein str0539 - 0.134 0.135 ABC transporter ATP binding/permease protein str0546 - 2.459 ABC transporter ATP binding protein str0705 hsdR1 11.232 8.490 type I restriction-modification system restriction subunit str0708 hsdS1 2.545 type I restriction-modification system specificty subunit str0711 hsdM1 3.871 3.267 2.486 type I restriction-modification system methyltransferase subunit str0758 - 5.677 4.553 0.333 ABC transporter ATP-binding/permease protein str0759 - 5.306 6.964 2.033 0.358 0.176 ABC transporter ATP-binding/permease protein str0844 - 3.631 type I restriction-modification system restriction subunit, truncated str0991 hsdS2 0.492 type I restriction-modification system specificty subunit
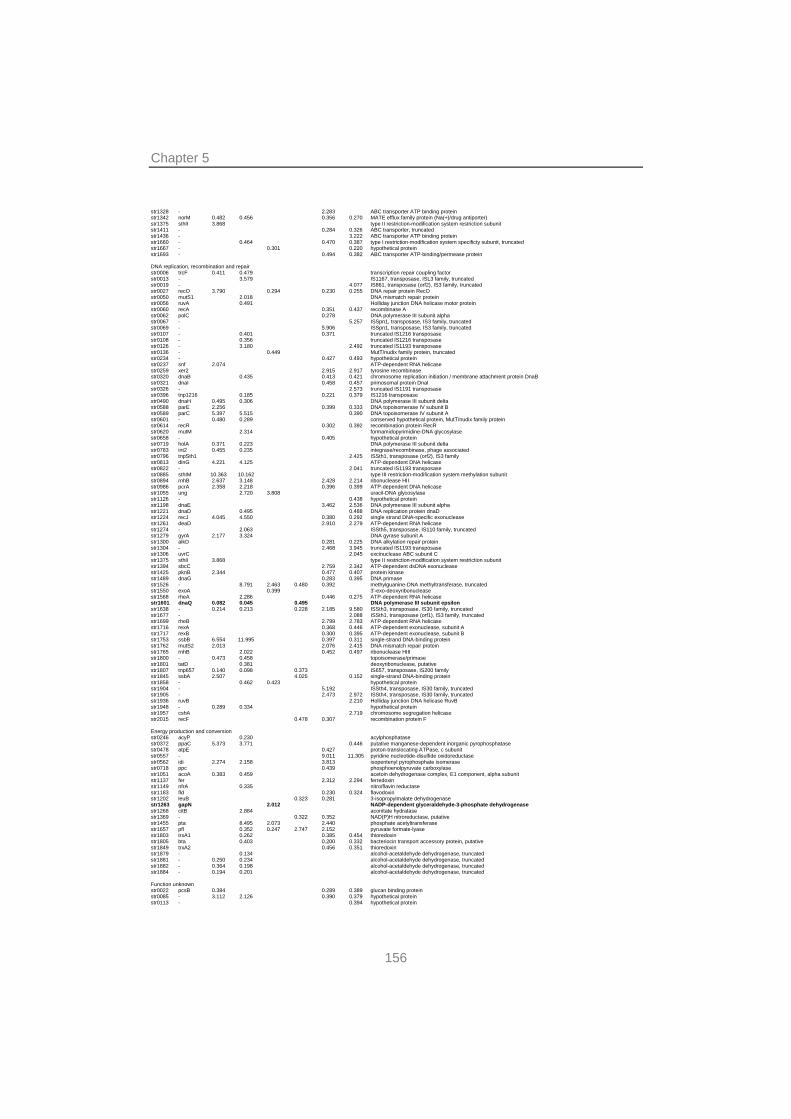
Chapter 5
156
str1328 - 2.283 ABC transporter ATP binding protein str1342 norM 0.482 0.456 0.356 0.270 MATE efflux family protein (Na(+)/drug antiporter) str1375 sthII 3.868 type II restriction-modification system restriction subunit str1411 - 0.284 0.326 ABC transporter, truncated str1436 - 3.222 ABC transporter ATP binding protein str1660 - 0.464 0.470 0.387 type I restriction-modification system specificty subunit, truncated str1667 - 0.301 0.220 hypothetical protein str1693 - 0.494 0.382 ABC transporter ATP-binding/permease protein DNA replication, recombination and repair str0006 trcF 0.411 0.479 transcription repair coupling factor str0013 - 3.579 IS1167, transposase, ISL3 family, truncated str0019 - 4.077 IS861, transposase (orf2), IS3 family, truncated str0027 recO 3.790 0.294 0.230 0.255 DNA repair protein RecO str0050 mutS1 2.018 DNA mismatch repair protein str0056 ruvA 0.491 Holliday junction DNA helicase motor protein str0060 recA 0.351 0.437 recombinase A str0062 polC 0.278 DNA polymerase III subunit alpha str0067 - 5.257 ISSpn1, transposase, IS3 family, truncated str0069 - 5.906 ISSpn1, transposase, IS3 family, truncated str0107 - 0.401 0.371 truncated IS1216 transposase str0108 - 0.356 truncated IS1216 transposase str0126 - 3.180 2.492 truncated IS1193 transposase str0136 - 0.449 MutT/nudix family protein, truncated str0234 - 0.427 0.493 hypothetical protein str0237 snf 2.074 ATP-dependent RNA helicase str0259 xer2 2.915 2.917 tyrosine recombinase str0320 dnaB 0.435 0.413 0.421 chromosome replication initiation / membrane attachment protein DnaB str0321 dnaI 0.458 0.457 primosomal protein DnaI str0326 - 2.573 truncated IS1191 transposase str0396 tnp1216 0.185 0.221 0.379 IS1216 transposase str0490 dnaH 0.495 0.306 DNA polymerase III subunit delta str0588 parE 2.256 0.399 0.333 DNA topoisomerase IV subunit B str0589 parC 5.397 5.515 0.390 DNA topoisomerase IV subunit A str0601 - 0.480 0.289 conserved hypothetical protein, MutT/nudix family protein str0614 recR 0.302 0.392 recombination protein RecR str0620 mutM 2.314 formamidopyrimidine-DNA glycosylase str0658 - 0.405 hypothetical protein str0719 holA 0.371 0.223 DNA polymerase III subunit delta str0783 int2 0.455 0.235 integrase/recombinase, phage associated str0796 tnpSth1 2.425 ISSth1, transposase (orf2), IS3 family str0813 dinG 4.221 4.125 ATP-dependent DNA helicase str0822 - 2.041 truncated IS1193 transposase str0885 sthIM 10.363 10.162 type III restriction-modification system methylation subunit str0894 rnhB 2.637 3.148 2.428 2.214 ribonuclease HII str0986 pcrA 2.358 2.218 0.396 0.399 ATP-dependent DNA helicase str1055 ung 2.720 3.808 uracil-DNA glycosylase str1126 - 0.438 hypothetical protein str1198 dnaE 3.462 2.536 DNA polymerase III subunit alpha str1221 dnaD 0.495 0.488 DNA replication protein dnaD str1224 recJ 4.045 4.550 0.380 0.292 single strand DNA-specific exonuclease str1261 deaD 2.910 2.279 ATP-dependent RNA helicase str1274 - 2.063 ISSth5, transposase, IS110 family, truncated str1279 gyrA 2.177 3.324 DNA gyrase subunit A str1300 alkD 0.281 0.225 DNA alkylation repair protein str1304 - 2.468 3.945 truncated IS1193 transposase str1306 uvrC 2.045 excinuclease ABC subunit C str1375 sthII 3.868 type II restriction-modification system restriction subunit str1394 sbcC 2.759 2.342 ATP-dependent dsDNA exonuclease str1425 pknB 2.344 0.477 0.407 protein kinase str1489 dnaG 0.283 0.395 DNA primase str1526 - 8.791 2.463 0.480 0.392 methylguanine-DNA methyltransferase, truncated str1550 exoA 0.399 3'-exo-deoxyribonuclease str1568 rheA 2.286 0.446 0.275 ATP-dependent RNA helicase str1601 dnaQ 0.082 0.045 0.495 DNA polymerase III subunit epsilon str1638 - 0.214 0.213 0.228 2.185 9.580 ISSth3, transposase, IS30 family, truncated str1677 - 2.088 ISSth1, transposase (orf1), IS3 family, truncated str1699 rheB 2.799 2.783 ATP-dependent RNA helicase str1716 rexA 0.368 0.446 ATP-dependent exonuclease, subunit A str1717 rexB 0.300 0.395 ATP-dependent exonuclease, subunit B str1753 ssbB 6.554 11.995 0.397 0.311 single-strand DNA-binding protein str1762 mutS2 2.013 2.076 2.415 DNA mismatch repair protein str1765 rnhB 2.022 0.452 0.497 ribonuclease HIII str1800 - 0.473 0.458 topoisomerase/primase str1801 tatD 0.381 deoxyribonuclease, putative str1807 tnp657 0.140 0.098 0.373 IS657, transposase, IS200 family str1845 ssbA 2.507 4.025 0.152 single-strand DNA-binding protein str1858 - 0.462 0.423 hypothetical protein str1904 - 5.192 ISSth4, transposase, IS30 family, truncated str1905 - 2.473 2.972 ISSth4, transposase, IS30 family, truncated str1936 ruvB 2.210 Holliday junction DNA helicase RuvB str1948 - 0.289 0.334 hypothetical protein str1957 cshA 2.719 chromosome segregation helicase str2015 recF 0.478 0.307 recombination protein F Energy production and conversion str0246 acyP 0.230 acylphosphatase str0372 ppaC 5.373 3.771 0.446 putative manganese-dependent inorganic pyrophosphatase str0478 atpE 0.427 proton-translocating ATPase, c subunit str0557 - 9.011 11.305 pyridine nucleotide-disulfide oxidoreductase str0562 idi 2.274 2.158 3.813 isopentenyl pyrophosphate isomerase str0718 ppc 0.439 phosphoenolpyruvate carboxylase str1051 acoA 0.383 0.459 acetoin dehydrogenase complex, E1 component, alpha subunit str1137 fer 2.312 2.294 ferredoxin str1149 nfrA 0.335 nitro/flavin reductase str1183 fld 0.230 0.324 flavodoxin str1202 leuB 0.323 0.281 3-isopropylmalate dehydrogenase str1263 gapN 2.012 NADP-dependent glyceraldehyde-3-phosphate dehydrogenase str1268 citB 2.884 aconitate hydratase str1369 - 0.322 0.352 NAD(P)H nitroreductase, putative str1455 pta 8.495 2.073 2.440 phosphate acetyltransferase str1657 pfl 0.352 0.247 2.747 2.152 pyruvate formate-lyase str1803 trxA1 0.262 0.385 0.454 thioredoxin str1805 bta 0.403 0.200 0.332 bacteriocin transport accessory protein, putative str1849 trxA2 0.456 0.351 thioredoxin str1879 - 0.134 alcohol-acetaldehyde dehydrogenase, truncated str1881 - 0.250 0.234 alcohol-acetaldehyde dehydrogenase, truncated str1882 - 0.364 0.198 alcohol-acetaldehyde dehydrogenase, truncated str1884 - 0.194 0.201 alcohol-acetaldehyde dehydrogenase, truncated Function unknown str0022 pcsB 0.384 0.289 0.389 glucan binding protein str0085 - 3.112 2.126 0.390 0.379 hypothetical protein str0113 - 0.394 hypothetical protein
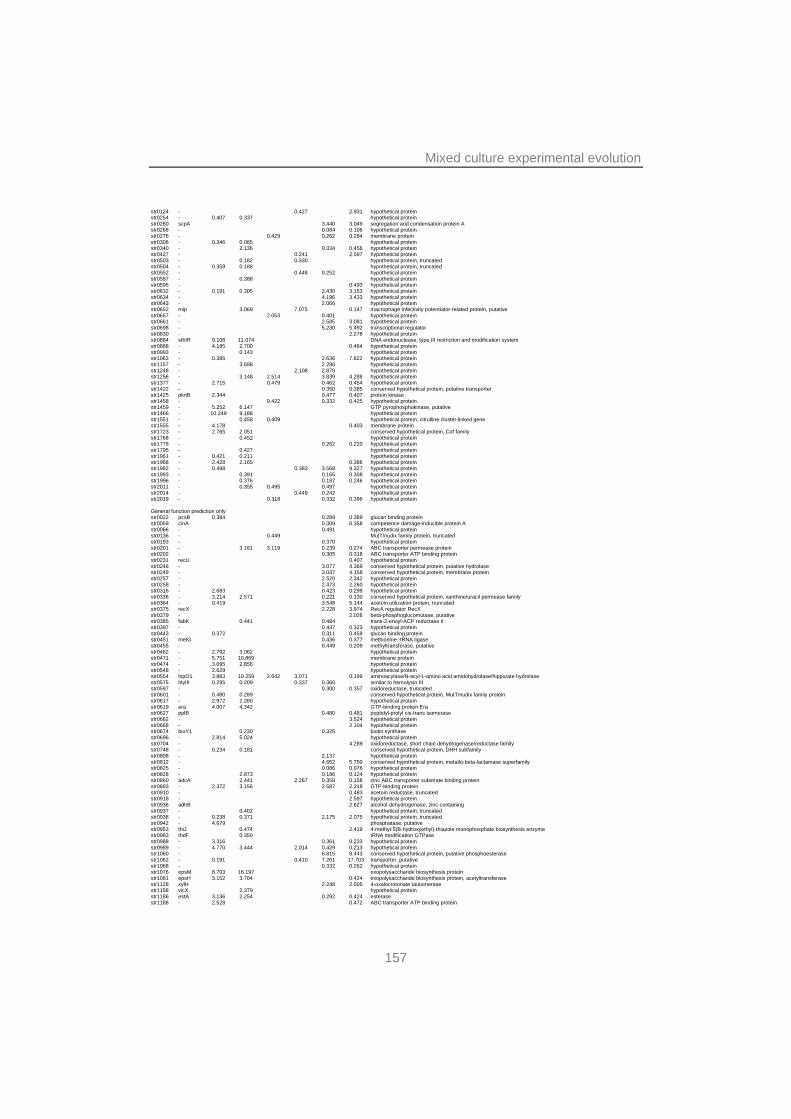
Mixed culture experimental evolution
157
str0124 - 0.427 2.931 hypothetical protein str0254 - 0.407 0.337 hypothetical protein str0260 scpA 3.440 3.049 segregation and condensation protein A str0268 - 0.084 0.106 hypothetical protein str0276 - 0.429 0.262 0.284 membrane protein str0306 - 0.346 0.085 hypothetical protein str0340 - 2.136 0.334 0.456 hypothetical protein str0427 - 0.241 2.597 hypothetical protein str0503 - 0.182 0.330 hypothetical protein, truncated str0504 - 0.359 0.188 hypothetical protein, truncated str0552 - 0.448 0.252 hypothetical protein str0587 - 0.388 hypothetical protein str0595 - 0.493 hypothetical protein str0632 - 0.191 0.305 2.430 3.153 hypothetical protein str0634 - 4.196 3.433 hypothetical protein str0643 - 2.066 hypothetical protein str0652 mip 3.069 7.075 0.147 macrophage infectivity potentiator-related protein, putative str0657 - 2.053 0.401 hypothetical protein str0661 - 2.585 3.081 hypothetical protein str0698 - 5.230 5.492 transcriptional regulator str0830 - 2.278 hypothetical protein str0884 sthIR 9.108 11.074 DNA endonuclease, type III restriction and modification system str0888 - 4.185 2.700 0.464 hypothetical protein str0993 - 0.143 hypothetical protein str1063 - 0.385 2.636 7.822 hypothetical protein str1157 - 3.698 2.296 hypothetical protein str1248 - 2.108 2.870 hypothetical protein str1256 - 3.148 2.514 3.839 4.288 hypothetical protein str1377 - 2.715 0.479 0.462 0.454 hypothetical protein str1422 - 0.350 0.385 conserved hypothetical protein, putative transporter str1425 pknB 2.344 0.477 0.407 protein kinase str1458 - 0.422 0.332 0.425 hypothetical protein str1459 - 5.252 6.147 GTP pyrophosphokinase, putative str1466 - 10.249 9.188 hypothetical protein str1551 - 0.458 0.409 hypothetical protein, citrulline cluster-linked gene str1555 - 4.178 0.403 membrane protein str1723 - 2.765 2.051 conserved hypothetical protein, Cof family str1768 - 0.452 hypothetical protein str1778 - 0.262 0.220 hypothetical protein str1795 - 0.427 hypothetical protein str1961 - 0.421 0.211 hypothetical protein str1968 - 2.428 2.165 0.386 hypothetical protein str1982 - 0.498 0.383 3.568 9.327 hypothetical protein str1993 - 0.391 0.165 0.308 hypothetical protein str1996 - 0.376 0.187 0.246 hypothetical protein str2011 - 0.355 0.495 0.497 hypothetical protein str2014 - 0.449 0.242 hypothetical protein str2019 - 0.318 0.332 0.396 hypothetical protein General function prediction only str0022 pcsB 0.384 0.289 0.389 glucan binding protein str0059 cinA 0.309 0.358 competence damage-inducible protein A str0066 - 0.491 hypothetical protein str0136 - 0.449 MutT/nudix family protein, truncated str0193 - 0.370 hypothetical protein str0201 - 3.161 3.119 0.239 0.274 ABC transporter permease protein str0202 - 0.305 0.318 ABC transporter ATP binding protein str0231 recU 0.407 hypothetical protein str0248 - 3.077 4.369 conserved hypothetical protein, putative hydrolase str0249 - 3.037 4.158 conserved hypothetical protein, membrane protein str0257 - 2.520 2.342 hypothetical protein str0258 - 2.473 2.260 hypothetical protein str0316 - 2.683 0.423 0.299 hypothetical protein str0336 - 3.214 2.571 0.221 0.130 conserved hypothetical protein, xanthine/uracil permease family str0364 - 0.419 3.548 5.144 acetoin utilization protein, truncated str0375 recX 2.228 3.974 RecA regulator RecX str0379 - 2.026 beta-phosphoglucomutase, putative str0385 fabK 0.441 0.484 trans-2-enoyl-ACP reductase II str0397 - 0.437 0.323 hypothetical protein str0443 - 0.372 0.311 0.459 glucan binding protein str0451 metG 0.436 0.377 methionine--tRNA ligase str0455 - 0.449 0.209 methyltransferase, putative str0462 - 2.792 3.062 hypothetical protein str0471 - 5.751 10.869 membrane protein str0474 - 3.095 2.856 hypothetical protein str0548 - 2.629 hypothetical protein str0554 hipO1 3.883 10.259 2.642 3.071 0.199 aminoacylase/N-acyl-L-amino acid amidohydrolase/hippurate hydrolase str0575 hlyIII 0.295 0.209 0.337 0.360 similar to hemolysin III str0597 - 0.300 0.357 oxidoreductase, truncated str0601 - 0.480 0.289 conserved hypothetical protein, MutT/nudix family protein str0617 - 2.972 2.280 hypothetical protein str0619 era 4.007 4.342 GTP-binding protein Era str0627 pplB 0.480 0.481 peptidyl-prolyl cis-trans isomerase str0662 - 3.524 hypothetical protein str0668 - 2.104 hypothetical protein str0674 bioY1 0.230 0.325 biotin synthase str0696 - 2.814 5.024 hypothetical protein str0704 - 4.289 oxidoreductase, short chain dehydrogenase/reductase family str0748 - 0.234 0.181 conserved hypothetical protein, DHH subfamily str0808 - 2.137 hypothetical protein str0812 - 4.652 5.750 conserved hypothetical protein, metallo-beta-lactamase superfamily str0825 - 0.086 0.076 hypothetical protein str0828 - 2.873 0.186 0.124 hypothetical protein str0860 adcA 2.441 2.267 0.359 0.158 zinc ABC transporter substrate binding protein str0893 - 2.372 3.156 2.587 2.218 GTP-binding protein str0910 - 0.483 acetoin reductase, truncated str0918 - 2.597 hypothetical protein str0936 adhB 2.627 alcohol dehydrogenase, zinc-containing str0937 - 0.402 hypothetical protein, truncated str0938 - 0.238 0.371 2.175 2.075 hypothetical protein, truncated str0942 - 4.679 phosphatase, putative str0953 thiJ 0.474 2.419 4-methyl-5(B-hydroxyethyl)-thiazole monophosphate biosynthesis enzyme str0983 thdF 0.350 tRNA modification GTPase str0988 - 3.316 0.361 0.233 hypothetical protein str0989 - 4.770 3.444 2.014 0.429 0.213 hypothetical protein str1060 - 6.815 8.443 conserved hypothetical protein, putative phosphoesterase str1062 - 0.191 0.410 7.261 17.703 transporter, putative str1068 - 0.332 0.262 hypothetical protein str1076 epsM 8.703 16.197 exopolysaccharide biosynthesis protein str1081 epsH 3.152 3.704 0.424 exopolysaccharide biosynthesis protein, acetyltransferase str1128 xylH 2.248 2.505 4-oxalocrotonate tautomerase str1158 vicX 2.379 hypothetical protein str1186 estA 3.136 2.254 0.292 0.424 esterase str1188 - 2.528 0.472 ABC transporter ATP binding protein
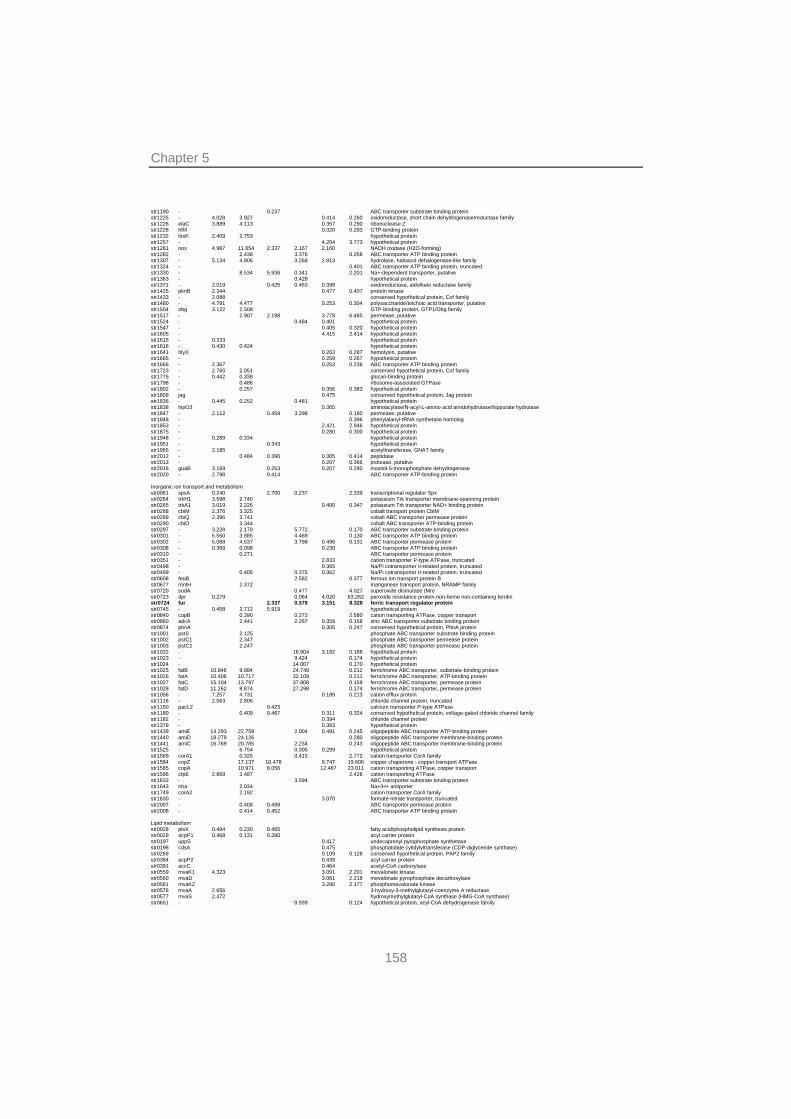
Chapter 5
158
str1190 - 0.237 ABC transporter substrate binding protein str1225 - 4.028 3.927 0.414 0.260 oxidoreductase, short chain dehydrogenase/reductase family str1226 elaC 3.889 4.113 0.357 0.290 ribonuclease Z str1228 hflX 0.320 0.293 GTP-binding protein str1232 hisK 2.409 2.753 hypothetical protein str1257 - 4.204 3.773 hypothetical protein str1281 nox 4.987 11.654 2.337 2.167 2.160 NADH oxidase (H2O-forming) str1282 - 2.438 3.376 0.258 ABC transporter ATP binding protein str1307 - 5.134 4.806 3.268 2.813 hydrolase, haloacid dehalogenase-like family str1324 - 0.401 ABC transporter ATP binding protein, truncated str1330 - 8.534 5.936 0.341 2.201 Na+-dependent transporter, putative str1363 - 0.428 hypothetical protein str1371 - 2.019 0.425 0.463 0.398 oxidoreductase, aldo/keto reductase family str1425 pknB 2.344 0.477 0.407 protein kinase str1433 - 2.088 conserved hypothetical protein, Cof family str1480 - 4.781 4.477 0.253 0.304 polysaccharide/teichoic acid transporter, putative str1504 obg 3.122 2.508 GTP-binding protein, GTP1/Obg family str1517 - 2.907 2.198 3.778 6.485 permease, putative str1524 - 0.484 0.401 hypothetical protein str1547 - 0.405 0.320 hypothetical protein str1605 - 4.415 2.414 hypothetical protein str1615 - 0.333 hypothetical protein str1616 - 0.430 0.424 hypothetical protein str1641 hlyX 0.263 0.287 hemolysin, putative str1665 - 0.259 0.267 hypothetical protein str1666 - 2.367 0.253 0.236 ABC transporter ATP binding protein str1723 - 2.765 2.051 conserved hypothetical protein, Cof family str1775 - 0.442 0.338 glucan-binding protein str1798 - 0.486 ribosome-associated GTPase str1802 - 0.257 0.356 0.383 hypothetical protein str1809 jag 0.475 conserved hypothetical protein, Jag protein str1836 - 0.445 0.252 0.481 hypothetical protein str1838 hipO3 0.365 aminoacylase/N-acyl-L-amino acid amidohydrolase/hippurate hydrolase str1847 - 2.112 0.459 3.298 0.180 permease, putative str1848 - 0.396 phenylalanyl-tRNA synthetase homolog str1853 - 2.421 2.946 hypothetical protein str1875 - 0.280 0.300 hypothetical protein str1948 - 0.289 0.334 hypothetical protein str1951 - 0.343 hypothetical protein str1965 - 2.185 acetyltransferase, GNAT family str2012 - 0.484 0.396 0.305 0.414 peptidase str2013 - 0.207 0.366 protease, putative str2016 guaB 3.169 0.253 0.207 0.290 inositol-5-monophosphate dehydrogenase str2020 - 2.798 0.414 ABC transporter ATP-binding protein Inorganic ion transport and metabolism str0061 spxA 0.240 2.700 0.237 2.339 transcriptional regulator Spx str0264 trkH1 3.598 2.740 potassium Trk transporter membrane-spanning protein str0265 trkA1 3.019 2.226 0.400 0.347 potassium Trk transporter NAD+ binding protein str0288 cbiM 2.376 3.325 cobalt transport protein CbiM str0289 cbiQ 2.396 3.741 cobalt ABC transporter permease protein str0290 cbiO 3.344 cobalt ABC transporter ATP-binding protein str0297 - 3.228 2.170 5.772 0.170 ABC transporter substrate binding protein str0301 - 5.550 3.885 4.469 0.130 ABC transporter ATP binding protein str0302 - 5.088 4.537 3.798 0.496 0.131 ABC transporter permease protein str0308 - 0.369 0.098 0.230 ABC transporter ATP binding protein str0310 - 0.271 ABC transporter permease protein str0351 - 2.833 cation transporter P-type ATPase, truncated str0498 - 0.365 Na/Pi cotransporter II-related protein, truncated str0499 - 0.405 0.375 0.362 Na/Pi cotransporter II-related protein, truncated str0608 feoB 2.582 0.377 ferrous ion transport protein B str0677 mntH 2.372 manganese transport protein, NRAMP family str0720 sodA 0.477 4.027 superoxide dismutase (Mn) str0723 dpr 0.279 0.064 4.020 63.262 peroxide resistance protein,non-heme iron-containing ferritin str0724 fur 2.337 0.378 3.151 8.328 ferric transport regulator protein str0745 - 0.458 2.712 5.919 hypothetical protein str0840 copB 0.390 0.372 2.580 cation transporting ATPase, copper transport str0860 adcA 2.441 2.267 0.359 0.158 zinc ABC transporter substrate binding protein str0874 phnA 0.305 0.247 conserved hypothetical protein, PhnA protein str1001 pstS 2.125 phosphate ABC transporter substrate binding protein str1002 pstC1 2.347 phosphate ABC transporter permease protein str1003 pstC2 2.247 phosphate ABC transporter permease protein str1022 - 16.904 3.182 0.188 hypothetical protein str1023 - 9.424 0.174 hypothetical protein str1024 - 14.007 0.170 hypothetical protein str1025 fatB 10.846 9.884 24.748 0.212 ferrichrome ABC transporter, substrate-binding protein str1026 fatA 10.406 10.717 32.109 0.211 ferrichrome ABC transporter, ATP-binding protein str1027 fatC 15.104 13.797 37.808 0.159 ferrichrome ABC transporter, permease protein str1028 fatD 11.262 8.874 27.298 0.174 ferrichrome ABC transporter, permease protein str1056 - 7.257 4.731 0.189 0.213 cation efflux protein str1116 - 2.063 2.806 chloride channel protein, truncated str1150 pacL2 0.423 calcium transporter P-type ATPase str1180 - 0.409 0.467 0.311 0.324 conserved hypothetical protein, voltage-gated chloride channel family str1182 - 0.394 chloride channel protein str1379 - 0.383 hypothetical protein str1439 amiE 14.293 22.759 2.004 0.491 0.245 oligopeptide ABC transporter ATP-binding protein str1440 amiD 18.279 24.126 0.280 oligopeptide ABC transporter membrane-binding protein str1441 amiC 16.769 20.785 2.234 0.243 oligopeptide ABC transporter membrane-binding protein str1525 - 6.754 0.305 0.299 hypothetical protein str1569 corA1 0.325 0.415 2.772 cation transporter CorA family str1584 copZ 17.137 10.478 9.747 19.606 copper chaperone - copper transport ATPase str1585 copA 10.971 8.056 12.487 23.011 cation transporting ATPase, copper transport str1596 ctpE 2.869 3.487 2.428 cation transporting ATPase str1633 - 3.594 ABC transporter substrate binding protein str1643 nha 2.034 Na+/H+ antiporter str1749 corA2 2.192 cation transporter CorA family str1830 - 3.070 formate-nitrate transporter, truncated str2007 - 0.408 0.499 ABC transporter permease protein str2008 - 0.414 0.452 ABC transporter ATP binding protein Lipid metabolism str0028 plsX 0.494 0.230 0.465 fatty acid/phospholipid synthesis protein str0029 acpP1 0.468 0.131 0.280 acyl carrier protein str0197 uppS 0.417 undecaprenyl pyrophosphate synthetase str0198 cdsA 0.475 phosphatidate cytidylyltransferase (CDP-diglyceride synthase) str0269 - 0.109 0.128 conserved hypothetical protein, PAP2 family str0384 acpP2 0.439 acyl carrier protein str0391 accC 0.464 acetyl-CoA carboxylase str0559 mvaK1 4.323 3.091 2.201 mevalonate kinase str0560 mvaD 3.061 2.218 mevalonate pyrophosphate decarboxylase str0561 mvaK2 3.280 2.177 phosphomevalonate kinase str0576 mvaA 2.656 3-hydroxy-3-methylglutaryl-coenzyme A reductase str0577 mvaS 2.472 hydroxymethylglutaryl-CoA synthase (HMG-CoA synthase) str0651 - 8.939 0.124 hypothetical protein, acyl-CoA dehydrogenase family
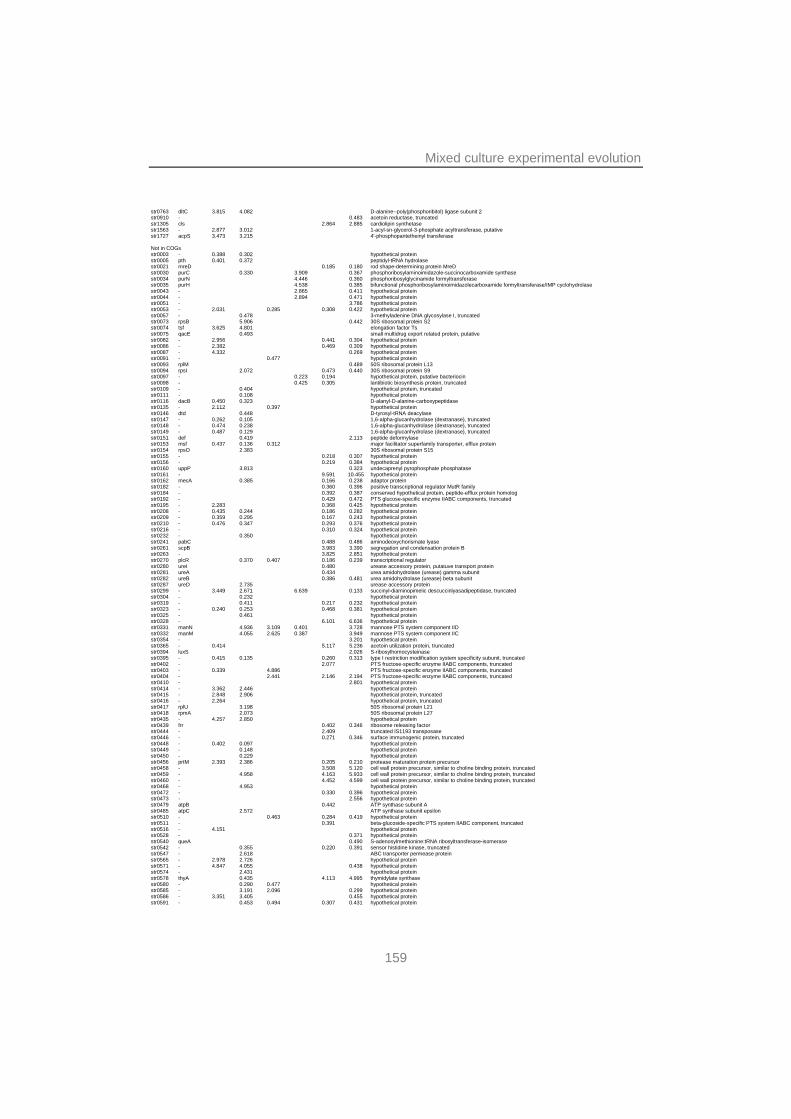
Mixed culture experimental evolution
159
str0763 dltC 3.815 4.082 D-alanine--poly(phosphoribitol) ligase subunit 2 str0910 - 0.483 acetoin reductase, truncated str1305 cls 2.864 2.885 cardiolipin synthetase str1563 - 2.877 3.012 1-acyl-sn-glycerol-3-phosphate acyltransferase, putative str1727 acpS 3.473 3.215 4'-phosphopantetheinyl transferase Not in COGs str0003 - 0.388 0.302 hypothetical protein str0005 pth 0.401 0.372 peptidyl-tRNA hydrolase str0021 mreD 0.185 0.180 rod shape-determining protein MreD str0030 purC 0.330 3.909 0.367 phosphoribosylaminoimidazole-succinocarboxamide synthase str0034 purN 4.446 0.360 phosphoribosylglycinamide formyltransferase str0035 purH 4.538 0.385 bifunctional phosphoribosylaminoimidazolecarboxamide formyltransferase/IMP cyclohydrolase str0043 - 2.865 0.411 hypothetical protein str0044 - 2.894 0.471 hypothetical protein str0051 - 3.786 hypothetical protein str0053 - 2.031 0.285 0.308 0.422 hypothetical protein str0057 - 0.478 3-methyladenine DNA glycosylase I, truncated str0073 rpsB 5.906 0.442 30S ribosomal protein S2 str0074 tsf 3.625 4.801 elongation factor Ts str0075 qacE 0.493 small multidrug export related protein, putative str0082 - 2.956 0.441 0.304 hypothetical protein str0086 - 2.382 0.469 0.309 hypothetical protein str0087 - 4.332 0.269 hypothetical protein str0091 - 0.477 hypothetical protein str0093 rplM 0.489 50S ribosomal protein L13 str0094 rpsI 2.072 0.473 0.440 30S ribosomal protein S9 str0097 - 0.223 0.194 hypothetical protein, putative bacteriocin str0098 - 0.425 0.305 lantibiotic biosynthesis protein, truncated str0109 - 0.404 hypothetical protein, truncated str0111 - 0.108 hypothetical protein str0116 dacB 0.450 0.323 D-alanyl-D-alanine-carboxypeptidase str0135 - 2.112 0.397 hypothetical protein str0146 dtd 0.448 D-tyrosyl-tRNA deacylase str0147 - 0.262 0.105 1,6-alpha-glucanhydrolase (dextranase), truncated str0148 - 0.474 0.238 1,6-alpha-glucanhydrolase (dextranase), truncated str0149 - 0.487 0.129 1,6-alpha-glucanhydrolase (dextranase), truncated str0151 def 0.419 2.113 peptide deformylase str0153 msf 0.437 0.136 0.312 major facilitator superfamily transporter, efflux protein str0154 rpsO 2.383 30S ribosomal protein S15 str0155 - 0.218 0.307 hypothetical protein str0156 - 0.219 0.384 hypothetical protein str0160 uppP 3.813 0.323 undecaprenyl pyrophosphate phosphatase str0161 - 9.591 10.455 hypothetical protein str0162 mecA 0.385 0.166 0.238 adaptor protein str0182 - 0.360 0.396 positive transcriptional regulator MutR family str0184 - 0.392 0.387 conserved hypothetical protein, peptide-efflux protein homolog str0192 - 0.429 0.472 PTS glucose-specific enzyme IIABC components, truncated str0195 - 2.283 0.368 0.425 hypothetical protein str0208 - 0.435 0.244 0.186 0.282 hypothetical protein str0209 - 0.359 0.295 0.167 0.243 hypothetical protein str0210 - 0.476 0.347 0.293 0.376 hypothetical protein str0216 - 0.310 0.324 hypothetical protein str0232 - 0.350 hypothetical protein str0241 pabC 0.488 0.486 aminodeoxychorismate lyase str0261 scpB 3.983 3.390 segregation and condensation protein B str0263 - 3.825 2.851 hypothetical protein str0270 plcR 0.370 0.407 0.186 0.239 transcriptional regulator str0280 ureI 0.480 urease accessory protein, putatuve transport protein str0281 ureA 0.434 urea amidohydrolase (urease) gamma subunit str0282 ureB 0.386 0.481 urea amidohydrolase (urease) beta subunit str0287 ureD 2.735 urease accessory protein str0299 - 3.449 2.671 6.639 0.133 succinyl-diaminopimelic descuccinlyasadipeptidase, truncated str0304 - 0.232 hypothetical protein str0319 - 0.411 0.217 0.232 hypothetical protein str0323 - 0.240 0.253 0.468 0.381 hypothetical protein str0325 - 0.461 hypothetical protein str0328 - 6.101 6.636 hypothetical protein str0331 manN 4.936 3.109 0.401 3.728 mannose PTS system component IID str0332 manM 4.055 2.625 0.387 3.949 mannose PTS system component IIC str0354 - 3.201 hypothetical protein str0365 - 0.414 5.117 5.236 acetoin utilization protein, truncated str0394 luxS 2.026 S-ribosylhomocysteinase str0395 - 0.415 0.135 0.260 0.313 type I restriction modification system specificity subunit, truncated str0402 - 2.077 PTS fructose-specific enzyme IIABC components, truncated str0403 - 0.339 4.886 PTS fructose-specific enzyme IIABC components, truncated str0404 - 2.441 2.146 2.194 PTS fructose-specific enzyme IIABC components, truncated str0410 - 2.801 hypothetical protein str0414 - 3.362 2.446 hypothetical protein str0415 - 2.848 2.906 hypothetical protein, truncated str0416 - 2.264 hypothetical protein, truncated str0417 rplU 3.198 50S ribosomal protein L21 str0418 rpmA 2.073 50S ribosomal protein L27 str0435 - 4.257 2.850 hypothetical protein str0439 frr 0.402 0.346 ribosome releasing factor str0444 - 2.409 truncated IS1193 transposase str0446 - 0.271 0.346 surface immunogenic protein, truncated str0448 - 0.402 0.097 hypothetical protein str0449 - 0.148 hypothetical protein str0450 - 0.229 hypothetical protein str0456 prtM 2.393 2.386 0.205 0.210 protease maturation protein precursor str0458 - 3.508 5.120 cell wall protein precursor, similar to choline binding protein, truncated str0459 - 4.958 4.163 5.933 cell wall protein precursor, similar to choline binding protein, truncated str0460 - 4.452 4.599 cell wall protein precursor, similar to choline binding protein, truncated str0468 - 4.953 hypothetical protein str0472 - 0.330 0.396 hypothetical protein str0473 - 2.556 hypothetical protein str0479 atpB 0.442 ATP synthase subunit A str0485 atpC 2.572 ATP synthase subunit epsilon str0510 - 0.463 0.284 0.419 hypothetical protein str0511 - 0.391 beta-glucoside-specific PTS system IIABC component, truncated str0516 - 4.151 hypothetical protein str0528 - 0.371 hypothetical protein str0540 queA 0.490 S-adenosylmethionine:tRNA ribosyltransferase-isomerase str0542 - 0.355 0.220 0.391 sensor histidine kinase, truncated str0547 - 2.618 ABC transporter permease protein str0565 - 2.978 2.726 hypothetical protein str0571 - 4.847 4.055 0.438 hypothetical protein str0574 - 2.431 hypothetical protein str0578 thyA 0.435 4.113 4.995 thymidylate synthase str0580 - 0.290 0.477 hypothetical protein str0585 - 3.191 2.096 0.299 hypothetical protein str0586 - 3.351 3.405 0.455 hypothetical protein str0591 - 0.453 0.494 0.307 0.431 hypothetical protein
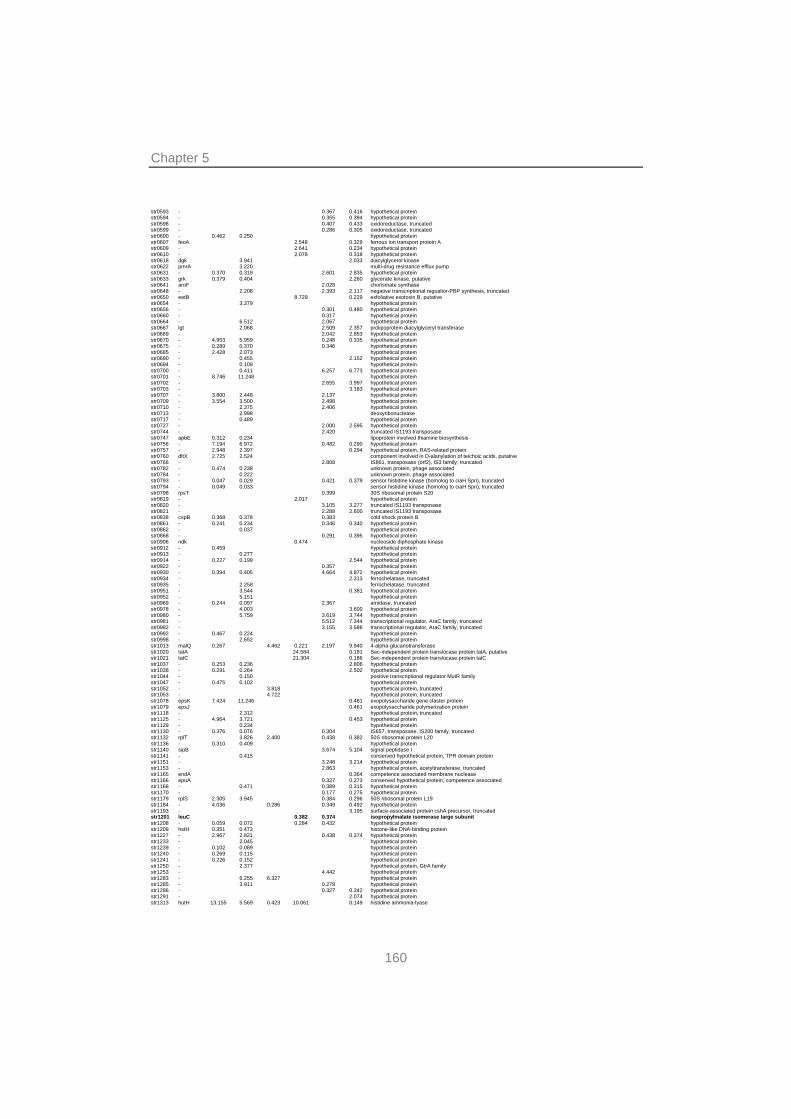
Chapter 5
160
str0593 - 0.367 0.416 hypothetical protein str0594 - 0.355 0.394 hypothetical protein str0598 - 0.407 0.433 oxidoreductase, truncated str0599 - 0.286 0.305 oxidoreductase, truncated str0600 - 0.462 0.250 hypothetical protein str0607 feoA 2.548 0.329 ferrous ion transport protein A str0609 - 2.641 0.234 hypothetical protein str0610 - 2.078 0.318 hypothetical protein str0618 dgk 3.941 2.033 diacylglycerol kinase str0622 pmrA 3.220 multi-drug resistance efflux pump str0631 - 0.370 0.319 2.601 2.835 hypothetical protein str0633 grk 0.379 0.404 2.260 glycerate kinase, putative str0641 aroF 2.028 chorismate synthase str0648 - 2.208 2.393 2.117 negative transcriptional regualtor-PBP synthesis, truncated str0650 eetB 8.729 0.229 exfoliative exotoxin B, putative str0654 - 3.379 hypothetical protein str0656 - 0.301 0.480 hypothetical protein str0660 - 0.317 hypothetical protein str0664 - 6.512 2.067 hypothetical protein str0667 lgt 2.068 2.509 2.357 prolipoprotein diacylglyceryl transferase str0669 - 2.042 2.853 hypothetical protein str0670 - 4.953 5.959 0.248 0.335 hypothetical protein str0675 - 0.289 0.370 0.346 hypothetical protein str0685 - 2.428 2.073 hypothetical protein str0690 - 0.455 2.152 hypothetical protein str0694 - 0.109 hypothetical protein str0700 - 0.411 6.257 6.773 hypothetical protein str0701 - 8.746 11.248 hypothetical protein str0702 - 2.655 3.997 hypothetical protein str0703 - 3.183 hypothetical protein str0707 - 3.800 2.448 2.137 hypothetical protein str0709 - 3.554 3.500 2.498 hypothetical protein str0710 - 2.375 2.406 hypothetical protein str0713 - 2.998 deoxyribonuclease str0717 - 0.489 hypothetical protein str0727 - 2.000 2.595 hypothetical protein str0744 - 2.420 truncated IS1193 transposase str0747 apbE 0.312 0.234 lipoprotein involved thiamine biosynthesis str0756 - 7.194 6.972 0.482 0.290 hypothetical protein str0757 - 2.948 2.397 0.294 hypothetical protein, RAS-related protein str0760 dltX 2.725 2.524 component involved in D-alanylation of teichoic acids, putative str0766 - 2.808 IS861, transposase (orf2), IS3 family, truncated str0782 - 0.474 0.238 unknown protein, phage associated str0784 - 0.222 unknown protein, phage associated str0793 - 0.047 0.029 0.421 0.379 sensor histidine kinase (homolog to ciaH Spn), truncated str0794 - 0.049 0.033 sensor histidine kinase (homolog to ciaH Spn), truncated str0798 rpsT 0.399 30S ribosomal protein S20 str0819 - 2.017 hypothetical protein str0820 - 3.105 3.277 truncated IS1193 transposase str0821 - 2.288 2.600 truncated IS1193 transposase str0838 cspB 0.368 0.378 0.383 cold shock protein B str0861 - 0.241 0.234 0.346 0.340 hypothetical protein str0862 - 0.037 hypothetical protein str0868 - 0.291 0.395 hypothetical protein str0906 ndk 0.474 nucleoside diphosphate kinase str0912 - 0.459 hypothetical protein str0913 - 0.277 hypothetical protein str0914 - 0.227 0.199 2.544 hypothetical protein str0922 - 0.357 hypothetical protein str0930 - 0.394 0.405 4.664 4.872 hypothetical protein str0934 - 2.313 ferrochelatase, truncated str0935 - 2.258 ferrochelatase, truncated str0951 - 3.544 0.381 hypothetical protein str0952 - 5.151 hypothetical protein str0969 - 0.244 0.097 2.367 amidase, truncated str0978 - 4.003 3.600 hypothetical protein str0980 - 5.759 3.619 3.744 hypothetical protein str0981 - 5.512 7.344 transcriptional regulator, AraC family, truncated str0982 - 3.155 3.586 transcriptional regulator, AraC family, truncated str0992 - 0.467 0.224 hypothetical protein str0998 - 2.652 hypothetical protein str1013 malQ 0.267 4.462 0.221 2.197 9.940 4-alpha-glucanotransferase str1020 tatA 24.584 0.181 Sec-independent protein translocase protein tatA, putative str1021 tatC 21.304 0.186 Sec-independent protein translocase protein tatC str1037 - 0.253 0.236 2.806 hypothetical protein str1038 - 0.291 0.264 2.502 hypothetical protein str1044 - 0.150 positive transcriptional regulator MutR family str1047 - 0.475 0.102 hypothetical protein str1052 - 3.818 hypothetical protein, truncated str1053 - 4.722 hypothetical protein, truncated str1078 epsK 7.424 11.246 0.481 exopolysaccharide gene claster protein str1079 epsJ 0.461 exopolysaccharide polymerization protein str1118 - 2.312 hypothetical protein, truncated str1125 - 4.964 3.721 0.453 hypothetical protein str1129 - 0.234 hypothetical protein str1130 - 0.376 0.076 0.304 IS657, transposase, IS200 family, truncated str1132 rplT 3.826 2.400 0.438 0.382 50S ribosomal protein L20 str1136 - 0.310 0.409 hypothetical protein str1140 sipB 3.674 5.104 signal peptidase I str1141 - 0.415 conserved hypothetical protein, TPR domain protein str1151 - 3.248 3.214 hypothetical protein str1153 - 2.863 hypothetical protein, acetyltransferase, truncated str1165 endA 0.364 competence associated membrane nuclease str1166 epuA 0.327 0.273 conserved hypothetical protein, competence associated str1168 - 0.471 0.389 0.315 hypothetical protein str1170 - 0.177 0.275 hypothetical protein str1179 rplS 2.305 3.945 0.384 0.296 50S ribosomal protein L19 str1184 - 4.036 0.286 0.349 0.492 hypothetical protein str1193 - 3.195 surface-associated protein cshA precursor, truncated str1201 leuC 0.382 0.374 isopropylmalate isomerase large subunit str1208 - 0.059 0.072 0.284 0.432 hypothetical protein str1209 hstH 0.351 0.473 histone-like DNA-binding protein str1227 - 2.967 2.821 0.438 0.374 hypothetical protein str1233 - 2.045 hypothetical protein str1239 - 0.102 0.089 hypothetical protein str1240 - 0.269 0.115 hypothetical protein str1241 - 0.226 0.152 hypothetical protein str1250 - 2.377 hypothetical protein, GtrA family str1253 - 4.442 hypothetical protein str1283 - 6.255 6.327 hypothetical protein str1285 - 3.911 0.278 hypothetical protein str1286 - 0.327 0.342 hypothetical protein str1291 - 2.074 hypothetical protein str1313 hutH 13.155 5.569 0.423 10.061 0.149 histidine ammonia-lyase
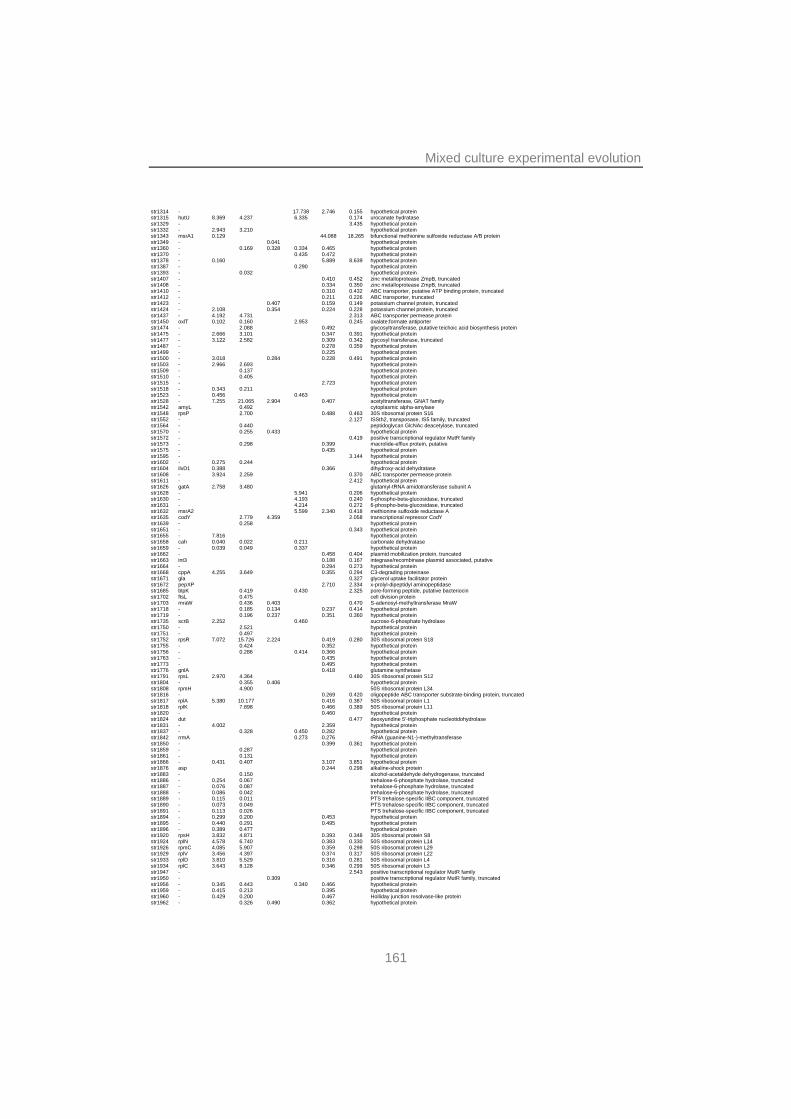
Mixed culture experimental evolution
161
str1314 - 17.738 2.746 0.155 hypothetical protein str1315 hutU 8.369 4.237 6.335 0.174 urocanate hydratase str1329 - 3.435 hypothetical protein str1332 - 2.943 3.210 hypothetical protein str1343 msrA1 0.129 44.088 18.265 bifunctional methionine sulfoxide reductase A/B protein str1349 - 0.041 hypothetical protein str1360 - 0.169 0.328 0.334 0.465 hypothetical protein str1370 - 0.435 0.472 hypothetical protein str1378 - 0.160 5.889 8.639 hypothetical protein str1387 - 0.290 hypothetical protein str1393 - 0.032 hypothetical protein str1407 - 0.410 0.452 zinc metalloprotease ZmpB, truncated str1408 - 0.334 0.350 zinc metalloprotease ZmpB, truncated str1410 - 0.310 0.432 ABC transporter, putative ATP binding protein, truncated str1412 - 0.211 0.226 ABC transporter, truncated str1423 - 0.407 0.159 0.149 potassium channel protein, truncated str1424 - 2.108 0.354 0.224 0.228 potassium channel protein, truncated str1437 - 4.192 4.731 2.313 ABC transporter permease protein str1450 oxlT 0.102 0.160 2.953 0.245 oxalate:formate antiporter str1474 - 2.088 0.492 glycosyltransferase, putative teichoic acid biosynthesis protein str1475 - 2.666 3.101 0.347 0.391 hypothetical protein str1477 - 3.122 2.582 0.309 0.342 glycosyl transferase, truncated str1487 - 0.278 0.359 hypothetical protein str1499 - 0.225 hypothetical protein str1500 - 3.018 0.284 0.228 0.491 hypothetical protein str1503 - 2.966 2.693 hypothetical protein str1509 - 0.137 hypothetical protein str1510 - 0.405 hypothetical protein str1515 - 2.723 hypothetical protein str1518 - 0.343 0.211 hypothetical protein str1523 - 0.456 0.463 hypothetical protein str1528 - 7.255 21.065 2.904 0.407 acetyltransferase, GNAT family str1542 amyL 0.492 cytoplasmic alpha-amylase str1548 rpsP 2.700 0.488 0.463 30S ribosomal protein S16 str1552 - 2.127 ISSth2, transposase, IS5 family, truncated str1564 - 0.440 peptidoglycan GlcNAc deacetylase, truncated str1570 - 0.255 0.433 hypothetical protein str1572 - 0.419 positive transcriptional regulator MutR family str1573 - 0.298 0.399 macrolide-efflux protein, putative str1575 - 0.435 hypothetical protein str1595 - 3.144 hypothetical protein str1602 - 0.275 0.244 hypothetical protein str1604 ilvD1 0.388 0.366 dihydroxy-acid dehydratase str1608 - 3.924 2.259 0.370 ABC transporter permease protein str1611 - 2.412 hypothetical protein str1626 gatA 2.758 3.480 glutamyl-tRNA amidotransferase subunit A str1628 - 5.941 0.206 hypothetical protein str1630 - 4.193 0.240 6-phospho-beta-glucosidase, truncated str1631 - 4.214 0.272 6-phospho-beta-glucosidase, truncated str1632 msrA2 5.599 2.340 0.418 methionine sulfoxide reductase A str1635 codY 2.779 4.359 2.058 transcriptional repressor CodY str1639 - 0.258 hypothetical protein str1651 - 0.343 hypothetical protein str1655 - 7.816 hypothetical protein str1658 cah 0.040 0.022 0.211 carbonate dehydratase str1659 - 0.039 0.049 0.337 hypothetical protein str1662 - 0.458 0.404 plasmid mobilization protein, truncated str1663 int3 0.188 0.167 integrase/recombinase plasmid associated, putative str1664 - 0.294 0.273 hypothetical protein str1668 cppA 4.255 3.649 0.355 0.294 C3-degrading proteinase str1671 gla 0.327 glycerol uptake facilitator protein str1672 pepXP 2.710 2.334 x-prolyl-dipeptidyl aminopeptidase str1685 blpK 0.419 0.430 2.325 pore-forming peptide, putative bacteriocin str1702 ftsL 0.475 cell division protein str1703 mraW 0.436 0.403 0.470 S-adenosyl-methyltransferase MraW str1718 - 0.185 0.134 0.237 0.414 hypothetical protein str1719 - 0.196 0.237 0.351 0.360 hypothetical protein str1735 scrB 2.252 0.460 sucrose-6-phosphate hydrolase str1750 - 2.521 hypothetical protein str1751 - 0.497 hypothetical protein str1752 rpsR 7.072 15.726 2.224 0.419 0.280 30S ribosomal protein S18 str1755 - 0.424 0.352 hypothetical protein str1756 - 0.286 0.414 0.366 hypothetical protein str1763 - 0.435 hypothetical protein str1773 - 0.495 hypothetical protein str1776 gnlA 0.418 glutamine synthetase str1791 rpsL 2.970 4.364 0.480 30S ribosomal protein S12 str1804 - 0.355 0.406 hypothetical protein str1808 rpmH 4.900 50S ribosomal protein L34 str1816 - 0.269 0.420 oligopeptide ABC transporter substrate-binding protein, truncated str1817 rplA 5.380 10.177 0.416 0.387 50S ribosomal protein L1 str1818 rplK 7.898 0.466 0.389 50S ribosomal protein L11 str1820 - 0.460 hypothetical protein str1824 dut 0.477 deoxyuridine 5'-triphosphate nucleotidohydrolase str1831 - 4.002 2.359 hypothetical protein str1837 - 0.328 0.450 0.282 hypothetical protein str1842 rrmA 0.273 0.276 rRNA (guanine-N1-)-methyltransferase str1850 - 0.399 0.361 hypothetical protein str1859 - 0.287 hypothetical protein str1861 - 0.131 hypothetical protein str1866 - 0.431 0.407 3.107 3.851 hypothetical protein str1876 asp 0.244 0.298 alkaline-shock protein str1883 - 0.150 alcohol-acetaldehyde dehydrogenase, truncated str1886 - 0.254 0.067 trehalose-6-phosphate hydrolase, truncated str1887 - 0.076 0.087 trehalose-6-phosphate hydrolase, truncated str1888 - 0.086 0.042 trehalose-6-phosphate hydrolase, truncated str1889 - 0.115 0.011 PTS trehalose-specific IIBC component, truncated str1890 - 0.073 0.049 PTS trehalose-specific IIBC component, truncated str1891 - 0.113 0.026 PTS trehalose-specific IIBC component, truncated str1894 - 0.299 0.200 0.453 hypothetical protein str1895 - 0.440 0.291 0.495 hypothetical protein str1896 - 0.389 0.477 hypothetical protein str1920 rpsH 3.832 4.871 0.393 0.348 30S ribosomal protein S8 str1924 rplN 4.578 6.740 0.383 0.330 50S ribosomal protein L14 str1926 rpmC 4.085 5.907 0.359 0.298 50S ribosomal protein L29 str1929 rplV 3.456 4.397 0.374 0.317 50S ribosomal protein L22 str1933 rplD 3.810 5.529 0.316 0.281 50S ribosomal protein L4 str1934 rplC 3.643 8.128 0.346 0.299 50S ribosomal protein L3 str1947 - 2.543 positive transcriptional regulator MutR family str1950 - 0.309 positive transcriptional regulator MutR family, truncated str1956 - 0.345 0.443 0.340 0.466 hypothetical protein str1959 - 0.415 0.213 0.395 hypothetical protein str1960 - 0.429 0.200 0.467 Holliday junction resolvase-like protein str1962 - 0.326 0.490 0.362 hypothetical protein
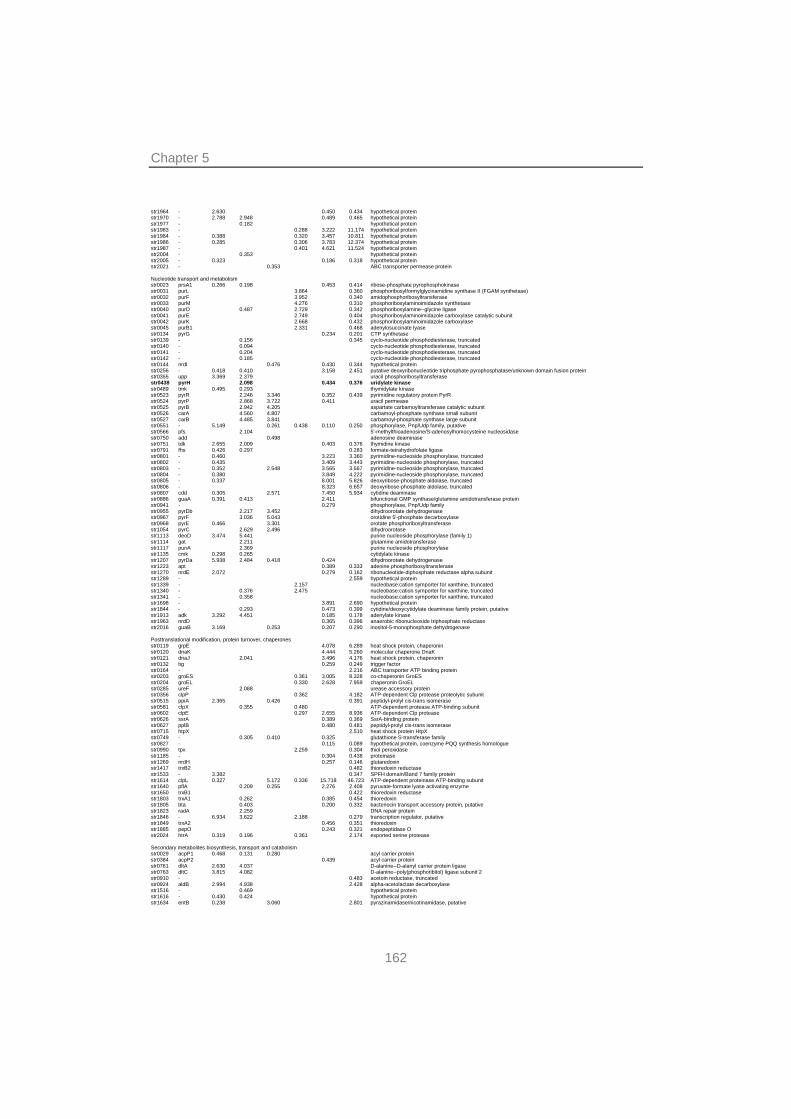
Chapter 5
162
str1964 - 2.630 0.450 0.434 hypothetical protein str1970 - 2.788 2.948 0.489 0.465 hypothetical protein str1977 - 0.182 hypothetical protein str1983 - 0.288 3.222 11.174 hypothetical protein str1984 - 0.388 0.320 3.457 10.811 hypothetical protein str1986 - 0.285 0.306 3.783 12.374 hypothetical protein str1987 - 0.401 4.621 11.524 hypothetical protein str2004 - 0.353 hypothetical protein str2005 - 0.323 0.186 0.318 hypothetical protein str2021 - 0.353 ABC transporter permease protein Nucleotide transport and metabolism str0023 prsA1 0.266 0.198 0.453 0.414 ribose-phosphate pyrophosphokinase str0031 purL 3.864 0.360 phosphoribosylformylglycinamidine synthase II (FGAM synthetase) str0032 purF 3.952 0.340 amidophosphoribosyltransferase str0033 purM 4.276 0.310 phosphoribosylaminoimidazole synthetase str0040 purD 0.487 2.729 0.342 phosphoribosylamine--glycine ligase str0041 purE 2.749 0.404 phosphoribosylaminoimidazole carboxylase catalytic subunit str0042 purK 2.668 0.432 phosphoribosylaminoimidazole carboxylase str0045 purB1 2.331 0.468 adenylosuccinate lyase str0134 pyrG 0.234 0.201 CTP synthetase str0139 - 0.156 0.345 cyclo-nucleotide phosphodiesterase, truncated str0140 - 0.094 cyclo-nucleotide phosphodiesterase, truncated str0141 - 0.204 cyclo-nucleotide phosphodiesterase, truncated str0142 - 0.185 cyclo-nucleotide phosphodiesterase, truncated str0144 nrdI 0.476 0.430 0.344 hypothetical protein str0256 - 0.418 0.410 3.158 2.451 putative deoxyribonucleotide triphosphate pyrophosphatase/unknown domain fusion protein str0355 upp 3.369 2.379 uracil phosphoribosyltransferase str0438 pyrH 2.098 0.434 0.376 uridylate kinase str0489 tmk 0.495 0.293 thymidylate kinase str0523 pyrR 2.246 3.346 0.352 0.439 pyrimidine regulatory protein PyrR str0524 pyrP 2.868 3.722 0.411 uracil permease str0525 pyrB 2.942 4.205 aspartate carbamoyltransferase catalytic subunit str0526 carA 4.560 4.807 carbamoyl-phosphate synthase small subunit str0527 carB 4.485 3.841 carbamoyl-phosphate synthase large subunit str0551 - 5.149 0.261 0.438 0.110 0.250 phosphorylase, Pnp/Udp family, putative str0566 pfs 2.104 5'-methylthioadenosine/S-adenosylhomocysteine nucleosidase str0750 add 0.498 adenosine deaminase str0751 tdk 2.655 2.009 0.403 0.376 thymidine kinase str0791 fhs 0.426 0.297 0.283 formate-tetrahydrofolate ligase str0801 - 0.460 3.223 3.360 pyrimidine-nucleoside phosphorylase, truncated str0802 - 0.435 3.409 3.443 pyrimidine-nucleoside phosphorylase, truncated str0803 - 0.352 2.548 3.565 3.567 pyrimidine-nucleoside phosphorylase, truncated str0804 - 0.380 3.849 4.222 pyrimidine-nucleoside phosphorylase, truncated str0805 - 0.337 8.001 5.826 deoxyribose-phosphate aldolase, truncated str0806 - 8.323 6.657 deoxyribose-phosphate aldolase, truncated str0807 cdd 0.305 2.571 7.450 5.934 cytidine deaminase str0886 guaA 0.391 0.413 2.411 bifunctional GMP synthase/glutamine amidotransferase protein str0941 - 0.279 phosphorylase, Pnp/Udp family str0955 pyrDb 2.217 3.452 dihydroorotate dehydrogenase str0967 pyrF 3.036 5.043 orotidine 5'-phosphate decarboxylase str0968 pyrE 0.466 3.301 orotate phosphoribosyltransferase str1054 pyrC 2.629 2.496 dihydroorotase str1113 deoD 3.474 5.441 purine nucleoside phosphorylase (family 1) str1114 gat 2.211 glutamine amidotransferase str1117 punA 2.369 purine nucleoside phosphorylase str1135 cmk 0.298 0.265 cytidylate kinase str1207 pyrDa 5.938 2.484 0.418 0.424 dihydroorotate dehydrogenase str1223 apt 0.389 0.333 adenine phosphoribosyltransferase str1270 nrdE 2.072 0.279 0.162 ribonucleotide-diphosphate reductase alpha subunit str1289 - 2.559 hypothetical protein str1339 - 2.157 nucleobase:cation symporter for xanthine, truncated str1340 - 0.376 2.475 nucleobase:cation symporter for xanthine, truncated str1341 - 0.358 nucleobase:cation symporter for xanthine, truncated str1698 - 3.891 2.690 hypothetical protein str1844 - 0.293 0.473 0.399 cytidine/deoxycytidylate deaminase family protein, putative str1913 adk 3.292 4.451 0.185 0.178 adenylate kinase str1963 nrdD 0.365 0.396 anaerobic ribonucleoside triphosphate reductase str2016 guaB 3.169 0.253 0.207 0.290 inositol-5-monophosphate dehydrogenase Posttranslational modification, protein turnover, chaperones str0119 grpE 4.078 6.289 heat shock protein, chaperonin str0120 dnaK 4.444 5.260 molecular chaperone DnaK str0121 dnaJ 2.041 3.496 4.176 heat shock protein, chaperonin str0132 tig 0.259 0.249 trigger factor str0164 - 2.216 ABC transporter ATP binding protein str0203 groES 0.361 3.005 8.328 co-chaperonin GroES str0204 groEL 0.330 2.628 7.959 chaperonin GroEL str0285 ureF 2.088 urease accessory protein str0356 clpP 0.362 4.182 ATP-dependent Clp protease proteolytic subunit str0515 ppiA 2.365 0.426 0.391 peptidyl-prolyl cis-trans isomerase str0581 clpX 0.355 0.480 ATP-dependent protease ATP-binding subunit str0602 clpE 0.297 2.655 8.936 ATP-dependent Clp protease str0626 ssrA 0.389 0.369 SsrA-binding protein str0627 pplB 0.480 0.481 peptidyl-prolyl cis-trans isomerase str0715 htpX 2.510 heat shock protein HtpX str0749 - 0.305 0.410 0.325 glutathione S-transferase family str0827 - 0.115 0.089 hypothetical protein, coenzyme PQQ synthesis homologue str0990 tpx 2.259 0.304 thiol peroxidase str1185 - 0.304 0.438 proteinase str1269 nrdH 0.257 0.146 glutaredoxin str1417 trxB2 0.482 thioredoxin reductase str1533 - 3.382 0.347 SPFH domain/Band 7 family protein str1614 clpL 0.327 5.172 0.336 15.718 46.723 ATP-dependent proteinase ATP-binding subunit str1640 pflA 0.209 0.255 2.276 2.408 pyruvate-formate lyase activating enzyme str1650 trxB1 0.422 thioredoxin reductase str1803 trxA1 0.262 0.385 0.454 thioredoxin str1805 bta 0.403 0.200 0.332 bacteriocin transport accessory protein, putative str1823 radA 2.259 DNA repair protein str1846 - 6.934 3.622 2.188 0.279 transcription regulator, putative str1849 trxA2 0.456 0.351 thioredoxin str1885 pepO 0.243 0.321 endopeptidase O str2024 htrA 0.319 0.196 0.361 2.174 exported serine protease Secondary metabolites biosynthesis, transport and catabolism str0029 acpP1 0.468 0.131 0.280 acyl carrier protein str0384 acpP2 0.439 acyl carrier protein str0761 dltA 2.630 4.037 D-alanine--D-alanyl carrier protein ligase str0763 dltC 3.815 4.082 D-alanine--poly(phosphoribitol) ligase subunit 2 str0910 - 0.483 acetoin reductase, truncated str0924 aldB 2.994 4.938 2.428 alpha-acetolactate decarboxylase str1516 - 0.469 hypothetical protein str1616 - 0.430 0.424 hypothetical protein str1634 entB 0.238 3.060 2.801 pyrazinamidase/nicotinamidase, putative
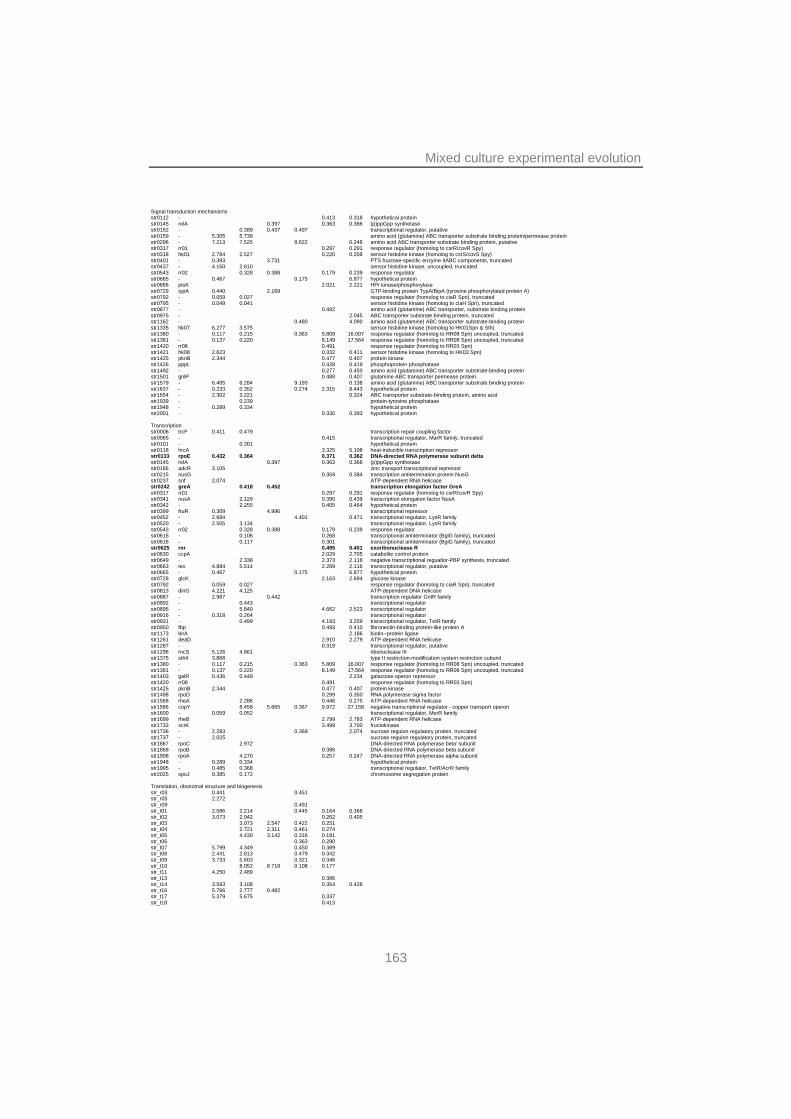
Mixed culture experimental evolution
163
Signal transduction mechanisms str0112 - 0.413 0.318 hypothetical protein str0145 relA 0.397 0.363 0.366 (p)ppGpp synthetase str0152 - 0.389 0.437 0.497 transcriptional regulator, putative str0159 - 5.305 5.739 amino acid (glutamine) ABC transporter substrate binding protein/permease protein str0296 - 7.213 7.525 8.622 0.248 amino acid ABC transporter substrate binding protein, putative str0317 rr01 0.297 0.291 response regulator (homolog to csrR/covR Spy) str0318 hk01 2.784 2.527 0.220 0.208 sensor histidine kinase (homolog to csrS/covS Spy) str0401 - 0.393 3.731 PTS fructose-specific enzyme IIABC components, truncated str0437 - 4.150 2.810 sensor histidine kinase, uncoupled, truncated str0543 rr02 0.328 0.388 0.179 0.239 response regulator str0665 - 0.467 0.175 6.877 hypothetical protein str0666 ptsK 2.021 2.221 HPr kinase/phosphorylase str0729 typA 0.440 2.169 GTP-binding protein TypA/BipA (tyrosine phosphorylated protein A) str0792 - 0.059 0.027 response regulator (homolog to ciaR Spn), truncated str0795 - 0.049 0.041 sensor histidine kinase (homolog to ciaH Spn), truncated str0877 - 0.492 amino acid (glutamine) ABC transporter, substrate binding protein str0975 - 2.045 ABC transporter substrate binding protein, truncated str1162 - 0.480 4.090 amino acid (glutamine) ABC transporter substrate-binding protein str1335 hk07 6.277 3.575 sensor histidine kinase (homolog to HK01Spn & Sth) str1380 - 0.117 0.215 0.363 5.809 16.007 response regulator (homolog to RR08 Spn) uncoupled, truncated str1381 - 0.137 0.220 8.149 17.564 response regulator (homolog to RR08 Spn) uncoupled, truncated str1420 rr08 0.491 response regulator (homolog to RR03 Spn) str1421 hk08 2.623 0.332 0.411 sensor histidine kinase (homolog to HK03 Spn) str1425 pknB 2.344 0.477 0.407 protein kinase str1426 pppL 0.428 0.419 phosphoprotein phosphatase str1492 - 0.277 0.450 amino acid (glutamine) ABC transporter substrate-binding protein str1501 gnlP 0.488 0.407 glutamine ABC transporter permease protein str1579 - 6.405 6.284 9.193 0.138 amino acid (glutamine) ABC transporter substrate binding protein str1637 - 0.233 0.352 0.274 2.315 8.443 hypothetical protein str1654 - 2.302 3.221 0.324 ABC transporter substrate-binding protein, amino acid str1939 - 0.239 protein-tyrosine phosphatase str1948 - 0.289 0.334 hypothetical protein str2001 - 0.330 0.393 hypothetical protein Transcription str0006 trcF 0.411 0.479 transcription repair coupling factor str0065 - 0.415 transcriptional regulator, MarR family, truncated str0101 - 0.301 hypothetical protein str0118 hrcA 3.325 5.108 heat-inducible transcription repressor str0133 rpoE 0.432 0.364 0.371 0.362 DNA-directed RNA polymerase subunit delta str0145 relA 0.397 0.363 0.366 (p)ppGpp synthetase str0185 adcR 3.105 zinc transport transcriptional repressor str0215 nusG 0.359 0.384 transcription antitermination protein NusG str0237 snf 2.074 ATP-dependent RNA helicase str0242 greA 0.418 0.452 transcription elongation factor GreA str0317 rr01 0.297 0.291 response regulator (homolog to csrR/covR Spy) str0341 nusA 2.129 0.390 0.439 transcription elongation factor NusA str0342 - 2.255 0.405 0.464 hypothetical protein str0399 fruR 0.309 4.996 transcriptional repressor str0452 - 2.684 4.401 0.471 transcriptional regulator, LysR family str0520 - 2.505 3.134 transcriptional regulator, LysR family str0543 rr02 0.328 0.388 0.179 0.239 response regulator str0615 - 0.106 0.268 transcriptional antiterminator (BglG family), truncated str0616 - 0.117 0.301 transcriptional antiterminator (BglG family), truncated str0625 rnr 0.495 0.401 exoribonuclease R str0630 ccpA 2.029 2.705 catabolite control protein str0649 - 2.338 2.373 2.118 negative transcriptional regualtor-PBP synthesis, truncated str0663 tex 4.884 5.514 2.289 2.116 transcriptional regulator, putative str0665 - 0.467 0.175 6.877 hypothetical protein str0728 glcK 2.163 2.694 glucose kinase str0792 - 0.059 0.027 response regulator (homolog to ciaR Spn), truncated str0813 dinG 4.221 4.125 ATP-dependent DNA helicase str0887 - 2.987 0.442 transcription regulator GntR family str0892 - 0.443 transcriptional regulator str0895 - 5.840 4.662 2.523 transcriptional regulator str0916 - 0.318 0.264 transcriptional regulator str0931 - 0.499 4.193 3.259 transcriptional regulator, TetR family str0950 fbp 0.493 0.410 fibronectin-binding protein-like protein A str1173 birA 2.186 biotin--protein ligase str1261 deaD 2.910 2.279 ATP-dependent RNA helicase str1287 - 0.318 transcriptional regulator, putative str1296 rncS 5.126 4.661 ribonuclease III str1375 sthII 3.868 type II restriction-modification system restriction subunit str1380 - 0.117 0.215 0.363 5.809 16.007 response regulator (homolog to RR08 Spn) uncoupled, truncated str1381 - 0.137 0.220 8.149 17.564 response regulator (homolog to RR08 Spn) uncoupled, truncated str1403 galR 0.436 0.449 2.234 galactose operon repressor str1420 rr08 0.491 response regulator (homolog to RR03 Spn) str1425 pknB 2.344 0.477 0.407 protein kinase str1488 rpoD 0.299 0.350 RNA polymerase sigma factor str1568 rheA 2.286 0.446 0.275 ATP-dependent RNA helicase str1586 copY 8.458 5.665 0.367 9.972 27.158 negative transcriptional regulator - copper transport operon str1600 - 0.059 0.052 transcriptional regulator, MerR family str1699 rheB 2.799 2.783 ATP-dependent RNA helicase str1733 scrK 3.499 3.700 fructokinase str1736 - 2.283 0.369 2.074 sucrose regulon regulatory protein, truncated str1737 - 2.025 sucrose regulon regulatory protein, truncated str1867 rpoC 2.972 DNA-directed RNA polymerase beta' subunit str1868 rpoB 0.386 DNA-directed RNA polymerase beta subunit str1908 rpoA 4.270 0.257 0.247 DNA-directed RNA polymerase alpha subunit str1948 - 0.289 0.334 hypothetical protein str1995 - 0.485 0.368 transcriptional regulator, TetR/AcrR family str2025 spoJ 0.385 0.172 chromosome segregation protein Translation, ribosomal structure and biogenesis str_r03 0.441 0.451 str_r05 2.272 str_r09 0.491 str_t01 2.086 2.214 0.445 0.164 0.368 str_t02 3.073 2.942 0.262 0.405 str_t03 3.073 2.547 0.422 0.251 str_t04 2.721 2.311 0.461 0.274 str_t05 4.430 3.142 0.316 0.181 str_t06 0.363 0.290 str_t07 5.799 4.349 0.450 0.389 str_t08 2.441 2.813 0.479 0.342 str_t09 3.733 5.603 0.321 0.346 str_t10 8.052 8.718 0.108 0.177 str_t11 4.250 2.489 str_t13 0.386 str_t14 3.593 3.108 0.354 0.428 str_t16 5.766 2.777 0.482 str_t17 5.379 5.675 0.337 str_t18 0.413
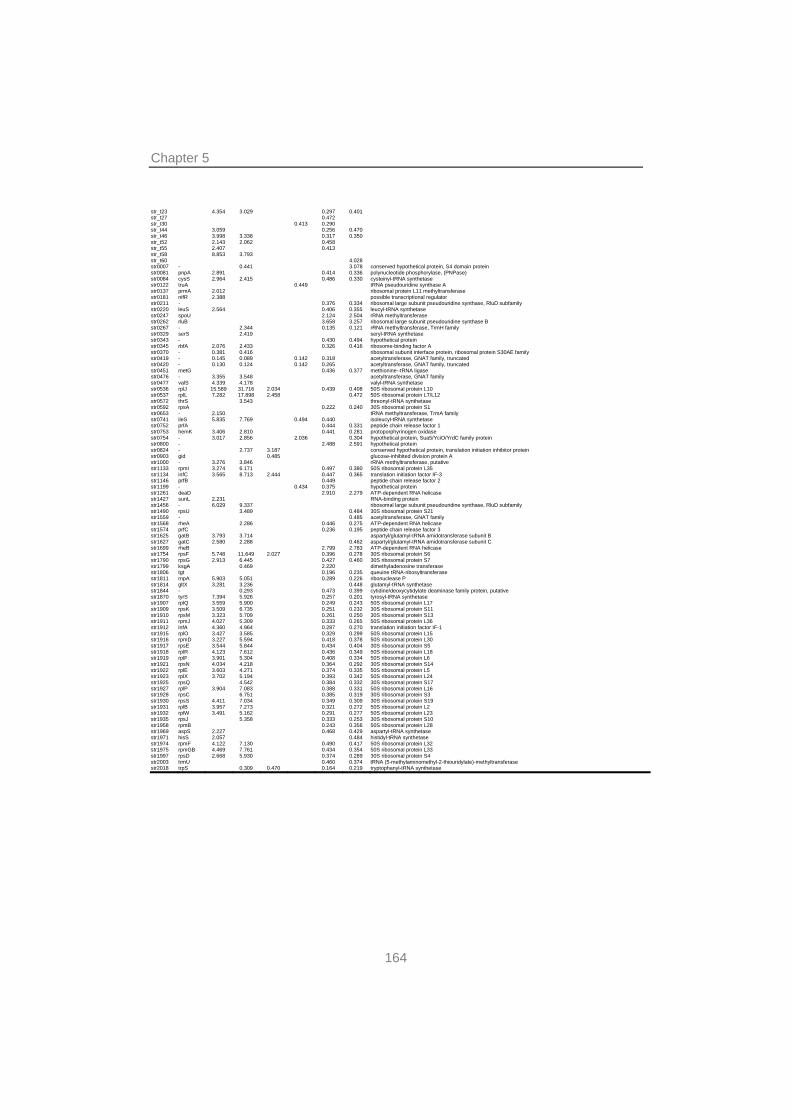
Chapter 5
164
str_t23 4.354 3.029 0.297 0.401 str_t27 0.472 str_t30 0.413 0.290 str_t44 3.059 0.256 0.470 str_t46 3.998 3.338 0.317 0.350 str_t52 2.143 2.062 0.458 str_t55 2.407 0.413 str_t58 8.853 3.793 str_t60 4.028 str0007 - 0.441 3.078 conserved hypothetical protein, S4 domain protein str0081 pnpA 2.891 0.414 0.336 polynucleotide phosphorylase, (PNPase) str0084 cysS 2.964 2.415 0.486 0.330 cysteinyl-tRNA synthetase str0122 truA 0.449 tRNA pseudouridine synthase A str0137 prmA 2.012 ribosomal protein L11 methyltransferase str0181 nifR 2.388 possible transcriptional regulator str0211 - 0.376 0.334 ribosomal large subunit pseudouridine synthase, RluD subfamily str0220 leuS 2.564 0.406 0.355 leucyl-tRNA synthetase str0247 spoU 2.124 2.504 rRNA methyltransferase str0262 rluB 3.658 3.257 ribosomal large subunit pseudouridine synthase B str0267 - 2.344 0.135 0.121 rRNA methyltransferase, TrmH family str0329 serS 2.419 seryl-tRNA synthetase str0343 - 0.430 0.494 hypothetical protein str0345 rbfA 2.076 2.433 0.326 0.416 ribosome-binding factor A str0370 - 0.381 0.416 ribosomal subunit interface protein, ribosomal protein S30AE family str0419 - 0.145 0.089 0.142 0.318 acetyltransferase, GNAT family, truncated str0420 - 0.130 0.124 0.142 0.265 acetyltransferase, GNAT family, truncated str0451 metG 0.436 0.377 methionine--tRNA ligase str0476 - 3.355 3.548 acetyltransferase, GNAT family str0477 valS 4.339 4.178 valyl-tRNA synthetase str0536 rplJ 15.589 31.716 2.034 0.439 0.408 50S ribosomal protein L10 str0537 rplL 7.282 17.898 2.458 0.472 50S ribosomal protein L7/L12 str0572 thrS 3.543 threonyl-tRNA synthetase str0592 rpsA 0.222 0.240 30S ribosomal protein S1 str0653 - 2.150 tRNA methyltransferase, TrmA family str0741 ileS 5.835 7.769 0.494 0.440 isoleucyl-tRNA synthetase str0752 prfA 0.444 0.331 peptide chain release factor 1 str0753 hemK 3.406 2.810 0.441 0.281 protoporphyrinogen oxidase str0754 - 3.017 2.856 2.036 0.304 hypothetical protein, Sua5/YciO/YrdC family protein str0800 - 2.488 2.591 hypothetical protein str0824 - 2.737 3.187 conserved hypothetical protein, translation initiation inhibitor protein str0903 gid 0.485 glucose-inhibited division protein A str1000 - 3.276 3.846 rRNA methyltransferase, putative str1133 rpmI 3.274 6.171 0.497 0.380 50S ribosomal protein L35 str1134 infC 3.565 8.713 2.444 0.447 0.365 translation initiation factor IF-3 str1146 prfB 0.449 peptide chain release factor 2 str1199 - 0.434 0.375 hypothetical protein str1261 deaD 2.910 2.279 ATP-dependent RNA helicase str1427 sunL 2.231 RNA-binding protein str1456 - 6.029 9.337 ribosomal large subunit pseudouridine synthase, RluD subfamily str1490 rpsU 3.489 0.484 30S ribosomal protein S21 str1559 - 0.485 acetyltransferase, GNAT family str1568 rheA 2.286 0.446 0.275 ATP-dependent RNA helicase str1574 prfC 0.236 0.195 peptide chain release factor 3 str1625 gatB 3.793 3.714 aspartyl/glutamyl-tRNA amidotransferase subunit B str1627 gatC 2.580 2.288 0.462 aspartyl/glutamyl-tRNA amidotransferase subunit C str1699 rheB 2.799 2.783 ATP-dependent RNA helicase str1754 rpsF 5.748 11.649 2.027 0.396 0.278 30S ribosomal protein S6 str1790 rpsG 2.913 6.445 0.427 0.460 30S ribosomal protein S7 str1799 ksgA 0.469 2.220 dimethyladenosine transferase str1806 tgt 0.196 0.235 queuine tRNA-ribosyltransferase str1811 rnpA 5.903 5.051 0.289 0.226 ribonuclease P str1814 gltX 3.281 3.236 0.448 glutamyl-tRNA synthetase str1844 - 0.293 0.473 0.399 cytidine/deoxycytidylate deaminase family protein, putative str1870 tyrS 7.394 5.926 0.257 0.201 tyrosyl-tRNA synthetase str1907 rplQ 3.559 5.900 0.249 0.243 50S ribosomal protein L17 str1909 rpsK 3.509 6.735 0.251 0.232 30S ribosomal protein S11 str1910 rpsM 3.323 5.709 0.261 0.250 30S ribosomal protein S13 str1911 rpmJ 4.027 5.309 0.333 0.265 50S ribosomal protein L36 str1912 infA 4.360 4.964 0.287 0.270 translation initiation factor IF-1 str1915 rplO 3.427 3.585 0.329 0.299 50S ribosomal protein L15 str1916 rpmD 3.227 5.594 0.418 0.378 50S ribosomal protein L30 str1917 rpsE 3.544 5.844 0.434 0.404 30S ribosomal protein S5 str1918 rplR 4.123 7.612 0.436 0.349 50S ribosomal protein L18 str1919 rplF 3.901 5.304 0.408 0.334 50S ribosomal protein L6 str1921 rpsN 4.034 4.218 0.364 0.292 30S ribosomal protein S14 str1922 rplE 3.603 4.271 0.374 0.335 50S ribosomal protein L5 str1923 rplX 3.702 5.194 0.393 0.342 50S ribosomal protein L24 str1925 rpsQ 4.542 0.384 0.332 30S ribosomal protein S17 str1927 rplP 3.904 7.083 0.388 0.331 50S ribosomal protein L16 str1928 rpsC 6.751 0.385 0.319 30S ribosomal protein S3 str1930 rpsS 4.411 7.034 0.349 0.309 30S ribosomal protein S19 str1931 rplB 3.957 7.273 0.321 0.272 50S ribosomal protein L2 str1932 rplW 3.491 5.162 0.291 0.277 50S ribosomal protein L23 str1935 rpsJ 5.358 0.333 0.253 30S ribosomal protein S10 str1958 rpmB 0.243 0.356 50S ribosomal protein L28 str1969 aspS 2.227 0.468 0.429 aspartyl-tRNA synthetase str1971 hisS 2.057 0.484 histidyl-tRNA synthetase str1974 rpmF 4.122 7.130 0.490 0.417 50S ribosomal protein L32 str1975 rpmGB 4.469 7.761 0.434 0.354 50S ribosomal protein L33 str1997 rpsD 2.668 5.930 0.374 0.289 30S ribosomal protein S4 str2003 trmU 0.460 0.374 tRNA (5-methylaminomethyl-2-thiouridylate)-methyltransferase str2018 trpS 0.309 0.470 0.164 0.219 tryptophanyl-tRNA synthetase
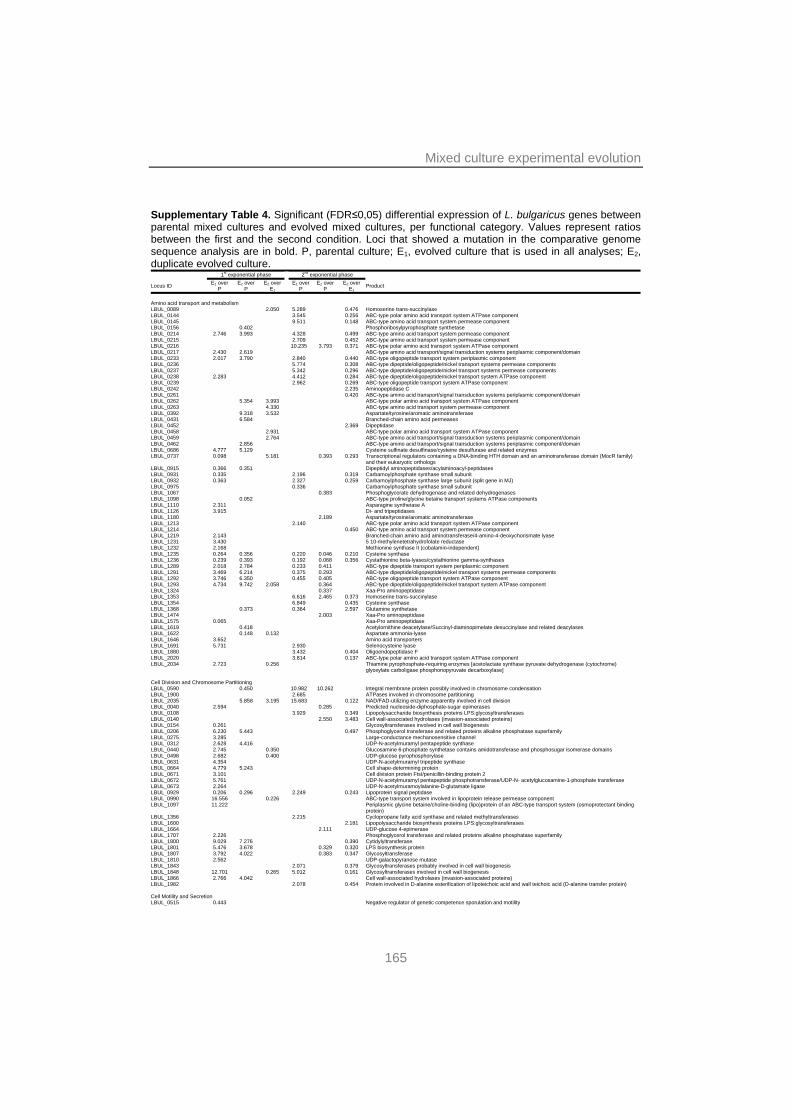
Mixed culture experimental evolution
165
Supplementary Table 4. Significant (FDR≤0,05) differential expression of L. bulgaricus genes between parental mixed cultures and evolved mixed cultures, per functional category. Values represent ratios between the first and the second condition. Loci that showed a mutation in the comparative genome sequence analysis are in bold. P, parental culture; E1, evolved culture that is used in all analyses; E2, duplicate evolved culture. 1st exponential phase 2nd exponential phase
Locus ID E1 over P
E2 over P
E2 over E1
E1 over P
E2 over P
E2 over E1
Product
Amino acid transport and metabolism LBUL_0089 2.050 5.289 0.476 Homoserine trans-succinylase LBUL_0144 3.545 0.256 ABC-type polar amino acid transport system ATPase component LBUL_0145 9.511 0.148 ABC-type amino acid transport system permease component LBUL_0156 0.402 Phosphoribosylpyrophosphate synthetase LBUL_0214 2.746 3.993 4.328 0.499 ABC-type amino acid transport system permease component LBUL_0215 2.709 0.452 ABC-type amino acid transport system permease component LBUL_0216 10.235 3.793 0.371 ABC-type polar amino acid transport system ATPase component LBUL_0217 2.430 2.619 ABC-type amino acid transport/signal transduction systems periplasmic component/domain LBUL_0233 2.017 3.790 2.840 0.440 ABC-type oligopeptide transport system periplasmic component LBUL_0236 5.774 0.308 ABC-type dipeptide/oligopeptide/nickel transport systems permease components LBUL_0237 5.342 0.296 ABC-type dipeptide/oligopeptide/nickel transport systems permease components LBUL_0238 2.283 4.412 0.284 ABC-type dipeptide/oligopeptide/nickel transport system ATPase component LBUL_0239 2.962 0.269 ABC-type oligopeptide transport system ATPase component LBUL_0242 2.235 Aminopeptidase C LBUL_0261 0.420 ABC-type amino acid transport/signal transduction systems periplasmic component/domain LBUL_0262 5.354 3.993 ABC-type polar amino acid transport system ATPase component LBUL_0263 4.330 ABC-type amino acid transport system permease component LBUL_0392 9.318 3.532 Aspartate/tyrosine/aromatic aminotransferase LBUL_0431 6.584 Branched-chain amino acid permeases LBUL_0452 2.369 Dipeptidase LBUL_0458 2.931 ABC-type polar amino acid transport system ATPase component LBUL_0459 2.764 ABC-type amino acid transport/signal transduction systems periplasmic component/domain LBUL_0462 2.856 ABC-type amino acid transport/signal transduction systems periplasmic component/domain LBUL_0686 4.777 5.129 Cysteine sulfinate desulfinase/cysteine desulfurase and related enzymes LBUL_0737 0.098 5.181 0.393 0.293 Transcriptional regulators containing a DNA-binding HTH domain and an aminotransferase domain (MocR family)
and their eukaryotic orthologs LBUL_0915 0.366 0.351 Dipeptidyl aminopeptidases/acylaminoacyl-peptidases LBUL_0931 0.335 2.196 0.319 Carbamoylphosphate synthase small subunit LBUL_0932 0.363 2.327 0.259 Carbamoylphosphate synthase large subunit (split gene in MJ) LBUL_0975 0.336 Carbamoylphosphate synthase small subunit LBUL_1067 0.383 Phosphoglycerate dehydrogenase and related dehydrogenases LBUL_1098 0.052 ABC-type proline/glycine betaine transport systems ATPase components LBUL_1110 2.311 Asparagine synthetase A LBUL_1126 3.915 Di- and tripeptidases LBUL_1180 2.189 Aspartate/tyrosine/aromatic aminotransferase LBUL_1213 2.140 ABC-type polar amino acid transport system ATPase component LBUL_1214 0.450 ABC-type amino acid transport system permease component LBUL_1219 2.143 Branched-chain amino acid aminotransferase/4-amino-4-deoxychorismate lyase LBUL_1231 3.430 5 10-methylenetetrahydrofolate reductase LBUL_1232 2.168 Methionine synthase II (cobalamin-independent) LBUL_1235 0.264 0.356 0.220 0.046 0.210 Cysteine synthase LBUL_1236 0.239 0.393 0.192 0.068 0.356 Cystathionine beta-lyases/cystathionine gamma-synthases LBUL_1289 2.018 2.784 0.233 0.411 ABC-type dipeptide transport system periplasmic component LBUL_1291 3.469 6.214 0.375 0.293 ABC-type dipeptide/oligopeptide/nickel transport systems permease components LBUL_1292 3.746 6.350 0.455 0.405 ABC-type oligopeptide transport system ATPase component LBUL_1293 4.734 9.742 2.058 0.364 ABC-type dipeptide/oligopeptide/nickel transport system ATPase component LBUL_1324 0.337 Xaa-Pro aminopeptidase LBUL_1353 6.616 2.465 0.373 Homoserine trans-succinylase LBUL_1354 6.849 0.435 Cysteine synthase LBUL_1368 0.373 0.364 2.597 Glutamine synthetase LBUL_1474 2.003 Xaa-Pro aminopeptidase LBUL_1575 0.065 Xaa-Pro aminopeptidase LBUL_1619 0.418 Acetylornithine deacetylase/Succinyl-diaminopimelate desuccinylase and related deacylases LBUL_1622 0.148 0.132 Aspartate ammonia-lyase LBUL_1646 3.652 Amino acid transporters LBUL_1691 5.731 2.930 Selenocysteine lyase LBUL_1880 3.432 0.404 Oligoendopeptidase F LBUL_2020 3.814 0.137 ABC-type polar amino acid transport system ATPase component LBUL_2034 2.723 0.256 Thiamine pyrophosphate-requiring enzymes [acetolactate synthase pyruvate dehydrogenase (cytochrome)
glyoxylate carboligase phosphonopyruvate decarboxylase] Cell Division and Chromosome Partitioning LBUL_0590 0.450 10.982 10.262 Integral membrane protein possibly involved in chromosome condensation LBUL_1900 2.685 ATPases involved in chromosome partitioning LBUL_2035 5.858 3.195 15.683 0.122 NAD/FAD-utilizing enzyme apparently involved in cell division LBUL_0040 2.594 0.285 Predicted nucleoside-diphosphate-sugar epimerases LBUL_0108 3.929 0.349 Lipopolysaccharide biosynthesis proteins LPS:glycosyltransferases LBUL_0140 2.550 3.483 Cell wall-associated hydrolases (invasion-associated proteins) LBUL_0154 0.261 Glycosyltransferases involved in cell wall biogenesis LBUL_0206 6.230 5.443 0.497 Phosphoglycerol transferase and related proteins alkaline phosphatase superfamily LBUL_0275 3.285 Large-conductance mechanosensitive channel LBUL_0312 2.628 4.416 UDP-N-acetylmuramyl pentapeptide synthase LBUL_0440 2.745 0.350 Glucosamine 6-phosphate synthetase contains amidotransferase and phosphosugar isomerase domains LBUL_0498 2.682 0.400 UDP-glucose pyrophosphorylase LBUL_0631 4.354 UDP-N-acetylmuramyl tripeptide synthase LBUL_0664 4.779 5.243 Cell shape-determining protein LBUL_0671 3.101 Cell division protein FtsI/penicillin-binding protein 2 LBUL_0672 5.761 UDP-N-acetylmuramyl pentapeptide phosphotransferase/UDP-N- acetylglucosamine-1-phosphate transferase LBUL_0673 2.264 UDP-N-acetylmuramoylalanine-D-glutamate ligase LBUL_0929 0.206 0.296 2.249 0.243 Lipoprotein signal peptidase LBUL_0990 16.556 0.226 ABC-type transport system involved in lipoprotein release permease component LBUL_1097 11.222 Periplasmic glycine betaine/choline-binding (lipo)protein of an ABC-type transport system (osmoprotectant binding
protein) LBUL_1356 2.215 Cyclopropane fatty acid synthase and related methyltransferases LBUL_1600 2.181 Lipopolysaccharide biosynthesis proteins LPS:glycosyltransferases LBUL_1664 2.111 UDP-glucose 4-epimerase LBUL_1707 2.226 Phosphoglycerol transferase and related proteins alkaline phosphatase superfamily LBUL_1800 9.029 7.276 0.390 Cytidylyltransferase LBUL_1801 5.476 3.678 0.329 0.320 LPS biosynthesis protein LBUL_1807 3.792 4.022 0.383 0.347 Glycosyltransferase LBUL_1810 2.562 UDP-galactopyranose mutase LBUL_1843 2.071 0.379 Glycosyltransferases probably involved in cell wall biogenesis LBUL_1848 12.701 0.265 5.012 0.161 Glycosyltransferases involved in cell wall biogenesis LBUL_1866 2.766 4.042 Cell wall-associated hydrolases (invasion-associated proteins) LBUL_1982 2.078 0.454 Protein involved in D-alanine esterification of lipoteichoic acid and wall teichoic acid (D-alanine transfer protein) Cell Motility and Secretion LBUL_0515 0.443 Negative regulator of genetic competence sporulation and motility
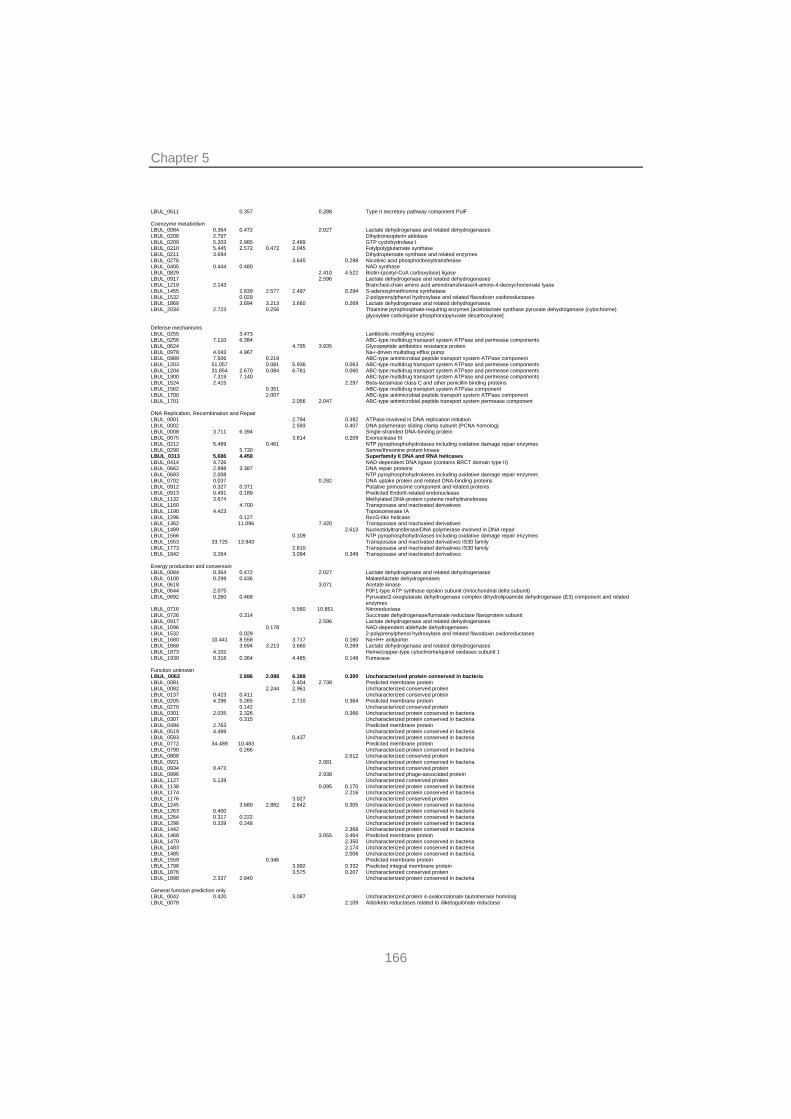
Chapter 5
166
LBUL_0611 0.357 0.288 Type II secretory pathway component PulF Coenzyme metabolism LBUL_0084 0.364 0.472 2.027 Lactate dehydrogenase and related dehydrogenases LBUL_0208 2.797 Dihydroneopterin aldolase LBUL_0209 5.203 2.985 2.489 GTP cyclohydrolase I LBUL_0210 5.445 2.572 0.472 2.045 Folylpolyglutamate synthase LBUL_0211 3.694 Dihydropteroate synthase and related enzymes LBUL_0276 3.645 0.298 Nicotinic acid phosphoribosyltransferase LBUL_0405 0.444 0.480 NAD synthase LBUL_0829 2.410 4.522 Biotin-(acetyl-CoA carboxylase) ligase LBUL_0917 2.596 Lactate dehydrogenase and related dehydrogenases LBUL_1219 2.143 Branched-chain amino acid aminotransferase/4-amino-4-deoxychorismate lyase LBUL_1455 2.839 2.577 2.497 0.294 S-adenosylmethionine synthetase LBUL_1532 0.029 2-polyprenylphenol hydroxylase and related flavodoxin oxidoreductases LBUL_1868 3.694 3.213 3.660 0.269 Lactate dehydrogenase and related dehydrogenases LBUL_2034 2.723 0.256 Thiamine pyrophosphate-requiring enzymes [acetolactate synthase pyruvate dehydrogenase (cytochrome)
glyoxylate carboligase phosphonopyruvate decarboxylase] Defense mechanisms LBUL_0255 3.473 Lantibiotic modifying enzyme LBUL_0256 7.110 6.384 ABC-type multidrug transport system ATPase and permease components LBUL_0624 4.795 3.935 Glycopeptide antibiotics resistance protein LBUL_0978 4.043 4.967 Na+-driven multidrug efflux pump LBUL_0989 7.506 0.219 ABC-type antimicrobial peptide transport system ATPase component LBUL_1203 51.057 0.081 5.936 0.063 ABC-type multidrug transport system ATPase and permease components LBUL_1204 31.854 2.670 0.084 6.781 0.060 ABC-type multidrug transport system ATPase and permease components LBUL_1300 7.319 7.140 ABC-type multidrug transport system ATPase and permease components LBUL_1524 2.415 2.297 Beta-lactamase class C and other penicillin binding proteins LBUL_1562 0.351 ABC-type multidrug transport system ATPase component LBUL_1700 2.007 ABC-type antimicrobial peptide transport system ATPase component LBUL_1701 2.056 2.047 ABC-type antimicrobial peptide transport system permease component DNA Replication, Recombination and Repair LBUL_0001 2.794 0.392 ATPase involved in DNA replication initiation LBUL_0002 2.593 0.407 DNA polymerase sliding clamp subunit (PCNA homolog) LBUL_0008 3.711 6.394 Single-stranded DNA-binding protein LBUL_0075 3.814 0.209 Exonuclease III LBUL_0212 5.489 0.461 NTP pyrophosphohydrolases including oxidative damage repair enzymes LBUL_0290 5.730 Serine/threonine protein kinase LBUL_0313 5.686 4.458 Superfamily II DNA and RNA helicases LBUL_0414 4.726 NAD-dependent DNA ligase (contains BRCT domain type II) LBUL_0662 2.998 3.387 DNA repair proteins LBUL_0683 2.008 NTP pyrophosphohydrolases including oxidative damage repair enzymes LBUL_0702 0.037 0.282 DNA uptake protein and related DNA-binding proteins LBUL_0912 0.327 0.371 Putative primosome component and related proteins LBUL_0913 0.491 0.189 Predicted EndoIII-related endonuclease LBUL_1132 3.674 Methylated DNA-protein cysteine methyltransferase LBUL_1160 4.700 Transposase and inactivated derivatives LBUL_1190 4.423 Topoisomerase IA LBUL_1296 0.127 RecG-like helicase LBUL_1362 11.096 7.420 Transposase and inactivated derivatives LBUL_1489 2.613 Nucleotidyltransferase/DNA polymerase involved in DNA repair LBUL_1566 0.109 NTP pyrophosphohydrolases including oxidative damage repair enzymes LBUL_1653 33.725 13.943 Transposase and inactivated derivatives IS30 family LBUL_1773 2.810 Transposase and inactivated derivatives IS30 family LBUL_1842 3.264 3.094 0.349 Transposase and inactivated derivatives Energy production and conversion LBUL_0084 0.364 0.472 2.027 Lactate dehydrogenase and related dehydrogenases LBUL_0100 0.299 0.436 Malate/lactate dehydrogenases LBUL_0618 3.071 Acetate kinase LBUL_0644 2.075 F0F1-type ATP synthase epsilon subunit (mitochondrial delta subunit) LBUL_0692 0.260 0.468 Pyruvate/2-oxoglutarate dehydrogenase complex dihydrolipoamide dehydrogenase (E3) component and related
enzymes LBUL_0716 5.560 10.851 Nitroreductase LBUL_0726 0.314 Succinate dehydrogenase/fumarate reductase flavoprotein subunit LBUL_0917 2.596 Lactate dehydrogenase and related dehydrogenases LBUL_1096 0.178 NAD-dependent aldehyde dehydrogenases LBUL_1532 0.029 2-polyprenylphenol hydroxylase and related flavodoxin oxidoreductases LBUL_1680 10.441 8.558 3.717 0.160 Na+/H+ antiporter LBUL_1868 3.694 3.213 3.660 0.269 Lactate dehydrogenase and related dehydrogenases LBUL_1873 4.102 Heme/copper-type cytochrome/quinol oxidases subunit 1 LBUL_1930 0.316 0.364 4.485 0.148 Fumarase Function unknown LBUL_0063 2.896 2.088 6.389 0.300 Uncharacterized protein conserved in bacteria LBUL_0081 5.404 2.738 Predicted membrane protein LBUL_0082 2.244 2.961 Uncharacterized conserved protein LBUL_0137 0.423 0.411 Uncharacterized conserved protein LBUL_0205 4.296 5.265 2.710 0.364 Predicted membrane protein LBUL_0270 0.142 Uncharacterized conserved protein LBUL_0301 2.035 2.326 0.366 Uncharacterized protein conserved in bacteria LBUL_0307 0.315 Uncharacterized protein conserved in bacteria LBUL_0494 2.763 Predicted membrane protein LBUL_0519 4.499 Uncharacterized protein conserved in bacteria LBUL_0583 0.437 Uncharacterized protein conserved in bacteria LBUL_0772 34.489 10.483 Predicted membrane protein LBUL_0790 0.266 Uncharacterized protein conserved in bacteria LBUL_0808 2.612 Uncharacterized conserved protein LBUL_0921 2.081 Uncharacterized protein conserved in bacteria LBUL_0934 0.473 Uncharacterized conserved protein LBUL_0996 2.938 Uncharacterized phage-associated protein LBUL_1127 5.139 Uncharacterized conserved protein LBUL_1138 0.095 0.170 Uncharacterized protein conserved in bacteria LBUL_1174 2.216 Uncharacterized protein conserved in bacteria LBUL_1176 3.027 Uncharacterized conserved protein LBUL_1245 3.680 2.882 2.842 0.305 Uncharacterized protein conserved in bacteria LBUL_1263 0.400 Uncharacterized protein conserved in bacteria LBUL_1264 0.317 0.222 Uncharacterized protein conserved in bacteria LBUL_1298 0.339 0.248 Uncharacterized protein conserved in bacteria LBUL_1442 2.368 Uncharacterized protein conserved in bacteria LBUL_1468 3.055 3.464 Predicted membrane protein LBUL_1470 2.350 Uncharacterized protein conserved in bacteria LBUL_1483 2.174 Uncharacterized protein conserved in bacteria LBUL_1485 2.006 Uncharacterized protein conserved in bacteria LBUL_1559 0.346 Predicted membrane protein LBUL_1798 3.992 0.332 Predicted integral membrane protein LBUL_1876 3.575 0.207 Uncharacterized conserved protein LBUL_1898 2.337 2.840 Uncharacterized protein conserved in bacteria General function prediction only LBUL_0042 0.420 3.087 Uncharacterized protein 4-oxalocrotonate tautomerase homolog LBUL_0078 2.109 Aldo/keto reductases related to diketogulonate reductase
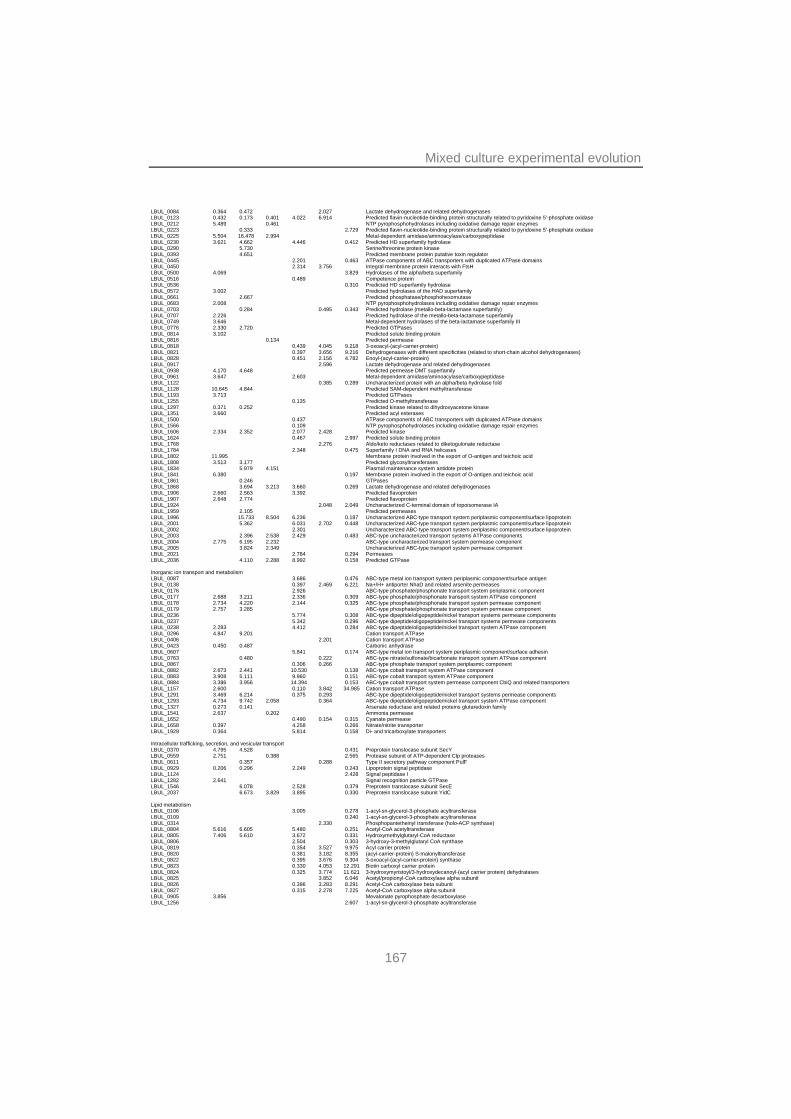
Mixed culture experimental evolution
167
LBUL_0084 0.364 0.472 2.027 Lactate dehydrogenase and related dehydrogenases LBUL_0123 0.432 0.173 0.401 4.022 6.914 Predicted flavin-nucleotide-binding protein structurally related to pyridoxine 5'-phosphate oxidase LBUL_0212 5.489 0.461 NTP pyrophosphohydrolases including oxidative damage repair enzymes LBUL_0223 0.333 2.729 Predicted flavin-nucleotide-binding protein structurally related to pyridoxine 5'-phosphate oxidase LBUL_0225 5.504 16.478 2.994 Metal-dependent amidase/aminoacylase/carboxypeptidase LBUL_0230 3.621 4.662 4.446 0.412 Predicted HD superfamily hydrolase LBUL_0290 5.730 Serine/threonine protein kinase LBUL_0393 4.651 Predicted membrane protein putative toxin regulator LBUL_0445 2.201 0.463 ATPase components of ABC transporters with duplicated ATPase domains LBUL_0450 2.314 3.756 Integral membrane protein interacts with FtsH LBUL_0500 4.069 3.829 Hydrolases of the alpha/beta superfamily LBUL_0516 0.489 Competence protein LBUL_0536 0.310 Predicted HD superfamily hydrolase LBUL_0572 3.002 Predicted hydrolases of the HAD superfamily LBUL_0661 2.667 Predicted phosphatase/phosphohexomutase LBUL_0683 2.008 NTP pyrophosphohydrolases including oxidative damage repair enzymes LBUL_0703 0.284 0.495 0.343 Predicted hydrolase (metallo-beta-lactamase superfamily) LBUL_0707 2.226 Predicted hydrolase of the metallo-beta-lactamase superfamily LBUL_0749 3.646 Metal-dependent hydrolases of the beta-lactamase superfamily III LBUL_0776 2.330 2.720 Predicted GTPases LBUL_0814 3.102 Predicted solute binding protein LBUL_0816 0.134 Predicted permease LBUL_0818 0.439 4.045 9.218 3-oxoacyl-(acyl-carrier-protein) LBUL_0821 0.397 3.656 9.216 Dehydrogenases with different specificities (related to short-chain alcohol dehydrogenases) LBUL_0828 0.451 2.156 4.782 Enoyl-(acyl-carrier-protein) LBUL_0917 2.596 Lactate dehydrogenase and related dehydrogenases LBUL_0938 4.170 4.648 Predicted permease DMT superfamily LBUL_0961 3.647 2.603 Metal-dependent amidase/aminoacylase/carboxypeptidase LBUL_1122 0.385 0.289 Uncharacterized protein with an alpha/beta hydrolase fold LBUL_1128 10.645 4.844 Predicted SAM-dependent methyltransferase LBUL_1193 3.713 Predicted GTPases LBUL_1255 0.135 Predicted O-methyltransferase LBUL_1297 0.371 0.252 Predicted kinase related to dihydroxyacetone kinase LBUL_1351 3.660 Predicted acyl esterases LBUL_1500 0.437 ATPase components of ABC transporters with duplicated ATPase domains LBUL_1566 0.109 NTP pyrophosphohydrolases including oxidative damage repair enzymes LBUL_1606 2.334 2.352 2.077 2.428 Predicted kinase LBUL_1624 0.467 2.997 Predicted solute binding protein LBUL_1768 2.276 Aldo/keto reductases related to diketogulonate reductase LBUL_1784 2.348 0.475 Superfamily I DNA and RNA helicases LBUL_1802 11.995 Membrane protein involved in the export of O-antigen and teichoic acid LBUL_1808 3.513 3.177 Predicted glycosyltransferases LBUL_1834 5.979 4.151 Plasmid maintenance system antidote protein LBUL_1841 6.380 0.197 Membrane protein involved in the export of O-antigen and teichoic acid LBUL_1861 0.246 GTPases LBUL_1868 3.694 3.213 3.660 0.269 Lactate dehydrogenase and related dehydrogenases LBUL_1906 2.660 2.563 3.392 Predicted flavoprotein LBUL_1907 2.648 2.774 Predicted flavoprotein LBUL_1924 2.048 2.049 Uncharacterized C-terminal domain of topoisomerase IA LBUL_1959 2.105 Predicted permeases LBUL_1996 15.733 8.504 6.236 0.187 Uncharacterized ABC-type transport system periplasmic component/surface lipoprotein LBUL_2001 5.362 6.031 2.702 0.448 Uncharacterized ABC-type transport system periplasmic component/surface lipoprotein LBUL_2002 2.301 Uncharacterized ABC-type transport system periplasmic component/surface lipoprotein LBUL_2003 2.396 2.538 2.429 0.483 ABC-type uncharacterized transport systems ATPase components LBUL_2004 2.775 6.195 2.232 ABC-type uncharacterized transport system permease component LBUL_2005 3.824 2.349 Uncharacterized ABC-type transport system permease component LBUL_2021 2.784 0.294 Permeases LBUL_2036 4.110 2.288 8.992 0.158 Predicted GTPase Inorganic ion transport and metabolism LBUL_0087 3.686 0.476 ABC-type metal ion transport system periplasmic component/surface antigen LBUL_0138 0.397 2.469 6.221 Na+/H+ antiporter NhaD and related arsenite permeases LBUL_0176 2.926 ABC-type phosphate/phosphonate transport system periplasmic component LBUL_0177 2.688 3.211 2.336 0.309 ABC-type phosphate/phosphonate transport system ATPase component LBUL_0178 2.734 4.220 2.144 0.325 ABC-type phosphate/phosphonate transport system permease component LBUL_0179 2.757 3.285 ABC-type phosphate/phosphonate transport system permease component LBUL_0236 5.774 0.308 ABC-type dipeptide/oligopeptide/nickel transport systems permease components LBUL_0237 5.342 0.296 ABC-type dipeptide/oligopeptide/nickel transport systems permease components LBUL_0238 2.283 4.412 0.284 ABC-type dipeptide/oligopeptide/nickel transport system ATPase component LBUL_0296 4.847 9.201 Cation transport ATPase LBUL_0406 2.201 Cation transport ATPase LBUL_0423 0.450 0.487 Carbonic anhydrase LBUL_0607 5.841 0.174 ABC-type metal ion transport system periplasmic component/surface adhesin LBUL_0763 0.480 0.222 ABC-type nitrate/sulfonate/bicarbonate transport system ATPase component LBUL_0867 0.306 0.266 ABC-type phosphate transport system periplasmic component LBUL_0882 2.673 2.441 10.530 0.138 ABC-type cobalt transport system ATPase component LBUL_0883 3.908 5.111 9.960 0.151 ABC-type cobalt transport system ATPase component LBUL_0884 3.386 3.956 14.394 0.153 ABC-type cobalt transport system permease component CbiQ and related transporters LBUL_1157 2.600 0.110 3.842 34.985 Cation transport ATPase LBUL_1291 3.469 6.214 0.375 0.293 ABC-type dipeptide/oligopeptide/nickel transport systems permease components LBUL_1293 4.734 9.742 2.058 0.364 ABC-type dipeptide/oligopeptide/nickel transport system ATPase component LBUL_1327 0.273 0.141 Arsenate reductase and related proteins glutaredoxin family LBUL_1541 2.637 0.202 Ammonia permease LBUL_1652 0.490 0.154 0.315 Cyanate permease LBUL_1658 0.397 4.258 0.266 Nitrate/nitrite transporter LBUL_1929 0.364 5.814 0.158 Di- and tricarboxylate transporters Intracellular trafficking, secretion, and vesicular transport LBUL_0370 4.795 4.528 0.431 Preprotein translocase subunit SecY LBUL_0559 2.751 0.388 2.565 Protease subunit of ATP-dependent Clp proteases LBUL_0611 0.357 0.288 Type II secretory pathway component PulF LBUL_0929 0.206 0.296 2.249 0.243 Lipoprotein signal peptidase LBUL_1124 2.428 Signal peptidase I LBUL_1282 2.641 Signal recognition particle GTPase LBUL_1546 6.078 2.528 0.379 Preprotein translocase subunit SecE LBUL_2037 6.673 3.829 3.895 0.330 Preprotein translocase subunit YidC Lipid metabolism LBUL_0106 3.005 0.278 1-acyl-sn-glycerol-3-phosphate acyltransferase LBUL_0109 0.240 1-acyl-sn-glycerol-3-phosphate acyltransferase LBUL_0314 2.330 Phosphopantetheinyl transferase (holo-ACP synthase) LBUL_0804 5.616 6.605 5.480 0.251 Acetyl-CoA acetyltransferase LBUL_0805 7.406 5.610 3.672 0.331 Hydroxymethylglutaryl-CoA reductase LBUL_0806 2.504 0.303 3-hydroxy-3-methylglutaryl CoA synthase LBUL_0819 0.354 3.527 9.975 Acyl carrier protein LBUL_0820 0.381 3.182 8.355 (acyl-carrier-protein) S-malonyltransferase LBUL_0822 0.395 3.676 9.304 3-oxoacyl-(acyl-carrier-protein) synthase LBUL_0823 0.330 4.053 12.291 Biotin carboxyl carrier protein LBUL_0824 0.325 3.774 11.621 3-hydroxymyristoyl/3-hydroxydecanoyl-(acyl carrier protein) dehydratases LBUL_0825 3.852 6.046 Acetyl/propionyl-CoA carboxylase alpha subunit LBUL_0826 0.396 3.283 8.291 Acetyl-CoA carboxylase beta subunit LBUL_0827 0.315 2.278 7.225 Acetyl-CoA carboxylase alpha subunit LBUL_0905 3.856 Mevalonate pyrophosphate decarboxylase LBUL_1256 2.607 1-acyl-sn-glycerol-3-phosphate acyltransferase
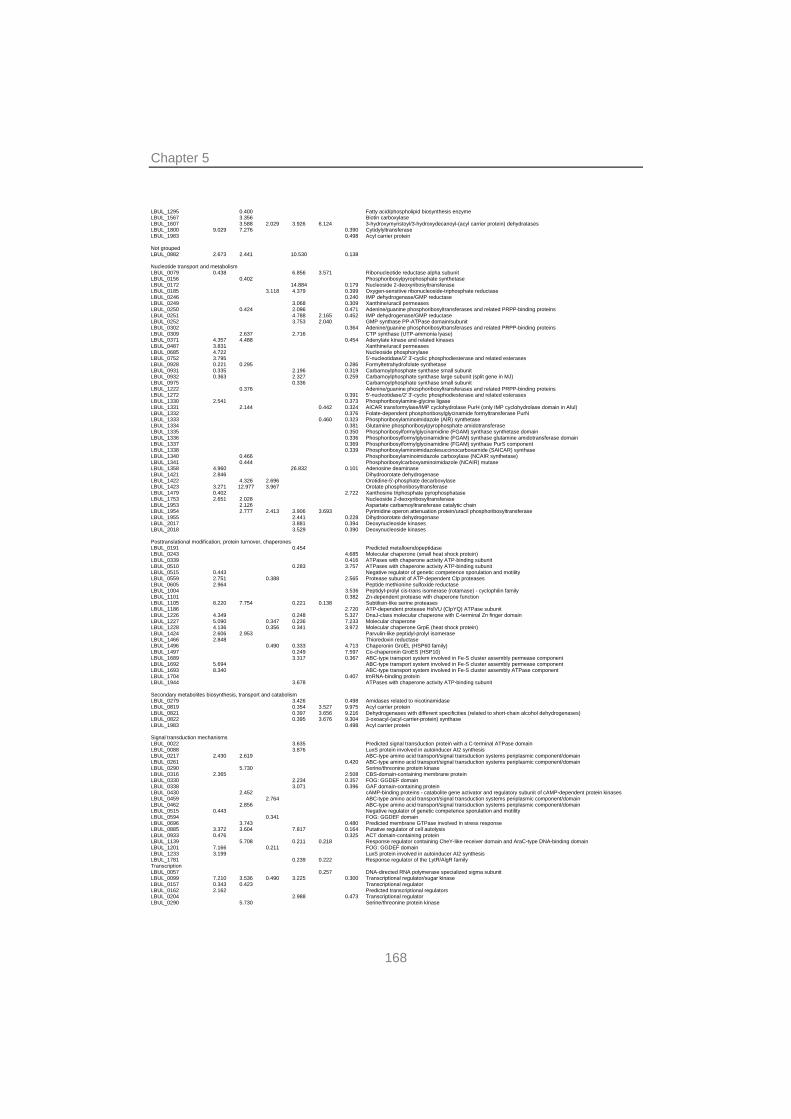
Chapter 5
168
LBUL_1295 0.400 Fatty acid/phospholipid biosynthesis enzyme LBUL_1567 3.356 Biotin carboxylase LBUL_1607 3.588 2.029 3.926 6.124 3-hydroxymyristoyl/3-hydroxydecanoyl-(acyl carrier protein) dehydratases LBUL_1800 9.029 7.276 0.390 Cytidylyltransferase LBUL_1983 0.498 Acyl carrier protein Not grouped LBUL_0882 2.673 2.441 10.530 0.138 Nucleotide transport and metabolism LBUL_0079 0.438 6.856 3.571 Ribonucleotide reductase alpha subunit LBUL_0156 0.402 Phosphoribosylpyrophosphate synthetase LBUL_0172 14.884 0.179 Nucleoside 2-deoxyribosyltransferase LBUL_0185 3.118 4.379 0.399 Oxygen-sensitive ribonucleoside-triphosphate reductase LBUL_0246 0.240 IMP dehydrogenase/GMP reductase LBUL_0249 3.068 0.309 Xanthine/uracil permeases LBUL_0250 0.424 2.096 0.471 Adenine/guanine phosphoribosyltransferases and related PRPP-binding proteins LBUL_0251 4.788 2.165 0.452 IMP dehydrogenase/GMP reductase LBUL_0252 3.753 2.040 GMP synthase PP-ATPase domain/subunit LBUL_0302 0.364 Adenine/guanine phosphoribosyltransferases and related PRPP-binding proteins LBUL_0309 2.637 2.716 CTP synthase (UTP-ammonia lyase) LBUL_0371 4.357 4.488 0.454 Adenylate kinase and related kinases LBUL_0487 3.831 Xanthine/uracil permeases LBUL_0685 4.722 Nucleoside phosphorylase LBUL_0752 3.795 5'-nucleotidase/2' 3'-cyclic phosphodiesterase and related esterases LBUL_0928 0.221 0.295 0.286 Formyltetrahydrofolate synthetase LBUL_0931 0.335 2.196 0.319 Carbamoylphosphate synthase small subunit LBUL_0932 0.363 2.327 0.259 Carbamoylphosphate synthase large subunit (split gene in MJ) LBUL_0975 0.336 Carbamoylphosphate synthase small subunit LBUL_1222 0.376 Adenine/guanine phosphoribosyltransferases and related PRPP-binding proteins LBUL_1272 0.391 5'-nucleotidase/2' 3'-cyclic phosphodiesterase and related esterases LBUL_1330 2.541 0.373 Phosphoribosylamine-glycine ligase LBUL_1331 2.144 0.442 0.324 AICAR transformylase/IMP cyclohydrolase PurH (only IMP cyclohydrolase domain in Aful) LBUL_1332 0.376 Folate-dependent phosphoribosylglycinamide formyltransferase PurN LBUL_1333 0.460 0.323 Phosphoribosylaminoimidazole (AIR) synthetase LBUL_1334 0.381 Glutamine phosphoribosylpyrophosphate amidotransferase LBUL_1335 0.350 Phosphoribosylformylglycinamidine (FGAM) synthase synthetase domain LBUL_1336 0.336 Phosphoribosylformylglycinamidine (FGAM) synthase glutamine amidotransferase domain LBUL_1337 0.369 Phosphoribosylformylglycinamidine (FGAM) synthase PurS component LBUL_1338 0.339 Phosphoribosylaminoimidazolesuccinocarboxamide (SAICAR) synthase LBUL_1340 0.466 Phosphoribosylaminoimidazole carboxylase (NCAIR synthetase) LBUL_1341 0.444 Phosphoribosylcarboxyaminoimidazole (NCAIR) mutase LBUL_1358 4.960 26.832 0.101 Adenosine deaminase LBUL_1421 2.846 Dihydroorotate dehydrogenase LBUL_1422 4.326 2.696 Orotidine-5'-phosphate decarboxylase LBUL_1423 3.271 12.977 3.967 Orotate phosphoribosyltransferase LBUL_1479 0.402 2.722 Xanthosine triphosphate pyrophosphatase LBUL_1753 2.651 2.028 Nucleoside 2-deoxyribosyltransferase LBUL_1953 2.126 Aspartate carbamoyltransferase catalytic chain LBUL_1954 2.777 2.413 3.906 3.693 Pyrimidine operon attenuation protein/uracil phosphoribosyltransferase LBUL_1955 2.441 0.228 Dihydroorotate dehydrogenase LBUL_2017 3.881 0.394 Deoxynucleoside kinases LBUL_2018 3.529 0.390 Deoxynucleoside kinases Posttranslational modification, protein turnover, chaperones LBUL_0191 0.454 Predicted metalloendopeptidase LBUL_0243 4.685 Molecular chaperone (small heat shock protein) LBUL_0339 0.416 ATPases with chaperone activity ATP-binding subunit LBUL_0510 0.283 3.757 ATPases with chaperone activity ATP-binding subunit LBUL_0515 0.443 Negative regulator of genetic competence sporulation and motility LBUL_0559 2.751 0.388 2.565 Protease subunit of ATP-dependent Clp proteases LBUL_0605 2.964 Peptide methionine sulfoxide reductase LBUL_1004 3.536 Peptidyl-prolyl cis-trans isomerase (rotamase) - cyclophilin family LBUL_1101 0.382 Zn-dependent protease with chaperone function LBUL_1105 8.220 7.754 0.221 0.138 Subtilisin-like serine proteases LBUL_1186 2.720 ATP-dependent protease HslVU (ClpYQ) ATPase subunit LBUL_1226 4.349 0.248 5.327 DnaJ-class molecular chaperone with C-terminal Zn finger domain LBUL_1227 5.090 0.347 0.236 7.233 Molecular chaperone LBUL_1228 4.136 0.356 0.341 3.972 Molecular chaperone GrpE (heat shock protein) LBUL_1424 2.606 2.953 Parvulin-like peptidyl-prolyl isomerase LBUL_1466 2.848 Thioredoxin reductase LBUL_1496 0.490 0.333 4.713 Chaperonin GroEL (HSP60 family) LBUL_1497 0.249 7.597 Co-chaperonin GroES (HSP10) LBUL_1689 3.317 0.367 ABC-type transport system involved in Fe-S cluster assembly permease component LBUL_1692 5.694 ABC-type transport system involved in Fe-S cluster assembly permease component LBUL_1693 8.340 ABC-type transport system involved in Fe-S cluster assembly ATPase component LBUL_1704 0.407 tmRNA-binding protein LBUL_1944 3.678 ATPases with chaperone activity ATP-binding subunit Secondary metabolites biosynthesis, transport and catabolism LBUL_0279 3.426 0.498 Amidases related to nicotinamidase LBUL_0819 0.354 3.527 9.975 Acyl carrier protein LBUL_0821 0.397 3.656 9.216 Dehydrogenases with different specificities (related to short-chain alcohol dehydrogenases) LBUL_0822 0.395 3.676 9.304 3-oxoacyl-(acyl-carrier-protein) synthase LBUL_1983 0.498 Acyl carrier protein Signal transduction mechanisms LBUL_0022 3.635 Predicted signal transduction protein with a C-terminal ATPase domain LBUL_0088 3.876 LuxS protein involved in autoinducer AI2 synthesis LBUL_0217 2.430 2.619 ABC-type amino acid transport/signal transduction systems periplasmic component/domain LBUL_0261 0.420 ABC-type amino acid transport/signal transduction systems periplasmic component/domain LBUL_0290 5.730 Serine/threonine protein kinase LBUL_0316 2.365 2.508 CBS-domain-containing membrane protein LBUL_0330 2.234 0.357 FOG: GGDEF domain LBUL_0338 3.071 0.396 GAF domain-containing protein LBUL_0430 2.452 cAMP-binding proteins - catabolite gene activator and regulatory subunit of cAMP-dependent protein kinases LBUL_0459 2.764 ABC-type amino acid transport/signal transduction systems periplasmic component/domain LBUL_0462 2.856 ABC-type amino acid transport/signal transduction systems periplasmic component/domain LBUL_0515 0.443 Negative regulator of genetic competence sporulation and motility LBUL_0594 0.341 FOG: GGDEF domain LBUL_0696 3.743 0.480 Predicted membrane GTPase involved in stress response LBUL_0885 3.372 3.604 7.817 0.164 Putative regulator of cell autolysis LBUL_0933 0.476 0.325 ACT domain-containing protein LBUL_1139 5.708 0.211 0.218 Response regulator containing CheY-like receiver domain and AraC-type DNA-binding domain LBUL_1201 7.166 0.211 FOG: GGDEF domain LBUL_1233 3.199 LuxS protein involved in autoinducer AI2 synthesis LBUL_1781 0.239 0.222 Response regulator of the LytR/AlgR family Transcription LBUL_0057 0.257 DNA-directed RNA polymerase specialized sigma subunit LBUL_0099 7.210 3.536 0.490 3.225 0.300 Transcriptional regulator/sugar kinase LBUL_0157 0.343 0.423 Transcriptional regulator LBUL_0162 2.162 Predicted transcriptional regulators LBUL_0204 2.988 0.473 Transcriptional regulator LBUL_0290 5.730 Serine/threonine protein kinase
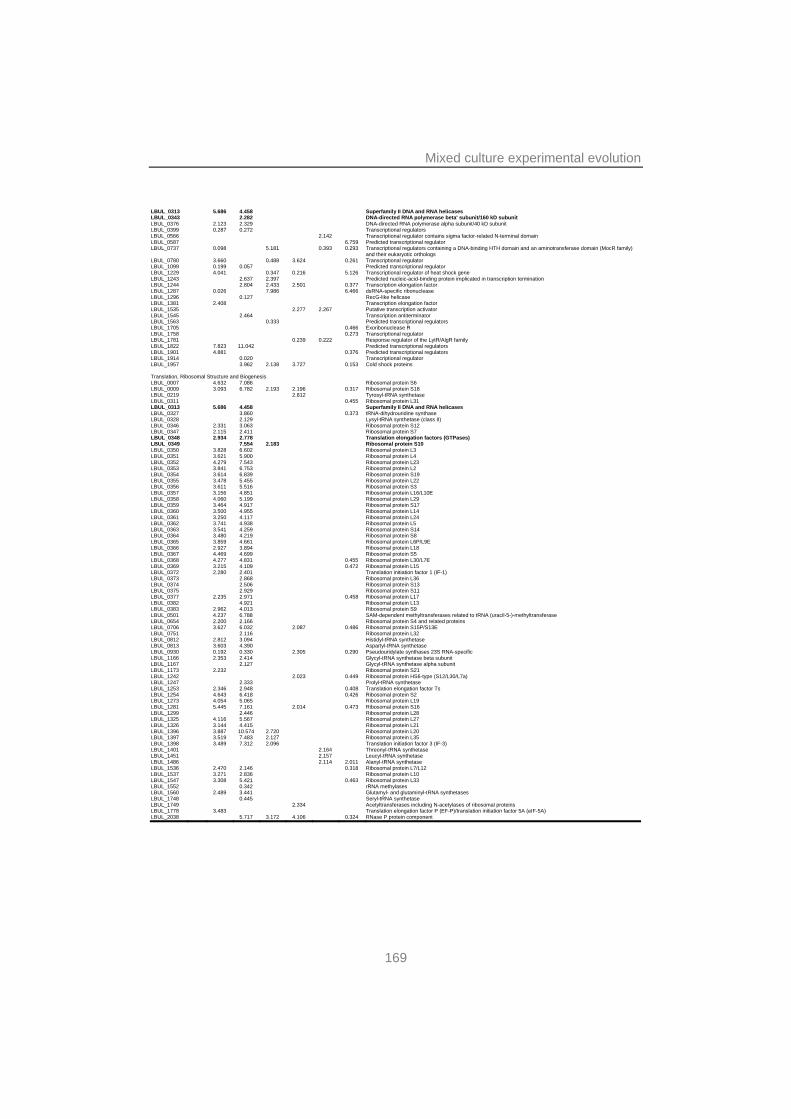
Mixed culture experimental evolution
169
LBUL_0313 5.686 4.458 Superfamily II DNA and RNA helicases LBUL_0343 2.282 DNA-directed RNA polymerase beta' subunit/160 kD subunit LBUL_0376 2.123 2.329 DNA-directed RNA polymerase alpha subunit/40 kD subunit LBUL_0399 0.287 0.272 Transcriptional regulators LBUL_0566 2.142 Transcriptional regulator contains sigma factor-related N-terminal domain LBUL_0587 6.759 Predicted transcriptional regulator LBUL_0737 0.098 5.181 0.393 0.293 Transcriptional regulators containing a DNA-binding HTH domain and an aminotransferase domain (MocR family)
and their eukaryotic orthologs LBUL_0780 3.660 0.488 3.624 0.261 Transcriptional regulator LBUL_1099 0.199 0.057 Predicted transcriptional regulator LBUL_1229 4.041 0.347 0.216 5.126 Transcriptional regulator of heat shock gene LBUL_1243 2.637 2.397 Predicted nucleic-acid-binding protein implicated in transcription termination LBUL_1244 2.804 2.433 2.501 0.377 Transcription elongation factor LBUL_1287 0.026 7.986 6.466 dsRNA-specific ribonuclease LBUL_1296 0.127 RecG-like helicase LBUL_1381 2.408 Transcription elongation factor LBUL_1535 2.277 2.267 Putative transcription activator LBUL_1545 2.464 Transcription antiterminator LBUL_1563 0.333 Predicted transcriptional regulators LBUL_1705 0.466 Exoribonuclease R LBUL_1758 0.273 Transcriptional regulator LBUL_1781 0.239 0.222 Response regulator of the LytR/AlgR family LBUL_1822 7.823 11.042 Predicted transcriptional regulators LBUL_1901 4.881 0.376 Predicted transcriptional regulators LBUL_1914 0.020 Transcriptional regulator LBUL_1957 3.962 2.138 3.727 0.153 Cold shock proteins Translation, Ribosomal Structure and Biogenesis LBUL_0007 4.632 7.086 Ribosomal protein S6 LBUL_0009 3.093 6.782 2.193 2.196 0.317 Ribosomal protein S18 LBUL_0219 2.812 Tyrosyl-tRNA synthetase LBUL_0311 0.455 Ribosomal protein L31 LBUL_0313 5.686 4.458 Superfamily II DNA and RNA helicases LBUL_0327 3.860 0.373 tRNA-dihydrouridine synthase LBUL_0328 2.129 Lysyl-tRNA synthetase (class II) LBUL_0346 2.331 3.063 Ribosomal protein S12 LBUL_0347 2.115 2.411 Ribosomal protein S7 LBUL_0348 2.934 2.778 Translation elongation factors (GTPases) LBUL_0349 7.554 2.183 Ribosomal protein S10 LBUL_0350 3.828 6.602 Ribosomal protein L3 LBUL_0351 3.621 5.900 Ribosomal protein L4 LBUL_0352 4.279 7.543 Ribosomal protein L23 LBUL_0353 3.841 6.753 Ribosomal protein L2 LBUL_0354 3.614 6.839 Ribosomal protein S19 LBUL_0355 3.478 5.455 Ribosomal protein L22 LBUL_0356 3.611 5.516 Ribosomal protein S3 LBUL_0357 3.156 4.851 Ribosomal protein L16/L10E LBUL_0358 4.060 5.199 Ribosomal protein L29 LBUL_0359 3.464 4.917 Ribosomal protein S17 LBUL_0360 3.500 4.955 Ribosomal protein L14 LBUL_0361 3.250 4.117 Ribosomal protein L24 LBUL_0362 3.741 4.938 Ribosomal protein L5 LBUL_0363 3.541 4.259 Ribosomal protein S14 LBUL_0364 3.480 4.219 Ribosomal protein S8 LBUL_0365 3.859 4.661 Ribosomal protein L6P/L9E LBUL_0366 2.927 3.894 Ribosomal protein L18 LBUL_0367 4.469 4.699 Ribosomal protein S5 LBUL_0368 4.277 4.831 0.455 Ribosomal protein L30/L7E LBUL_0369 3.215 4.109 0.472 Ribosomal protein L15 LBUL_0372 2.280 2.401 Translation initiation factor 1 (IF-1) LBUL_0373 2.868 Ribosomal protein L36 LBUL_0374 2.506 Ribosomal protein S13 LBUL_0375 2.929 Ribosomal protein S11 LBUL_0377 2.235 2.971 0.458 Ribosomal protein L17 LBUL_0382 4.921 Ribosomal protein L13 LBUL_0383 2.962 4.013 Ribosomal protein S9 LBUL_0501 4.237 6.788 SAM-dependent methyltransferases related to tRNA (uracil-5-)-methyltransferase LBUL_0654 2.200 2.166 Ribosomal protein S4 and related proteins LBUL_0706 3.627 6.032 2.087 0.486 Ribosomal protein S15P/S13E LBUL_0751 2.116 Ribosomal protein L32 LBUL_0812 2.812 3.094 Histidyl-tRNA synthetase LBUL_0813 3.603 4.390 Aspartyl-tRNA synthetase LBUL_0930 0.192 0.330 2.305 0.290 Pseudouridylate synthases 23S RNA-specific LBUL_1166 2.353 2.414 Glycyl-tRNA synthetase beta subunit LBUL_1167 2.127 Glycyl-tRNA synthetase alpha subunit LBUL_1173 2.232 Ribosomal protein S21 LBUL_1242 2.023 0.449 Ribosomal protein HS6-type (S12/L30/L7a) LBUL_1247 2.333 Prolyl-tRNA synthetase LBUL_1253 2.346 2.948 0.408 Translation elongation factor Ts LBUL_1254 4.643 6.418 0.426 Ribosomal protein S2 LBUL_1273 4.054 5.065 Ribosomal protein L19 LBUL_1281 5.445 7.161 2.014 0.473 Ribosomal protein S16 LBUL_1299 2.446 Ribosomal protein L28 LBUL_1325 4.116 5.567 Ribosomal protein L27 LBUL_1326 3.144 4.415 Ribosomal protein L21 LBUL_1396 3.887 10.574 2.720 Ribosomal protein L20 LBUL_1397 3.519 7.483 2.127 Ribosomal protein L35 LBUL_1398 3.489 7.312 2.096 Translation initiation factor 3 (IF-3) LBUL_1401 2.164 Threonyl-tRNA synthetase LBUL_1451 2.157 Leucyl-tRNA synthetase LBUL_1486 2.114 2.011 Alanyl-tRNA synthetase LBUL_1536 2.470 2.146 0.318 Ribosomal protein L7/L12 LBUL_1537 3.271 2.836 Ribosomal protein L10 LBUL_1547 3.308 5.421 0.463 Ribosomal protein L33 LBUL_1552 0.342 rRNA methylases LBUL_1560 2.489 3.441 Glutamyl- and glutaminyl-tRNA synthetases LBUL_1748 0.445 Seryl-tRNA synthetase LBUL_1749 2.334 Acetyltransferases including N-acetylases of ribosomal proteins LBUL_1778 3.483 Translation elongation factor P (EF-P)/translation initiation factor 5A (eIF-5A) LBUL_2038 5.717 3.172 4.106 0.324 RNase P protein component

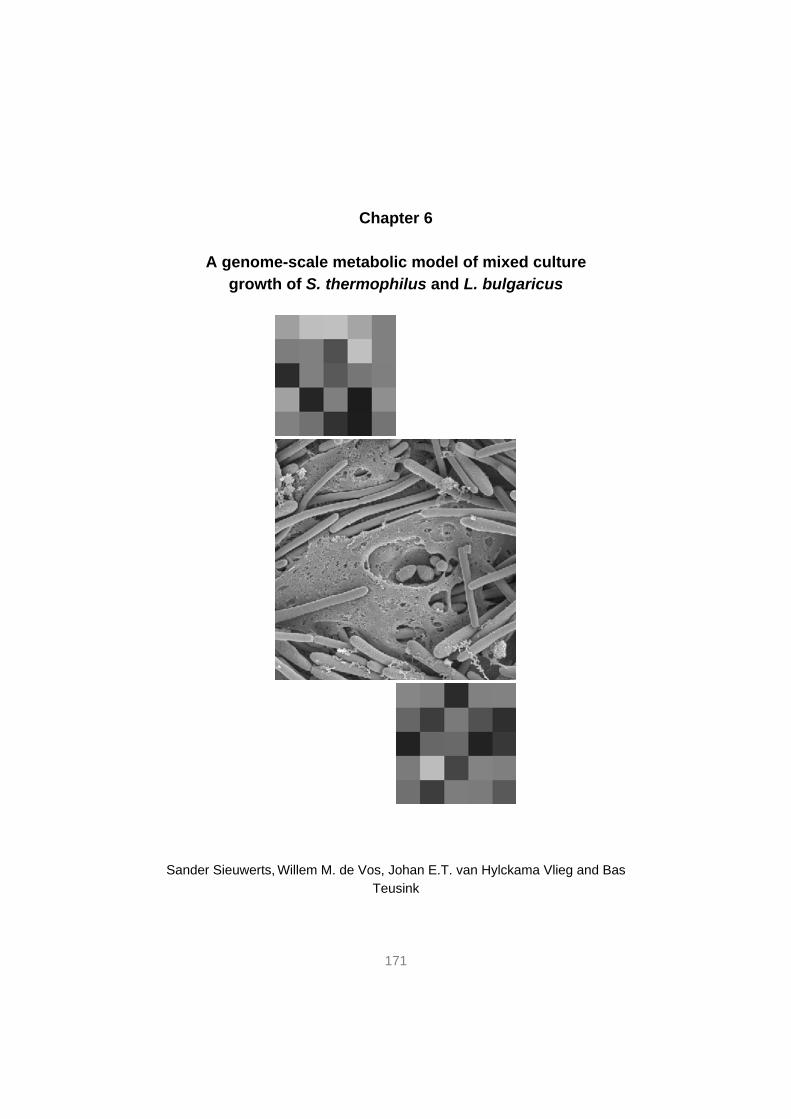
Chapter 6
A genome-scale metabolic model of mixed culture growth of S. thermophilus and L. bulgaricus
Sander Sieuwerts, Willem M. de Vos, Johan E.T. van Hylckama Vlieg and Bas Teusink
171
Chapter 6
ABSTRACT The interactions between microorganisms are of key importance for the performance of mixed culture fermentations such as the yoghurt fermentation, which is carried out by a consortium of Streptococcus thermophilus and Lactobacillus bulgaricus. These two species stimulate each other’s growth by the exchange of growth factors associated with purine and amino acid metabolism (5, 7, 9). However, a detailed view on the regulatory responses and metabolic basis of these stimulatory interactions remains to be established. To advance this insight, mapping the metabolism of the two separate species can be instrumental. We used genome-scale metabolic modeling to identify the reactions occurring in both bacteria. Moreover, carbon and amino acid fluxes in both bacteria were calculated and included in the models. Finally, we demonstrate the possibility to couple such models in order to identify reactions associated with interactions between consortium members. In this case nutritional exchange was indeed predicted to be based on formic acid, folic acid and proteolysis. In addition, the experimental observation of an increased biomass yield on lactose was confirmed in the model. It is anticipated that such models will aid the development or improvement of other mixed culture fermentations in the near future. INTRODUCTION Microorganisms are almost uniquely found in ecosystems consisting of multiple species. The interplay with other microorganisms is of key importance for their behavior and performance (13, 17). A well-known example in the field of food fermentations is the yoghurt fermentation. In this process (bovine) milk is transformed into yoghurt, through the combined action of the two lactic acid bacteria (LAB) Streptococcus thermophilus and Lactobacillus delbrueckii subsp. bulgaricus. These two species stimulate each other’s growth by the exchange of growth factors associated with purine and amino acid (AA) metabolism (5, 7, 9, 23), in a process also referred to as protocooperation. A number of recent post-genomic studies identified several genetic and physiological responses associated with co-cultivation (11, 12, 26).
Previously, kinetic models of the yoghurt fermentation were constructed to quantify interactions between S. thermophilus and L. bulgaricus in yoghurt (6, 27). Although these models proved to be very useful for the quantification of interactions in mixed cultures, they are highly specific to the conditions used for the assessment of the kinetic parameters and they have little predictive value for other
172
Genome-scale metabolic model for the prediction of interactions
conditions. These black-box models also do not allow the identification of the underlying mechanisms behind the mutualistic interactions between S. thermophilus and L. bulgaricus. Genome-scale metabolic models, on the other hand, may provide an attractive alternative as they enable the prediction of the behavior of a microorganism in a complex and changing environment, especially when fed with experimental fermentation data used to calculate fluxes (30, 32). However, the construction of metabolic models that take into account the effects of competition and the exchange of metabolites between members of a microbial community is still challenging (2, 35).
Here we report the construction of genome-scale metabolic models of S. thermophilus CNRZ1066 and L. bulgaricus ATCC BAA-365 and their validation using experimental fermentation data. Furthermore, we comment on the possibility to couple both models in order to identify the nature of the interactions between both bacteria in yoghurt. Preliminary results suggest interactions based on the exchange of formic acid, folic acid (provided by S. thermophilus) and proteolysis (executed by L. bulgaricus), which is in accordance with literature findings and the data reported in chapter 4. Although determining the metabolite fluxes in the mixed culture model presented is not finalized yet and the model needs to be validated with additional experimental data, it is anticipated that such genome-scale metabolic models are valuable for the prediction of mixed culture growth in dynamic environments MATERIALS AND METHODS Strains and culture conditions S. thermophilus CNRZ1066 (3), L. bulgaricus ATCC BAA-365 (16) and two co-adapted strains by an experimental evolution study, S. thermophilus NIZO3938 and L. bulgaricus NIZO3939 (24), were maintained as frozen M17 broth (Difco) and MRS broth (Difco) cultures with 22% glycerol (Scharlau) at -80 °C. Pre-cultures and 275 mL final cultures were prepared as described in (26). Colony-forming units (CFUs) were determined by selective plating (M17 agar supplemented with 1% (w/v) glucose, aerobic at 42°C for S. thermophilus and MRS agar, anaerobic at 42°C for L. bulgaricus) using the faster plating method developed before (25). Optical density, dry weight and metabolite measurements The optical density at 600 nm (OD600) of yoghurt cultures was determined in duplicate by mixing one volume of culture was mixed with 9 volumes of a 0.2%
173
Chapter 6
(w/v) NaEDTA / 0.2% (w/v) NaOH solution. The cell dry weight of cultures was derived from OD600 values after calibration as described in (21).
Sugar (lactose, glucose, galactose), acid (lactic acid, acetic acid, formic acid, citric acid and succinic acid) and ethanol content of the medium were determined using HPLC as described before (24). The AA content was determined as described in (26). Calculation of fluxes Fluxes of metabolites (mmol gDW-1) were calculated as follows. The average increase in biomass (g h-1) was calculated by linear regression of the growth curve. The average production (or consumption) of substrates and metabolites (mmol h-1) was calculated in the same way. The specific production of metabolites per g dry weight was calculated by dividing the metabolite production by the biomass production. Exopolysaccharide isolation Exopolysaccharides (EPS) were extracted from 275 mL cultures grown for 24 h at 42°C as described before (26). The composition of EPS was determined as in (15). Model development Two genome-scale metabolic models were constructed on the basis of the genomes of S. thermophilus CNRZ1066 and L. bulgaricus ATCC BAA-365 (see Table 1). First drafts of the models were generated using the AUTOGRAPH method (18). In short, the genome of each organism was compared with the genomes for which a curated genome-scale metabolic model was already available, i.e. for Lactobacillus plantarum WCFS1 (30), Bacillus subtilis ATCC 23857 (19), S. thermophilus LMG18311 (20) and Lactococcus lactis MG1363 (Teusink and Notebaart, unpublished results). For orthologous genes, the corresponding gene-protein-reaction associations were copied to the draft models. For the S. thermophilus model, the model of strain LMG13811 was used with priority; for L. bulgaricus, L. plantarum was used as primary source. The other models were used as supplements for reactions that were not present in the S. thermophilus LMG18311 and L. plantarum models.
The draft models were manually curated as described before (30, 32). All gene-protein-reaction associations were checked manually for consistency and by comparing with other annotation resources such as the ERGO bioinformatics suite and KEGG pathways. In case a gene encoded an enzyme with a specific metabolic function, it was included in the model. Here after, the models were analyzed for
174
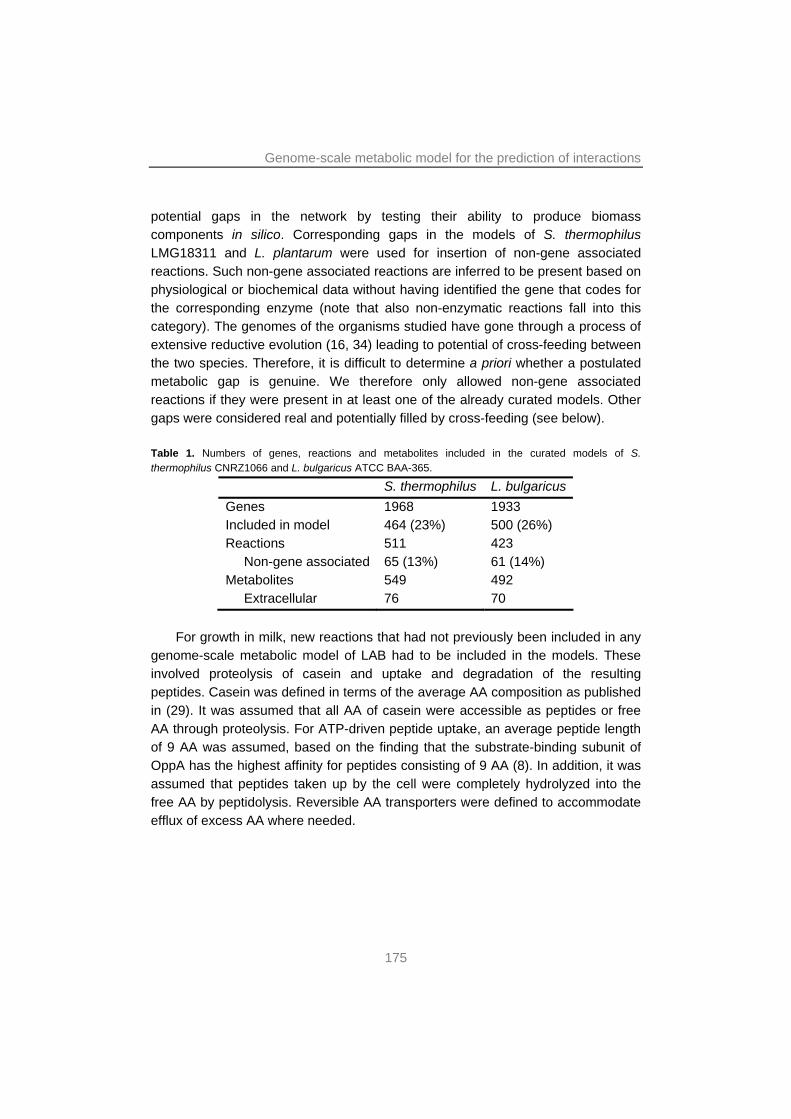
Genome-scale metabolic model for the prediction of interactions
potential gaps in the network by testing their ability to produce biomass components in silico. Corresponding gaps in the models of S. thermophilus LMG18311 and L. plantarum were used for insertion of non-gene associated reactions. Such non-gene associated reactions are inferred to be present based on physiological or biochemical data without having identified the gene that codes for the corresponding enzyme (note that also non-enzymatic reactions fall into this category). The genomes of the organisms studied have gone through a process of extensive reductive evolution (16, 34) leading to potential of cross-feeding between the two species. Therefore, it is difficult to determine a priori whether a postulated metabolic gap is genuine. We therefore only allowed non-gene associated reactions if they were present in at least one of the already curated models. Other gaps were considered real and potentially filled by cross-feeding (see below). Table 1. Numbers of genes, reactions and metabolites included in the curated models of S. thermophilus CNRZ1066 and L. bulgaricus ATCC BAA-365.
S. thermophilus L. bulgaricus Genes 1968 1933 Included in model 464 (23%) 500 (26%) Reactions 511 423 Non-gene associated 65 (13%) 61 (14%) Metabolites 549 492 Extracellular 76 70
For growth in milk, new reactions that had not previously been included in any
genome-scale metabolic model of LAB had to be included in the models. These involved proteolysis of casein and uptake and degradation of the resulting peptides. Casein was defined in terms of the average AA composition as published in (29). It was assumed that all AA of casein were accessible as peptides or free AA through proteolysis. For ATP-driven peptide uptake, an average peptide length of 9 AA was assumed, based on the finding that the substrate-binding subunit of OppA has the highest affinity for peptides consisting of 9 AA (8). In addition, it was assumed that peptides taken up by the cell were completely hydrolyzed into the free AA by peptidolysis. Reversible AA transporters were defined to accommodate efflux of excess AA where needed.
175
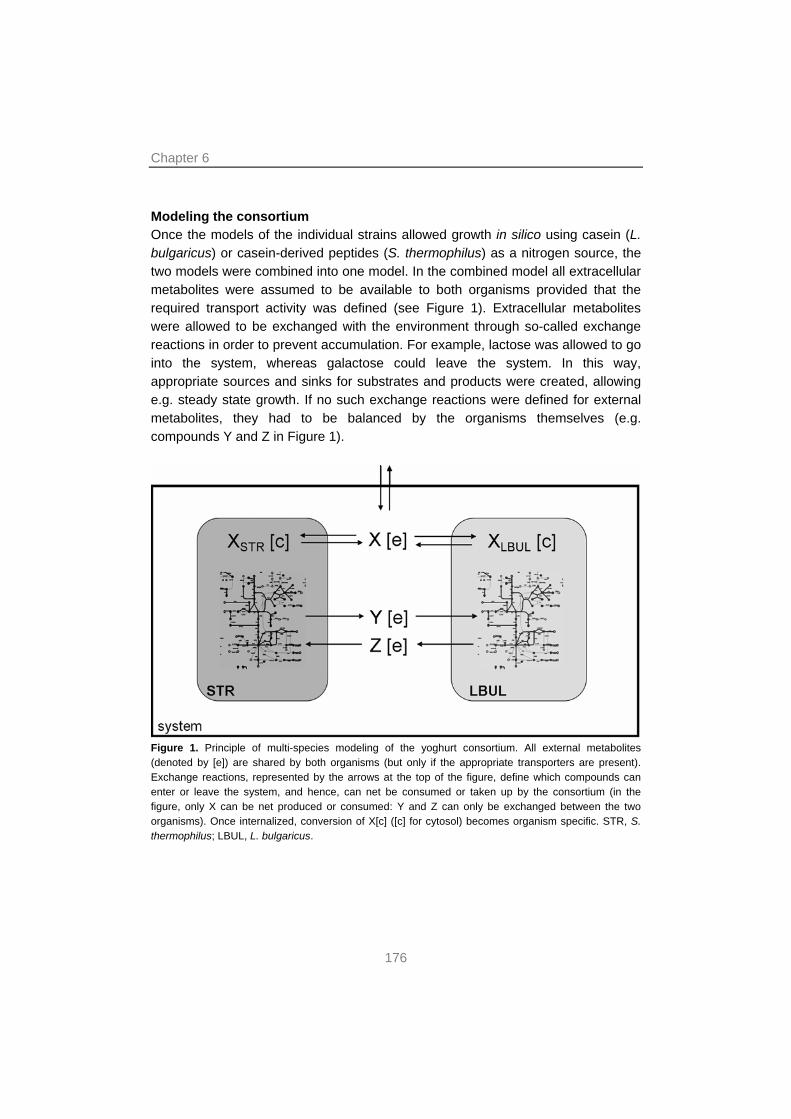
Chapter 6
Modeling the consortium Once the models of the individual strains allowed growth in silico using casein (L. bulgaricus) or casein-derived peptides (S. thermophilus) as a nitrogen source, the two models were combined into one model. In the combined model all extracellular metabolites were assumed to be available to both organisms provided that the required transport activity was defined (see Figure 1). Extracellular metabolites were allowed to be exchanged with the environment through so-called exchange reactions in order to prevent accumulation. For example, lactose was allowed to go into the system, whereas galactose could leave the system. In this way, appropriate sources and sinks for substrates and products were created, allowing e.g. steady state growth. If no such exchange reactions were defined for external metabolites, they had to be balanced by the organisms themselves (e.g. compounds Y and Z in Figure 1).
Figure 1. Principle of multi-species modeling of the yoghurt consortium. All external metabolites (denoted by [e]) are shared by both organisms (but only if the appropriate transporters are present). Exchange reactions, represented by the arrows at the top of the figure, define which compounds can enter or leave the system, and hence, can net be consumed or taken up by the consortium (in the figure, only X can be net produced or consumed: Y and Z can only be exchanged between the two organisms). Once internalized, conversion of X[c] ([c] for cytosol) becomes organism specific. STR, S. thermophilus; LBUL, L. bulgaricus.
176
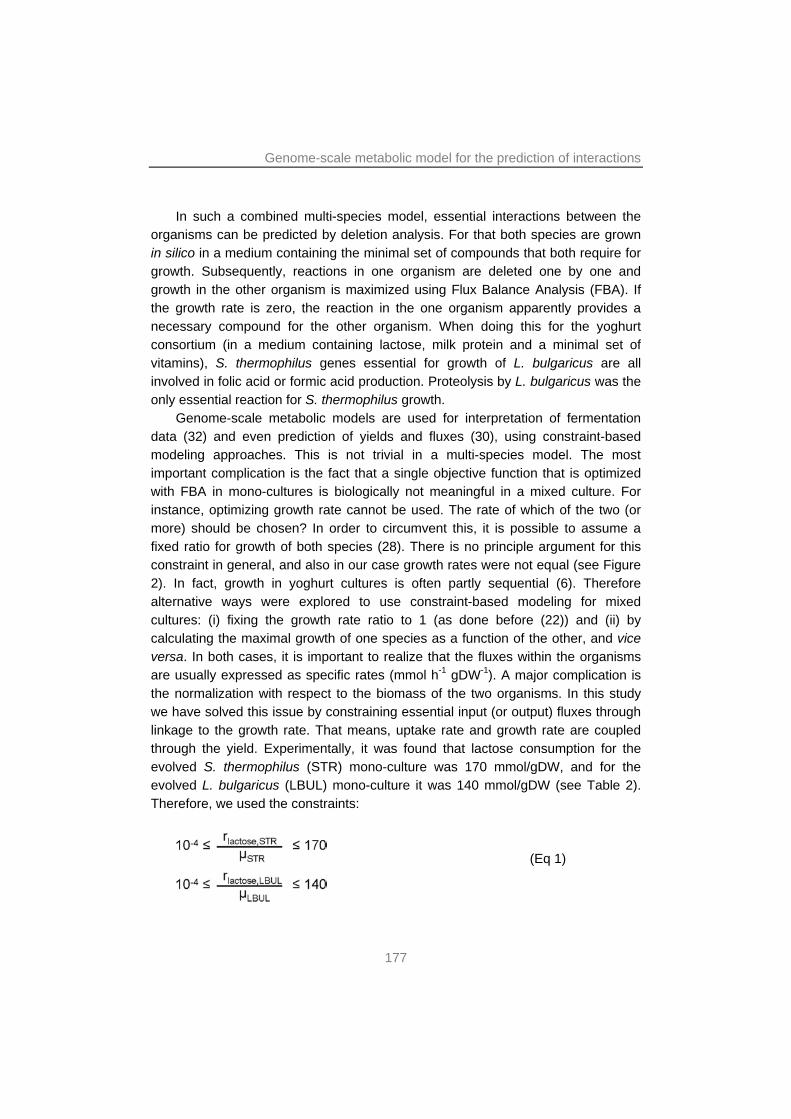
Genome-scale metabolic model for the prediction of interactions
In such a combined multi-species model, essential interactions between the organisms can be predicted by deletion analysis. For that both species are grown in silico in a medium containing the minimal set of compounds that both require for growth. Subsequently, reactions in one organism are deleted one by one and growth in the other organism is maximized using Flux Balance Analysis (FBA). If the growth rate is zero, the reaction in the one organism apparently provides a necessary compound for the other organism. When doing this for the yoghurt consortium (in a medium containing lactose, milk protein and a minimal set of vitamins), S. thermophilus genes essential for growth of L. bulgaricus are all involved in folic acid or formic acid production. Proteolysis by L. bulgaricus was the only essential reaction for S. thermophilus growth.
Genome-scale metabolic models are used for interpretation of fermentation data (32) and even prediction of yields and fluxes (30), using constraint-based modeling approaches. This is not trivial in a multi-species model. The most important complication is the fact that a single objective function that is optimized with FBA in mono-cultures is biologically not meaningful in a mixed culture. For instance, optimizing growth rate cannot be used. The rate of which of the two (or more) should be chosen? In order to circumvent this, it is possible to assume a fixed ratio for growth of both species (28). There is no principle argument for this constraint in general, and also in our case growth rates were not equal (see Figure 2). In fact, growth in yoghurt cultures is often partly sequential (6). Therefore alternative ways were explored to use constraint-based modeling for mixed cultures: (i) fixing the growth rate ratio to 1 (as done before (22)) and (ii) by calculating the maximal growth of one species as a function of the other, and vice versa. In both cases, it is important to realize that the fluxes within the organisms are usually expressed as specific rates (mmol h-1 gDW-1). A major complication is the normalization with respect to the biomass of the two organisms. In this study we have solved this issue by constraining essential input (or output) fluxes through linkage to the growth rate. That means, uptake rate and growth rate are coupled through the yield. Experimentally, it was found that lactose consumption for the evolved S. thermophilus (STR) mono-culture was 170 mmol/gDW, and for the evolved L. bulgaricus (LBUL) mono-culture it was 140 mmol/gDW (see Table 2). Therefore, we used the constraints:
(Eq 1)
177
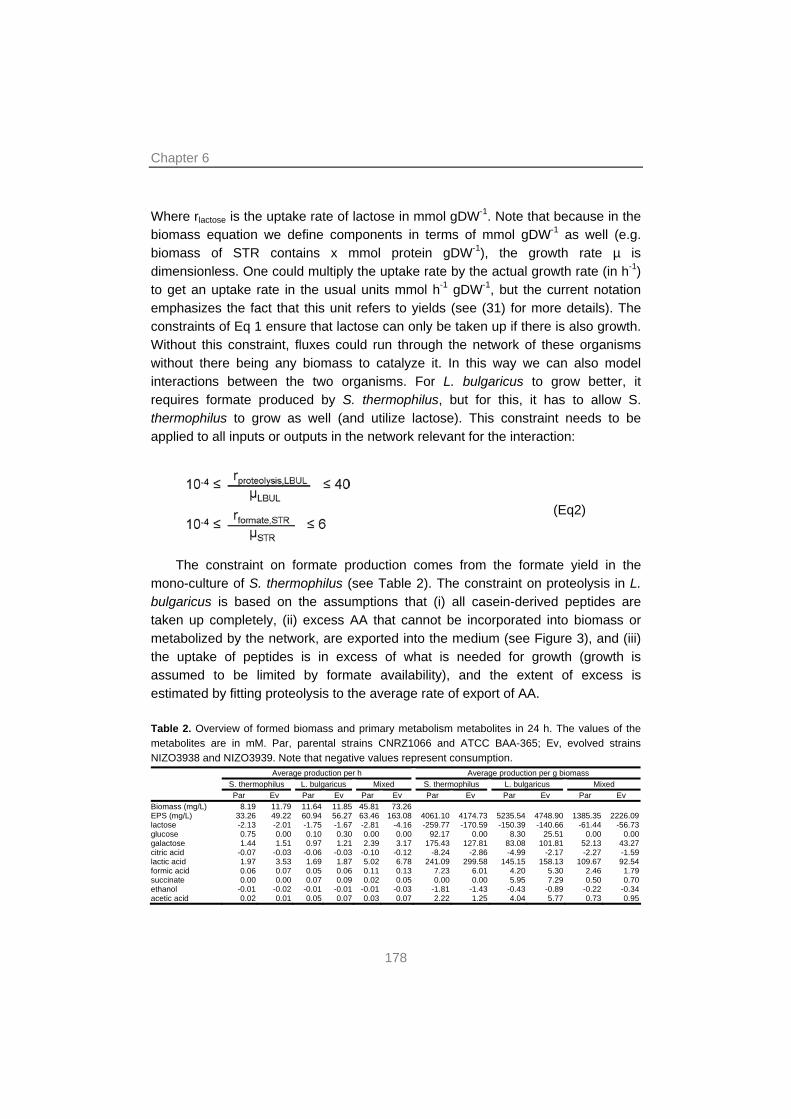
Chapter 6
Where rlactose is the uptake rate of lactose in mmol gDW-1. Note that because in the biomass equation we define components in terms of mmol gDW-1 as well (e.g. biomass of STR contains x mmol protein gDW-1), the growth rate µ is dimensionless. One could multiply the uptake rate by the actual growth rate (in h-1) to get an uptake rate in the usual units mmol h-1 gDW-1, but the current notation emphasizes the fact that this unit refers to yields (see (31) for more details). The constraints of Eq 1 ensure that lactose can only be taken up if there is also growth. Without this constraint, fluxes could run through the network of these organisms without there being any biomass to catalyze it. In this way we can also model interactions between the two organisms. For L. bulgaricus to grow better, it requires formate produced by S. thermophilus, but for this, it has to allow S. thermophilus to grow as well (and utilize lactose). This constraint needs to be applied to all inputs or outputs in the network relevant for the interaction:
(Eq2)
The constraint on formate production comes from the formate yield in the mono-culture of S. thermophilus (see Table 2). The constraint on proteolysis in L. bulgaricus is based on the assumptions that (i) all casein-derived peptides are taken up completely, (ii) excess AA that cannot be incorporated into biomass or metabolized by the network, are exported into the medium (see Figure 3), and (iii) the uptake of peptides is in excess of what is needed for growth (growth is assumed to be limited by formate availability), and the extent of excess is estimated by fitting proteolysis to the average rate of export of AA. Table 2. Overview of formed biomass and primary metabolism metabolites in 24 h. The values of the metabolites are in mM. Par, parental strains CNRZ1066 and ATCC BAA-365; Ev, evolved strains NIZO3938 and NIZO3939. Note that negative values represent consumption. Average production per h Average production per g biomass S. thermophilus L. bulgaricus Mixed S. thermophilus L. bulgaricus Mixed Par Ev Par Ev Par Ev Par Ev Par Ev Par Ev Biomass (mg/L) 8.19 11.79 11.64 11.85 45.81 73.26 EPS (mg/L) 33.26 49.22 60.94 56.27 63.46 163.08 4061.10 4174.73 5235.54 4748.90 1385.35 2226.09 lactose -2.13 -2.01 -1.75 -1.67 -2.81 -4.16 -259.77 -170.59 -150.39 -140.66 -61.44 -56.73 glucose 0.75 0.00 0.10 0.30 0.00 0.00 92.17 0.00 8.30 25.51 0.00 0.00 galactose 1.44 1.51 0.97 1.21 2.39 3.17 175.43 127.81 83.08 101.81 52.13 43.27 citric acid -0.07 -0.03 -0.06 -0.03 -0.10 -0.12 -8.24 -2.86 -4.99 -2.17 -2.27 -1.59 lactic acid 1.97 3.53 1.69 1.87 5.02 6.78 241.09 299.58 145.15 158.13 109.67 92.54 formic acid 0.06 0.07 0.05 0.06 0.11 0.13 7.23 6.01 4.20 5.30 2.46 1.79 succinate 0.00 0.00 0.07 0.09 0.02 0.05 0.00 0.00 5.95 7.29 0.50 0.70 ethanol -0.01 -0.02 -0.01 -0.01 -0.01 -0.03 -1.81 -1.43 -0.43 -0.89 -0.22 -0.34 acetic acid 0.02 0.01 0.05 0.07 0.03 0.07 2.22 1.25 4.04 5.77 0.73 0.95
178
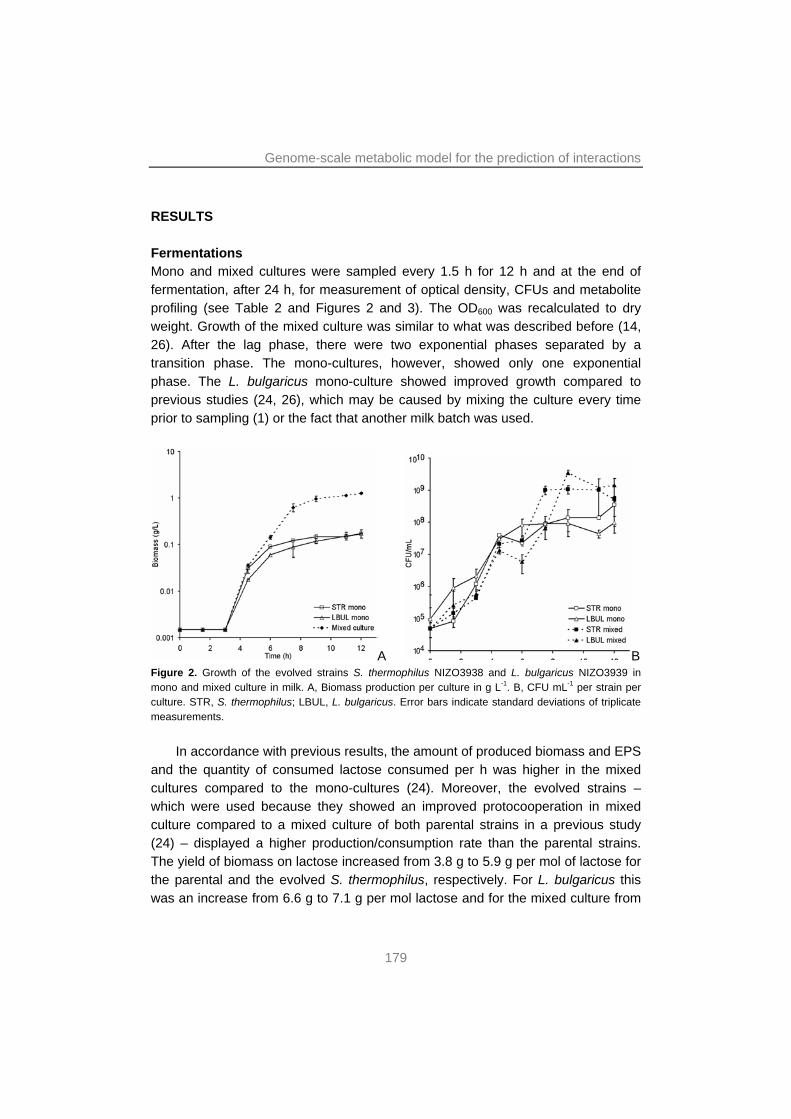
Genome-scale metabolic model for the prediction of interactions
RESULTS Fermentations Mono and mixed cultures were sampled every 1.5 h for 12 h and at the end of fermentation, after 24 h, for measurement of optical density, CFUs and metabolite profiling (see Table 2 and Figures 2 and 3). The OD600 was recalculated to dry weight. Growth of the mixed culture was similar to what was described before (14, 26). After the lag phase, there were two exponential phases separated by a transition phase. The mono-cultures, however, showed only one exponential phase. The L. bulgaricus mono-culture showed improved growth compared to previous studies (24, 26), which may be caused by mixing the culture every time prior to sampling (1) or the fact that another milk batch was used.
A B Figure 2. Growth of the evolved strains S. thermophilus NIZO3938 and L. bulgaricus NIZO3939 in mono and mixed culture in milk. A, Biomass production per culture in g L-1. B, CFU mL-1 per strain per culture. STR, S. thermophilus; LBUL, L. bulgaricus. Error bars indicate standard deviations of triplicate measurements.
In accordance with previous results, the amount of produced biomass and EPS
and the quantity of consumed lactose consumed per h was higher in the mixed cultures compared to the mono-cultures (24). Moreover, the evolved strains – which were used because they showed an improved protocooperation in mixed culture compared to a mixed culture of both parental strains in a previous study (24) – displayed a higher production/consumption rate than the parental strains. The yield of biomass on lactose increased from 3.8 g to 5.9 g per mol of lactose for the parental and the evolved S. thermophilus, respectively. For L. bulgaricus this was an increase from 6.6 g to 7.1 g per mol lactose and for the mixed culture from
179
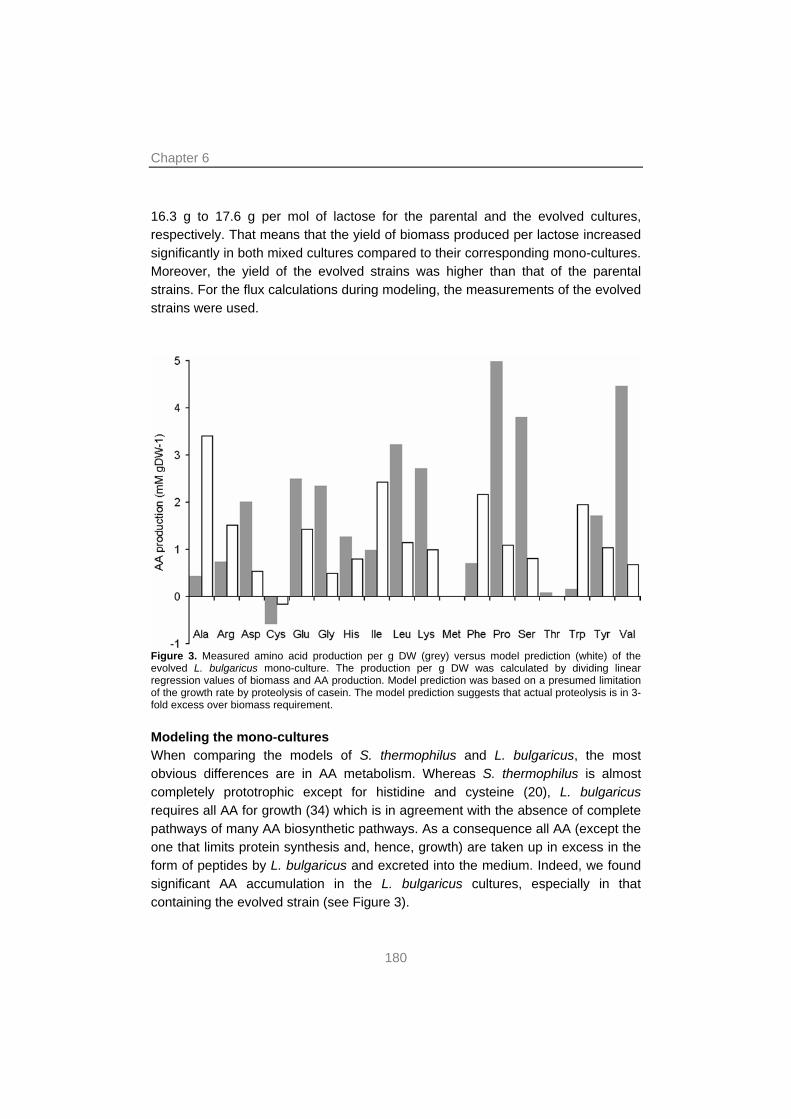
Chapter 6
16.3 g to 17.6 g per mol of lactose for the parental and the evolved cultures, respectively. That means that the yield of biomass produced per lactose increased significantly in both mixed cultures compared to their corresponding mono-cultures. Moreover, the yield of the evolved strains was higher than that of the parental strains. For the flux calculations during modeling, the measurements of the evolved strains were used.
Figure 3. Measured amino acid production per g DW (grey) versus model prediction (white) of the evolved L. bulgaricus mono-culture. The production per g DW was calculated by dividing linear regression values of biomass and AA production. Model prediction was based on a presumed limitation of the growth rate by proteolysis of casein. The model prediction suggests that actual proteolysis is in 3-fold excess over biomass requirement. Modeling the mono-cultures When comparing the models of S. thermophilus and L. bulgaricus, the most obvious differences are in AA metabolism. Whereas S. thermophilus is almost completely prototrophic except for histidine and cysteine (20), L. bulgaricus requires all AA for growth (34) which is in agreement with the absence of complete pathways of many AA biosynthetic pathways. As a consequence all AA (except the one that limits protein synthesis and, hence, growth) are taken up in excess in the form of peptides by L. bulgaricus and excreted into the medium. Indeed, we found significant AA accumulation in the L. bulgaricus cultures, especially in that containing the evolved strain (see Figure 3).
180
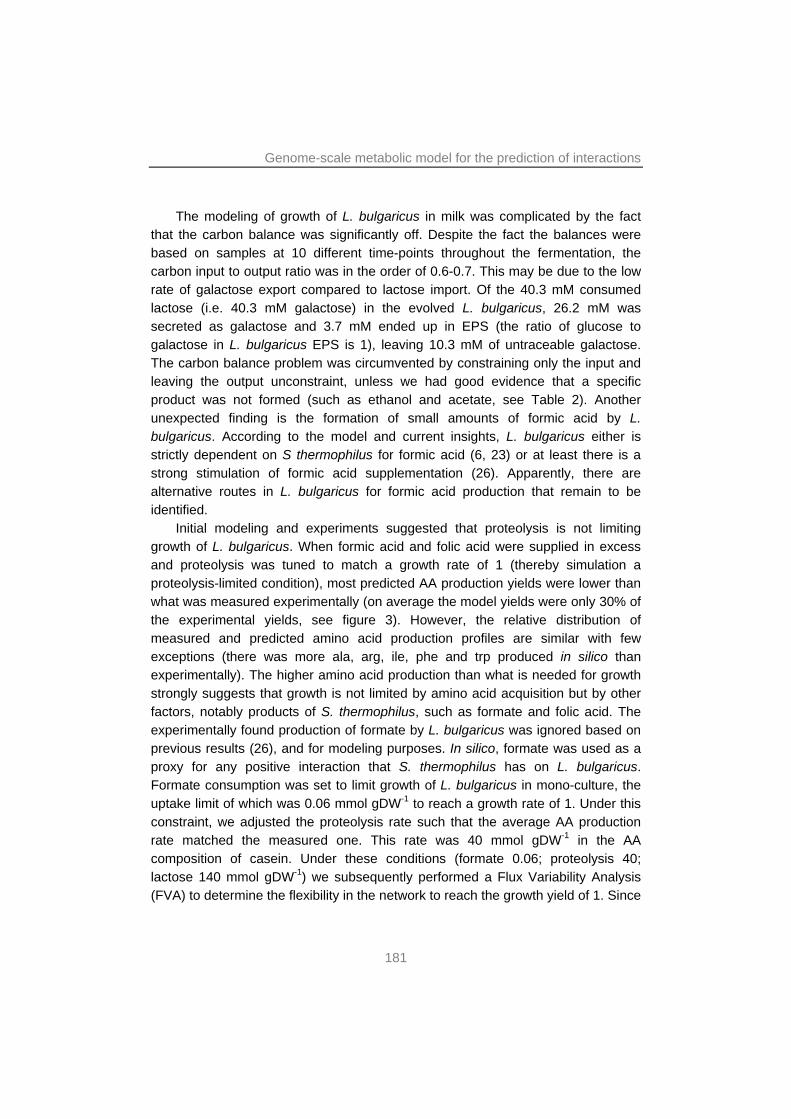
Genome-scale metabolic model for the prediction of interactions
The modeling of growth of L. bulgaricus in milk was complicated by the fact that the carbon balance was significantly off. Despite the fact the balances were based on samples at 10 different time-points throughout the fermentation, the carbon input to output ratio was in the order of 0.6-0.7. This may be due to the low rate of galactose export compared to lactose import. Of the 40.3 mM consumed lactose (i.e. 40.3 mM galactose) in the evolved L. bulgaricus, 26.2 mM was secreted as galactose and 3.7 mM ended up in EPS (the ratio of glucose to galactose in L. bulgaricus EPS is 1), leaving 10.3 mM of untraceable galactose. The carbon balance problem was circumvented by constraining only the input and leaving the output unconstraint, unless we had good evidence that a specific product was not formed (such as ethanol and acetate, see Table 2). Another unexpected finding is the formation of small amounts of formic acid by L. bulgaricus. According to the model and current insights, L. bulgaricus either is strictly dependent on S thermophilus for formic acid (6, 23) or at least there is a strong stimulation of formic acid supplementation (26). Apparently, there are alternative routes in L. bulgaricus for formic acid production that remain to be identified.
Initial modeling and experiments suggested that proteolysis is not limiting growth of L. bulgaricus. When formic acid and folic acid were supplied in excess and proteolysis was tuned to match a growth rate of 1 (thereby simulation a proteolysis-limited condition), most predicted AA production yields were lower than what was measured experimentally (on average the model yields were only 30% of the experimental yields, see figure 3). However, the relative distribution of measured and predicted amino acid production profiles are similar with few exceptions (there was more ala, arg, ile, phe and trp produced in silico than experimentally). The higher amino acid production than what is needed for growth strongly suggests that growth is not limited by amino acid acquisition but by other factors, notably products of S. thermophilus, such as formate and folic acid. The experimentally found production of formate by L. bulgaricus was ignored based on previous results (26), and for modeling purposes. In silico, formate was used as a proxy for any positive interaction that S. thermophilus has on L. bulgaricus. Formate consumption was set to limit growth of L. bulgaricus in mono-culture, the uptake limit of which was 0.06 mmol gDW-1 to reach a growth rate of 1. Under this constraint, we adjusted the proteolysis rate such that the average AA production rate matched the measured one. This rate was 40 mmol gDW-1 in the AA composition of casein. Under these conditions (formate 0.06; proteolysis 40; lactose 140 mmol gDW-1) we subsequently performed a Flux Variability Analysis (FVA) to determine the flexibility in the network to reach the growth yield of 1. Since
181
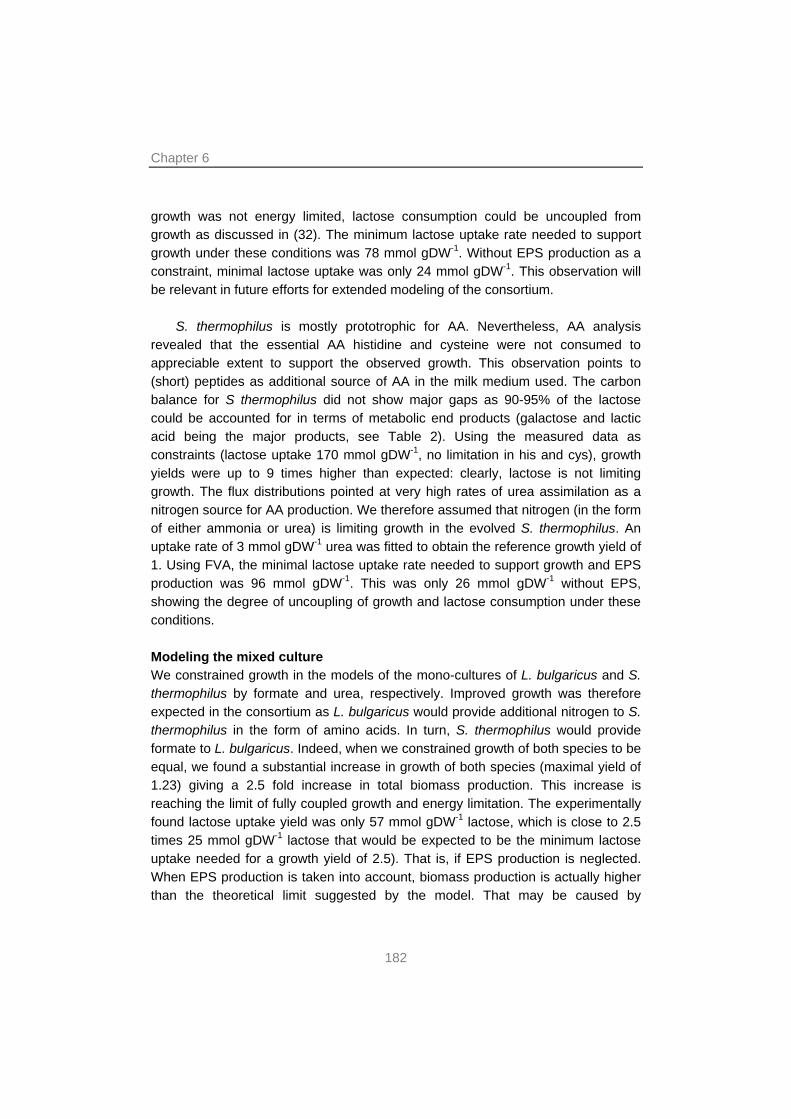
Chapter 6
growth was not energy limited, lactose consumption could be uncoupled from growth as discussed in (32). The minimum lactose uptake rate needed to support growth under these conditions was 78 mmol gDW-1. Without EPS production as a constraint, minimal lactose uptake was only 24 mmol gDW-1. This observation will be relevant in future efforts for extended modeling of the consortium.
S. thermophilus is mostly prototrophic for AA. Nevertheless, AA analysis revealed that the essential AA histidine and cysteine were not consumed to appreciable extent to support the observed growth. This observation points to (short) peptides as additional source of AA in the milk medium used. The carbon balance for S thermophilus did not show major gaps as 90-95% of the lactose could be accounted for in terms of metabolic end products (galactose and lactic acid being the major products, see Table 2). Using the measured data as constraints (lactose uptake 170 mmol gDW-1, no limitation in his and cys), growth yields were up to 9 times higher than expected: clearly, lactose is not limiting growth. The flux distributions pointed at very high rates of urea assimilation as a nitrogen source for AA production. We therefore assumed that nitrogen (in the form of either ammonia or urea) is limiting growth in the evolved S. thermophilus. An uptake rate of 3 mmol gDW-1 urea was fitted to obtain the reference growth yield of 1. Using FVA, the minimal lactose uptake rate needed to support growth and EPS production was 96 mmol gDW-1. This was only 26 mmol gDW-1 without EPS, showing the degree of uncoupling of growth and lactose consumption under these conditions. Modeling the mixed culture We constrained growth in the models of the mono-cultures of L. bulgaricus and S. thermophilus by formate and urea, respectively. Improved growth was therefore expected in the consortium as L. bulgaricus would provide additional nitrogen to S. thermophilus in the form of amino acids. In turn, S. thermophilus would provide formate to L. bulgaricus. Indeed, when we constrained growth of both species to be equal, we found a substantial increase in growth of both species (maximal yield of 1.23) giving a 2.5 fold increase in total biomass production. This increase is reaching the limit of fully coupled growth and energy limitation. The experimentally found lactose uptake yield was only 57 mmol gDW-1 lactose, which is close to 2.5 times 25 mmol gDW-1 lactose that would be expected to be the minimum lactose uptake needed for a growth yield of 2.5). That is, if EPS production is neglected. When EPS production is taken into account, biomass production is actually higher than the theoretical limit suggested by the model. That may be caused by
182
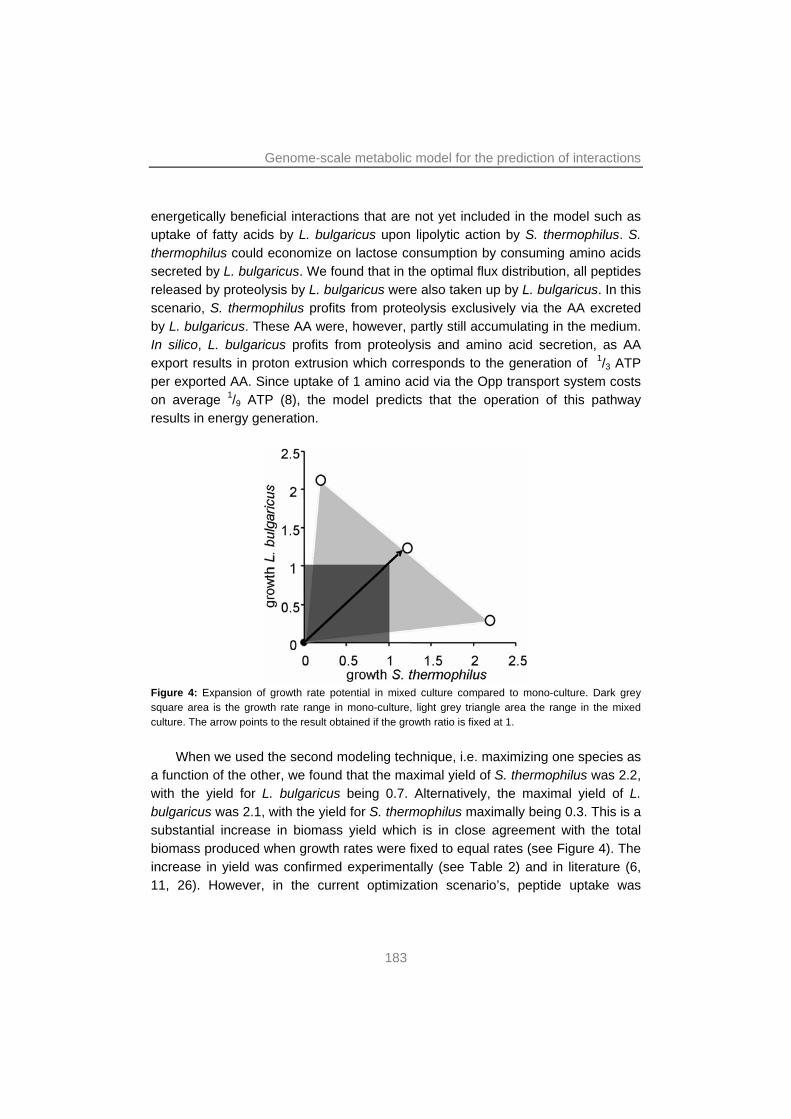
Genome-scale metabolic model for the prediction of interactions
energetically beneficial interactions that are not yet included in the model such as uptake of fatty acids by L. bulgaricus upon lipolytic action by S. thermophilus. S. thermophilus could economize on lactose consumption by consuming amino acids secreted by L. bulgaricus. We found that in the optimal flux distribution, all peptides released by proteolysis by L. bulgaricus were also taken up by L. bulgaricus. In this scenario, S. thermophilus profits from proteolysis exclusively via the AA excreted by L. bulgaricus. These AA were, however, partly still accumulating in the medium. In silico, L. bulgaricus profits from proteolysis and amino acid secretion, as AA export results in proton extrusion which corresponds to the generation of 1/3 ATP per exported AA. Since uptake of 1 amino acid via the Opp transport system costs on average 1/9 ATP (8), the model predicts that the operation of this pathway results in energy generation.
Figure 4: Expansion of growth rate potential in mixed culture compared to mono-culture. Dark grey square area is the growth rate range in mono-culture, light grey triangle area the range in the mixed culture. The arrow points to the result obtained if the growth ratio is fixed at 1.
When we used the second modeling technique, i.e. maximizing one species as
a function of the other, we found that the maximal yield of S. thermophilus was 2.2, with the yield for L. bulgaricus being 0.7. Alternatively, the maximal yield of L. bulgaricus was 2.1, with the yield for S. thermophilus maximally being 0.3. This is a substantial increase in biomass yield which is in close agreement with the total biomass produced when growth rates were fixed to equal rates (see Figure 4). The increase in yield was confirmed experimentally (see Table 2) and in literature (6, 11, 26). However, in the current optimization scenario’s, peptide uptake was
183
Chapter 6
equally divided between S. thermophilus and L. bulgaricus when growth for S. thermophilus was maximized. Moreover, since growth of L bulgaricus was relatively low (0.3), not all casein could be proteolysed (see constraints Eq. 2) suggesting - much to our surprise - that already at very low growth rates of L. bulgaricus, the competition for lactose outweighs the benefit of peptide or amino acid provision to S. thermophilus. As expected, S. thermophilus peptide uptake was zero when growth of L. bulgaricus was maximized.
DISCUSSION AND FUTURE PROSPECTS
We have developed two functional genome-scale metabolic models of S. thermophilus and L. bulgaricus. Based on an in silico simulation of knock-outs and in silico growth, we were able to confirm metabolites that are exchanged between the two bacteria in milk. These were formic acid, folic acid (provided by S. thermophilus) and AA (released by proteolysis by L. bulgaricus). These interactions resulted in a total yield of the mixed culture that was increased 2.3-2.5 fold compared to the mono-cultures. That means that the interaction between the two organisms, despite lower uptake of lactose per g DW (57 mmol gDW-1 instead of 140 and 170 for L. bulgaricus and S. thermophilus, respectively), resulted in a much larger possible range of growth rates (see Figure 4). Indeed, the amount of lactose consumed per g of biomass was 2.5-3.0 fold lower in our experimental data. The lower uptake of lactose can partly be explained by lower EPS production compared to the biomass production (2.2 g per g biomass in the evolved mixed culture versus 4.2 g and 4.7 g for the S. thermophilus and L. bulgaricus mono-cultures, respectively, see Table 2). That is striking, because genes coding for EPS biosynthesis were shown to be higher expressed in mixed culture in a previous study (26). The lower uptake of lactose per g produced biomass can also partly be explained by less spilling of AA into the medium. The AA secreted by L. bulgaricus were utilized by S. thermophilus, reducing the need for lactose for de novo AA production. The modeling exercise also showed the extent of uncoupling that is possible in milk between ATP production through glycolysis and growth. Although some improvement is seen in the evolved mono-cultures compared to the parental ones (see Table 2), the real improvement in lactose yield is caused by the provision of essential growth components by the other species in mixed cultures. The nature of the limitation is still speculative at the moment due to lack of required data sets, but the explanation provided by the model seems insensitive to the exact
184
Genome-scale metabolic model for the prediction of interactions
molecules being exchanged, and formate appears a reasonable proxy for that purpose.
By calculating fluxes using fermentation data, we were able to nearly close the carbon balance of the S. thermophilus model, but were not successful in closing that of L. bulgaricus. The consumed galactose moiety from lactose was much higher (25%) than the secreted galactose, either as galactose monomers or as EPS. With few exceptions (4), L. bulgaricus was reported to be unable to utilize galactose due to the absence of a galT gene (10, 33). Indeed, blasting the galT gene of L. plantarum WCFS1 against the L. bulgaricus ATCC BAA-365 genome showed that this gene is not present. We have not been able to find an explanation for the galactose gap so far. The measured AA secretion by L. bulgaricus did not correspond to that predicted by the model, i.e. on average it was 3 fold higher. Moreover, the ratio between the experimentally measured and the predicted AA secretion differed for a number of AA (i.e. ala, arg, ile, phe and trp). This may have two explanations: (i) L. bulgaricus also grows on free peptides in milk that have a different composition than casein or (ii) the AA content of L. bulgaricus biomass is significantly different from that of L. plantarum, of which the AA content was taken as that of L. bulgaricus (30). Explanation (i) is also supported by the growth of S. thermophilus in mono-culture. As this organism is non-proteolytic, auxotroph for histidine, which is present as free AA in a negligible quantity in milk (24 µM), S. thermophilus probably has another source of histidine, such as small peptides present in milk.
The current mixed culture model is not finished yet, but it allows the yoghurt consortium to grown in silico and predicts the type of mutualistic interactions of which we know that they do occur (11, 23, 26). This model fulfills the requirements for a novel class of predictive microbial growth models (35): because it is whole-genome based, it takes into account the interactions between both consortium members and has therefore a much higher molecular resolution than previous models (6, 27). Furthermore, the model can be updated with new information of reactions catalyzed by enzymes in both species and with experimental data, improving the accuracy of the model. At this moment, we propose the inclusion of other fermentation data such as the production of volatile components (the quantity of produced acetaldehyde, diacetyl and acetone by these bacteria is significant (24)) and the quantity of folic acid, produced by S. thermophilus and consumed by L. bulgaricus (7), that is available in the medium. Further improvements may deal with the discrepancies between (i) measured and predicted AA secretion by L. bulgaricus and (ii) the content of casein and the free AA in milk after fermentation. Therefore, the precise AA content of L. bulgaricus and S. thermophilus should be
185
Chapter 6
experimentally determined. Moreover, the presence and AA content of peptides initially present in milk should be studied. Finally, the gap in the carbon balance of L. bulgaricus should be fixed, possibly by the identification of other means of galactose metabolism (i.e. a currently unknown galactose utilization pathway) or by measuring more potential end products of primary metabolism. Once these improvements of the mono-culture models and the mixed culture model provide a reliable representation of the fermentation, it should be possible to model the different growth phases of the fermentations, providing predictions of the extent and the nature of the interactions between S. thermophilus and L. bulgaricus.
It is expected that these models, when elaborated as described above, will be suitable also to predict the performance of this culture in other dairy or non dairy substrates. Furthermore, as sequencing and genome-scale modeling rapidly develop, we anticipate that multi-strain and community genome-scale models will find wider application in research on microbial ecosystems. REFERENCES 1. Aguirre-Ezkauriatza, E. J., M. G. Galarza-Gonzalez, A. I. Uribe-Bujanda, M. Rios-Licea, F.
Lopez-Pacheco, C. M. Hernandez-Brenes, and M. M. Alvarez. 2008. Effect of mixing during fermentation in yogurt manufacturing. J Dairy Sci 91:4454-4465.
2. Bernaerts, K., E. Dens, K. Vereecken, A. H. Geeraerd, A. R. Standaert, F. Devlieghere, J. Debevere, and J. F. Van Impe. 2004. Concepts and tools for predictive modeling of microbial dynamics. J Food Prot 67:2041-2052.
3. Bolotin, A., B. Quinquis, P. Renault, A. Sorokin, S. D. Ehrlich, S. Kulakauskas, A. Lapidus, E. Goltsman, M. Mazur, G. D. Pusch, M. Fonstein, R. Overbeek, N. Kyprides, B. Purnelle, D. Prozzi, K. Ngui, D. Masuy, F. Hancy, S. Burteau, M. Boutry, J. Delcour, A. Goffeau, and P. Hols. 2004. Complete sequence and comparative genome analysis of the dairy bacterium Streptococcus thermophilus. Nat Biotechnol 22:1554-1558.
4. Burgos-Rubio, C. N., M. R. Okos, and P. C. Wankat. 2000. Kinetic study of the conversion of different substrates to lactic acid using Lactobacillus bulgaricus. Biotechnol Prog 16:305-314.
5. Courtin, P., V. Monnet, and F. Rul. 2002. Cell-wall proteinases PrtS and PrtB have a different role in Streptococcus thermophilus/Lactobacillus bulgaricus mixed cultures in milk. Microbiology 148:3413-3421.
6. Courtin, P., and F. Rul. 2004. Interactions between microorganisms in a simple ecosystem: yogurt bacteria as a study model. Lait 84:125-134.
7. Crittenden, R. G., N. R. Martinez, and M. J. Playne. 2003. Synthesis and utilisation of folate by yoghurt starter cultures and probiotic bacteria. Int J Food Microbiol 80:217-222.
8. Detmers, F. J. M., F. C. Lanfermeijer, R. Abele, R. W. Jack, R. Tampe, W. N. Konings, and B. Poolman. 2000. Combinatorial peptide libraries reveal the ligand-binding mechanism of the oligopeptide receptor OppA of Lactococcus lactis. Proceedings of the National Academy of Sciences of the United States of America 97:12487-12492.
9. Driessen, F. M., F. Kingma, and J. Stadhouders. 1982. Evidence that Lactobacillus bulgaricus in yoghurt is stimulated by carbon dioxide produced by Streptococcus thermophilus. Netherlands Milk and Dairy Journal 36:135-144.
186

Genome-scale metabolic model for the prediction of interactions
10. Germond, J. E., L. Lapierre, M. Delley, B. Mollet, G. E. Felis, and F. Dellaglio. 2003. Evolution of the bacterial species Lactobacillus delbrueckii: a partial genomic study with reflections on prokaryotic species concept. Mol Biol Evol 20:93-104.
11. Herve-Jimenez, L., I. Guillouard, E. Guedon, S. Boudebbouze, P. Hols, V. Monnet, E. Maguin, and F. Rul. 2009. Postgenomic analysis of Streptococcus thermophilus cocultivated in milk with Lactobacillus delbrueckii subsp. bulgaricus: involvement of nitrogen, purine, and iron metabolism. Appl Environ Microbiol 75:2062-2073.
12. Herve-Jimenez, L., I. Guillouard, E. Guedon, C. Gautier, S. Boudebbouze, P. Hols, V. Monnet, F. Rul, and E. Maguin. 2008. Physiology of Streptococcus thermophilus during the late stage of milk fermentation with special regard to sulfur amino-acid metabolism. Proteomics 8:4273-4286.
13. Keller, L., and M. G. Surette. 2006. Communication in bacteria: an ecological and evolutionary perspective. Nat Rev Microbiol 4:249-258.
14. Letort, C., M. Nardi, P. Garault, V. Monnet, and V. Juillard. 2002. Casein utilization by Streptococcus thermophilus results in a diauxic growth in milk. Appl Environ Microbiol 68:3162-3165.
15. Looijesteijn, P. J., I. C. Boels, M. Kleerebezem, and J. Hugenholtz. 1999. Regulation of exopolysaccharide production by Lactococcus lactis subsp. cremoris by the sugar source. Appl Environ Microbiol 65:5003-5008.
16. Makarova, K., A. Slesarev, Y. Wolf, A. Sorokin, B. Mirkin, E. Koonin, A. Pavlov, N. Pavlova, V. Karamychev, N. Polouchine, V. Shakhova, I. Grigoriev, Y. Lou, D. Rohksar, S. Lucas, K. Huang, D. M. Goodstein, T. Hawkins, V. Plengvidhya, D. Welker, J. Hughes, Y. Goh, A. Benson, K. Baldwin, J. H. Lee, I. Diaz-Muniz, B. Dosti, V. Smeianov, W. Wechter, R. Barabote, G. Lorca, E. Altermann, R. Barrangou, B. Ganesan, Y. Xie, H. Rawsthorne, D. Tamir, C. Parker, F. Breidt, J. Broadbent, R. Hutkins, D. O'Sullivan, J. Steele, G. Unlu, M. Saier, T. Klaenhammer, P. Richardson, S. Kozyavkin, B. Weimer, and D. Mills. 2006. Comparative genomics of the lactic acid bacteria. Proc Natl Acad Sci U S A 103:15611-15616.
17. Nadell, C. D., J. B. Xavier, and K. R. Foster. 2009. The sociobiology of biofilms. FEMS Microbiol Rev 33:206-224.
18. Notebaart, R. A., F. H. van Enckevort, C. Francke, R. J. Siezen, and B. Teusink. 2006. Accelerating the reconstruction of genome-scale metabolic networks. BMC Bioinformatics 7:296.
19. Oh, Y. K., B. O. Palsson, S. M. Park, C. H. Schilling, and R. Mahadevan. 2007. Genome-scale reconstruction of metabolic network in Bacillus subtilis based on high-throughput phenotyping and gene essentiality data. J Biol Chem 282:28791-28799.
20. Pastink, M. I., B. Teusink, P. Hols, S. Visser, W. M. de Vos, and J. Hugenholtz. 2009. Genome-scale model of Streptococcus thermophilus LMG18311 for metabolic comparison of lactic acid bacteria. Appl Environ Microbiol 75:3627-3633.
21. Pedersen, M. B., B. J. Koebmann, P. R. Jensen, and D. Nilsson. 2002. Increasing acidification of nonreplicating Lactococcus lactis deltathyA mutants by incorporating ATPase activity. Appl Environ Microbiol 68:5249-5257.
22. Rodriguez, J., R. Kleerebezem, J. M. Lema, and M. C. van Loosdrecht. 2006. Modeling product formation in anaerobic mixed culture fermentations. Biotechnol Bioeng 93:592-606.
23. Sieuwerts, S., F. A. de Bok, J. Hugenholtz, and J. E. van Hylckama Vlieg. 2008. Unraveling microbial interactions in food fermentations: from classical to genomics approaches. Appl Environ Microbiol 74:4997-5007.
24. Sieuwerts, S., F. A. M. de Bok, C. J. Ingham, M. Beerthuyzen, S. A. F. T. van Hijum, D. Molenaar, P. M. Slegers, E. H. Tolls, W. M. de Vos, and J. E. T. van Hylckama Vlieg. 2009. Experimental evolution of of yoghurt cultures improves co-culture growth and interactions. This thesis Ch. 5.
25. Sieuwerts, S., F. A. M. de Bok, E. Mols, W. M. de Vos, and J. E. T. van Hylckama Vlieg. 2008. A simple and fast method for determining colony forming units. Lett Appl Microbiol 47:275-278.
26. Sieuwerts, S., D. Molenaar, S. A. F. T. van Hijum, C. Ingham, M. Beerthuyzen, M. J. A. Stevens, I. van Alen, P. W. M. Janssen, F. A. M. de Bok, W. M. de Vos, and J. E. T. van Hylckama Vlieg. 2009. Mixed culture transcriptome analysis reveals the molecular basis of
187
Chapter 6
188
co-culture growth and its consequences in Streptococcus thermophilus and Lactobacillus bulgaricus. This thesis Ch. 4.
27. Sodini, I., E. Latrille, and G. Corrieu. 2000. Identification of interacting mixed cultures of lactic acid bacteria by their exclusion from a model predicting the acidifying activity of non-interacting mixed cultures. Appl Microbiol Biotechnol 54:715-718.
28. Stolyar, S., S. Van Dien, K. L. Hillesland, N. Pinel, T. J. Lie, J. A. Leigh, and D. A. Stahl. 2007. Metabolic modeling of a mutualistic microbial community. Mol Syst Biol 3:92.
29. Sundararajan, T. A., and P. S. Sarma. 1957. Preparation and amino acid composition of enzymically dephosphorylated casein. Biochem J 65:261-266.
30. Teusink, B., F. H. van Enckevort, C. Francke, A. Wiersma, A. Wegkamp, E. J. Smid, and R. J. Siezen. 2005. In silico reconstruction of the metabolic pathways of Lactobacillus plantarum: comparing predictions of nutrient requirements with those from growth experiments. Appl Environ Microbiol 71:7253-7262.
31. Teusink, B., A. Wiersma, L. Jacobs, R. A. Notebaart, and E. J. Smid. 2009. Understanding the adaptive growth strategy of Lactobacillus plantarum by in silico optimisation. PLoS Comput Biol 5:e1000410.
32. Teusink, B., A. Wiersma, D. Molenaar, C. Francke, W. M. de Vos, R. J. Siezen, and E. J. Smid. 2006. Analysis of growth of Lactobacillus plantarum WCFS1 on a complex medium using a genome-scale metabolic model. J Biol Chem 281:40041-40048.
33. Turner, K. W., and F. G. Martley. 1983. Galactose Fermentation and Classification of Thermophilic Lactobacilli. Appl Environ Microbiol 45:1932-1934.
34. van de Guchte, M., S. Penaud, C. Grimaldi, V. Barbe, K. Bryson, P. Nicolas, C. Robert, S. Oztas, S. Mangenot, A. Couloux, V. Loux, R. Dervyn, R. Bossy, A. Bolotin, J. M. Batto, T. Walunas, J. F. Gibrat, P. Bessieres, J. Weissenbach, S. D. Ehrlich, and E. Maguin. 2006. The complete genome sequence of Lactobacillus bulgaricus reveals extensive and ongoing reductive evolution. Proc Natl Acad Sci U S A 103:9274-9279.
35. Van Impe, J. F., F. Poschet, A. H. Geeraerd, and K. M. Vereecken. 2005. Towards a novel class of predictive microbial growth models. Int J Food Microbiol 100:97-105.


Chapter 7
Summary, discussion and future perspectives
191
Chapter 7
INTRODUCTION AND SUMMARY Most microbial ecosystems consist of multiple species. The interactions between consortium members in these systems are at the base of the performances of the individual bacteria. Consequently, in fermentations the interactions between microbes are very important for the culture’s performance and the quality of the fermented foods. There is a strong need in industry to improve the efficiency of existing industrial fermentations or to develop more sustainable processes. In addition, the current market trends demand a wider range of healthy fermented foods (20) and the application of strains marketed as probiotics. These trends underpin the importance of characterizing the interactions between microorganisms, not only quantitatively, but also qualitatively by unraveling the underlying molecular mechanisms. This also includes a higher predictability of (the interactions involved in) the final microbial composition of fermentations (42). Moreover, there is considerable interest in the interactions that structure microbial communities from an ecological (29, 36) and evolutionary (36, 37) perspective. Therefore, unraveling the interactions between the microbes in a fermentation is highly relevant from an industrial and a scientific point of view.
A well-studied fermentation is the one carried out by the lactic acid bacteria (LAB) Streptococcus thermophilus and Lactobacillus delbrueckii subsp. bulgaricus. The combined action of these two bacteria turns milk into yoghurt. It has been recognized in the first half of the 20th century that these two LAB stimulate each other in growth and acid production when co-cultivated (49). This mutual stimulation is also referred to as protocooperation. The basis behind this protocooperation has partly been unraveled in the last six decades. It was shown that S. thermophilus stimulates L. bulgaricus by supplying formic acid (16), folic acid (9, 59) and CO2 (18), all involved in purine metabolism. L. bulgaricus, in turn, provides S. thermophilus with peptides and amino acids (AA) released from milk casein with its exoprotease PrtB (8). With the classical microbiological methods that were available until the 1980’s, it was not possible to further unravel the molecular basis behind these interactions. However, the availability of genome sequences of these bacteria and of ~omics tools the last decade meant a breakthrough in interaction research (26, 38). A number of post-genomic studies of the yoghurt fermentation revealed the involvement of sulfur AA, branched-chain AA (BCAA) specifically in the protocooperation between S. thermophilus and L. bulgaricus (33, 34). The research described in this thesis aimed at further unraveling the interactions between these two species using an integrated approach of classical and novel techniques and methodologies. As these novel
192
Summary, discussion and future perspectives
techniques are based on ~omics approaches, two sequenced strains, namely S. thermophilus CNRZ1066 and L. bulgaricus ATCC BAA-365, were used in all studies. Chapter 1 gave a general introduction to the subject and briefly discussed the novel techniques that were used in this thesis research, i.e. transcription profiling, high-throughput screening and next-generation sequencing. Also experimental evolution and genome-scale metabolic modeling were briefly introduced. Chapter 2 summarized the status of mixed culture research in general and of the yoghurt consortium in more detail. In addition, it described the current trends in the use of ~omics in mixed culture research. Chapter 3 described a tool for rapid assessment of viable counts of microorganisms in (mixed) cultures. This method was used in the research of Chapters 4, 5 and 6. In Chapter 4, a combination of transcriptomics and screening was used to identify the genetic and physiological basis behind the interactions between the two yoghurt bacteria grown in milk (see also the section below). It confirmed that interactions between the yoghurt bacteria are based on the exchange of formic acid, folic acid and AA. Supply of sulfur AA and BCAA through proteolysis was not sufficient to sustain the increased growth in mixed culture, leading to a higher expression of sulfur AA and BCAA production genes in both species. Moreover, it was shown that exopolysaccharide (EPS) synthesis genes were higher expressed in both species in mixed culture and that L. bulgaricus lowered the expression of long-chain fatty acids (LCFA) biosynthesis upon co-culture, possibly due to lipolytic action of S. thermophilus. In Chapter 5, the two sequenced strains of S. thermophilus and L. bulgaricus that that had no history of co-cultivation were co-evolved for ~1000 generations in milk. A detailed analysis of fermentation profiles (e.g. acidification rate), gene expression, and mutations further elucidated the molecular basis behind their protocooperation. Moreover, it was shown that as little as ~1000 generations of co-evolution is sufficient to adapt a relatively slow growing and acidifying mixed culture into one that is comparable to a commercial starter in terms of acidification rate and EPS production. The development of a genome-based mixed culture model of the yoghurt fermentation was discussed in Chapter 6. Although the model is currently still in development, various predictions could be made about the interactions based on the genome content of the two species. Indeed, the predicted interactions included AA metabolism (i.e. proteolysis) and purine metabolism (i.e. formic acid and folic acid), which was already experimentally confirmed in Chapter 4. Using flux balance analysis (FBA), it was possible to determine the effects of the protocooperation on biomass yields on lactose. The biomass yields were found to be significantly improved in the mixed culture compared to the mono-cultures. The general discussion below will
193
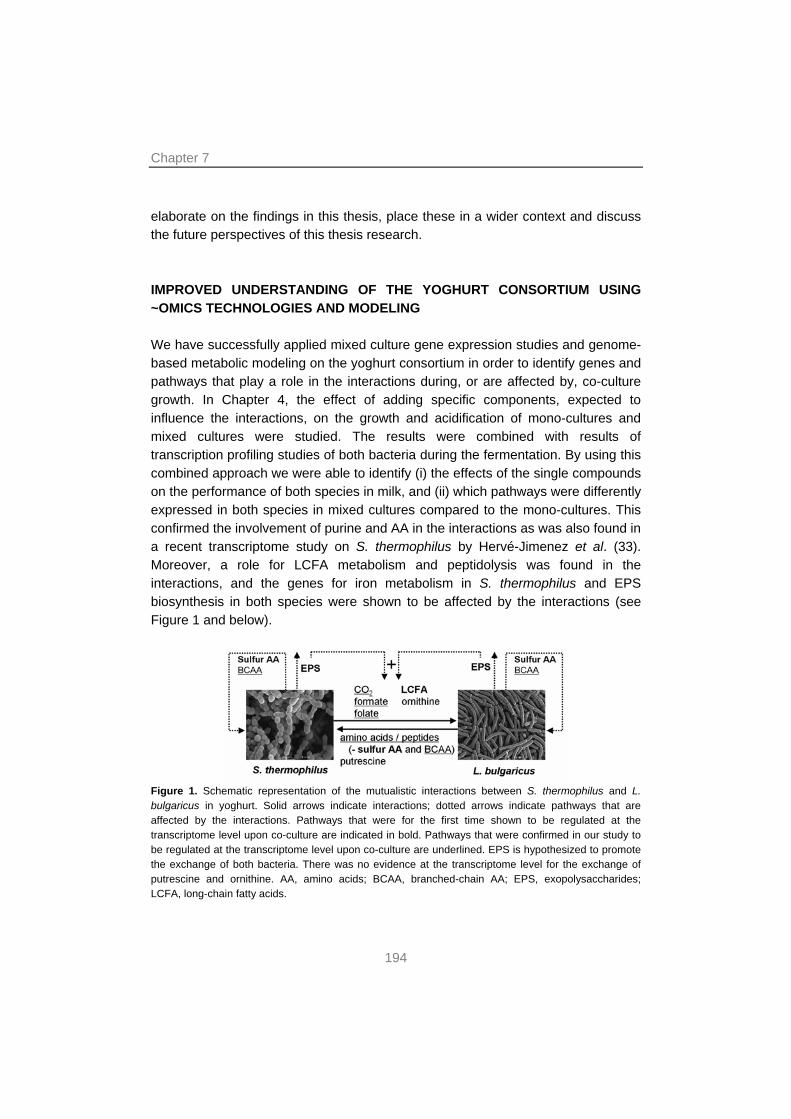
Chapter 7
elaborate on the findings in this thesis, place these in a wider context and discuss the future perspectives of this thesis research. IMPROVED UNDERSTANDING OF THE YOGHURT CONSORTIUM USING ~OMICS TECHNOLOGIES AND MODELING We have successfully applied mixed culture gene expression studies and genome-based metabolic modeling on the yoghurt consortium in order to identify genes and pathways that play a role in the interactions during, or are affected by, co-culture growth. In Chapter 4, the effect of adding specific components, expected to influence the interactions, on the growth and acidification of mono-cultures and mixed cultures were studied. The results were combined with results of transcription profiling studies of both bacteria during the fermentation. By using this combined approach we were able to identify (i) the effects of the single compounds on the performance of both species in milk, and (ii) which pathways were differently expressed in both species in mixed cultures compared to the mono-cultures. This confirmed the involvement of purine and AA in the interactions as was also found in a recent transcriptome study on S. thermophilus by Hervé-Jimenez et al. (33). Moreover, a role for LCFA metabolism and peptidolysis was found in the interactions, and the genes for iron metabolism in S. thermophilus and EPS biosynthesis in both species were shown to be affected by the interactions (see Figure 1 and below).
Figure 1. Schematic representation of the mutualistic interactions between S. thermophilus and L. bulgaricus in yoghurt. Solid arrows indicate interactions; dotted arrows indicate pathways that are affected by the interactions. Pathways that were for the first time shown to be regulated at the transcriptome level upon co-culture are indicated in bold. Pathways that were confirmed in our study to be regulated at the transcriptome level upon co-culture are underlined. EPS is hypothesized to promote the exchange of both bacteria. There was no evidence at the transcriptome level for the exchange of putrescine and ornithine. AA, amino acids; BCAA, branched-chain AA; EPS, exopolysaccharides; LCFA, long-chain fatty acids.
194
Summary, discussion and future perspectives
Long-chain fatty acids acquisition by L. bulgaricus. It was shown that L. bulgaricus lowered the expression of LCFA biosynthesis genes (i.e. those coding for decarboxylases, hydrolases, oxidoreductases and acyltransferases) in mixed culture. The last step in the phosphatidic acid synthesis from acyl-carrier proteins containing the fatty acid chains was higher expressed in mixed than in mono-culture. Although LCFA such as lauric acid and oleic acid had previously been reported to stimulate the growth of L. bulgaricus (47), no attempts have been made to link this to the protocooperation between the yoghurt bacteria. In an earlier study, several genes involved in fatty acid production (fabH, accC and fabI) were higher expressed in L. bulgaricus as an adaptation to an acidic (pH 4.2) environment (23). However, these genes (LBUL_0822, LBUL_0829 and LBUL_0828 in L. bulgaricus ATCC BAA-365, respectively) were 3-10-fold lower expressed in mixed culture compared to mono-culture despite the lower pH. This suggests that the acyl-carrier proteins were loaded with fatty acid chains from another source, for instance fatty acids liberated from milk fat by the lipolytic action of S. thermophilus (53). It is not clear how these fatty acids are taken up by L. bulgaricus, but evidently this species is capable of utilizing fatty acids from the medium (47). Possibly, this role is executed by the so far uncharacterized LBUL_0063 identified in Chapter 5. The S. thermophilus genome encodes multiple lipolytic enzymes (3, 25, 39) that also play a role in the flavor formation (48).
Branched-chain and sulfur amino acids. It was stated in Chapter 4 that the proteolytic activity of L. bulgaricus does not supply a sufficient amount of BCAA leading to a higher expression of de novo synthesis of this pathway in both species. This is notably the case for the BCAA transaminase (LBUL_1219 and str0590) responsible for the formation of valine, leucine and isoleucine from 3-methyl-2oxobutanoate, 4-methyl-2-oxopentanoate and (S)-3-methyl-2-oxopentanoate, respectively. This is most likely due to the high abundance of valine, leucine and isoleucine in the total proteomes of S. thermophilus (33) and L. bulgaricus (GenomeAtlas database (30)). Moreover, the pathways for sulfur AA biosynthesis were upregulated in both species when grown in a mixed culture. This may be due to the low amount of sulfur AA in casein (cysteine 0.35% and methionine 2.9%) (58) that becomes available during proteolysis of milk compared to that of the proteome of S. thermophilus and L. bulgaricus (cysteine ~1% and methionine ~2%). Indeed, the measured levels of free cysteine and methionine were very low. In addition, it was previously reported based on a transcription profiling approach with a S. thermophilus mono-culture that sulfur AA limitation is likely to occur, particularly in the later stages of fermentation, and that this also occurs in mixed culture (34).
195
Chapter 7
Exopolysaccharide biosynthesis. EPS is mainly synthesized in the later phases of fermentation (4). Although there has not been assigned an evident function for EPS in yoghurt, it is possible that EPS plays a role in acid resistance (45) or in facilitating exchange of metabolites by allowing stable close proximities or even physical contact between the two species, which is likely also the function of EPS in kefir (6, 7). In addition, the combination of different EPS-producing strains of S. thermophilus was shown to stimulate total EPS production in mixed culture (14, 24). However, these observations had not yet been linked to gene expression. Interestingly, in Chapter 4 it was shown that the expression of EPS biosynthesis genes in both species was increased during growth in mixed culture. Furthermore, this was confirmed in a transcription profiling study of mixed culture biofilms, suggesting that this effect is generic. Basically, there were two reasons to choose for biofilm growth to confirm this effect: (i) when grown in biofilms, there is a forced physical contact between S. thermophilus and L. bulgaricus strengthening potential interactions; (ii) biofilms are relatively well accessible for analytical techniques such as staining and microscopy compared to liquid cultures (see also Chapter 4). Indeed, the mixed culture biofilm showed a stronger staining by Wheat-Germ Agglutin, a lectin that is commonly used for staining polysaccharides, than the mono-culture biofilm (31). In fact, the EPS concentrations after 24 h culturing at 42°C increased from 0.80±0.02 g/L in a S. thermophilus mono-culture and 1.18±0.12 g/L in a L. bulgaricus mono-culture to 1.46±0.04 g/L in the mixed culture. In the cultures with the evolved strains from Chapter 5 this was 1.35±0.26 g/L, 1.52±0.03 g/L and 3.91±0.48 g/L, respectively. This all underpins the importance of EPS for the bacteria, especially in mixed culture.
Mixed culture metabolic modeling. In Chapter 6, the development of a mixed culture metabolic model, which was based on the genome content of both species, was presented. It confirmed that the interactions were based on the exchange of formic acid, folic acid and on AA metabolism. By measuring the biomass and EPS production and by determining the fluxes of lactose and fermentation products, it was possible to calculate the yield of biomass on lactose. This was substantially higher (2.3-2.9 fold) in the mixed culture than in the corresponding mono-cultures, which can be explained by a lower EPS production per g of total biomass and by the benefits of the interactions. In the model, these benefits included less spilling of AA. That means that S. thermophilus consumed a part of the AA that were released by proteolysis and peptidolysis by L. bulgaricus, i.e. L. bulgaricus consumed all the released peptides and secreted all AA, except the one that was limiting growth. Subsequently, S. thermophilus could consume these AA in stead of synthesizing them itself, saving energy and thus lactose.
196
Summary, discussion and future perspectives
However, in the mixed culture transcriptome study (Chapter 4), it was shown that S. thermophilus in mixed culture mainly upregulates peptide transporters and peptidases in stead of AA transporters. In addition, the carbon balance of L. bulgaricus was not closed: around 25% of the consumed galactose moiety in lactose could not be found as secreted galactose monomers or in EPS. Due to the absence of a galT gene (10, 32).L. bulgaricus can not utilize galactose (27, 60). These two discrepancies should still be dealt with in order to make the mixed culture model sufficiently predictive.
In conclusion, there is strong evidence from various studies (physiological, transcription profiling, experimental evolution and genome-scale metabolic modeling) that the interactions between S. thermophilus and L. bulgaricus are based on the exchange of various growth factors provided by S. thermophilus, proteolysis (executed by L. bulgaricus) and lipolysis (executed by S. thermophilus). The growth factors provided by S. thermophilus are related to purine and AA biosynthesis: formic acid, folic acid and CO2 (the latter is not discussed here, see Chapter 4). In addition, there is a potential role for EPS in facilitating these nutritional exchanges (see Figure 1). There was no evidence for the exchange of ornithine and putrescine as suggested by Van de Guchte et al. (62), but it can not be excluded if any benefits resulting from their exchange do not lead to evident differential gene expression or increased growth. EXPERIMENTAL EVOLUTION IMPROVES KEY CHARACTERISTICS OF YOGHURT PRODUCTION REPRODUCIBLY In Chapter 5, experimental evolution has proven to be a useful methodology for the optimization of mixed culture fermentations. For the development of novel industrial starters, or for the improvement of existing ones, it is definitely worthwhile to investigate the possibilities of experimental evolution. In this thesis research, a relatively slow growing and acidifying mixed culture (i.e. S. thermophilus CNRZ1066 and L. bulgaricus ATCC BAA-365) was turned into one that can meet with commercial starters in the course of ~1000 generations of co-culture. The acidification rate increased step-wise (see Figure 1 in Chapter 5) caused by the accumulation of rare beneficial mutations (21, 35). The acidification rate of the evolved mixed culture was closer to that of the commercial starter yoghurt culture I-St than to its own parental mixed culture. Moreover, the efficiency of biomass production increased from 0.12 g/mol consumed lactose in the parental culture to 0.22 g/mol in the evolved culture (this is 0.30 g/mol for the commercial culture I-St)
197

Chapter 7
during exponential growth. That indicates that either the metabolism of the evolved organisms compared to their parental strains had become more efficient, or that the interactions between the two species improved making the evolved mixed culture more efficient than the original mixed culture. The flux balance analysis in Chapter 6 and the improved stimulation of parental strains by evolved strains suggest that both instances occurred.
The amount of produced EPS in 24 h more than doubled from 1.46 g/L by the parental mixed culture to 3.91 g/L by the evolved mixed culture (see also above). This was also reflected in the culture’s viscosity, which also increased by a factor of 2.6-2.8. The viscosity of the evolved culture was comparable to – or even higher than – that of the commercial starter composed of S. thermophilus Sts and L. bulgaricus Ib. This higher production of EPS was related to the higher expression of EPS biosynthesis genes, notably in S. thermophilus. Interestingly, the increase in EPS production, visualized in biofilms, also occurred step-wise (see Figure 2), indicating that the higher production is not solely due to the higher quantity of cells in the evolved culture. Unfortunately, no mutation was found that clearly indicates the cause of this higher EPS production in evolved strains compared to their parental strains.
Generations: 0 49 365 1009 Figure 2. SEM images of S. thermophilus cells grown as mono-culture biofilms in the course of evolution. Single colony isolates were selected from the evolving culture and grown on anopore as mono-culture before imaging. The increasing extracellular matrix is assumed to be EPS (see Chapter 4).
It appears to be not a coincidence that specifically these improvements (faster
acidification, more growth and more EPS production) occur during experimental evolution with the strict growth regime discussed in Chapter 5. A second culture of S. thermophilus and L. bulgaricus that had undergone the same process also showed a higher acidification rate and a higher viscosity. It was shown that this second evolved S. thermophilus had mutations compared to the parental strains in three of the same sites. Gene expression studies showed upregulation of the same pathways as the strains from the other evolved culture. This is by itself not very
198
Summary, discussion and future perspectives
surprising as the optimization strategies of comparable cultures in the same ecological conditions are likely to be similar (55, 63). Interestingly, the gene expression study showed that in particular pathways involved in folic acid (L. bulgaricus), sulfur AA, BCAA, LCFA (L. bulgaricus) and EPS were differentially expressed between the evolved and parental strains. This indicates the fine-tuning of interactions in order to maximize growth in both species.
Novel types of mixed cultures show similar improvements. The experimental evolution procedures (Chapter 5) were also applied to uncommon species combinations containing the probiotic Lactobacillus plantarum. Previously, it had been shown that growth of some L. plantarum strains was stimulated by L. bulgaricus, but there was no stimulation of yoghurt bacteria by L. plantarum (12). All possible two-species and three-species combinations of S. thermophilus, L. bulgaricus and five different L. plantarum strains were prepared (see Table 1). The two strains that probably have a higher number of IS elements (61) were assumed to have a potentially higher mutation rate and a correspondingly faster adaptation.
The step-wise increase in acidification rate reported for the two evolved yoghurt cultures was also evident in all five evolved cultures consisting of S. thermophilus and L. plantarum and the five three-species cultures (see Figure 3). It did not occur in any of the evolved cultures consisting of L. bulgaricus and L. plantarum. This implies that the step-wise increases in acidification rates were caused by mutations in S. thermophilus (13).
Table 1. The five L. plantarum strains that were co-evolved for ~1000 generations in milk with S. thermophilus CNRZ1066, L. bulgaricus ATCC BAA-365, or both. The rationale behind their use is stated at the right. The strains were obtained from NIZO food research, the Netherlands.
L. plantarum strain Rationale WCFS1 Reference strain with sequenced genome LMG9208 (NIZO 2806) Relative good growth in milk BLL(EI31) (NIZO 2830) Relative good growth in milk SECT4645 (NIZO 2776) High number of IS elements (61) NCTH19-1 (NIZO 2484) High number of IS elements (61)
As expected, all five L. plantarum strains remained stable in co-cultures with L.
bulgaricus. In the cultures containing S. thermophilus and L. plantarum, only the strains SECT4645 and NCTH19-1 were outcompeted within five transfers. That was due to their slow growth rate compared to the other three L. plantarum strains. When serial transfers were applied every other day, L. plantarum SECT4645 and NCTH19-1 stayed at a constant level in combination with S. thermophilus. In all three-species cultures, L. plantarum was present for at least 800 generations.
199
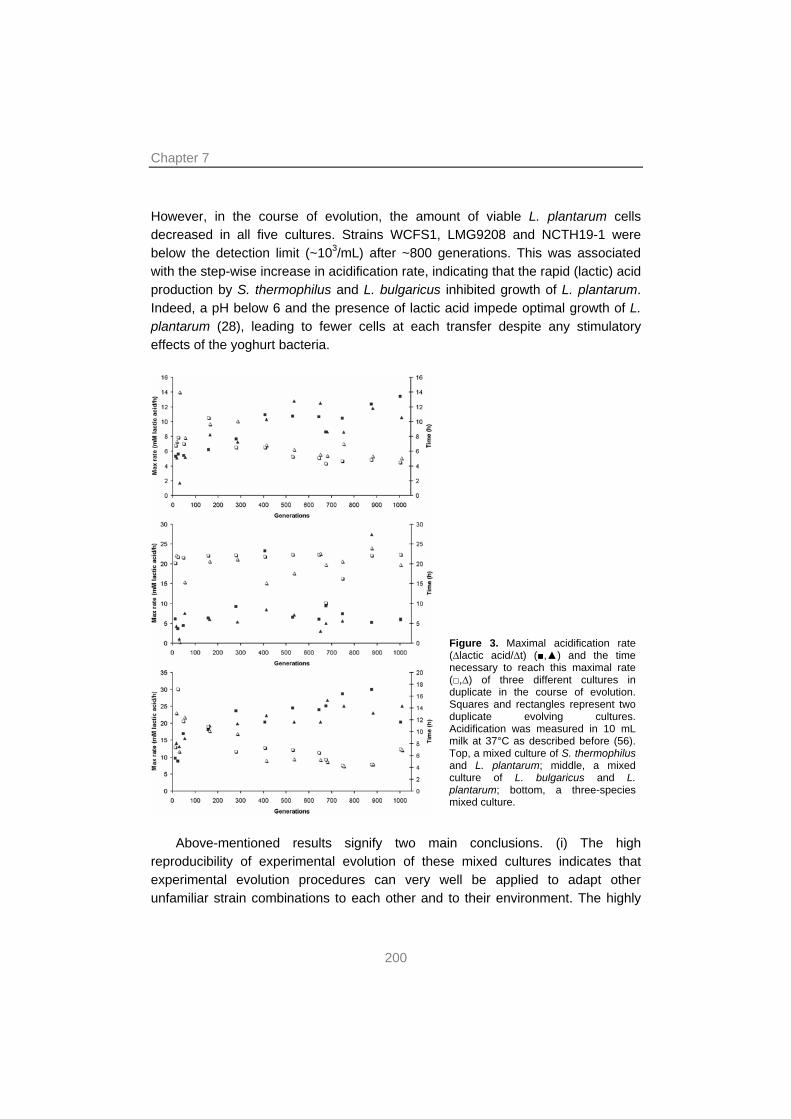
Chapter 7
However, in the course of evolution, the amount of viable L. plantarum cells decreased in all five cultures. Strains WCFS1, LMG9208 and NCTH19-1 were below the detection limit (~103/mL) after ~800 generations. This was associated with the step-wise increase in acidification rate, indicating that the rapid (lactic) acid production by S. thermophilus and L. bulgaricus inhibited growth of L. plantarum. Indeed, a pH below 6 and the presence of lactic acid impede optimal growth of L. plantarum (28), leading to fewer cells at each transfer despite any stimulatory effects of the yoghurt bacteria.
Figure 3. Maximal acidification rate (∆lactic acid/∆t) (■,▲) and the time necessary to reach this maximal rate (□,∆) of three different cultures in duplicate in the course of evolution. Squares and rectangles represent two duplicate evolving cultures. Acidification was measured in 10 mL milk at 37°C as described before (56). Top, a mixed culture of S. thermophilus and L. plantarum; middle, a mixed culture of L. bulgaricus and L. plantarum; bottom, a three-species mixed culture.
Above-mentioned results signify two main conclusions. (i) The high
reproducibility of experimental evolution of these mixed cultures indicates that experimental evolution procedures can very well be applied to adapt other unfamiliar strain combinations to each other and to their environment. The highly
200
Summary, discussion and future perspectives
reproducible outcome of experimental evolution had also been found for mono-cultures of Escherichia coli cells grown under a strict regime (63), supporting this conclusion. (ii) Although interactions between yoghurt bacteria also promote growth of other (probiotic) species, the interactions within new species combinations do not necessarily strengthen to form a well-performing stable mixed culture. That means that it may be necessary to rationally introduce nutritional dependencies in advance in order to stably include probiotics at a reasonable level (105-108 per gram of product (44)) in existing relatively optimal fermentations such as the yoghurt fermentation (10, 32) (see below). However, this is the case for L. plantarum and may not necessarily apply to other newly included species that already display mutually synergistic interactions. Moreover, the addition of probiotic species or strains in suboptimal systems, such as a combination with either S. thermophilus or L. bulgaricus, is more likely to succeed as there is much more room for improvement and the development of interdependencies (22, 51).
As discussed, in order to include probiotics in existing optimized mixed culture fermentations, rationally engineering of interactions may be necessary. Therefore, it is not only from a scientific but also from an industrial point of view relevant to identify the exact modes of interaction and their underlying molecular mechanisms in the current mixed cultures. Once the engineering of interactions between an endogenous species and the probiotic species has been performed, experimental evolution can be applied to optimize these new interactions and stabilize the new mixed culture. The high reproducibility of experimental evolution indicates that the outcome can – at least in part – be predicted based on the new (environmental) conditions the microorganisms find themselves in (15). The structure of the environment and the conditions used for the fermentations are therefore important considerations when applying experimental evolution (22, 51, 54). EVALUATION OF THE USED MODERN TECHNOLOGIES Transcription analysis with mixed culture microarrays. The face of transcription analysis has changed rapidly the past decade with the use of whole-genome analysis tools such as microarrays. Currently, there are many studies where microarrays containing probes targeting different species are used. Examples include the use of metatranscriptomics in the field of metagenomics such as in environmental microbial communities and fermented food products (46). Microarrays have also been used before to differentiate between different Bifidobacterium species in the intestine (2) and to study gene
201
Chapter 7
expression of one species in a mixed culture (33, 43). The use of microarrays targeting the whole genomes of both species in a food fermentation is novel. It is not trivial as the probes in the microarrays should be selective (see Chapter 4): the target gene in one of the species may be very similar to its orthologue in the other species, especially when closely related species are used. Moreover, the efficacy of the applied extraction method is essential for the quality of the extracted RNA (52). That is, one has to ensure that the method works equally efficient for both bacteria in order to circumvent a bias in the normalization of gene expression data if the hybridized cDNA of one species is overrepresented compared to that of the other species. This problem can be avoided by using next-generation sequencing of cDNA in stead of microarrays as discussed in (40), but this method is still in development. Next-generation sequencing. In Chapter 5, Illumina Solexa sequencing was used to identify mutations in the evolved strains of S. thermophilus and L. bulgaricus compared to their parental strains. The alignment of data is not trivial. Issues regarding local low coverage and repeatedly occurring sequences have been discussed in Chapter 1. Moreover, the choice of cut-offs is and the alignment method(s) applied are important factors in the reliability of the results (17, 57). We applied different alignment methods and filtered their results with a stringent cut-off for the quality score (see Chapter 5), providing the possibility to find substitutions as well as (one base and larger) insertions or deletions. Solexa sequencing has indeed proven to be a good method for the detection of mutations. Mixed culture metabolic modeling. Considering the rapid increase in papers discussing genome-scale metabolic modeling (no Pubmed hits before 2002, 25 in 2008 and 25 until July 1, 2009), there is a great and growing interest in this topic. That is not an odd development as such models provide a solid interpretative framework for experimental data related to gene content and metabolic state of the microorganism (19). Coupling two of these models in order to identify possible modes of interaction and their effects on both bacteria is a novel application. It is expected that the inadequacies of the current mixed culture model discussed above and in Chapter 6 can be settled in the near future.
202
Summary, discussion and future perspectives
CONCLUDING REMARKS AND FUTURE PERSPECTIVES This thesis research has provided novel insights in the protocooperation between S. thermophilus and L. bulgaricus, in particular in the molecular base behind these interactions (see Figure 1). It has not been shown before that EPS biosynthesis genes were induced in mixed culture in both species and that EPS production increased in the course of mixed culture experimental evolution. This strongly suggests that EPS has a function in the interactions, but the details of this function remain to be elucidated. Similarly, a novel finding is that genes coding for LCFA production in L. bulgaricus were lower expressed in mixed culture despite the higher use of LCFA to sustain a higher growth rate. It was suggested that lipolysis executed by S. thermophilus provides here a novel mode of interaction, but hard experimental evidence to confirm that still has to come. The gene LBUL_0063 is a good target to start with.
The extensive list of interactions based on nutritional exchanges indicates the complexity that can occur in a relatively simple (in terms of members involved) microbial community such as the yoghurt consortium. However, the interactions in this system are indicative for the types of interaction that can be expected in other mixed culture ecosystems. Experimental evolution (Chapter 5) and mixed culture modeling (Chapter 6) showed the extent of the benefits that microorganisms can achieve by cross-feeding in terms of increased growth rate and efficiency of metabolism. Indeed, there are numerous examples of cross-feeding interactions in the microbial world (5). In conclusion, nutritional interdependencies like in the yoghurt consortium are ubiquitous and likely structure and stabilize many different ecosystems (1, 11, 50). The post genomic approaches applied in this thesis have increased our understanding of this classic mixed culture fermentation process. Suggested further research might start with improving the annotation of the genomes, i.e. 32% of the COGs in S. thermophilus CNRZ1066 are not or poorly annotated (3); in L. bulgaricus ATCC BAA-365 this is 38% (41). The galactose sink and the production of formic acid by L. bulgaricus discussed in Chapter 6 clearly indicate that there are metabolic pathways operational for which the corresponding genes and proteins remain to be identified. Therefore, the mixed culture model will be elaborated in the near future as discussed. How can we apply the used methods in future research? The rapid plating method discussed in Chapter 3 can be implemented easily for any type of microbiological work that requires the assessment of large numbers of colonies. For this, there is no need for special equipment. Furthermore, it reduces the use of consumables and the concomitant production of waste by a factor 100 compared to conventional
203
Chapter 7
plating, which is becoming increasingly important in this era of environmental problems. The mixed culture microarrays can be used to evaluate the molecular responses of both yoghurt consortium members to various environmental factors. For example, the responses to supplementation of fatty acids to a yoghurt culture growing in fat-free milk may confirm the suggestion of lipolysis playing a role in the interactions. Moreover, by using transcription profiling of other strains, it will be possible to identify whether responses associated with co-culture are similar in other strain combinations.
Currently, most industrial mixed culture starters are selected by screening combinations of strains for desired properties. Given the results in this thesis, it is anticipated that directed experimental evolution of mixed cultures containing interesting strains or species, such as probiotics, can allow the production of industrially relevant starters that would not be selected otherwise. In addition, the new insights in the yoghurt consortium interactions provide targets for the rational development or optimization of stable mixed cultures, e.g. by introducing similar mutual dependencies in other mixed cultures. In the near future, the work described in this thesis will (i) improve research techniques in other mixed culture studies such as in kefir or cheese, (ii) lead a further increase in knowledge on the yoghurt consortium by providing novel targets for additional research, and (iii) facilitate (food) industry to develop new or improved fermented products with desired properties. REFERENCES 1. Azam, F., and F. Malfatti. 2007. Microbial structuring of marine ecosystems. Nat Rev
Microbiol 5:782-791. 2. Boesten, R. J., F. H. Schuren, and W. M. de Vos. 2009. A Bifidobacterium mixed-species
microarray for high resolution discrimination between intestinal bifidobacteria. J Microbiol Methods 76:269-277.
3. Bolotin, A., B. Quinquis, P. Renault, A. Sorokin, S. D. Ehrlich, S. Kulakauskas, A. Lapidus, E. Goltsman, M. Mazur, G. D. Pusch, M. Fonstein, R. Overbeek, N. Kyprides, B. Purnelle, D. Prozzi, K. Ngui, D. Masuy, F. Hancy, S. Burteau, M. Boutry, J. Delcour, A. Goffeau, and P. Hols. 2004. Complete sequence and comparative genome analysis of the dairy bacterium Streptococcus thermophilus. Nat Biotechnol 22:1554-1558.
4. Broadbent, J. R., D. J. McMahon, D. L. Welker, C. J. Oberg, and S. Moineau. 2003. Biochemistry, genetics, and applications of exopolysaccharide production in Streptococcus thermophilus: a review. J Dairy Sci 86:407-423.
5. Bull, J. J., and W. R. Harcombe. 2009. Population dynamics constrain the cooperative evolution of cross-feeding. PLoS One 4:e4115.
6. Cheirsilp, B., H. Shimizu, and S. Shioya. 2003. Enhanced kefiran production by mixed culture of Lactobacillus kefiranofaciens and Saccharomyces cerevisiae. J Biotechnol 100:43-53.
204
Summary, discussion and future perspectives
7. Cheirsilp, B., H. Shoji, H. Shimizu, and S. Shioya. 2003. Interactions between Lactobacillus kefiranofaciens and Saccharomyces cerevisiae in mixed culture for kefiran production. J Biosci Bioeng 96:279-284.
8. Courtin, P., V. Monnet, and F. Rul. 2002. Cell-wall proteinases PrtS and PrtB have a different role in Streptococcus thermophilus/Lactobacillus bulgaricus mixed cultures in milk. Microbiology 148:3413-3421.
9. Crittenden, R. G., N. R. Martinez, and M. J. Playne. 2003. Synthesis and utilisation of folate by yoghurt starter cultures and probiotic bacteria. Int J Food Microbiol 80:217-222.
10. Dave, R. I., and N. P. Shah. 1998. Ingredient supplementation effects on viability of probiotic bacteria in yogurt. J Dairy Sci 81:2804-2816.
11. Davies, J. 2009. Everything depends on everything else. Clin Microbiol Infect 15 Suppl 1:1-4. 12. de Bok, F. A. M. 2009. Personal communication. 13. de Visser, J. A., and D. E. Rozen. 2006. Clonal interference and the periodic selection of
new beneficial mutations in Escherichia coli. Genetics 172:2093-2100. 14. De Vuyst, L., F. Vanderveken, S. Van de Ven, and B. Degeest. 1998. Production by and
isolation of exopolysaccharides from Streptococcus thermophilus grown in a milk medium and evidence for their growth-associated biosynthesis. J Appl Microbiol 84:1059-1068.
15. Dekel, E., and U. Alon. 2005. Optimality and evolutionary tuning of the expression level of a protein. Nature 436:588-592.
16. Derzelle, S., A. Bolotin, M. Y. Mistou, and F. Rul. 2005. Proteome analysis of Streptococcus thermophilus grown in milk reveals pyruvate formate-lyase as the major upregulated protein. Appl Environ Microbiol 71:8597-8605.
17. Dohm, J. C., C. Lottaz, T. Borodina, and H. Himmelbauer. 2008. Substantial biases in ultra-short read data sets from high-throughput DNA sequencing. Nucleic Acids Res 36:e105.
18. Driessen, F. M., F. Kingma, and J. Stadhouders. 1982. Evidence that Lactobacillus bulgaricus in yoghurt is stimulated by carbon dioxide produced by Streptococcus thermophilus. Netherlands Milk and Dairy Journal 36:135-144.
19. Durot, M., P. Y. Bourguignon, and V. Schachter. 2009. Genome-scale models of bacterial metabolism: reconstruction and applications. FEMS Microbiol Rev 33:164-190.
20. Eiben, G., C. S. Andersson, E. Rothenberg, V. Sundh, B. Steen, and L. Lissner. 2004. Secular trends in diet among elderly Swedes -- cohort comparisons over three decades. Public Health Nutr 7:637-644.
21. Elena, S. F., V. S. Cooper, and R. E. Lenski. 1996. Punctuated evolution caused by selection of rare beneficial mutations. Science 272:1802-1804.
22. Elena, S. F., and R. E. Lenski. 2003. Evolution experiments with microorganisms: the dynamics and genetic bases of adaptation. Nat Rev Genet 4:457-469.
23. Fernandez, A., J. Ogawa, S. Penaud, S. Boudebbouze, D. Ehrlich, M. van de Guchte, and E. Maguin. 2008. Rerouting of pyruvate metabolism during acid adaptation in Lactobacillus bulgaricus. Proteomics 8:3154-3163.
24. Folkenberg, D. M., P. Dejmek, A. Skriver, and R. Ipsen. 2006. Interactions between EPS-producing Streptococcus thermophilus strains in mixed yoghurt cultures. J Dairy Res 73:385-393.
25. Fox, P. F., P. McSweeney, T. M. Cogan, and T. P. Guinee. 2004. Cheese: Major cheese groups, 3 ed. Academic Press.
26. Frank, D. N., and N. R. Pace. 2008. Gastrointestinal microbiology enters the metagenomics era. Curr Opin Gastroenterol 24:4-10.
27. Germond, J. E., L. Lapierre, M. Delley, B. Mollet, G. E. Felis, and F. Dellaglio. 2003. Evolution of the bacterial species Lactobacillus delbrueckii: a partial genomic study with reflections on prokaryotic species concept. Mol Biol Evol 20:93-104.
28. Giraud, E., B. Lelong, and M. Raimbault. 1991. Influence of pH and initial lactate concentration on the growth of Lactobacillus plantarum. Applied Microbiology and Biotechnology 36:96-99.
29. Guerrero, R., and M. Berlanga. 2006. Life's unity and flexibility: the ecological link. Int Microbiol 9:225-235.
30. Hallin, P. F., and D. W. Ussery. 2004. CBS Genome Atlas Database: a dynamic storage for bioinformatic results and sequence data. Bioinformatics 20:3682-3686.
205
Chapter 7
31. Hassan, A. N., J. F. Frank, and K. B. Qvist. 2002. Direct observation of bacterial exopolysaccharides in dairy products using confocal scanning laser microscopy. J Dairy Sci 85:1705-1708.
32. Heller, K. J. 2001. Probiotic bacteria in fermented foods: product characteristics and starter organisms. Am J Clin Nutr 73:374S-379S.
33. Herve-Jimenez, L., I. Guillouard, E. Guedon, S. Boudebbouze, P. Hols, V. Monnet, E. Maguin, and F. Rul. 2009. Postgenomic analysis of Streptococcus thermophilus cocultivated in milk with Lactobacillus delbrueckii subsp. bulgaricus: involvement of nitrogen, purine, and iron metabolism. Appl Environ Microbiol 75:2062-2073.
34. Herve-Jimenez, L., I. Guillouard, E. Guedon, C. Gautier, S. Boudebbouze, P. Hols, V. Monnet, F. Rul, and E. Maguin. 2008. Physiology of Streptococcus thermophilus during the late stage of milk fermentation with special regard to sulfur amino-acid metabolism. Proteomics 8:4273-4286.
35. Imhof, M., and C. Schlotterer. 2001. Fitness effects of advantageous mutations in evolving Escherichia coli populations. Proc Natl Acad Sci U S A 98:1113-1117.
36. Keller, L., and M. G. Surette. 2006. Communication in bacteria: an ecological and evolutionary perspective. Nat Rev Microbiol 4:249-258.
37. Little, A. E., C. J. Robinson, S. B. Peterson, K. F. Raffa, and J. Handelsman. 2008. Rules of engagement: interspecies interactions that regulate microbial communities. Annu Rev Microbiol 62:375-401.
38. Liu, M., R. J. Siezen, and A. Nauta. 2009. In silico prediction of horizontal gene transfer events in Lactobacillus bulgaricus and Streptococcus thermophilus reveals protocooperation in yogurt manufacturing. Appl Environ Microbiol 75:4120-4129.
39. Liu, S.-Q., R. Holland, and V. L. Crow. 2001. Purification and properties of intracellular esterases from Streptococcus thermophilus. International Dairy Journal 11:27-35.
40. MacLean, D., J. D. Jones, and D. J. Studholme. 2009. Application of 'next-generation' sequencing technologies to microbial genetics. Nat Rev Microbiol 7:287-296.
41. Makarova, K., A. Slesarev, Y. Wolf, A. Sorokin, B. Mirkin, E. Koonin, A. Pavlov, N. Pavlova, V. Karamychev, N. Polouchine, V. Shakhova, I. Grigoriev, Y. Lou, D. Rohksar, S. Lucas, K. Huang, D. M. Goodstein, T. Hawkins, V. Plengvidhya, D. Welker, J. Hughes, Y. Goh, A. Benson, K. Baldwin, J. H. Lee, I. Diaz-Muniz, B. Dosti, V. Smeianov, W. Wechter, R. Barabote, G. Lorca, E. Altermann, R. Barrangou, B. Ganesan, Y. Xie, H. Rawsthorne, D. Tamir, C. Parker, F. Breidt, J. Broadbent, R. Hutkins, D. O'Sullivan, J. Steele, G. Unlu, M. Saier, T. Klaenhammer, P. Richardson, S. Kozyavkin, B. Weimer, and D. Mills. 2006. Comparative genomics of the lactic acid bacteria. Proc Natl Acad Sci U S A 103:15611-15616.
42. Malakar, P. K., G. C. Barker, M. H. Zwietering, and K. van't Riet. 2003. Relevance of microbial interactions to predictive microbiology. Int J Food Microbiol 84:263-272.
43. Maligoy, M., M. Mercade, M. Cocaign-Bousquet, and P. Loubiere. 2008. Transcriptome analysis of Lactococcus lactis in coculture with Saccharomyces cerevisiae. Appl Environ Microbiol 74:485-494.
44. Maragkoudakis, P. A., C. Miaris, P. Rojez, N. Manalis, F. Magkanari, G. Kalantzopoulos, and E. Tsakalidou. 2006. Production of traditional Greek yoghurt using Lactobacillus strains with probiotic potential as starter adjuncts. International Dairy Journal 16:52-60.
45. Mozzi, F., E. Gerbino, G. Font de Valdez, and M. I. Torino. 2009. Functionality of exopolysaccharides produced by lactic acid bacteria in an in vitro gastric system. J Appl Microbiol.
46. Nam, Y. D., H. W. Chang, K. H. Kim, S. W. Roh, and J. W. Bae. 2009. Metatranscriptome analysis of lactic acid bacteria during kimchi fermentation with genome-probing microarrays. Int J Food Microbiol 130:140-146.
47. Partanen, L., N. Marttinen, and T. Alatossava. 2001. Fats and fatty acids as growth factors for Lactobacillus delbrueckii. Syst Appl Microbiol 24:500-506.
48. Pastink, M. I., S. Sieuwerts, F. A. M. de Bok, P. W. M. Janssen, B. Teusink, J. E. T. van Hylckama Vlieg, and J. Hugenholtz. 2008. Genomics and high-throughput screening approaches for optimal flavour production in dairy fermentation. International Dairy Journal 18:781-789.
206
Summary, discussion and future perspectives
207
49. Pette, J. W., and H. Lolkema. 1950. Yoghurt. I. Symbiosis and antibiosis in mixed cultures of Lb bulgaricus and Se thermophilus. Netherlands Milk Dairy Journal 4:197-208.
50. Pfeiffer, T., and S. Bonhoeffer. 2004. Evolution of cross-feeding in microbial populations. Am Nat 163:E126-135.
51. Pfeiffer, T., and S. Schuster. 2005. Game-theoretical approaches to studying the evolution of biochemical systems. Trends Biochem Sci 30:20-25.
52. Pieterse, B., R. H. Jellema, and M. J. van der Werf. 2006. Quenching of microbial samples for increased reliability of microarray data. J Microbiol Methods 64:207-216.
53. Rao, D. R., and J. C. Reddy. 1984. Effects of Lactic Fermentation of Milk on Milk Lipids. Journal of Food Science 49:748-750.
54. Rosenzweig, R. F., R. R. Sharp, D. S. Treves, and J. Adams. 1994. Microbial evolution in a simple unstructured environment: genetic differentiation in Escherichia coli. Genetics 137:903-917.
55. Schneider, D., E. Duperchy, E. Coursange, R. E. Lenski, and M. Blot. 2000. Long-term experimental evolution in Escherichia coli. IX. Characterization of insertion sequence-mediated mutations and rearrangements. Genetics 156:477-488.
56. Sieuwerts, S., F. A. M. de Bok, C. J. Ingham, M. Beerthuyzen, S. A. F. T. van Hijum, D. Molenaar, P. M. Slegers, E. H. Tolls, W. M. de Vos, and J. E. T. van Hylckama Vlieg. 2009. Experimental evolution of yoghurt cultures improves co-culture growth and interactions. In S. Sieuwerts (ed.), This thesis, Ch 5.
57. Smith, A. D., Z. Xuan, and M. Q. Zhang. 2008. Using quality scores and longer reads improves accuracy of Solexa read mapping. BMC Bioinformatics 9:128.
58. Sundararajan, T. A., and P. S. Sarma. 1957. Preparation and amino acid composition of enzymically dephosphorylated casein. Biochem J 65:261-266.
59. Sybesma, W., M. Starrenburg, L. Tijsseling, M. H. Hoefnagel, and J. Hugenholtz. 2003. Effects of cultivation conditions on folate production by lactic acid bacteria. Appl Environ Microbiol 69:4542-4548.
60. Turner, K. W., and F. G. Martley. 1983. Galactose Fermentation and Classification of Thermophilic Lactobacilli. Appl Environ Microbiol 45:1932-1934.
61. Tzeneva, V. A., A. Castioni, M. Wels, H. T. K. Phan, J. L. W. Rademaker, M. J. C. Starrenburg, S. Torriani, H. Smidt, M. Kleerebezem, D. Molenaar, J. E. T. van Hylckama Vlieg, and R. J. Siezen. 2009. Phenotypic and genomic diversity of Lactobacillus plantarum strains isolated from diverse environments. Appl Environ Microbiol Submitted.
62. van de Guchte, M., S. Penaud, C. Grimaldi, V. Barbe, K. Bryson, P. Nicolas, C. Robert, S. Oztas, S. Mangenot, A. Couloux, V. Loux, R. Dervyn, R. Bossy, A. Bolotin, J. M. Batto, T. Walunas, J. F. Gibrat, P. Bessieres, J. Weissenbach, S. D. Ehrlich, and E. Maguin. 2006. The complete genome sequence of Lactobacillus bulgaricus reveals extensive and ongoing reductive evolution. Proc Natl Acad Sci U S A 103:9274-9279.
63. Woods, R., D. Schneider, C. L. Winkworth, M. A. Riley, and R. E. Lenski. 2006. Tests of parallel molecular evolution in a long-term experiment with Escherichia coli. Proc Natl Acad Sci U S A 103:9107-9112.

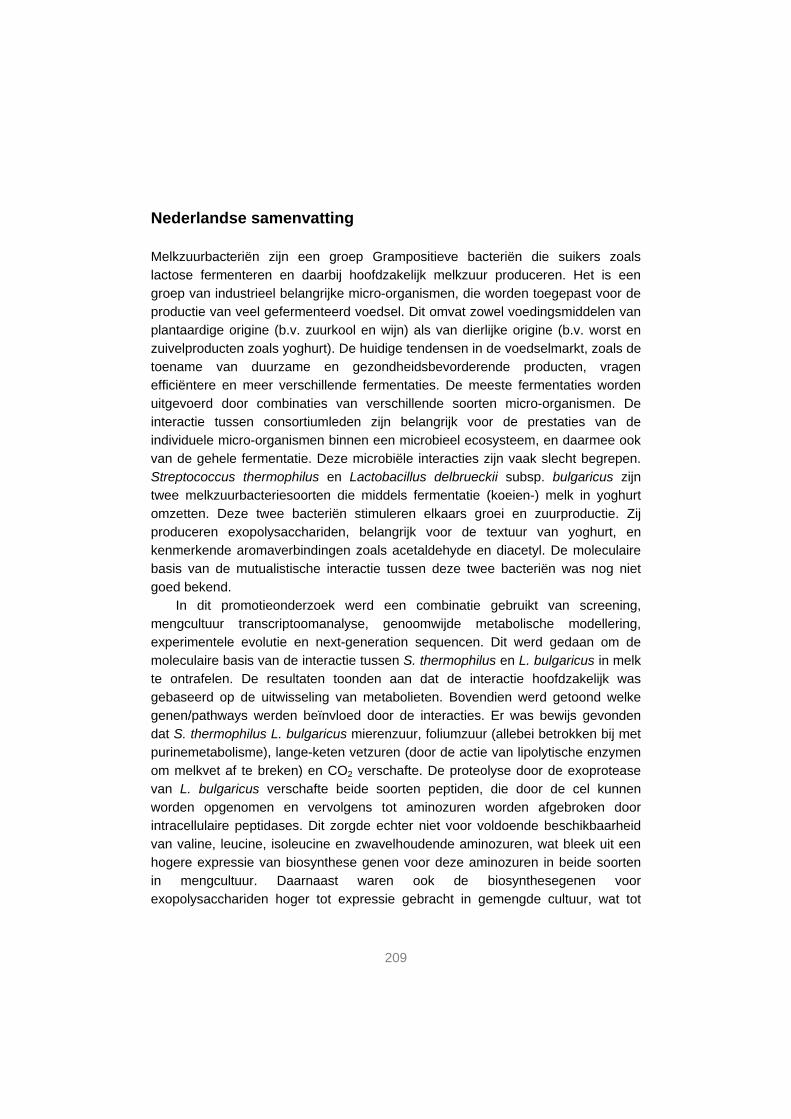
Nederlandse samenvatting Melkzuurbacteriën zijn een groep Grampositieve bacteriën die suikers zoals lactose fermenteren en daarbij hoofdzakelijk melkzuur produceren. Het is een groep van industrieel belangrijke micro-organismen, die worden toegepast voor de productie van veel gefermenteerd voedsel. Dit omvat zowel voedingsmiddelen van plantaardige origine (b.v. zuurkool en wijn) als van dierlijke origine (b.v. worst en zuivelproducten zoals yoghurt). De huidige tendensen in de voedselmarkt, zoals de toename van duurzame en gezondheidsbevorderende producten, vragen efficiëntere en meer verschillende fermentaties. De meeste fermentaties worden uitgevoerd door combinaties van verschillende soorten micro-organismen. De interactie tussen consortiumleden zijn belangrijk voor de prestaties van de individuele micro-organismen binnen een microbieel ecosysteem, en daarmee ook van de gehele fermentatie. Deze microbiële interacties zijn vaak slecht begrepen. Streptococcus thermophilus en Lactobacillus delbrueckii subsp. bulgaricus zijn twee melkzuurbacteriesoorten die middels fermentatie (koeien-) melk in yoghurt omzetten. Deze twee bacteriën stimuleren elkaars groei en zuurproductie. Zij produceren exopolysacchariden, belangrijk voor de textuur van yoghurt, en kenmerkende aromaverbindingen zoals acetaldehyde en diacetyl. De moleculaire basis van de mutualistische interactie tussen deze twee bacteriën was nog niet goed bekend.
In dit promotieonderzoek werd een combinatie gebruikt van screening, mengcultuur transcriptoomanalyse, genoomwijde metabolische modellering, experimentele evolutie en next-generation sequencen. Dit werd gedaan om de moleculaire basis van de interactie tussen S. thermophilus en L. bulgaricus in melk te ontrafelen. De resultaten toonden aan dat de interactie hoofdzakelijk was gebaseerd op de uitwisseling van metabolieten. Bovendien werd getoond welke genen/pathways werden beïnvloed door de interacties. Er was bewijs gevonden dat S. thermophilus L. bulgaricus mierenzuur, foliumzuur (allebei betrokken bij met purinemetabolisme), lange-keten vetzuren (door de actie van lipolytische enzymen om melkvet af te breken) en CO2 verschafte. De proteolyse door de exoprotease van L. bulgaricus verschafte beide soorten peptiden, die door de cel kunnen worden opgenomen en vervolgens tot aminozuren worden afgebroken door intracellulaire peptidases. Dit zorgde echter niet voor voldoende beschikbaarheid van valine, leucine, isoleucine en zwavelhoudende aminozuren, wat bleek uit een hogere expressie van biosynthese genen voor deze aminozuren in beide soorten in mengcultuur. Daarnaast waren ook de biosynthesegenen voor exopolysacchariden hoger tot expressie gebracht in gemengde cultuur, wat tot
209
210
meer productie van exopolysacchariden en een hogere viscositeit van de yoghurt leidde.
Een genoomwijd metabolisch model van de mengcultuur bevestigde dat de interacties tussen de yoghurtbacteriën waren gebaseerd op het purine en het aminozuur metabolisme. Daarnaast werd dit model gebruikt om aan te tonen dat de interactie een significant voordeel aan beide bacteriën opleverde, d.w.z. hun opbrengst van biomassa op lactose was ongeveer 50% hoger in mengcultuur.
Experimentele evolutie onthulde dat het mogelijk is om een nieuwe combinatie van S. thermophilus en L. bulgaricus stammen aan elkaar aan te passen. Het bleek dat hun wederzijdse stimulatie versterkte door hun interactie te optimaliseren middels het fine-tunen van pathways die betrokken zijn bij de interactie. Slechts ~1000 generaties samen kweken volstond om de relatief slecht groeiende mengcultuur te veranderen in één die vergelijkbaar was met een commerciële cultuur in zeer belangrijke kenmerken zoals verzuringsnelheid en viscositeit.
Het betere begrip van de interacties die ten grondslag liggen aan de yoghurtfermentatie geven ons doelwitten voor de rationele optimalisering van bestaande mengcultuurfermentaties en de rationele ontwikkeling van nieuwe industrieel relevante mengculturen, zoals die met probiotica. Bovendien zijn de resultaten in het bijzonder interessant voor het onderzoeksgebied van microbiële ecologie aangezien zij tonen hoe de wederzijdse interacties evolueren en de microbiële samenstelling van dit ecosysteem structureren.


List of publications
Genomics and high-throughput screening approaches for optimal flavour production in dairy fermentation. 2008. Margreet I. Pastink#, Sander Sieuwerts#, Frank A.M. de Bok, Patrick W.M. Janssen, Bas Teusink, Johan E.T. van Hylckama Vlieg, Jeroen Hugenholtz. International Dairy Journal 18:781-789. #These authors contributed equally to this work A simple and fast method for determining colony forming units. 2008. Sander Sieuwerts, Frank A.M. de Bok, Erik Mols, Willem M. de Vos and Johan E.T. van Hylckama Vlieg. Letters in applied Microbiology 47(4):275-278 Unraveling microbial interactions in food fermentations; from classical to genomics approaches. 2008. Sander Sieuwerts, Frank A.M. de Bok, Douwe Molenaar, Jeroen Hugenholtz and Johan E.T. van Hylckama Vlieg. Applied and Environmental Microbiology 74(16):4997-5007 Effect of amino acid availability on Vitamin B12 production in Lactobacillus reuteri. 2009. Filipe B. Santos, Douwe Molenaar, Bas Teusink, Maurice van Heck, Sander Sieuwerts, Willem M. de Vos and Jeroen Hugenholtz. Applied and Environmental Microbiology 75(12):3930-3936 Mixed culture transcriptome analysis reveals the molecular basis of co-culture growth and its consequences in Streptococcus thermophilus and Lactobacillus bulgaricus. Sander Sieuwerts, Douwe Molenaar, Sacha A.F.T. van Hijum, Colin J. Ingham, Marke Beerthuyzen, Marc J.A. Stevens, Patrick W.M. Janssen, Frank A.M. de Bok, Willem M. de Vos and Johan E.T. van Hylckama Vlieg. Manuscript submitted for publication. Experimental evolution of yoghurt cultures improves co-culture growth and interactions. Sander Sieuwerts, Frank A.M. de Bok, Colin J. Ingham, Marke Beerthuyzen, Sacha A.F.T. van Hijum, Douwe Molenaar, P.M. (Ellen) Slegers, Elisabeth H. Tolls, Willem M. de Vos and Johan E.T. van Hylckama Vlieg. Manuscript in preparation. A genome-scale metabolic model of mixed culture growth of S. thermophilus and L. bulgaricus. Sander Sieuwerts, Johan E.T. van Hylckama Vlieg, Willem M. de Vos and Bas Teusink. Manuscript in preparation.
Volatile compound fingerprinting of mixed culture fermentations. Frank A.M. de Bok, Patrick W.M. Janssen, Juma Bayjanov, Sander Sieuwerts, Arjen Lommen, Johan E.T. van Hylckama Vlieg and Douwe Molenaar. Manuscript in preparation.
Combinatorial screening of mixed cultures of lactic acid bacteria in milk and soymilk. Frank A.M. de Bok, Patrick W.M. Janssen, Sander Sieuwerts, Douwe Molenaar, Johan E.T. van Hylckama Vlieg. Manuscript in preparation. Hoe yoghurtbacteriën samenwerken aan een gezonde en lekkere voeding. 2009. Sander Sieuwerts, Eddy J. Smid, Jeroen A. Wouters and Frank A.M. de Bok. VMT 20.
213

Acknowledgements As all the people that preceded me in acquiring the title of Doctor (Dr.) know, it is impossible to work your backside off for four years and get your title without any help from and enjoyment of other people. Therefore, I would like to thank all the people that have supported me in any way the past four years; I couldn’t have done it without you!
I want to mention some (groups of) people in particular. Let me first start with my parents. Het is voor iedereen in de familie niet altijd makkelijk geweest de afgelopen vier jaar, maar toch wil ik jullie nog extra bedanken voor dat jullie er altijd zijn geweest. Dat geldt natuurlijk ook voor mijn broer, met wie ik ‘biologisch’ kon praten terwijl mijn ouders er de ballen van snapten, en mijn oma, die wel eens het idee kreeg me op te bellen als ik net een vergadering had.
Of course I want to give special thanks to the people that have supervised me. My promotor WdV, you were always one step ahead thinking about the impact of results, and my co-promotor JvHV, you left for a job in Paris but managed to stimulate me by phone and e-mail. Next to you two, I had two more ‘fathers’ at Nizo: ES and JH, thank you for the fruitful discussions and helping me. That brings me automatically to the thesis committee. Thank you for critically reading my thesis and I am looking forward to the questions at my defense; Dank u voor het kritisch lezen van mijn proefschrift en ik verheug me op de vragen met mijn verdediging; Merci de lire en critique ma thèse et j'attends avec intérêt les questions à ma defense.
There are many other people that I worked with or at least enjoyed their presence at work and/or outside work hours. It would simply double the size of my thesis if I was to write a short note of them all separately. I will therefore only briefly mention some highlights; the people involved will know it is about them. I really enjoyed the C-015 team and in particular the collaborations I had with some of them. I think the thesis research would not be so complete without your contributions. That also counts for the ‘computer guys’ BT, DM, MW and SvH that helped me with the more advanced bioinformatics. Moreover, I think that working wouldn’t have been so pleasant without the people in the Kluyver lab (not to be confused
with Kluyver Centre) and the office. We have had some good laughs, especially at the Friday afternoons. Similarly, I enjoyed the great discussions we sometimes started when I actually came for one small question. Though I saw the basement-people
on a less regular basis, I definitely feel that they’ve been an enrichment to my stay at Nizo as well.
As a PhD student sometimes you get a bit (well… a bit) fed-up with all the practical work and you want to do something else. Fortunately, I had three excellent students KZ, ES and ET coming to the rescue. They continued the practical work giving me time to write and attend conferences and courses. Thank you! Similarly, it was good to spend some time with other people during teaching, for instance (KH, SP, JS, LB and MG). And I am sure that I would have thrown my computer, a centrifuge or something else expensive through the window if I did not cool down talking to BvdB or MP. As I sill have to work at Nizo for two more years, I am very grateful for their excellent listening skills.
Not so much involved in my work and currently far away, there were some people important in my personal life. AC, GF and MdV, you were worthwhile to spend the scarce free time with these last four years. I must say that I still miss you; Ancora lo manco; ik mis je nog.
Last but definitely not least, I want to give special thanks to my two paranymphs PJ and FdB. I think you are two of the few people that know me quite well and I am delighted that you are willing to put on your suits for the special occasion of my thesis defense.
Well, that’s it for so far. If you still would like to be mentioned in particular, please fill in the following line: Dear . . . . . . . . . . , you are the best and therefore I want to thank you for . . . . . . . . . . . . . .
Sander


Curriculum Vitae Sander Sieuwerts was born at March 8, 1982 in Zoetermeer, the same city as he lived the first 23 years of his life. There he followed primary and secondary school as most other kids. At secondary school Sander followed preparatory scientific education (VWO) with mainly science subjects. Although he had always been a person that likes nature very much, it was there that he decided to study biology and focus on molecular biology. In 2000, Sander started his MSc (doctoraal) studies at Leiden University, which he managed to finish in March 2005. During these studies he performed three internships in plant physiology (TNO-TPW, Leiden), fungal genetics (DSM-DFS-GEN, Delft) and plant genetics (Leiden University). Although plants stayed important in his personal life, Sander considered microorganisms more fun to work with. He was excited when he was offered the position of PhD student in project C-015 (Biodiversity and mixed cultures) at WCFS (the former TI Food and Nutrition). In March 2005, he started working for four years at NIZO food research under supervision of Johan van Hylckama Vlieg as primary supervisor and Willem de Vos as promotor. The results of this fundamental yet applied research are described in this thesis. After a short but very welcome holiday, Sander started working as a postdoc for the Kluyver Centre for Industrial fermentation on a research topic closely related to his thesis research: interactions between (lactic acid) bacteria and yeasts.
219

Overview of completed training activities Discipline specific activities ■ Principles of ~omics data analysis, EPS/NBIC, 2005 ■ Food fermentation, VLAG, 2008 ■ Stralingshygiëne, VLAG/Larenstein, 2005 ■ SRS/BLAST/ClustalW, CMBI, 2006 ■ Protein sequence analysis, CMBI, 2006 ■ Applied genomics of industrial microorganisms (incl. poster presentation),
BODL/Kluyver, 2006 ■ Genetics and physiology of food associated microorganisms, VLAG, 2007 ■ NIZO dairy conference (incl. poster presentation and oral presentation),
Arnhem, 2007 ■ Kluyver centre symposium 08 (incl. poster presentation), Egmond aan Zee,
2008 ■ 9th International symposium on lactic acid bacteria (incl. poster presentation),
Egmond aan Zee, 2008 ■ Kluyver centre symposium fall 08 (incl. oral presentation), Wageningen, 2008 ■ Kluyver centre symposium 09 (incl. poster presentation), Egmond aan Zee,
2009 ■ International dairy federation Science and technology week (incl. oral
presentation), Rennes, France, 2009 General courses ■ PhD scientific writing, CENTA, 2005 ■ PhD presentation skills, CENTA, 2006 ■ Assisting in undergraduate microbial physiology practical, 2007/8 ■ MSc course Didactiek en communicatie (ECS-20806), ECS, 2008 Other activities ■ Preparation of PhD thesis research proposal, 2005 ■ PhD VLAG week, VLAG, 2006 ■ WE-days WCFS/TIFN (Programme 3 - Microbial functionality and safety),
2005-8 ■ Organisation of Programme 3 WCFS Fall WE-days, Koudum, 2007 ■ Project meetings Biodiversity and mixed cultures, 2005-9 ■ Bio-IT meetings WCFS/TIFN, 2005-8 ■ Schoolpracticum (ECS-31306), ECS, 2008
221