Embed Size (px)
Citation preview
Introduction Consumers select fruit juice because it is a tasty, convenient beverage and generally understood to be a more nutritious alternative to carbonated beverages. For 100% juice products, the nutrition content
of the original fruit itself is well known, which translates to the expected nutritional value of the final juice product. Detailed labeling is required on food products; for consumers, any comparative variance can be a strong incentive to choose one product over another. In an effort to appeal to consumers and address market needs, many juice products may also be fortified with micronutrients to boost or add to what is already present naturally.
For food manufacturers and processors, it is imperative that there is a means to quantify the content of food products, including micronutrients, for both safety and quality reasons, along with regulatory label-claim requirements. Screening raw materials for elemental contaminants prior to use and then confirming the micronutrient content of the final product are two basic examples of the benefits of analytical testing. Accurate and precise analysis can also help improve the production process by utilizing the analytical data generated and employing statistical analysis to maximize nutrient yield or production volume where appropriate.
Analysis of Micronutrients in Fruit Juice Using FAST Flame Sample Automation for Increased Sample Throughput
A P P L I C A T I O N N O T E
Author:
Nick Spivey
PerkinElmer, Inc.Shelton, CT
Atomic Absorption
2
While ICP-OES is generally favored in a multi-element analytical environment, the cost savings, simplicity and speed of a flame atomic absorption (AA) system provides an attractive alternative. However, measuring multiple elements by flame AA requires each sample to be analyzed individually for each element, which impacts the speed advantage of flame AA.
To address the speed issue, a fast, high-throughput sample automation system can be used. Although samples still need to be analyzed multiple times, the analysis time per sample is significantly reduced, thus increasing sample throughput compared to manual sample introduction. In addition, an automated sample introduction system increases the precision of the analysis and frees the chemist to perform other tasks.
This work will focus on the analysis of micronutrients in a variety of commercial juice products using flame AA coupled with a high- throughput sample automation system.
Experimental
Samples and Sample PreparationWith the tremendous variety of juice and juice blends available on the market, samples were selected to be representative of commonly available and purchased juices. Only samples that were made from 100% juice (as accepted under current labeling guidelines) were selected, though this still meant that in many cases the juice was reconstituted from concentrate. The samples analyzed represent two different brands of apple juice and orange juice, two different varieties of grape juice, a pomegranate juice, and a vegetable-fruit juice blend. The analytical elements selected are representative of micronutrients that commonly appear on product labels.
Juice samples were subjected to minimum sample preparation with only nitric acid added to bring the acidity to 2%. Samples were split, and the elements of interest were spiked into one set of the split samples.
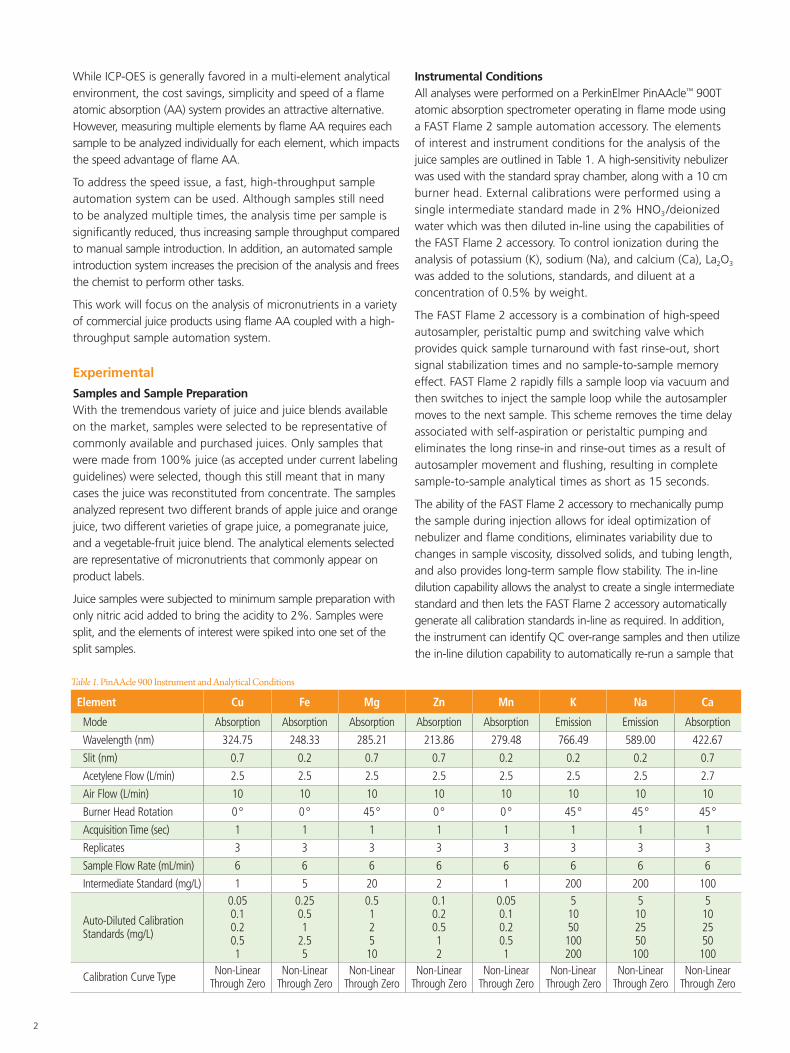
Instrumental ConditionsAll analyses were performed on a PerkinElmer PinAAcle™ 900T atomic absorption spectrometer operating in flame mode using a FAST Flame 2 sample automation accessory. The elements of interest and instrument conditions for the analysis of the juice samples are outlined in Table 1. A high-sensitivity nebulizer was used with the standard spray chamber, along with a 10 cm burner head. External calibrations were performed using a single intermediate standard made in 2% HNO3 /deionized water which was then diluted in-line using the capabilities of the FAST Flame 2 accessory. To control ionization during the analysis of potassium (K), sodium (Na), and calcium (Ca), La2O3 was added to the solutions, standards, and diluent at a concentration of 0.5% by weight.
The FAST Flame 2 accessory is a combination of high-speed autosampler, peristaltic pump and switching valve which provides quick sample turnaround with fast rinse-out, short signal stabilization times and no sample-to-sample memory effect. FAST Flame 2 rapidly fills a sample loop via vacuum and then switches to inject the sample loop while the autosampler moves to the next sample. This scheme removes the time delay associated with self-aspiration or peristaltic pumping and eliminates the long rinse-in and rinse-out times as a result of autosampler movement and flushing, resulting in complete sample-to-sample analytical times as short as 15 seconds.
The ability of the FAST Flame 2 accessory to mechanically pump the sample during injection allows for ideal optimization of nebulizer and flame conditions, eliminates variability due to changes in sample viscosity, dissolved solids, and tubing length, and also provides long-term sample flow stability. The in-line dilution capability allows the analyst to create a single intermediate standard and then lets the FAST Flame 2 accessory automatically generate all calibration standards in-line as required. In addition, the instrument can identify QC over-range samples and then utilize the in-line dilution capability to automatically re-run a sample that
Table 1. PinAAcle 900 Instrument and Analytical Conditions
Element Cu Fe Mg Zn Mn K Na Ca
Mode Absorption Absorption Absorption Absorption Absorption Emission Emission Absorption
Wavelength (nm) 324.75 248.33 285.21 213.86 279.48 766.49 589.00 422.67
Slit (nm) 0.7 0.2 0.7 0.7 0.2 0.2 0.2 0.7
Acetylene Flow (L/min) 2.5 2.5 2.5 2.5 2.5 2.5 2.5 2.7
Air Flow (L/min) 10 10 10 10 10 10 10 10
Burner Head Rotation 0 ° 0 ° 45 ° 0 ° 0 ° 45 ° 45 ° 45 °
Acquisition Time (sec) 1 1 1 1 1 1 1 1
Replicates 3 3 3 3 3 3 3 3
Sample Flow Rate (mL/min) 6 6 6 6 6 6 6 6
Intermediate Standard (mg/L) 1 5 20 2 1 200 200 100
Auto-Diluted Calibration Standards (mg/L)
0.050.10.20.51
0.250.51
2.55
0.5125 10
0.10.20.512
0.050.1 0.20.51
51050100200
51025 50100
5102550100
Calibration Curve Type Non-Linear Through Zero
Non-Linear Through Zero
Non-Linear Through Zero
Non-Linear Through Zero
Non-Linear Through Zero
Non-Linear Through Zero
Non-Linear Through Zero
Non-Linear Through Zero
3
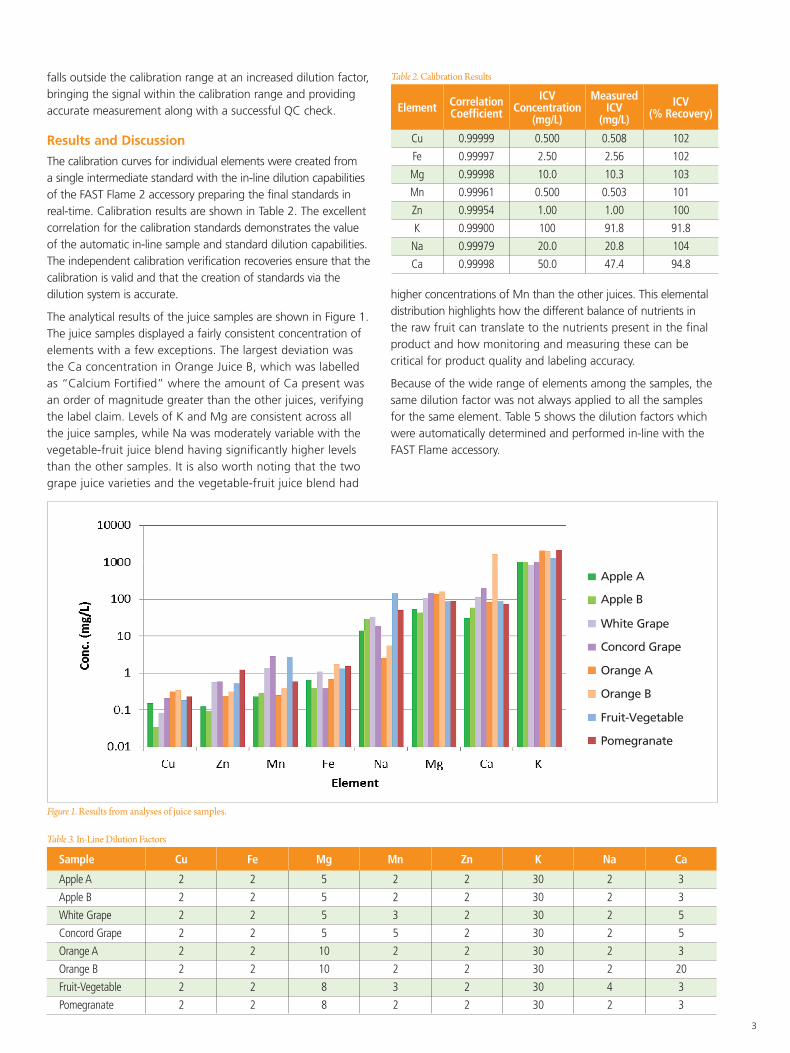
Figure 1. Results from analyses of juice samples.
falls outside the calibration range at an increased dilution factor, bringing the signal within the calibration range and providing accurate measurement along with a successful QC check.
Results and Discussion
The calibration curves for individual elements were created from a single intermediate standard with the in-line dilution capabilities of the FAST Flame 2 accessory preparing the final standards in real-time. Calibration results are shown in Table 2. The excellent correlation for the calibration standards demonstrates the value of the automatic in-line sample and standard dilution capabilities. The independent calibration verification recoveries ensure that the calibration is valid and that the creation of standards via the dilution system is accurate.
The analytical results of the juice samples are shown in Figure 1. The juice samples displayed a fairly consistent concentration of elements with a few exceptions. The largest deviation was the Ca concentration in Orange Juice B, which was labelled as “Calcium Fortified” where the amount of Ca present was an order of magnitude greater than the other juices, verifying the label claim. Levels of K and Mg are consistent across all the juice samples, while Na was moderately variable with the vegetable-fruit juice blend having significantly higher levels than the other samples. It is also worth noting that the two grape juice varieties and the vegetable-fruit juice blend had
higher concentrations of Mn than the other juices. This elemental distribution highlights how the different balance of nutrients in the raw fruit can translate to the nutrients present in the final product and how monitoring and measuring these can be critical for product quality and labeling accuracy.
Because of the wide range of elements among the samples, the same dilution factor was not always applied to all the samples for the same element. Table 5 shows the dilution factors which were automatically determined and performed in-line with the FAST Flame accessory.
Table 2. Calibration Results
Element Correlation Coefficient
ICV Concentration
(mg/L)
Measured ICV
(mg/L)
ICV (% Recovery)
Cu 0.99999 0.500 0.508 102
Fe 0.99997 2.50 2.56 102
Mg 0.99998 10.0 10.3 103
Mn 0.99961 0.500 0.503 101
Zn 0.99954 1.00 1.00 100
K 0.99900 100 91.8 91.8
Na 0.99979 20.0 20.8 104
Ca 0.99998 50.0 47.4 94.8
Table 3. In-Line Dilution Factors
Sample Cu Fe Mg Mn Zn K Na Ca
Apple A 2 2 5 2 2 30 2 3
Apple B 2 2 5 2 2 30 2 3
White Grape 2 2 5 3 2 30 2 5
Concord Grape 2 2 5 5 2 30 2 5
Orange A 2 2 10 2 2 30 2 3
Orange B 2 2 10 2 2 30 2 20
Fruit-Vegetable 2 2 8 3 2 30 4 3
Pomegranate 2 2 8 2 2 30 2 3
Apple A
Apple B
White Grape
Concord Grape
Orange A
Orange B
Fruit-Vegetable
Pomegranate

4
To assess any possible matrix effects from the various juices, all samples were spiked with all elements at the levels shown in Table 4; the resulting spike recoveries appear in Figure 2. The recoveries of nearly all the sample spikes are within 10% of the calculated values for all elements and did not require per-sample matrix matching. However, there were two recovery values that exceeded 110% for K (Concorde Grape and Orange B), a result of the spike levels (91.9, 95.1 mg/kg, respectively) being significantly lower than the actual K concentrations in the samples (about one-tenth the amount). In all cases, the spike concentrations were established prior to analysis, and therefore, were not ideal. Nevertheless, excellent recoveries were observed. The Ca spike recovery for Orange B is not reported because of the excessively high Ca concentration in this juice. For all remaining elements and samples, the simple spiking and rapid sampling resulted in accurate analysis with good spike recovery, an absolute minimum of labor, and almost no sample preparation.
The addition of the FAST Flame 2 sample automation accessory reduced the number of standards the analyst needed to make from six (one intermediate and five final standards) to a single intermediate standard, with a commensurate reduction in human error during standard preparation. The measured concentrations
of K, Mg, Mn, Na, and Ca in the samples varied enough to fall outside the calibration curve, but the in-line dilution capability of the FAST Flame 2 accessory allowed real-time dilution of these samples so that the absorbance fell within the calibration curve, producing accurate analyses. The ability of FAST Flame 2 to react to the over-range samples and auto-dilute the samples accurately and consistently without interaction from an analyst saves time and eliminates additional sample handling and lengthy re-prep.
Comparing typical autosampler performance, the total analytical time for each sample is dramatically reduced, while sample throughput is increased by nearly 4X with the use of the FAST Flame 2 accessory. The sample turnaround was reduced by 45 seconds while still maintaining the advantages of fully automated sample analysis, sample dilution, and calibration standard preparation. FAST Flame 2 retained the full automation benefits and still maintained a speed advantage even when compared with manual operation of the AA.
These results validate the accuracy and value of fruit juice analysis via flame AA along with the speed and increased productivity available from the PinAAcle and the FAST Flame 2 sample automation accessory.
Table 4. Pre-Digestion Spike Levels (all units in mg/kg)
Sample Cu Fe Mg Mn Zn K Na Ca
Apple A 0.494 0.494 4.94 0.494 0.494 94.1 94.1 37.7
Apple B 0.508 0.508 5.08 0.508 0.508 92.0 92.0 36.8
White Grape 0.500 0.500 5.00 0.500 0.500 90.4 90.4 36.2
Concord Grape 0.475 0.475 4.75 0.475 0.475 91.9 91.9 36.8
Orange A 0.502 0.502 5.02 0.502 0.502 93.2 93.2 37.3
Orange B 0.484 0.484 4.84 0.484 0.484 95.1 95.1 38.0
Fruit-Vegetable 0.486 0.486 4.86 0.486 0.486 89.1 89.1 35.6
Pomegranate 0.479 0.479 4.79 0.479 0.479 95.8 95.8 38.3
Figure 2. Spike recoveries in the juice samples.
Apple A
Apple B
White Grape
Concord Grape
Orange A
Orange B
Fruit-Vegetable
Pomegranate

For a complete listing of our global offices, visit www.perkinelmer.com/ContactUs
Copyright ©2015, PerkinElmer, Inc. All rights reserved. PerkinElmer® is a registered trademark of PerkinElmer, Inc. All other trademarks are the property of their respective owners. 012272_01 PKI
PerkinElmer, Inc. 940 Winter Street Waltham, MA 02451 USA P: (800) 762-4000 or (+1) 203-925-4602www.perkinelmer.com
Consumables
Component Part Number
Red/Red PVC Pump Tubing 09908585
Black/Black PVC Pump Tubing 09908587
Autosampler Tubes B0193233 (15 mL)B0193234 (50 mL)
Ca Hollow Cathode Lamp N3050114
Cu Hollow Cathode Lamp N3050121
Fe Hollow Cathode Lamp N3050126
Mg Hollow Cathode Lamp N3050144
Mn Hollow Cathode Lamp N3050145
Zn Hollow Cathode Lamp N3050191
Pure-Grade Ca Standard (10,000 mg/L) N0691581 (125 mL)N9303764 (500 mL)
Pure-Grade Cu Standard (1000 mg/L) N9300183 (125 mL)N9300114 (500 mL)
Pure-Grade Fe Standard (1000 mg/L) N9303771 (125 mL)N9300126 (500 mL)
Pure-Grade K Standard (10,000 mg/L) N9304121 (125 mL)N9304120 (500 mL)
Pure-Grade Mg Standard (1000 mg/L) N9300179 (125 mL)N9300131 (500 mL)
Pure-Grade Mn Standard (1000 mg/L) N9303783 (125 mL)N9300132 (500 mL)
Pure-Grade Na Standard (10,000 mg/L) N9304124 (125 mL)N9304123 (500 mL)
Pure-Grade Zn Standard (1000 mg/L) N9300178 (125 mL)N9300168 (500 mL)
Conclusion
This work has demonstrated the ability of the PinAAcle 900 AA spectrometer to reliably and effectively analyze a variety of fruit juice samples for Cu, Fe, Mg, Mn, Zn, K, Na, and Ca over a wide range of concentrations. Using the FAST Flame 2 sample automation accessory along with the PinAAcle 900 minimizes user errors when performing dilutions and making calibration standards while increasing throughput and productivity for the laboratory. (Equivalent results would also be obtained with the PinAAcle 500 AA spectrometer). The same analyses can also be done without the use of a FAST Flame accessory when analyzing smaller sample batches or the auto-dilution needs are not required.