Embed Size (px)
Citation preview

99
JIOS, VOL. 43. NO. 1 (2019), PP. 99-117
JIOS, VOL. 43, NO. 1 (2019) SUBMITTED 03/18; ACCEPTED 06/18
Analysis of Methods and Techniques for Prediction of Natural Gas Consumption: A Literature Review
Dario Šebalj [email protected] Faculty of Economics in Osijek Josip Juraj Strossmayer University of Osijek, Osijek, Croatia
Josip Mesarić [email protected] Faculty of Economics in Osijek Josip Juraj Strossmayer University of Osijek, Osijek, Croatia
Davor Dujak [email protected] Faculty of Economics in Osijek Josip Juraj Strossmayer University of Osijek, Osijek, Croatia
Abstract
Due to its many advantages, demand for natural gas has increased considerably and many models for predicting natural gas consumption are developed. The aim of this paper is to present an overview and systematic analysis of the latest research papers that deal with predictions of natural gas consumption for residential and commercial use from the year 2002 to 2017. Literature overview analysis was conducted using the two most relevant scientific databases Web of Science Core Collection and Scopus. The results indicate neural networks as the most common method used for predictions of natural gas consumption, while most accurate methods are genetic algorithms, support vector machines and ANFIS. Most used input variables are past natural gas consumption data and weather data, and prediction is most commonly made on daily and annual level on a country area level. Limitations of the research raise from relatively small number of analyzed papers but still research could be used for significant improving of prediction models for natural gas consumption. Keywords: natural gas, prediction models, energy, literature review
1. Introduction
Natural gas (NG) is one of the most important energy resources that is becoming more and more popular due to its environmental benefits (lower impact on environmental pollution). Therefore, demand for this source of energy has increased considerably in recent years. According to [1], natural gas consumption increases almost everywhere (the main exception is Japan, where nuclear power increases the most), especially in China and the Middle East. Consumption of natural gas consumption is projected to increase from 120 trillion cubic feet (Tcf) in 2012 to 203 Tcf in 2040 [2]. Globally,
UDC 004.032.26:553.981-047.44 Survey Paper
DOI: https://doi.org/10.31341/jios.43.1.6 Open Access

100
JIOS, VOL. 43. NO. 1 (2019), PP. 99-117
ŠEBALJ, MESARIĆ AND DUJAK ANALYSIS OF METHODS AND TECHNIQUES FOR...
natural gas accounted for 23.8% of primary energy consumption [3] and it remains the main fuel in the production of electricity and in industry sector.
Many authors have tried to develop models for predicting natural gas consumption on the hourly, daily, weekly, monthly or yearly basis. The accuracy of the models is important for decision making on gas nominations. Gas nominations are usually created by gas distributor, and used by gas transporter and gas producer for optimization of its flow and inventories. Moreover, every natural gas distributor is obliged to make a nomination of natural gas by its supplier, which is the amount of gas needed for the following day (or other future period). There is a certain regulated tolerance that is allowed. In case the actual consumption exceeds the nominated amount, the distributor must pay a certain penalty. On the other hand, if nominated amount exceeds actual consumption, different type of penalty will be charged as well (although lower). Since the incorrect nominations lead to high costs, an accurate predictions of natural gas consumption for the following day are very important to natural gas distributor due to financial reasons.
The purpose of this paper is to provide an overview of predictive models of natural gas consumption for residential and commercial use and to give suggestions for its more effective use. More precisely, 4 research question are raising in this paper: What are the most used and most accurate methods for predicting NG consumption? What are the most used input variables for modelling of NG consumption and is there any dependency between chosen methods and input variables? What are prediction areas and forecast horizon for predicting NG consumption?
This paper is structured as follows: in Section 2 methodology is described, Section 3 gives an overview of prediction area and prediction horizons, Section 4 describes prediction methods and Section 5 gives an overview of input and output variables used for modelling. The key findings of this research are given in Section 6.
2. Methodology
For this preliminary research, literature overview analysis was conducted using the two most relevant scientific databases Web of Science Core Collection (WoSCC) and Scopus in October 2017. The keywords “natural-gas prediction (consumption OR demand)” were used for searching articles in both databases. The articles in WoS database were searched within three WoSCC indexes: Science Citation Index Expanded (SCI-Expanded), Social Science Citation Index (SSCI), and Arts and Humanities Citation Index (A&HCI). The time span used for analysis was from 2002 to 2017.
This search resulted with 197 papers from WoS and 431 papers from Scopus. After reviewing the title, abstracts and keywords of all found articles from WoS and first 100 articles from Scopus sorted by relevance, articles that are not related to models for prediction of natural gas consumption for residential or commercial use were eliminated. Thereafter, 29 articles from WoSCC and 24 articles from Scopus remain that met posted criteria. However, 14 articles were in both databases so 39 articles were analyzed according to several criteria: methods used for predictions of natural gas consumption, input variables used for modelling, prediction area and

101
JIOS, VOL. 43. NO. 1 (2019), PP. 99-117
JOURNAL OF INFORMATION AND ORGANIZATIONAL SCIENCES
prediction horizon. Similar literature review was conducted by Soldo [4], who analyzed natural gas consumption from the year 1949 to 2010.
In some papers, several prediction methods, prediction areas or prediction horizons were used. Due to this reason, in following sections, those papers are mentioned multiple times in the same section.
Year of publication
Number of papers
% Authors
2003 1 2.56% Viet & Mandziuk 2004 2 5.13% Gil & Deferrari; Elragal 2005 2 5.13% Aras; Gutierrez et al. 2007 1 2.56% Potočnik et al. 2008 1 2.56% Brabec et al. 2009 2 5.13% Tonković et al.; Xie & Li
2010 4 10.26% Azadeh et al.; Forouzanfar et al.; Ma & Li; Kumar & Jain
2011 3 7.32% Kaynar et al.; Sabo et al.; Azadeh et al. 2012 2 5.13% Demirel et al.; Olgun et al.
2013 3 7.32% Taspinar et al.; Akpinar & Yumusak; Akpinar & Yumusak
2014 2 5.13% Soldo et al.; Feng et al.
2015 7 17.95% Azadeh et al.; Boran; Izadyar et al.; Szoplik; Wu et al.; Zhu et al.; Zhang & Yang
2016 4 10.26% Akpinar & Yumusak; Bai & Li; Baldacci et al.; Zeng & Li
2017 5 12.82% Akpinar & Yumusak; Panapakidis & Dagoumas; Ma & Lu; Akpinar et al.; Akpinar & Yumusak
Total 39 100.00%
Table 1. Number of published papers per year
As it can be seen in Table 1, in the last three years 16 papers considering natural gas prediction were published, which is more than 41% of all analyzed papers.
3. Overview of Prediction Areas and Horizons
Prediction of NG consumption can be conducted on different areas, for example on the country, region, city or individual customer area [4]. From Table 2 it can be seen that the authors mostly predict natural gas consumption on country level. Reason for this can be found in the fact that the data about natural gas consumption is more available because of the various statistical (energy) reports in which this kind of data can be published.

102
JIOS, VOL. 43. NO. 1 (2019), PP. 99-117
ŠEBALJ, MESARIĆ AND DUJAK ANALYSIS OF METHODS AND TECHNIQUES FOR...
Prediction
area Published papers Total
Country [5], [6], [7], [8], [9], [10], [11], [12], [13], [14], [15], [16], [17], [18], [19], [20], [21], [22], [23]
19
Region [24], [25], [26], [27], [28], [29], [30], [31], [32]
9
City [33], [34], [35], [36], [37], [38], [39], [40], [41], [42], [43]
11
House [43] 1
Table 2. Overview of prediction areas
Table 3 shows the overview of countries, in which predictions of natural gas consumption were made.
Country Number of
published papers References
Argentina 1 [25]
China 8 [28], [10], [15], [18], [20], [41], [21], [23]
Croatia 3 [27], [35], [43] Egypt 1 [26] Greece 1 [22] India 1 [11] Iran 4 [8], [9], [16], [39] Italy 1 [42]
Middle Eastern countries
1 [13]
Poland 2 [24], [40] Slovakia 1 [7] Slovenia 1 [6]
Spain 1 [5]
Turkey 12 [33], [12], [34], [14], [29], [36], [37], [17], [30], [31], [32], [38]
United Kingdom
1 [19]
Table 3. Overview of the number of published papers by countries where predictions were made
There are several prediction horizons that can be used for prediction of natural gas consumption. Large number of authors were predicting natural gas consumption on

103
JIOS, VOL. 43. NO. 1 (2019), PP. 99-117
JOURNAL OF INFORMATION AND ORGANIZATIONAL SCIENCES
annual level. Gil & Deferrari [25] presented a model intended to predict a natural gas consumption on the short and intermediate range of time for the region in Argentina. In the intermediate range (1-5 years), the model can estimate the annual peak consumption. Xie and Li [28] were predicting total demand for the years 2003 to 2005, according to the data from 1996 to 2002. Gutierrez et al. [5] used the stochastic Gompertz innovation diffusion model for forecasting annual natural gas consumption in Spain, Forouzanfar et al. [9] used a logistic based approach to predict the annual natural gas consumption for the years 2006 to 2008, while Ma & Li [10] predicted China’s gas consumption in 2009-2020. For their study, Kumar & Jain [11] used the data obtained from Energy Statistics in India since 1970-1971 to 2005-2006. Azadeh et al. [13] projected natural gas consumption in four Middle Eastern countries for the time period 2008 to 2015, Olgun et al. [14] presented a model in order to estimate the annual NG demand for Turkey until year 2030, Feng et al. [15] presented prediction values of NG demand during 2012 to 2015 using ARIMA model, Zhang & Yang [20] forecasted natural gas consumption under different scenarios from 2015 to 2020., while Boran [17], Wu et al. [18], Zeng & Li [21] and Ma & Liu [23] used grey prediction models to predict annual NG consumption in Turkey and China.
Forouzanfar et al. [9] modelled seasonal NG consumption (for the years 2006 to 2008), as well as Baldacci et al. [42].
Predicting natural gas consumption on monthly level was reported by Viet & Mandziuk [24], who considered three types of prediction – one-day, one-week and four-week (a month), Aras [33], who forecasted residential consumption using genetic algorithms for the years 2009 to 2013, Akpinar & Yumusak [36], [37] who predicted households consumption from 2009 to 2012, Azadeh et al. [16], who proposed a hybrid method based on computer simulation and ANFIS for the years 2009 to 2013, Izadyar et al. [39], who predicted the residential heating demand in Iran, and Akpinar & Yumusak [30], who forecasted NG consumption using different time series methods.
There are three papers in which weekly prediction of natural gas consumption was reported. Those are papers written by Viet & Mandziuk [24], who conducted three types of prediction – one-day, one-week and four-week, Potočnik et al. [6], who proposed a forecasting model in order to forecast risk estimation, and Kaynar et al. [12], who used neural network and neuro fuzzy system for prediction of NG consumption on weekly basis.
The largest number of authors predicted natural gas consumption on a daily level. Viet & Mandziuk [24], among the other predictions, conducted a one-day prediction of natural gas consumption, while Gil & Deferrari [25], as mentioned earlier, presented a model intended to predict a natural gas consumption on the short and intermediate range of time for the region in Argentina. In the short range, the model is able to predict the consumption 1 to 5 days in advance. Elragal [26] proposed a model for prediction of daily natural gas consumption needed by gas utilities, Potočnik and co-authors [6] presented a risk model that is applicable to estimating the daily forecasting risk. In order to do that, they had to create a model for daily prediction of natural gas consumption. Brabec et al. [7] forecasted a daily consumption of NG at the level of individual customers, and Azadeh et al. [8]
104
JIOS, VOL. 43. NO. 1 (2019), PP. 99-117
ŠEBALJ, MESARIĆ AND DUJAK ANALYSIS OF METHODS AND TECHNIQUES FOR...
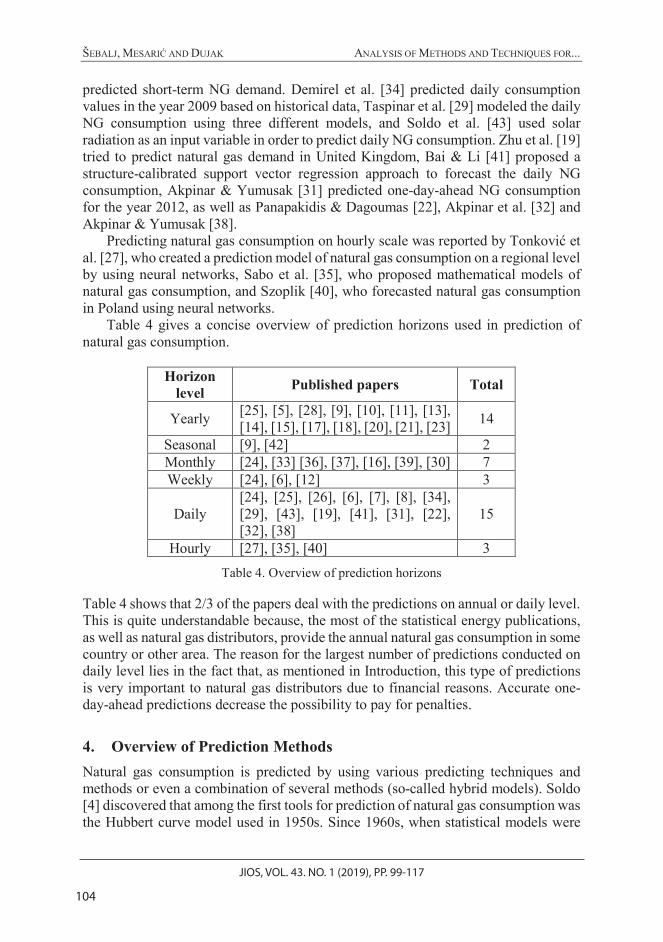
predicted short-term NG demand. Demirel et al. [34] predicted daily consumption values in the year 2009 based on historical data, Taspinar et al. [29] modeled the daily NG consumption using three different models, and Soldo et al. [43] used solar radiation as an input variable in order to predict daily NG consumption. Zhu et al. [19] tried to predict natural gas demand in United Kingdom, Bai & Li [41] proposed a structure-calibrated support vector regression approach to forecast the daily NG consumption, Akpinar & Yumusak [31] predicted one-day-ahead NG consumption for the year 2012, as well as Panapakidis & Dagoumas [22], Akpinar et al. [32] and Akpinar & Yumusak [38].
Predicting natural gas consumption on hourly scale was reported by Tonković et al. [27], who created a prediction model of natural gas consumption on a regional level by using neural networks, Sabo et al. [35], who proposed mathematical models of natural gas consumption, and Szoplik [40], who forecasted natural gas consumption in Poland using neural networks.
Table 4 gives a concise overview of prediction horizons used in prediction of natural gas consumption.
Horizon level
Published papers Total
Yearly [25], [5], [28], [9], [10], [11], [13], [14], [15], [17], [18], [20], [21], [23]
14
Seasonal [9], [42] 2 Monthly [24], [33] [36], [37], [16], [39], [30] 7 Weekly [24], [6], [12] 3
Daily [24], [25], [26], [6], [7], [8], [34], [29], [43], [19], [41], [31], [22], [32], [38]
15
Hourly [27], [35], [40] 3
Table 4. Overview of prediction horizons
Table 4 shows that 2/3 of the papers deal with the predictions on annual or daily level. This is quite understandable because, the most of the statistical energy publications, as well as natural gas distributors, provide the annual natural gas consumption in some country or other area. The reason for the largest number of predictions conducted on daily level lies in the fact that, as mentioned in Introduction, this type of predictions is very important to natural gas distributors due to financial reasons. Accurate one-day-ahead predictions decrease the possibility to pay for penalties.
4. Overview of Prediction Methods
Natural gas consumption is predicted by using various predicting techniques and methods or even a combination of several methods (so-called hybrid models). Soldo [4] discovered that among the first tools for prediction of natural gas consumption was the Hubbert curve model used in 1950s. Since 1960s, when statistical models were

105
JIOS, VOL. 43. NO. 1 (2019), PP. 99-117
JOURNAL OF INFORMATION AND ORGANIZATIONAL SCIENCES
developed, various statistical models have been used for predictions of NG consumption. From the late 1970s and 1980s, the artificial neural networks became very popular forecasting tool. Lately, there are new methods used in predictions of natural gas consumption such as grey models or genetic algorithms.
In this research, the most often method used for prediction of natural gas consumption was neural network or techniques based on similar principles (like adaptive network-based fuzzy inference system - ANFIS). Neural networks are programs that, most often by the iterative process from the past data, try to find the connection between input and output variables of the model in order to obtain the output value for the new input variables [44]. Adaptive network-based fuzzy inference system (ANFIS) was presented by Jang [45], which is “a fuzzy inference system implemented in the framework of adaptive networks”. According to Azadeh et al. [8], “ANFIS possess both the learning capability of neural networks and the structured knowledge representation employed in fuzzy inference system which is appropriate for nonlinear modelling and time series prediction”.
Authors who used neural networks were [24], [27], [12], [29], [34], [14], [43], [15], [40], [39], and [32]. Viet & Mandziuk [24] presented several neural and fuzzy neural approaches. Comparing the average Mean Absolute Percentage Error (MAPE) values, the best performance for daily (4.04%), as well as for weekly (7.04%) predictions, was achieved using three neural modules, each of which was devoted to a specific temperature range. Tonković et al. [27], Taspinar et al. [29] and Kaynar et al. [12] trained and tested two neural network algorithms – the multilayer perceptron and the radial basis function network with different activation functions. The first mentioned algorithm produced the smallest MAPE in all three analyzed paper (9.36%, 0.814%, 5.477%, respectively). Taspinar et al. [29] also compared neural networks algorithms and time series model. In their research, Demirel and co-authors [34] used multilayer perceptron algorithm for neural network and compared this model with 2 time series models. Neural network performed the best result with the MAPE of 0.1833. Olgun et al. [14] compared neural networks with support vector machines and they concluded that SVM had less statistical error. Feng et al. [15] developed three different kinds of model – ARIMA model, neural network model and combined model. Neural network model (radial basis function) achieved the MAPE of 5.78%. Szoplik [40] also used a multilayer perceptron algorithm in order to predict natural gas consumption. Average MAPE was 8% and the lower values of MAPE are recorded in the winter months. Soldo et al. [43] investigated the influence of solar radiation on residential NG consumption. Among several different methods, they used neural networks on two different data sets, and the performance measure was mean absolute range normalized error (MARNE). The first data set is from a model house (MARNE 5.06%) and the second one from the local distribution company (MARNE 2.52%). Extreme learning machine (ELM), as a learning algorithm for feedforward neural network, was used by Izadyar et al. [39]. They compared ELM method with artificial neural network (back propagation as a learning rule) and genetic programming. Accuracy results, measured in terms of RMSE (root mean square error), go in the favor of ELM model (0.18068). Akpinar et al. [32] presented ABC (Artificial Bee Colony) algorithm as an alternative of using the BP neural network

106
JIOS, VOL. 43. NO. 1 (2019), PP. 99-117
ŠEBALJ, MESARIĆ AND DUJAK ANALYSIS OF METHODS AND TECHNIQUES FOR...
algorithm. ABC neural network generated lower error values (14.9% MAPE) compared to BP neural network (33.9% MAPE).
In several papers hybrid models were presented. Panapakidis & Dagoumas [22] proposed an interesting model that combines the wavelet transform, genetic algorithm, adaptive neuro-fuzzy inference system and feed-forward neural network. They tried to test the robustness of a novel hybrid computational intelligence model in day-ahead predictions of natural gas demand. Their model was applied to all natural gas distribution points. The lowest errors were met in large city centers. There was four more paper that combined two different models. Elragal [26] proposed a hybrid model consisted of neural network and fuzzy-genetic model. In the first stage, two adaptive neural network predictors run in parallel and produce independent prediction. These predictions are then input to the second stage, which includes a fuzzy-genetic module. Although neural network predictors performed well (4.12% MAPE), the combinations strategy improved the result (3.97% MAPE). In their paper, Xie & Li [28] introduced grey modelling method optimized by genetic algorithm. Traditional grey prediction model resulted with the relative error of 10.5%, while the same error based on the optimized model was smaller (8.16%). As mentioned earlier, Feng et al. [15] developed three different kinds of model – ARIMA model, neural network model and combined model. The MAPE of the combined (hybrid) model was 4.52%. In this case, the hybrid model did not achieve better result, since the ARIMA model had error percentage of 3.06%. Azadeh et al. [16] created a hybrid model of adaptive neuro fuzzy inference system and computer simulation which had the MAPE value of 13.5%.
The same authors [8] presented an adaptive network-based fuzzy inference system (ANFIS) in their earlier research with the MAPE value of 2%. The similar research was conducted by Azadeh et al. [13] in order to predict natural gas consumption in Middle Eastern countries. The results of MAPE for the Bahrain, Saudi Arabia, Syria and United Arab Emirates were 1.8%, 1.4%, 7.5% and 1.6%, respectively. The ANFIS was used by Kaynar et al. [12] as well, who presented three different models to predict natural gas consumption – neural network model, time series ARIMA model and ANFIS. The latter produced the MAPE value of 5.468% which is almost the same as the neural network model (5.477%).
Several authors used various grey prediction models for predictions of natural gas consumption. According to Kayacan et al. [46], “grey models predict the future values of a time series based only on a set of the most recent data depending on the window size of the predictor”. Grey models for energy prediction can be mainly categorized into three types [21]: 1) grey models’ self-optimization, 2) combination of the grey models and some other models (neural networks, support vector machines, ARIMA, etc.) and 3) upgrade of the grey model structures with some novel methods. Ma & Li [10] predicted natural gas consumption based on the grey system model. The same approach was using Boran [17], who proposed a grey prediction with rolling mechanism (GPRM) for a first time in order to predict natural gas consumption in Turkey. He managed to achieve a MAPE of 6.5%. Wu et al. [18] used a novel grey system model with the MAPE value of 2%. Zeng & Li [21] presented a self-adapting intelligent grey prediction model (SIGM) with the average error of 3.75%. A novel

107
JIOS, VOL. 43. NO. 1 (2019), PP. 99-117
JOURNAL OF INFORMATION AND ORGANIZATIONAL SCIENCES
time-delayed polynomial grey prediction model was developed by Ma & Liu [23]. The mean absolute percentage error was 4.62%.
Another commonly used techniques for natural gas consumption prediction are support vector machine (SVM) and support vector regression (SVR). Olgun et al. [14] compared neural networks with support vector machines and they concluded that support vector machines had less statistical error for demand estimation of natural gas consumption. Soldo et al. [43] used several linear and nonlinear models for predictions. The testing errors obtained by nonlinear neural networks (house model: 5.06%, LDC: 2.52%) and SVR models (house model: 5.28%, LDC: 2.25%) are slightly higher compared to linear models. Zhu et al. [19] presented the method that integrated the SVR algorithm with the reconstruction properties of a time series and optimizes the original local predictor by removing false neighbors. The MAPE of that model was 3.8%. A structure-calibrated SVR approach was used by Bai & Li [41]. The results indicated that the mean absolute percentage error was 2.36%.
Aras [33] tried to forecast short-term demand of natural gas in residences by using genetic algorithms. According to him, genetic algorithms are stochastic search techniques based on the mechanism of natural selection and natural genetics. Genetic programming technique was used by Forouzanfar et al. [9] as well. The largest yearly percent error for the residential sector was less than 1.2% and less than 3.6% for the commercial sector. Izadyar et al. [39] compared the genetic programming model with the ELM and neural network models, mentioned before. Genetic programming prediction error was slightly higher (0.18504), compared to the ELM model (0.18068).
Some authors used mathematical or statistical models in order to predict natural gas consumption. Gil & Deferrari [25] developed a model which is able to predict the residential and commercial NG consumption at short (1 to 5 days) and intermediate range (1 to 5 years). At short range, prediction error was about 10%, and at intermediate range the same error was 12%. Gutierrez et al. [5] presented a stochastic Gompertz innovation diffusion model while Potočnik et al. [6] forecasted NG consumption by using their model that is already used in several gas distribution systems. In that study, the forecasting errors were described by the absolute error, normalized to the maximum transport capacity of the gas distribution system. The error of the validation data was 2.6%. Brabec et al. [7] developed nonlinear mixed effects model (NLME), a parametric statistical model which is later compared with two classical time series approaches. This model’s mean absolute error (MAE) was 12.60%. Several advanced linear and nonlinear mathematical models, such as exponential, Gompertz and logistic model, were used by Sabo et al. [35]. They concluded that linear approximation gives an acceptable forecast for practical needs. Forouzanfar et al. [9] used a method based on the concept of the nonlinear programming with earlier mentioned genetic programming technique. Forecasting errors are almost the same for both methods, the largest yearly percent error for the residential sector was less than 1.2% and less than 3.6% for the commercial sector. Soldo et al. [43] compared several linear models such as auto-regressive model with exogenous inputs (ARX) and stepwise regression. ARX model produced the MARNE of 3.25% for house model and 1.17% for LDC, while stepwise regression had error

108
JIOS, VOL. 43. NO. 1 (2019), PP. 99-117
ŠEBALJ, MESARIĆ AND DUJAK ANALYSIS OF METHODS AND TECHNIQUES FOR...
values of 3.64% for house model and 1.33% for LDC. Akpinar & Yumusak [31] used multiple linear regression (MLR) for prediction of NG consumption. They developed several models (scenarios) and the lowest MAPE was 6.8%, while the highest was even 54.5%. Akpinar & Yumusak [37] also developed a model using multiple linear regression. The MAPE of their model was 14.38%. Among other methods used for NG consumption predictions can be highlighted Baldacci et al. [42], who defined two predicting techniques, one based on a nearest neighbor approach and one employing local regression analysis. They conclusion was that the local regression overcomes the first approach as to the accuracy of predictions. Zhang & Yang [20] presented Bayesian Model Averaging (BMA) for prediction of natural gas consumption in China. This model had the MAPE of 2.6%.
There are several time series methods used for predicting natural gas consumption. Kaynar et al. [12], Demirel et al. [34], Akpinar & Yumusak [36], [30], and Feng et al. [15] used autoregressive integrated moving average (ARIMA), very popular method in analyzing of time series. This model originated from the autoregressive model (AR), the moving average (MA) and the combination of integrated AR and MA. ARIMA models can be used if data is not a missing value and the time series is stationary [36]. Kaynar et al. [12] compared this model with neural networks and ANFIS as well. ARIMA model has yielded the worst results with the MAPE of 6.41%. Demirel et al. [34] also compared ARIMA model with neural network models and it produced slightly worse results. The MAPE value of ARIMA was 0.1984, while the same error of neural network was 0.1833. Akpinar & Yumusak wrote two papers considering prediction of natural gas consumption using ARIMA. In the first one [36], the MAPE was 8.48%, while in the second one [30] the same error was 12.9%. In the research, conducted by Feng et al. [15], who proposed three models – ARIMA, neural network and combined model, the ARIMA model yielded the error of 3.06%, which is the best result among all methods. Taspinar [29] also used type of ARIMA model, called SARIMAX, which is seasonal autoregressive integrated moving average model with exogenous inputs and the mean absolute percentage error was 0.792%. Akpinar & Yumusak [30] presented some other time series methods as well. Those are time series decomposition (MAPE of 19%), Holt-Winters exponential smoothing (MAPE of 14%). The same authors [38] used some other nonseasonal exponential smoothing methods in their most recent research. The lowest mean absolute percentage error was determined as 14.1%. Kumar & Jain [11] used singular spectrum analysis in order to predict natural gas consumption. This model had a MAPE value of 3.4%.
Table 5 shows an overview of prediction methods used in predicting natural gas consumption and the average prediction error for every group of prediction methods. For calculation of average prediction error, authors have recorded the MAPE errors of all prediction methods within the same group and then calculated the mean value. In some papers (marked with *) there is no available data about prediction errors, while in several other papers (marked with **) authors used some other measure of prediction error (like RMSE). From this table it can be seen that the most accurate predictions were given by genetic algorithms, followed by support vector machines/regression and ANFIS. However, these conclusions must be taken with

109
JIOS, VOL. 43. NO. 1 (2019), PP. 99-117
JOURNAL OF INFORMATION AND ORGANIZATIONAL SCIENCES
caution because there is a small number of papers dealing with these methods. For example, there is only one paper that used genetic algorithms and had available data about prediction errors. Neural networks also could be considered as a quite precise method since the average error is less than 6%. The time series methods and hybrid models have the highest prediction error.
Prediction method
Published papers Total Average
prediction error (%)
Neural network
[24], [27], [12], [34], [14]*, [29], [43]**, [15], [39], [40], [32]
11 5.74
ANFIS [8], [12], [13] 3 3.50 Grey model [10]*, [17], [18], [21], [23] 5 4.22 SVM/SVR [14]*, [43], [19], [41] 4 3.42
Genetic algorithms
[33]**, [9], [39]** 3 2.40
Mathematical and statistical
models
[25], [5]*, [6], [7], [9], [35]*, [37], [43], [20], [42]*, [31]
11 6.81
Time series [11], [12], [34], [29], [36], [15], [30], [38]
8 10.20
Hybrid models
[26], [28], [15], [16], [22]* 5 7.54
* For these papers there are no available data for prediction errors of model used ** These papers use measure of prediction error other than MAPE
Table 5. Overview of prediction methods
Table 6 gives even more precise overview of number of papers per prediction method by prediction area and prediction horizon.
Prediction method Prediction area* Prediction horizon**
Co R C H Y S M W D H Neural network 3 4 4 1 2 2 2 5 2
ANFIS 3 1 1 1 Grey model 5 5 SVM/SVR 2 2 1 1 3
Genetic algorithms 1 2 1 1 2 Mathematical and statistical
models 5 2 4 1 3 2 1 1 5 1
Time series 3 2 3 2 2 1 3 Hybrid models 3 2 2 1 2
* Co – country, R – region, C – city, H – house ** Y – yearly, S – seasonal, M – monthly, W – weekly, D – daily, H – hourly
Table 6. Number of papers per prediction method by prediction area and prediction horizon

110
JIOS, VOL. 43. NO. 1 (2019), PP. 99-117
ŠEBALJ, MESARIĆ AND DUJAK ANALYSIS OF METHODS AND TECHNIQUES FOR...
From this two tables, it can be concluded that the most often used methods for prediction of natural gas consumption are neural network and methods based on similar principles (ANFIS) as well as various mathematical and statistical models.
Also, it can be seen that some methods are linked to a specific prediction area or horizon. For example, all authors, who used grey models, conducted their research on country level for annual prediction. Neural networks, as well as mathematical and statistical models, can be used on all kind of prediction areas for all prediction horizons.
5. Overview of Variables Used for Modelling
Various data sets were used to produce prediction models of NG consumption. Accordingly, authors used different input variables in order to create a model but it can be noticed that the most commonly used variable was past natural gas consumption. This input variable was used by Gutierrez et al. [5], Xie & Li [28], Forouzanfar et al. [9], Kumar & Jain [11], Kaynar et al. [12], Akpinar & Yumusak [36], [30], [38], Feng et al. [15], Boran [17], Wu et al. [18], Bai & Li [41], Zeng & Li [21], Ma & Liu [23] and Akpinar et al. [32]. Those authors mostly used grey models and various time series models. Some authors, together with the past gas consumption, used some other variables as well. Viet & Mandziuk [24], Gil & Deferrari [25], Sabo et al. [35], Baldacci et al. [42] used outside temperature, Elragal [26] temperature, wind speed, heat loss, day of week, Potočnik et al. [6] used past weather data, weather forecast, seasonal information, days of week, holidays, industrial nominations, Tonković et al. [27] used similar input variables, such as month, season detection, day type (working day, holiday, day after holiday), day of the week, temperature, wind direction, wind velocity at different time, Akpinar & Yumusak [37], [31] used temperature, humidity, wind speed, holidays, number of gas consumers, Izadyar [39] used temperature and months, Zhu et al. [19] temperature, wind speed, effective temperature and pseudo seasonal normal effective temperature, while Panapakidis & Dagoumas [22] used temperature, months and days of week. Aras [33] used for predictions consumer price index and average daily temperatures. Brabec et al. [7] used temperature and day of the week. Similar variables can be found in Szoplik’s paper [40]. He used temperature, hour of the day, day of the week, month and day of month. For the prediction of natural gas demand, Azadeh et al. [8] used day of week, demand of the same day in previous year, demand of a day before, demand of 2 days before as input variables. Demirel et al. [34] used daily average temperature, squared temperature, natural gas price, number of gas consumers, 12 lags of consumption, while Taspinar et al. [29] used humidity, atmospheric pressure, wind speed, ambient air temperature and average cloud cover. Some authors included Gross domestic product (GDP) in their models. Ma & Li [10] used GDP and past consumption, Olgun et al. [14] used GDP and population, while Azadeh et al. [16] used GDP, population, NG price, inflation rate, unemployment rate, IT/IS index, human development index and CO2 emission, while the same author [13] in his other paper used GDP and population. Zhang & Yang [20] for their BMA model

111
JIOS, VOL. 43. NO. 1 (2019), PP. 99-117
JOURNAL OF INFORMATION AND ORGANIZATIONAL SCIENCES
used GDP, urban population, energy consumption structure, industrial structure, energy efficiency and export of goods. Soldo et al. [43] conducted an interesting research in which the influence of solar radiation on predicting residential natural gas consumption was investigated. The input variables they used were weather data (on hourly basis) and solar radiation.
Input variable Prediction method*
A B C D E F G H Past gas consumption 8 2 5 3 2 9 7 4
Temperature 7 2 2 8 2 2 Days of week 2 1 2 2
Month 3 1 1 Seasonal information 1 1
Wind data 2 1 1 1 1 GDP 1 1 1 1 1 1
Holidays 1 3 Humidity 1 1 1 Population 1 1 1 1 1
No of gas consumers 1 2 1 Gas price 1 1 1
* A – neural network, B – ANFIS, C – grey model, D – SVM/SVR, E – genetic algorithm, F – mathematical and statistical model, G – time series, H – hybrid model
Table 7. Number of papers by input variables used according to prediction method
Input variable Prediction area* Prediction horizon** Co R C H Y S M W D H
Past gas consumption 14 8 8 1 11 2 5 3 11 2 Temperature 4 7 7 1 1 1 3 2 12 3 Days of week 4 2 1 1 5 2
Month 1 1 2 1 1 2 Seasonal information 1 1 1 1 1
Wind data 2 3 1 1 1 4 1 GDP 5 4 1
Holidays 1 1 1 1 1 2 Humidity 1 1 1 1 Population 4 3 1
No of gas consumers 1 2 1 2 Gas price 1 1 1 1
* Co – country, R – region, C – city, H – house ** Y – yearly, S – seasonal, M – monthly, W – weekly, D – daily, H – hourly
Table 8. Number of papers by input variables used according to prediction area and horizon
From this analysis, it can be seen that past gas consumption is the most important input variable for prediction of natural gas consumption. It was used in largest number

112
JIOS, VOL. 43. NO. 1 (2019), PP. 99-117
ŠEBALJ, MESARIĆ AND DUJAK ANALYSIS OF METHODS AND TECHNIQUES FOR...
of papers, especially in papers where mathematical, grey and time series models were presented. The important variables were also various meteorological data.
Table 7 shows the overview of number of papers by input variables used most frequently according to prediction method while Table 8 shows the same information according to prediction area and horizon. It can be concluded that in researches based on neural networks method for predicting of NG consumption, the largest number of input variables is used. Just slightly less variables are used in the group of different mathematical and statistical models. When comparing results of Table 5 and Table 7, it can be seen that the accuracy of the models is not affected by the number of input variables, since the most accurate models have very small number of variables (genetic algorithms and ANFIS), as well as the least accurate models (e.g. time series models).
When it comes to different prediction areas in prediction of NG consumption, there is no obvious difference in the number of input variables used. On the other hand, when it comes to different prediction horizon, most input variables are used in researches on daily and monthly bases.
6. Discussion and Conclusion
The aim of this paper is to present an overview of the latest papers that deal with predictions of natural gas consumption for residential or commercial use. In order to achieve this goal, the search of relevant scientific articles was conducted using scientific databases Web of Science Core Collection and Scopus. There was total of 39 papers that met required conditions. Those papers were analyzed and then compared according to several criteria, such as methods used for predictions, input variables used for modelling, prediction areas and prediction horizons. Natural gas prediction models are complex models with high interdependency between its structural components, e.g. choice of appropriate method will be dependent on chosen prediction horizon or the use of the appropriate input variables will depend on the method used. The results of this paper show that the most common method used for predictions of natural gas consumption is neural network or methods based on the same principles (like ANFIS), followed by time series methods and various mathematical and statistical methods. Other popular methods are genetic algorithms, support vector machines/regression, grey system models or hybrid models based on several methods. Some researchers used two or more methods in the same paper in order to compare them and choose the most appropriate one. From our relatively small sample we can generate preliminary conclusion that the methods, that provide the lowest average prediction errors, are genetic algorithms, support vector machines and ANFIS, while the least accurate methods are various time series methods and hybrid models. But obviously there is no statistically significant difference between accuracy of methods, and this could be one of the reasons for use of such a huge number of different methods in prediction of NG consumption (some other attributes of natural gas consumption, like number and type of available variables, rather than accuracy, are primarily taken into account).

113
JIOS, VOL. 43. NO. 1 (2019), PP. 99-117
JOURNAL OF INFORMATION AND ORGANIZATIONAL SCIENCES
Analysis has shown that for modelling, authors often use past natural gas consumption data and weather data (mostly temperature) as input variables. Other variables include month, days of the week, wind speed, number of natural gas consumers, GDP, population, etc. Speaking of prediction areas, it can be seen that most of the papers deal with the predictions on country level. Predictions can be made as well as on regional, city, or even house level. The analysis also revealed that authors mostly predict natural gas consumption on daily and annual level. There are only few papers that predict natural gas consumption on seasonal, monthly, weekly or hourly level.
Limitation of this study is reflected in relatively small number of analyzed papers. For further research, authors plan to search more relevant scientific databases, such as Proquest in order to obtain larger number of relevant sources, or even to search for papers written in other languages. This paper can be helpful for other researchers who deal with predictions of natural gas consumption in order to create better and more accurate models.
Acknowledgements
This work has been fully supported by Croatian Science Foundation under Grant No. IP-2016-06-8350 "Methodological Framework for Efficient Energy Management by Intelligent Data Analytics" (MERIDA).
References
[1] International Energy Agency, "World Energy Outlook 2016," Paris.
[2] "International Energy Outlook 2016.," 2016. [Online]. Available: https://www.eia.gov/outlooks/ieo/pdf/0484(2016).pdf.
[3] "Natural gas consumption," 2015. [Online]. Available: ttp://www.bp.com/en/global/corporate/energy-economics/statistical-review-of-world-energy/natural-gas/natural-gas-consumption.html.
[4] B. Soldo, "Forecasting natural gas consumption," Applied Energy, vol. 92, pp. 26-37, 2012.
[5] R. Gutierrez, A. Nafidi and R. Gutierrez Sanchez, "Forecasting total natural-gas consumption in Spain by using the stochastic Gompertz innovation diffusion model," Applied Energy, vol. 80, no. 2, pp. 115-124, 2005.
[6] P. Potočnik, M. Thaler, E. Govekar, I. Grabec and A. Poredoš, "Forecasting risks of natural gas consumption in Slovenia," Energy Policy, vol. 35, no. 8, pp. 4271-4282, 2007.
[7] M. Brabec, O. Konar, E. Pelikan and M. Maly, "A nonlinear mixed effects model for the prediction of natural gas consumption by individual

114
JIOS, VOL. 43. NO. 1 (2019), PP. 99-117
ŠEBALJ, MESARIĆ AND DUJAK ANALYSIS OF METHODS AND TECHNIQUES FOR...
customers," International Journal of Forecasting, vol. 24, no. 4, pp. 659-678, 2008.
[8] A. Azadeh, S. Asadzadeh and A. Ghanbari, "An adaptive network-based fuzzy inference system for short-term natural gas demand estimation: Uncertain and complex environments," Energy Policy, vol. 38, no. 3, pp. 1529-1536, 2010.
[9] M. Forouzanfar, A. Doustmohammadi, M. Menhaj and S. Hasanzadeh, "Modeling and estimation of the natural gas consumption for residential and commercial sectors in Iran," Applied Energy, vol. 87, no. 1, pp. 268-274, 2010.
[10] Y. Ma and Y. Li, "Analysis of the supply-demand status of China’s natural gas to 2020," Petroleum Science, vol. 7, no. 1, pp. 132-135, 2010.
[11] U. Kumar and V. K. Jain, "Time series models (Grey-Markov, Grey Model with rolling mechanism and singular spectrum analysis) to forecast energy consumption in India," Energy, vol. 35, no. 4, pp. 1709-1716, 2010.
[12] O. Kaynar, I. Yilmaz and F. Demirkoparan, "Forecasting of natural gas consumption with neural network and neuro fuzzy system," Energy Education Science and Technology Part A: Energy Science and Research, vol. 26, no. 2, pp. 221-238, 2011.
[13] A. Azadeh, S. M. Asadzadeh, M. Saberi, V. Nadimi, A. Tajvidi and M. Sheikalishahi, "A Neuro-fuzzy-stochastic frontier analysis approach for long-term natural gas consumption forecasting and behavior analysis: The cases of Bahrain, Saudi Arabia, Syria, and UAE," Applied Energy, vol. 88, no. 11, pp. 3850-3859, 2011.
[14] M. Olgun, G. Ozdemir and E. Aydemir, "Forecasting of Turkey’s natural gas demand using artifical neural networks and support vector machines," Energy, Education, Science and Technology, vol. 30, no. 1, pp. 15-20, 2012.
[15] X. Feng, J. S. Zhang, S. H. Zou and W. Y. B. Bao, "Study on natural gas demand prediction model in China," in Proceedings of the 3rd International Conference on Energy, Environment and Sustainable Development, Shanghai, 2014.
[16] A. Azadeh, M. Zarrin, H. Rahdar Beik and A. Bioki, "A neuro-fuzzy algorithm for improved gas consumption forecasting with economic, environmental and IT/IS indicators," Journal of Petroleum Science and Engineering, vol. 133, pp. 716-739, 2015.
[17] F. Boran, "Forecasting Natural Gas Consumption in Turkey Using Grey Prediction," Energy Sources, vol. 10, no. 2, pp. 208-213, 2015.

115
JIOS, VOL. 43. NO. 1 (2019), PP. 99-117
JOURNAL OF INFORMATION AND ORGANIZATIONAL SCIENCES
[18] L. Wu, S. Liu, H. Chen and N. Zhang, "Using a Novel Grey System Model to Forecast Natural Gas Consumption in China," Mathematical Problems in Engineering, vol. 2015, pp. 1-7, 2015.
[19] L. Zhu, M. Li, Q. Wu and L. Jiang, "Short-term natural gas demand prediction based on support vector regression with false neighbours filtered," Energy, vol. 80, pp. 428-436, 2015.
[20] W. Zhang and J. Yang, "Forecasting natural gas consumption in China by Bayesian Model Averaging," Energy Reports, vol. 1, no. November, pp. 216-220, 2015.
[21] B. Zeng and C. Li, "Forecasting the natural gas demand in China using a self-adapting intelligent grey model," Energy, vol. 112, no. 1, pp. 810-825, 2016.
[22] I. Panapakidis and A. Dagoumas, "Day-ahead natural gas demand forecasting based on the combination of wavelet transform and ANFIS/genetic algorithm/neural network model," Energy, vol. 118, no. 1, pp. 231-245, 2017.
[23] X. Ma and Z. Liu, "Application of a novel time-delayed polynomial grey model to predict the natural gasconsumption in China," Journal of Computational and Applied Mathematics, vol. 324, pp. 17-24, 2017.
[24] N. H. Viet and J. Mandziuk, "Neural and fuzzy neural networks for natural gas consumption prediction," Neural, Parallel and Scientific Computations, vol. 13, no. 3-4, pp. 265-286, 2005.
[25] S. Gil and J. Deferrari, "Generalized Model of Prediction of Natural Gas Consumption," Journal of Energy Resources Technology, vol. 126, no. 2, pp. 90-98, 2004.
[26] H. Elragal, "Improving neural networks prediction using fuzzy-genetic model," in Proceedings of the Twenty First National Radio Science Conference (NRSC 2004), Cairo, 2004.
[27] Z. Tonković, M. Zekić Sušac and M. Somolanji, "Predicting natural gas consumption by neural networks," Technical Gazette, vol. 16, no. 3, pp. 51-61, 2009.
[28] Y. Xie and M. Li, "Research on Prediction Model of Natural Gas Consumption Based on Grey Modeling Optimized by Genetic Algorithm," in Proceedings - 2009 IITA International Conference on Control, Automation and Systems Engineering, CASE 2009, Zhangjiajie, 2009.
[29] F. Taspinar, N. Celebi and N. Tutkun, "Forecasting of daily natural gas consumption on regional basis in Turkey using various computational methods," Energy and Buildings, vol. 56, pp. 23-31, 2013.

116
JIOS, VOL. 43. NO. 1 (2019), PP. 99-117
ŠEBALJ, MESARIĆ AND DUJAK ANALYSIS OF METHODS AND TECHNIQUES FOR...
[30] M. Akpinar and N. Yumusak, "Year Ahead Demand Forecast of City Natural Gas Using Seasonal Time Series Methods," Energies, vol. 9, no. 9, p. 727, 2016.
[31] M. Akpinar and N. Yumusak, "Naıve forecasting of household natural gas consumption with sliding window approach," Turkish Journal of Electrical Engineering & Computer Sciences, vol. 25, pp. 30-45, 2017.
[32] M. Akpinar, F. Adak and N. Yumusak, "Day-Ahead Natural Gas Demand Forecasting Using Optimized ABC-Based Neural Network with Sliding Window Technique: The Case Study of Regional Basis in Turkey," Energies, vol. 10, no. 6, p. 781, 2017.
[33] N. Aras, "Forecasting Residential Consumption of Natural Gas Using Genetic Algorithms," Energy Exploration & Exploitation, vol. 26, no. 4, pp. 241-266, 2008.
[34] O. Demirel, S. Zaim, A. Caliskan and P. Ozuyar, "Forecasting natural gas consumption in Istanbul using neural networks and multivariate time series methods," Turkish Journal of Electrical Engineering and Computer Sciences, vol. 20, no. 5, pp. 695-711, 2012.
[35] K. Sabo, R. Scitovski, I. Vazler and M. Zekić Sušac, "Mathematical models of natural gas consumption," Energy Conversion and Management, vol. 52, no. 3, pp. 1721-1727, 2011.
[36] M. Akpinar and N. Yumusak, "Forecasting household natural gas consumption with ARIMA model: A case study of removing cycle," in Proceedings of 7th International Conference on Application of Information and Communication Technologies (AICT), Baku, 2013.
[37] M. Akpinar and N. Yumusak, "Estimating household natural gas consumption with multiple regression: Effect of cycle," in Proceedings of the 2013 International Conference on Electronics, Computer and Computation (ICECCO), Ankara, 2013.
[38] M. Akpinar and N. Yumusak, "Day-ahead natural gas forecasting using nonseasonal exponential smoothing methods," in Conference Proceedings - 2017 17th IEEE International Conference on Environment and Electrical Engineering and 2017 1st IEEE Industrial and Commercial Power Systems Europe, Milan, 2017.
[39] N. Izadyar, H. Ong, S. Shamshirband, H. Ghadamian and C. Tong, "Intelligent forecasting of residential heating demand for the District Heating System based on the monthly overall natural gas consumption," Energy and Buildings, vol. 104, no. 1, pp. 208-214, 2015.
[40] J. Szoplik, "Forecasting of natural gas consumption with artificial neural networks," Energy, vol. 85, no. 1, pp. 208-220, 2015.

117
JIOS, VOL. 43. NO. 1 (2019), PP. 99-117
JOURNAL OF INFORMATION AND ORGANIZATIONAL SCIENCES
[41] Y. Bai and C. Li, "Daily natural gas consumption forecasting based on a structure-calibrated support vector regression approach," Energy and Buildings, vol. 127, no. 1, pp. 571-579, 2016.
[42] L. Baldacci, M. Golfarelli, D. Lombardi and F. Sami, "atural gas consumption forecasting for anomaly detection," Expert Systems With Applications, vol. 62, pp. 190-201, 2016.
[43] B. Soldo, P. Potočnik, G. Šimunović, T. Šarić and E. Govekar, "Improving the residential natural gas consumption forecasting models by using solar radiation," Energy and Buildings, vol. 69, pp. 498-506, 2014.
[44] M. Zekić Sušac, A. Frajman Jakšić and N. Drvenkar, "Neuronske mreže i stabla odlučivanja za predviđanje uspješnosti studiranja," Ekonomski vjesnik, vol. 22, no. 2, pp. 314-327, 2009.
[45] J. Jang, "ANFIS: adaptive-network-based fuzzy inference system," IEEE transactions on systems, man, and cybernetics, vol. 23, no. 3, pp. 665-685, 1993.
[46] E. Kayacan, B. Ulutas and O. Kaynak, "Grey system theory-based models in time series prediction," Expert Systems with Applications, vol. 37, no. 2, pp. 1784-1789, 2010.
[47] G. Aydin, "Forecasting Natural Gas Production Using Various Regression Models," Petroleum Science and Technology, vol. 33, no. 15-16, pp. 1486-1492, 2015.