Embed Size (px)
Citation preview
ANALYSIS OF MAGNETICFIELD POLARIZATIONPARAMETERS BEFORE
AND AFTER KOYNAEARTHQUAKES
Fedir Dudkin1, Olha Leontyeva1, Baldev Arora2,Gautam Rawat2, Ashok Sharma3
1. Lviv Centre of Institute of Space Research of National Academy of Sciencesof Ukraine and National Space Agency of Ukraine, Naukova Str. 5-A, 79000
Lviv, Ukraine2. Wadia Institute of Himalayan Geology, 33, General Mahadeo Singh Road,
Dehra Dun, 288 001 India3. Shivaji University, Physics Department, Kolhapur, 416 004, Maharashtra,
India
European Geosciences Union General Assembly 2008Vienna, Austria, 13 – 18 April 2008
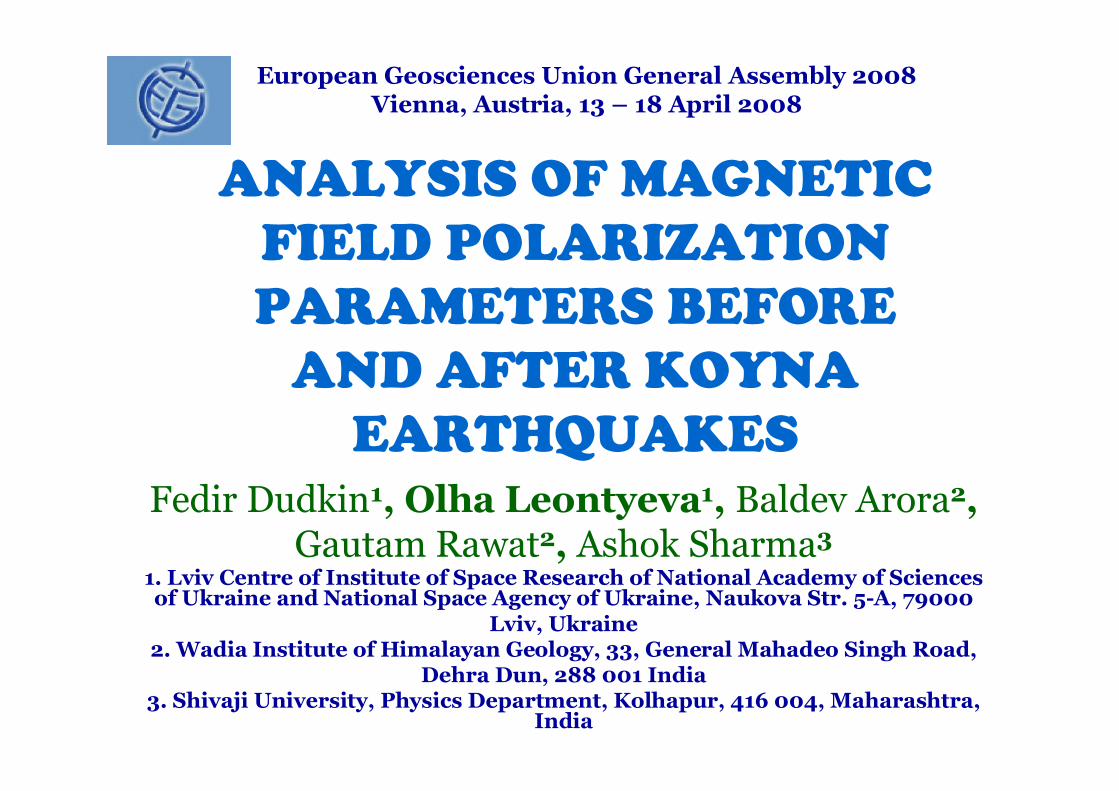
Measurement of natural magnetic field in ULF frequency band(0.001-10 Hz) is very perspective for study of the earthquake (EQ)precursors. One of magnetic field generalized representation ispolarization ellipse (PE), which allows the simplifying of localizationtask for EQ electromagnetic (EM) precursor source.
For looking for precursor candidates the data from 3-componentmagnetometers LEMI-30, located in measuring sites near Kolhapur andKoyna (both are in Maharashtra, India) were taken. These sites havelow enough magnetic interference and placed in seismo-active region.LEMI-30 magnetometers have a very low noise and work in frequencyrange 0.001-32 Hz. During observation time 1 April, 2006 – 5 June, 2006two clustered EQs occurred: 1) April, 17 at 16.39.58.87 (M=4.7, h=10 km,17.07 N, 73.69 E); 2) May, 21 at 20.29.00.29 (M=3.7, h=10 km, 16.9 N,73.61 E). The distance to both measuring sites from EQ epicentres wasin the range 30-89 km.
The wave form, dynamical Fourier spectra and polarization ellipseparameters of ULF magnetic field signals during period five daysbefore and one day after EQ events have been analyzed. The results onlooking for precursor candidates and analysis of signal peculiarities aregiven in the presentation.
This work is partially supported by STCU grant 3165.
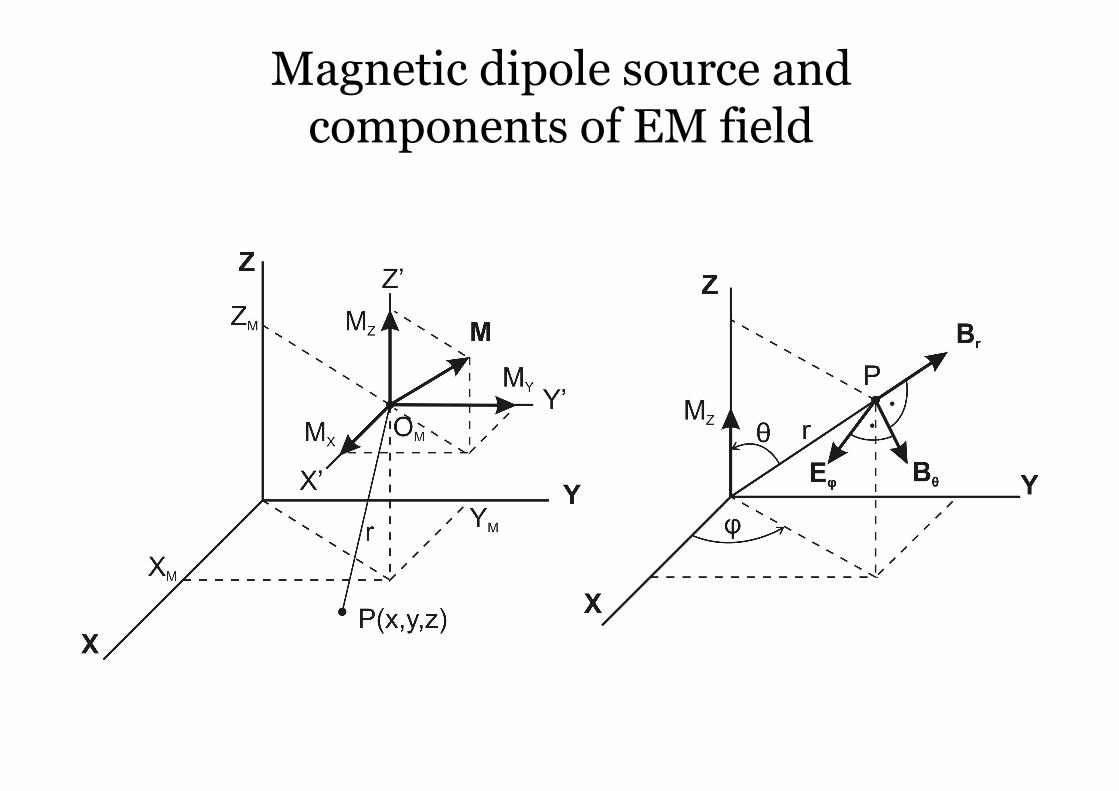
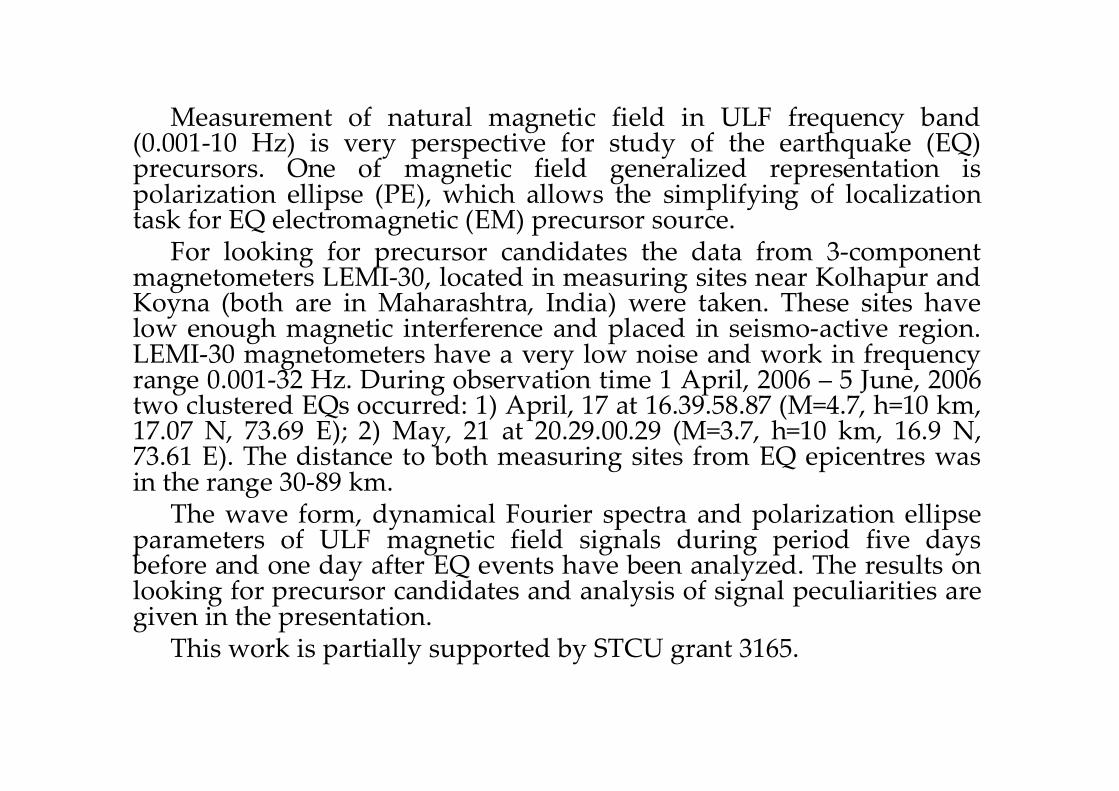
Magnetic dipole source andcomponents of EM field
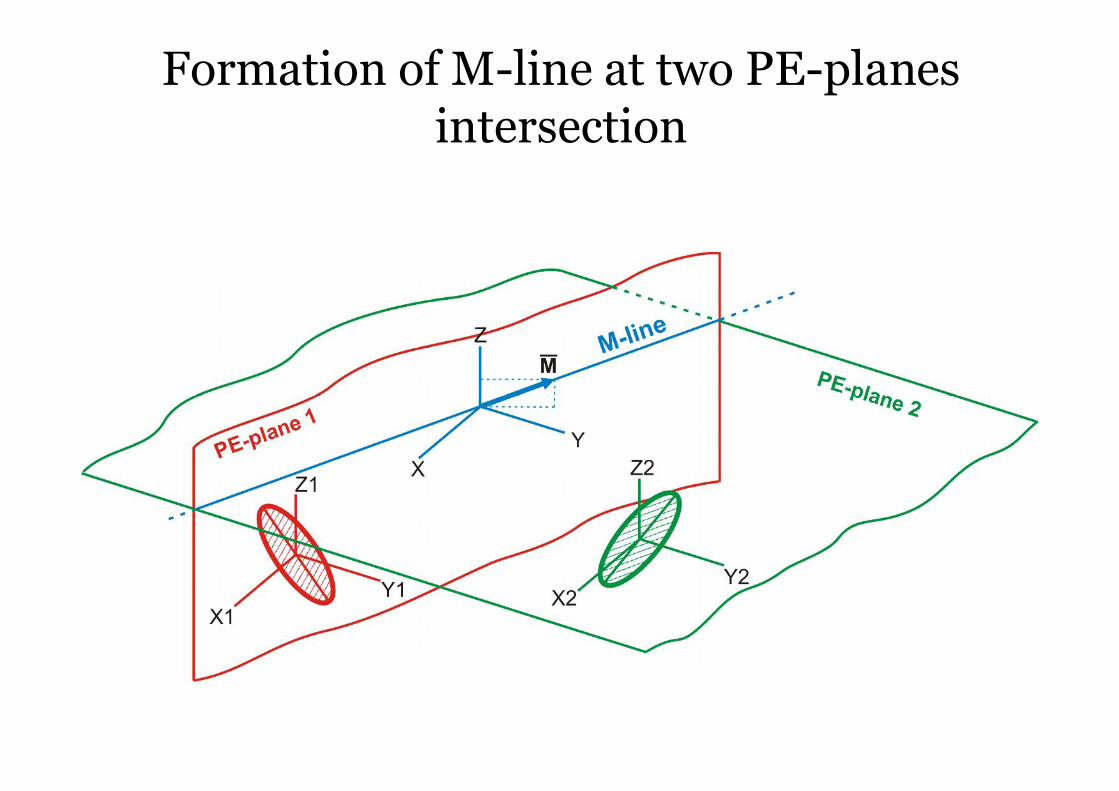
Formation of M-line at two PE-planesintersection
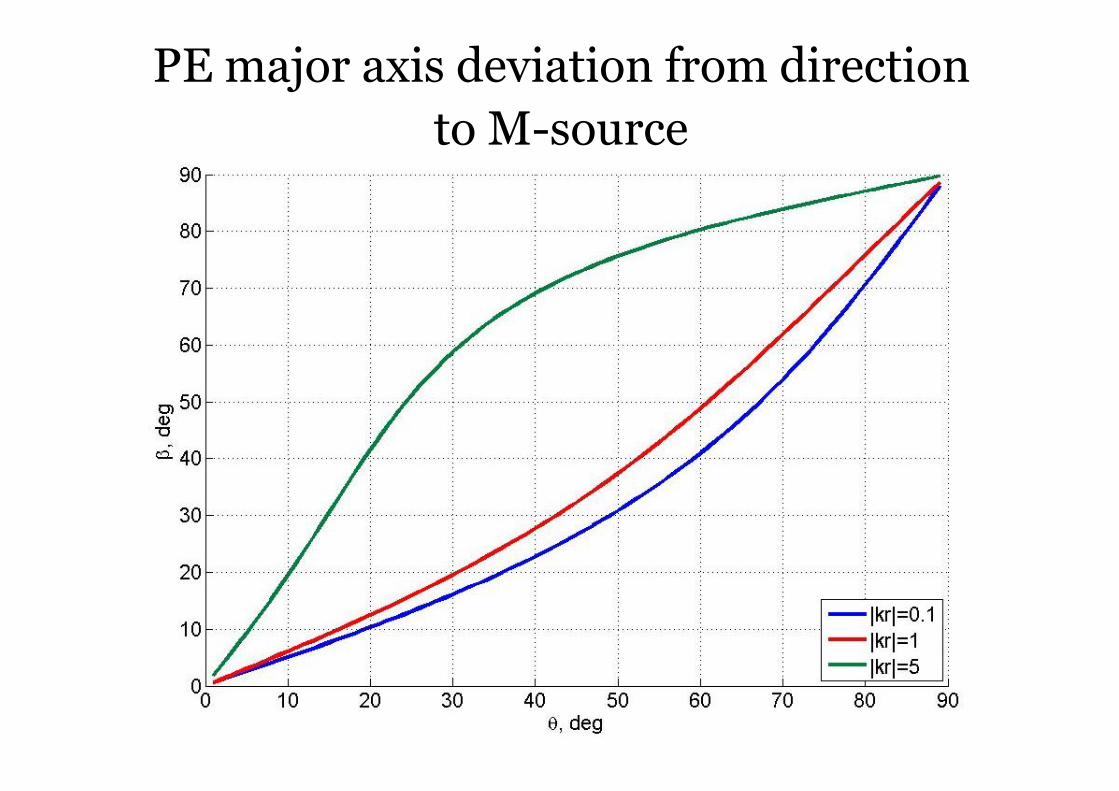
PE major axis deviation from directionto M-source
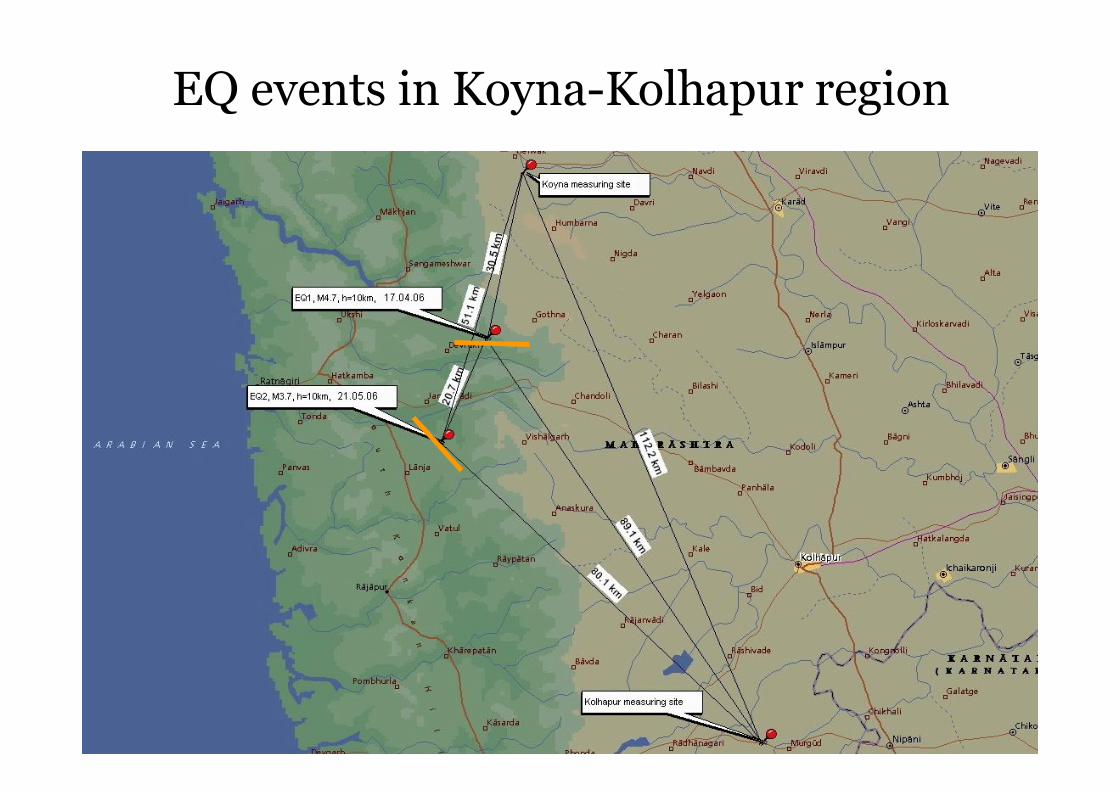
EQ events in Koyna-Kolhapur region
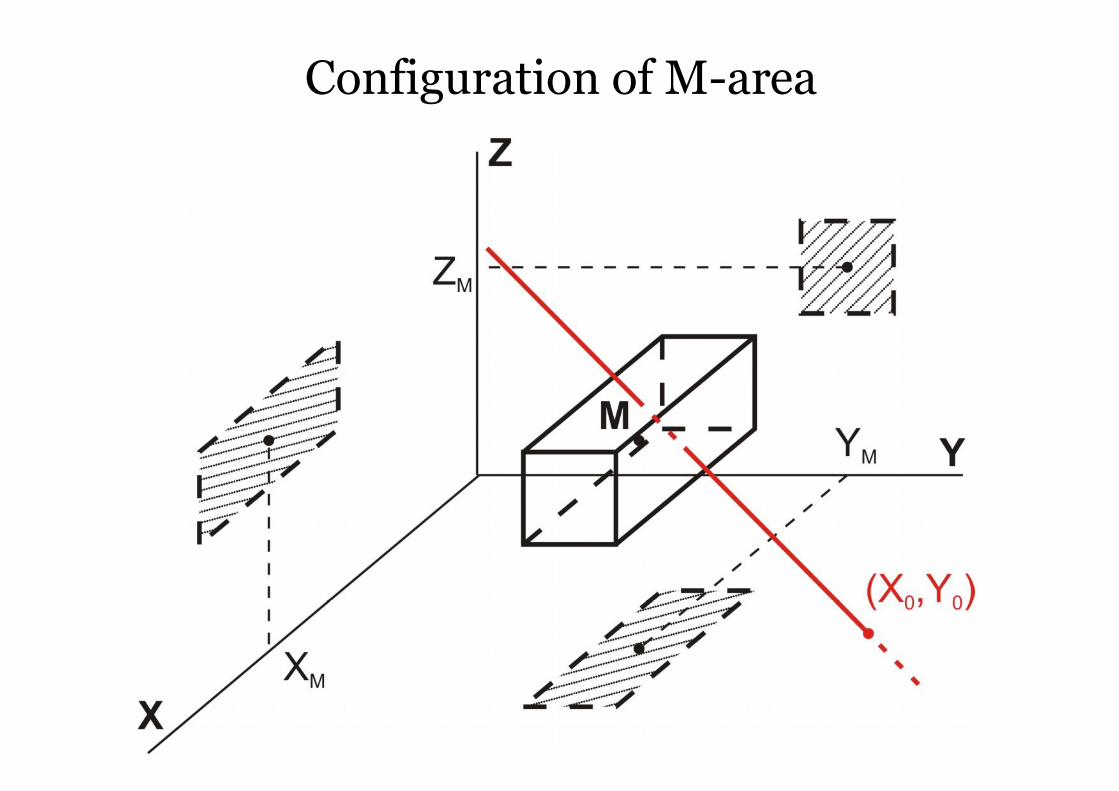
Configuration of M-area
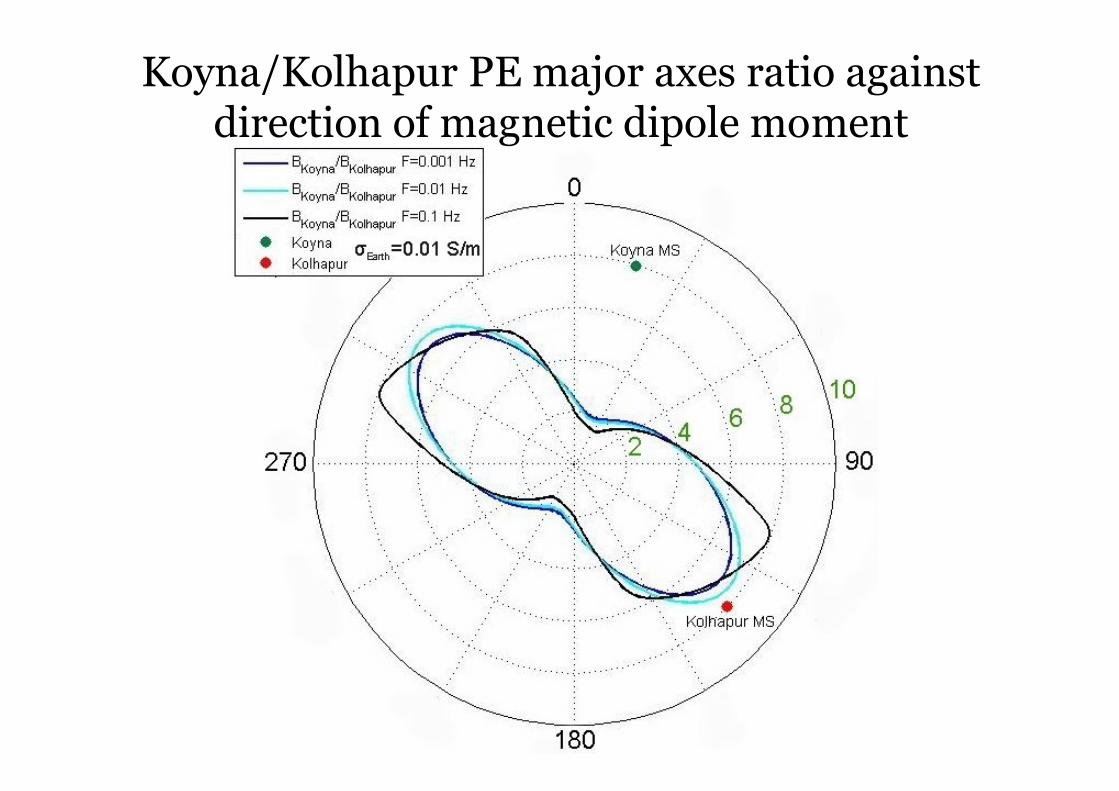
Koyna/Kolhapur PE major axes ratio againstdirection of magnetic dipole moment
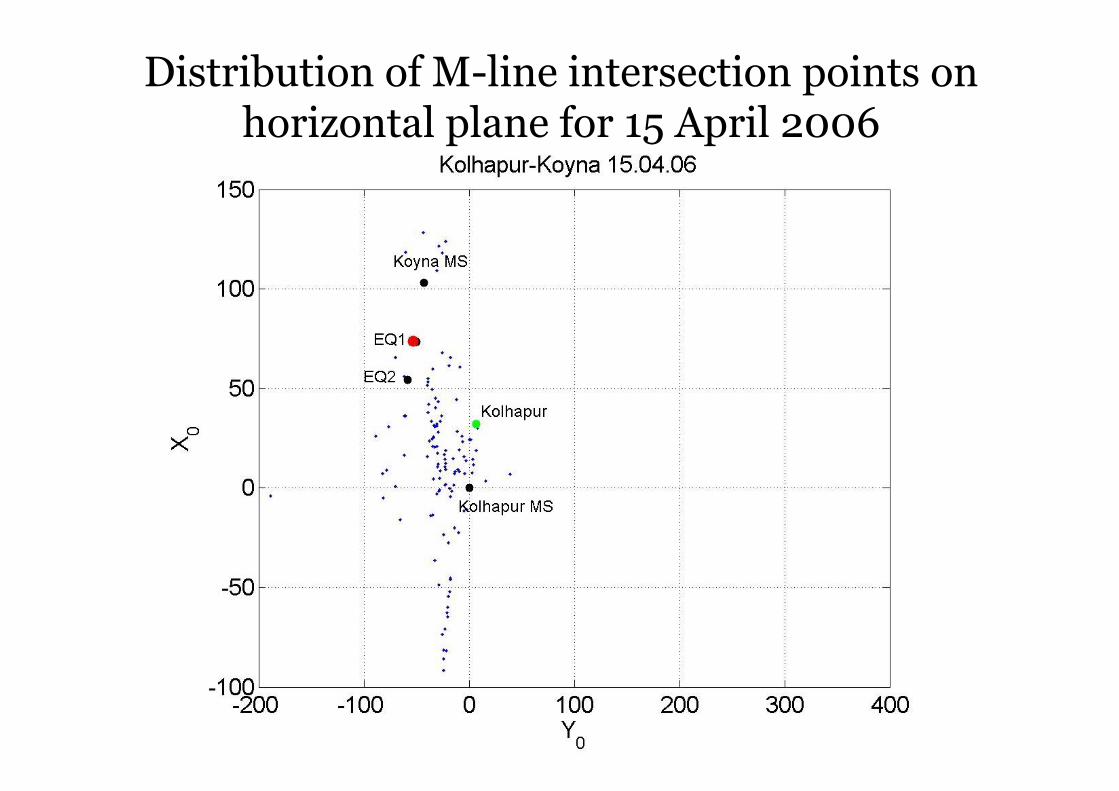
Distribution of M-line intersection points onhorizontal plane for 15 April 2006
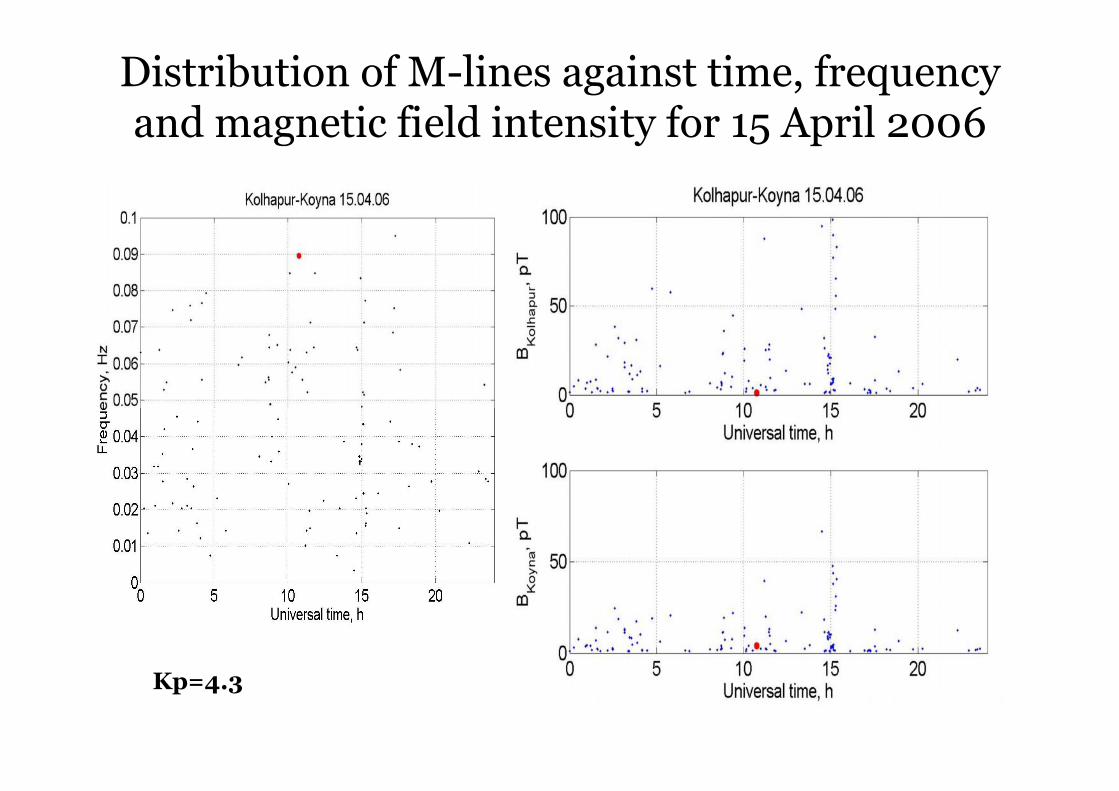
Distribution of M-lines against time, frequencyand magnetic field intensity for 15 April 2006
Kp=4.3
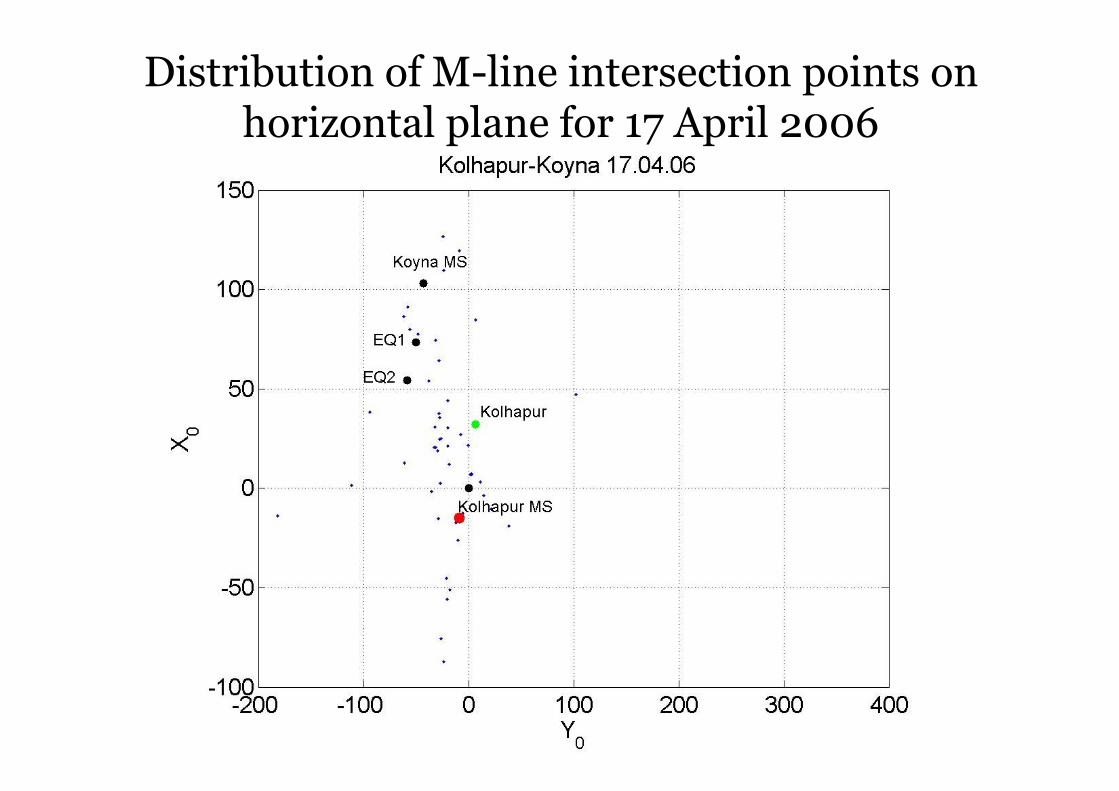
Distribution of M-line intersection points onhorizontal plane for 17 April 2006
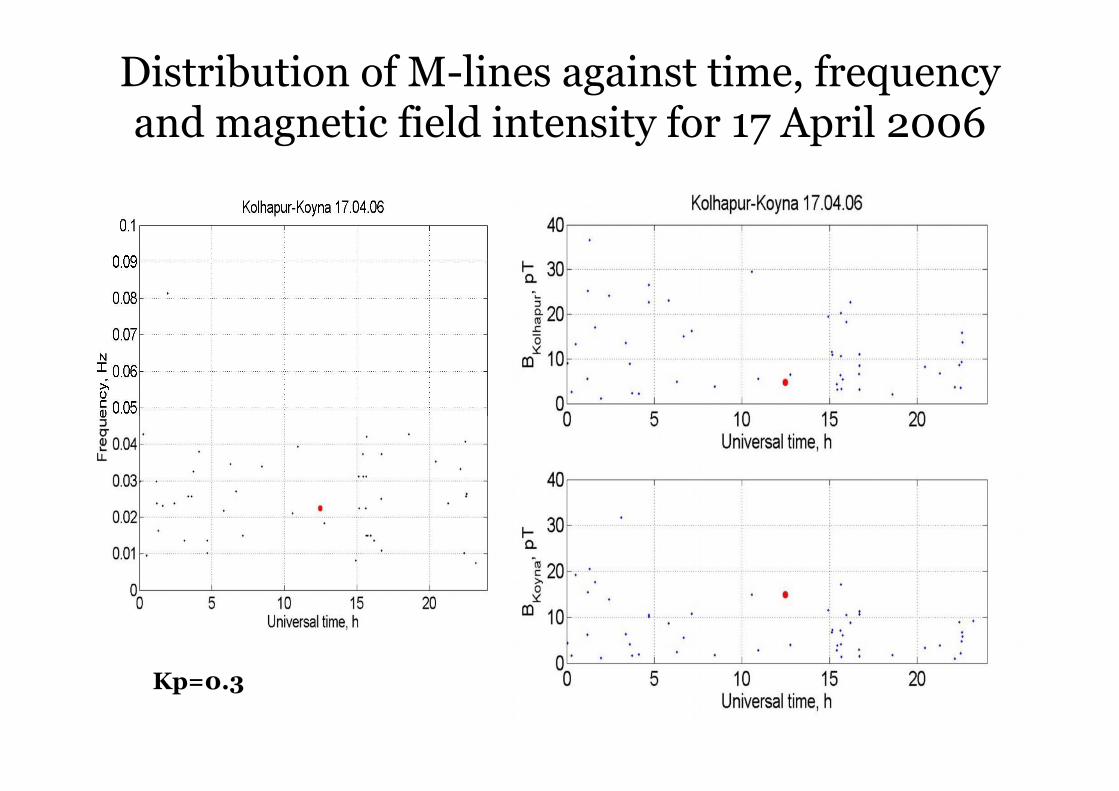
Distribution of M-lines against time, frequencyand magnetic field intensity for 17 April 2006
Kp=0.3
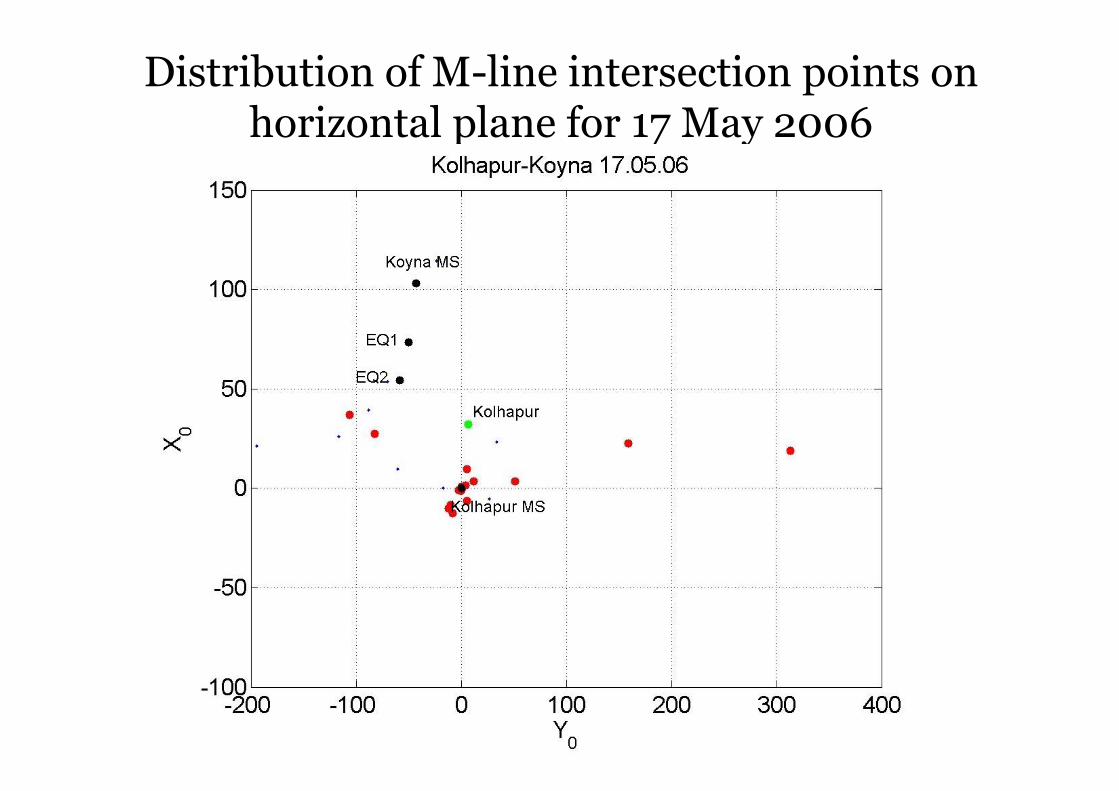
Distribution of M-line intersection points onhorizontal plane for 17 May 2006
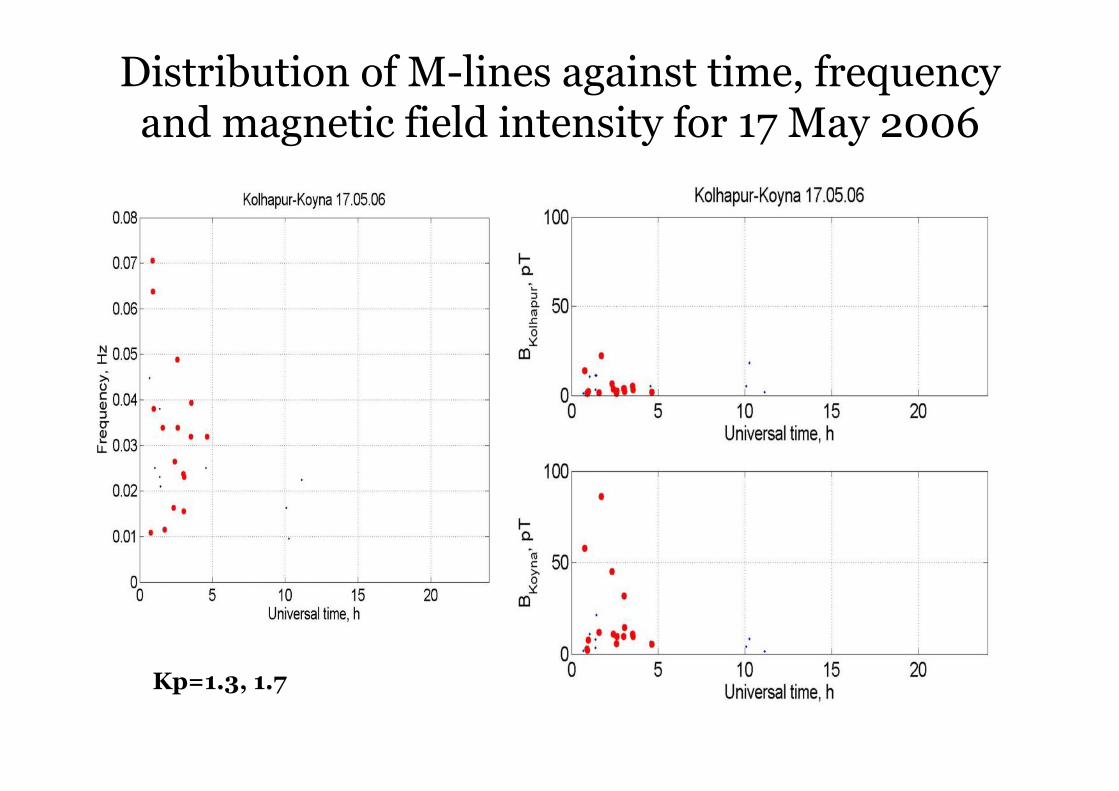
Distribution of M-lines against time, frequencyand magnetic field intensity for 17 May 2006
Kp=1.3, 1.7
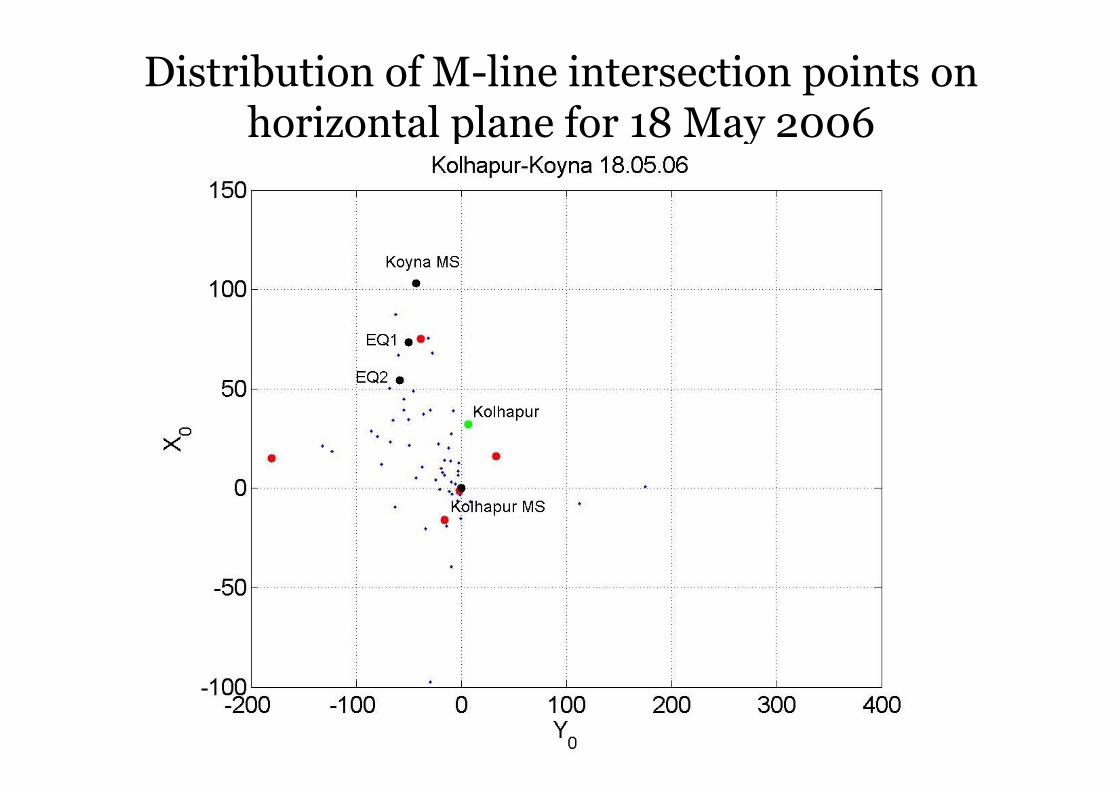
Distribution of M-line intersection points onhorizontal plane for 18 May 2006
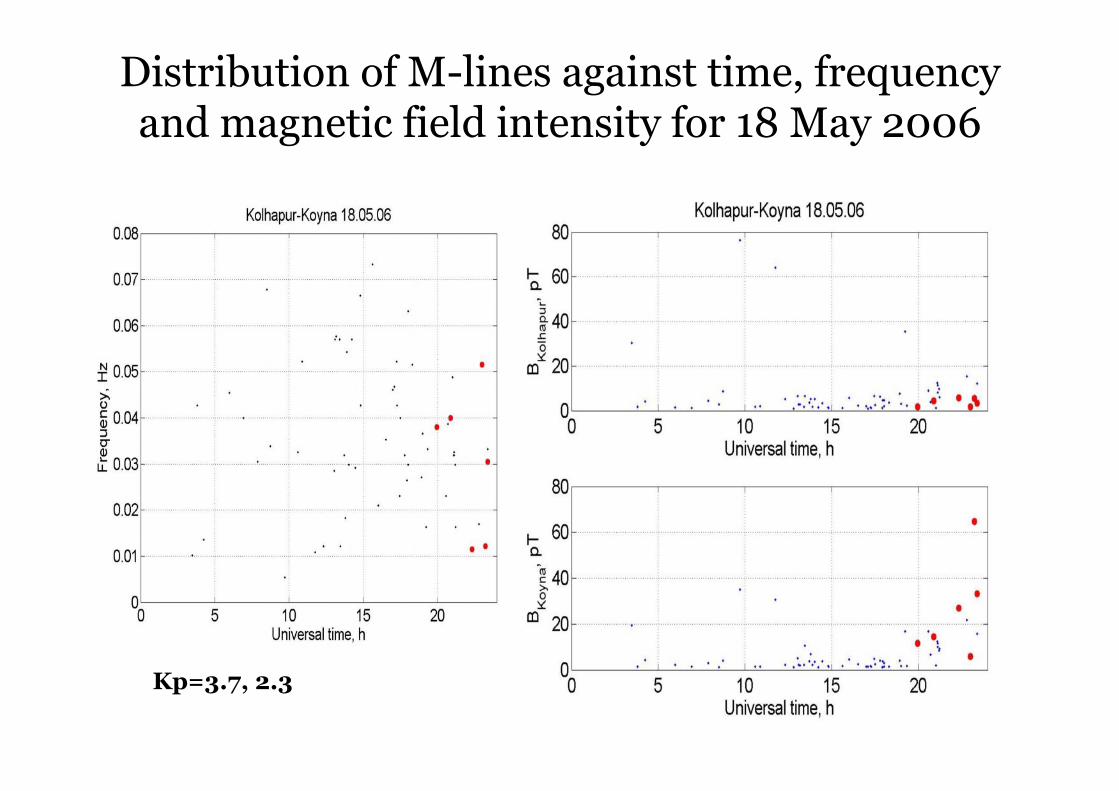
Distribution of M-lines against time, frequencyand magnetic field intensity for 18 May 2006
Kp=3.7, 2.3
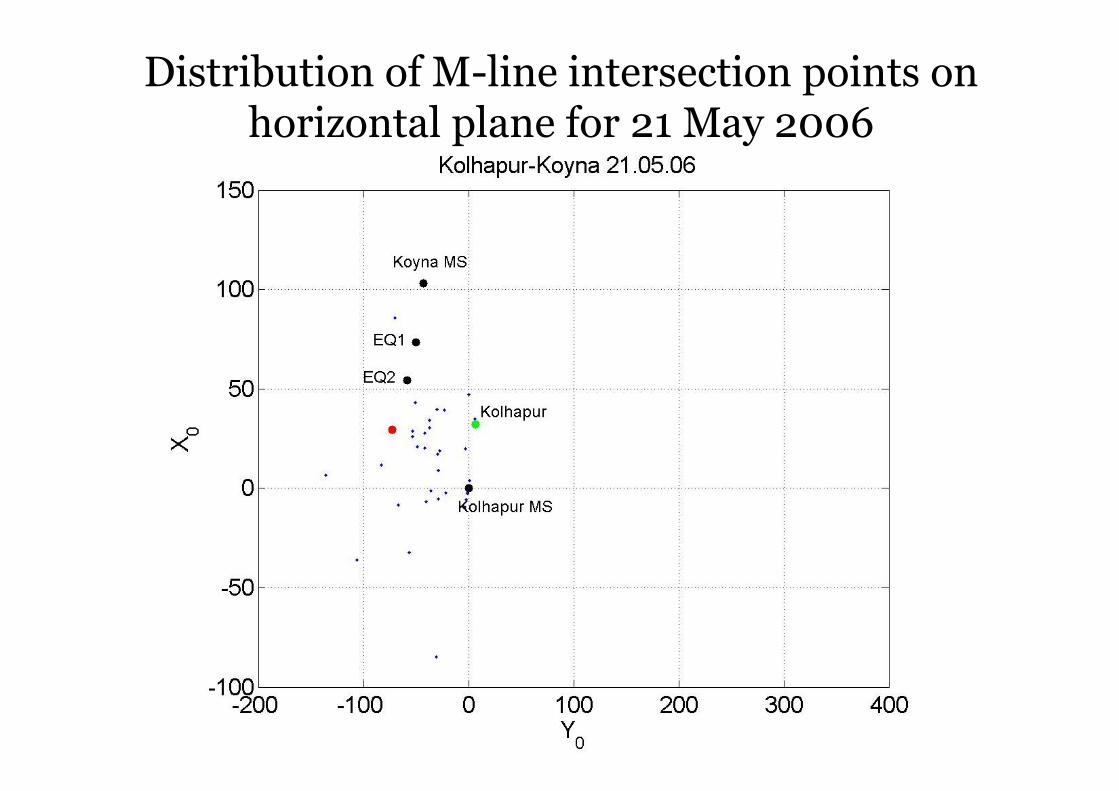
Distribution of M-line intersection points onhorizontal plane for 21 May 2006
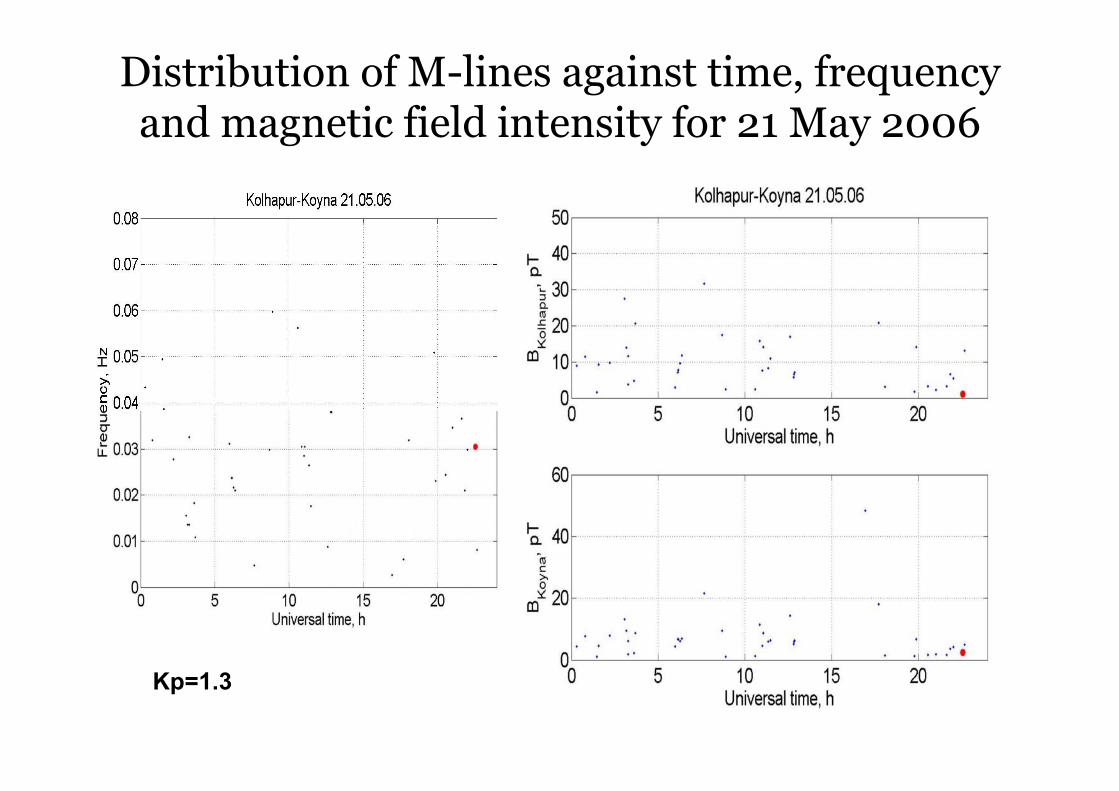
Distribution of M-lines against time, frequencyand magnetic field intensity for 21 May 2006
Kp=1.3
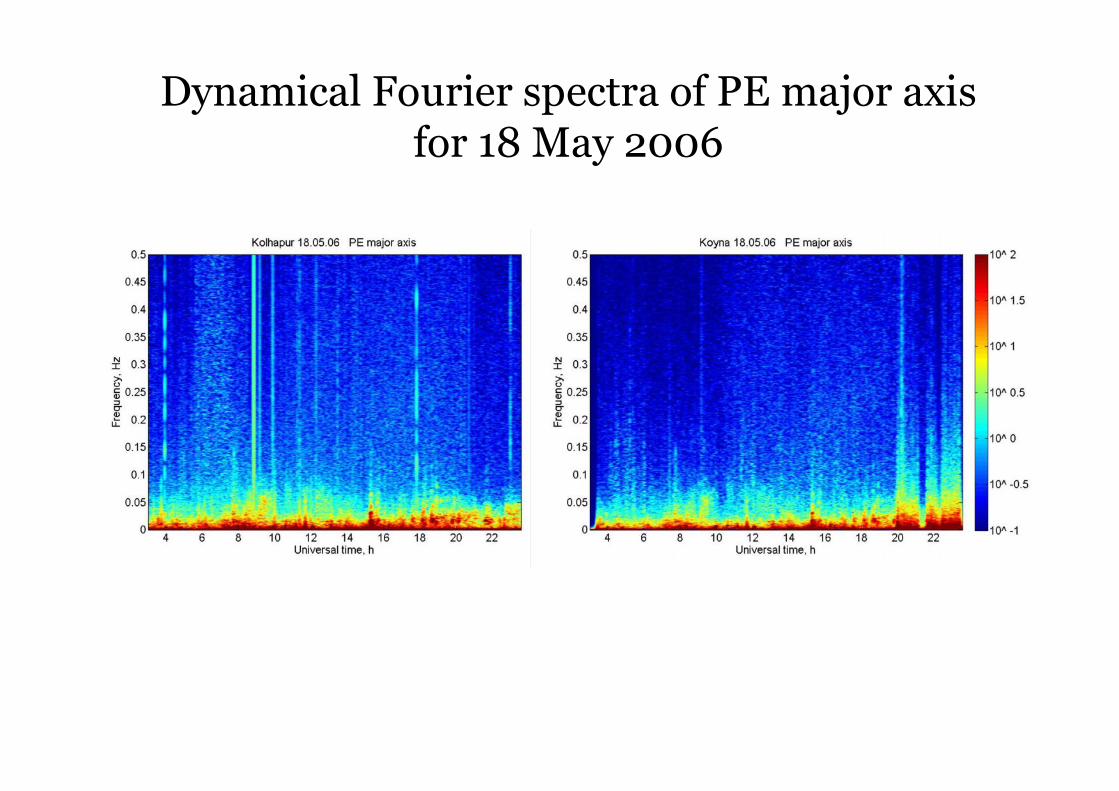
Dynamical Fourier spectra of PE major axisfor 18 May 2006
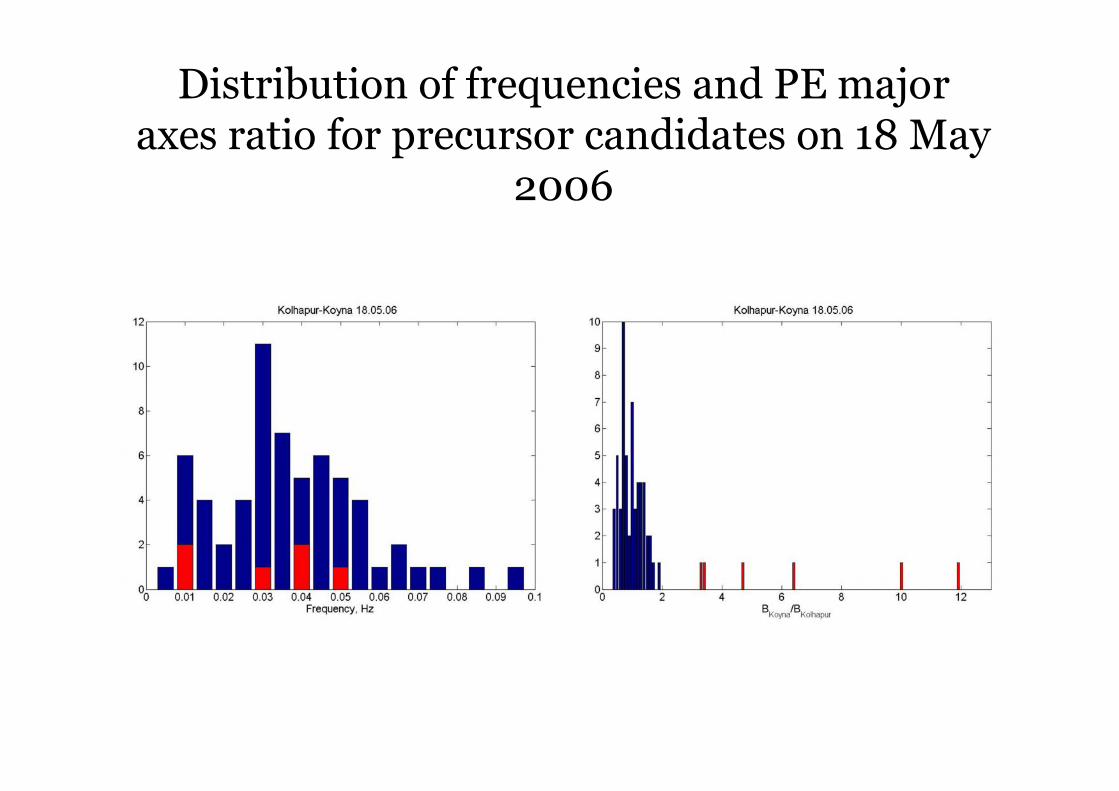
Distribution of frequencies and PE majoraxes ratio for precursor candidates on 18 May
2006
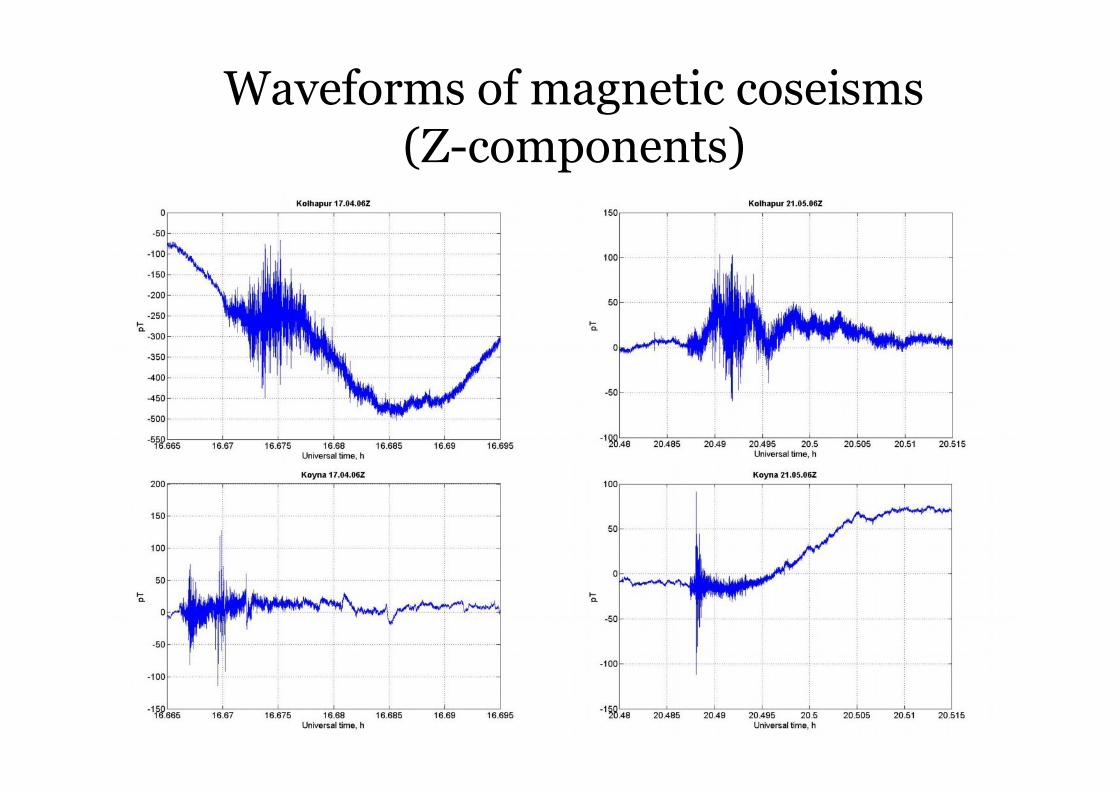
Waveforms of magnetic coseisms(Z-components)
Conclusions• Direction finding method of signal arrival from magnetic
dipole-like source was developed. In many cases it gives apossibility for sources separation of lithospheric andionospheric origin.
• This method was approved on magnetic field data in ULFrange, which were obtained from two spaced measuring siteslocated in seismo-active region Koyna (Maharashtra, India).
• Using this method the ULF magnetic pre-EQ activity beforetwo clustered EQs on 17 April 2006 (M=4.7, h=10 km, 17.07 N,73.69 E, UT 16.39.58.87) and 21 May 2006 (M=3.7, h=10 km, 16.9N, 73.61 E, UT 20.29.00.29 ) was found. Magnetic precursorcandidates are in frequency band 0.01-0.07 Hz and correspondto magnetic moment orientation mainly in N-W – S-E direction.
• The intensity of ULF magnetic precursors for 2nd EQ (M=3.7)exceeds this one for 1st EQ (M=4.7). This fact can be explainedby inequality of fault occurrences before EQs relatively tomagnetic meridian.