Embed Size (px)
Citation preview
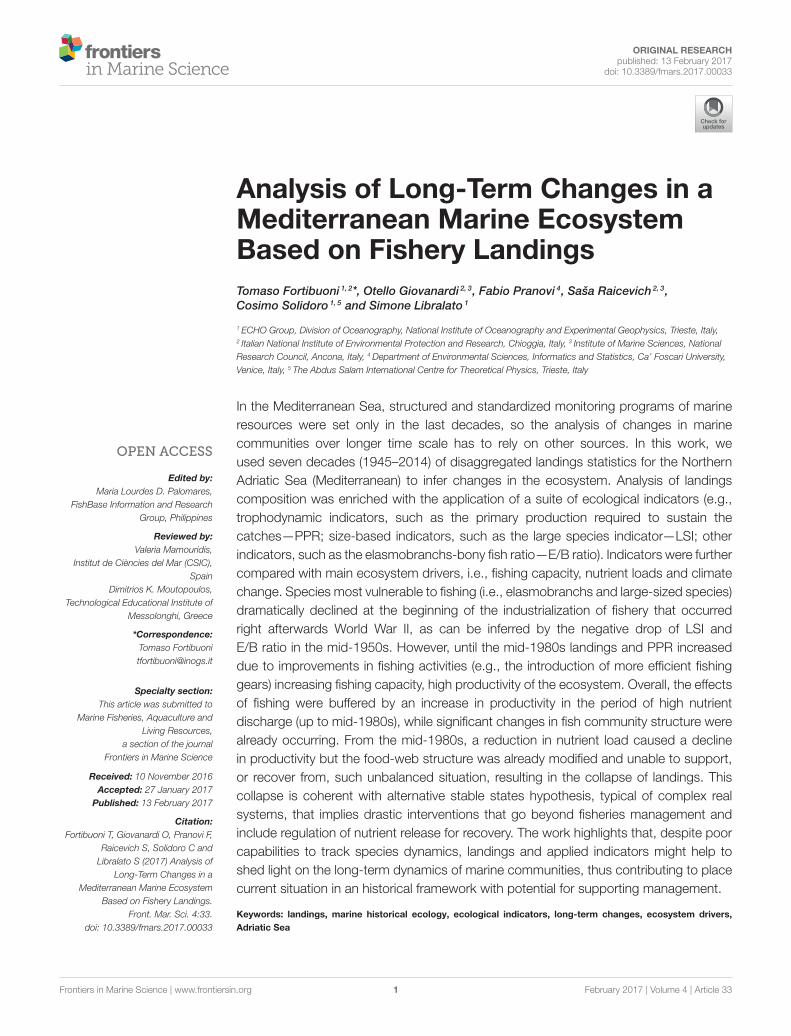
ORIGINAL RESEARCHpublished: 13 February 2017
doi: 10.3389/fmars.2017.00033
Frontiers in Marine Science | www.frontiersin.org 1 February 2017 | Volume 4 | Article 33
Edited by:
Maria Lourdes D. Palomares,
FishBase Information and Research
Group, Philippines
Reviewed by:
Valeria Mamouridis,
Institut de Ciències del Mar (CSIC),
Spain
Dimitrios K. Moutopoulos,
Technological Educational Institute of
Messolonghi, Greece
*Correspondence:
Tomaso Fortibuoni
Specialty section:
This article was submitted to
Marine Fisheries, Aquaculture and
Living Resources,
a section of the journal
Frontiers in Marine Science
Received: 10 November 2016
Accepted: 27 January 2017
Published: 13 February 2017
Citation:
Fortibuoni T, Giovanardi O, Pranovi F,
Raicevich S, Solidoro C and
Libralato S (2017) Analysis of
Long-Term Changes in a
Mediterranean Marine Ecosystem
Based on Fishery Landings.
Front. Mar. Sci. 4:33.
doi: 10.3389/fmars.2017.00033
Analysis of Long-Term Changes in aMediterranean Marine EcosystemBased on Fishery Landings
Tomaso Fortibuoni 1, 2*, Otello Giovanardi 2, 3, Fabio Pranovi 4, Saša Raicevich 2, 3,
Cosimo Solidoro 1, 5 and Simone Libralato 1
1 ECHO Group, Division of Oceanography, National Institute of Oceanography and Experimental Geophysics, Trieste, Italy,2 Italian National Institute of Environmental Protection and Research, Chioggia, Italy, 3 Institute of Marine Sciences, National
Research Council, Ancona, Italy, 4Department of Environmental Sciences, Informatics and Statistics, Ca’ Foscari University,
Venice, Italy, 5 The Abdus Salam International Centre for Theoretical Physics, Trieste, Italy
In the Mediterranean Sea, structured and standardized monitoring programs of marine
resources were set only in the last decades, so the analysis of changes in marine
communities over longer time scale has to rely on other sources. In this work, we
used seven decades (1945–2014) of disaggregated landings statistics for the Northern
Adriatic Sea (Mediterranean) to infer changes in the ecosystem. Analysis of landings
composition was enriched with the application of a suite of ecological indicators (e.g.,
trophodynamic indicators, such as the primary production required to sustain the
catches—PPR; size-based indicators, such as the large species indicator—LSI; other
indicators, such as the elasmobranchs-bony fish ratio—E/B ratio). Indicators were further
compared with main ecosystem drivers, i.e., fishing capacity, nutrient loads and climate
change. Species most vulnerable to fishing (i.e., elasmobranchs and large-sized species)
dramatically declined at the beginning of the industrialization of fishery that occurred
right afterwards World War II, as can be inferred by the negative drop of LSI and
E/B ratio in the mid-1950s. However, until the mid-1980s landings and PPR increased
due to improvements in fishing activities (e.g., the introduction of more efficient fishing
gears) increasing fishing capacity, high productivity of the ecosystem. Overall, the effects
of fishing were buffered by an increase in productivity in the period of high nutrient
discharge (up to mid-1980s), while significant changes in fish community structure were
already occurring. From the mid-1980s, a reduction in nutrient load caused a decline
in productivity but the food-web structure was already modified and unable to support,
or recover from, such unbalanced situation, resulting in the collapse of landings. This
collapse is coherent with alternative stable states hypothesis, typical of complex real
systems, that implies drastic interventions that go beyond fisheries management and
include regulation of nutrient release for recovery. The work highlights that, despite poor
capabilities to track species dynamics, landings and applied indicators might help to
shed light on the long-term dynamics of marine communities, thus contributing to place
current situation in an historical framework with potential for supporting management.
Keywords: landings, marine historical ecology, ecological indicators, long-term changes, ecosystem drivers,
Adriatic Sea
Fortibuoni et al. Long-Term Changes in the Mediterranean
INTRODUCTION
Long-term analyses of the interactions between human societyand the oceans are necessary for understanding the processesthat brought the marine ecosystems as we see today, avoidingthe so-called “shifting the baseline syndrome” and understandingthe magnitude and causes of change (Pauly, 1995; Jackson et al.,2001). In this framework, marine historical ecology (MHE) canbring a significant contribution to present-day management ofmarine ecosystems, both for conservation and for sustainableexploitation of resources (Engelhard et al., 2015). However, oftenthe analyses of historical changes in marine communities cannotbe based on results of structured and standardized monitoringprograms, since in most of the cases those were set in thevery last decades. The need to bridge the gap between requestof knowledge on past status of ecosystems and the availablemonitoring data, triggered the uses of different approachesto extract information from data coming from other sources,including paleontological, archeological, and historical sources,as well as the use of landings (e.g., Rosenberg et al., 2005; Sàenz-Arroyo et al., 2005; Lotze et al., 2006; Fortibuoni et al., 2010, 2016;Van Beveren et al., 2016).
In this context, detailed and disaggregated fishery statisticsrepresent an important source of information that can be usedas proxies to evaluate long-term changes in marine fisheries andcommunities. Changes in the composition of landings, evaluatedthrough opportune weighting metrics (indicators), showed toreflect changes in the structure of underlying fish communitiesdue to anthropogenic impacts and environmental changes (e.g.,Caddy, 1993; Pauly et al., 1998; de Leiva Moreno et al., 2000;Pinnegar et al., 2002; Libralato et al., 2004; Pauly and Watson,2005; Baeta et al., 2009; Munyandorero and Guenter, 2010;Kleisner et al., 2013). Moreover, catch statistics are recognizedto be linked to fishing and environmental pressures and respondselectively to management action (Coll et al., 2016).
Nevertheless, the intrinsic limitations of fishery-dependentdata—such as landings—include the lack of standardization, thedependence from fishing fleet activity features as well as marketpreferences of products that usually change across time andspace. All this imposes caution in deriving marine populationdensities directly from catch statistics (e.g., Essington et al., 2006;Pauly et al., 2013).
The capability to connect modification in landingscomposition to changes in the community at sea is morerobust when local disaggregated landings result from multi-target and multi-gear fisheries (i.e., several distinct métiers),and when changes in fishing activities (e.g., introduction ofnew technologies, shift from one fishing gear to another, shiftin fishing grounds, fishing capacity as number and tonnage ofboats) are traceable. In this context an important aspect to beconsidered is the trend in indices over time, rather than theabsolute values they assume, being reference points or limitvalues for many indicators not yet been established (Shin et al.,2010).
The Northern Adriatic Sea (Mediterranean Sea) representsa valuable case study for MHE, due to the long historyof exploitation (Botter et al., 2006; Fortibuoni, 2010),
human-induced changes (Lotze et al., 2011), as well asdocumented long-term modifications of the physical andchemical oceanographic characteristics of the basin dueto anthropogenic impact (Mozetic et al., 2009; Solidoroet al., 2009) and temperature change (Russo et al.,2002).
In this study, a long-term time-series (1945–2014) of landingsdisaggregated by species (Mazzoldi et al., 2014) for the NorthernAdriatic Sea was analyzed to detect changes in total yields andvariations in landings composition by functional groups overtime. A suite of ecological indicators was applied to landings datato integrate responses to multiple stressors (Fu et al., 2015; Collet al., 2016). They include trophodynamic indicators (e.g., meantrophic level, primary production required), climatic indicators(mean temperature of the catch), and other indicators, such aselasmobranchs-bony fish ratio. These indicators were comparedwith independent data describing main ecosystem drivers, inorder to corroborate findings.
Our analysis falls within the general need of takinginto account ecological processes when considering long-term changes in fishery resources where fishery-independentdata are lacking, by testing several ecological indicators, andtheir responsiveness to fishery and environmental drivers. Theapproach is suitable to be applied for the purposes of theEcosystem Approach to Fishery Management (EAFM) andcontributes to establishing historical baselines to be used tocompare current and future ecosystem status, for instance inthe context of the Marine Strategy Framework Directive (MSFD)implementation.
MATERIALS AND METHODS
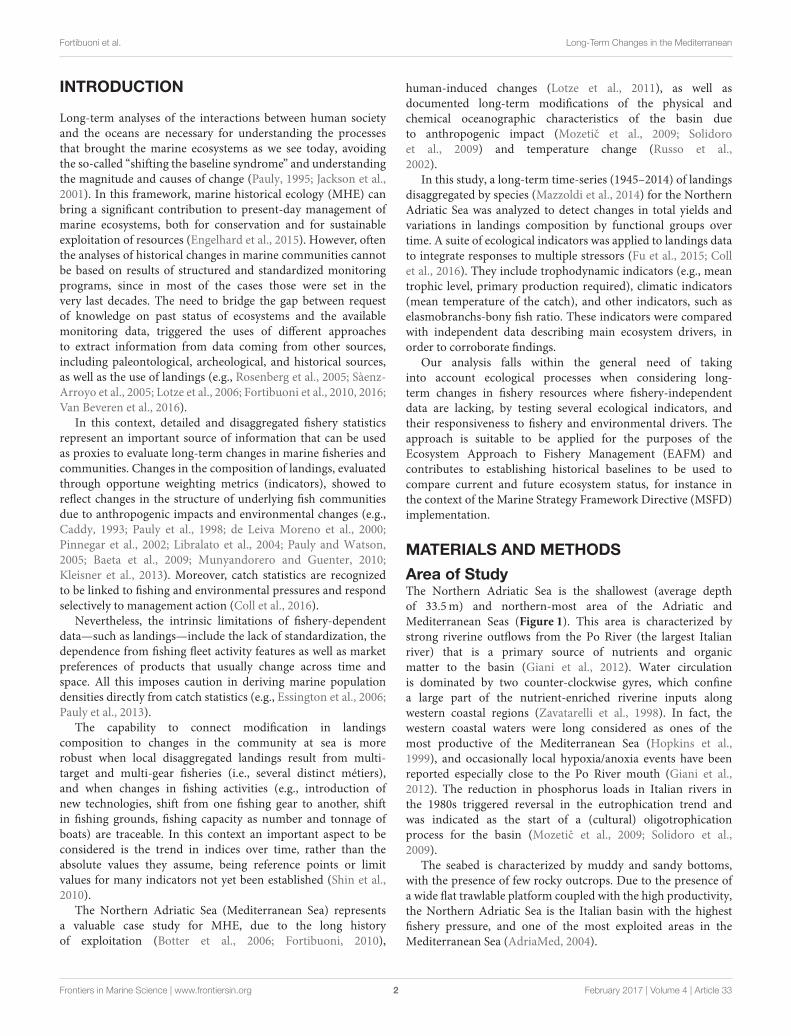
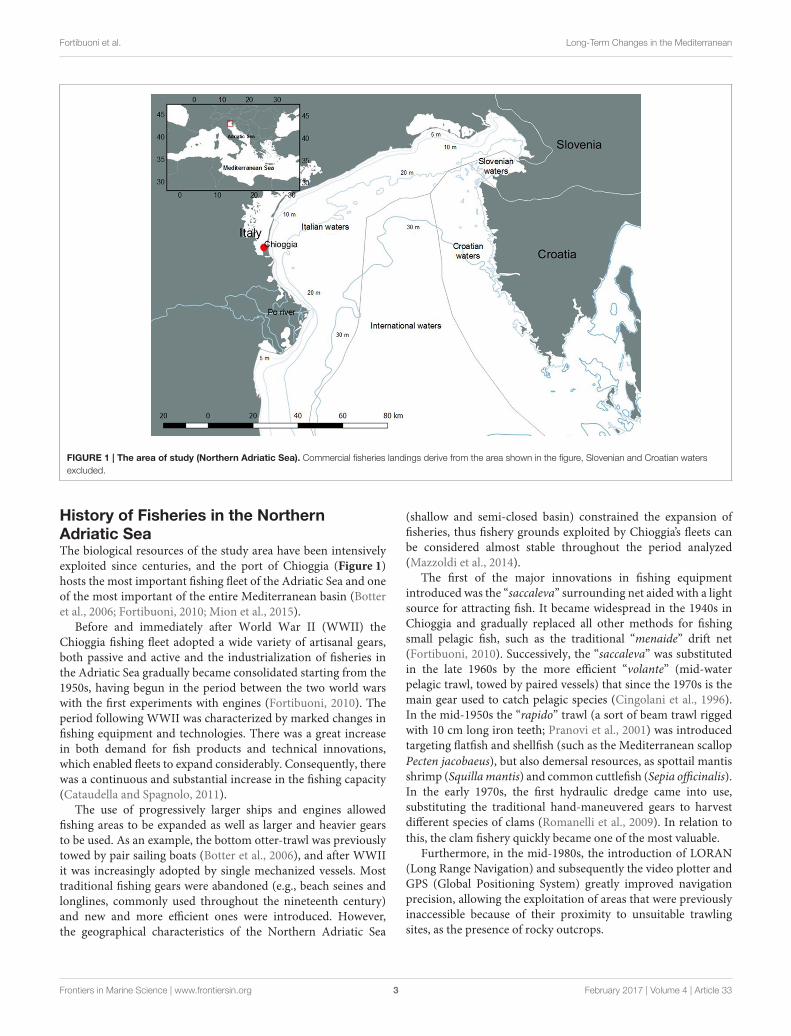
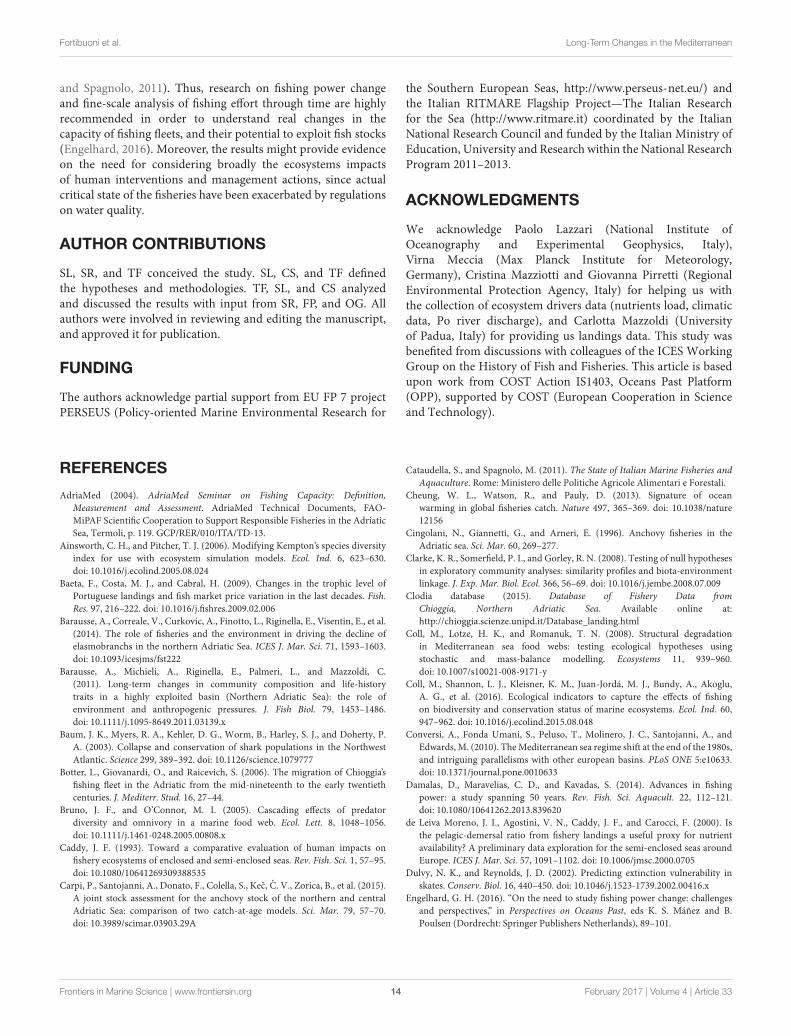
Area of StudyThe Northern Adriatic Sea is the shallowest (average depthof 33.5m) and northern-most area of the Adriatic andMediterranean Seas (Figure 1). This area is characterized bystrong riverine outflows from the Po River (the largest Italianriver) that is a primary source of nutrients and organicmatter to the basin (Giani et al., 2012). Water circulationis dominated by two counter-clockwise gyres, which confinea large part of the nutrient-enriched riverine inputs alongwestern coastal regions (Zavatarelli et al., 1998). In fact, thewestern coastal waters were long considered as ones of themost productive of the Mediterranean Sea (Hopkins et al.,1999), and occasionally local hypoxia/anoxia events have beenreported especially close to the Po River mouth (Giani et al.,2012). The reduction in phosphorus loads in Italian rivers inthe 1980s triggered reversal in the eutrophication trend andwas indicated as the start of a (cultural) oligotrophicationprocess for the basin (Mozetic et al., 2009; Solidoro et al.,2009).
The seabed is characterized by muddy and sandy bottoms,with the presence of few rocky outcrops. Due to the presence ofa wide flat trawlable platform coupled with the high productivity,the Northern Adriatic Sea is the Italian basin with the highestfishery pressure, and one of the most exploited areas in theMediterranean Sea (AdriaMed, 2004).
Frontiers in Marine Science | www.frontiersin.org 2 February 2017 | Volume 4 | Article 33
Fortibuoni et al. Long-Term Changes in the Mediterranean
FIGURE 1 | The area of study (Northern Adriatic Sea). Commercial fisheries landings derive from the area shown in the figure, Slovenian and Croatian waters
excluded.
History of Fisheries in the NorthernAdriatic SeaThe biological resources of the study area have been intensivelyexploited since centuries, and the port of Chioggia (Figure 1)hosts the most important fishing fleet of the Adriatic Sea and oneof the most important of the entire Mediterranean basin (Botteret al., 2006; Fortibuoni, 2010; Mion et al., 2015).
Before and immediately after World War II (WWII) theChioggia fishing fleet adopted a wide variety of artisanal gears,both passive and active and the industrialization of fisheries inthe Adriatic Sea gradually became consolidated starting from the1950s, having begun in the period between the two world warswith the first experiments with engines (Fortibuoni, 2010). Theperiod following WWII was characterized by marked changes infishing equipment and technologies. There was a great increasein both demand for fish products and technical innovations,which enabled fleets to expand considerably. Consequently, therewas a continuous and substantial increase in the fishing capacity(Cataudella and Spagnolo, 2011).
The use of progressively larger ships and engines allowedfishing areas to be expanded as well as larger and heavier gearsto be used. As an example, the bottom otter-trawl was previouslytowed by pair sailing boats (Botter et al., 2006), and after WWIIit was increasingly adopted by single mechanized vessels. Mosttraditional fishing gears were abandoned (e.g., beach seines andlonglines, commonly used throughout the nineteenth century)and new and more efficient ones were introduced. However,the geographical characteristics of the Northern Adriatic Sea
(shallow and semi-closed basin) constrained the expansion offisheries, thus fishery grounds exploited by Chioggia’s fleets canbe considered almost stable throughout the period analyzed(Mazzoldi et al., 2014).
The first of the major innovations in fishing equipmentintroduced was the “saccaleva” surrounding net aided with a lightsource for attracting fish. It became widespread in the 1940s inChioggia and gradually replaced all other methods for fishingsmall pelagic fish, such as the traditional “menaide” drift net(Fortibuoni, 2010). Successively, the “saccaleva” was substitutedin the late 1960s by the more efficient “volante” (mid-waterpelagic trawl, towed by paired vessels) that since the 1970s is themain gear used to catch pelagic species (Cingolani et al., 1996).In the mid-1950s the “rapido” trawl (a sort of beam trawl riggedwith 10 cm long iron teeth; Pranovi et al., 2001) was introducedtargeting flatfish and shellfish (such as the Mediterranean scallop
Pecten jacobaeus), but also demersal resources, as spottail mantisshrimp (Squilla mantis) and common cuttlefish (Sepia officinalis).In the early 1970s, the first hydraulic dredge came into use,substituting the traditional hand-maneuvered gears to harvestdifferent species of clams (Romanelli et al., 2009). In relation to
this, the clam fishery quickly became one of the most valuable.Furthermore, in the mid-1980s, the introduction of LORAN
(Long Range Navigation) and subsequently the video plotter andGPS (Global Positioning System) greatly improved navigationprecision, allowing the exploitation of areas that were previouslyinaccessible because of their proximity to unsuitable trawlingsites, as the presence of rocky outcrops.
Frontiers in Marine Science | www.frontiersin.org 3 February 2017 | Volume 4 | Article 33
Fortibuoni et al. Long-Term Changes in the Mediterranean
As regard fisheries management, a comprehensive scheme inItaly was initiated with the Law 41/1982, establishing that allprofessional fishing vessels had to possess a license reportingthe characteristics of the vessel (e.g., GT), limitations of fishingareas, gear use and spatial licensing (Piroddi et al., 2015).The Italian fisheries management system is actually basedon fishing effort/capacity regulation systems, and technicalmeasures. No quotas or TACs (total allowable catch) havebeen established, except for Atlantic bluefin tuna (Thunnusthynnus) and Striped venus clam (Chamelea gallina). From 1983,the national fishing fleet was subject to reduction constraintsin relation to two reference parameters, fleet tonnage andengine power. A further incentive toward fleet capacity/effortreduction was provided by European Structural Funds thatfinanced the voluntary removal of vessels. Moreover, in recentyears there has been a voluntary departure from the sectordue to the general old age of the fishing fleet and thefisheries crisis (Cataudella and Spagnolo, 2011). However,as regards the Chioggia’s fishing fleet, fishing capacity (i.e.,total GT) has increased until recent years (Barausse et al.,2011).
DataLandings DatasetOfficial landings data (1945–2014) from the Chioggia’swholesale fish-market were retrieved from the Clodiadatabase (Clodia database, 2015). Landings of a wide varietyof benthic and pelagic species represent the aggregatedcommercialized quantities caught by the highly diversifiedfishing gears employed by fishermen of Chioggia. Datado not include any estimate of the discard, and landingsdisaggregated by gear are not available. Landings referonly to fish and seafood caught by local fishermen fromthe Chioggia’s fleet that operates in the Adriatic Sea. Thedatabase was validated by Mazzoldi et al. (2014) to showthat landings composition provides reliable indication of fishabundance.
Information on the habitat (pelagic/demersal) and maximumlength (Lmax) for each species were taken from FishBase (Froeseand Pauly, 2016). Moreover, the thermal preference (mediantemperature preference, T) was assigned according to Cheunget al. (2013). The trophic level of species (TL), specific forthe Northern Adriatic Sea, was obtained from Fortibuoni et al.(2013), from other literature and estimates (e.g., Stergiou andKarpouzi, 2002) or retrieved from FishBase in the case of fish,and SeaLifeBase (Palomares and Pauly, 2016) in the case ofinvertebrates.
Ecosystem Drivers: Fishing Capacity, Nutrient Loads,
and Climate ChangeData on Chioggia’s fishing fleet capacity in terms of grossregistered tonnage (GRT) were gathered from ISTAT (ItalianNational Institute of Statistics) for the period 1951–1989 andin terms of gross tonnage (GT) from the Community FleetRegister for the period 1990–2014. Total fishing capacity wasexpressed as GT for the entire time-series and used as a proxyfor fishing pressure in the analyses because no long-term records
of fishing effort were available. It was also not possible toinclude in fishing pressure any estimate of the technologicalcreep due to the lack of data (e.g., CPUE from scientific surveys;Engelhard, 2016).
The monthly discharge of the Po river (m3/s), measured atPontelagoscuro (Ferrara, Italy) for the period 1945–2014 wasprovided by the Regional Environmental Protection Agency ofEmilia Romagna and used to calculate monthly mean annualdischarge. Nutrient yearly discharge, in terms of annual inputof nitrogen (NO3) and phosphorus (PO4) load (t/y) from thePo river, was obtained from Ludwig et al. (2009) for the period1960–2000, and from EU FP7 PERSEUS project for the period2001–2014.
The winter (December-March) station based index ofthe North Atlantic Oscillation index (Hurrell and NationalCenter for Atmospheric Research Staff, 2016) was used torepresent the large-scale climatic variability in the area inthe period 1945–2014. The NAO is based on the differenceof normalized sea level pressure between Lisbon (Portugal)and Stykkisholmur/Reykjavik (Iceland). Positive values of theNAO index are typically associated with stronger-than-averagewesterlies over the middle latitudes and wetter/milder weatherover western Europe.
Finally, monthly data on sea surface temperature (SST)were downloaded from the International ComprehensiveOcean–Atmosphere Data Set (ICOADS). SST data at 13◦E–45◦N, 15◦E–45◦N, 13◦E–43◦N, and 15◦E–43◦N for theperiod 1957–2014 were used to compute the annual meanvalues.
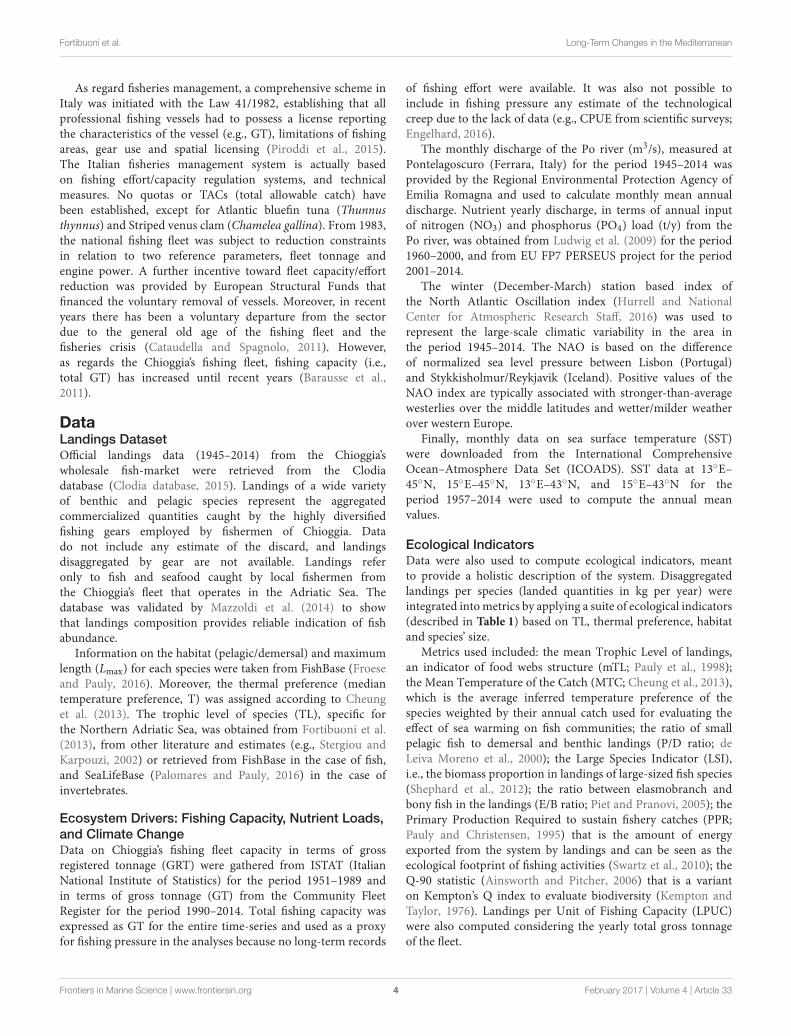
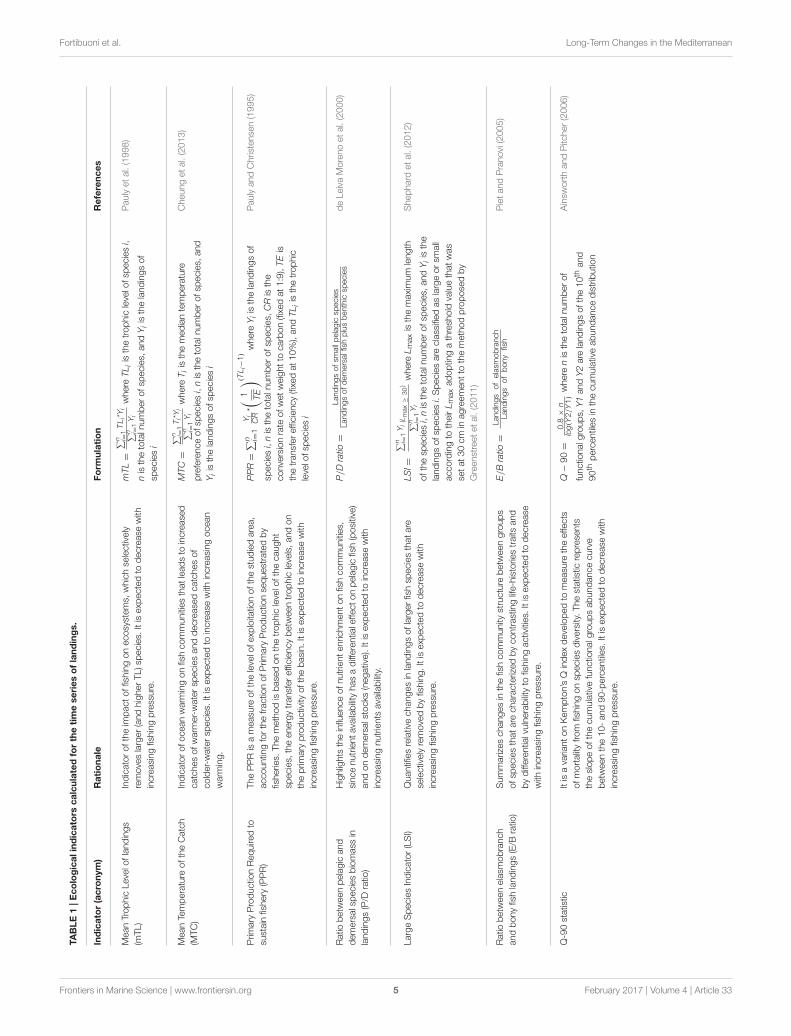
Ecological IndicatorsData were also used to compute ecological indicators, meantto provide a holistic description of the system. Disaggregatedlandings per species (landed quantities in kg per year) wereintegrated intometrics by applying a suite of ecological indicators(described in Table 1) based on TL, thermal preference, habitatand species’ size.
Metrics used included: the mean Trophic Level of landings,an indicator of food webs structure (mTL; Pauly et al., 1998);the Mean Temperature of the Catch (MTC; Cheung et al., 2013),which is the average inferred temperature preference of thespecies weighted by their annual catch used for evaluating theeffect of sea warming on fish communities; the ratio of smallpelagic fish to demersal and benthic landings (P/D ratio; deLeiva Moreno et al., 2000); the Large Species Indicator (LSI),i.e., the biomass proportion in landings of large-sized fish species(Shephard et al., 2012); the ratio between elasmobranch andbony fish in the landings (E/B ratio; Piet and Pranovi, 2005); thePrimary Production Required to sustain fishery catches (PPR;Pauly and Christensen, 1995) that is the amount of energyexported from the system by landings and can be seen as theecological footprint of fishing activities (Swartz et al., 2010); theQ-90 statistic (Ainsworth and Pitcher, 2006) that is a varianton Kempton’s Q index to evaluate biodiversity (Kempton andTaylor, 1976). Landings per Unit of Fishing Capacity (LPUC)were also computed considering the yearly total gross tonnageof the fleet.
Frontiers in Marine Science | www.frontiersin.org 4 February 2017 | Volume 4 | Article 33
Fortibuoni et al. Long-Term Changes in the Mediterranean
TABLE1|Ecologicalindicators
calculatedforthetimeseriesoflandings.
Indicator(acronym)
Rationale
Form
ulation
References
MeanTrophicLevelo
flandings
(mTL)
Indicatoroftheim
pactoffishingonecosystems,
whichse
lectively
removeslarger(andhigherTL)sp
ecies.
Itisexp
ectedto
decrease
with
increasingfishingpressure.
mTL=
∑
n i=1TLi*Yi
∑
n i=1Yi
whereTLiisthetrophiclevelo
fsp
eciesi,
nisthetotaln
umberofsp
ecies,
andYiisthelandingsof
speciesi
Paulyetal.(1998)
MeanTemperature
oftheCatch
(MTC)
Indicatorofoceanwarm
ingonfishcommunitiesthatleadsto
increase
d
catchesofwarm
er-watersp
eciesanddecrease
dcatchesof
colder-watersp
ecies.
Itisexp
ectedto
increase
with
increasingocean
warm
ing.
MTC=
∑
n i=1Ti*Yi
∑
n i=1Yi
whereTiisthemediantemperature
preferenceofsp
eciesi,nisthetotaln
umberofsp
ecies,
and
Yiisthelandingsofsp
eciesi
Cheungetal.(2013)
Prim
ary
Productio
nRequire
dto
sustain
fishery
(PPR)
ThePPRisameasu
reofthelevelo
fexp
loitatio
nofthestudiedarea,
accountin
gforthefractio
nofPrim
ary
Productio
nse
questratedby
fisherie
s.Themethodisbase
donthetrophiclevelo
fthecaught
species,
theenergytransferefficiencybetw
eentrophiclevels,andon
theprim
ary
productivity
ofthebasin.Itisexp
ectedto
increase
with
increasingfishingpressure.
PPR=
∑
n i=1
Yi
CR*(
1 TE
)
(TLi−
1)
whereYiisthelandingsof
speciesi,nisthetotaln
umberofsp
ecies,CRisthe
conversionrate
ofwetweightto
carbon(fixe
dat1:9),TEis
thetransferefficiency(fixe
dat10%),andTLiisthetrophic
levelo
fsp
eciesi
PaulyandChristense
n(1995)
Ratio
betw
eenpelagicand
demersalspeciesbiomass
in
landings(P/D
ratio
)
Highlights
theinfluenceofnutrientenric
hmentonfishcommunities,
sincenutrientavailability
hasadifferentialeffectonpelagicfish(positive)
andondemersalstocks
(negative).Itisexp
ectedto
increase
with
increasingnutrients
availability.
P/Dratio=
Landingsofsm
allpelagic
species
Landingsofdemersalfishplusbenthic
species
deLeivaMorenoetal.(2000)
LargeSpeciesIndicator(LSI)
Quantifiesrelativechangesin
landingsoflargerfishsp
eciesthatare
selectivelyremovedbyfishing.Itisexp
ectedto
decrease
with
increasingfishingpressure.
LSI=
∑
n i=1Yi(Lmax≥
30)
∑
n i=1Yi
whereLmaxisthemaximum
length
ofthesp
eciesi,nisthetotaln
umberofsp
ecies,
andYiisthe
landingsofsp
eciesi.Speciesare
classifiedaslargeorsm
all
accordingto
theirLmaxadoptin
gathresh
old
valuethatwas
setat30cm
inagreementto
themethodpropose
dby
Greenstreetetal.(2011)
Shephard
etal.(2012)
Ratio
betw
eenelasm
obranch
andbonyfishlandings(E/B
ratio
)
Summarizeschangesin
thefishcommunity
structure
betw
eengroups
ofsp
eciesthatare
characterizedbycontrastinglife-historie
straits
and
bydifferentialvulnerability
tofishingactivities.
Itisexp
ectedto
decrease
with
increasingfishingpressure.
E/Bratio=
Landings
ofelasm
obranch
Landings
ofbony
fish
PietandPranovi(2005)
Q-90statistic
Itisavaria
ntonKempton’sQ
indexdevelopedto
measu
retheeffects
ofmortalityfrom
fishingonsp
eciesdiversity.Thestatistic
represe
nts
theslopeofthecumulativefunctio
nalg
roupsabundancecurve
betw
eenthe10-and90-percentiles.
Itisexp
ectedto
decrease
with
increasingfishingpressure.
Q−
90=
0.8
×n
log(Y
2/Y1)wherenisthetotaln
umberof
functio
nalg
roups,Y1andY2are
landingsofthe10th
and
90th
percentilesin
thecumulativeabundancedistributio
n
Ainsw
orthandPitcher(2006)
Frontiers in Marine Science | www.frontiersin.org 5 February 2017 | Volume 4 | Article 33

Fortibuoni et al. Long-Term Changes in the Mediterranean
Analysis of DataMultivariate AnalysisLandings data were aggregated into 12 functional groups,according to their taxonomical and ecological features, toreduce missing values and restrict the number of variablesin order to better elucidate main changes. Invertebrates weresubdivided into three groups, i.e., bivalves, cephalopods, andcrustaceans (no reliable data for gastropods were available inthe database and thus this group was omitted). Pelagic bonyfish species were grouped into three size classes according tofish species Lmax (small: Lmax < 30 cm; medium: 30 cm ≤
Lmax < 90 cm; large: Lmax ≥ 90 cm). Analogously, three groupswere used for aggregating demersal bony fish species by size.Flatfishes, sharks and “skates and rays” represented three furthergroups.
Functional groups’ proportion in landings (%) was computedyearly in order to analyse landings composition and remove theeffect of landings abundances. A fourth root transformation wasapplied to data to downweight the influence of predominantgroups (Kaiser et al., 2000) and the similarity between everypair of years was computed using the Bray-Curtis similaritycoefficient. Chronological clustering using the un-weighted pair-group average (Legendre and Legendre, 1998) was applied toidentify periods with similar landings composition. Functionalgroups’ proportion in landings was compared among periods bymeans of the non-parametric Kruskal-Wallis H-test (α = 0.05).Ecological indicators were compared between consecutiveperiods identified through cluster analysis by means of the non-parametric Mann-Whitney U-test (α = 0.05). Analysis was donewith PAST v. 3.14 (PAleontological STatistics; Hammer et al.,2001).
Ecological indicators and drivers relationship was analyzedfor the period 1960–2014 (for which all drivers were available)through the statistical procedure BIO-ENV from PRIMERv. 6.1.5 (global BEST-test; Clarke et al., 2008). The methodconsists in the computation of the correlation coefficientsbetween similarity matrices of ecological indicators and drivers,and identifies the combination of drivers that maximizes thecorrelation. Indicators and drivers were normalized prior tothe construction of the Euclidean distance matrices, sincethey represented different units of measure. The skewness andthe individual correlations between drivers were explored byconstructing a draftsman plot and examining the resultingSpearman rank correlations to eventually reduce redundancy anddimensionality of the data. We included all drivers in the analysisafter testing the absence of highly correlated drivers (ρ ≥ 0.95).
Time-Series AnalysisTrends in total landings (Y), ecological indicators and driverstime-series were analyzed using the Mann–Kendall test andthe non-parametric Sen’s method was used to quantify themagnitude (slope) of the trend, using the Microsoft Exceltemplate MAKESENS (Mann-Kendall test for trend and Sen’sslope estimates) developed by Salmi et al. (2002).
Drivers time-series were further explored using the sequentialt-test analysis of regime shift (STARS v. 3.4) first developed byRodionov (2004) in order to detect potential abrupt changes in
the mean. The algorithm was applied to the filtered time seriescalculated by removing red noise through a “pre-whitening”procedure based on the IP4method (Rodionov, 2006) to take intoaccount the effect of serial correlation on shift detection. The cut-off length was set at 10 years, the significance level at 0.05 andHuber’s weight parameter at 1.
RESULTS
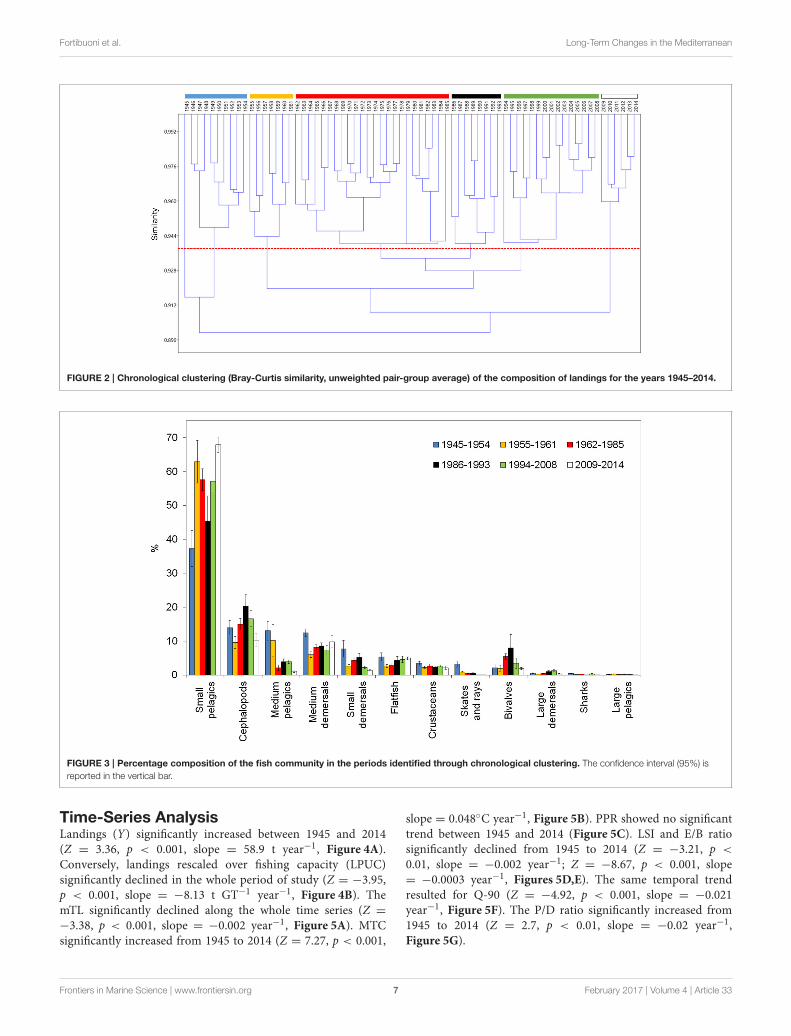
Multivariate AnalysisChronological clustering allowed distinguishing seven periodswith different landings composition at a similarity threshold of0.94: 1945, 1946–1954, 1955–1961, 1962–1985, 1986–1993, 1994–2008, and 2009–2014 (Figure 2). Year 1945, which representedan autonomous cluster at this similarity threshold, was associatedto the first period (then becoming 1945–1954).
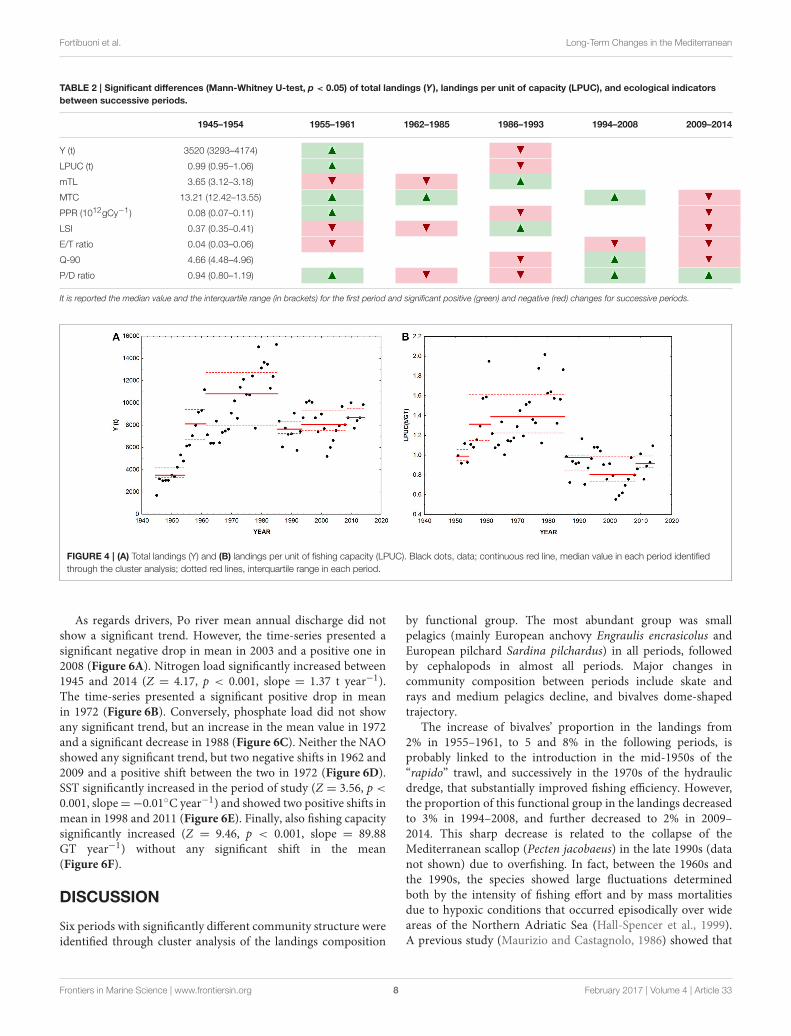
The difference among periods of functional groups’proportion in landings was statistically significant for allfunctional groups. Landings were dominated by small pelagicsin all periods, with a percentage contribution ranging between37% (SD: 8%; 1945–1954) and 68% (SD: 3%; 2009–2014).Cephalopods was the second most relevant group in the landingsin all periods, with a contribution ranging between 10% (SD:2%; 1955–1961) and 20% (SD: 5%; 1986–1993). In the firsttwo periods, the third group in terms of biomass was mediumpelagics that represented more than 10% of the landings [13%(SD: 4%) and 10% (SD: 6%), respectively], but then mediumpelagics declined in the following periods down to 1.1% (SD:0.4%) in recent years (2009–2014). Medium demersals rangedbetween 12% (SD: 2%; 1945–1954) and 6% (SD: 1%; 1955–1961).The other groups contributed with <10% in all periods. It isworth noting that skates and rays showed a sharp decline, from3% (SD: 1%) in 1945–1954 to 0.04% (SD: 0.01%) in 2009–2014(Figure 3). Another interesting dynamic was showed by bivalvesthat from 2% (SD: 1%) of the landings biomass in the first periodincreased to 8% (SD: 6%) in the period 1986–1993, and thensharply declined down to 1.9% (SD: 0.4%) in the most recentperiod (Figure 3).
Mann-WhitneyU-test results are reported inTable 2. Y,MTC,LPUC, PPR, and P/D ratio significantly increased between thefirst two periods, while mTL, LSI and E/B ratio significantlydecreased (Figures 4, 5). Between 1955–1961 and 1962–1985only MTC significantly increased, while mTL, LSI, and P/Dratio significantly decreased (Figure 5). In the subsequent period,mTL and LSI significantly increased, while Y, LPUC, PPR, Q-90, and P/D ratio significantly decreased (Figures 4, 5). Between1986–1993 and 1994–2008 a significant increase of MTC, Q-90,and P/D ratio was observed, while E/B ratio further decreased(Figure 5). Finally, by comparing the last two periods (1994–2008and 2009–2014) a significant decrease of MTC, PPR, LSI, Q-90,and E/B ratio occurred, while P/D ratio significantly increased(Figure 5).
The global BEST-test showed a moderate (ρ = 0.26–0.34)significant (p < 0.01) link between ecological indicators anddrivers. The similarity matrices obtained with phosphorousdischarge and fishing capacity correlated highest (ρ = 0.34) withthe similarity matrix of ecological indicators.
Frontiers in Marine Science | www.frontiersin.org 6 February 2017 | Volume 4 | Article 33
Fortibuoni et al. Long-Term Changes in the Mediterranean
FIGURE 2 | Chronological clustering (Bray-Curtis similarity, unweighted pair-group average) of the composition of landings for the years 1945–2014.
FIGURE 3 | Percentage composition of the fish community in the periods identified through chronological clustering. The confidence interval (95%) is
reported in the vertical bar.
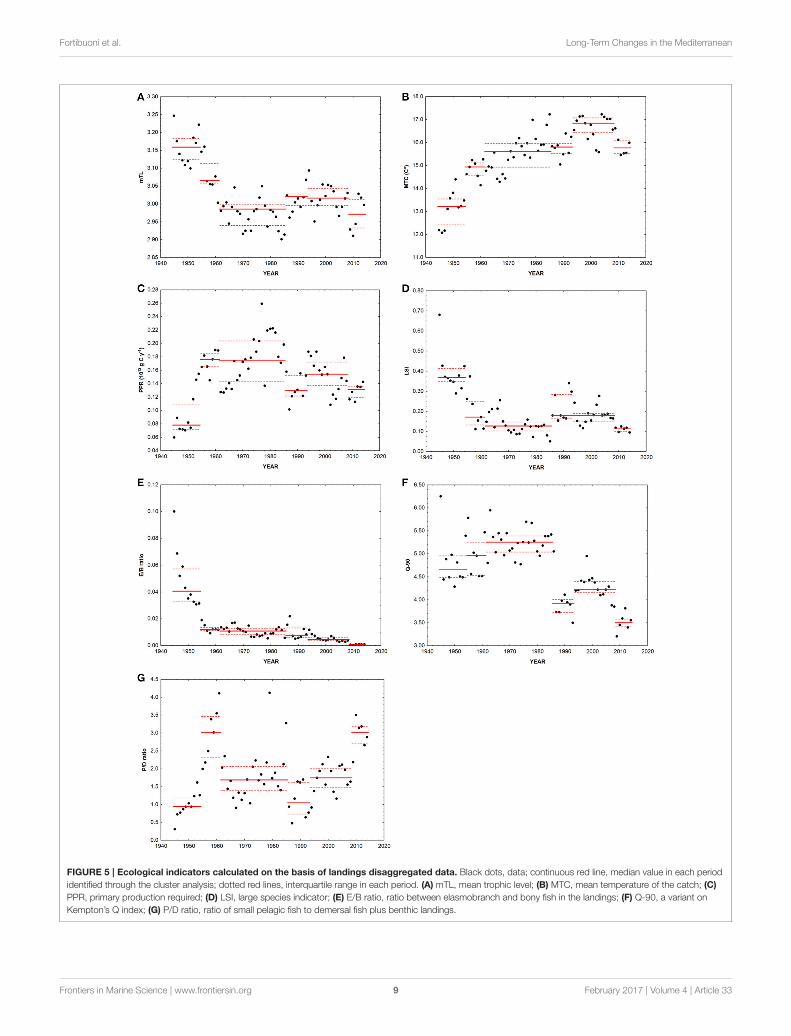
Time-Series AnalysisLandings (Y) significantly increased between 1945 and 2014(Z = 3.36, p < 0.001, slope = 58.9 t year−1, Figure 4A).Conversely, landings rescaled over fishing capacity (LPUC)significantly declined in the whole period of study (Z = −3.95,p < 0.001, slope = −8.13 t GT−1 year−1, Figure 4B). ThemTL significantly declined along the whole time series (Z =
−3.38, p < 0.001, slope = −0.002 year−1, Figure 5A). MTCsignificantly increased from 1945 to 2014 (Z = 7.27, p < 0.001,
slope = 0.048◦C year−1, Figure 5B). PPR showed no significanttrend between 1945 and 2014 (Figure 5C). LSI and E/B ratiosignificantly declined from 1945 to 2014 (Z = −3.21, p <
0.01, slope = −0.002 year−1; Z = −8.67, p < 0.001, slope= −0.0003 year−1, Figures 5D,E). The same temporal trendresulted for Q-90 (Z = −4.92, p < 0.001, slope = −0.021year−1, Figure 5F). The P/D ratio significantly increased from1945 to 2014 (Z = 2.7, p < 0.01, slope = −0.02 year−1,Figure 5G).
Frontiers in Marine Science | www.frontiersin.org 7 February 2017 | Volume 4 | Article 33
Fortibuoni et al. Long-Term Changes in the Mediterranean
TABLE 2 | Significant differences (Mann-Whitney U-test, p < 0.05) of total landings (Y), landings per unit of capacity (LPUC), and ecological indicators
between successive periods.
1945–1954 1955–1961 1962–1985 1986–1993 1994–2008 2009–2014
Y (t) 3520 (3293–4174)
LPUC (t) 0.99 (0.95–1.06)
mTL 3.65 (3.12–3.18)
MTC 13.21 (12.42–13.55)
PPR (1012gCy−1) 0.08 (0.07–0.11)
LSI 0.37 (0.35–0.41)
E/T ratio 0.04 (0.03–0.06)
Q-90 4.66 (4.48–4.96)
P/D ratio 0.94 (0.80–1.19)
It is reported the median value and the interquartile range (in brackets) for the first period and significant positive (green) and negative (red) changes for successive periods.
FIGURE 4 | (A) Total landings (Y) and (B) landings per unit of fishing capacity (LPUC). Black dots, data; continuous red line, median value in each period identified
through the cluster analysis; dotted red lines, interquartile range in each period.
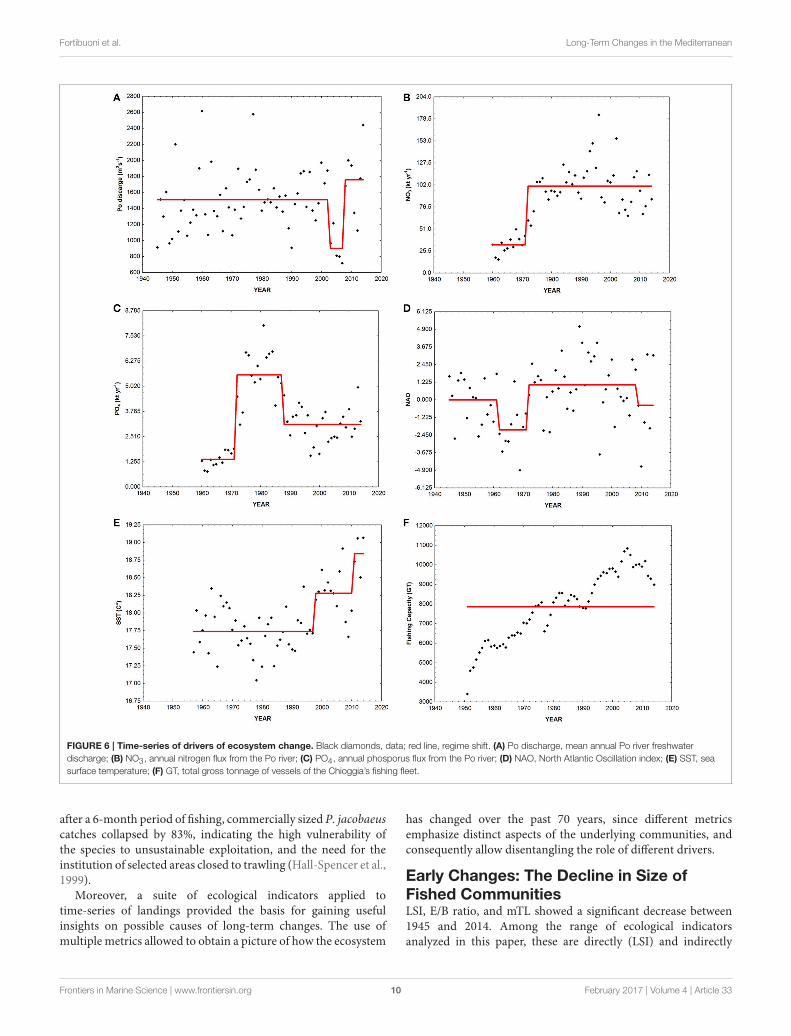
As regards drivers, Po river mean annual discharge did notshow a significant trend. However, the time-series presented asignificant negative drop in mean in 2003 and a positive one in2008 (Figure 6A). Nitrogen load significantly increased between1945 and 2014 (Z = 4.17, p < 0.001, slope = 1.37 t year−1).The time-series presented a significant positive drop in meanin 1972 (Figure 6B). Conversely, phosphate load did not showany significant trend, but an increase in the mean value in 1972and a significant decrease in 1988 (Figure 6C). Neither the NAOshowed any significant trend, but two negative shifts in 1962 and2009 and a positive shift between the two in 1972 (Figure 6D).SST significantly increased in the period of study (Z = 3.56, p <
0.001, slope=−0.01◦C year−1) and showed two positive shifts inmean in 1998 and 2011 (Figure 6E). Finally, also fishing capacitysignificantly increased (Z = 9.46, p < 0.001, slope = 89.88GT year−1) without any significant shift in the mean(Figure 6F).
DISCUSSION
Six periods with significantly different community structure wereidentified through cluster analysis of the landings composition
by functional group. The most abundant group was smallpelagics (mainly European anchovy Engraulis encrasicolus andEuropean pilchard Sardina pilchardus) in all periods, followedby cephalopods in almost all periods. Major changes incommunity composition between periods include skate andrays and medium pelagics decline, and bivalves dome-shapedtrajectory.
The increase of bivalves’ proportion in the landings from2% in 1955–1961, to 5 and 8% in the following periods, isprobably linked to the introduction in the mid-1950s of the“rapido” trawl, and successively in the 1970s of the hydraulicdredge, that substantially improved fishing efficiency. However,the proportion of this functional group in the landings decreasedto 3% in 1994–2008, and further decreased to 2% in 2009–2014. This sharp decrease is related to the collapse of theMediterranean scallop (Pecten jacobaeus) in the late 1990s (datanot shown) due to overfishing. In fact, between the 1960s andthe 1990s, the species showed large fluctuations determinedboth by the intensity of fishing effort and by mass mortalitiesdue to hypoxic conditions that occurred episodically over wideareas of the Northern Adriatic Sea (Hall-Spencer et al., 1999).A previous study (Maurizio and Castagnolo, 1986) showed that
Frontiers in Marine Science | www.frontiersin.org 8 February 2017 | Volume 4 | Article 33
Fortibuoni et al. Long-Term Changes in the Mediterranean
FIGURE 5 | Ecological indicators calculated on the basis of landings disaggregated data. Black dots, data; continuous red line, median value in each period
identified through the cluster analysis; dotted red lines, interquartile range in each period. (A) mTL, mean trophic level; (B) MTC, mean temperature of the catch; (C)
PPR, primary production required; (D) LSI, large species indicator; (E) E/B ratio, ratio between elasmobranch and bony fish in the landings; (F) Q-90, a variant on
Kempton’s Q index; (G) P/D ratio, ratio of small pelagic fish to demersal fish plus benthic landings.
Frontiers in Marine Science | www.frontiersin.org 9 February 2017 | Volume 4 | Article 33
Fortibuoni et al. Long-Term Changes in the Mediterranean
FIGURE 6 | Time-series of drivers of ecosystem change. Black diamonds, data; red line, regime shift. (A) Po discharge, mean annual Po river freshwater
discharge; (B) NO3, annual nitrogen flux from the Po river; (C) PO4, annual phosporus flux from the Po river; (D) NAO, North Atlantic Oscillation index; (E) SST, sea
surface temperature; (F) GT, total gross tonnage of vessels of the Chioggia’s fishing fleet.
after a 6-month period of fishing, commercially sized P. jacobaeuscatches collapsed by 83%, indicating the high vulnerability ofthe species to unsustainable exploitation, and the need for theinstitution of selected areas closed to trawling (Hall-Spencer et al.,1999).
Moreover, a suite of ecological indicators applied totime-series of landings provided the basis for gaining usefulinsights on possible causes of long-term changes. The use ofmultiple metrics allowed to obtain a picture of how the ecosystem
has changed over the past 70 years, since different metricsemphasize distinct aspects of the underlying communities, andconsequently allow disentangling the role of different drivers.
Early Changes: The Decline in Size ofFished CommunitiesLSI, E/B ratio, and mTL showed a significant decrease between1945 and 2014. Among the range of ecological indicatorsanalyzed in this paper, these are directly (LSI) and indirectly
Frontiers in Marine Science | www.frontiersin.org 10 February 2017 | Volume 4 | Article 33

Fortibuoni et al. Long-Term Changes in the Mediterranean
(E/B ratio and mTL) related to size. Since fishing is usuallysize-selective, both within and among species (Jennings, 2005),these indicators are considered to be sensitive to fishingdisturbance and are expected to decrease under unsustainableexploitation.
It is worth noting that LSI does not take into account theactual size-distribution of exploited populations (that requiresthe availability of information of the size of caught individuals),but it is based on the Lmax of species (see Table 1). Thus,the LSI changes are attributable to changes in composition ofpopulations rather than species’ size composition. Therefore,the LSI differs substantially from the Large Fish Indicator (LFI,Greenstreet et al., 2011), but it may be useful for managementpurposes since it requires less detailed data than LFI forhighlighting effects of fishing, and can be applied also to long-term landings data series where the size structure of catches ismost often not known.
The negative trend for these indicators highlights a shifttoward smaller species in the community, or anyway a decreaseof proportion of larger fish. Larger fish (which usually havehigh trophic levels) are more vulnerable to fishing and haveless capacity to sustain great rates of mortality (Dulvy andReynolds, 2002; Jennings, 2005; Myers and Worm, 2005). Thisphenomenon could be further exacerbated by the possibleincrease of small species due to the “predation release” as theirpredators are depleted (Bruno and O’Connor, 2005; Jennings,2005; Myers et al., 2007).
Therefore, fishing seems to have had significant detrimentaleffects on the fish community composition since the first yearsof the time-series. Indeed in mid-1950s, the first rearrangementof the fish community structure occurred, as emerged fromthe cluster analysis, with a shift from large-sized high trophiclevel species to small planktivorous ones. Consequently, asignificant negative decrease of mTL, LSI, and E/B ratio wasobserved.
The decline of elasmobranchs and large-sized species startedeven before the 1950s in the area (i.e., in the nineteenth century;Fortibuoni et al., 2010; Raicevich and Fortibuoni, 2013), butwas exacerbated afterwards probably as a consequence of theindustrialization of fishery and the introduction of new highlyimpacting fishing gears (Ferretti et al., 2013; Barausse et al., 2014).Especially linked to the decrease of skates and rays (Barausseet al., 2014; Engelhard et al., 2015), the E/B ratio decline indicatesthe important role of elasmobranchs as sensitive key species fordetecting early signals of fisheries disturbances (Baum et al.,2003).
However, the early collapse of large-sized species is not onlya consequence of the decline of elasmobranchs. In the mid-1950s medium pelagic species reached a maximum in landings(1449 kg in 1956), and dramatically declined afterwards. Mediumpelagics (mainly the Atlantic mackerel Scomber scombrus)represent an important group of species for the local fishmarket, whose decline is hardly a consequence of changes inmarket demand (Meneghesso et al., 2013). Thus, it can beassumed quite conservatively that the decline in catches formedium pelagics reflects a dramatic decline of populationsat sea.
Overall, the decline in mTL, E/B ratio and LSI clearlyhighlight that there has been a long-term fishing-down food webphenomenon (sensu Pauly et al., 1998).
Signals of Structural ChangesThe Q-90 index significantly declined between 1945 and2014, with a significant negative median-shift in the mid-1980s, indicating a reduction in the biodiversity of landingswith increasing fishing impact. The change in biodiversityof landings is concurrent to the significant decrease of totallandings and LPUC, suggesting that main modification of marinecommunities affected local fisheries production.
In the mid-1980s, regime shifts are reported for differentecosystem components in many areas, the Mediterranean Sea,the North Sea, the Baltic Sea, and the Black Sea, possiblysuggesting regional effects of a larger scale northern hemisphericpattern (Conversi et al., 2010). Barausse et al. (2011) reportedthat a similar shift occurred also in the Northern Adriatic fishcommunity, including also medium-high trophic level speciesbelonging to both the demersal and pelagic habitats. Our analysis,however, while confirming the existence of the shift, do notsupport the hypothesis that climatic drivers played a major effecton it, and rather point to the impact of local pressures, i.e.,overexploitation and nutrient loads.
Such structural changes may have altered food-web structureand impaired its functioning and resilience. Coll et al.(2008) compared North-Central Adriatic Sea food-web structurebetween the 1970s and 1990s, and reported a high food-webdegradation regarding overexploitation of higher trophic levelsand a simplification of food-web structure (lower omnivory andhigher generality). Thus, it is not surprising that LPUC showeda downwards significant shift in 1986, reaching its minimumvalue in 2002. Only in 2014, the index recovered to valuescomparable to the very beginning of the time-series, when fishingtechnologies were markedly less developed and efficient.
Changes in the Trophic StateThe significant positive trend over time in the P/D index foundin the present study may depend both from eutrophication andoverexploitation of resources (Libralato et al., 2004). Indeed,eutrophication and overfishing may have similar and synergisticeffects on fish communities, i.e., a decline in diversity, aninitial increase in productivity of benthic/demersal and pelagicfood webs, then the progressive dominance of the productionsystem by short-lived, especially pelagic species (Caddy, 1993).However, the P/D ratio in the present case seems to point out theimportance of eutrophication driven events.
Pelagic fishes are generally influenced by nutrient enrichmentwhen it stimulates the plankton production (Caddy, 1993),while demersal fishes are influenced by the dynamics ofbenthic community, which generally responds negatively to theconditions of excessive enrichment as shown by de Leiva Morenoet al. (2000). These authors found a mean value of P/D equalto 3.76 in the Adriatic for the historical series 1978–1988. Inthe present study, the P/D index had a wide dynamic trajectory,ranging between 0.31 and 4.12 with a mean value of 1.81 (±0.84), thus confirming the Adriatic as a mesotrophic ecosystem
Frontiers in Marine Science | www.frontiersin.org 11 February 2017 | Volume 4 | Article 33

Fortibuoni et al. Long-Term Changes in the Mediterranean
(de Leiva Moreno et al., 2000). The index reached some peaksthat can be partly related to severe anoxic/hypoxic events. Forinstance, anoxias in bottom waters linked to eutrophicationoccurred in the periods 1955–1956 and 1972–1982 (Sangiorgiand Donders, 2004), when the P/D index reached a value of∼2. Finally, the P/D index showed an increasing trend in recentyears (significant upward median-shift in 2009), probably linkedto a partial recovery of small pelagic species, mainly Europeananchovy (Carpi et al., 2015).
PPR showed a significant positive median-shift in the mid-1950s. In the mid-1980s, PPR collapsed, mainly driven by thestrong reduction of small pelagic landings. As regards anchovy,its population started declining since the late-1970s, and thereasons of this abrupt reduction have been previously ascribedto climate forcing (Santojanni et al., 2006), modified inflow ofMediterranean waters in the Adriatic Sea and associated salinitychanges (Grbec et al., 2002), over-fishing, increased predation ofeggs and larvae by the jellyfish Pelagia noctiluca and the presenceof mucilage events (Regner, 1996). PPR further significantlydecreased in the last period 2009–2014.
It is worth noting that during the 1970s an increase ofeutrophication occurred in the basin, lasting until the mid-1980s (Giani et al., 2012). Although nitrogen loads increasedup to the mid-1970s and then maintained approximately thesame values up to now (Figure 6B), phosphate peaked in themid-1980s (Figure 6C), and its following marked decline mayhave resulted in limiting production. In 1985, to reduce thenegative effects of cultural eutrophication (e.g., anoxia events),the nutrient load delivered to the Adriatic Sea was reduced,mainly by changing the chemical composition of soap powders(banning phosphorous from the mixture) and by improving thetreatment of urban sewage and farm litter products (Decree-lawNo. 667 of November 25th 1985—Urgent measures to limit theeutrophication of waters).
A significant decrease of phytoplankton abundance was alsoobserved after the 1980s, along with changes in its speciescomposition with a shift toward smaller organisms. Such changesmodified also zooplankton community (Kamburska and Fonda-Umani, 2009). This trend was a consequence of a reductionof phosphorous load, being the Northern Adriatic watersphosphorous-limited (Solidoro et al., 2009), and a decline ofatmospheric precipitation and the runoff in the basin (Giani et al.,2012).
Signals of Climatic ChangesMTC significantly increased between 1945 and 2014 at a decadalrate of 0.5◦C, with three significant positive median-shifts inthe mid-1950s, in the early-1960s, and in the mid-1990s. Asignificant negative median-shift was instead observed in thelast period (2009–2014), even if the median value (15.8◦C) wasstill much higher than at the one observed at the beginning ofthe time-series (1945–1954: 13.2◦C). Thus, overall an increasingdominance in catches of warm affinity species occurred in thelandings of Chioggia, coherently with the pattern observed inother Mediterranean areas (Cheung et al., 2013; Tsikliras andStergiou, 2014; Fortibuoni et al., 2015; Tsikliras et al., 2015).Also SST significantly increased between 1957 and 2014, with apositive shift in mean in 1998. However, SST resulted not to be
one of the main ecological drivers in driving community changesin the Northern Adriatic Sea, and results from this study do notallow establishing a relationship between MTC, SST in the areaand NAO.
Integrating in a Coherent Framework theCommunity ChangesLong-term changes in the Northern Adriatic fish communityresulted to be mainly related to the impacts of fisheries andnutrient dynamics, while climate had a secondary role up tonow. A coherent dynamic is obtained by scaling the PPR to N:Pratio (NO3/PO4) to account for the changes in the limiting factor(Solidoro et al., 2009), and comparing it with the fishing capacitythrough time (Figure 7).
The PPR to N:P ratio increased up to the mid-1980s, showingthat the exploitation development was supported by nutrientenrichment. In the mid-1980s there was an abrupt collapse afterwhich, even for large changes in fishing capacity, PPR to N:Pratio attained much lower values (Figure 7). Notably, the mid-1980s shift is coherent with a shift between two alternative stablestates, as described in Scheffer and Carpenter (2003): from thefirst state (line A–B in Figure 7), to a second state (line C–D–E in Figure 7). Therefore, in the mid-1980s a shift betweentwo alternative stable states of the system likely occurred in theNorthern Adriatic Sea, which is reflected also in a change inthe community structure (see chronological clustering; Figure 2).The shift to a new community composition and the lower trophicpotential (see previous sections) thus resulted in a much lowerproductive capacity (here represented by PPR to N:P ratio), evenfor the high fishing effort exerted in the last decades of the timeseries (Figure 6F). Importantly, to induce a switch back to the
FIGURE 7 | Dynamics of fisheries production under changes of fishing
capacity and nutrient limitation from 1960 to 2014. PPR is scaled to N:P
ratio to take into account changes in the nutrient limiting factor. Solid lines
represent subjective indication of average main trajectories identifiable as two
alternative states of the system (state 1: line A–B; state 2: C–D–E). The
mid-1980s shift is coherent with a catastrophic shift between two alternative
stable states (dashed arrow from B to C) and the presence of hysteretic
behavior. For going back from the actual state (state 2, lower solid line) to a
state prior to the catastrophic event of mid-1980s (state 1, upper solid line) it is
necessary to considerably reduce fishing capacity (left dashed line E–F, placed
subjectively).
Frontiers in Marine Science | www.frontiersin.org 12 February 2017 | Volume 4 | Article 33

Fortibuoni et al. Long-Term Changes in the Mediterranean
original state, it is not sufficient to restore the conditions presentbefore the collapse (Scheffer and Carpenter, 2003): Figure 7shows the hysteresis (B–C–E–F) typical to alternative stablepoints of complex systems. From the actual situation (state 2),to reach the same PPR to N:P ratio observed before its collapse(state 1), a relevant reduction of fishing capacity is necessary (seethe hypothetical line E–F).
Although from our data it is not possible to estimate thereduction in fishing capacity necessary to switch back from state 2to state 1, Figure 7 highlights that a reduction in fishing capacityto values lower than the ones that characterized the 1980swould be necessary, together with an intervention on nutrientloads. This result points to the fact that the current criticalsituation of fisheries is not solely the result of mismanagementof the fisheries sector, but is due also to other environmentalpolicies, in particular those relative to water quality. Thus, actualmanagement needs to account for the fact that the ecosystem isnow in a different state (state 2), and the reversal of the shift ofthe mid-1980s implies changes in fishing capacity and nutrientbalance that go far beyond those of the period of the shift.
Overcoming Limitations in the Use ofLandings for Ecological AnalysesThis work gives support to the possibility of using landingsstatistics for inferring changes in marine ecosystems throughthe analysis of landings composition and the application of aset of ecological indicators. Despite the intrinsic limitations offishery-dependent data (Essington et al., 2006; Hilborn, 2007),the analysis reported here highlights that opportune indicatorscan produce interesting and useful assessments from landings,especially if combined with local knowledge on fisheries changes.In particular, the capability to understand relationship betweenlandings composition to community at sea is more robust whenlocal disaggregated landings result from multi-target and multi-gear fisheries (i.e., several distinct métiers), and when changesin fishing activities (e.g., introduction of new technologies, shiftfrom one fishing gear to another, number and tonnage of boats)are traceable.
Being aware of the poor capabilities of landings absolutequantities to assess single species abundances (Pauly et al.,2013), we used landings composition (percentage proportionof functional groups in total landings) to detect communitychanges. Moreover, the use of data lumped into functional groupsallowed overcoming problems of changes in aggregation detail inlandings statistics.
The potential is great given that landings data are the mostwidespread information that can be used to analyse marineecosystem changes in the past, and probably the cheapestinformation that can be collected by surveying archives andstatistical bulletins and that can be used also in data poorconditions.
CONCLUSIONS
The analysis of landings from the fishmarket of Chioggia allowedinferring information on long-term changes in the Northern
Adriatic ecosystem. Most vulnerable species (i.e., elasmobranchsand large-sized species) considerably declined at the beginningof the industrialization of fishery and continued to decline in thefollowing decades, probably because the exploitation rates werenot sustainable. Indeed, fishing capacity increased enormouslyduring the 1960s and 1970s, i.e., larger boats, higher tonnageand engine horsepower, improved fishing gears, use of high-technology equipment (Fortibuoni, 2010). Until the mid-1980stotal landings continuously increased, possibly as a consequenceof the modernization of fishing fleets and of the growing culturaleutrophication. However, while landings were still increasing, theLPUC was already declining.
Later, the nutrient load (in terms of phosphorus) deliveredto the Adriatic Sea decreased, thus leading to a combinationof high exploitation and reduced productivity, which may well-explain the collapse in landings in the following years. Indeed,from our analysis resulted that phosphorous load (a proxy ofprimary production) and fishing capacity (a proxy of fishingeffort) were the main drivers of change among the consideredexplanatory variables. Conversely, climate relate variables had asmaller impact.
It is likely that long-term effects of fishing drove significantchanges in fish community structure in the Northern AdriaticSea that were partially masked or balanced by an increasein productivity in the period of high nutrient discharge.Once productivity declined, the food-web structure was alreadymodified and probably the resilience of the system wasunpaired. The ecosystem was in a “fishing status” (sensuJennings and Kaiser, 1998), thus reducing its recoverability fromenvironmental driven imbalance. As regards the role played byfishing, it is expected that over time the enhanced skipper skills,adoption of auxiliary equipment and more efficient gear andmaterials, replacement of old vessels by new ones and upgradedengines (Damalas et al., 2014; Engelhard, 2016), resulted inan increased catching efficiency. However, since no reliableinformation was available for the area we did not considerthe effect of the technological creep, keeping our results ratherconservative with respect to fishing impacts.
This study shows that the Northern Adriatic ecosystem andecological drivers has dramatically changed in the last decades,and thus greater knowledge of past states is crucial to setappropriate baselines for current management. Indeed, the actualcrisis faced by the Northern Adriatic Sea fishery sector maybe ascribed both to long-term over-exploitation and changesin nutrient load. This evidence should be considered in fisherymanagement, for instance by rescaling the fishing capacityaccording to the present status of environmental parameters(e.g., trophic conditions related to nutrient discharges). Sincefisheries management in Italy (as in the whole Mediterranean) ispredominantly capacity/effort-based, accounting for changes inthese parameters is decisive. However, because of technologicalcreep, measuring nominal capacity and effort in conventionalterms (e.g., GT, KW, days at sea) may produce estimatesfar from the effective fishing mortality exerted by the fleet(Damalas et al., 2014). All this may partly explain why in Italianwaters the positive impact on resources expected from fishingcapacity/effort reduction was lower than expected (Cataudella
Frontiers in Marine Science | www.frontiersin.org 13 February 2017 | Volume 4 | Article 33
Fortibuoni et al. Long-Term Changes in the Mediterranean
and Spagnolo, 2011). Thus, research on fishing power changeand fine-scale analysis of fishing effort through time are highlyrecommended in order to understand real changes in thecapacity of fishing fleets, and their potential to exploit fish stocks(Engelhard, 2016). Moreover, the results might provide evidenceon the need for considering broadly the ecosystems impactsof human interventions and management actions, since actualcritical state of the fisheries have been exacerbated by regulationson water quality.
AUTHOR CONTRIBUTIONS
SL, SR, and TF conceived the study. SL, CS, and TF definedthe hypotheses and methodologies. TF, SL, and CS analyzedand discussed the results with input from SR, FP, and OG. Allauthors were involved in reviewing and editing the manuscript,and approved it for publication.
FUNDING
The authors acknowledge partial support from EU FP 7 projectPERSEUS (Policy-oriented Marine Environmental Research for
the Southern European Seas, http://www.perseus-net.eu/) andthe Italian RITMARE Flagship Project—The Italian Researchfor the Sea (http://www.ritmare.it) coordinated by the ItalianNational Research Council and funded by the Italian Ministry ofEducation, University and Research within the National ResearchProgram 2011–2013.
ACKNOWLEDGMENTS
We acknowledge Paolo Lazzari (National Institute ofOceanography and Experimental Geophysics, Italy),Virna Meccia (Max Planck Institute for Meteorology,Germany), Cristina Mazziotti and Giovanna Pirretti (RegionalEnvironmental Protection Agency, Italy) for helping us withthe collection of ecosystem drivers data (nutrients load, climaticdata, Po river discharge), and Carlotta Mazzoldi (Universityof Padua, Italy) for providing us landings data. This study wasbenefited from discussions with colleagues of the ICES WorkingGroup on the History of Fish and Fisheries. This article is basedupon work from COST Action IS1403, Oceans Past Platform(OPP), supported by COST (European Cooperation in Scienceand Technology).
REFERENCES
AdriaMed (2004). AdriaMed Seminar on Fishing Capacity: Definition,
Measurement and Assessment. AdriaMed Technical Documents, FAO-
MiPAF Scientific Cooperation to Support Responsible Fisheries in the Adriatic
Sea, Termoli, p. 119. GCP/RER/010/ITA/TD-13.
Ainsworth, C. H., and Pitcher, T. J. (2006). Modifying Kempton’s species diversity
index for use with ecosystem simulation models. Ecol. Ind. 6, 623–630.
doi: 10.1016/j.ecolind.2005.08.024
Baeta, F., Costa, M. J., and Cabral, H. (2009). Changes in the trophic level of
Portuguese landings and fish market price variation in the last decades. Fish.
Res. 97, 216–222. doi: 10.1016/j.fishres.2009.02.006
Barausse, A., Correale, V., Curkovic, A., Finotto, L., Riginella, E., Visentin, E., et al.
(2014). The role of fisheries and the environment in driving the decline of
elasmobranchs in the northern Adriatic Sea. ICES J. Mar. Sci. 71, 1593–1603.
doi: 10.1093/icesjms/fst222
Barausse, A., Michieli, A., Riginella, E., Palmeri, L., and Mazzoldi, C.
(2011). Long-term changes in community composition and life-history
traits in a highly exploited basin (Northern Adriatic Sea): the role of
environment and anthropogenic pressures. J. Fish Biol. 79, 1453–1486.
doi: 10.1111/j.1095-8649.2011.03139.x
Baum, J. K., Myers, R. A., Kehler, D. G., Worm, B., Harley, S. J., and Doherty, P.
A. (2003). Collapse and conservation of shark populations in the Northwest
Atlantic. Science 299, 389–392. doi: 10.1126/science.1079777
Botter, L., Giovanardi, O., and Raicevich, S. (2006). The migration of Chioggia’s
fishing fleet in the Adriatic from the mid-nineteenth to the early twentieth
centuries. J. Mediterr. Stud. 16, 27–44.
Bruno, J. F., and O’Connor, M. I. (2005). Cascading effects of predator
diversity and omnivory in a marine food web. Ecol. Lett. 8, 1048–1056.
doi: 10.1111/j.1461-0248.2005.00808.x
Caddy, J. F. (1993). Toward a comparative evaluation of human impacts on
fishery ecosystems of enclosed and semi-enclosed seas. Rev. Fish. Sci. 1, 57–95.
doi: 10.1080/10641269309388535
Carpi, P., Santojanni, A., Donato, F., Colella, S., Kec, C. V., Zorica, B., et al. (2015).
A joint stock assessment for the anchovy stock of the northern and central
Adriatic Sea: comparison of two catch-at-age models. Sci. Mar. 79, 57–70.
doi: 10.3989/scimar.03903.29A
Cataudella, S., and Spagnolo, M. (2011). The State of Italian Marine Fisheries and
Aquaculture. Rome: Ministero delle Politiche Agricole Alimentari e Forestali.
Cheung, W. L., Watson, R., and Pauly, D. (2013). Signature of ocean
warming in global fisheries catch. Nature 497, 365–369. doi: 10.1038/nature
12156
Cingolani, N., Giannetti, G., and Arneri, E. (1996). Anchovy fisheries in the
Adriatic sea. Sci. Mar. 60, 269–277.
Clarke, K. R., Somerfield, P. I., and Gorley, R. N. (2008). Testing of null hypotheses
in exploratory community analyses: similarity profiles and biota-environment
linkage. J. Exp. Mar. Biol. Ecol. 366, 56–69. doi: 10.1016/j.jembe.2008.07.009
Clodia database (2015). Database of Fishery Data from
Chioggia, Northern Adriatic Sea. Available online at:
http://chioggia.scienze.unipd.it/Database_landing.html
Coll, M., Lotze, H. K., and Romanuk, T. N. (2008). Structural degradation
in Mediterranean sea food webs: testing ecological hypotheses using
stochastic and mass-balance modelling. Ecosystems 11, 939–960.
doi: 10.1007/s10021-008-9171-y
Coll, M., Shannon, L. J., Kleisner, K. M., Juan-Jordá, M. J., Bundy, A., Akoglu,
A. G., et al. (2016). Ecological indicators to capture the effects of fishing
on biodiversity and conservation status of marine ecosystems. Ecol. Ind. 60,
947–962. doi: 10.1016/j.ecolind.2015.08.048
Conversi, A., Fonda Umani, S., Peluso, T., Molinero, J. C., Santojanni, A., and
Edwards, M. (2010). TheMediterranean sea regime shift at the end of the 1980s,
and intriguing parallelisms with other european basins. PLoS ONE 5:e10633.
doi: 10.1371/journal.pone.0010633
Damalas, D., Maravelias, C. D., and Kavadas, S. (2014). Advances in fishing
power: a study spanning 50 years. Rev. Fish. Sci. Aquacult. 22, 112–121.
doi: 10.1080/10641262.2013.839620
de Leiva Moreno, J. I., Agostini, V. N., Caddy, J. F., and Carocci, F. (2000). Is
the pelagic-demersal ratio from fishery landings a useful proxy for nutrient
availability? A preliminary data exploration for the semi-enclosed seas around
Europe. ICES J. Mar. Sci. 57, 1091–1102. doi: 10.1006/jmsc.2000.0705
Dulvy, N. K., and Reynolds, J. D. (2002). Predicting extinction vulnerability in
skates. Conserv. Biol. 16, 440–450. doi: 10.1046/j.1523-1739.2002.00416.x
Engelhard, G. H. (2016). “On the need to study fishing power change: challenges
and perspectives,” in Perspectives on Oceans Past, eds K. S. Máñez and B.
Poulsen (Dordrecht: Springer Publishers Netherlands), 89–101.
Frontiers in Marine Science | www.frontiersin.org 14 February 2017 | Volume 4 | Article 33

Fortibuoni et al. Long-Term Changes in the Mediterranean
Engelhard, G. H., Thurstan, R. H., MacKenzie, B. R., Alleway, H. K., Bannister, R.
C. A., Cardinale, M., et al. (2015). ICESmeets marine historical ecology: placing
the history of fish and fisheries in current policy context. ICES J. Mar. Sci. 73,
1386–1403. doi: 10.1093/icesjms/fsv219
Essington, T. E., Beaudreau, A. H., and Wiedenmann, J. (2006). Fishing
through marine food webs. Proc. Natl. Acad. Sci. U.S.A. 103, 3171–3175.
doi: 10.1073/pnas.0510964103
Ferretti, F., Osio, G. C., Jenkins, C. J., Rosenberg, A. A., and Lotze, H. K. (2013).
Long-term change in a meso-predator community in response to prolonged
and heterogeneous human impact. Sci. Rep. 3:1057. doi: 10.1038/srep01057
Fortibuoni, T. (2010). La Pesca in Alto Adriatico dalla Caduta Della Serenissima ad
oggi: un’Analisi Storica ed Ecologica. Ph.D. thesis, University of Trieste, Trieste.
Fortibuoni, T., Aldighieri, F., Giovanardi, O., Pranovi, F., and Zucchetta, M.
(2015). Climate impact on Italian fisheries (Mediterranean Sea). Reg. Environ.
Change 15, 931–937. doi: 10.1007/s10113-015-0781-6
Fortibuoni, T., Borme, D., Franceschini, G., Giovanardi, O., and Raicevich,
S. (2016). Common, rare or extirpated? Shifting baselines for common
angelshark, Squatina squatina (Elasmobranchii: Squatinidae), in the
Northern Adriatic Sea (Mediterranean Sea). Hydrobiologia 772, 247–259.
doi: 10.1007/s10750-016-2671-4
Fortibuoni, T., Libralato, S., Raicevich, S., Giovanardi, O., and Solidoro,
C. (2010). Coding early naturalists’ accounts into long-term fish
community changes in the Adriatic Sea (1800–2000). PLoS ONE 5:e15502.
doi: 10.1371/journal.pone.0015502
Fortibuoni, T., Noventa, S., Rampazzo, F., Gion, C., Formalewicz, M., Berto, D.,
et al. (2013). Evidence of butyltin biomagnification along the northern Adriatic
food-web (Mediterranean Sea) elucidated by stable isotope ratios. Environ. Sci.
Technol. 47, 3370–3377. doi: 10.1021/es304875b
Froese, R., and Pauly, D. (2016). FishBase. World Wide Web Electronic
Publication. Available online at: www.fishbase.org
Fu, C., Large, S., Knight, B., Richardson, A. J., Bundy, A., Reygondeau, G., et al.
(2015). Relationships among fisheries exploitation, environmental conditions,
and ecological indicators across a series of marine ecosystems. J. Mar. Syst. 148,
101–111. doi: 10.1016/j.jmarsys.2015.01.004
Giani, M., Djakovac, T., Degobbis, D., Cozzi, S., Solidoro, C., and Fonda Umani, S.
(2012). Recent changes in the marine ecosystems of the northern Adriatic Sea.
Estuar. Coast. Shelf S. 115, 1–13. doi: 10.1016/j.ecss.2012.08.023
Grbec, B., Dulcic, J., and Morovi, M. (2002). Long-term changes in landings
of small pelagic fish in the eastern Adriatic—possible influence of climate
oscillations over the Northern Hemisphere. Clim. Res. 20, 241–252.
doi: 10.3354/cr020241
Greenstreet, S. P. R., Rogers, S. I., Rice, J. C., Piet, G. J., Guirey, E. J., Fraser, H. M.,
et al. (2011). Development of the EcoQO for fish communities in the North Sea.
ICES J. Mar. Sci. 68, 1–11. doi: 10.1093/icesjms/fsq156
Hall-Spencer, J. M., Froglia, C., Atkinson, R. J. A., and Moore, P. G. (1999). The
impact of Rapido trawling for scallops, Pecten jacobaeus (L.), on the benthos of
the Gulf of Venice. ICES J. Mar. Sci. 56, 111–124. doi: 10.1006/jmsc.1998.0424
Hammer, Ø., Harper, D. A. T., and Ryan, P. D. (2001). PAST: Paleontological
Statistics Software package for education and data analysis. Palaeontol. Electron.
4, 1–9.
Hilborn, R. (2007). Reinterpreting the state of fisheries and their management.
Ecosystems 10, 1362–1369. doi: 10.1007/s10021-007-9100-5
Hopkins, T. S., Artegiani, A., Kinder, C., and Pariante, R. (1999). “A discussion
of the northern Adriatic circulation and flushing as determined from the
ELNA hydrography,” in The Adriatic Sea. Ecosystem Research Report 32, eds
T. S. Hopkins, A. Artegiani, G. Cauwet, D. Degobbis, and A. Malej (Brussels:
European Commission), 85–106.
Hurrell, J., and National Center for Atmospheric Research Staff (2016). The
Climate Data Guide: Hurrell North Atlantic Oscillation (NAO) Index (Station-
Based). Available online at: https://climatedataguide.ucar.edu/climate-data/
hurrell-north-atlantic-oscillation-nao-index-station-based
Jackson, J. B. C., Kirby, M. X., Berger, W. H., Bjorndal, K. A., Botsford, L. W.,
Bourque, B. J., et al. (2001). Historical overfishing and the recent collapse of
coastal ecosystems. Science 293, 629–637. doi: 10.1126/science.1059199
Jennings, S. (2005). Indicators to support an ecosystem approach to fisheries. Fish
Fish. 6, 212–232. doi: 10.1111/j.1467-2979.2005.00189.x
Jennings, S., and Kaiser, M. J. (1998). The effects of fishing on marine ecosystems.
Adv. Mar. Biol. 34, 201–352. doi: 10.1016/S0065-2881(08)60212-6
Kaiser, M. J., Ramsay, K., Richardson, C. A., Spence, F. E., and Brand, A. R.
(2000). Chronic fishing disturbance has changed shelf sea benthic community
structure. J. Anim. Ecol. 69, 494–503. doi: 10.1046/j.1365-2656.2000.00412.x
Kamburska, L., and Fonda-Umani, S. (2009). From seasonal to decadal inter-
annual variability of mesozooplankton biomass in the northern Adriatic Sea
(Gulf of Trieste). J. Mar. Syst. 78, 490–504. doi: 10.1016/j.jmarsys.2008.12.007
Kempton, R. A., and Taylor, L. R. (1976). Models and statistics for species diversity.
Nature 262, 818–820. doi: 10.1038/262818a0
Kleisner, K., Zeller, D., Froese, R., and Pauly, D. (2013). Using global catch
data for inferences on the world’s marine fisheries. Fish Fish. 14, 293–311.
doi: 10.1111/j.1467-2979.2012.00469.x
Legendre, P., and Legendre, L. (1998). Numerical Ecology, 2nd Edn. Amsterdam:
Elsevier.
Libralato, S., Pranovi, F., Raicevich, S., Da Ponte, F., Giovanardi, O., Pastres, R.,
et al. (2004). Ecological stages of the Venice Lagoon analysed using landing
time series data. J. Mar. Syst. 51, 331–344. doi: 10.1016/j.jmarsys.2004.05.020
Lotze, H. K., Coll, M., and Dunne, J. A. (2011). Historical changes in marine
resources, food-web structure and ecosystem functioning in the Adriatic Sea,
Mediterranean. Ecosystems 14, 198–222. doi: 10.1007/s10021-010-9404-8
Lotze, H. K., Lenihan, H. S., Bourque, B. J., Bradbury, R. H., Cooke, R. G., Kay, M.
C., et al. (2006). Depletion, degradation, and recovery potential of estuaries and
coastal seas. Science 312, 1806–1808. doi: 10.1126/science.1128035
Ludwig, W., Dumonta, E., Meybeck, M., and Heussner, S. (2009). River discharges
of water and nutrients to the Mediterranean and Black Sea: major drivers
for ecosystem changes during past and future decades? Prog. Oceanogr. 80,
199–217. doi: 10.1016/j.pocean.2009.02.001
Maurizio, C., and Castagnolo, L. (1986). Variazioni di taglia in un banco
commerciale di Pecten jacobaeus L. e Chlamys opercularis L. al largo di
Chioggia. Un anno di studi. Nova Thalassia 8, 635–640.
Mazzoldi, C., Sambo, A., and Riginella, E. (2014). The Clodia database: a
long time series of fishery data from the Adriatic Sea. Sci. Data. 1:140018.
doi: 10.1038/sdata.2014.18
Meneghesso, C., Riginella, E., La Mesa, M., Donato, F., and Mazzoldi, C. (2013).
Life-history traits and population decline of the Atlantic mackerel Scomber
scombrus in the Adriatic Sea. J. Fish Biol. 83, 1249–1267. doi: 10.1111/jfb.12223
Mion, M., Piras, C., Fortibuoni, T., Celic, I., Franceschini, G., Giovanardi,
O., et al. (2015). Collection and validation of self-sampled e-logbook data
in a Mediterranean demersal trawl fishery. Reg. Stud. Mar. Sci. 2, 76–86.
doi: 10.1016/j.rsma.2015.08.009
Mozetic, P., Solidoro, C., Cossarini, G., Socal, G., Precali, R., Francé, J.,
et al. (2009). Recent trends towards oligotrophication of the Northern
Adriatic: evidence from chlorophyll a time series. Estuar. Coasts 33, 362–375.
doi: 10.1007/s12237-009-9191-7
Munyandorero, J., and Guenter, C. B. (2010). A six-decade portrait of florida
marine fisheries via landings-based trophodynamic indicators. N. Am. J. Fish.
Manage. 30, 259–280. doi: 10.1577/M08-202.1
Myers, R. A., Baum, J. K., Shepherd, T. D., Powers, S. P., and Peterson, C. H. (2007).
Cascading effects of the loss of apex predatory sharks from a coastal ocean.
Science 315, 1846–1850. doi: 10.1126/science.1138657
Myers, R. A., and Worm, B. (2005). Extinction, survival or recovery of large
predatory fishes. Philos. Trans. R. Soc. B 360, 13–20. doi: 10.1098/rstb.2004.1573
Palomares, M. L. D., and Pauly, D. (2016). SeaLifeBase. World Wide Web
Electronic Publication. Available online at: http://www.sealifebase.org
Pauly, D. (1995). Anecdotes and the shifting baseline syndrome of fisheries. Trends
Ecol. Evol. 10:430. doi: 10.1016/S0169-5347(00)89171-5
Pauly, D., and Christensen, V. (1995). Primary production required to sustain
global fisheries. Nature 374, 255–257. doi: 10.1038/374255a0
Pauly, D., Christensen, V., Dalsgaard, J., Froese, R., and Torres, F.
Jr. (1998). Fishing down marine food webs. Science 279, 860–863.
doi: 10.1126/science.279.5352.860
Pauly, D., Hilborn, R., and Branch, T. (2013). Fisheries: does catch reflect
abundance? Nature 494, 303–306. doi: 10.1038/494303a
Pauly, D., and Watson, R. (2005). Background and interpretation of the ‘Marine
Trophic Index’ as a measure of biodiversity. Philos. Trans. R. Soc. B 360,
415–423. doi: 10.1098/rstb.2004.1597
Piet, G., and Pranovi, F. (2005). A Review of the Indicators for Ecosystem Structure
and Functioning. Project No. 513754. INDECO - Development of Indicators of
Environmental Performance of the Common Fisheries Policy.
Frontiers in Marine Science | www.frontiersin.org 15 February 2017 | Volume 4 | Article 33

Fortibuoni et al. Long-Term Changes in the Mediterranean
Pinnegar, J. K., Jennings, S., O’Brien, C. M., and Polunin, N. V. C.
(2002). Long-term changes in the trophic level of the Celtic Sea fish
community and fish market price distribution. J. Appl. Ecol. 39, 377–390.
doi: 10.1046/j.1365-2664.2002.00723.x
Piroddi, C., Gristina, M., Zylich, K., Greer, K., Ulman, A., Zeller, D., et al.
(2015). Reconstruction of Italy’s marine fisheries removals and fishing capacity,
1950–2010. Fish. Res. 172, 137–147. doi: 10.1016/j.fishres.2015.06.028
Pranovi, F., Raicevich, S., Franceschini, G., Torricelli, P., and Giovanardi, O.
(2001). Discard analysis and damage to non-target species in the “rapido” trawl
fishery.Mar. Biol. 139, 863–875. doi: 10.1007/s002270100646
Raicevich, S., and Fortibuoni, T. (2013). “Assessing neoextirpations in the Adriatic
Sea: an historical ecology approach” in Marine Extinctions - Patterns and
Processes, ed F. Briand (Monaco: CIESM Publisher), 97–111.
Regner, S. (1996). Effects of environmental changes on early stages and
reproduction of anchovy in the Adriatic Sea. Sci. Mar. 60, 167–177.
Rodionov, S. N. (2004). A sequential algorithm for testing climate regime shifts.
Geophys. Res. Lett. 31, L09204. doi: 10.1029/2004GL019448
Rodionov, S. N. (2006). Use of prewhitening in climate regime shift detection.
Geophys. Res. Lett. 33, L12707. doi: 10.1029/2006GL025904
Romanelli, M., Cordisco, C. A., and Giovanardi, O. (2009). The long-term decline
of theChamelea gallina L. (Bivalvia: Veneridae) clam fishery in the Adriatic Sea:
is a synthesis possible? Acta Adriat. 50, 171–205.
Rosenberg, A. A., Bolster, W. J., Alexander, K. E., Leavenworth, W. B., Cooper,
A. B., and McKenzie, M. G. (2005). The history of ocean resources:
modeling cod biomass using historical records. Front. Ecol. Environ. 3, 84–90.
doi: 10.2307/3868514
Russo, A., Rabitti, S., and Bastianini, M. (2002). Decadal climatic anomalies in the
Northern Adriatic Sea inferred from a new oceanographic data set. Mar. Ecol.
23, 340–351. doi: 10.1111/j.1439-0485.2002.tb00032.x
Sàenz-Arroyo, A., Roberts, C. M., Torre, J., Carino-Olvera, M., and Enriquez-
Andrade, R. R. (2005). Rapidly shifting environmental baselines among
fishers of the Gulf of California. Proc. R. Soc. Lond. B Bio. 272, 1957–1962.
doi: 10.1098/rspb.2005.3175
Salmi, T., Määttä, A., Anttila, P., Ruoho-Airola, T., and Amnell, T. (2002).
Detecting Trends of Annual Values of Atmospheric Pollutants by the Mann-
Kendall Test and Sen’s Slope Estimates: the Excel Template Application
MAKESENS. Publications of Air Quality.
Sangiorgi, F., and Donders, T. H. (2004). Reconstructing 150 years
of eutrophication in the north-western Adriatic Sea (Italy) using
dinoflagellate cysts, pollen and spores. Estuar. Coast. Shelf S. 60, 69–79.
doi: 10.1016/j.ecss.2003.12.001
Santojanni, A., Arneri, E., Bernardini, V., Cingolani, N., Di Marco, M., and Russo,
A. (2006). Effects of environmental variables on recruitment of anchovy in the
Adriatic Sea. Clim. Res. 31, 181–193. doi: 10.3354/cr031181
Scheffer, M., and Carpenter, S. R. (2003). Catastrophic regime shifts in
ecosystems: linking theory to observation. Trends Ecol. Evol. 18, 648–656.
doi: 10.1016/j.tree.2003.09.002
Shephard, S., Fung, T., Houle, J. E., Farnsworth, K. D., Reid, D. G., and Rossberg,
A. G. (2012). Size-selective fishing drives species composition in the Celtic Sea.
ICES J. Mar. Sci. 69, 223–234. doi: 10.1093/icesjms/fsr200
Shin, Y.-J., Bundy, A., Shannon, L. J., Simier, M., Coll, M., Fulton, E. A., et al.
(2010). Can simple be useful and reliable? Using ecological indicators to
represent and compare the states of marine ecosystems. ICES J. Mar. Sci. 67,
717–731. doi: 10.1093/icesjms/fsp287
Solidoro, C., Bastianini, M., Bandelj, V., Codermatz, R., Cossarini, G., Melaku
Canu, D., et al. (2009). Current state, scales of variability, and trends of
biogeochemical properties in the northern Adriatic Sea. J. Geophys. Res. 114,
C07S91. doi: 10.1029/2008JC004838
Stergiou, K. I., and Karpouzi, V. S. (2002). Feeding habits and trophic
levels of Mediterranean fish. Rev. Fish Biol. Fish. 11, 217–254.
doi: 10.1023/A:1020556722822
Swartz, W., Sala, E., Tracey, S., Watson, R., and Pauly, D. (2010). The spatial
expansion and ecological footprint of fisheries (1950 to Present). PLoS ONE
5:e15143. doi: 10.1371/journal.pone.0015143
Tsikliras, A. C., Peristeraki, P., Tserpes, G., and Stergiou, K. I. (2015). Mean
temperature of the catch (MTC) in the Greek Seas based on landings and survey
data. Front. Mar. Sci 2:23. doi: 10.3389/fmars.2015.00023
Tsikliras, A. C., and Stergiou, K. I. (2014). Mean temperature of the catch
increases quickly in the Mediterranean Sea.Mar. Ecol. Prog. Ser. 515, 281–284.
doi: 10.3354/meps11005
Van Beveren, E., Fromentin, J.-M., Rouyer, T., Bonhommeau, S., Brosset, P., and
Saraux, C. (2016). The fisheries history of small pelagics in the Northern
Mediterranean. ICES J. Mar. Sci. 73, 1474–1484. doi: 10.1093/icesjms/fsw023
Zavatarelli, M., Raicich, F., Bregant, D., Russo, A., and Artegiani, A. (1998).
Climatological biogeochemical characteristics of the Adriatic Sea. J. Mar. Syst.
18, 227–263. doi: 10.1016/S0924-7963(98)00014-1
Conflict of Interest Statement: The authors declare that the research was
conducted in the absence of any commercial or financial relationships that could
be construed as a potential conflict of interest.
Copyright © 2017 Fortibuoni, Giovanardi, Pranovi, Raicevich, Solidoro and
Libralato. This is an open-access article distributed under the terms of the Creative
Commons Attribution License (CC BY). The use, distribution or reproduction in
other forums is permitted, provided the original author(s) or licensor are credited
and that the original publication in this journal is cited, in accordance with accepted
academic practice. No use, distribution or reproduction is permitted which does not
comply with these terms.
Frontiers in Marine Science | www.frontiersin.org 16 February 2017 | Volume 4 | Article 33