Embed Size (px)
Citation preview

Journal of Constructional Steel Research 89 (2013) 153–164
Contents lists available at ScienceDirect
Journal of Constructional Steel Research
Analysis of locally loaded steel plate girders
Model for patch load resistanceSrđa Aleksić ⁎, Milivoje Rogač, Duško LučićUniversity of Montenegro, Faculty of Civil Engineering, Džordža Vašingtona b.b., 81000 Podgorica, Montenegro
⁎ Corresponding author at: Faculty of Civil Engineering4905; fax: +381 20241903.
E-mail address: [email protected] (S. Aleksić).
0143-974X/$ – see front matter © 2013 Elsevier Ltd. Alhttp://dx.doi.org/10.1016/j.jcsr.2013.07.005
a b s t r a c t
a r t i c l e i n f oArticle history:Received 26 March 2013Accepted 1 July 2013Available online 31 July 2013
Keywords:Thin-walled steel I-girdersPatch loadingStabilityUltimate loadExperimental researchMathematical model
The paper deals with the problem of ultimate load capacity of thin-walled steel I-girders under the patch loadwhich acts in the web plane of the girder. It considers the patch load type “a” according to EN1993-1-5. Theanalysed problem is very complex with the girder carrying capacity loss due to buckling of the web under theloaded flange. An experimental research of twelve plate steel girders subjected to patch loading is presented.The mathematical model for calculating ultimate load capacity of thin-walled steel I-girder under the patchload is proposed. Experimentally obtained ultimate loads and ultimate loads calculated by EN1993-1-5 arecompared with those calculated by the proposed model. Experimental database consists of 52 tests fromthe experimental researches which were done at the Civil Engineering Faculty, University of Montenegro.
© 2013 Elsevier Ltd. All rights reserved.
1. Introduction
The resistance of thin-walled steel I-girders under the patch loadinghas been thoroughly analysed in the last decades and the problem isactually for more than one century. The paper considers patch loadingtype “a” according to EN1993-1-5, which acts in the web plane of thegirder.
More than 35 experimental researches have been carried outworldwide [8] and main conclusions of the experimental experienceare as follows. Girder collapse is characterised by web buckling belowthe loading. Web thickness is the main parameter that influences theultimate load. Other geometrical parameters of significant influenceare loaded flange stiffness and load length. Horizontal and/or verticalstiffeners can increase the ultimate load only if they prevent or limit col-lapse mechanism formation (web buckle formation). For slender webpanels, web slenderness (ratio of web depth and web thickness) doesnot influence the ultimate load, but in the case of girders with lowweb depth (stocky web) ultimate load tends to increase as slendernessdecrease. Initial geometrical imperfections within common tolerancesas well as normal stresses due to global bending do not significantlyaffect the ultimate load.
Problem solution was theoretically developed using two differentapproaches. The first one considers critical buckling load based on thetheory of elastic stabilitywhile the second approach applies amechanicalmodel based on first theorem of limit analysis upon previously adoptedfailure mechanism. The first approach leads to underestimated ultimate
, Montenegro. Tel.: +381 2024
l rights reserved.
capacity of the girder while the second one predictsmore realistic valuesof ultimate load.
The first mechanical model based on failure mechanism was devel-oped by Rockey and Roberts [1] and then modified by Lagerquvist andJohansson [2]. The mechanical model which is currently included inEN1993-1-5 is based upon plastic resistance from this failuremechanism.Because of the failure mechanism imperfections, solutions are mainlysubjected to corrections, simplifications and calibrations with existingexperimental databases and thus obtain semi-empirical character [1–4].
The mathematical model for predicting ultimate load capacity ofthin-walled steel I-girder under the patch loading in the web planeis formulated. The proposed model is based on the application of thetheory of elastic stability on an isolated web plate under the load.Model validity is verified by comparing the obtained ultimate loadcapacity with experimental results from researches which were doneat the Civil Engineering Faculty, University of Montenegro [6–8].
2. A short reviewof the patch load resistance according to En1993-1-5
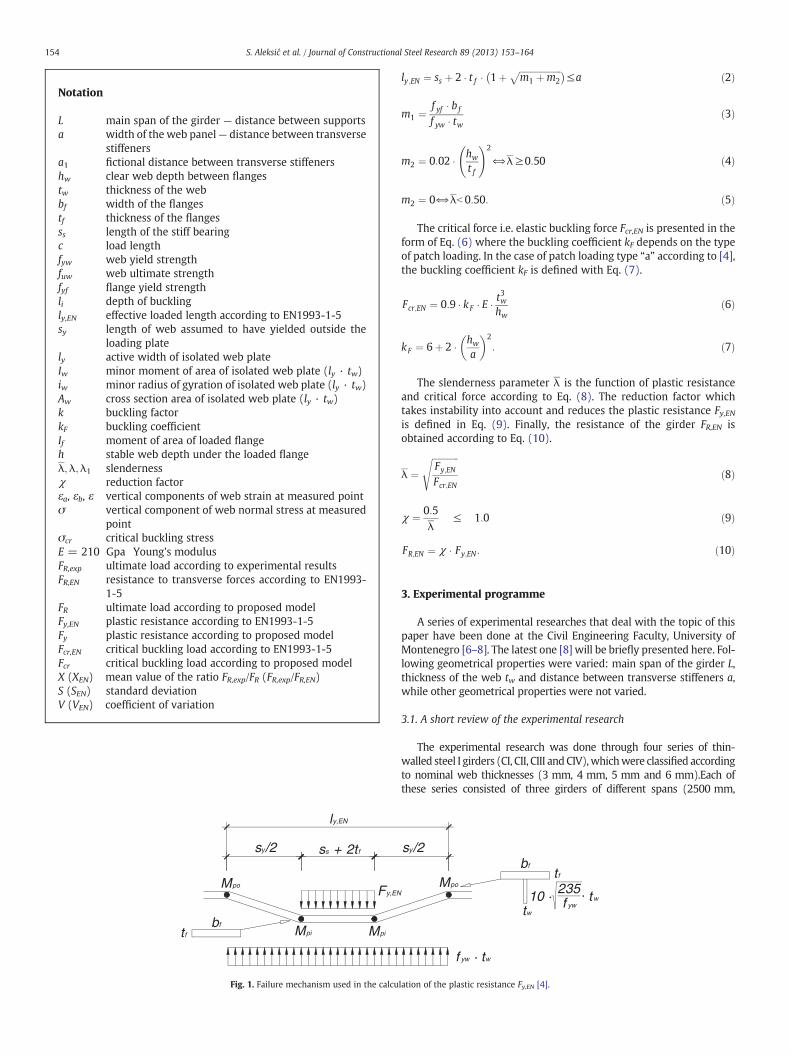
The prediction of the ultimate load of girder under the patch loadingaccording to [4] is based on theχ−λapproach. The plastic resistance Fy,EN(Eq. (1)) is obtained using the first theorem of limit analysis, byequalisation of strain energy of external and internal forces upon virtualdisplacements and rotations of the assumed failure mechanism. The as-sumed failuremechanism impliesweb yielding along the effective lengthly,EN (Eq. (2)) and plastic hinges occurrence in the loaded flangeaccording to (Fig. 1).
Fy;EN ¼ f yw � tw � ly;EN ð1Þ
Notation
L main span of the girder — distance between supportsa width of the web panel— distance between transverse
stiffenersa1 fictional distance between transverse stiffenershw clear web depth between flangestw thickness of the webbf width of the flangestf thickness of the flangesss length of the stiff bearingc load lengthfyw web yield strengthfuw web ultimate strengthfyf flange yield strengthli depth of bucklingly,EN effective loaded length according to EN1993-1-5sy length of web assumed to have yielded outside the
loading plately active width of isolated web plateIw minor moment of area of isolated web plate (ly · tw)iw minor radius of gyration of isolated web plate (ly · tw)Aw cross section area of isolated web plate (ly · tw)k buckling factorkF buckling coefficientIf moment of area of loaded flangeh stable web depth under the loaded flangeλ;λ;λ1 slendernessχ reduction factorεa, εb, ε vertical components of web strain at measured pointσ vertical component of web normal stress at measured
pointσcr critical buckling stressE = 210 Gpa Young's modulusFR,exp ultimate load according to experimental resultsFR,EN resistance to transverse forces according to EN1993-
1-5FR ultimate load according to proposed modelFy,EN plastic resistance according to EN1993-1-5Fy plastic resistance according to proposed modelFcr,EN critical buckling load according to EN1993-1-5Fcr critical buckling load according to proposed modelX (XEN) mean value of the ratio FR,exp/FR (FR,exp/FR,EN)S (SEN) standard deviationV (VEN) coefficient of variation
ss + 2tfsy/2
MpiMpi
Mpo Fy,EN
bf
tf
ly,EN
Fig. 1. Failure mechanism used in the calcu
154 S. Aleksić et al. / Journal of Constructional Steel Research 89 (2013) 153–164
ly ;EN ¼ ss þ 2 � t f � 1þ ffiffiffiffiffiffiffiffiffiffiffiffiffiffiffiffiffiffiffim1 þm2
p� �≤a ð2Þ
m1 ¼ f yf � bf
f yw � twð3Þ
m2 ¼ 0:02 � hwt f
!2
⇔λ≥0:50 ð4Þ
m2 ¼ 0⇔λb 0:50: ð5Þ
The critical force i.e. elastic buckling force Fcr,EN is presented in theform of Eq. (6) where the buckling coefficient kF depends on the typeof patch loading. In the case of patch loading type “a” according to [4],the buckling coefficient kF is defined with Eq. (7).
Fcr;EN ¼ 0:9 � kF � E � t3w
hwð6Þ
kF ¼ 6þ 2 � hwa
� �2: ð7Þ
The slenderness parameter λ is the function of plastic resistanceand critical force according to Eq. (8). The reduction factor whichtakes instability into account and reduces the plastic resistance Fy,ENis defined in Eq. (9). Finally, the resistance of the girder FR,EN isobtained according to Eq. (10).
λ ¼ffiffiffiffiffiffiffiffiffiffiffiffiFy;ENFcr;EN
sð8Þ
χ ¼ 0:5λ
≤ 1:0 ð9Þ
FR;EN ¼ χ � Fy;EN: ð10Þ
3. Experimental programme
A series of experimental researches that deal with the topic of thispaper have been done at the Civil Engineering Faculty, University ofMontenegro [6–8]. The latest one [8] will be briefly presented here. Fol-lowing geometrical properties were varied: main span of the girder L,thickness of the web tw and distance between transverse stiffeners a,while other geometrical properties were not varied.
3.1. A short review of the experimental research
The experimental research was done through four series of thin-walled steel I girders (CI, CII, CIII andCIV),whichwere classified accordingto nominal web thicknesses (3 mm, 4 mm, 5 mm and 6 mm).Each ofthese series consisted of three girders of different spans (2500 mm,
bf
tf
sy/2
Mpo
f yw · tw
10 · w
twf yw
235
lation of the plastic resistance Fy,EN [4].

Fig. 2. Girder CIII5/2 before (left) and after (right) failure.
155S. Aleksić et al. / Journal of Constructional Steel Research 89 (2013) 153–164
3000 mm and 500 mm). Long span girders (2500 mm and 3000 mm)carried sub labels 1 and 3 respectively whereas the short span girders(500 mm) carried sub label 5. After the initial loading up to failure, theshort span girders were rotated and re-tested (sub labels 5/1 and 5/2)(Fig. 2).
So, the number of individual tests up to failure per one series was 4,and the total number of tests was 16 (Table 1).
All girders have the same clear web depth hw (400 mm), width ofthe flanges bf (150 mm) and thickness of the flanges tf (8 mm) in ac-cordance with Figs. 3 and 4.
All girders were tested as simply supported beams (span L) with ad-ditional lateral torsional restraints at positions of transverse stiffeners.Patch loadwas applied at themid-span of the girders, over the top flangeby cylindrical (50 mm diameter) stiff bearing ss = 0 (Figs. 3 and 4).
Girderswebswere equippedwith uni-axial strain gaugeswhichwereattached on both web sides in the vertical direction (Figs. 2 and 4). InEq. (11) ε is an axial component of strain in vertical direction while εaand εb are vertical strains at measured points from both sides of theweb. The vertical component of normal stress described in Eq. (12) isincorrect for stress levels over a proportional limit point, but accordingto the authors it gives a clearer insight into the deformation level atmea-sured points (Figs. 4–8).
ε ¼ εa þ εb2
ð11Þ
σ ¼ ε � E: ð12Þ
Lateral deflections of the web panel were measured at the girdermid-span cross-section along eleven points (Figs. 3, 9–12). Due to
Table 1Geometrical and material properties of tested girders, experimental results.
Series Girder L a hw tw
[mm] [mm] [mm] [mm]
I CI1 2500 1500 400 3.2I CI3 3000 1500 400 3.2I CI5/1 500 500 400 3.2I CI5/2 500 500 400 3.2II CII1 2500 1500 400 4.3II CII3 3000 1500 400 4.3II CII5/1 500 500 400 4.3II CII5/2 500 500 400 4.3III CIII1 2500 1500 400 5.0III CIII3 3000 1500 400 5.0III CIII5/1 500 500 400 5.0III CIII5/2 500 500 400 5.0IV CIV1 2500 1500 400 6.0IV CIV3 3000 1500 400 6.0IV CIV5/1 500 500 400 6.0IV CIV5/2 500 500 400 6.0
technical limitations of the measuring equipment, residual lateralweb deflections (deflections after collapse) of the CIV1 girder werenot measured (Fig. 12).
Force controlled loading with a loading speed of about 0.5 kN/swas applied. For all girders, zero measurements were done at load in-tensity of 5 kN. After zero measurement, loading was applied through8–10 increments up to the failure. In all loading increments force waskept constant during the period of measurement.
Geometrical and material properties of all girders as well as ex-perimental results of the obtained ultimate loads are provided inTable 1.
3.2. Remarks and conclusions from experimental research
The direction of the web lateral deflection has the same trend asthe initial geometrical imperfections of the web. At a cross sectionunder the loading, web lateral deflection has a half-sinusoid shapewhich extends the entire web height. At failure point, web deformationchanges configuration and isolates locally in the web area under theload (Figs. 2, 9–13).
Girder failure occurred suddenly due to the instability of the webplate under the load, with propagation of the loaded flange deforma-tion in loading direction. On the residually deformed girder, inflectionlines are clearly visible (Figs. 2, 13 and 14) and they describe thebuckling depth of the web li.
The failure mechanism which can be observed from residuallydeformed girder (Figs. 1, 2 and 13) is a consequence of girder defor-mation after web buckling and it represents deformation after girderfailure.
bf tf ss fyw fuw FR,exp
[mm] [mm] [mm] [MPa] [MPa] [kN]
150 8 0 258 371 83150 8 0 267 373 85150 8 0 258 371 90150 8 0 258 371 92150 8 0 278 405 125150 8 0 301 401 137150 8 0 278 405 147150 8 0 278 405 137150 8 0 206 351 143150 8 0 218 373 139150 8 0 206 351 161150 8 0 206 351 157150 8 0 315 414 203150 8 0 322 428 189150 8 0 315 414 257150 8 0 315 414 240

FRexp
416
150
840
08
50 500 (750) a = 1500 500 (750) 50
L = 2500 (3000)
L/2 = 1250 (1500) L/2 = 1250 (1500)
CI tw = 3mm
CII tw = 4mm
CIII tw = 5mm
CIV tw = 6mm
[mm]
208
x 25
= 2
002
x 50
60
400
20
Fig. 3. Geometry of tested girders with sub labels 1 and 3, positions of the measured points at mid-span.
50 500 50
416
150
840
08
CI tw = 3mm
CII tw = 4mm
CIII tw = 5mm
CIV tw = 6mm
[mm]
250 250
12
3
4
5
20
25
50
50
50
FRexp
Fig. 4. Geometry of tested girders with sub label 5, positions of the measured points atmid-span.
156 S. Aleksić et al. / Journal of Constructional Steel Research 89 (2013) 153–164
Web depth h under the loaded flange remains stable, straight andperpendicular to the loaded flange even after girder failure (Figs. 13and 14). The aforementioned depth of web h is already fully plasticizedat a load level of about 60% of the measured ultimate load (Figs. 5–8).
Normal stresses due to global bending do not significantly affectthe ultimate load capacity [8]. The observed decrease of ultimateload capacities for long span girders (2500 mm and 3000 mm) in rela-tion to short span girders (500 mm) is a consequence of different posi-tions of transverse stiffener a (Table 1).
At the failure point, girders CIV1 and CIV3 were laterally movable(unstable) and therefore they were excluded from the analysis carriedout in Section 5 of this paper.
4. The mathematical model for patch load resistance
The mathematical model for calculating ultimate load capacity ofthin-walled steel I-girder under the patch load in the web plane isproposed. The model is based on the application of the theory of elasticstability on an isolated web plate under the load. Approach to the prob-lem solution is new, clear and simple. It supports the conclusions of theexperimental researches [6–8].
4.1. Mathematical formulation of patch load resistance
Ultimate load capacity is reached due to yielding/buckling of theisolated web plate under the loaded flange. An isolated web platewith depth of buckling li and active width ly which is engaged at thefailure point is considered (Fig. 14).
Plastic resistance Fy of isolated web plate is defined with Eq. (13)and assumes web yielding along length ly.
Fy ¼ f yw � tw � ly: ð13Þ
Critical buckling load Fcr of isolated web plate can be obtainedwith Eq. (16) and represents critical buckling load of a simply sup-ported bar with length li and cross-section ly ⋅ tw.
Fcr ¼π2 � E � Iw
l2ið14Þ
Iw ¼ ly � t3w12
ð15Þ
Fcr ¼π2 � E � t3w � ly
12 � l2i: ð16Þ
If we equate plastic resistance Fy (Eq. (13)) and critical bucklingload Fcr (Eq. (16)) of the isolated web plate, an exact expression forbuckling depth li is obtained with Eq. (17) (Fig. 14).
Fy ¼ Fcr⇒li ¼ tw � π �ffiffiffiffiffiffiffiffiffiffiffiffiffiffiffiffiffi
E12 � f yw
s: ð17Þ
We can present active width of isolatedweb plate ly as a linear com-bination of depth of buckling li and buckling factor k according toEq. (18), so that ultimate load capacity is exactly defined with Eq. (19).
ly ¼ k � li ð18Þ
FR ¼ Fy ¼ Fcr ¼ k � li � tw � f yw ¼ k � π � t2w �ffiffiffiffiffiffiffiffiffiffiffiffiffiffiE � f yw12
s: ð19Þ
4.2. Defining of the influence ratios and buckling factor
According to the remarks from the experimental researches, increas-ing the stiff bearing length ss increases ultimate load capacity FR. Let usmake an assumption that the load extends through the loaded flange atan angle of 45° and let us define new load length c according to Eq. (20).
c ¼ ss þ 2 � t f : ð20Þ
Transverse stiffeners affect the increase of ultimate load capacityonly if they limit/prevent web buckle formation. Let us introduce the

Fig. 5. Normal stress vs. loading level at measured points, girder CI5/1.
157S. Aleksić et al. / Journal of Constructional Steel Research 89 (2013) 153–164
term— fictional distance between transverse stiffeners a1 (Eq. (21)). So,if the real distance between transverse stiffeners a is greater thanfictional a1, the stiffeners do not affect ultimate load capacity FR.
a1 ¼ min 3 � hwa
:
�ð21Þ
Fig. 6. Normal stress vs. loading level
Influence of stiff bearing length ss (c) and distance between trans-verse stiffeners a (a1) on the ultimate load capacity can be consideredthrough ratio c/a1 according to Eq. (22).
ca1
¼ ss þ 2 � t fmin 3 � hw
a:
� ð22Þ
at measured points, girder CII5/1.

Fig. 7. Normal stress vs. loading level at measured points, girder CIII5/2.
158 S. Aleksić et al. / Journal of Constructional Steel Research 89 (2013) 153–164
According to the remarks from the experimental researches, in-creasing the loaded flange stiffness increases ultimate load capacityFR. The influence of flange stiffness on the ultimate load capacity canbe considered through ratio If/Iw according to Eq. (23). If and Iw aremoments of area of loaded flange and isolated web plate.
I fIw
¼ bf � t3fk � li � t3w
: ð23Þ
Buckling factor k of isolated web plate can be presented as a combi-nation of influence ratios defined with Eqs. (22) and (23). After calibra-tion with the existing experimental database which contains over 700worldwide tests [8], buckling factor k of isolated web plate can beobtained with Eq. (24). The effects of the initial geometrical imperfec-tions and residual stresses as well as normal stresses due to bendingin the case of the long span girders are included in the model over thebuckling factor k through the calibration process [8].
k ¼ 1:3 � t ftw
� �3� bf
li
� �� c
a1
� �� 19
: ð24Þ
4.3. An application field of the proposed model
If the clear web depth hw is deeper than the necessary depth for theformation of the described buckling mechanism (Eq. (25); Fig. 2), thepresented calculation procedure can be applied.
hw≥hþ li: ð25Þ
Depth of buckling li is defined with Eq. (17) while unknown depthh (Figs. 14 and 2) can be obtained as follows. If we assume that thetheory of elastic stability (Eq. (26)) is valid up to the yield strengthpoint (Eq. (27)) instead of proportional limit point and if we takeinto account the fact that the web part under the loaded flange h(Fig. 14) is plasticized and stable at the failure point (Eq. (28) —
[5]), then the upper bound of depth h can be exactly obtained withEqs. (31) and (32). In Eqs. (29) and (30), Iw, iw and Aw are respectively:minormoment of area, minor radius of gyration and area of the isolatedweb plate cross section ly · tw.
σ cr ¼ π2 � Eλ2 ð26Þ
σ cr ¼ f yw⇒λ ¼ λ1 ¼ π �ffiffiffiffiffiffiffiffiEf yw
sð27Þ
λ ¼ λλ1
≤ 0:2 ð28Þ
λλ1
≤ 0:2⇒λ ≤ 0:2 � λ1⇒hiw
≤ 0:2 � λ1⇒h ≤ 0:2 � iw � λ1 ð29Þ
iw ¼ffiffiffiffiffiffiIwAw
s¼ twffiffiffiffiffiffi
12p ð30Þ
h ≤ 0:2 � tw � π �ffiffiffiffiffiffiffiffiffiffiffiffiffiffiffiffiffi
E12 � f yw
sð31Þ
h ≤ 0:2 � li: ð32Þ
The upper bound of depth h defines the lower bound of the clearweb depth hw which defines the application field of the proposedmodel according to Eq. (33).
hw ≥ 1:2 � li: ð33Þ
So, the proposed model is valid for the patch loading type “a”according to [4] and except the condition defined with Eq. (33) thereare no further limitations.
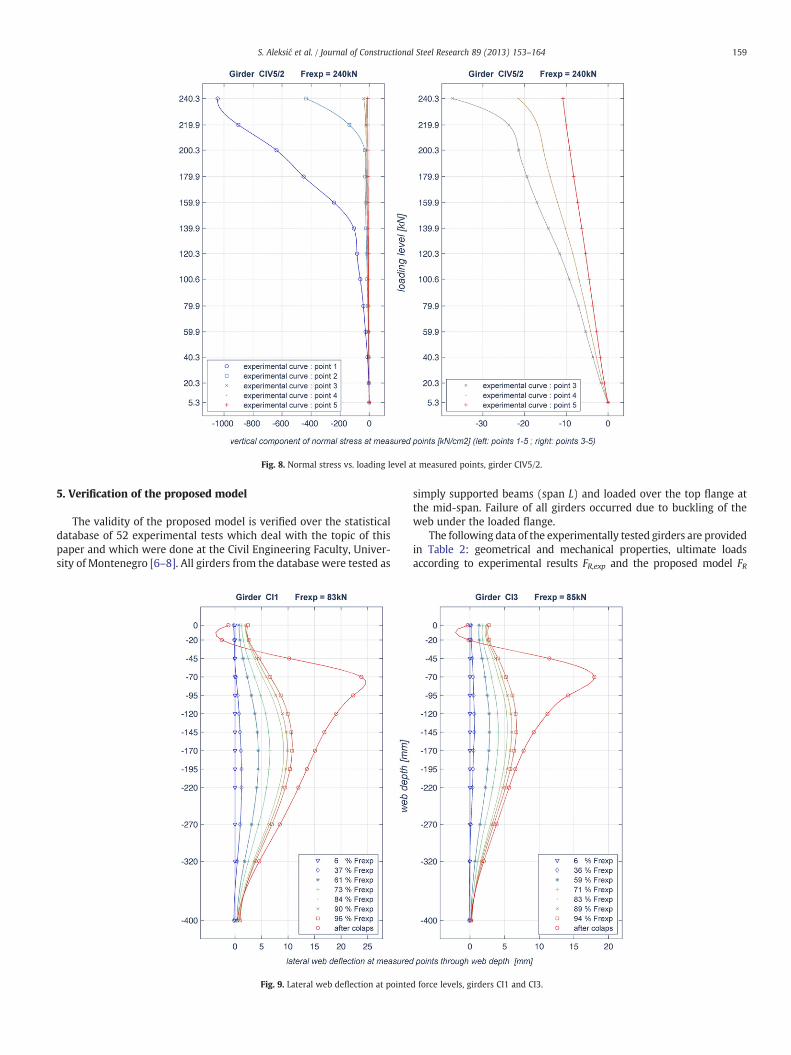
Fig. 8. Normal stress vs. loading level at measured points, girder CIV5/2.
159S. Aleksić et al. / Journal of Constructional Steel Research 89 (2013) 153–164
5. Verification of the proposed model
The validity of the proposed model is verified over the statisticaldatabase of 52 experimental tests which deal with the topic of thispaper and which were done at the Civil Engineering Faculty, Univer-sity of Montenegro [6–8]. All girders from the database were tested as
Fig. 9. Lateral web deflection at pointe
simply supported beams (span L) and loaded over the top flange atthe mid-span. Failure of all girders occurred due to buckling of theweb under the loaded flange.
The following data of the experimentally tested girders are providedin Table 2: geometrical and mechanical properties, ultimate loadsaccording to experimental results FR,exp and the proposed model FR
d force levels, girders CI1 and CI3.

Fig. 10. Lateral web deflection at pointed force levels, girders CII1 and CII3.
160 S. Aleksić et al. / Journal of Constructional Steel Research 89 (2013) 153–164
(Eq. (19)), as well as the resistance to transverse forces according to [4]FR,EN (Eq. (10)). A graphical illustration of the obtained results can beseen in Figs. 15–18.
Statistical analysis of the proposed model was done over a totaldatabase of 52 tests (Fig. 18) and separately over databases fromthe individual experimental researches (14 [8], 22 [6] and 16 tests[7]; Figs. 15–17). Assuming a normal distribution (Gauss), following
Fig. 11. Lateral web deflection at pointed
statistical terms were analysed: mean value X (XEN) of the ratio FR,exp/FR (FR,exp/FR,EN), standard deviation S (SEN) and coefficient of varia-tion V (VEN). The results of the statistical analysis are presented inTable 3 and Figs. 15–19.
Over considered statistical databases, the proposed model is stableand provides a realistic prediction of ultimate load capacity (X =0.999–1.020) with low dispersion of results around the mean value
force levels, girders CIII1 and CIII3.

Fig. 12. Lateral web deflection at pointed force levels, girder CIV1 and CIV3.
Fig. 13. Girder CII3 before (left) and after (right) failure.
ss
FR
161S. Aleksić et al. / Journal of Constructional Steel Research 89 (2013) 153–164
(V = 3.361–8.266%), while the model included in [4] shows clear signsof instability (also concluded in [9]) and underestimates the ultimateload (XEN = 1.194–1.346)with a significant dispersion of results aroundthe mean value (VEN = 10.949–17.317%) (Fig. 19).
h
li
ly = k · li
hw
li
Fig. 14. Failure mechanism according to the proposed model.
6. Conclusions
The ultimate load capacity of thin-walled steel I-girders under thepatch loading type “a” according to [4] is analysed. The load acts inthe web plane. Longitudinally stiffened girders are not considered.
According to the topic of this paper, an experimental research wasdone over twelve girders with sixteen tests up to failure [8]. The failureof all tested girders occurred suddenly as a consequence of instability ofthe web plate under the load. The failure mechanism which can beobserved from a residually deformed girder is formed after webbuckling and it represents deformation after girder failure. Webdepth h (Fig. 14) under the loaded flange remains stable, straight
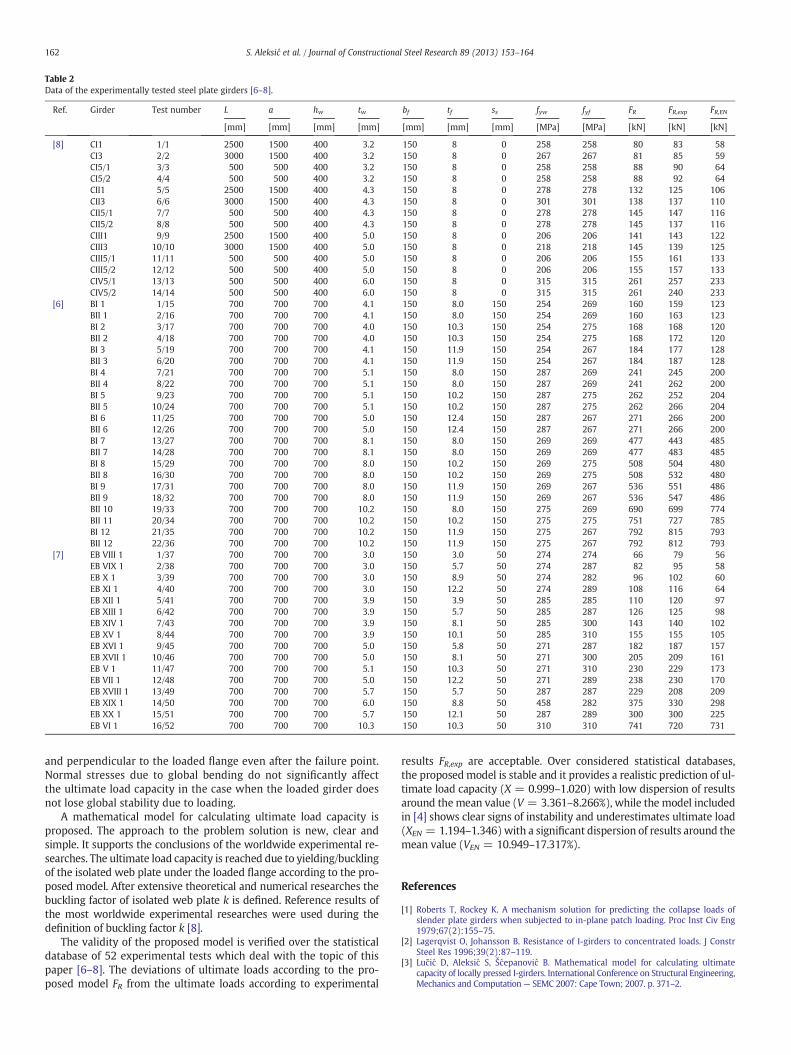
Table 2Data of the experimentally tested steel plate girders [6–8].
Ref. Girder Test number L a hw tw bf tf ss fyw fyf FR FR,exp FR,EN
[mm] [mm] [mm] [mm] [mm] [mm] [mm] [MPa] [MPa] [kN] [kN] [kN]
[8] CI1 1/1 2500 1500 400 3.2 150 8 0 258 258 80 83 58CI3 2/2 3000 1500 400 3.2 150 8 0 267 267 81 85 59CI5/1 3/3 500 500 400 3.2 150 8 0 258 258 88 90 64CI5/2 4/4 500 500 400 3.2 150 8 0 258 258 88 92 64CII1 5/5 2500 1500 400 4.3 150 8 0 278 278 132 125 106CII3 6/6 3000 1500 400 4.3 150 8 0 301 301 138 137 110CII5/1 7/7 500 500 400 4.3 150 8 0 278 278 145 147 116CII5/2 8/8 500 500 400 4.3 150 8 0 278 278 145 137 116CIII1 9/9 2500 1500 400 5.0 150 8 0 206 206 141 143 122CIII3 10/10 3000 1500 400 5.0 150 8 0 218 218 145 139 125CIII5/1 11/11 500 500 400 5.0 150 8 0 206 206 155 161 133CIII5/2 12/12 500 500 400 5.0 150 8 0 206 206 155 157 133CIV5/1 13/13 500 500 400 6.0 150 8 0 315 315 261 257 233CIV5/2 14/14 500 500 400 6.0 150 8 0 315 315 261 240 233
[6] BI 1 1/15 700 700 700 4.1 150 8.0 150 254 269 160 159 123BII 1 2/16 700 700 700 4.1 150 8.0 150 254 269 160 163 123BI 2 3/17 700 700 700 4.0 150 10.3 150 254 275 168 168 120BII 2 4/18 700 700 700 4.0 150 10.3 150 254 275 168 172 120BI 3 5/19 700 700 700 4.1 150 11.9 150 254 267 184 177 128BII 3 6/20 700 700 700 4.1 150 11.9 150 254 267 184 187 128BI 4 7/21 700 700 700 5.1 150 8.0 150 287 269 241 245 200BII 4 8/22 700 700 700 5.1 150 8.0 150 287 269 241 262 200BI 5 9/23 700 700 700 5.1 150 10.2 150 287 275 262 252 204BII 5 10/24 700 700 700 5.1 150 10.2 150 287 275 262 266 204BI 6 11/25 700 700 700 5.0 150 12.4 150 287 267 271 266 200BII 6 12/26 700 700 700 5.0 150 12.4 150 287 267 271 266 200BI 7 13/27 700 700 700 8.1 150 8.0 150 269 269 477 443 485BII 7 14/28 700 700 700 8.1 150 8.0 150 269 269 477 483 485BI 8 15/29 700 700 700 8.0 150 10.2 150 269 275 508 504 480BII 8 16/30 700 700 700 8.0 150 10.2 150 269 275 508 532 480BI 9 17/31 700 700 700 8.0 150 11.9 150 269 267 536 551 486BII 9 18/32 700 700 700 8.0 150 11.9 150 269 267 536 547 486BII 10 19/33 700 700 700 10.2 150 8.0 150 275 269 690 699 774BII 11 20/34 700 700 700 10.2 150 10.2 150 275 275 751 727 785BI 12 21/35 700 700 700 10.2 150 11.9 150 275 267 792 815 793BII 12 22/36 700 700 700 10.2 150 11.9 150 275 267 792 812 793
[7] EB VIII 1 1/37 700 700 700 3.0 150 3.0 50 274 274 66 79 56EB VIX 1 2/38 700 700 700 3.0 150 5.7 50 274 287 82 95 58EB X 1 3/39 700 700 700 3.0 150 8.9 50 274 282 96 102 60EB XI 1 4/40 700 700 700 3.0 150 12.2 50 274 289 108 116 64EB XII 1 5/41 700 700 700 3.9 150 3.9 50 285 285 110 120 97EB XIII 1 6/42 700 700 700 3.9 150 5.7 50 285 287 126 125 98EB XIV 1 7/43 700 700 700 3.9 150 8.1 50 285 300 143 140 102EB XV 1 8/44 700 700 700 3.9 150 10.1 50 285 310 155 155 105EB XVI 1 9/45 700 700 700 5.0 150 5.8 50 271 287 182 187 157EB XVII 1 10/46 700 700 700 5.0 150 8.1 50 271 300 205 209 161EB V 1 11/47 700 700 700 5.1 150 10.3 50 271 310 230 229 173EB VII 1 12/48 700 700 700 5.0 150 12.2 50 271 289 238 230 170EB XVIII 1 13/49 700 700 700 5.7 150 5.7 50 287 287 229 208 209EB XIX 1 14/50 700 700 700 6.0 150 8.8 50 458 282 375 330 298EB XX 1 15/51 700 700 700 5.7 150 12.1 50 287 289 300 300 225EB VI 1 16/52 700 700 700 10.3 150 10.3 50 310 310 741 720 731
162 S. Aleksić et al. / Journal of Constructional Steel Research 89 (2013) 153–164
and perpendicular to the loaded flange even after the failure point.Normal stresses due to global bending do not significantly affectthe ultimate load capacity in the case when the loaded girder doesnot lose global stability due to loading.
A mathematical model for calculating ultimate load capacity isproposed. The approach to the problem solution is new, clear andsimple. It supports the conclusions of the worldwide experimental re-searches. The ultimate load capacity is reached due to yielding/bucklingof the isolated web plate under the loaded flange according to the pro-posed model. After extensive theoretical and numerical researches thebuckling factor of isolated web plate k is defined. Reference results ofthe most worldwide experimental researches were used during thedefinition of buckling factor k [8].
The validity of the proposed model is verified over the statisticaldatabase of 52 experimental tests which deal with the topic of thispaper [6–8]. The deviations of ultimate loads according to the pro-posed model FR from the ultimate loads according to experimental
results FR,exp are acceptable. Over considered statistical databases,the proposedmodel is stable and it provides a realistic prediction of ul-timate load capacity (X = 0.999–1.020) with low dispersion of resultsaround the mean value (V = 3.361–8.266%), while the model includedin [4] shows clear signs of instability and underestimates ultimate load(XEN = 1.194–1.346)with a significant dispersion of results around themean value (VEN = 10.949–17.317%).
References
[1] Roberts T, Rockey K. A mechanism solution for predicting the collapse loads ofslender plate girders when subjected to in-plane patch loading. Proc Inst Civ Eng1979;67(2):155–75.
[2] Lagerqvist O, Johansson B. Resistance of I-girders to concentrated loads. J ConstrSteel Res 1996;39(2):87–119.
[3] Lučić D, Aleksić S, Šćepanović B. Mathematical model for calculating ultimatecapacity of locally pressed I-girders. International Conference on Structural Engineering,Mechanics and Computation— SEMC 2007: Cape Town; 2007. p. 371–2.

Fig. 15. Ultimate load according to experimental results, EN1993-1-5 and proposedmodel.Experimental database [8].
Fig. 17. Ultimate load according to experimental results, EN1993-1-5 and proposedmodel.Experimental database [7].
163S. Aleksić et al. / Journal of Constructional Steel Research 89 (2013) 153–164
[4] EN1993-1-5. Eurocode 3. Design of Steel Structures — Part 1–5: Plated StructuralElements. CEN; 2006 .
[5] EN1993-1-1. Eurocode 3. Design of Steel Structures — Part 1–1: General Rules andRules for Buildings. CEN; 2006 .
[6] Lučić D. Experimental Research: Thin-walled I Girders Subjected to Centric and Ec-centric Patch Loading: Faculty of Civil Engineering. Podgorica: University of Monte-negro; 2001 348.
Fig. 16. Ultimate load according to experimental results, EN1993-1-5 and proposedmodel.Experimental database [6].
[7] Šćepanović B, Lučić D. Ultimate strength of I-girders under eccentric patch load-ing: derivation of a new strength reduction coefficient. Eng Struct 2009;31:1403–13.
[8] Aleksić S. Stability of thin-walled I-girders under the patch loading in web plane.[Doctoral thesis] Faculty of Civil Engineering. Podgorica: University of Montenegro;2010 140 [in Montenegrian].
[9] Chacon R, Mirambell E, Real E. Hybrid steel plate girders subjected to patch loading.Part 2: design proposal. J Constr Steel Res 2010;66:709–15.
Fig. 18. Ultimate load according to experimental results, EN1993-1-5 and proposedmodel.Total experimental database [6–8].
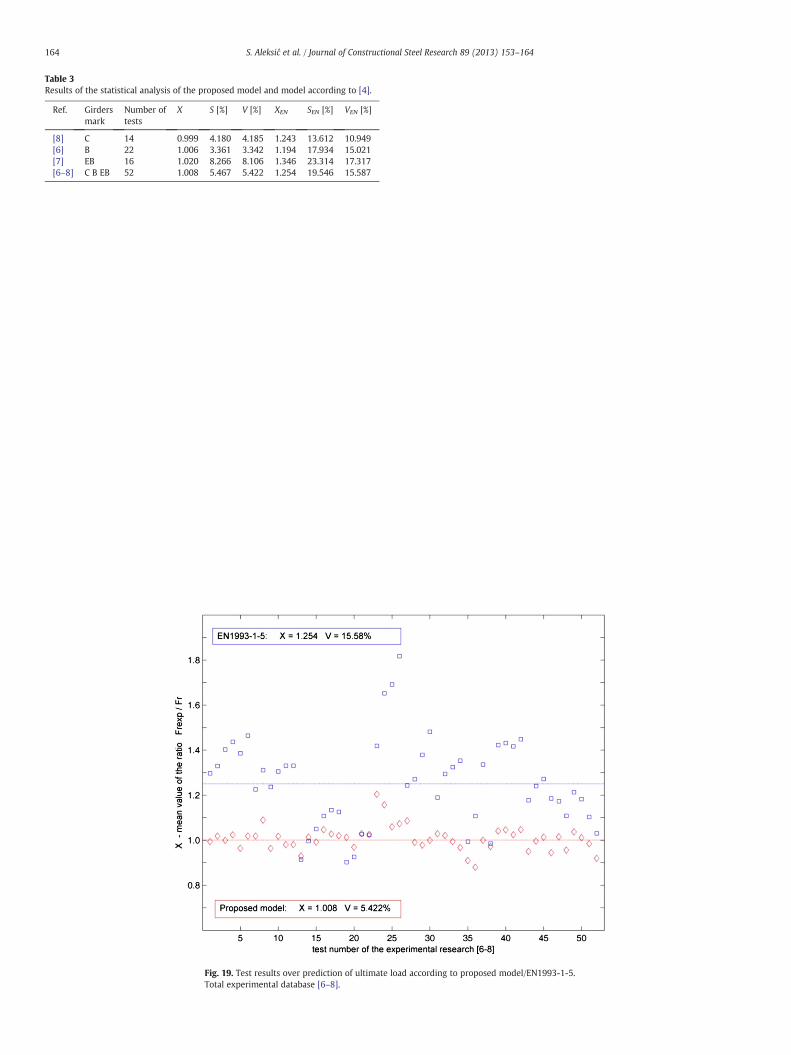
Table 3Results of the statistical analysis of the proposed model and model according to [4].
Ref. Girdersmark
Number oftests
X S [%] V [%] XEN SEN [%] VEN [%]
[8] C 14 0.999 4.180 4.185 1.243 13.612 10.949[6] B 22 1.006 3.361 3.342 1.194 17.934 15.021[7] EB 16 1.020 8.266 8.106 1.346 23.314 17.317[6–8] C B EB 52 1.008 5.467 5.422 1.254 19.546 15.587
164 S. Aleksić et al. / Journal of Constructional Steel Research 89 (2013) 153–164
Fig. 19. Test results over prediction of ultimate loaTotal experimental database [6–8].
d according to proposed model/EN1993-1-5.