Embed Size (px)
Citation preview
Bankmed - Market & Economic Research Division
AnAlysis of lebAnon’sTravel and Tourism secTor
SPECIAL REPORT
Analysis of lebanon’s Travel and Tourism sector - July 2015
Travel and Tourism Contribution to the economy 3
Travel and Tourism Contribution to GDP 3
Travel and Tourism Contribution to employment 4
Travel and Tourism sector 5
beirut international Airport Passengers 5
Total Tourist Arrivals 6
Tourist Arrivals by Region 7
Arab Tourist Arrivals 9
Tourists spending 11
VAT Refunds 13
Hotels Performance 14
Travel and Tourism Competitiveness index 16
sWoT Analysis 18
2
Table of Contents
Bankmed - Market & Economic Research Division
SPECIAL REPORT
Analysis of lebanon’s Travel and Tourism sector - July 2015
3
Travel and Tourism conTribuTion To The economy
TRAVel AnD TouRism ConTRibuTion To GDP
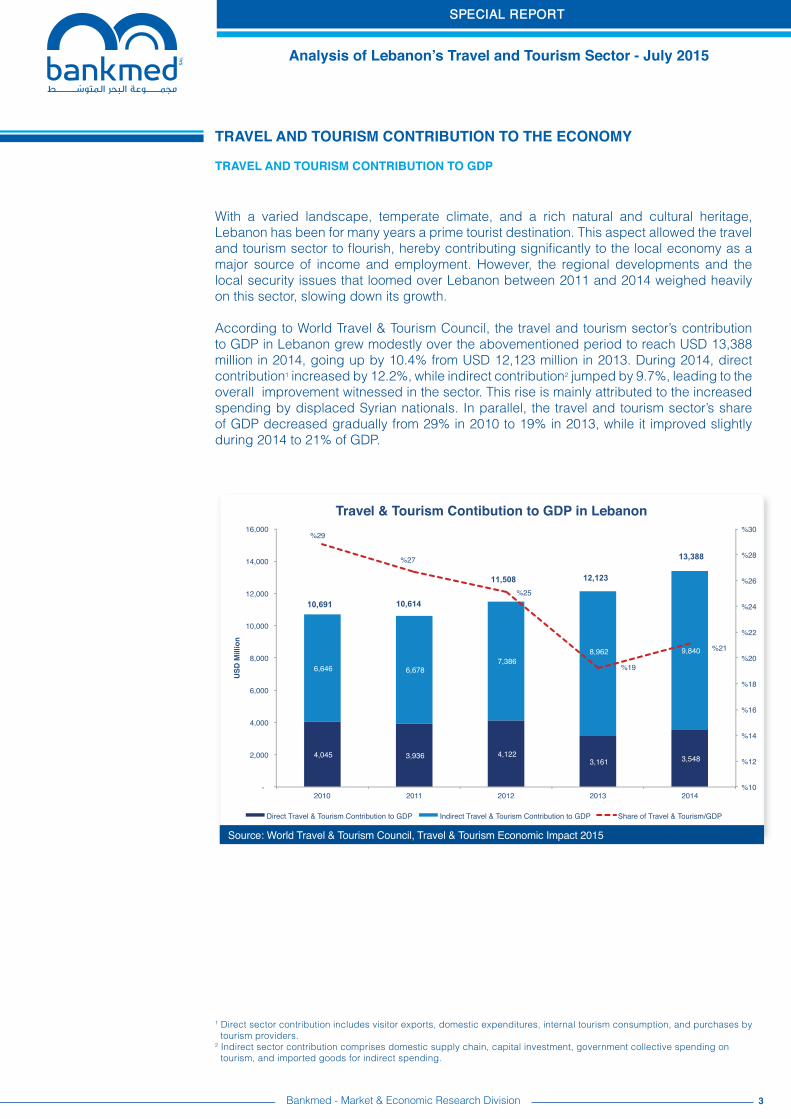
With a varied landscape, temperate climate, and a rich natural and cultural heritage, Lebanon has been for many years a prime tourist destination. This aspect allowed the travel and tourism sector to flourish, hereby contributing significantly to the local economy as a major source of income and employment. However, the regional developments and the local security issues that loomed over Lebanon between 2011 and 2014 weighed heavily on this sector, slowing down its growth.
According to World Travel & Tourism Council, the travel and tourism sector’s contribution to GDP in Lebanon grew modestly over the abovementioned period to reach USD 13,388 million in 2014, going up by 10.4% from USD 12,123 million in 2013. During 2014, direct contribution1 increased by 12.2%, while indirect contribution2 jumped by 9.7%, leading to the overall improvement witnessed in the sector. This rise is mainly attributed to the increased spending by displaced Syrian nationals. In parallel, the travel and tourism sector’s share of GDP decreased gradually from 29% in 2010 to 19% in 2013, while it improved slightly during 2014 to 21% of GDP.
1 Direct sector contribution includes visitor exports, domestic expenditures, internal tourism consumption, and purchases by tourism providers.2 Indirect sector contribution comprises domestic supply chain, capital investment, government collective spending on tourism, and imported goods for indirect spending.
Bankmed - Market & Economic Research Division
Source: World Travel & Tourism Council, Travel & Tourism Economic Impact 2015
SPECIAL REPORT
Analysis of lebanon’s Travel and Tourism sector - July 2015
4
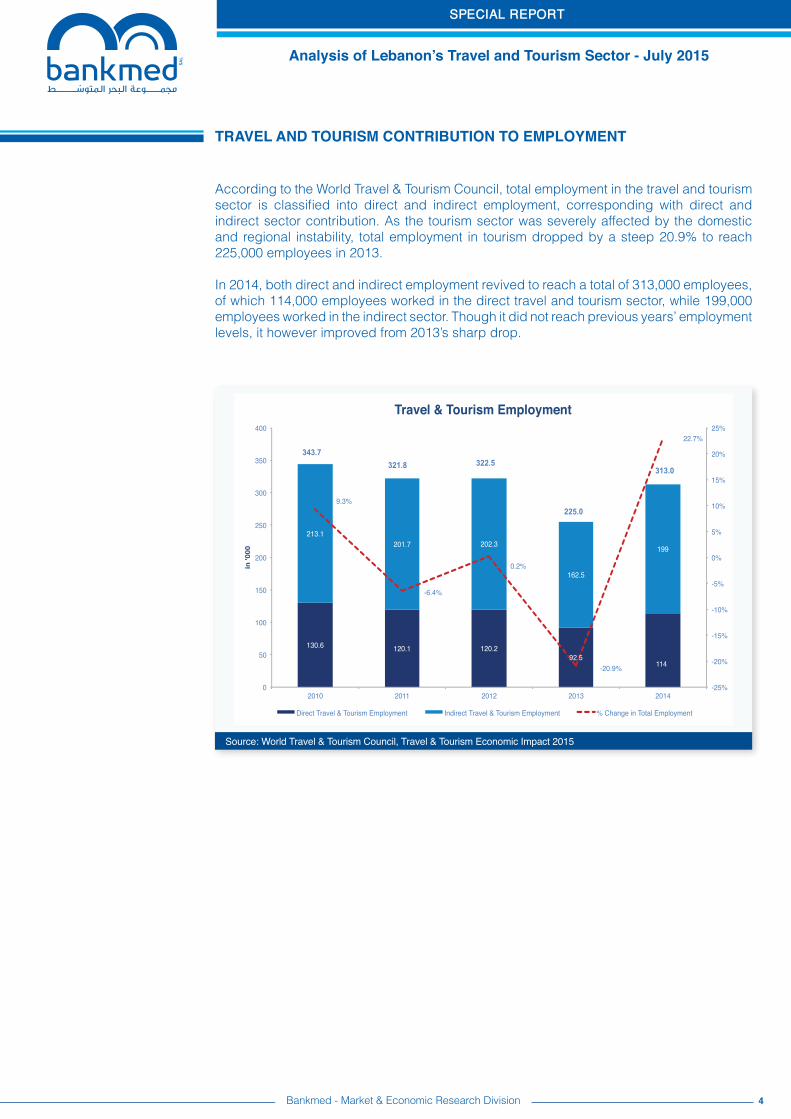
Source: World Travel & Tourism Council, Travel & Tourism Economic Impact 2015
According to the World Travel & Tourism Council, total employment in the travel and tourism sector is classified into direct and indirect employment, corresponding with direct and indirect sector contribution. As the tourism sector was severely affected by the domestic and regional instability, total employment in tourism dropped by a steep 20.9% to reach 225,000 employees in 2013.
In 2014, both direct and indirect employment revived to reach a total of 313,000 employees, of which 114,000 employees worked in the direct travel and tourism sector, while 199,000 employees worked in the indirect sector. Though it did not reach previous years’ employment levels, it however improved from 2013’s sharp drop.
TRAVel AnD TouRism ConTRibuTion To emPloymenT
Bankmed - Market & Economic Research Division
SPECIAL REPORT
Analysis of lebanon’s Travel and Tourism sector - July 2015
5
Source: Beirut International Airport
beiRuT inTeRnATionAl AiRPoRT PAssenGeRs
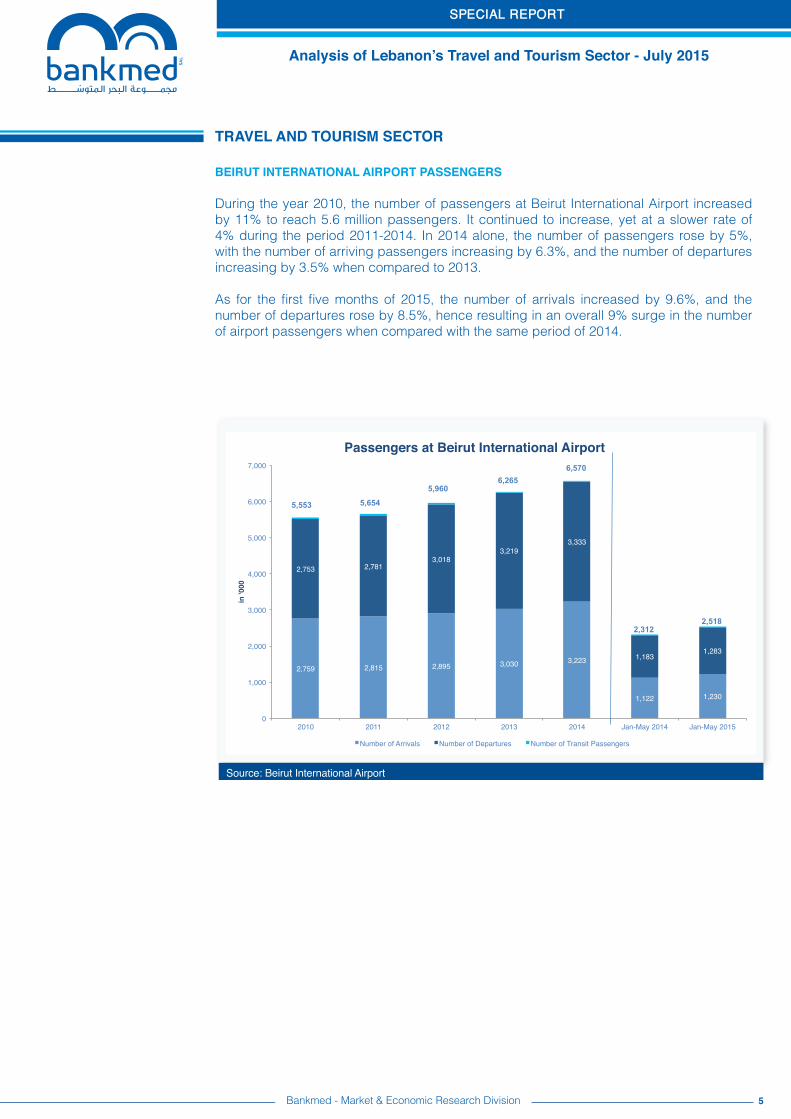
During the year 2010, the number of passengers at Beirut International Airport increased by 11% to reach 5.6 million passengers. It continued to increase, yet at a slower rate of 4% during the period 2011-2014. In 2014 alone, the number of passengers rose by 5%, with the number of arriving passengers increasing by 6.3%, and the number of departures increasing by 3.5% when compared to 2013.
As for the first five months of 2015, the number of arrivals increased by 9.6%, and the number of departures rose by 8.5%, hence resulting in an overall 9% surge in the number of airport passengers when compared with the same period of 2014.
Travel and Tourism secTor
Bankmed - Market & Economic Research Division
2,759! 2,815! 2,895! 3,030! 3,223!
1,122! 1,230!
2,753! 2,781!3,018!
3,219!3,333!
1,183!1,283!
0!
1,000!
2,000!
3,000!
4,000!
5,000!
6,000!
7,000!
2010! 2011! 2012! 2013! 2014! Jan-May 2014! Jan-May 2015!
in '0
00!
Passengers at Beirut International Airport!
Number of Arrivals! Number of Departures! Number of Transit Passengers!
5,553 5,654
5,960 6,265
6,570
2,312 2,518
SPECIAL REPORT
Analysis of lebanon’s Travel and Tourism sector - July 2015
6
Source: Ministry of Tourism
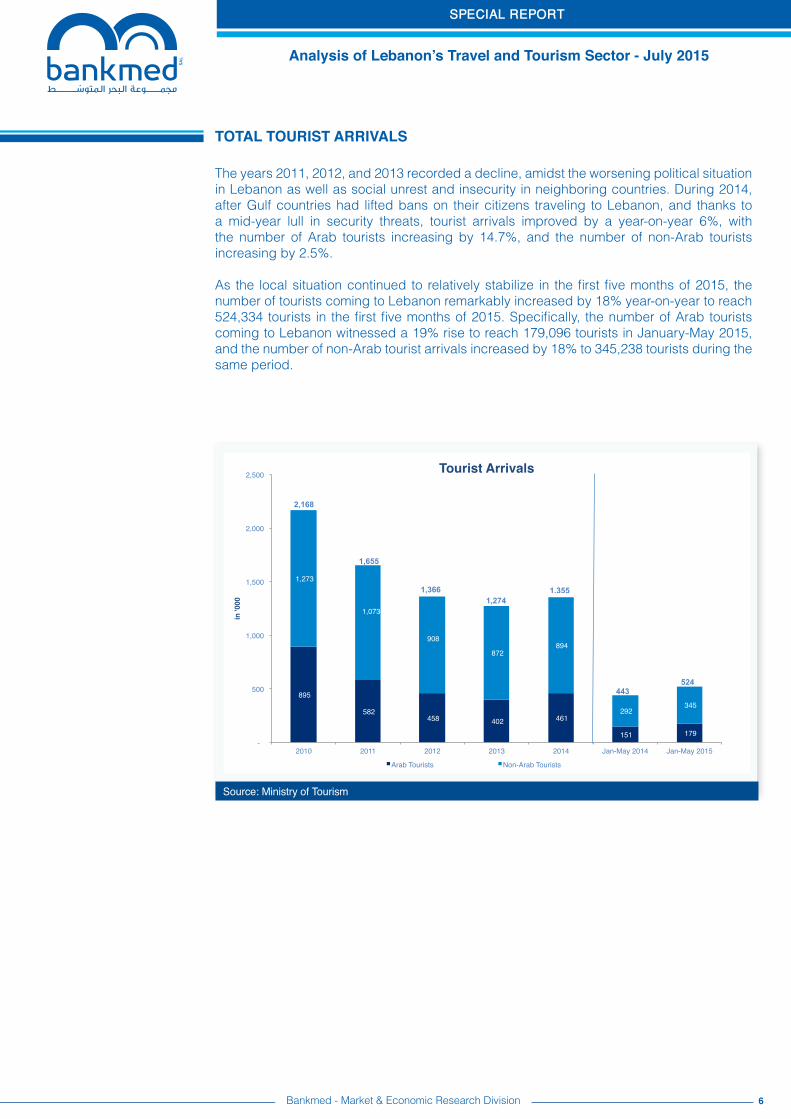
The years 2011, 2012, and 2013 recorded a decline, amidst the worsening political situation in Lebanon as well as social unrest and insecurity in neighboring countries. During 2014, after Gulf countries had lifted bans on their citizens traveling to Lebanon, and thanks to a mid-year lull in security threats, tourist arrivals improved by a year-on-year 6%, with the number of Arab tourists increasing by 14.7%, and the number of non-Arab tourists increasing by 2.5%.
As the local situation continued to relatively stabilize in the first five months of 2015, the number of tourists coming to Lebanon remarkably increased by 18% year-on-year to reach 524,334 tourists in the first five months of 2015. Specifically, the number of Arab tourists coming to Lebanon witnessed a 19% rise to reach 179,096 tourists in January-May 2015, and the number of non-Arab tourist arrivals increased by 18% to 345,238 tourists during the same period.
ToTal TourisT arrivals
Bankmed - Market & Economic Research Division
895 !
582 ! 458 ! 402 ! 461 !
151 ! 179 !
1,273 !
1,073 !
908 !
872 ! 894 !
292 ! 345 !
- !
500 !
1,000 !
1,500 !
2,000 !
2,500 !
2010! 2011! 2012! 2013! 2014! Jan-May 2014! Jan-May 2015!
in '0
00!
Tourist Arrivals!
Arab Tourists! Non-Arab Tourists!
1,355
2,168
1,655
1,366 1,274
524 443
SPECIAL REPORT
Analysis of lebanon’s Travel and Tourism sector - July 2015
7
Source: Ministry of Tourism
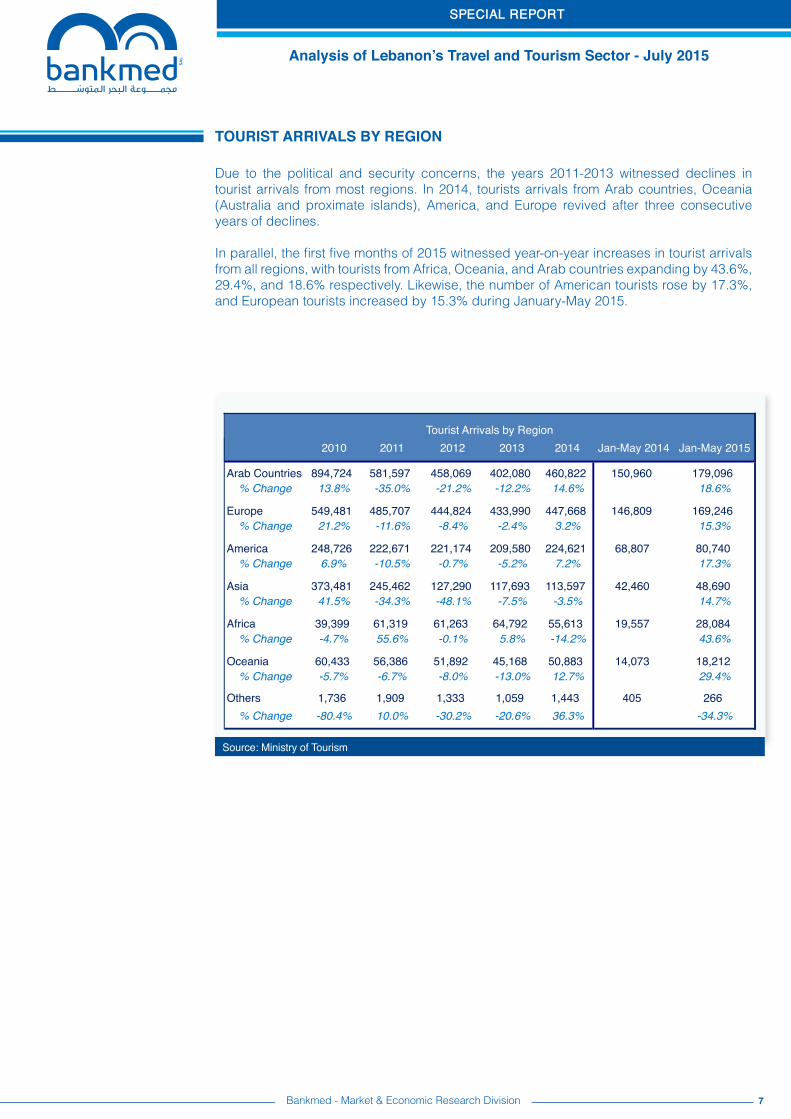
Due to the political and security concerns, the years 2011-2013 witnessed declines in tourist arrivals from most regions. In 2014, tourists arrivals from Arab countries, Oceania (Australia and proximate islands), America, and Europe revived after three consecutive years of declines.
In parallel, the first five months of 2015 witnessed year-on-year increases in tourist arrivals from all regions, with tourists from Africa, Oceania, and Arab countries expanding by 43.6%, 29.4%, and 18.6% respectively. Likewise, the number of American tourists rose by 17.3%, and European tourists increased by 15.3% during January-May 2015.
TouRisT ARRiVAls by ReGion
Bankmed - Market & Economic Research Division
2010 2011 2012 2013 2014 Jan-May 2014 Jan-May 2015
Arab Countries 894,724 581,597 458,069 402,080 460,822 150,960 179,096% Change 13.8% -35.0% -21.2% -12.2% 14.6% 18.6%
Europe 549,481 485,707 444,824 433,990 447,668 146,809 169,246% Change 21.2% -11.6% -8.4% -2.4% 3.2% 15.3%
America 248,726 222,671 221,174 209,580 224,621 68,807 80,740% Change 6.9% -10.5% -0.7% -5.2% 7.2% 17.3%
Asia 373,481 245,462 127,290 117,693 113,597 42,460 48,690% Change 41.5% -34.3% -48.1% -7.5% -3.5% 14.7%
Africa 39,399 61,319 61,263 64,792 55,613 19,557 28,084% Change -4.7% 55.6% -0.1% 5.8% -14.2% 43.6%
Oceania 60,433 56,386 51,892 45,168 50,883 14,073 18,212% Change -5.7% -6.7% -8.0% -13.0% 12.7% 29.4%
Others 1,736 1,909 1,333 1,059 1,443 405 266% Change -80.4% 10.0% -30.2% -20.6% 36.3% -34.3%
Tourist Arrivals by Region
SPECIAL REPORT
Analysis of lebanon’s Travel and Tourism sector - July 2015
8
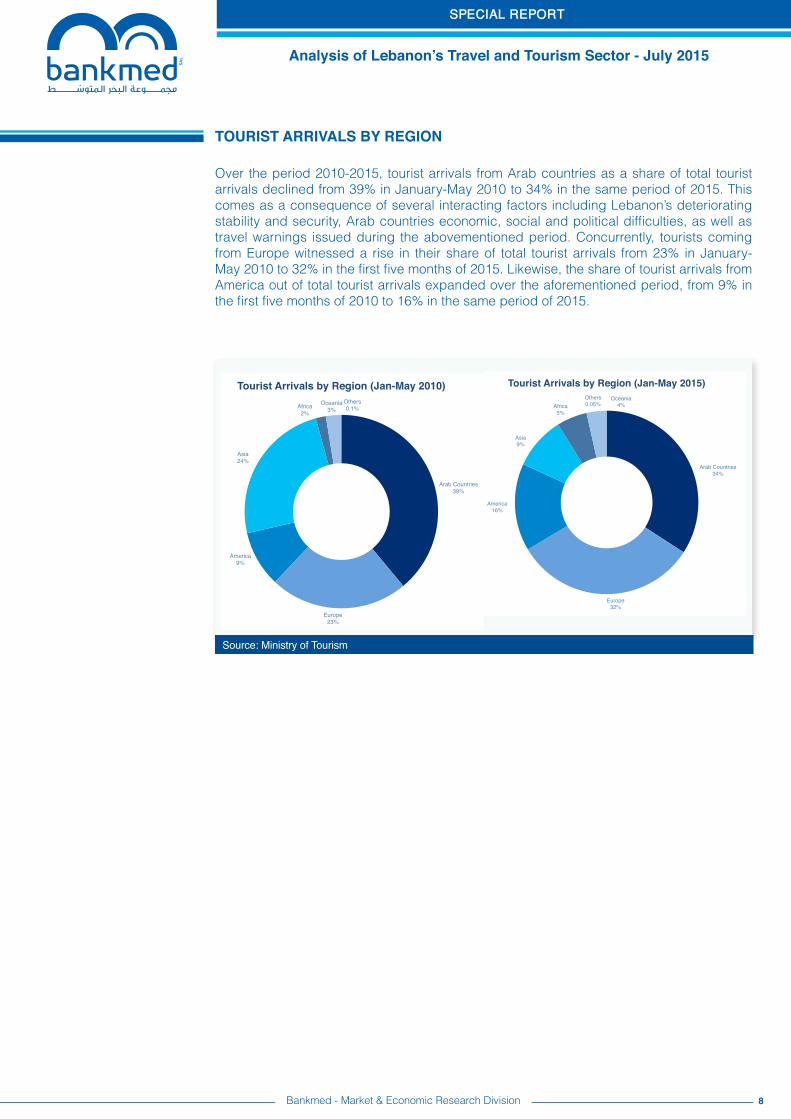
Over the period 2010-2015, tourist arrivals from Arab countries as a share of total tourist arrivals declined from 39% in January-May 2010 to 34% in the same period of 2015. This comes as a consequence of several interacting factors including Lebanon’s deteriorating stability and security, Arab countries economic, social and political difficulties, as well as travel warnings issued during the abovementioned period. Concurrently, tourists coming from Europe witnessed a rise in their share of total tourist arrivals from 23% in January-May 2010 to 32% in the first five months of 2015. Likewise, the share of tourist arrivals from America out of total tourist arrivals expanded over the aforementioned period, from 9% in the first five months of 2010 to 16% in the same period of 2015.
Source: Ministry of Tourism
TouRisT ARRiVAls by ReGion
Bankmed - Market & Economic Research Division
Arab Countries!34%!
Europe!32%!
America!16%!
Asia!9%!
Africa!5%!
Oceania!4%!
Others!0.05%!
Tourist Arrivals by Region (Jan-May 2015)!
Arab Countries!39%!
Europe!23%!
America!9%!
Asia!24%!
Africa!2%!
Oceania!3%!
Others!0.1%!
Tourist Arrivals by Region (Jan-May 2010)!
SPECIAL REPORT
Analysis of lebanon’s Travel and Tourism sector - July 2015
9
arab TourisT arrivals
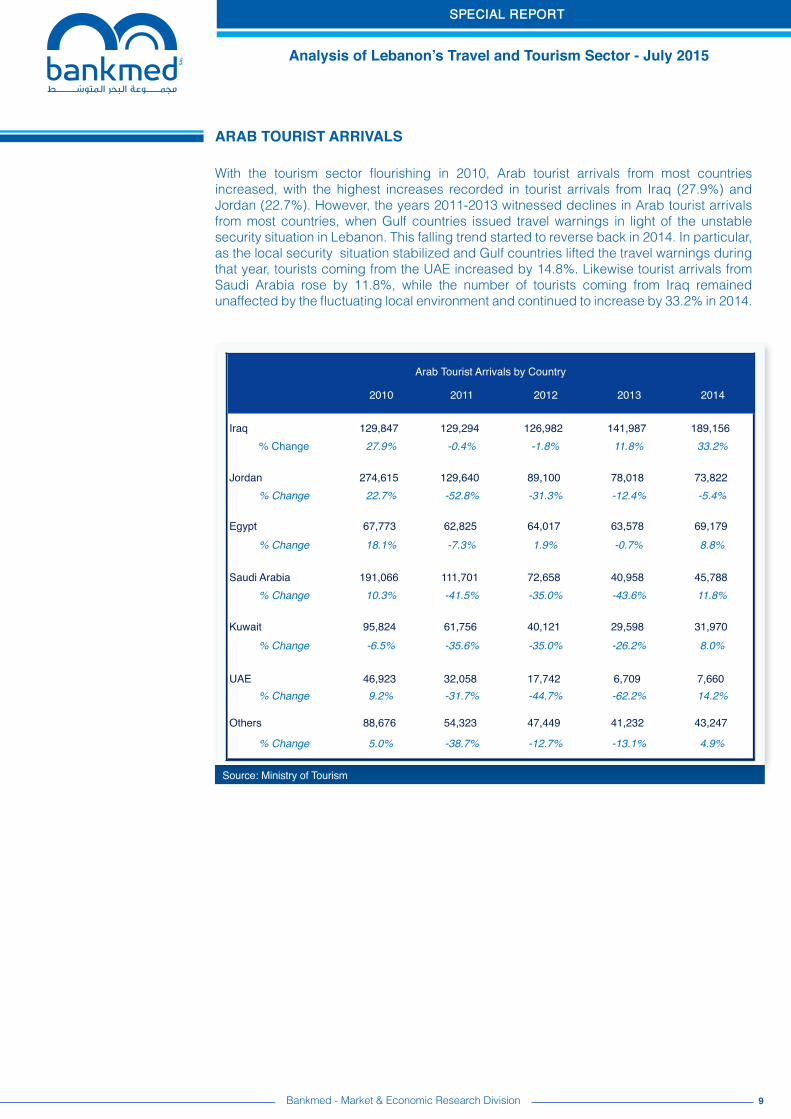
With the tourism sector flourishing in 2010, Arab tourist arrivals from most countries increased, with the highest increases recorded in tourist arrivals from Iraq (27.9%) and Jordan (22.7%). However, the years 2011-2013 witnessed declines in Arab tourist arrivals from most countries, when Gulf countries issued travel warnings in light of the unstable security situation in Lebanon. This falling trend started to reverse back in 2014. In particular, as the local security situation stabilized and Gulf countries lifted the travel warnings during that year, tourists coming from the UAE increased by 14.8%. Likewise tourist arrivals from Saudi Arabia rose by 11.8%, while the number of tourists coming from Iraq remained unaffected by the fluctuating local environment and continued to increase by 33.2% in 2014.
Bankmed - Market & Economic Research Division
Source: Ministry of Tourism
2010 2011 2012 2013 2014
Iraq 129,847 129,294 126,982 141,987 189,156% Change 27.9% -0.4% -1.8% 11.8% 33.2%
Jordan 274,615 129,640 89,100 78,018 73,822% Change 22.7% -52.8% -31.3% -12.4% -5.4%
Egypt 67,773 62,825 64,017 63,578 69,179% Change 18.1% -7.3% 1.9% -0.7% 8.8%
Saudi Arabia 191,066 111,701 72,658 40,958 45,788% Change 10.3% -41.5% -35.0% -43.6% 11.8%
Kuwait 95,824 61,756 40,121 29,598 31,970% Change -6.5% -35.6% -35.0% -26.2% 8.0%
UAE 46,923 32,058 17,742 6,709 7,660% Change 9.2% -31.7% -44.7% -62.2% 14.2%
Others 88,676 54,323 47,449 41,232 43,247
% Change 5.0% -38.7% -12.7% -13.1% 4.9%
Arab Tourist Arrivals by Country
SPECIAL REPORT
Analysis of lebanon’s Travel and Tourism sector - July 2015
10
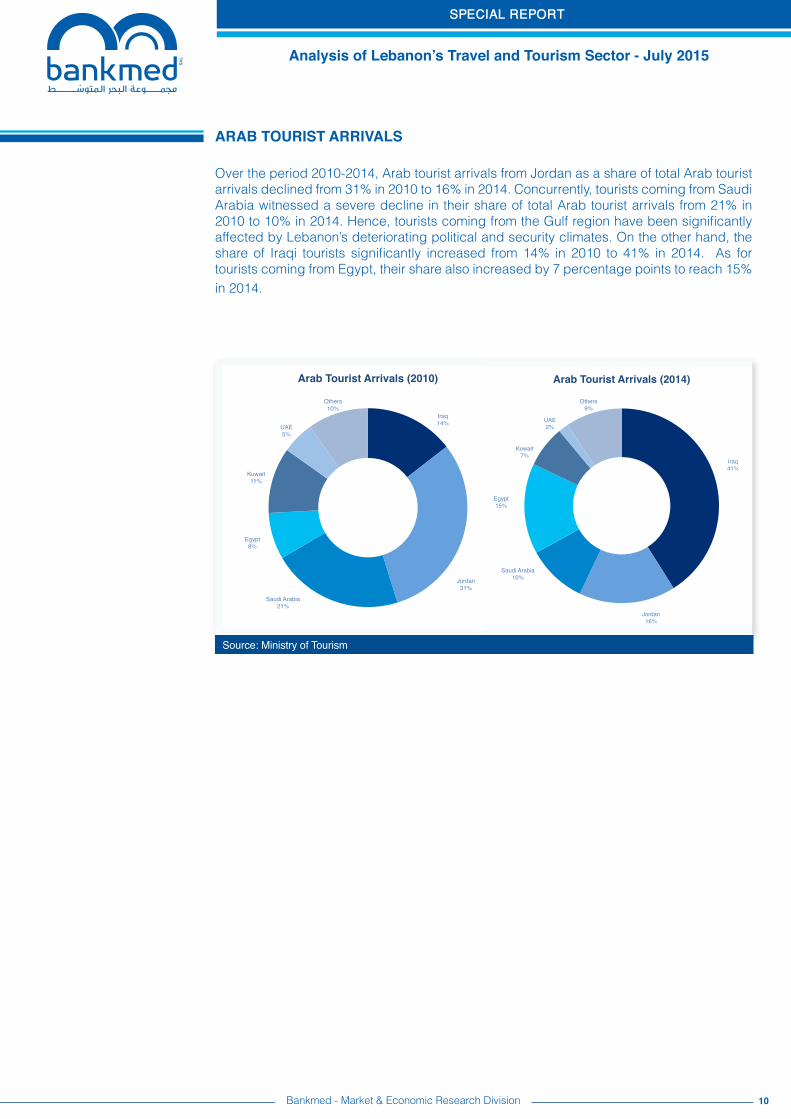
Over the period 2010-2014, Arab tourist arrivals from Jordan as a share of total Arab tourist arrivals declined from 31% in 2010 to 16% in 2014. Concurrently, tourists coming from Saudi Arabia witnessed a severe decline in their share of total Arab tourist arrivals from 21% in 2010 to 10% in 2014. Hence, tourists coming from the Gulf region have been significantly affected by Lebanon’s deteriorating political and security climates. On the other hand, the share of Iraqi tourists significantly increased from 14% in 2010 to 41% in 2014. As for tourists coming from Egypt, their share also increased by 7 percentage points to reach 15% in 2014.
arab TourisT arrivals
Bankmed - Market & Economic Research Division
Source: Ministry of Tourism
Iraq!14%!
Jordan!31%!
Saudi Arabia!21%!
Egypt!8%!
Kuwait!11%!
UAE!5%!
Others!10%!
Arab Tourist Arrivals (2010)!
Iraq!41%!
Jordan!16%!
Saudi Arabia!10%!
Egypt!15%!
Kuwait!7%!
UAE!2%!
Others!9%!
Arab Tourist Arrivals (2014)!
SPECIAL REPORT
Analysis of lebanon’s Travel and Tourism sector - July 2015
11
TouRisTs sPenDinG
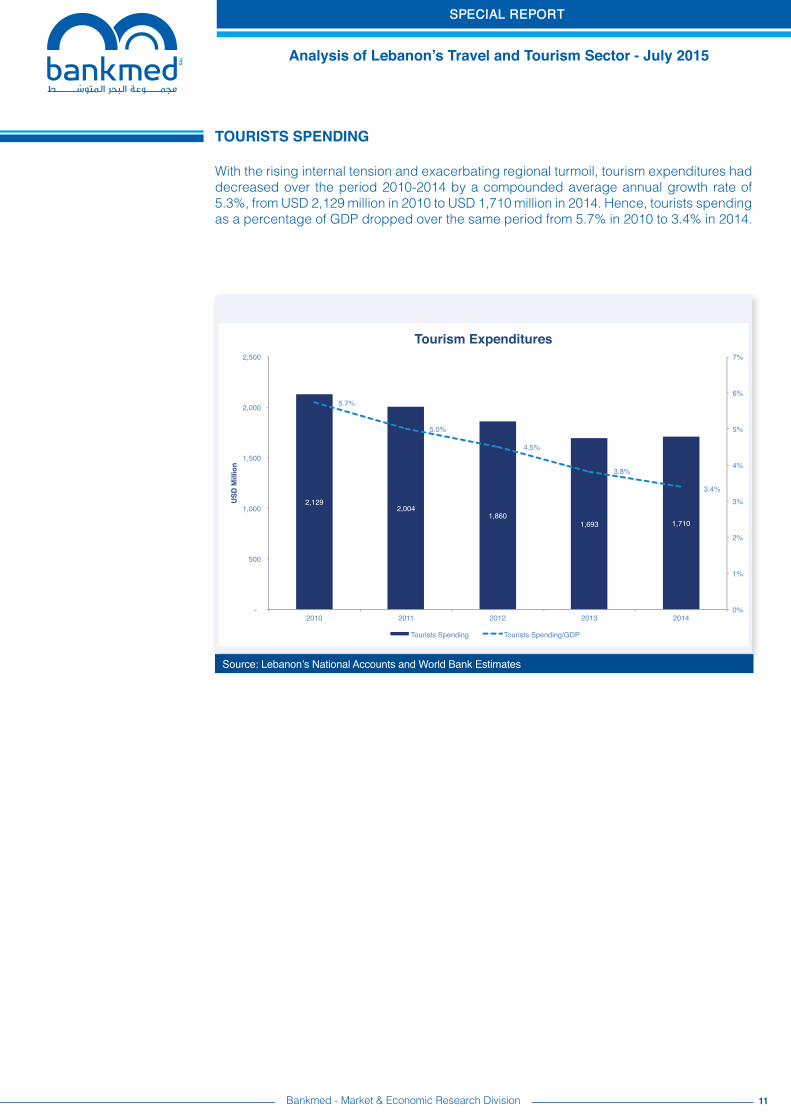
With the rising internal tension and exacerbating regional turmoil, tourism expenditures had decreased over the period 2010-2014 by a compounded average annual growth rate of 5.3%, from USD 2,129 million in 2010 to USD 1,710 million in 2014. Hence, tourists spending as a percentage of GDP dropped over the same period from 5.7% in 2010 to 3.4% in 2014.
Source: Lebanon’s National Accounts and World Bank Estimates
Bankmed - Market & Economic Research Division
SPECIAL REPORT
Analysis of lebanon’s Travel and Tourism sector - July 2015
12
TouRisTs sPenDinG
Bankmed - Market & Economic Research Division
Source: Global Blue Lebanon
Source: Global Blue Lebanon
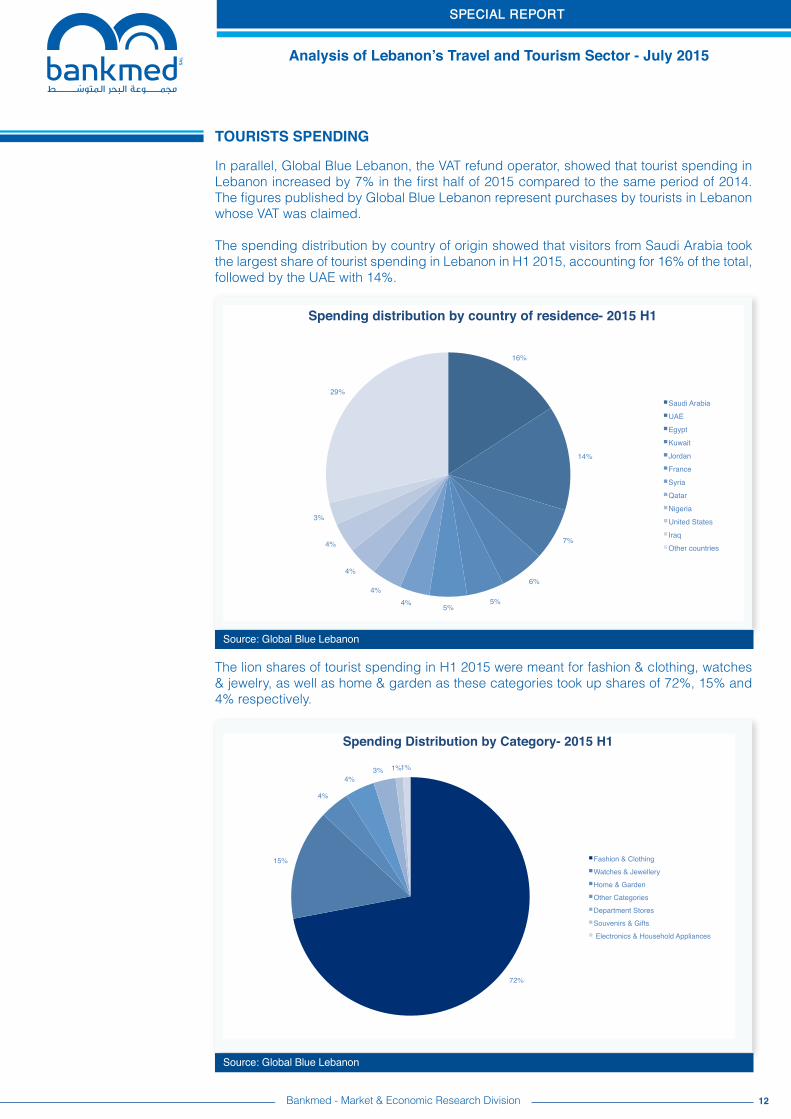
The lion shares of tourist spending in H1 2015 were meant for fashion & clothing, watches & jewelry, as well as home & garden as these categories took up shares of 72%, 15% and 4% respectively.
16%!
14%!
7%!
6%!
5%!5%!4%!
4%!
4%!
4%!
3%!
29%!
Spending distribution by country of residence- 2015 H1!
Saudi Arabia!UAE!Egypt!Kuwait!Jordan!France!Syria!Qatar!Nigeria!United States!Iraq!Other countries!
In parallel, Global Blue Lebanon, the VAT refund operator, showed that tourist spending in Lebanon increased by 7% in the first half of 2015 compared to the same period of 2014. The figures published by Global Blue Lebanon represent purchases by tourists in Lebanon whose VAT was claimed.
The spending distribution by country of origin showed that visitors from Saudi Arabia took the largest share of tourist spending in Lebanon in H1 2015, accounting for 16% of the total, followed by the UAE with 14%.
72%!
15%!
4%!
4%!3%! 1%!1%!
Spending Distribution by Category- 2015 H1!
Fashion & Clothing!Watches & Jewellery!Home & Garden!Other Categories!Department Stores!Souvenirs & Gifts! Electronics & Household Appliances!
SPECIAL REPORT
Analysis of lebanon’s Travel and Tourism sector - July 2015
13
vaT refunds
Bankmed - Market & Economic Research Division
Source: Ministry of Finance, Public Finance Report
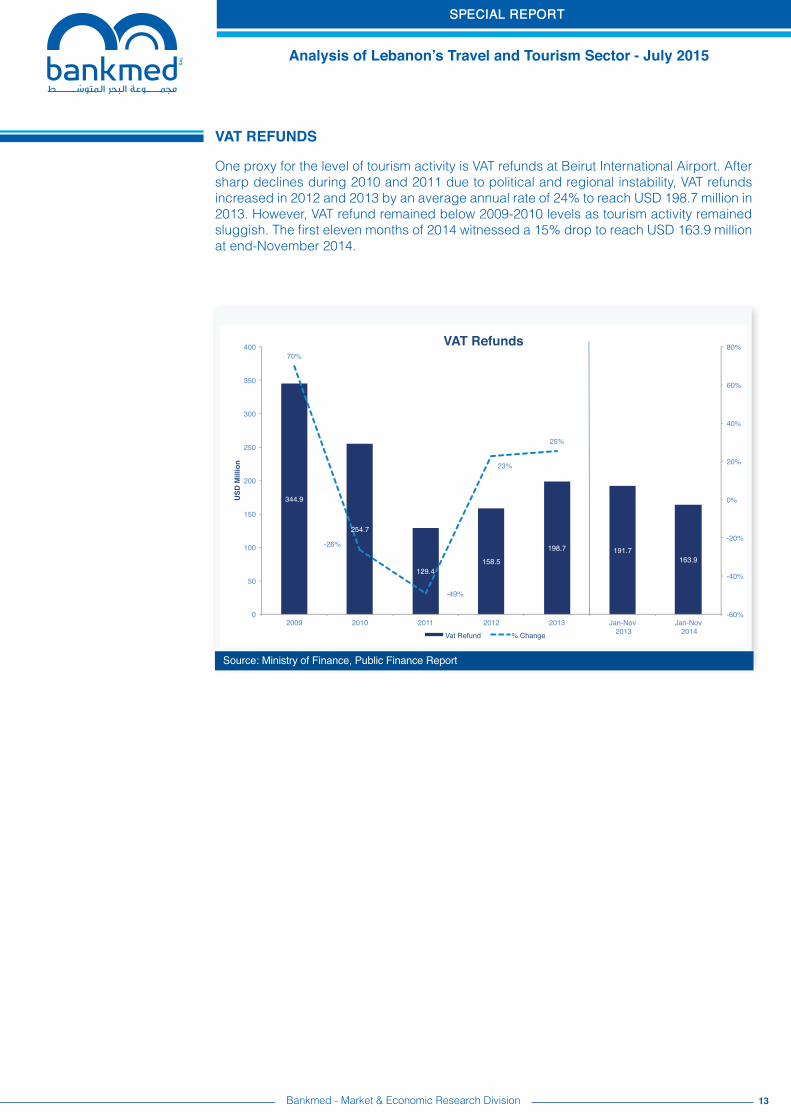
One proxy for the level of tourism activity is VAT refunds at Beirut International Airport. After sharp declines during 2010 and 2011 due to political and regional instability, VAT refunds increased in 2012 and 2013 by an average annual rate of 24% to reach USD 198.7 million in 2013. However, VAT refund remained below 2009-2010 levels as tourism activity remained sluggish. The first eleven months of 2014 witnessed a 15% drop to reach USD 163.9 million at end-November 2014.
SPECIAL REPORT
Analysis of lebanon’s Travel and Tourism sector - July 2015
14Bankmed - Market & Economic Research Division
HoTels PeRfoRmAnCe
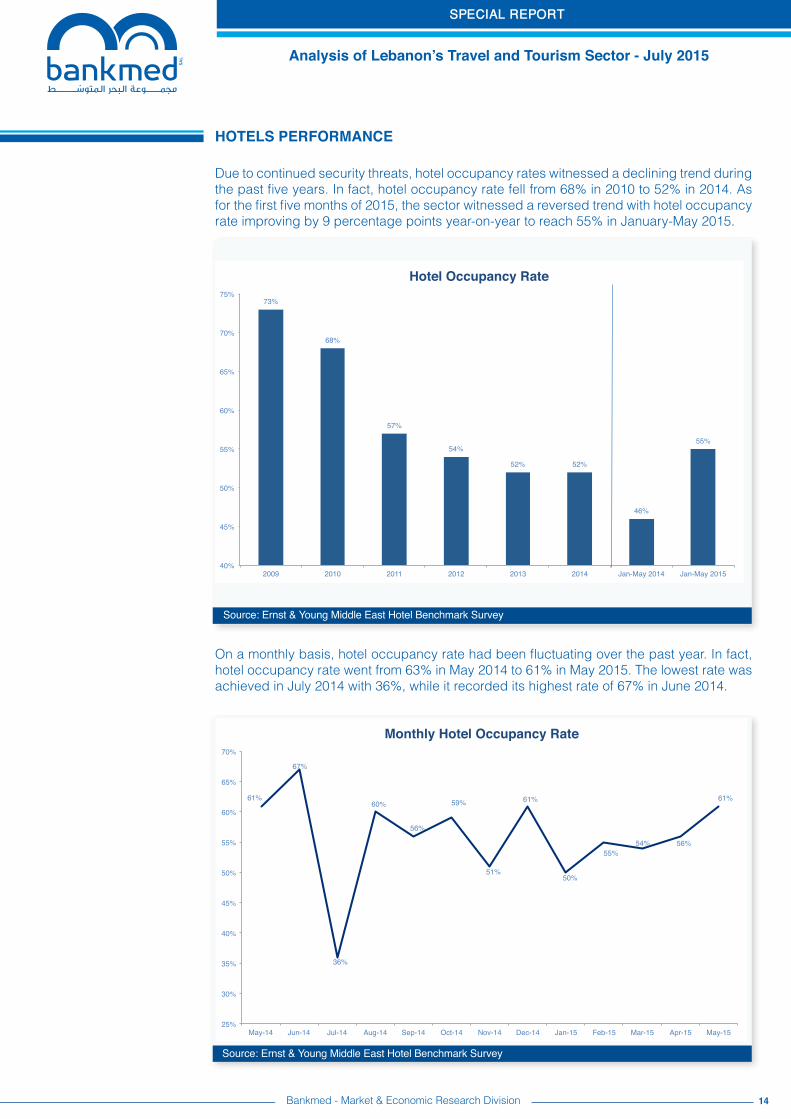
Due to continued security threats, hotel occupancy rates witnessed a declining trend during the past five years. In fact, hotel occupancy rate fell from 68% in 2010 to 52% in 2014. As for the first five months of 2015, the sector witnessed a reversed trend with hotel occupancy rate improving by 9 percentage points year-on-year to reach 55% in January-May 2015.
On a monthly basis, hotel occupancy rate had been fluctuating over the past year. In fact, hotel occupancy rate went from 63% in May 2014 to 61% in May 2015. The lowest rate was achieved in July 2014 with 36%, while it recorded its highest rate of 67% in June 2014.
Source: Ernst & Young Middle East Hotel Benchmark Survey
Source: Ernst & Young Middle East Hotel Benchmark Survey
73%!
68%!
57%!
54%!
52%! 52%!
46%!
55%!
40%!
45%!
50%!
55%!
60%!
65%!
70%!
75%!
2009! 2010! 2011! 2012! 2013! 2014! Jan-May 2014! Jan-May 2015!
Hotel Occupancy Rate!
61%!
67%!
36%!
60%!
56%!
59%!
51%!
61%!
50%!
55%!54%! 56%!
61%!
25%!
30%!
35%!
40%!
45%!
50%!
55%!
60%!
65%!
70%!
May-14! Jun-14! Jul-14! Aug-14! Sep-14! Oct-14! Nov-14! Dec-14! Jan-15! Feb-15! Mar-15! Apr-15! May-15!
Monthly Hotel Occupancy Rate!
SPECIAL REPORT
Analysis of lebanon’s Travel and Tourism sector - July 2015
15
Source: Ernst & Young Middle East Hotel Benchmark Survey
Source: Ernst & Young Middle East Hotel Benchmark Survey
Bankmed - Market & Economic Research Division
HoTels PeRfoRmAnCe
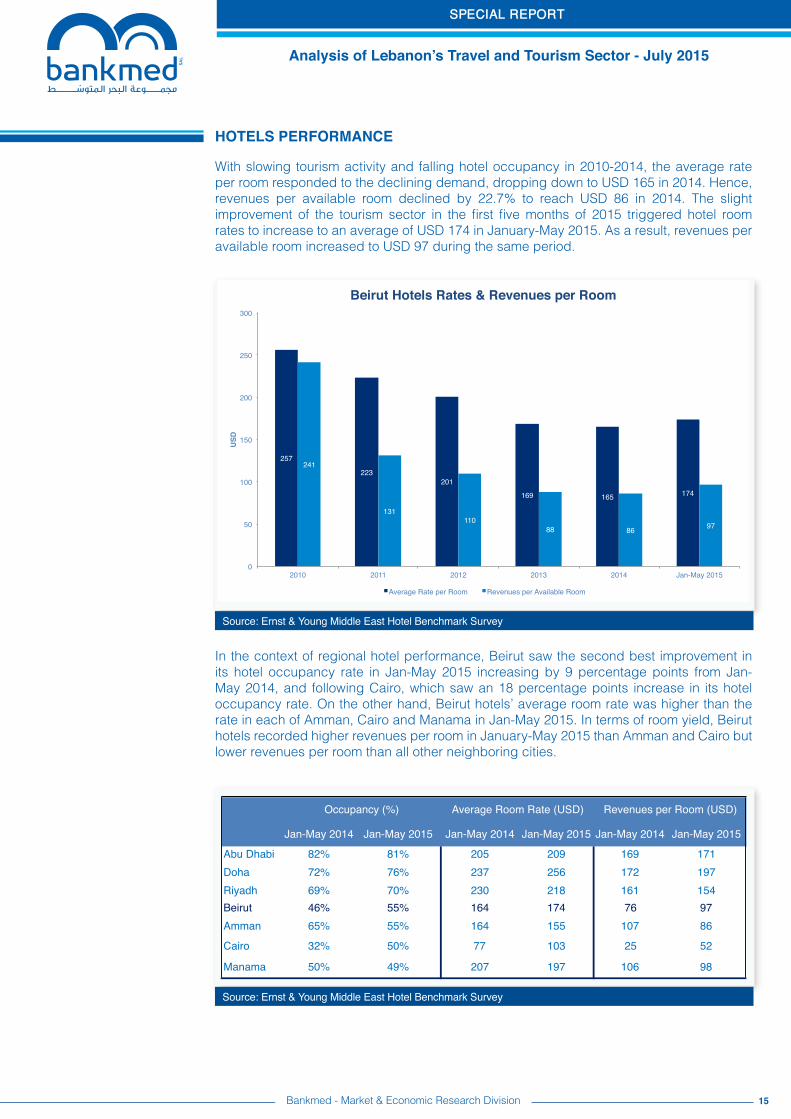
With slowing tourism activity and falling hotel occupancy in 2010-2014, the average rate per room responded to the declining demand, dropping down to USD 165 in 2014. Hence, revenues per available room declined by 22.7% to reach USD 86 in 2014. The slight improvement of the tourism sector in the first five months of 2015 triggered hotel room rates to increase to an average of USD 174 in January-May 2015. As a result, revenues per available room increased to USD 97 during the same period.
In the context of regional hotel performance, Beirut saw the second best improvement in its hotel occupancy rate in Jan-May 2015 increasing by 9 percentage points from Jan-May 2014, and following Cairo, which saw an 18 percentage points increase in its hotel occupancy rate. On the other hand, Beirut hotels’ average room rate was higher than the rate in each of Amman, Cairo and Manama in Jan-May 2015. In terms of room yield, Beirut hotels recorded higher revenues per room in January-May 2015 than Amman and Cairo but lower revenues per room than all other neighboring cities.
257!
223!201!
169! 165! 174!
241!
131!110!
88! 86! 97!
0!
50!
100!
150!
200!
250!
300!
2010! 2011! 2012! 2013! 2014! Jan-May 2015!
USD!
Beirut Hotels Rates & Revenues per Room!
Average Rate per Room! Revenues per Available Room!
Jan-May 2014 Jan-May 2015 Jan-May 2014 Jan-May 2015 Jan-May 2014 Jan-May 2015
Abu Dhabi 82% 81% 205 209 169 171Doha 72% 76% 237 256 172 197Riyadh 69% 70% 230 218 161 154Beirut 46% 55% 164 174 76 97Amman 65% 55% 164 155 107 86
Cairo 32% 50% 77 103 25 52
Manama 50% 49% 207 197 106 98
Occupancy (%) Average Room Rate (USD) Revenues per Room (USD)
SPECIAL REPORT
Analysis of lebanon’s Travel and Tourism sector - July 2015
16
Source: Travel and Tourism Competitiveness Index Report 2015
Bankmed - Market & Economic Research Division
TRAVel AnD TouRism ComPeTiTiVeness inDex
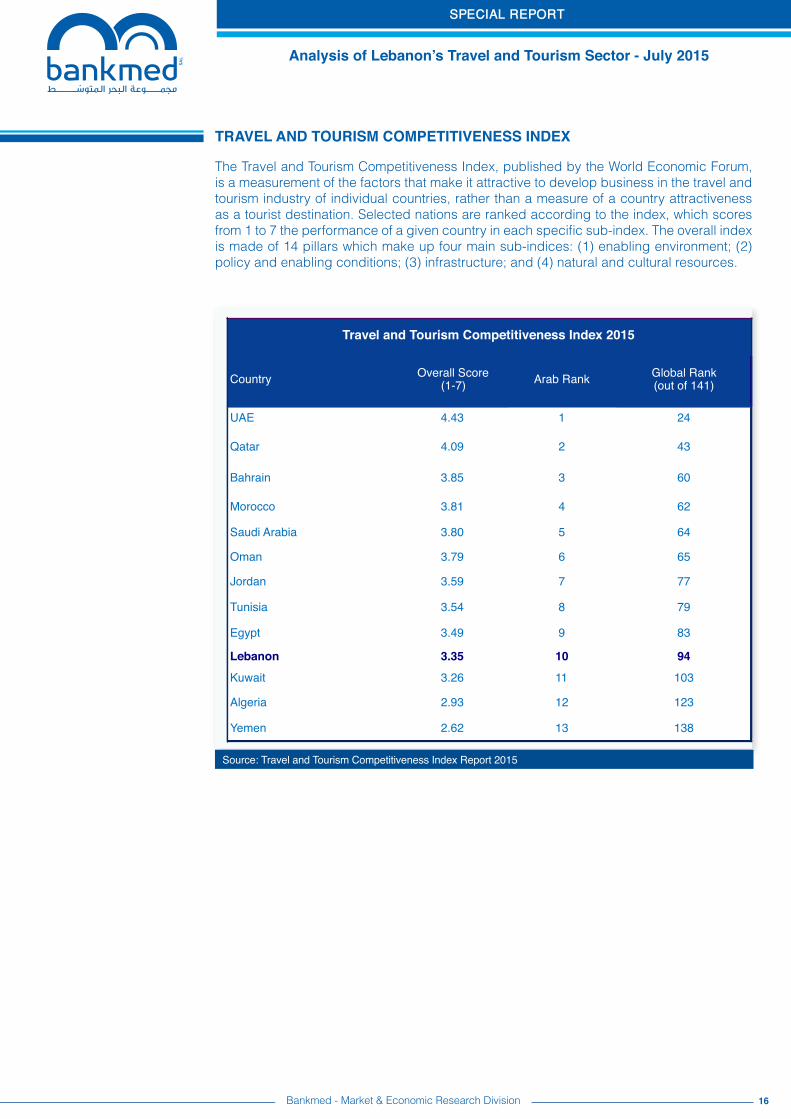
The Travel and Tourism Competitiveness Index, published by the World Economic Forum, is a measurement of the factors that make it attractive to develop business in the travel and tourism industry of individual countries, rather than a measure of a country attractiveness as a tourist destination. Selected nations are ranked according to the index, which scores from 1 to 7 the performance of a given country in each specific sub-index. The overall index is made of 14 pillars which make up four main sub-indices: (1) enabling environment; (2) policy and enabling conditions; (3) infrastructure; and (4) natural and cultural resources.
Country Overall Score(1-7) Arab Rank Global Rank
(out of 141)
UAE 4.43 1 24
Qatar 4.09 2 43
Bahrain 3.85 3 60
Morocco 3.81 4 62
Saudi Arabia 3.80 5 64
Oman 3.79 6 65
Jordan 3.59 7 77
Tunisia 3.54 8 79
Egypt 3.49 9 83
Lebanon 3.35 10 94
Kuwait 3.26 11 103
Algeria 2.93 12 123
Yemen 2.62 13 138
Travel and Tourism Competitiveness Index 2015
SPECIAL REPORT
Analysis of lebanon’s Travel and Tourism sector - July 2015
17
Source: Travel and Tourism Competitiveness Index Report 2015
Bankmed - Market & Economic Research Division
TRAVel AnD TouRism ComPeTiTiVeness inDex
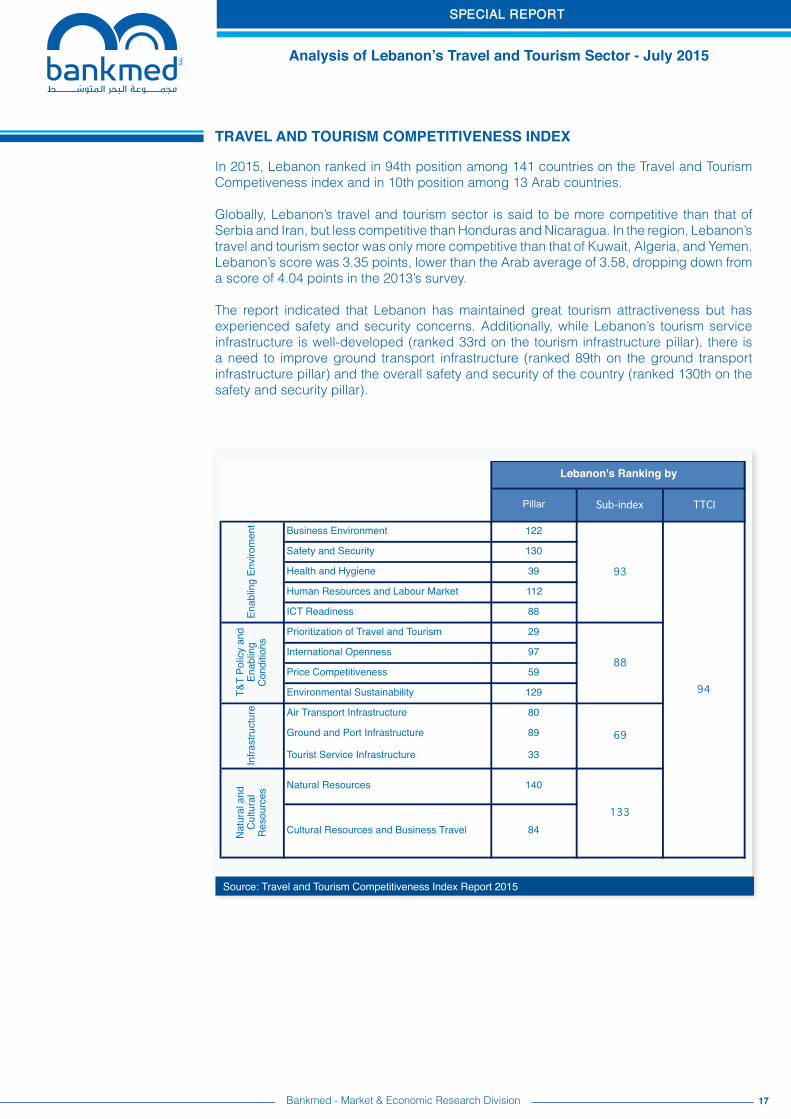
In 2015, Lebanon ranked in 94th position among 141 countries on the Travel and Tourism Competiveness index and in 10th position among 13 Arab countries.
Globally, Lebanon’s travel and tourism sector is said to be more competitive than that of Serbia and Iran, but less competitive than Honduras and Nicaragua. In the region, Lebanon’s travel and tourism sector was only more competitive than that of Kuwait, Algeria, and Yemen. Lebanon’s score was 3.35 points, lower than the Arab average of 3.58, dropping down from a score of 4.04 points in the 2013’s survey.
The report indicated that Lebanon has maintained great tourism attractiveness but has experienced safety and security concerns. Additionally, while Lebanon’s tourism service infrastructure is well-developed (ranked 33rd on the tourism infrastructure pillar), there is a need to improve ground transport infrastructure (ranked 89th on the ground transport infrastructure pillar) and the overall safety and security of the country (ranked 130th on the safety and security pillar).
Pillar Sub-index TTCI
Business Environment 122
Safety and Security 130
Health and Hygiene 39
Human Resources and Labour Market 112
ICT Readiness 88
Prioritization of Travel and Tourism 29
International Openness 97
Price Competitiveness 59
Environmental Sustainability 129
Air Transport Infrastructure 80
Ground and Port Infrastructure 89
Tourist Service Infrastructure 33
Natural Resources 140
Cultural Resources and Business Travel 84Nat
ural
and
C
ultu
ral
Res
ourc
es
88
69
133
94
Lebanon's Ranking by
Enab
ling
Envi
rom
ent
93
T&T
Polic
y an
d En
ablin
g C
ondi
tions
Infra
stru
ctur
e
SPECIAL REPORT
Analysis of lebanon’s Travel and Tourism sector - July 2015
Source: Bankmed Research
Disclaimer:This material has been prepared by Bankmed sal based on publicly available information and personal analysis. It is provided for information purposes only. It is not intended to be used as a research tool nor as a basis or reference for any decision. The information contained herein including any opinion, news and analysis, is based on various publicly available sources believed to be reliable but its accuracy cannot be guaranteed and may be subject to change without notice. Bankmed, sal does not guarantee the accuracy, timeliness, continued availability or completeness of such information. All data contained herein are indicative. Neither the information provided nor any opinion expressed therein, constitutes a solicitation, offer, personal recommendation or advice. Bankmed, sal does not assume any liability for direct, indirect, incidental or consequential damages resulting from any use of the information contained herein.
mazen soueid, stephanie Ghanem, Ziad Hariri, Rita nehme
sWoT Analysis: lebanon Travel & Tourism sector
18
sWoT analysis
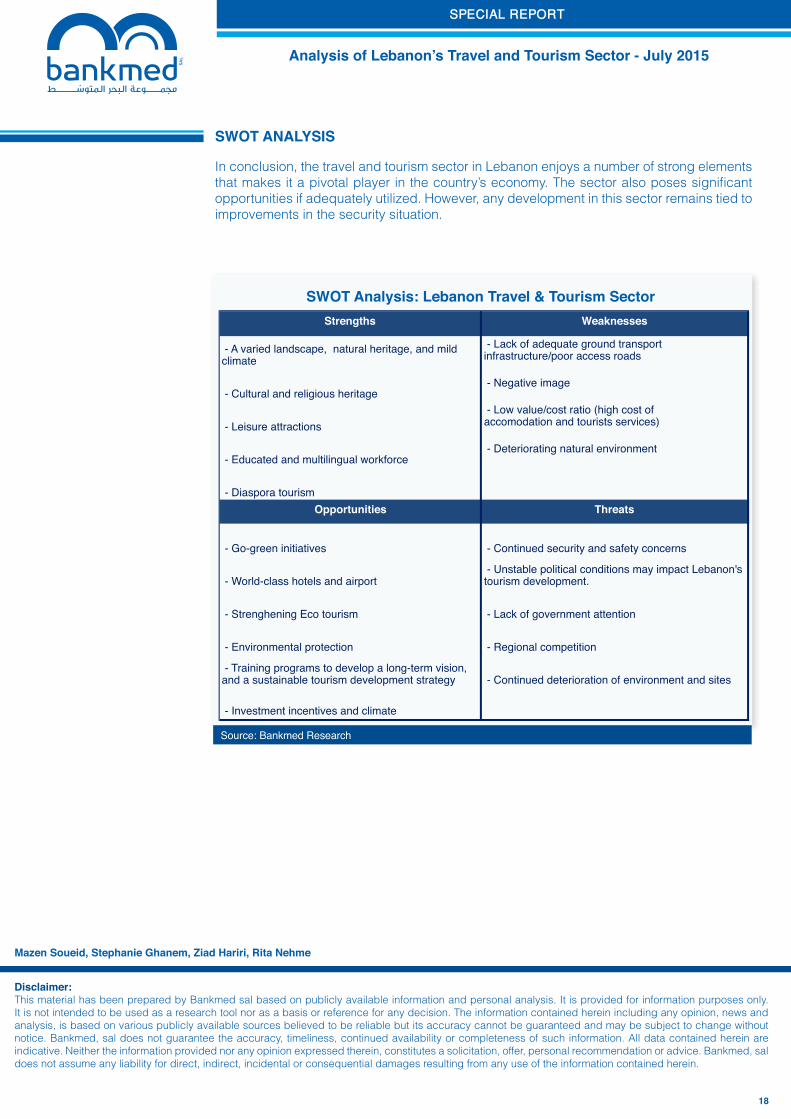
In conclusion, the travel and tourism sector in Lebanon enjoys a number of strong elements that makes it a pivotal player in the country’s economy. The sector also poses significant opportunities if adequately utilized. However, any development in this sector remains tied to improvements in the security situation.
Strengths Weaknesses
- A varied landscape, natural heritage, and mild climate
- Lack of adequate ground transport infrastructure/poor access roads
- Cultural and religious heritage - Negative image
- Leisure attractions - Low value/cost ratio (high cost of accomodation and tourists services)
- Educated and multilingual workforce - Deteriorating natural environment
- Diaspora tourismOpportunities Threats
- Go-green initiatives - Continued security and safety concerns
- World-class hotels and airport - Unstable political conditions may impact Lebanon's tourism development.
- Strenghening Eco tourism - Lack of government attention
- Environmental protection - Regional competition
- Training programs to develop a long-term vision, and a sustainable tourism development strategy - Continued deterioration of environment and sites
- Investment incentives and climate