Embed Size (px)
Citation preview
Copyright © 2017 by The Segal Group, Inc. All rights reserved.
Nevada Public Employees'
ANALYSIS OF INVESTMENT PERFORMANCE
Deferred Compensation Plan March 31, 2017
Francis Picarelli Senior Vice President

T
AM
Ta b l e
ANALYSIS OFMarch 2014
Financial
Administration Review
Investme
o f C o
F INVESTMEN
Market Condition
ent Manager Perfo
n t e n t s
NT PERFORM
ns .......................
...............................
ormance .............
s
MANCE
...........................
...........................
...........................
...........................
...........................
...........................
...........................
...........................
...........................
...........................
...........................
...........................
...........................
...........................
...........................
.... 1
.... 2
.... 3
1

2

0
Financial Market Conditions
3

Summary of Investment Returns
Q1 2017 In Review
6.4% 5.7%7.3%
11.5%
0.8%2.0%
-2.3%
1.6%3.8%
2.4%
14.8%
18.1%
11.7%
17.2%
0.4%
-4.8%
8.7%7.3%
9.1%
6.2%
-6%-4%-2%0%2%4%6%8%
10%12%14%16%18%20%
World Equities* U.S. Equities InternationalEquities*
EMEquities*
U.S. Fixed Income International FixedIncome
Commodities Real Estate Private Equity** Funds of HedgeFunds
QTD 1-Year
Quarterly Synopsis • World equity markets were positive due to continued optimism about the U.S. economy and signs of growth in Europe.• U.S. equity gained in Q1 with solid corporate earnings and optimism that economic growth will continue.• International equity rose as economic fundamentals in Europe improved and the dollar struggled.• Emerging market equity surged in Q1 with stronger Asian economic data and declining nervousness about U.S. trade policy.• U.S. fixed income was nearly flat as investors anticipate further U.S. interest rate hikes after March’s rate increase.• Non-U.S. fixed income was positive for the quarter with investors gravitating toward bonds amid political uncertainty.• Hedge funds benefited from rising stock markets, and particularly from gains in technology and healthcare.
* Net of Dividends** Performance reported as of Q3 2016 because Q4 2016 and Q1 2017 performance data is not yet available.Sources: eVestment Alliance, Hueler Analytics, Investment Metrics, Thomson One
4

* Net of Dividends** Performance reported as of Q3 2016 because Q4 2016 and Q1 2017 performance data is not yet available.Sources: eVestment Alliance, Hueler Analytics, Investment Metrics, Thomson One
Q1 2017 In Review: Index Returns
Asset Class Indices QTD YTD 1-Year 3-Year 5-Year 10-Year
World Equity MSCI World* 6.38 6.38 14.77 5.52 9.37 4.21
U.S. Equity Russell 3000 5.74 5.74 18.07 9.76 13.18 7.54
Non-U.S. Equity MSCI EAFE* 7.25 7.25 11.67 0.50 5.83 1.05
Emerging Market Equity MSCI EM* 11.45 11.45 17.22 1.18 0.81 2.72
U.S. Fixed Income Bloomberg Barclays U.S. Aggregate 0.82 0.82 0.44 2.68 2.34 4.27
Non-U.S. Fixed Income Citigroup Non-U.S. WGBI(Unhedged) 2.02 2.02 -4.79 -2.56 -1.50 2.64
Commodities Bloomberg Commodity Index -2.33 -2.33 8.69 -13.92 -9.54 -6.22
Private Real Estate NCREIF NPI 1.55 1.55 7.27 10.58 10.69 6.72
Private Equity Thomson Reuters Private Equity*** 3.80 6.84 9.08 12.24 13.41 10.37
Hedge Funds HFRI Fund of Funds Composite 2.39 2.39 6.23 1.80 3.22 1.24
5
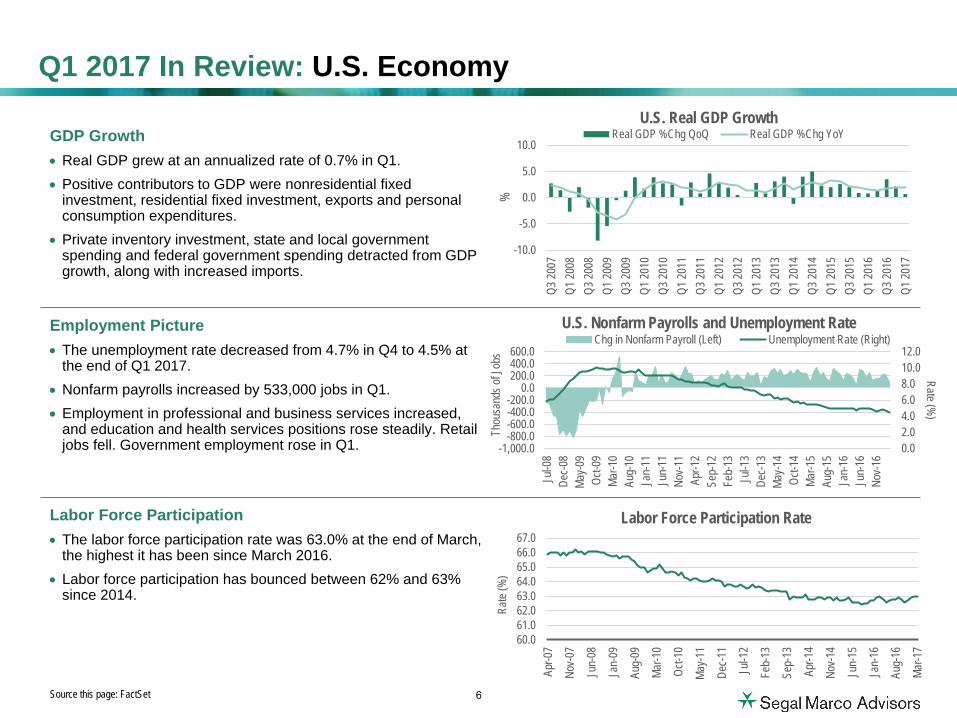
GDP Growth• Real GDP grew at an annualized rate of 0.7% in Q1.• Positive contributors to GDP were nonresidential fixed
investment, residential fixed investment, exports and personalconsumption expenditures.
• Private inventory investment, state and local governmentspending and federal government spending detracted from GDPgrowth, along with increased imports.
Employment Picture• The unemployment rate decreased from 4.7% in Q4 to 4.5% at
the end of Q1 2017.• Nonfarm payrolls increased by 533,000 jobs in Q1.• Employment in professional and business services increased,
and education and health services positions rose steadily. Retailjobs fell. Government employment rose in Q1.
Labor Force Participation• The labor force participation rate was 63.0% at the end of March,
the highest it has been since March 2016.• Labor force participation has bounced between 62% and 63%
since 2014.
Q1 2017 In Review: U.S. Economy
60.061.062.063.064.065.066.067.0
Apr-0
7
Nov-0
7
Jun-
08
Jan-
09
Aug-
09
Mar-1
0
Oct-1
0
May-1
1
Dec-1
1
Jul-1
2
Feb-
13
Sep-
13
Apr-1
4
Nov-1
4
Jun-
15
Jan-
16
Aug-
16
Mar-1
7
Rate
(%)
Labor Force Participation Rate
-10.0
-5.0
0.0
5.0
10.0
Q3 20
07Q1
2008
Q3 20
08Q1
2009
Q3 20
09Q1
2010
Q3 20
10Q1
2011
Q3 20
11Q1
2012
Q3 20
12Q1
2013
Q3 20
13Q1
2014
Q3 20
14Q1
2015
Q3 20
15Q1
2016
Q3 20
16Q1
2017
%
U.S. Real GDP GrowthReal GDP %Chg QoQ Real GDP %Chg YoY
0.02.04.06.08.010.012.0
-1,000.0-800.0-600.0-400.0-200.0
0.0200.0400.0600.0
Jul-0
8De
c-08
May-0
9Oc
t-09
Mar-1
0Au
g-10
Jan-
11Ju
n-11
Nov-1
1Ap
r-12
Sep-
12Fe
b-13
Jul-1
3De
c-13
May-1
4Oc
t-14
Mar-1
5Au
g-15
Jan-
16Ju
n-16
Nov-1
6
Rate (%)
Thou
sand
s of J
obs
U.S. Nonfarm Payrolls and Unemployment RateChg in Nonfarm Payroll (Left) Unemployment Rate (Right)
Source this page: FactSet 6

Consumer Confidence and Spending• Consumer confidence continued its post-Presidential election
surge in Q1, reaching a level of 126.• However, personal consumption expenditures fell a bit during
the quarter.• The election of President Donald Trump spurred optimism that
economic growth would continue, but people were lessoptimistic about their own financial situations.
Retail Sales• Retail sales rose in Q1 but weakened in March.• Retail sales ex motor vehicle sales slid late in the quarter.
Home Prices• Home prices rose 1.5 percent in the fourth quarter*.• Though interest rates rose in December, home prices are not
expected to decline any time soon.• Unusually low housing inventories continue to support home
price gains.
Q1 2017 In Review: U.S. Economy
*The most recent quarterly data available.Source this page: FactSet
-30.00-20.00-10.00
0.0010.0020.00
Apr-0
7Au
g-07
Dec-0
7Ap
r-08
Aug-
08De
c-08
Apr-0
9Au
g-09
Dec-0
9Ap
r-10
Aug-
10De
c-10
Apr-1
1Au
g-11
Dec-1
1Ap
r-12
Aug-
12De
c-12
Apr-1
3Au
g-13
Dec-1
3Ap
r-14
Aug-
14De
c-14
Apr-1
5Au
g-15
Dec-1
5Ap
r-16
Aug-
16De
c-16
S&P/Case-Shiller Composite 20 Home Price Index (% 1 Yr.)
-15.0-10.0
-5.00.05.0
10.0
Apr-0
7Se
p-07
Feb-
08Ju
l-08
Dec-0
8Ma
y-09
Oct-0
9Ma
r-10
Aug-
10Ja
n-11
Jun-
11No
v-11
Apr-1
2Se
p-12
Feb-
13Ju
l-13
Dec-1
3Ma
y-14
Oct-1
4Ma
r-15
Aug-
15Ja
n-16
Jun-
16No
v-16
U.S. Retail Sales(% 1YR) Retail Sales, Total, SA(% 1YR) Retail Sales, Ex. Motor Vehicle & Parts Dealers, SA
8,5009,0009,50010,00010,50011,00011,50012,000
0.020.040.060.080.0
100.0120.0140.0
Jul-0
7No
v-07
Mar-0
8Ju
l-08
Nov-0
8Ma
r-09
Jul-0
9No
v-09
Mar-1
0Ju
l-10
Nov-1
0Ma
r-11
Jul-1
1No
v-11
Mar-1
2Ju
l-12
Nov-1
2Ma
r-13
Jul-1
3No
v-13
Mar-1
4Ju
l-14
Nov-1
4Ma
r-15
Jul-1
5No
v-15
Mar-1
6Ju
l-16
Nov-1
6Ma
r-17
Consumer Confidence and SpendingConsumer Confidence Index (Left) Personal Consumption Expenditures (Right)
7

Monetary Policies/Global Interest Rates• Central bank deposit rates remain negative in most developed
markets.• The United States is the exception—the Federal Reserve raised
its policy rate in March and indicated that more hikes were likelyin 2017.
World GDP Growth• Japan GDP growth was predicted to be higher in Q4, but was
relatively flat amid declining government investment.• Eurozone GDP growth rose only slightly. Household
consumption drove growth but net external demand wasnegative.
Global Employment Picture• Unemployment in developed countries was relatively flat in the
quarter.• Eurozone unemployment edged a bit lower in Q1. German
unemployment was at a post reunification low, though France’swas flat.
• Japan’s unemployment rate fell to 2.8% in February from 3.1% inDecember.
Q1 2017 In Review: Global Economy
0.0
5.0
10.0
15.0Ju
n-07
Sep-
07De
c-07
Mar-0
8Ju
n-08
Sep-
08De
c-08
Mar-0
9Ju
n-09
Sep-
09De
c-09
Mar-1
0Ju
n-10
Sep-
10De
c-10
Mar-1
1Ju
n-11
Sep-
11De
c-11
Mar-1
2Ju
n-12
Sep-
12De
c-12
Mar-1
3Ju
n-13
Sep-
13De
c-13
Mar-1
4Ju
n-14
Sep-
14De
c-14
Mar-1
5Ju
n-15
Sep-
15De
c-15
Mar-1
6Ju
n-16
Sep-
16De
c-16
Mar-1
7
Rate
%International Unemployment Rates
Eurozone Germany Japan UK USA
-10.0
-5.0
0.0
5.0
Sep-
07
Mar-0
8
Sep-
08
Mar-0
9
Sep-
09
Mar-1
0
Sep-
10
Mar-1
1
Sep-
11
Mar-1
2
Sep-
12
Mar-1
3
Sep-
13
Mar-1
4
Sep-
14
Mar-1
5
Sep-
15
Mar-1
6
Sep-
16
Mar-1
7
%
Real GDP (QoQ %)Eurozone Japan USA China*
*Quarter over quarter data calculations began in 2011Source this page: FactSet
-0.50.00.51.01.5
6/30/2
012
9/30/2
012
12/31
/2012
3/31/2
013
6/30/2
013
9/30/2
013
12/31
/2013
3/31/2
014
6/30/2
014
9/30/2
014
12/31
/2014
3/31/2
015
6/30/2
015
9/30/2
015
12/31
/2015
3/31/2
016
6/30/2
016
9/30/2
016
12/31
/2016
3/31/2
017
%
Central Bank Target RatesJapan Uncollateralized O/N Call Target Rate Eurozone Deposit Facility RateFed Fund Target Rate
8
U.S. Equity
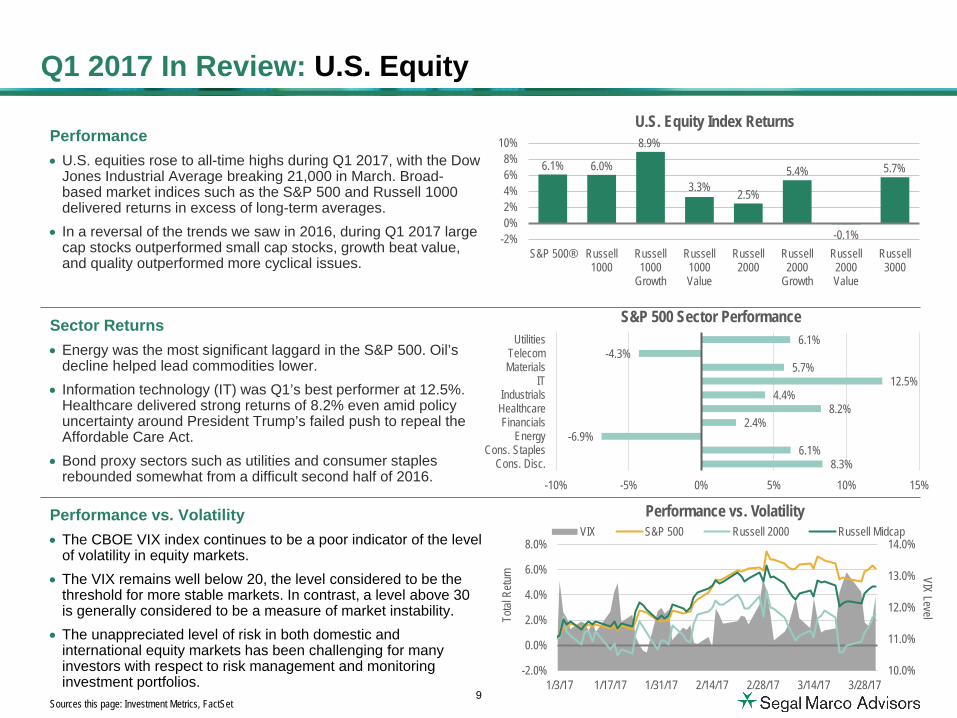
Performance• U.S. equities rose to all-time highs during Q1 2017, with the Dow
Jones Industrial Average breaking 21,000 in March. Broad-based market indices such as the S&P 500 and Russell 1000delivered returns in excess of long-term averages.
• In a reversal of the trends we saw in 2016, during Q1 2017 largecap stocks outperformed small cap stocks, growth beat value,and quality outperformed more cyclical issues.
Sector Returns• Energy was the most significant laggard in the S&P 500. Oil’s
decline helped lead commodities lower.• Information technology (IT) was Q1’s best performer at 12.5%.
Healthcare delivered strong returns of 8.2% even amid policyuncertainty around President Trump’s failed push to repeal theAffordable Care Act.
• Bond proxy sectors such as utilities and consumer staplesrebounded somewhat from a difficult second half of 2016.
Performance vs. Volatility• The CBOE VIX index continues to be a poor indicator of the level
of volatility in equity markets.• The VIX remains well below 20, the level considered to be the
threshold for more stable markets. In contrast, a level above 30is generally considered to be a measure of market instability.
• The unappreciated level of risk in both domestic andinternational equity markets has been challenging for manyinvestors with respect to risk management and monitoringinvestment portfolios.
8.3%6.1%
-6.9%2.4%
8.2%4.4%
12.5%5.7%
-4.3%6.1%
-10% -5% 0% 5% 10% 15%
Cons. Disc.Cons. Staples
EnergyFinancials
HealthcareIndustrials
ITMaterialsTelecom
Utilities
S&P 500 Sector Performance
6.1% 6.0%
8.9%
3.3% 2.5%
5.4%
-0.1%
5.7%
-2%0%2%4%6%8%
10%
S&P 500® Russell1000
Russell1000
Growth
Russell1000Value
Russell2000
Russell2000
Growth
Russell2000Value
Russell3000
U.S. Equity Index Returns
10.0%
11.0%
12.0%
13.0%
14.0%
-2.0%
0.0%
2.0%
4.0%
6.0%
8.0%
1/3/17 1/17/17 1/31/17 2/14/17 2/28/17 3/14/17 3/28/17
VIX LevelTotal
Retu
rnPerformance vs. Volatility
VIX S&P 500 Russell 2000 Russell Midcap
Sources this page: Investment Metrics, FactSet
Q1 2017 In Review: U.S. Equity
9
Q1 2017 In Review: International Equity
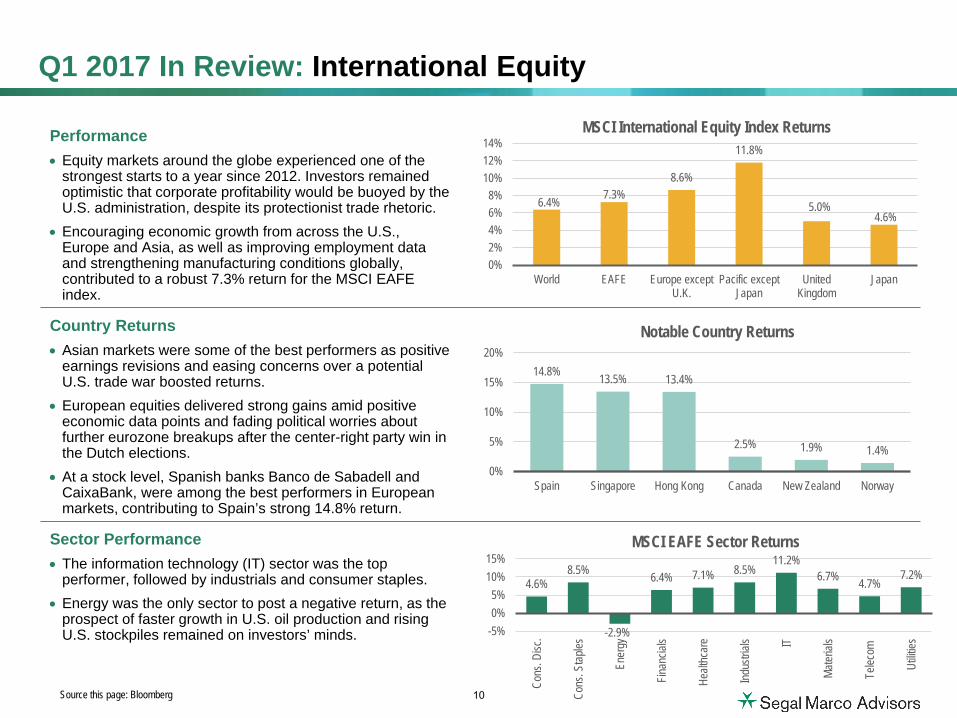
Performance• Equity markets around the globe experienced one of the
strongest starts to a year since 2012. Investors remainedoptimistic that corporate profitability would be buoyed by theU.S. administration, despite its protectionist trade rhetoric.
• Encouraging economic growth from across the U.S.,Europe and Asia, as well as improving employment dataand strengthening manufacturing conditions globally,contributed to a robust 7.3% return for the MSCI EAFEindex.
Country Returns• Asian markets were some of the best performers as positive
earnings revisions and easing concerns over a potentialU.S. trade war boosted returns.
• European equities delivered strong gains amid positiveeconomic data points and fading political worries aboutfurther eurozone breakups after the center-right party win inthe Dutch elections.
• At a stock level, Spanish banks Banco de Sabadell andCaixaBank, were among the best performers in Europeanmarkets, contributing to Spain’s strong 14.8% return.
Sector Performance• The information technology (IT) sector was the top
performer, followed by industrials and consumer staples.• Energy was the only sector to post a negative return, as the
prospect of faster growth in U.S. oil production and risingU.S. stockpiles remained on investors’ minds.
6.4% 7.3%8.6%
11.8%
5.0%4.6%
0%2%4%6%8%
10%12%14%
World EAFE Europe exceptU.K.
Pacific exceptJapan
UnitedKingdom
Japan
MSCI International Equity Index Returns
14.8% 13.5% 13.4%
2.5% 1.9% 1.4%0%
5%
10%
15%
20%
Spain Singapore Hong Kong Canada New Zealand Norway
Notable Country Returns
4.6%8.5%
-2.9%
6.4% 7.1% 8.5%11.2%
6.7% 4.7%7.2%
-5%0%5%
10%15%
Cons
. Disc
.
Cons
. Stap
les
Ener
gy
Finan
cials
Healt
hcar
e
Indus
trials IT
Mater
ials
Telec
om
Utilit
ies
MSCI EAFE Sector Returns
Source this page: Bloomberg 10

Q1 2017 In Review: Emerging Market Equity
Performance• The MSCI Emerging Markets Index rose by 11.5% in Q1, posting
the best quarterly increase in five years. • An improvement in global growth prospects, higher prices for
industrial metals, and a weaker USD all provided a tailwind forreturns.
• At the total index level, currency had a positive impact for U.S.investors, with local currency returns coming in 3.7% below theUSD results.
Country Returns• China gained on robust industrial production figures and
continued strength in the property market. Korea and Taiwan rallied on strong exports of technology related components.
• India gained as its central bank forecasted strong economicgrowth for the year and kept interest rates unchanged. The rulingBJP’s success in state elections also provided a tailwind.
• Poland performed the best of all index constituents, as positiveeconomic data increased expectations for growth in 2017.Russia lost the most, hurt by a decline in energy prices.
Sector Performance• All sector returns were positive in Q1.• The technology and industrials sectors were the best performers,
while the energy and healthcare sectors lagged.
11.5%13.4%
2.7%
12.1%
0%
4%
8%
12%
16%
Emerging Markets Asia EMEA Latin America
MSCI Emerging Market Index Returns
12.9%
7.6%4.4%
10.0%
5.5%
13.6%17.0%
12.1%
7.6%10.0%
0%
10%
20%Co
ns. D
isc.
Cons
. Stap
les
Ener
gy
Finan
cials
Healt
hcar
e
Indus
trials IT
Mater
ials
Telec
om
Utilit
ies
MSCI EM Sector Returns
12.9%17.1% 16.9%
11.8%
17.8%
-4.6%-10%
0%
10%
20%
China India Korea Taiwan Poland Russia
Notable Country Returns
Source this page: Bloomberg 11

Q1 2017 In Review: U.S. Fixed Income
Performance• Overall, credit outperformed Treasuries in Q1.• The Bloomberg Barclays U.S. High Yield Index extended its
2016 run, generating 2.7% in Q1. Lower quality names outperformed higher quality names.
• The Bloomberg Barclays U.S. Aggregate Index had strongperformance from the investment-grade corporate sectorconstituent (1.2% for the quarter).
Spreads• All standard U.S. spread sectors were trading below historical
medians at quarter end.• High yield bond spreads ended Q1 below high yield bank loans
at 392 bps over like-duration Treasuries vs. 438 bps over Libor for loans.
Yield Curve• The yield curve flattened modestly in Q1, with the 30- and 10-
year tenors falling 6 bps each, yielding 3.01% and 2.39%,respectively, at quarter end.
• The 2-year nominal Treasury note rose 7 bps to yield 1.26%behind a 25 bps Fed policy hike and inflation repricing.
0.8% 1.0% 0.8%1.6%
0.7%1.3% 1.2%
0.9% 0.5%
2.7%
0.1% 0.4%
0%
1%
2%
3%
4%
U.S.
Aggr
egate
Govt/
Cred
it
Inter
media
teGo
vt/Cr
edit
Long
Govt/
Cred
it
Gove
rnme
nt
Cred
it
Inv G
rade
Corp
orate
Inv G
rade
CMB
S
Mortg
age
U.S.
Cor
pora
teHi
gh Y
ield
Citi 3
-Mon
thT-
Bill
Huele
rSt
able
Value
U.S. Fixed Income Index Returns*
*Bloomberg Barclays Indices, unless otherwise noted.Sources this page: eVestment, Hueler Analytics, Barclays Live, FactSet
0.0
2.0
4.0
1M 3M 6M 1Y 2Y 3Y 5Y 7Y 10Y 30Y
%
Yield Curve12/31/2016 Yield 12/31/2015 Yield 03/31/2017 Yield
0.0
5.0
10.0
15.0
20.0
7/31/2015 12/31/2015 5/31/2016 10/31/2016 3/31/2017
Bloomberg Barclays Option Adjusted SpreadsU.S. Aggregate - OASU.S. Aggregate Credit - Corporate - High Yield / Energy - SEC - OASU.S. High Yield - Corporate - OASU.S. Aggregate Credit - Corporate - Investment Grade - OAS
12

Q1 2017 In Review: International Fixed Income
Global Treasuries• The USD depreciated in Q1, which benefitted international and
global indices with the euro, yen, and other developed ex-U.S.currencies.
Global Fixed Income Index Returns• The Global Aggregate Index was up 1.8% in Q1, while the USD-
hedged version of that index was only up 0.4%. The USD’sweakness held back the hedged index’s performance.
• The Citigroup World Government Bond (1.6%) and Non-U.S.World Government Bond (2.0%) indices also outpaced theirhedged counterparts.
Emerging Market Debt• The USD-denominated corporate bond index (CEMBI) fell. The
USD-denominated EMBI Global and the local currency GBI-EMGlobal Diversified indices gained.
• Commodity prices found a bid in Q1 and meaningful emergingmarket currency appreciation occurred in pockets of the universewhere valuations aren’t supported by fundamentals.
• In Latin America, Brazil and Mexico currencies appreciated 4.3%and 10.7%, respectively, versus the USD.
• In Asia, the South Korean won, Taiwanese dollar, and Indianrupee all appreciated meaningfully by quarter end.
3.9%
-1.3%
6.5%
-4%
-2%
0%
2%
4%
6%
8%
EMBI CEMBI GBI-EM
JP Morgan EMD Index Returns
-1.0
0.0
1.0
2.0
3.0
5/31/2
015
6/30/2
015
7/31/2
015
8/31/2
015
9/30/2
015
10/31
/2015
11/30
/2015
12/31
/2015
1/31/2
016
2/29/2
016
3/31/2
016
4/30/2
016
5/31/2
016
6/30/2
016
7/31/2
016
8/31/2
016
9/30/2
016
10/31
/2016
11/30
/2016
12/31
/2016
1/31/2
017
2/28/2
017
3/31/2
017
Global 10-Year Treasury YieldsUSA Japan UK Germany Canada
1.8%
0.4%
1.6%
0.0%
2.0%
-0.4%-0.5%0.0%0.5%1.0%1.5%2.0%2.5%
Blmb
g Bar
Glob
alAg
greg
ate
Blmb
g Bar
Glob
alAg
greg
ate(H
edge
d)
Citig
roup
WGB
I
Citig
roup
WGB
I(H
edge
d)
Citig
roup
Non-
U.S.
WGB
I
Citig
roup
Non-
U.S.
WGB
I(H
edge
d)
Global Fixed Income Index Performance
Sources this page: FactSet, Investment Metrics, JP Morgan13

Q1 2017 In Review: Mutual Fund Flows
Equity and Fixed Income Flows• Fixed income received net new inflows of approximately $45.3
billion in Q1 through February 28, 2017*.• Equity experienced net outflows of approximately $5.9 billion
during the same time period. Net inflows of around $2.6 billion inFebruary were not significant enough to offset January’s netoutflows of approximately $8.6 billion in the quarter-to-date(QTD) calculation.
Equity Flows• International equity experienced the greatest net inflows QTD
through February 28* with a total of approximately $10 billion.• U.S. large and mid caps were net negative QTD, while small
caps and emerging markets were net positive.
Fixed Income Flows• Investment grade bonds saw the greatest net inflows at
approximately $17 billion QTD through February 28*.• International, high yield and municipal bonds were also net
positive.• The only segment that experienced net outflows was
government (not shown in graph).
-50,000-40,000-30,000-20,000-10,000
010,00020,00030,000
Apr-1
4
Jun-
14
Aug-
14
Oct-1
4
Dec-1
4
Feb-
15
Apr-1
5
Jun-
15
Aug-
15
Oct-1
5
Dec-1
5
Feb-
16
Apr-1
6
Jun-
16
Aug-
16
Oct-1
6
Dec-1
6
Feb-
17
Net N
ew F
lows (
$ milli
ons)
Mutual Fund FlowsBonds Stocks
*The most recent data available.Source this page: FactSet
-25,000
-15,000
-5,000
5,000
15,000
25,000
Mar-1
4Ap
r-14
May-1
4Ju
n-14
Jul-1
4Au
g-14
Sep-
14Oc
t-14
Nov-1
4De
c-14
Jan-
15Fe
b-15
Mar-1
5Ap
r-15
May-1
5Ju
n-15
Jul-1
5Au
g-15
Sep-
15Oc
t-15
Nov-1
5De
c-15
Jan-
16Fe
b-16
Mar-1
6Ap
r-16
May-1
6Ju
n-16
Jul-1
6Au
g-16
Sep-
16Oc
t-16
Nov-1
6De
c-16
Jan-
17Fe
b-17
$ Milli
ons
Equity FlowsUS LC US MC US SC Emerging Markets International
14

Hedge Funds and Fund of Funds• Q1 hedge fund performance as represented by the HFRI Fund
Weighted Composite was positive at 2.4%. The index hasgained for four consecutive quarters and has trailing 1-, 3-, and5-year returns of 8.7%, 2.8%, and 4.0%, respectively.
• The HFRI Fund of Funds Composite Index was also positivefor the fourth consecutive quarter and up 2.4% in Q1. Theindex now has trailing 1-, 3-, and 5-year returns of 6.2%, 1.8%,and 3.2%, respectively.
Hedge Fund Sub-Strategies• Emerging Markets led sub-strategy performance in Q1, up
6.1%, driven largely by India and Asia ex-Japan.• Equity Hedge also posted a solid gain of 3.6% and benefited
from technology and healthcare specific managers.• Macro was the weakest strategy, down -0.2%, driven by Active
Trading and Systematic managers.
Hedge Fund Industry Asset Flows• Total hedge fund industry capital rose for the fourth
consecutive quarter. Industry-wide assets totaled $3.07 trillionby the end of Q1.
• Assets increased by $47 billion as investors increased capitalto Event Driven and Trend Following Systematic Macrostrategies. Trailing 12-month industry capital increased 7.3%.
• 2016 saw the largest annual outflow since 2009; however,investor outflow slowed to $5.5 billion in Q1 2017, the lowestquarterly outflow since Q4 2015.
Q1 2017 In Review: Absolute Return Strategies
$1,162
$1,424
$1,406
$500
$1,000
$1,500
$2,000
'07 '08 '09 '10 '11 '12 '13 '14 '15 '16 '17
HFR Hedge Fund and Fund of Fund Weighted CompositeGrowth of $1000
FOF Composite Fund Weighted Composite S&P 500 Global Aggregate
-5%
0%
5%
10%
15%
20%
Fund ofFund
FundWeighted
EventDriven
EquityHedge
Macro Distressed EmergingMarkets
RelativeValue
Hedge Fund Sub-Strategy PerformanceQTR 1 YR 3 YR 5 YR
$3,066
-5.5
$1,000
$1,500
$2,000
$2,500
$3,000
-160-140-120-100
-80-60-40-20
0204060
Q1 07
Q1 08
Q1 09
Q1 10
Q1 11
Q1 12
Q1 13
Q1 14
Q1 15
Q1 16
Q1 17
Quarterly Asset Flows ($Billions)HF Industry Assets Net Flows
Sources this page: Hedge Fund Research, Inc., eVestment15
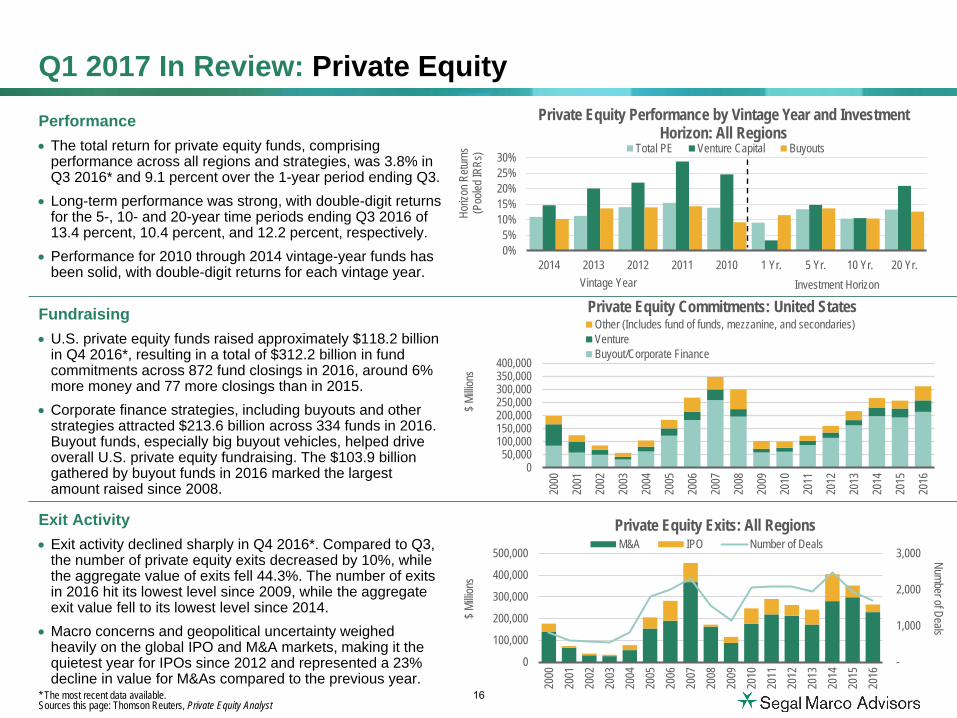
Performance• The total return for private equity funds, comprising
performance across all regions and strategies, was 3.8% inQ3 2016* and 9.1 percent over the 1-year period ending Q3.
• Long-term performance was strong, with double-digit returnsfor the 5-, 10- and 20-year time periods ending Q3 2016 of13.4 percent, 10.4 percent, and 12.2 percent, respectively.
• Performance for 2010 through 2014 vintage-year funds hasbeen solid, with double-digit returns for each vintage year.
Fundraising• U.S. private equity funds raised approximately $118.2 billion
in Q4 2016*, resulting in a total of $312.2 billion in fundcommitments across 872 fund closings in 2016, around 6%more money and 77 more closings than in 2015.
• Corporate finance strategies, including buyouts and otherstrategies attracted $213.6 billion across 334 funds in 2016.Buyout funds, especially big buyout vehicles, helped driveoverall U.S. private equity fundraising. The $103.9 billiongathered by buyout funds in 2016 marked the largestamount raised since 2008.
Exit Activity• Exit activity declined sharply in Q4 2016*. Compared to Q3,
the number of private equity exits decreased by 10%, whilethe aggregate value of exits fell 44.3%. The number of exitsin 2016 hit its lowest level since 2009, while the aggregateexit value fell to its lowest level since 2014.
• Macro concerns and geopolitical uncertainty weighedheavily on the global IPO and M&A markets, making it thequietest year for IPOs since 2012 and represented a 23%decline in value for M&As compared to the previous year.
050,000
100,000150,000200,000250,000300,000350,000400,000
2000
2001
2002
2003
2004
2005
2006
2007
2008
2009
2010
2011
2012
2013
2014
2015
2016
$ Milli
ons
Private Equity Commitments: United StatesOther (Includes fund of funds, mezzanine, and secondaries)VentureBuyout/Corporate Finance
Q1 2017 In Review: Private Equity
0%5%
10%15%20%25%30%
2014 2013 2012 2011 2010 1 Yr. 5 Yr. 10 Yr. 20 Yr.
Horiz
on R
eturn
s (P
ooled
IRRs
)
Vintage Year
Private Equity Performance by Vintage Year and Investment Horizon: All Regions
Total PE Venture Capital Buyouts
Investment Horizon
Sources this page: Thomson Reuters, Private Equity Analyst
-
1,000
2,000
3,000
0
100,000
200,000
300,000
400,000
500,00020
0020
0120
0220
0320
0420
0520
0620
0720
0820
0920
1020
1120
1220
1320
1420
1520
16
$ Milli
ons
Private Equity Exits: All RegionsM&A IPO Number of Deals
Number of Deals
* The most recent data available. 16
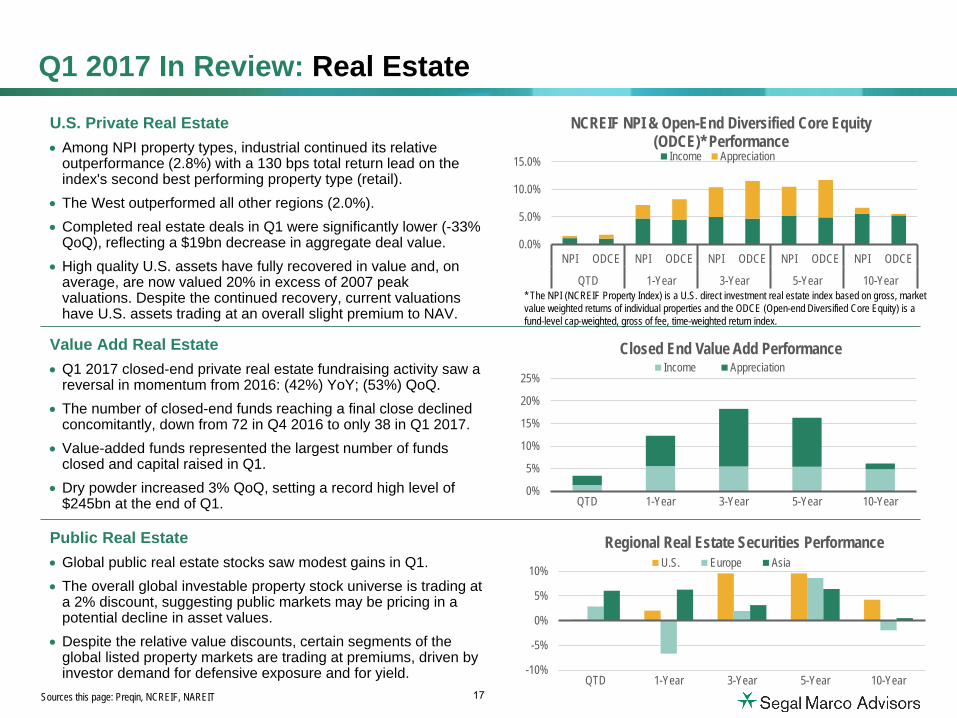
Q1 2017 In Review: Real EstateU.S. Private Real Estate• Among NPI property types, industrial continued its relative
outperformance (2.8%) with a 130 bps total return lead on theindex's second best performing property type (retail).
• The West outperformed all other regions (2.0%).• Completed real estate deals in Q1 were significantly lower (-33%
QoQ), reflecting a $19bn decrease in aggregate deal value.• High quality U.S. assets have fully recovered in value and, on
average, are now valued 20% in excess of 2007 peakvaluations. Despite the continued recovery, current valuationshave U.S. assets trading at an overall slight premium to NAV.
Value Add Real Estate• Q1 2017 closed-end private real estate fundraising activity saw a
reversal in momentum from 2016: (42%) YoY; (53%) QoQ.• The number of closed-end funds reaching a final close declined
concomitantly, down from 72 in Q4 2016 to only 38 in Q1 2017.• Value-added funds represented the largest number of funds
closed and capital raised in Q1.• Dry powder increased 3% QoQ, setting a record high level of
$245bn at the end of Q1.
Public Real Estate• Global public real estate stocks saw modest gains in Q1.• The overall global investable property stock universe is trading at
a 2% discount, suggesting public markets may be pricing in apotential decline in asset values.
• Despite the relative value discounts, certain segments of theglobal listed property markets are trading at premiums, driven byinvestor demand for defensive exposure and for yield. -10%
-5%
0%
5%
10%
QTD 1-Year 3-Year 5-Year 10-Year
Regional Real Estate Securities PerformanceU.S. Europe Asia
Sources this page: Preqin, NCREIF, NAREIT
0%
5%
10%
15%
20%
25%
QTD 1-Year 3-Year 5-Year 10-Year
Closed End Value Add PerformanceIncome Appreciation
0.0%
5.0%
10.0%
15.0%
NPI ODCE NPI ODCE NPI ODCE NPI ODCE NPI ODCE
QTD 1-Year 3-Year 5-Year 10-Year
NCREIF NPI & Open-End Diversified Core Equity (ODCE)* Performance
Income Appreciation
* The NPI (NCREIF Property Index) is a U.S. direct investment real estate index based on gross, market value weighted returns of individual properties and the ODCE (Open-end Diversified Core Equity) is a fund-level cap-weighted, gross of fee, time-weighted return index.
17
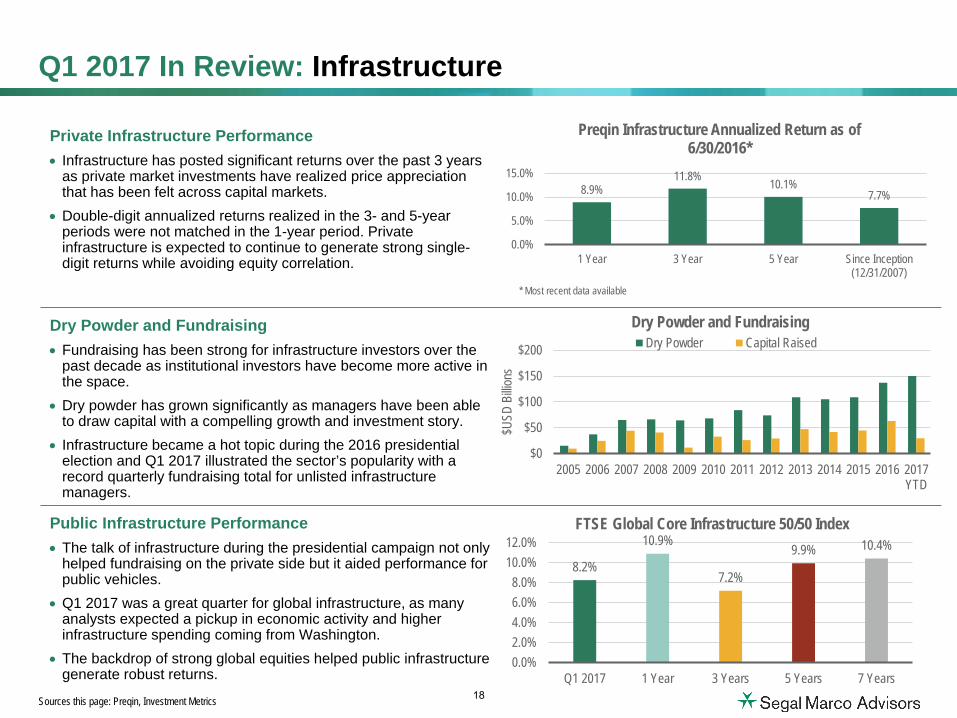
Q1 2017 In Review: Infrastructure
Private Infrastructure Performance • Infrastructure has posted significant returns over the past 3 years
as private market investments have realized price appreciationthat has been felt across capital markets.
• Double-digit annualized returns realized in the 3- and 5-yearperiods were not matched in the 1-year period. Privateinfrastructure is expected to continue to generate strong single-digit returns while avoiding equity correlation.
Dry Powder and Fundraising• Fundraising has been strong for infrastructure investors over the
past decade as institutional investors have become more active in the space.
• Dry powder has grown significantly as managers have been ableto draw capital with a compelling growth and investment story.
• Infrastructure became a hot topic during the 2016 presidentialelection and Q1 2017 illustrated the sector’s popularity with arecord quarterly fundraising total for unlisted infrastructuremanagers.
Public Infrastructure Performance• The talk of infrastructure during the presidential campaign not only
helped fundraising on the private side but it aided performance for public vehicles.
• Q1 2017 was a great quarter for global infrastructure, as manyanalysts expected a pickup in economic activity and higherinfrastructure spending coming from Washington.
• The backdrop of strong global equities helped public infrastructuregenerate robust returns.
Sources this page: Preqin, Investment Metrics
8.2%
10.9%
7.2%
9.9% 10.4%
0.0%2.0%4.0%6.0%8.0%
10.0%12.0%
Q1 2017 1 Year 3 Years 5 Years 7 Years
FTSE Global Core Infrastructure 50/50 Index
8.9%11.8% 10.1%
7.7%
0.0%
5.0%
10.0%
15.0%
1 Year 3 Year 5 Year Since Inception(12/31/2007)
Preqin Infrastructure Annualized Return as of 6/30/2016*
$0
$50
$100
$150
$200
2005 2006 2007 2008 2009 2010 2011 2012 2013 2014 2015 2016 2017YTD
$USD
Billi
ons
Dry Powder and FundraisingDry Powder Capital Raised
* Most recent data available
18
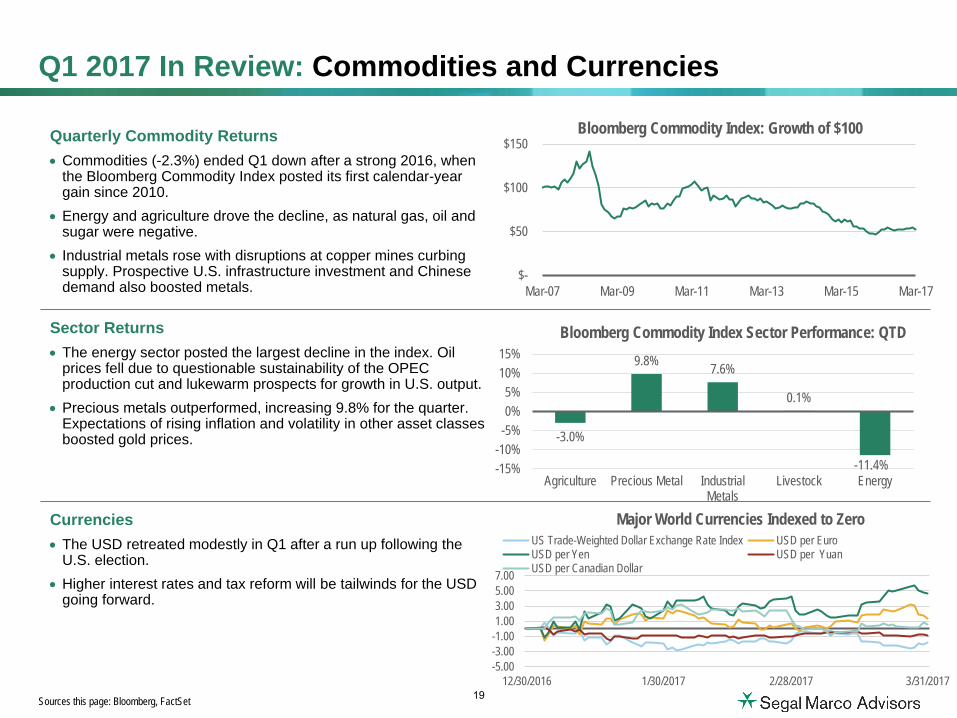
Q1 2017 In Review: Commodities and Currencies
Quarterly Commodity Returns• Commodities (-2.3%) ended Q1 down after a strong 2016, when
the Bloomberg Commodity Index posted its first calendar-yeargain since 2010.
• Energy and agriculture drove the decline, as natural gas, oil andsugar were negative.
• Industrial metals rose with disruptions at copper mines curbingsupply. Prospective U.S. infrastructure investment and Chinesedemand also boosted metals.
Sector Returns• The energy sector posted the largest decline in the index. Oil
prices fell due to questionable sustainability of the OPECproduction cut and lukewarm prospects for growth in U.S. output.
• Precious metals outperformed, increasing 9.8% for the quarter.Expectations of rising inflation and volatility in other asset classesboosted gold prices.
Currencies • The USD retreated modestly in Q1 after a run up following the
U.S. election.• Higher interest rates and tax reform will be tailwinds for the USD
going forward.
$-
$50
$100
$150
Mar-07 Mar-09 Mar-11 Mar-13 Mar-15 Mar-17
Bloomberg Commodity Index: Growth of $100
Sources this page: Bloomberg, FactSet
-3.0%
9.8% 7.6%
0.1%
-11.4%-15%-10%-5%0%5%
10%15%
Agriculture Precious Metal IndustrialMetals
Livestock Energy
Bloomberg Commodity Index Sector Performance: QTD
-5.00-3.00-1.001.003.005.007.00
12/30/2016 1/30/2017 2/28/2017 3/31/2017
Major World Currencies Indexed to ZeroUS Trade-Weighted Dollar Exchange Rate Index USD per EuroUSD per Yen USD per YuanUSD per Canadian Dollar
19

Q1 2017 In Review: Noteworthy Developments
Financial Assets Outpace Economic Growth in the Current Expansion• As shown in the graph at left below, the current economic expansion is the third longest since 1950, as well as one of the slowest
in terms of economic growth.• Meanwhile, the current bull market in equities is the third strongest over that same time period, as illustrated in the graph at right
below.• This means the value of financial assets has far outpaced underlying economic growth, contributing to a few observations:
• The current state of the capital markets of overvaluation across virtually all asset classes.• The disconnect between the upper and middle classes, since the upper class typically benefits most from gains in financial
assets while slow growth has not benefitted the middle class to the same extent.
Source this page: FactSet
1953
19571960
1969
1973
1979
1981
1990
2001
2007 2017
0%
10%
20%
30%
40%
50%
60%
1 6 11 16 21 26 31 36 41
Cumu
lative
Rea
l GDP
Gro
wth (
%)
Number of Quarters of Economic Recovery
Economic Expansions Since 1950
19571960
19691979
1981
1990
2001
2007
2017
-100%
0%
100%
200%
300%
400%
500%
1 6 11 16 21 26 31 36 41
Number of Quarters of Economic Recovery
S&P 500 Total Return Cumulative Performance Since 1950
20

Q1 2017 In Review: Noteworthy Developments
The Quiet Black Swan• Over the last 5 years the U.S. equity market has outperformed emerging market equities by 12% per annum.• In other words, going long $1.00 in U.S. equities and short $1.00 in emerging markets would have given you $1.75 in a year.• This has occurred even though these two assets classes had a correlation of 0.66 throughout the period.• Using the historical standard deviations and correlations, the probability of this occurring is 1%, or 1-in-99 years.*
* This is according to the Capital Asset Pricing Model, or CAPM, which is a formula that is widely used in finance for the pricing of risky securities.** Ex Ante CAPMSources this page: Investment Metrics, Segal Marco Advisors analytics
$1.75
$0.80
$1.00
$1.20
$1.40
$1.60
$1.80
$2.00
Dec-2
016
Aug-
2016
Apr-2
016
Dec-2
015
Aug-
2015
Apr-2
015
Dec-2
014
Aug-
2014
Apr-2
014
Dec-2
013
Aug-
2013
Apr-2
013
Dec-2
012
Aug-
2012
Apr-2
012
Dec-2
011
U.S. Equity Versus Emerging Market EquityTrailing 5 Years
US EQ / EM EQ US EQ EM EQ
Risk Premium**
Historical StandardDeviation
Historical Correlation
U.S. Equity 6% 11% 1.00 0.66
Emerging Market Equity
8% 16% 0.66 1.00
Long U.S. Equity/
Short EME-1% 12%
Z-Score 2
Probability 1%
21
Q1 2017 In Review: Noteworthy Developments
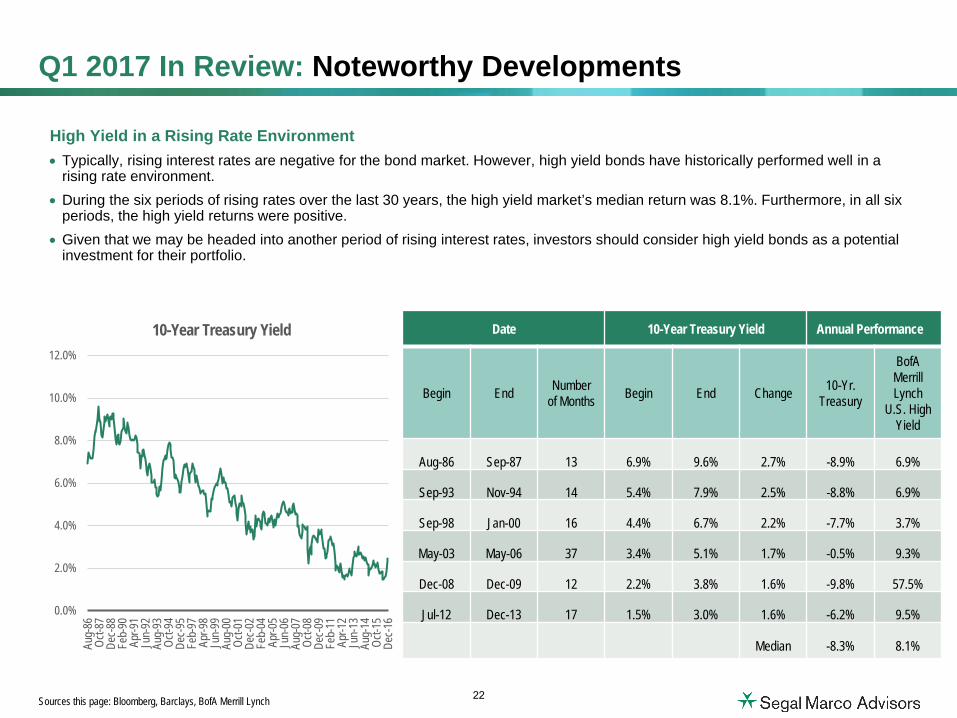
High Yield in a Rising Rate Environment• Typically, rising interest rates are negative for the bond market. However, high yield bonds have historically performed well in a
rising rate environment.• During the six periods of rising rates over the last 30 years, the high yield market’s median return was 8.1%. Furthermore, in all six
periods, the high yield returns were positive.• Given that we may be headed into another period of rising interest rates, investors should consider high yield bonds as a potential
investment for their portfolio.
Sources this page: Bloomberg, Barclays, BofA Merrill Lynch
Date 10-Year Treasury Yield Annual Performance
Begin End Number of Months Begin End Change 10-Yr.
Treasury
BofAMerrill Lynch
U.S. High Yield
Aug-86 Sep-87 13 6.9% 9.6% 2.7% -8.9% 6.9%
Sep-93 Nov-94 14 5.4% 7.9% 2.5% -8.8% 6.9%
Sep-98 Jan-00 16 4.4% 6.7% 2.2% -7.7% 3.7%
May-03 May-06 37 3.4% 5.1% 1.7% -0.5% 9.3%
Dec-08 Dec-09 12 2.2% 3.8% 1.6% -9.8% 57.5%
Jul-12 Dec-13 17 1.5% 3.0% 1.6% -6.2% 9.5%
Median -8.3% 8.1%
0.0%
2.0%
4.0%
6.0%
8.0%
10.0%
12.0%
Aug-
86Oc
t-87
Dec-8
8Fe
b-90
Apr-9
1Ju
n-92
Aug-
93Oc
t-94
Dec-9
5Fe
b-97
Apr-9
8Ju
n-99
Aug-
00Oc
t-01
Dec-0
2Fe
b-04
Apr-0
5Ju
n-06
Aug-
07Oc
t-08
Dec-0
9Fe
b-11
Apr-1
2Ju
n-13
Aug-
14Oc
t-15
Dec-1
6
10-Year Treasury Yield
22

0
Administrative Review
23
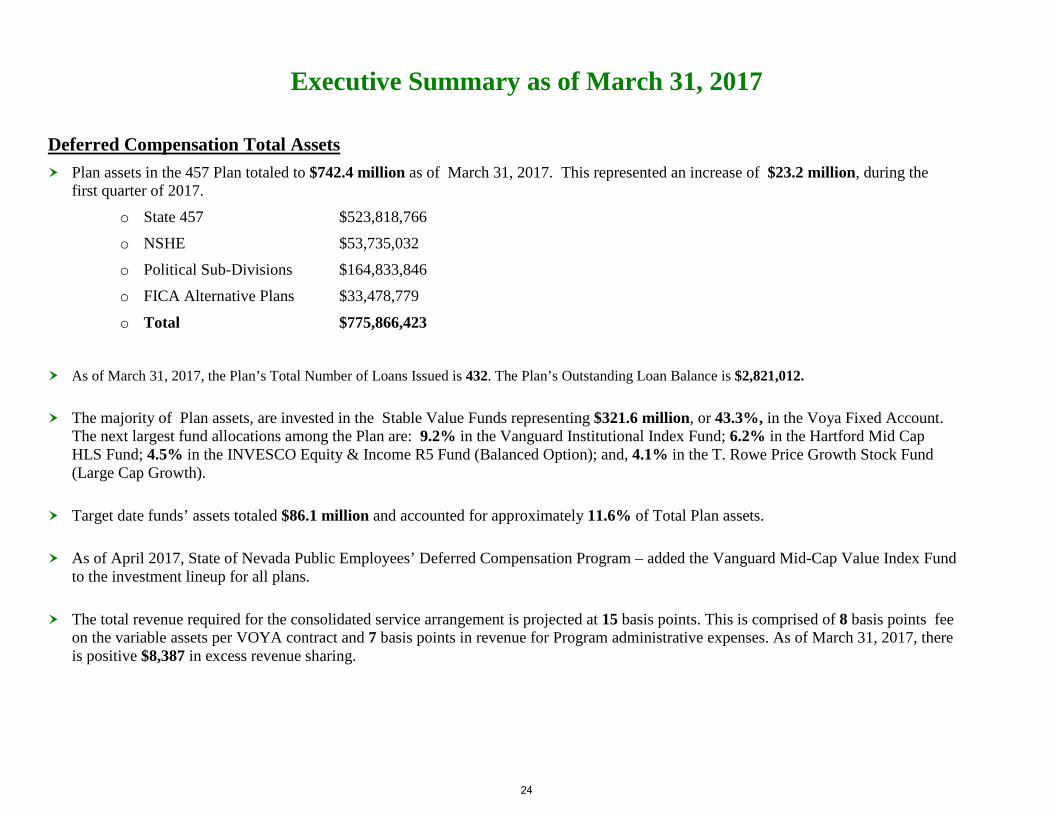
Executive Summary as of March 31, 2017 Deferred Compensation Total Assets Plan assets in the 457 Plan totaled to $742.4 million as of March 31, 2017. This represented an increase of $23.2 million, during the
first quarter of 2017. o State 457 $523,818,766 o NSHE $53,735,032 o Political Sub-Divisions $164,833,846 o FICA Alternative Plans $33,478,779
o Total $775,866,423
As of March 31, 2017, the Plan’s Total Number of Loans Issued is 432. The Plan’s Outstanding Loan Balance is $2,821,012.
The majority of Plan assets, are invested in the Stable Value Funds representing $321.6 million, or 43.3%, in the Voya Fixed Account. The next largest fund allocations among the Plan are: 9.2% in the Vanguard Institutional Index Fund; 6.2% in the Hartford Mid Cap HLS Fund; 4.5% in the INVESCO Equity & Income R5 Fund (Balanced Option); and, 4.1% in the T. Rowe Price Growth Stock Fund (Large Cap Growth).
Target date funds’ assets totaled $86.1 million and accounted for approximately 11.6% of Total Plan assets.
As of April 2017, State of Nevada Public Employees’ Deferred Compensation Program – added the Vanguard Mid-Cap Value Index Fund to the investment lineup for all plans.
The total revenue required for the consolidated service arrangement is projected at 15 basis points. This is comprised of 8 basis points fee on the variable assets per VOYA contract and 7 basis points in revenue for Program administrative expenses. As of March 31, 2017, there is positive $8,387 in excess revenue sharing.
24
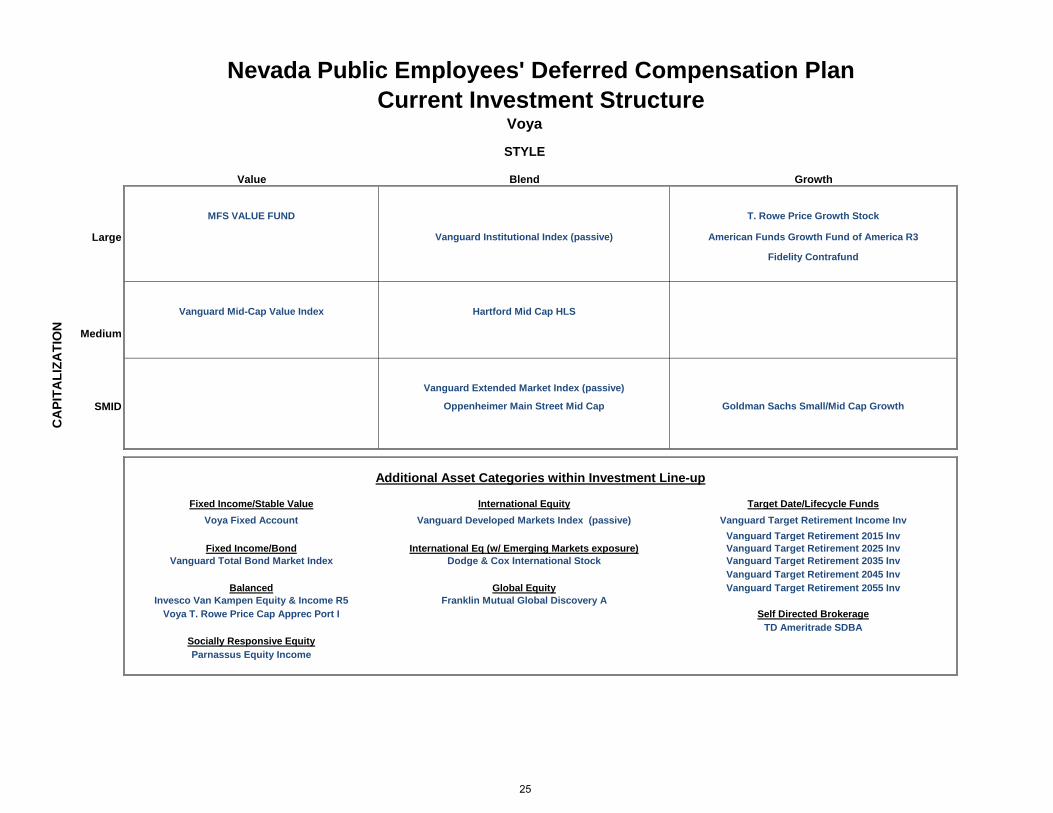
Voya
STYLE
Value Blend Growth
MFS VALUE FUND T. Rowe Price Growth Stock
Large Vanguard Institutional Index (passive) American Funds Growth Fund of America R3
Fidelity Contrafund
Vanguard Mid-Cap Value Index Hartford Mid Cap HLS
Medium
Vanguard Extended Market Index (passive)
SMID Oppenheimer Main Street Mid Cap Goldman Sachs Small/Mid Cap Growth
Fixed Income/Stable Value International Equity Target Date/Lifecycle FundsVoya Fixed Account Vanguard Developed Markets Index (passive) Vanguard Target Retirement Income Inv
Vanguard Target Retirement 2015 InvFixed Income/Bond International Eq (w/ Emerging Markets exposure) Vanguard Target Retirement 2025 Inv
Vanguard Total Bond Market Index Dodge & Cox International Stock Vanguard Target Retirement 2035 InvVanguard Target Retirement 2045 Inv
Balanced Global Equity Vanguard Target Retirement 2055 InvInvesco Van Kampen Equity & Income R5 Franklin Mutual Global Discovery A
Voya T. Rowe Price Cap Apprec Port I Self Directed BrokerageTD Ameritrade SDBA
Socially Responsive EquityParnassus Equity Income
CA
PITA
LIZA
TIO
N
Additional Asset Categories within Investment Line-up
Nevada Public Employees' Deferred Compensation PlanCurrent Investment Structure
25

Tier II- Passive Core (index options) Tier II - Active CoreStable Value
Voya Fixed AccountCore Fixed Income
Vanguard Total Bond Market IndexBalanced Fund
Invesco Van Kampen Equity & Income R6Voya T.Rowe Price Cap App Port I
Large Cap ValueMFS Value Fund
Large Cap Blend Vanguard Institutional Index
Large Cap GrowthT.Rowe Price Growth Stock
American Funds Growth Fund of Amer R3Fidelity Contrafund
Mid Cap Blend Mid Cap Blend Vanguard Mid Cap Value Index Hartford Mid Cap HLS
SMID Cap Blend (Small & Mid Cap) SMID Cap Blend (Small & Mid Cap)Vanguard Extended Market Index I Oppenheimer Main Street Mid Cap
SMID Cap GrowthGoldman Sachs Small/Mid Cap Growth
International Equity International Equity (w/Emerging Markets)Vanguard Developed Markets Index Adm Dodge & Cox International Stock
Socially Responsive
Vanguard Target Retirement 2055 Inv
Vanguard Target Retirement 2015 InvVanguard Target Retirement 2025 InvVanguard Target Retirement 2035 InvVanguard Target Retirement 2045 Inv
Tier III- Specialty
State of Nevada Deferred Compensation Plan Line-UpPlan Review - Investment Options Array
Tier I - Asset AllocationTarget Date/Lifecycle Funds
Vanguard Target Retirement Income Inv
TD Ameritrade
Parnassus Equity IncomeGlobal Equity
Franklin Mutual Discovery ZSelf-Directed Brokerage
Cons
erva
tive
Aggr
essi
ve
26

Tier I: Asset Allocation Tier II (A): Passive Core (index options) Tier II(B): Active Core Tier III: (Specialty CONSERVATIVE Stable Value
Voya Fixed Account Core Fixed Income
Vanguard Total Bond Market IndexTarget Date/Lifecycle Funds Balanced Fund
Vanguard Target Retirement Funds Invesco Van Kampen Equity & Income R6Voya T.Rowe Price Cap App Port I
Large Cap ValueMFS Value Fund
Large Cap Blend Socially ResponsiveVanguard Institutional Index Parnassus Equity Income
Large Cap GrowthT.Rowe Price Growth Stock
American Funds Growth Fund of Amer R3Fidelity Contrafund
Mid Cap Blend Mid Cap BlendVanguard Mid Cap Value Index Hartford Mid Cap HLS
SMID Cap Blend (Small & Mid Cap) SMID Cap Blend (Small & Mid Cap)Vanguard Extended Market Index I Oppenheimer Main Street Mid Cap
SMID Cap GrowthGoldman Sachs Small/Mid Cap Growth
International Equity International Equity (w/Emerging Market) Global EquityVanguard Developed Markets Index Adm Dodge & Cox International Stock Franklin Mutual Discovery A
Self-Directed BrokerageAGGRESSIVE TD Ameritrade
State of Nevada Deferred Compensation Plan Line-UpPlan Review - Investment Options Array
27
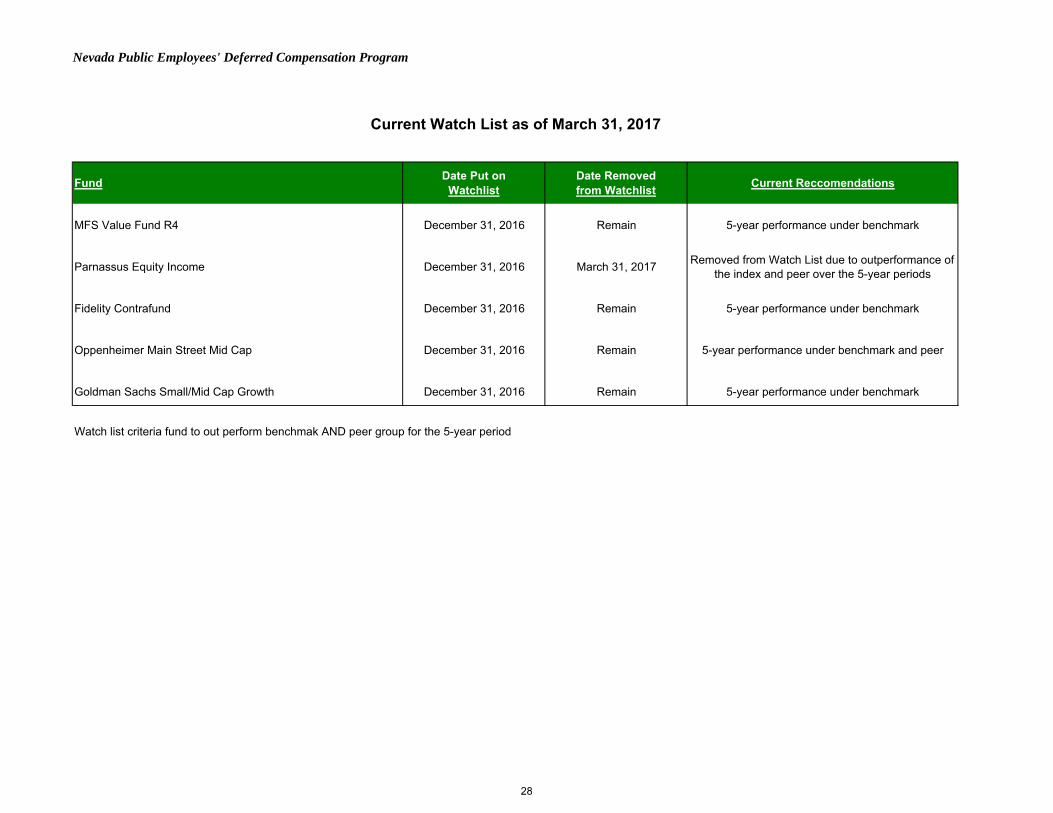
Nevada Public Employees' Deferred Compensation Program
Fund Date Put on Watchlist
Date Removed from Watchlist Current Reccomendations
MFS Value Fund R4 December 31, 2016 Remain 5-year performance under benchmark
Parnassus Equity Income December 31, 2016 March 31, 2017 Removed from Watch List due to outperformance of the index and peer over the 5-year periods
Fidelity Contrafund December 31, 2016 Remain 5-year performance under benchmark
Oppenheimer Main Street Mid Cap December 31, 2016 Remain 5-year performance under benchmark and peer
Goldman Sachs Small/Mid Cap Growth December 31, 2016 Remain 5-year performance under benchmark
Watch list criteria fund to out perform benchmak AND peer group for the 5-year period
Current Watch List as of March 31, 2017
28
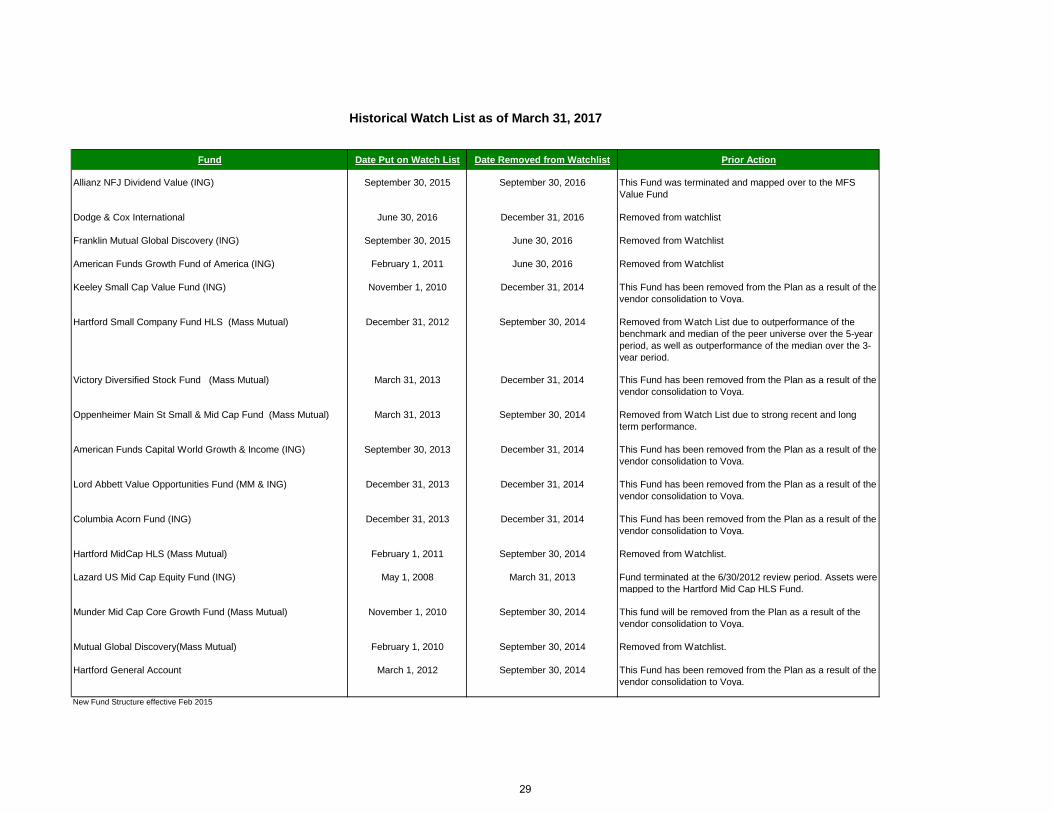
Fund Date Put on Watch List Date Removed from Watchlist Prior Action
Allianz NFJ Dividend Value (ING) September 30, 2015 September 30, 2016 This Fund was terminated and mapped over to the MFS Value Fund
Dodge & Cox International June 30, 2016 December 31, 2016 Removed from watchlist
Franklin Mutual Global Discovery (ING) September 30, 2015 June 30, 2016 Removed from Watchlist
American Funds Growth Fund of America (ING) February 1, 2011 June 30, 2016 Removed from Watchlist
Keeley Small Cap Value Fund (ING) November 1, 2010 December 31, 2014 This Fund has been removed from the Plan as a result of the vendor consolidation to Voya.
Hartford Small Company Fund HLS (Mass Mutual) December 31, 2012 September 30, 2014 Removed from Watch List due to outperformance of the benchmark and median of the peer universe over the 5-year period, as well as outperformance of the median over the 3-year period.
Victory Diversified Stock Fund (Mass Mutual) March 31, 2013 December 31, 2014 This Fund has been removed from the Plan as a result of the vendor consolidation to Voya.
Oppenheimer Main St Small & Mid Cap Fund (Mass Mutual) March 31, 2013 September 30, 2014 Removed from Watch List due to strong recent and long term performance.
American Funds Capital World Growth & Income (ING) September 30, 2013 December 31, 2014 This Fund has been removed from the Plan as a result of the vendor consolidation to Voya.
Lord Abbett Value Opportunities Fund (MM & ING) December 31, 2013 December 31, 2014 This Fund has been removed from the Plan as a result of the vendor consolidation to Voya.
Columbia Acorn Fund (ING) December 31, 2013 December 31, 2014 This Fund has been removed from the Plan as a result of the vendor consolidation to Voya.
Hartford MidCap HLS (Mass Mutual) February 1, 2011 September 30, 2014 Removed from Watchlist.
Lazard US Mid Cap Equity Fund (ING) May 1, 2008 March 31, 2013 Fund terminated at the 6/30/2012 review period. Assets were mapped to the Hartford Mid Cap HLS Fund.
Munder Mid Cap Core Growth Fund (Mass Mutual) November 1, 2010 September 30, 2014 This fund will be removed from the Plan as a result of the vendor consolidation to Voya.
Mutual Global Discovery(Mass Mutual) February 1, 2010 September 30, 2014 Removed from Watchlist.
Hartford General Account March 1, 2012 September 30, 2014 This Fund has been removed from the Plan as a result of the vendor consolidation to Voya.
New Fund Structure effective Feb 2015
Historical Watch List as of March 31, 2017
29

Parnassus Equity Income
The Parnassus Equity Income Fund lags the S&P 500 Index over all time periods analyzed ending March 31, 2017, except for the trailing
5-year period. The Fund’s most positive impacts came from underweight positions in energy and telecommunications, the two worst performing sectors
in the S&P 500 index during the recent quarter. At the individual stock level, Gilead Sciences, was the Fund’s biggest detractor during the recent quarter. The stock subtracted 19 basis
points from the Fund’s return. In addition, United Parcel Service reduced the fund’s return by 19 basis points and Compass Minerals trimmed 14 basis points from the Fund’s return.
Apple added 96 basis points to the Fund’s return, making it the Fund’s biggest winner during the recent quarter.
MFS Value Fund R4
The MFS Value R4 Fund outperformed the Russell 1000 Value Index over the first quarter and lags the benchmark for the one- and five-year trailing periods.
During the recent quarter, energy, consumer staples, healthcare, and industrials contributed to relative returns. Conversely, an underweight position in technology detracted from relative performance. From a sector perspective, energy was the best performing sector for the portfolio. The portfolio’s underweight position in shares of
integrated oil & gas company Exxon Mobil contributed to relative performance. At the individual stock level, United Parcel Service Inc., Goldman Sachs Group Inc., CSX Corp., and Bank of America Corp., all
detracted from relative performance during the quarter. Goldman Sachs Small/Mid Cap Growth
The Goldman Sachs Small/Mid Cap Growth Fund outperformed the Russell 2500 Growth Index over the first quarter and lags the
benchmark for all other time periods analyzed ending March 31, 2017. From a sector perspective, stock selection in information technology and healthcare contributed to relative returns, while stock selection in
real estate detracted from relative returns during the recent quarter. VCA, Inc. and Panera Bread Co. were top contributors for the Fund during the recent quarter. During the quarter, regional bank Eagle Bankcorp, Inc (1.7%) was a top detractor from relative returns. The company disclosed in its 10-k
material weakness in the company’s internal controls relating to income tax accounting which weighed on the stock. Advance Auto Parts, Inc. (1.2%) was another top detractor from relative returns during the quarter.
30
Oppenheimer Main Street Mid Cap
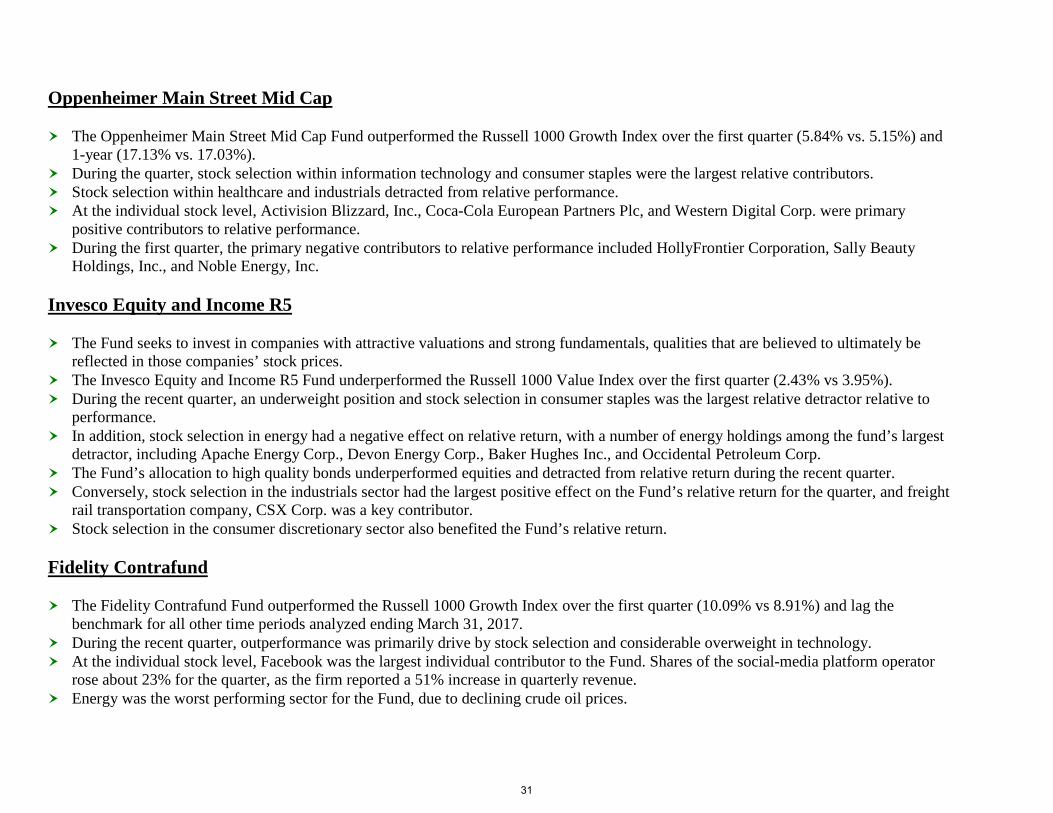
The Oppenheimer Main Street Mid Cap Fund outperformed the Russell 1000 Growth Index over the first quarter (5.84% vs. 5.15%) and
1-year (17.13% vs. 17.03%). During the quarter, stock selection within information technology and consumer staples were the largest relative contributors. Stock selection within healthcare and industrials detracted from relative performance. At the individual stock level, Activision Blizzard, Inc., Coca-Cola European Partners Plc, and Western Digital Corp. were primary
positive contributors to relative performance. During the first quarter, the primary negative contributors to relative performance included HollyFrontier Corporation, Sally Beauty
Holdings, Inc., and Noble Energy, Inc.
Invesco Equity and Income R5
The Fund seeks to invest in companies with attractive valuations and strong fundamentals, qualities that are believed to ultimately be reflected in those companies’ stock prices.
The Invesco Equity and Income R5 Fund underperformed the Russell 1000 Value Index over the first quarter (2.43% vs 3.95%). During the recent quarter, an underweight position and stock selection in consumer staples was the largest relative detractor relative to
performance. In addition, stock selection in energy had a negative effect on relative return, with a number of energy holdings among the fund’s largest
detractor, including Apache Energy Corp., Devon Energy Corp., Baker Hughes Inc., and Occidental Petroleum Corp. The Fund’s allocation to high quality bonds underperformed equities and detracted from relative return during the recent quarter. Conversely, stock selection in the industrials sector had the largest positive effect on the Fund’s relative return for the quarter, and freight
rail transportation company, CSX Corp. was a key contributor. Stock selection in the consumer discretionary sector also benefited the Fund’s relative return.
Fidelity Contrafund
The Fidelity Contrafund Fund outperformed the Russell 1000 Growth Index over the first quarter (10.09% vs 8.91%) and lag the
benchmark for all other time periods analyzed ending March 31, 2017. During the recent quarter, outperformance was primarily drive by stock selection and considerable overweight in technology. At the individual stock level, Facebook was the largest individual contributor to the Fund. Shares of the social-media platform operator
rose about 23% for the quarter, as the firm reported a 51% increase in quarterly revenue. Energy was the worst performing sector for the Fund, due to declining crude oil prices.
31
Fund Name Ticker Asset ClassPlan Assets
12/31/16
Mutual Fund Expense
Ratio
Mutual Fund Total Expense
Ratio $Revenue Sharing
Revenue Sharing $
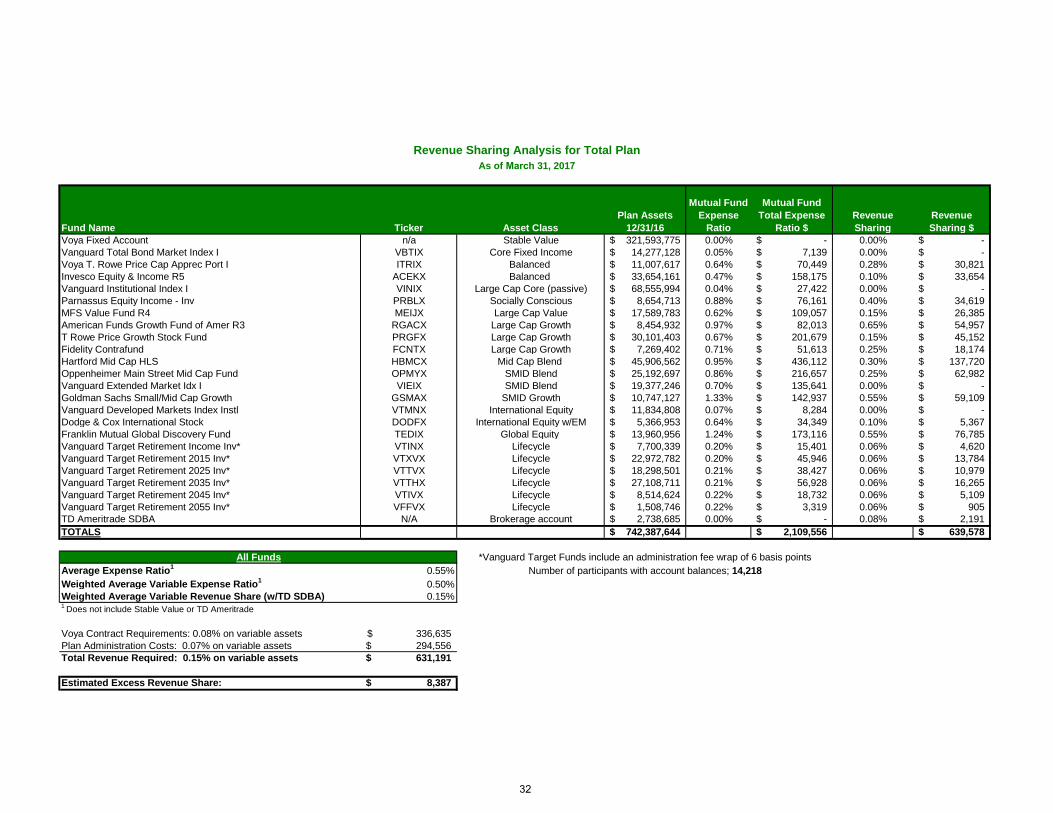
Voya Fixed Account n/a Stable Value 321,593,775$ 0.00% -$ 0.00% -$ Vanguard Total Bond Market Index I VBTIX Core Fixed Income 14,277,128$ 0.05% 7,139$ 0.00% -$ Voya T. Rowe Price Cap Apprec Port I ITRIX Balanced 11,007,617$ 0.64% 70,449$ 0.28% 30,821$ Invesco Equity & Income R5 ACEKX Balanced 33,654,161$ 0.47% 158,175$ 0.10% 33,654$ Vanguard Institutional Index I VINIX Large Cap Core (passive) 68,555,994$ 0.04% 27,422$ 0.00% -$ Parnassus Equity Income - Inv PRBLX Socially Conscious 8,654,713$ 0.88% 76,161$ 0.40% 34,619$ MFS Value Fund R4 MEIJX Large Cap Value 17,589,783$ 0.62% 109,057$ 0.15% 26,385$ American Funds Growth Fund of Amer R3 RGACX Large Cap Growth 8,454,932$ 0.97% 82,013$ 0.65% 54,957$ T Rowe Price Growth Stock Fund PRGFX Large Cap Growth 30,101,403$ 0.67% 201,679$ 0.15% 45,152$ Fidelity Contrafund FCNTX Large Cap Growth 7,269,402$ 0.71% 51,613$ 0.25% 18,174$ Hartford Mid Cap HLS HBMCX Mid Cap Blend 45,906,562$ 0.95% 436,112$ 0.30% 137,720$ Oppenheimer Main Street Mid Cap Fund OPMYX SMID Blend 25,192,697$ 0.86% 216,657$ 0.25% 62,982$ Vanguard Extended Market Idx I VIEIX SMID Blend 19,377,246$ 0.70% 135,641$ 0.00% -$ Goldman Sachs Small/Mid Cap Growth GSMAX SMID Growth 10,747,127$ 1.33% 142,937$ 0.55% 59,109$ Vanguard Developed Markets Index Instl VTMNX International Equity 11,834,808$ 0.07% 8,284$ 0.00% -$ Dodge & Cox International Stock DODFX International Equity w/EM 5,366,953$ 0.64% 34,349$ 0.10% 5,367$ Franklin Mutual Global Discovery Fund TEDIX Global Equity 13,960,956$ 1.24% 173,116$ 0.55% 76,785$ Vanguard Target Retirement Income Inv* VTINX Lifecycle 7,700,339$ 0.20% 15,401$ 0.06% 4,620$ Vanguard Target Retirement 2015 Inv* VTXVX Lifecycle 22,972,782$ 0.20% 45,946$ 0.06% 13,784$ Vanguard Target Retirement 2025 Inv* VTTVX Lifecycle 18,298,501$ 0.21% 38,427$ 0.06% 10,979$ Vanguard Target Retirement 2035 Inv* VTTHX Lifecycle 27,108,711$ 0.21% 56,928$ 0.06% 16,265$ Vanguard Target Retirement 2045 Inv* VTIVX Lifecycle 8,514,624$ 0.22% 18,732$ 0.06% 5,109$ Vanguard Target Retirement 2055 Inv* VFFVX Lifecycle 1,508,746$ 0.22% 3,319$ 0.06% 905$ TD Ameritrade SDBA N/A Brokerage account 2,738,685$ 0.00% -$ 0.08% 2,191$ TOTALS 742,387,644$ 2,109,556$ 639,578$
Average Expense Ratio1 0.55%Weighted Average Variable Expense Ratio1 0.50%Weighted Average Variable Revenue Share (w/TD SDBA) 0.15%1 Does not include Stable Value or TD Ameritrade
Voya Contract Requirements: 0.08% on variable assets 336,635$ Plan Administration Costs: 0.07% on variable assets 294,556$ Total Revenue Required: 0.15% on variable assets 631,191$
Estimated Excess Revenue Share: 8,387$
Revenue Sharing Analysis for Total Plan As of March 31, 2017
All FundsNumber of participants with account balances; 14,218
*Vanguard Target Funds include an administration fee wrap of 6 basis points
32

Beginning Investment EndingBalance Loan Gain/Loss Balance
Funds January 1, 2017 Contributions Withdrawals Repayments Misc* Fees* (incl. Dividends) March 31, 2017
Voya Fixed Account 321,746,563$ 4,194,060$ 401,071$ (6,957,503)$ 57,219$ 72,534$ (97,505)$ 2,177,336$ 321,593,775$
Vanguard Total Bond Market Index I 14,250,548$ 256,833$ 164,886$ (540,985)$ 17,488$ -$ (1,805)$ 130,164$ 14,277,128$
Voya T. Rowe Price Cap Apprec Port I 10,689,081$ 281,067$ (261,155)$ (295,398)$ 21,827$ -$ (267)$ 572,462$ 11,007,617$
Invesco Equity & Income R5 32,487,634$ 470,098$ 489,343$ (590,033)$ 7,271$ -$ (626)$ 790,472$ 33,654,161$
MFS Value Fund R4 16,650,010$ 244,571$ 171,521$ (275,762)$ 6,442$ -$ (1,031)$ 794,032$ 17,589,783$
Vanguard Institutional Index I 64,082,460$ 791,749$ 879,666$ (1,114,924)$ 17,107$ -$ (971)$ 3,900,907$ 68,555,994$
Parnassus Equity Income - Inv 8,393,335$ 155,971$ (70,132)$ (205,802)$ 12,170$ -$ (118)$ 369,289$ 8,654,713$
American Funds Growth Fund of Amer R3 7,887,429$ 144,654$ (60,625)$ (152,625)$ 11,283$ -$ (124)$ 624,941$ 8,454,932$
T. Rowe Price Growth Stock Fund 27,183,325$ 345,297$ (54,588)$ (385,136)$ 7,047$ -$ (204)$ 3,005,663$ 30,101,403$
Fidelity Contrafund 6,694,374$ 159,484$ (112,166)$ (141,488)$ 3,034$ -$ (93)$ 666,257$ 7,269,402$
Hartford Mid Cap HLS 43,717,580$ 559,671$ (233,718)$ (706,667)$ 10,601$ -$ (440)$ 2,559,535$ 45,906,562$
Oppenheimer Main Street Mid Cap Fund 23,959,175$ 298,939$ (54,308)$ (419,621)$ 8,088$ -$ (697)$ 1,401,121$ 25,192,697$
Vanguard Extended Market Idx I 18,135,697$ 410,565$ 203,526$ (225,811)$ 16,867$ -$ (908)$ 837,310$ 19,377,246$
Goldman Sachs Small/Mid Cap Growth 10,476,024$ 177,703$ (821,834)$ (110,289)$ 8,837$ -$ (171)$ 1,016,857$ 10,747,127$
Vanguard Developed Markets Index Instl 11,065,404$ 236,916$ (140,905)$ (191,230)$ 4,415$ -$ (574)$ 860,782$ 11,834,808$
Dodge & Cox International Stock 4,769,687$ 109,998$ 119,508$ (90,141)$ 11,210$ -$ (394)$ 447,085$ 5,366,953$
Franklin Mutual Global Discovery Fund A 13,324,669$ 179,266$ (30,854)$ (98,406)$ 3,091$ -$ (736)$ 583,924$ 13,960,956$
Vanguard Target Retirement Income Inv 7,421,916$ 185,477$ 91,807$ (233,583)$ 53,625$ -$ (125)$ 181,222$ 7,700,339$
Vanguard Target Retirement 2015 Inv 23,224,063$ 588,597$ (1,041,167)$ (578,633)$ 14,542$ -$ (348)$ 765,728$ 22,972,782$
Vanguard Target Retirement 2025 Inv 16,659,087$ 1,076,010$ (32,729)$ (187,306)$ 9,685$ -$ (660)$ 774,414$ 18,298,501$
Vanguard Target Retirement 2035 Inv 25,227,830$ 948,559$ (15,474)$ (472,159)$ 21,923$ -$ (921)$ 1,398,952$ 27,108,711$
Vanguard Target Retirement 2045 Inv 7,679,288$ 586,109$ (69,082)$ (162,856)$ 3,985$ -$ (250)$ 477,430$ 8,514,624$
Vanguard Target Retirement 2055 Inv 975,182$ 91,392$ 373,651$ (887)$ -$ -$ -$ 69,407$ 1,508,746$
TD Ameritrade SDBA 2,532,008$ -$ 103,759$ -$ -$ -$ -$ 102,918$ 2,738,685$
Total 719,232,369$ 12,492,987$ (0)$ (14,137,245)$ 327,758$ 72,534$ (108,970)$ 24,508,211$ 742,387,644$
Misc* Reimbursement account activity and death claimsFees* Loan and Morningstar fees 23,155,275$
Plan Activity: Total All PlansJanuary 1, 2017 through March 31, 2017
Interfund InterPlan Exchanges
33

Fund Assets % of Total AssetsVoya Fixed Account 321,593,775$ 43.3%Vanguard Total Bond Market Index I 14,277,128$ 1.9%Voya T. Rowe Price Cap Apprec Port I 11,007,617$ 1.5%Invesco Equity & Income R5 33,654,161$ 4.5%MFS Value Fund R4 17,589,783$ 2.4%Vanguard Institutional Index I 68,555,994$ 9.2%Parnassus Equity Income - Inv 8,654,713$ 1.2%American Funds Growth Fund of Amer R3 8,454,932$ 1.1%T. Rowe Price Growth Stock Fund 30,101,403$ 4.1%Fidelity Contrafund 7,269,402$ 1.0%Hartford Mid Cap HLS 45,906,562$ 6.2%Oppenheimer Main Street Mid Cap Fund 25,192,697$ 3.4%Vanguard Extended Market Idx I 19,377,246$ 2.6%Goldman Sachs Small/Mid Cap Growth 10,747,127$ 1.4%Vanguard Developed Markets Index Instl 11,834,808$ 1.6%Dodge & Cox International Stock 5,366,953$ 0.7%Franklin Mutual Global Discovery Fund A 13,960,956$ 1.9%Vanguard Target Retirement Income Inv 7,700,339$ 1.0%Vanguard Target Retirement 2015 Inv 22,972,782$ 3.1%Vanguard Target Retirement 2025 Inv 18,298,501$ 2.5%Vanguard Target Retirement 2035 Inv 27,108,711$ 3.7%Vanguard Target Retirement 2045 Inv 8,514,624$ 1.1%Vanguard Target Retirement 2055 Inv 1,508,746$ 0.2%TD Ameritrade SDBA 2,738,685$ 0.4%
Total 742,387,644$ 100.0%
Asset Allocation Summary: Total All Plans
March 31, 2017
34
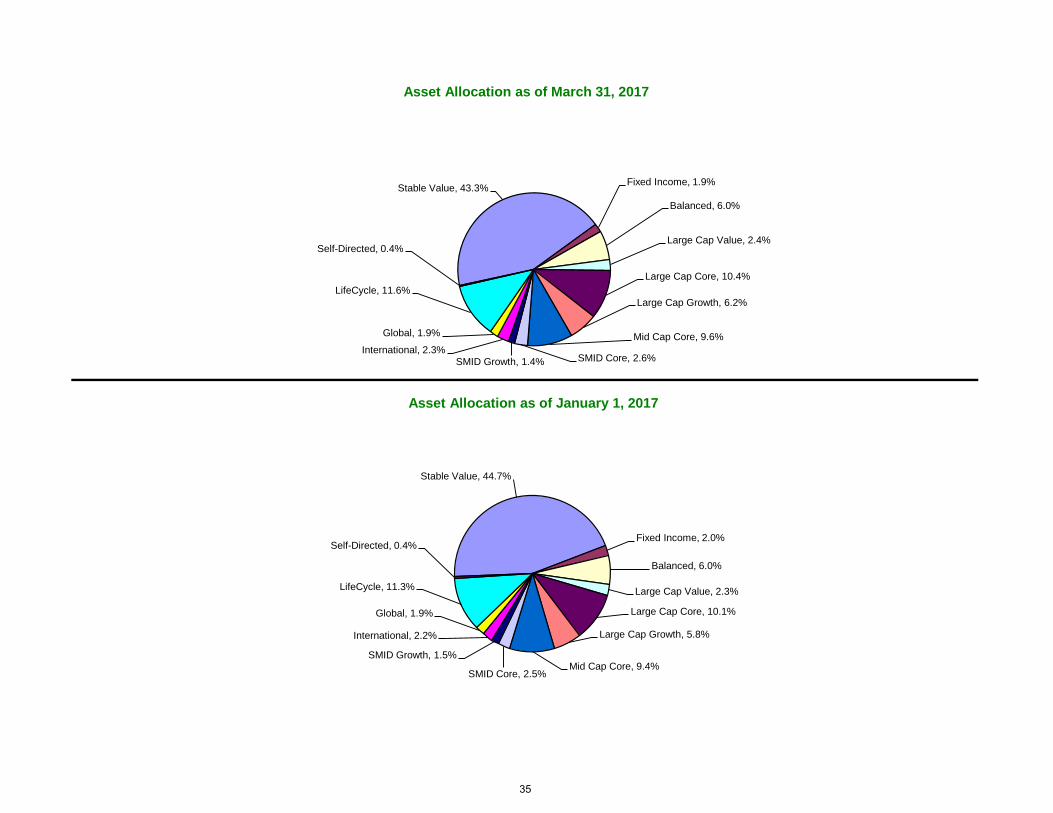
Stable Value, 44.7%
Fixed Income, 2.0%
Balanced, 6.0%
Large Cap Value, 2.3%
Large Cap Core, 10.1%
Large Cap Growth, 5.8%
Mid Cap Core, 9.4%SMID Core, 2.5%
SMID Growth, 1.5%
International, 2.2%
Global, 1.9%
LifeCycle, 11.3%
Self-Directed, 0.4%
Asset Allocation as of January 1, 2017
Stable Value, 43.3% Fixed Income, 1.9%
Balanced, 6.0%
Large Cap Value, 2.4%
Large Cap Core, 10.4%
Large Cap Growth, 6.2%
Mid Cap Core, 9.6%
SMID Core, 2.6%SMID Growth, 1.4%International, 2.3%
Global, 1.9%
LifeCycle, 11.6%
Self-Directed, 0.4%
Asset Allocation as of March 31, 2017
35
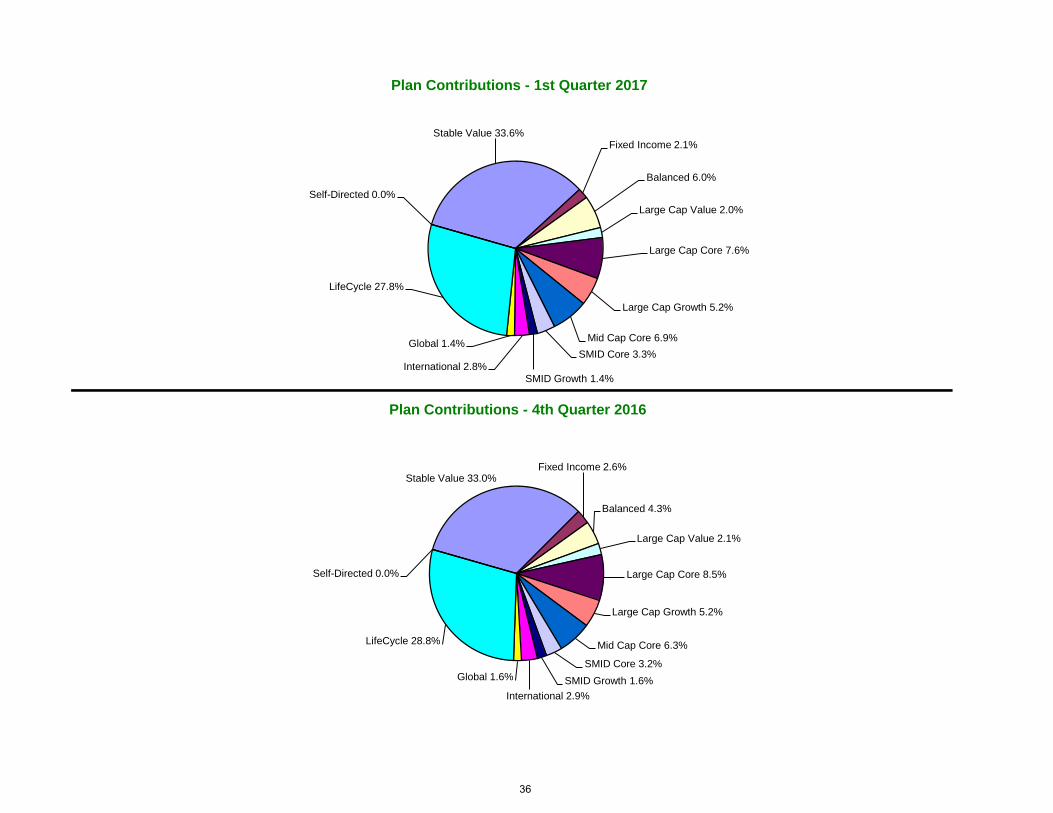
Stable Value 33.6%Fixed Income 2.1%
Balanced 6.0%
Large Cap Value 2.0%
Large Cap Core 7.6%
Large Cap Growth 5.2%
Mid Cap Core 6.9%SMID Core 3.3%
SMID Growth 1.4%International 2.8%
Global 1.4%
LifeCycle 27.8%
Self-Directed 0.0%
Plan Contributions - 1st Quarter 2017
Stable Value 33.0%Fixed Income 2.6%
Balanced 4.3%
Large Cap Value 2.1%
Large Cap Core 8.5%
Large Cap Growth 5.2%
Mid Cap Core 6.3%
SMID Core 3.2%SMID Growth 1.6%
International 2.9%
Global 1.6%
LifeCycle 28.8%
Self-Directed 0.0%
Plan Contributions - 4th Quarter 2016
36

Beginning Investment EndingBalance Loan Gain/Loss Balance
Funds January 1, 2017 Contributions Withdrawals Repayments Misc* Fees* (incl. Dividends) March 31, 2017
Voya Fixed Account 237,091,509$ 2,849,856$ (14,629)$ (5,294,520)$ 57,219$ 72,534$ (97,376)$ 1,603,140$ 236,267,733$
Vanguard Total Bond Market Index I 8,837,982$ 148,328$ 155,784$ (499,080)$ 17,488$ -$ (1,497)$ 80,714$ 8,739,720$
Voya T. Rowe Price Cap Apprec Port I 7,734,652$ 214,190$ (149,112)$ (276,613)$ 21,827$ -$ (265)$ 408,689$ 7,953,368$
Invesco Equity & Income R5 24,400,045$ 379,096$ 370,578$ (507,257)$ 7,271$ -$ (554)$ 593,128$ 25,242,306$
MFS Value Fund R4 11,021,304$ 149,872$ 119,863$ (228,546)$ 6,442$ -$ (913)$ 522,000$ 11,590,024$
Vanguard Institutional Index I 42,138,352$ 465,043$ 350,321$ (798,805)$ 17,107$ -$ (900)$ 2,541,050$ 44,712,169$
Parnassus Equity Income - Inv 5,378,705$ 106,631$ (117,728)$ (184,786)$ 12,170$ -$ (118)$ 236,276$ 5,431,149$
American Funds Growth Fund of Amer R3 5,756,513$ 110,752$ (216,312)$ (85,539)$ 11,283$ -$ (124)$ 444,678$ 6,021,251$
T Rowe Price Growth Stock Fund 17,885,407$ 215,375$ 16,850$ (313,720)$ 7,047$ -$ (204)$ 1,976,248$ 19,787,003$
Fidelity Contrafund 4,665,086$ 120,411$ (151,514)$ (96,349)$ 3,034$ -$ (93)$ 460,968$ 5,001,543$
Hartford Mid Cap HLS 33,061,481$ 316,348$ (123,493)$ (580,353)$ 10,601$ -$ (440)$ 1,934,187$ 34,618,331$
Oppenheimer Main Street Mid Cap Fund 14,796,402$ 164,298$ 13,020$ (312,825)$ 8,088$ -$ (637)$ 865,050$ 15,533,396$
Vanguard Extended Market Idx I 10,423,150$ 249,128$ 444,205$ (124,329)$ 16,867$ -$ (814)$ 485,688$ 11,493,896$
Goldman Sachs Small/Mid Cap Growth 6,621,847$ 112,581$ (227,675)$ (84,048)$ 8,837$ -$ (171)$ 664,106$ 7,095,476$
Vanguard Developed Markets Index Instl 6,527,966$ 123,233$ (70,867)$ (117,724)$ 4,415$ -$ (519)$ 504,457$ 6,970,962$
Dodge & Cox International Stock 3,056,261$ 71,135$ 163,893$ (74,231)$ 11,210$ -$ (350)$ 286,645$ 3,514,563$
Franklin Mutual Global Discovery Fund 8,714,123$ 105,854$ (36,360)$ (82,553)$ 3,091$ -$ (644)$ 380,948$ 9,084,459$
Vanguard Target Retirement Income Inv 4,447,270$ 113,684$ (10,538)$ (92,346)$ 53,625$ -$ (125)$ 109,509$ 4,621,079$
Vanguard Target Retirement 2015 Inv 18,943,275$ 415,049$ (823,131)$ (374,944)$ 14,542$ -$ (348)$ 624,006$ 18,798,447$
Vanguard Target Retirement 2025 Inv 11,444,438$ 659,821$ 40,085$ (131,717)$ 9,685$ -$ (660)$ 528,424$ 12,550,077$
Vanguard Target Retirement 2035 Inv 19,783,385$ 645,645$ (80,781)$ (412,681)$ 21,923$ -$ (921)$ 1,093,794$ 21,050,364$
Vanguard Target Retirement 2045 Inv 4,728,195$ 379,175$ (110,728)$ (123,728)$ 3,985$ -$ (250)$ 290,569$ 5,167,218$
Vanguard Target Retirement 2055 Inv 610,793$ 66,207$ 340,666$ (128)$ -$ -$ -$ 45,474$ 1,063,012$
TD Ameritrade SDBA 1,352,607$ -$ 85,131$ -$ -$ -$ -$ 73,481$ 1,511,220$
Total 509,420,745$ 8,181,712$ (32,470)$ (10,796,821)$ 327,758$ 72,534$ (107,923)$ 16,753,229$ 523,818,766$
Misc* Reimbursement account activity and death claimsFees* Loan and Morningstar fees
Interfund InterPlan
Exchanges
Plan Activity: State Plan ActivityJanuary 1, 2017 through March 31, 2017
37

Fund Assets % of Total AssetsVoya Fixed Account 236,267,733$ 45.1%Vanguard Total Bond Market Index I 8,739,720$ 1.7%Voya T. Rowe Price Cap Apprec Port I 7,953,368$ 1.5%Invesco Equity & Income R5 25,242,306$ 4.8%MFS Value Fund R4 11,590,024$ 2.2%Vanguard Institutional Index I 44,712,169$ 8.5%Parnassus Equity Income - Inv 5,431,149$ 1.0%American Funds Growth Fund of Amer R3 6,021,251$ 1.1%T Rowe Price Growth Stock Fund 19,787,003$ 3.8%Fidelity Contrafund 5,001,543$ 1.0%Hartford Mid Cap HLS 34,618,331$ 6.6%Oppenheimer Main Street Mid Cap Fund 15,533,396$ 3.0%Vanguard Extended Market Idx I 11,493,896$ 2.2%Goldman Sachs Small/Mid Cap Growth 7,095,476$ 1.4%Vanguard Developed Markets Index Instl 6,970,962$ 1.3%Dodge & Cox International Stock 3,514,563$ 0.7%Franklin Mutual Global Discovery Fund 9,084,459$ 1.7%Vanguard Target Retirement Income Inv 4,621,079$ 0.9%Vanguard Target Retirement 2015 Inv 18,798,447$ 3.6%Vanguard Target Retirement 2025 Inv 12,550,077$ 2.4%Vanguard Target Retirement 2035 Inv 21,050,364$ 4.0%Vanguard Target Retirement 2045 Inv 5,167,218$ 1.0%Vanguard Target Retirement 2055 Inv 1,063,012$ 0.2%TD Ameritrade SDBA 1,511,220$ 0.3%
Total 523,818,766$ 100.0%
March 31, 2017
Asset Allocation Summary: State Plan Activity
38
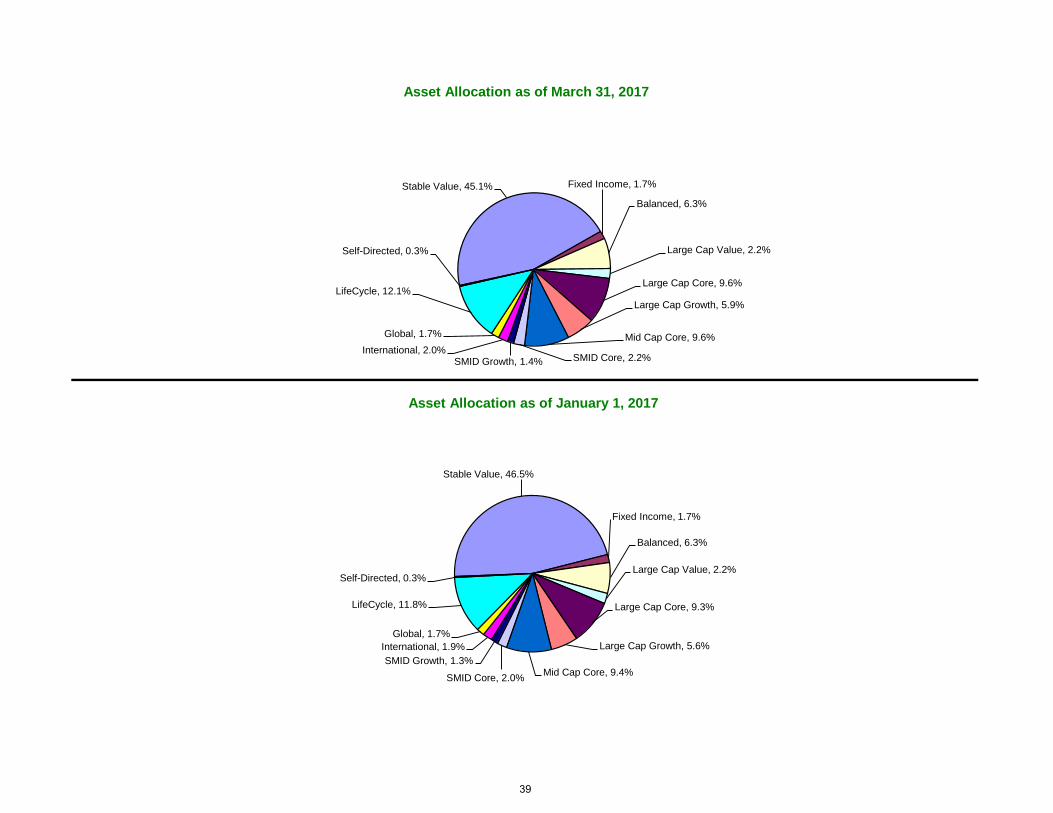
Stable Value, 46.5%
Fixed Income, 1.7%
Balanced, 6.3%
Large Cap Value, 2.2%
Large Cap Core, 9.3%
Large Cap Growth, 5.6%
Mid Cap Core, 9.4%SMID Core, 2.0%SMID Growth, 1.3%
International, 1.9%Global, 1.7%
LifeCycle, 11.8%
Self-Directed, 0.3%
Asset Allocation as of January 1, 2017
Stable Value, 45.1% Fixed Income, 1.7%
Balanced, 6.3%
Large Cap Value, 2.2%
Large Cap Core, 9.6%
Large Cap Growth, 5.9%
Mid Cap Core, 9.6%
SMID Core, 2.2%SMID Growth, 1.4%International, 2.0%
Global, 1.7%
LifeCycle, 12.1%
Self-Directed, 0.3%
Asset Allocation as of March 31, 2017
39

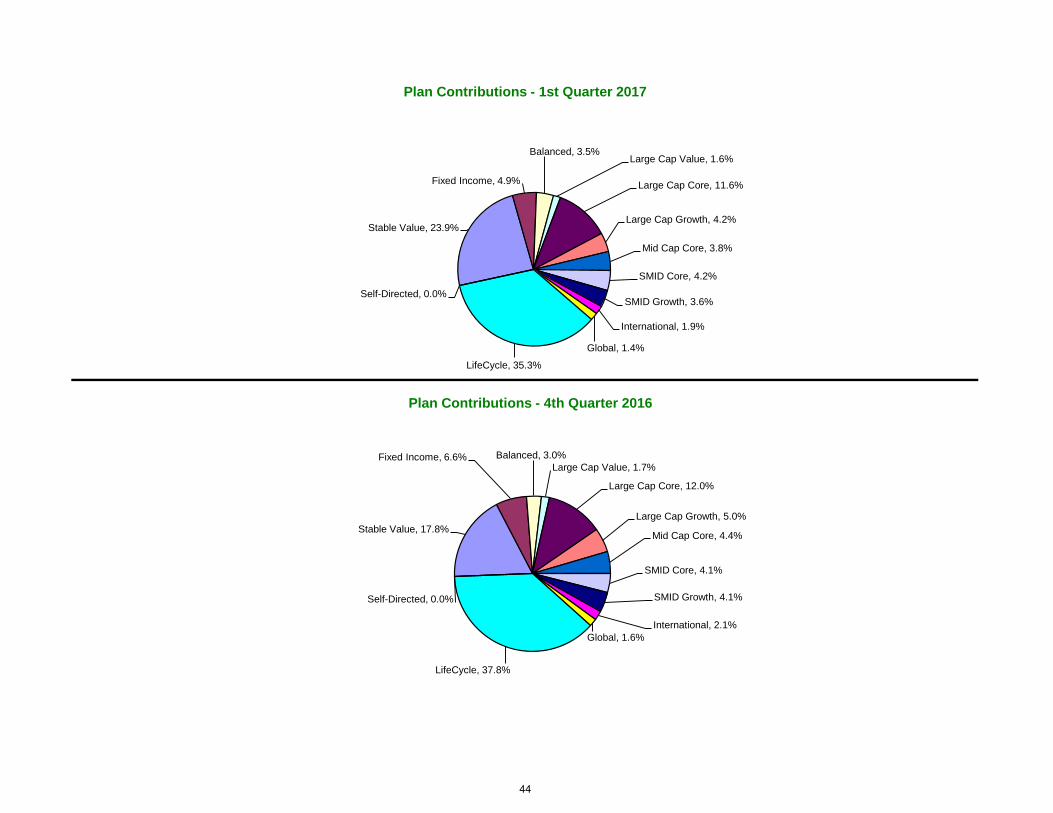
Stable Value 34.8% Fixed Income 1.8%
Balanced 7.3%
Large Cap Value 1.8%
Large Cap Core 7.0%
Large Cap Growth 5.5%Mid Cap Core 5.9%
SMID Core 3.0%
SMID Growth 1.4%
International 2.4%Global 1.3%
LifeCycle 27.9%
Self-Directed 0.0%
Plan Contributions - 1st Quarter 2017
Stable Value 34.4%Fixed Income 2.3%
Balanced 4.3%
Large Cap Value 1.9%
Large Cap Core 7.6%
Large Cap Growth 5.2%
Mid Cap Core 5.8%
SMID Core 2.7%
SMID Growth 1.7%International 2.4%
Global 1.5%
LifeCycle 30.1%
Self-Directed 0.0%
Plan Contributions - 4th Quarter 2016
40

Beginning Investment EndingBalance Gain/Loss Balance
Funds January 1, 2017 Contributions Withdrawals Fees* (incl. Dividends) March 31, 2017
Voya Fixed Account 13,534,603$ 300,836$ 200,849$ (558,415)$ (49)$ 92,530$ 13,570,354$
Vanguard Total Bond Market Index I 2,202,305$ 62,351$ (41,350)$ (1,517)$ (122)$ 19,857$ 2,241,524$
Voya T. Rowe Price Cap Apprec Port I 1,709,419$ 31,179$ (8,028)$ -$ (2)$ 92,460$ 1,825,029$
Invesco Equity & Income R5 1,252,363$ 13,294$ (2,215)$ -$ (27)$ 30,491$ 1,293,907$
MFS Value Fund R4 1,366,960$ 20,584$ (2,102)$ (9,606)$ (30)$ 65,615$ 1,441,422$
Vanguard Institutional Index I 6,891,161$ 127,059$ 167,557$ (41,586)$ (27)$ 424,162$ 7,568,325$
Parnassus Equity Income - Inv 637,674$ 18,992$ 33,960$ (12,812)$ -$ 28,462$ 706,275$
American Funds Growth Fund of Amer R3 1,103,448$ 10,242$ (669)$ (59,407)$ -$ 88,000$ 1,141,613$
T Rowe Price Growth Stock Fund 1,176,683$ 19,267$ (58,692)$ (312)$ -$ 126,452$ 1,263,399$
Fidelity Contrafund 757,690$ 22,849$ 35,124$ (3,876)$ -$ 77,156$ 888,943$
Hartford Mid Cap HLS 2,410,277$ 24,298$ 31,222$ (65,652)$ -$ 141,273$ 2,541,417$
Oppenheimer Main Street Mid Cap Fund 1,937,182$ 23,830$ (4,334)$ -$ (18)$ 113,476$ 2,070,136$
Vanguard Extended Market Idx I 2,958,870$ 53,208$ (265,014)$ (62,675)$ (25)$ 132,843$ 2,817,208$
Goldman Sachs Small/Mid Cap Growth 1,144,622$ 21,160$ (4,212)$ (3,486)$ -$ 117,479$ 1,275,564$
Vanguard Developed Markets Index Instl 876,569$ 23,772$ 38,574$ (51,248)$ (14)$ 72,009$ 959,661$
Dodge & Cox International Stock 1,240,184$ 23,822$ (40,402)$ (3,269)$ (11)$ 116,513$ 1,336,836$
Franklin Mutual Global Discovery Fund 1,023,789$ 18,113$ 29,827$ -$ (27)$ 45,421$ 1,117,123$
Vanguard Target Retirement Income Inv 1,354,426$ 60,639$ (55,664)$ (138,218)$ -$ 31,072$ 1,252,254$
Vanguard Target Retirement 2015 Inv 2,482,192$ 138,729$ (136,111)$ (169,694)$ -$ 82,561$ 2,397,677$
Vanguard Target Retirement 2025 Inv 2,135,044$ 113,340$ 29,378$ -$ -$ 101,360$ 2,379,122$
Vanguard Target Retirement 2035 Inv 2,157,569$ 73,829$ 58,251$ -$ -$ 120,966$ 2,410,615$
Vanguard Target Retirement 2045 Inv 875,289$ 51,252$ (6,538)$ (8,392)$ -$ 55,345$ 966,956$
Vanguard Target Retirement 2055 Inv 208,089$ 7,725$ -$ -$ -$ 13,112$ 228,926$
TD Ameritrade SDBA 30,654$ -$ 8,051$ -$ -$ 2,040$ 40,745$
Total 51,467,060$ 1,260,370$ 7,462$ (1,190,164)$ (351)$ 2,190,655$ 53,735,032$
Misc* Reimbursement account activity and death claimsFees* Loan and Morningstar fees
Plan Activity: Nevada System of Higher EducationJanuary 1, 2017 through March 31, 2017
Interfund InterPlan
Exchanges
41

Fund Assets % of Total AssetsVoya Fixed Account 13,570,354$ 25.3%Vanguard Total Bond Market Index I 2,241,524$ 4.2%Voya T. Rowe Price Cap Apprec Port I 1,825,029$ 3.4%Invesco Equity & Income R5 1,293,907$ 2.4%MFS Value Fund R4 1,441,422$ 2.7%Vanguard Institutional Index I 7,568,325$ 14.1%Parnassus Equity Income - Inv 706,275$ 1.3%American Funds Growth Fund of Amer R3 1,141,613$ 2.1%T Rowe Price Growth Stock Fund 1,263,399$ 2.4%Fidelity Contrafund 888,943$ 1.7%Hartford Mid Cap HLS 2,541,417$ 4.7%Oppenheimer Main Street Mid Cap Fund 2,070,136$ 3.9%Vanguard Extended Market Idx I 2,817,208$ 5.2%Goldman Sachs Small/Mid Cap Growth 1,275,564$ 2.4%Vanguard Developed Markets Index Instl 959,661$ 1.8%Dodge & Cox International Stock 1,336,836$ 2.5%Franklin Mutual Global Discovery Fund 1,117,123$ 2.1%Vanguard Target Retirement Income Inv 1,252,254$ 2.3%Vanguard Target Retirement 2015 Inv 2,397,677$ 4.5%Vanguard Target Retirement 2025 Inv 2,379,122$ 4.4%Vanguard Target Retirement 2035 Inv 2,410,615$ 4.5%Vanguard Target Retirement 2045 Inv 966,956$ 1.8%Vanguard Target Retirement 2055 Inv 228,926$ 0.4%TD Ameritrade SDBA 40,745$ 0.1%
Total 53,735,032$ 100.0%
Asset Allocation Summary: Nevada System of Higher Education
March 31, 2017
42

Stable Value, 26.3%
Fixed Income, 4.3%Balanced, 5.8%
Large Cap Value, 2.7%
Large Cap Core, 14.6%
Large Cap Growth, 5.9%
Mid Cap Core, 8.4%
SMID Core, 5.7%SMID Growth, 3.9%
International, 2.4%Global, 2.0%
LifeCycle, 17.9%
Self-Directed, 0.1%
Asset Allocation as of January 1, 2017
Stable Value, 25.3%
Fixed Income, 4.2%Balanced, 5.8%
Large Cap Value, 2.7%
Large Cap Core, 15.4%
Large Cap Growth, 6.1%
Mid Cap Core, 8.6%
SMID Core, 5.2%SMID Growth, 4.2%
International, 2.5%Global, 2.1%
LifeCycle, 17.9%
Self-Directed, 0.1%
Asset Allocation as of March 31, 2017
43
Stable Value, 17.8%
Fixed Income, 6.6% Balanced, 3.0%Large Cap Value, 1.7%
Large Cap Core, 12.0%
Large Cap Growth, 5.0%
Mid Cap Core, 4.4%
SMID Core, 4.1%
SMID Growth, 4.1%
International, 2.1%Global, 1.6%
LifeCycle, 37.8%
Self-Directed, 0.0%
Plan Contributions - 4th Quarter 2016
Stable Value, 23.9%
Fixed Income, 4.9%
Balanced, 3.5%Large Cap Value, 1.6%
Large Cap Core, 11.6%
Large Cap Growth, 4.2%
Mid Cap Core, 3.8%
SMID Core, 4.2%
SMID Growth, 3.6%
International, 1.9%
Global, 1.4%
LifeCycle, 35.3%
Self-Directed, 0.0%
Plan Contributions - 1st Quarter 2017
44
Beginning Investment EndingBalance Gain/Loss Balance
Funds January 1, 2017 Contributions Withdrawals Fees (incl. Dividends) March 31, 2017
Voya Fixed Account 71,120,452$ 1,043,368$ 214,850$ (1,104,568)$ (81)$ 481,666$ 71,755,688$
Vanguard Total Bond Market Index I 3,210,261$ 46,154$ 50,452$ (40,389)$ (186)$ 29,593$ 3,295,884$
Voya T. Rowe Price Cap Apprec Port I 1,245,010$ 35,697$ (104,015)$ (18,786)$ (0)$ 71,313$ 1,229,219$
Invesco Equity & Income R5 6,835,226$ 77,709$ 120,981$ (82,776)$ (45)$ 166,853$ 7,117,947$
MFS Value Fund R4 4,261,746$ 74,115$ 53,759$ (37,610)$ (89)$ 206,417$ 4,558,338$
Vanguard Institutional Index I 15,052,947$ 199,647$ 361,787$ (274,533)$ (44)$ 935,695$ 16,275,500$
Parnassus Equity Income - Inv 2,376,957$ 30,348$ 13,637$ (8,204)$ -$ 104,551$ 2,517,289$
American Funds Growth Fund of Amer R3 1,027,468$ 23,660$ 156,355$ (7,679)$ -$ 92,263$ 1,292,068$
T Rowe Price Growth Stock Fund 8,121,236$ 110,655$ (12,747)$ (71,104)$ -$ 902,962$ 9,051,001$
Fidelity Contrafund 1,271,597$ 16,224$ 4,224$ (41,263)$ -$ 128,134$ 1,378,916$
Hartford Mid Cap HLS 8,245,822$ 219,025$ (141,446)$ (60,662)$ -$ 484,075$ 8,746,814$
Oppenheimer Main Street Mid Cap Fund 7,225,591$ 110,812$ (62,993)$ (106,797)$ (43)$ 422,595$ 7,589,165$
Vanguard Extended Market Idx I 4,753,677$ 108,228$ 24,335$ (38,807)$ (70)$ 218,778$ 5,066,142$
Goldman Sachs Small/Mid Cap Growth 2,709,556$ 43,962$ (589,947)$ (22,755)$ -$ 235,273$ 2,376,087$
Vanguard Developed Markets Index Instl 3,660,870$ 89,911$ (108,613)$ (22,258)$ (41)$ 284,316$ 3,904,185$
Dodge & Cox International Stock 473,242$ 15,041$ (3,982)$ (12,641)$ (32)$ 43,927$ 515,554$
Franklin Mutual Global Discovery Fund 3,586,757$ 55,300$ (24,321)$ (15,852)$ (65)$ 157,555$ 3,759,374$
Vanguard Target Retirement Income Inv 1,620,220$ 11,154$ 158,009$ (3,019)$ -$ 40,641$ 1,827,006$
Vanguard Target Retirement 2015 Inv 1,798,596$ 34,820$ (81,924)$ (33,995)$ -$ 59,161$ 1,776,658$
Vanguard Target Retirement 2025 Inv 3,079,604$ 302,850$ (102,193)$ (55,589)$ -$ 144,630$ 3,369,302$
Vanguard Target Retirement 2035 Inv 3,286,876$ 229,085$ 7,056$ (59,478)$ -$ 184,193$ 3,647,732$
Vanguard Target Retirement 2045 Inv 2,075,803$ 155,683$ 48,183$ (30,736)$ -$ 131,516$ 2,380,449$
Vanguard Target Retirement 2055 Inv 156,300$ 17,460$ 32,985$ (759)$ -$ 10,821$ 216,808$
TD Ameritrade SDBA 1,148,746$ -$ 10,577$ -$ -$ 27,397$ 1,186,720$
Total 158,344,563$ 3,050,906$ 25,007$ (2,150,261)$ (696)$ 5,564,327$ 164,833,846$
Misc* Reimbursement account activity and death claimsFees* Loan and Morningstar fees
Plan Activity: Political SubdivisionJanuary 1, 2017 through March 31, 2017
Interfund InterPlan
Exchanges
45

Fund Assets % of Total AssetsVoya Fixed Account 71,755,688$ 43.5%Vanguard Total Bond Market Index I 3,295,884$ 2.0%Voya T. Rowe Price Cap Apprec Port I 1,229,219$ 0.7%Invesco Equity & Income R5 7,117,947$ 4.3%MFS Value Fund R4 4,558,338$ 2.8%Vanguard Institutional Index I 16,275,500$ 9.9%Parnassus Equity Income - Inv 2,517,289$ 1.5%American Funds Growth Fund of Amer R3 1,292,068$ 0.8%T Rowe Price Growth Stock Fund 9,051,001$ 5.5%Fidelity Contrafund 1,378,916$ 0.8%Hartford Mid Cap HLS 8,746,814$ 5.3%Oppenheimer Main Street Mid Cap Fund 7,589,165$ 4.6%Vanguard Extended Market Idx I 5,066,142$ 3.1%Goldman Sachs Small/Mid Cap Growth 2,376,087$ 1.4%Vanguard Developed Markets Index Instl 3,904,185$ 2.4%Dodge & Cox International Stock 515,554$ 0.3%Franklin Mutual Global Discovery Fund 3,759,374$ 2.3%Vanguard Target Retirement Income Inv 1,827,006$ 1.1%Vanguard Target Retirement 2015 Inv 1,776,658$ 1.1%Vanguard Target Retirement 2025 Inv 3,369,302$ 2.0%Vanguard Target Retirement 2035 Inv 3,647,732$ 2.2%Vanguard Target Retirement 2045 Inv 2,380,449$ 1.4%Vanguard Target Retirement 2055 Inv 216,808$ 0.1%Vanguard Target Retirement 2055 Inv 1,186,720$ 0.7%
Total 164,833,846$ 100.0%
Asset Allocation Summary: Political Subdivision
March 31, 2017
46

Stable Value, 44.9%
Fixed Income, 2.0%
Balanced, 5.1%
Large Cap Value, 2.7%
Large Cap Core, 11.0%
Large Cap Growth, 6.6%Mid Cap Core, 9.8%SMID Core, 3.0%
SMID Growth, 4.0%
International, 0.3%
Global, 2.3%
LifeCycle, 7.6%
Self-Directed, 0.7%
Asset Allocation as of January 1, 2017
Stable Value, 43.5%Fixed Income, 2.0%
Balanced, 5.1%Large Cap Value, 2.8%
Large Cap Core, 11.4%
Large Cap Growth, 7.1%
Mid Cap Core, 9.9%
SMID Core, 3.1%SMID Growth, 3.8%
International, 0.3%Global, 2.3%
LifeCycle, 8.0%
Self-Directed, 0.7%
Asset Allocation as of March 31, 2017
47

Stable Value, 35.4%
Fixed Income, 1.7%Balanced, 4.8%
Large Cap Value, 2.9%
Large Cap Core, 9.4%
Large Cap Growth, 5.2%
Mid Cap Core, 8.4%
SMID Core, 4.1%
SMID Growth, 4.5%International, 0.5%
Global, 2.0%
LifeCycle, 21.0%
Self-Directed, 0.0%
Plan Contributions - 4th Quarter 2016
Stable Value, 34.2%
Fixed Income, 1.5%
Balanced, 3.7%
Large Cap Value, 2.4%Large Cap Core, 7.5%
Large Cap Growth, 4.9%
Mid Cap Core, 10.8%
SMID Core, 3.5%
SMID Growth, 4.4%International, 0.5%
Global, 1.8%LifeCycle, 24.6%
Self-Directed, 0.0%
Plan Contributions - 1st Quarter 2017
48

Nevada Public Employees' Deferred Compensation Program
Summary of Loan Activity
As of March 31, 2017
Loans Issued* Loans Paid in Full* Outstanding Balance Principal Paid* Interest Paid*
432 12 $2,821,012 $95,262 $9,891
*Total loans since inception.
Summary of Roth Accounts
Number of Accounts Total Balance Number of Accounts Total Balance
State 987 $4,068,151 1033 $4,477,338
NSHE 72 $1,093,703 76 $1,108,109
Poltical Sub Divisions 116 $594,866 120 $626,270
Total 1175 $5,756,719 1229 $6,211,717
As of January 1, 2017 As of March 31, 2017
49

FICA Plan Activity All State Pol. Sub-Division NSHE
Number of Participants Actively Contributing: 5,704 133 479 5,092
Number of Participants with Account Balance: 20,229 930 1,557 17,742
Average Account Balance: $1,518 $1,623 $1,239 $1,693
Closing Balance as of 12/31/2016: $32,759,971 $1,547,127 $1,894,601 $29,318,243
Closing Balance as of 3/31/2017: $33,478,779 $1,509,546 $1,928,341 $30,040,892
50
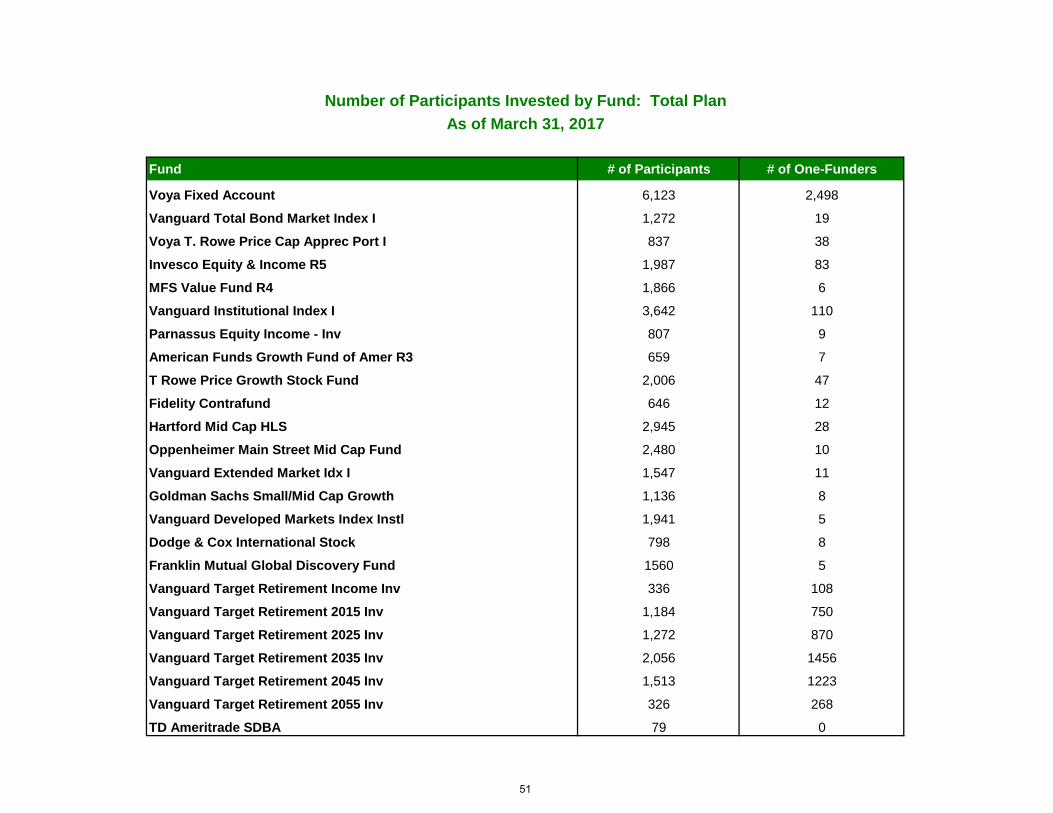
Fund # of Participants # of One-Funders
Voya Fixed Account 6,123 2,498
Vanguard Total Bond Market Index I 1,272 19
Voya T. Rowe Price Cap Apprec Port I 837 38
Invesco Equity & Income R5 1,987 83
MFS Value Fund R4 1,866 6
Vanguard Institutional Index I 3,642 110
Parnassus Equity Income - Inv 807 9
American Funds Growth Fund of Amer R3 659 7
T Rowe Price Growth Stock Fund 2,006 47
Fidelity Contrafund 646 12
Hartford Mid Cap HLS 2,945 28
Oppenheimer Main Street Mid Cap Fund 2,480 10
Vanguard Extended Market Idx I 1,547 11
Goldman Sachs Small/Mid Cap Growth 1,136 8
Vanguard Developed Markets Index Instl 1,941 5
Dodge & Cox International Stock 798 8
Franklin Mutual Global Discovery Fund 1560 5
Vanguard Target Retirement Income Inv 336 108
Vanguard Target Retirement 2015 Inv 1,184 750
Vanguard Target Retirement 2025 Inv 1,272 870
Vanguard Target Retirement 2035 Inv 2,056 1456
Vanguard Target Retirement 2045 Inv 1,513 1223
Vanguard Target Retirement 2055 Inv 326 268
TD Ameritrade SDBA 79 0
Number of Participants Invested by Fund: Total PlanAs of March 31, 2017
51

Number of Funds Number of Participants Percent
One 7,579 53.31%Two 1,434 10.09%
Three 1018 7.16%Four 1029 7.24%Five 1,141 8.03%Six 837 5.89%
Seven 371 2.61%Eight 220 1.55%Nine 166 1.17%
Ten + 423 2.98%
TOTAL 14,218 100.00%
Average number of funds being used in the Plan: 2.7
Investment Diversification as of 1st Quarter 2017
52

Fund
Total Stock Market Index
Fund
Total International Stock Index
Fund
Total Bond Market Index II
Fund
Total Intl Bond Market Index
Fund
ST Inflation-Protected Securities
Fund Stocks Bonds & Cash
2055 54.1% 35.8% 7.1% 3.0% 0.0% 89.9% 10.1%
2045 53.7% 36.2% 7.1% 3.0% 0.0% 89.9% 10.1%
2035 47.6% 32.0% 14.4% 6.0% 0.0% 79.6% 20.4%
2025 38.6% 26.0% 24.9% 10.5% 0.0% 64.6% 35.4%
2015 26.8% 17.9% 31.6% 13.4% 10.3% 44.7% 55.3%
Income 18.8% 12.1% 37.4% 15.9% 16.6% 30.9% 69.9%
Vanguard Target Date Retirement FundsEstimated allocations
0
20
40
60
80
100
2060
2055
2050
2045
2040
2035
2030
2025
2020
2015
2010
Inco
me
TRT Allocations
Stocks Bonds & Cash
53
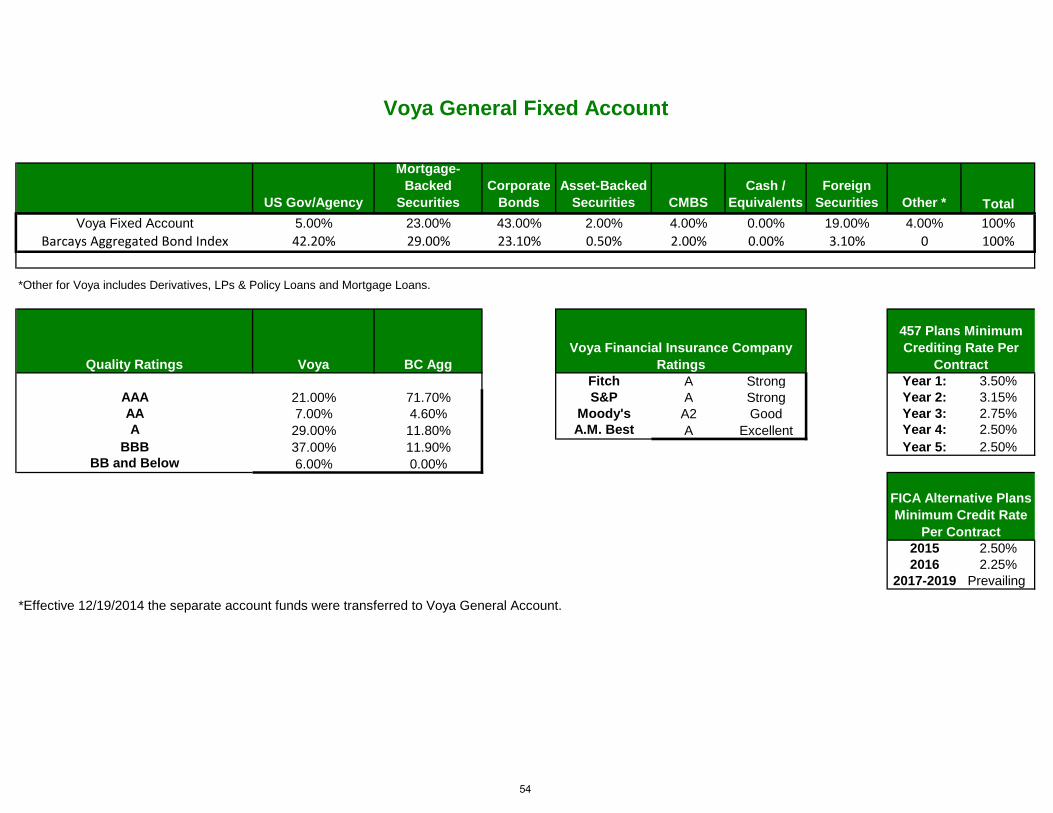
US Gov/Agency
Mortgage-Backed
SecuritiesCorporate
BondsAsset-Backed
Securities CMBSCash /
EquivalentsForeign
Securities Other * TotalVoya Fixed Account 5.00% 23.00% 43.00% 2.00% 4.00% 0.00% 19.00% 4.00% 100%
Barcays Aggregated Bond Index 42.20% 29.00% 23.10% 0.50% 2.00% 0.00% 3.10% 0 100%
*Other for Voya includes Derivatives, LPs & Policy Loans and Mortgage Loans.
Quality Ratings Voya BC AggFitch A Strong Year 1: 3.50%
AAA 21.00% 71.70% S&P A Strong Year 2: 3.15%AA 7.00% 4.60% Moody's A2 Good Year 3: 2.75%A 29.00% 11.80% A.M. Best A Excellent Year 4: 2.50%
BBB 37.00% 11.90% Year 5: 2.50%BB and Below 6.00% 0.00%
2015 2.50%2016 2.25%
2017-2019 Prevailing
*Effective 12/19/2014 the separate account funds were transferred to Voya General Account.
FICA Alternative Plans Minimum Credit Rate
Per Contract
Voya General Fixed Account
Voya Financial Insurance Company Ratings
457 Plans Minimum Crediting Rate Per
Contract
54
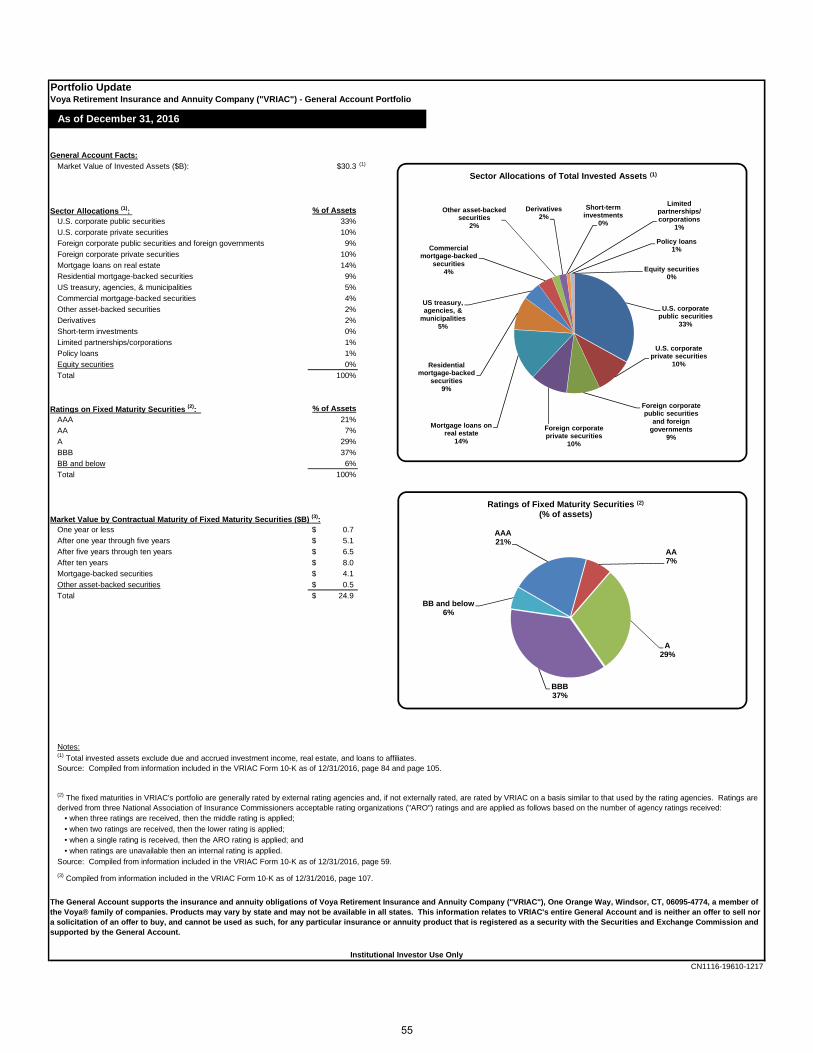
Portfolio UpdateVoya Retirement Insurance and Annuity Company ("VRIAC") - General Account Portfolio
General Account Facts:Market Value of Invested Assets ($B): $30.3 (1)
Sector Allocations (1): % of AssetsU.S. corporate public securities 33%U.S. corporate private securities 10%Foreign corporate public securities and foreign governments 9%Foreign corporate private securities 10%Mortgage loans on real estate 14%Residential mortgage-backed securities 9%US treasury, agencies, & municipalities 5%Commercial mortgage-backed securities 4%Other asset-backed securities 2%Derivatives 2%Short-term investments 0%Limited partnerships/corporations 1%Policy loans 1%Equity securities 0%Total 100%
Ratings on Fixed Maturity Securities (2): % of AssetsAAA 21%AA 7%A 29%BBB 37%BB and below 6%Total 100%
Market Value by Contractual Maturity of Fixed Maturity Securities ($B) (3):One year or less 0.7$ After one year through five years 5.1$ After five years through ten years 6.5$ After ten years 8.0$ Mortgage-backed securities 4.1$ Other asset-backed securities 0.5$ Total 24.9$
Notes:
CN1116-19610-1217
• when three ratings are received, then the middle rating is applied;
(1) Total invested assets exclude due and accrued investment income, real estate, and loans to affiliates. Source: Compiled from information included in the VRIAC Form 10-K as of 12/31/2016, page 84 and page 105.
(2) The fixed maturities in VRIAC's portfolio are generally rated by external rating agencies and, if not externally rated, are rated by VRIAC on a basis similar to that used by the rating agencies. Ratings are derived from three National Association of Insurance Commissioners acceptable rating organizations ("ARO") ratings and are applied as follows based on the number of agency ratings received:
As of December 31, 2016
The General Account supports the insurance and annuity obligations of Voya Retirement Insurance and Annuity Company ("VRIAC"), One Orange Way, Windsor, CT, 06095-4774, a member of the Voya® family of companies. Products may vary by state and may not be available in all states. This information relates to VRIAC's entire General Account and is neither an offer to sell nor a solicitation of an offer to buy, and cannot be used as such, for any particular insurance or annuity product that is registered as a security with the Securities and Exchange Commission and supported by the General Account.
Institutional Investor Use Only
• when two ratings are received, then the lower rating is applied;• when a single rating is received, then the ARO rating is applied; and• when ratings are unavailable then an internal rating is applied.
Source: Compiled from information included in the VRIAC Form 10-K as of 12/31/2016, page 59.(3) Compiled from information included in the VRIAC Form 10-K as of 12/31/2016, page 107.
AAA21%
AA7%
A29%
BBB37%
BB and below6%
Ratings of Fixed Maturity Securities (2)
(% of assets)
U.S. corporate public securities
33%
U.S. corporate private securities
10%
Foreign corporate public securities
and foreign governments
9%Foreign corporate private securities
10%
Mortgage loans on real estate
14%
Residential mortgage-backed
securities9%
US treasury, agencies, &
municipalities5%
Commercial mortgage-backed
securities4%
Other asset-backed securities
2%
Derivatives2%
Short-term investments
0%
Limited partnerships/corporations
1%
Policy loans1%
Equity securities0%
Sector Allocations of Total Invested Assets (1)
55
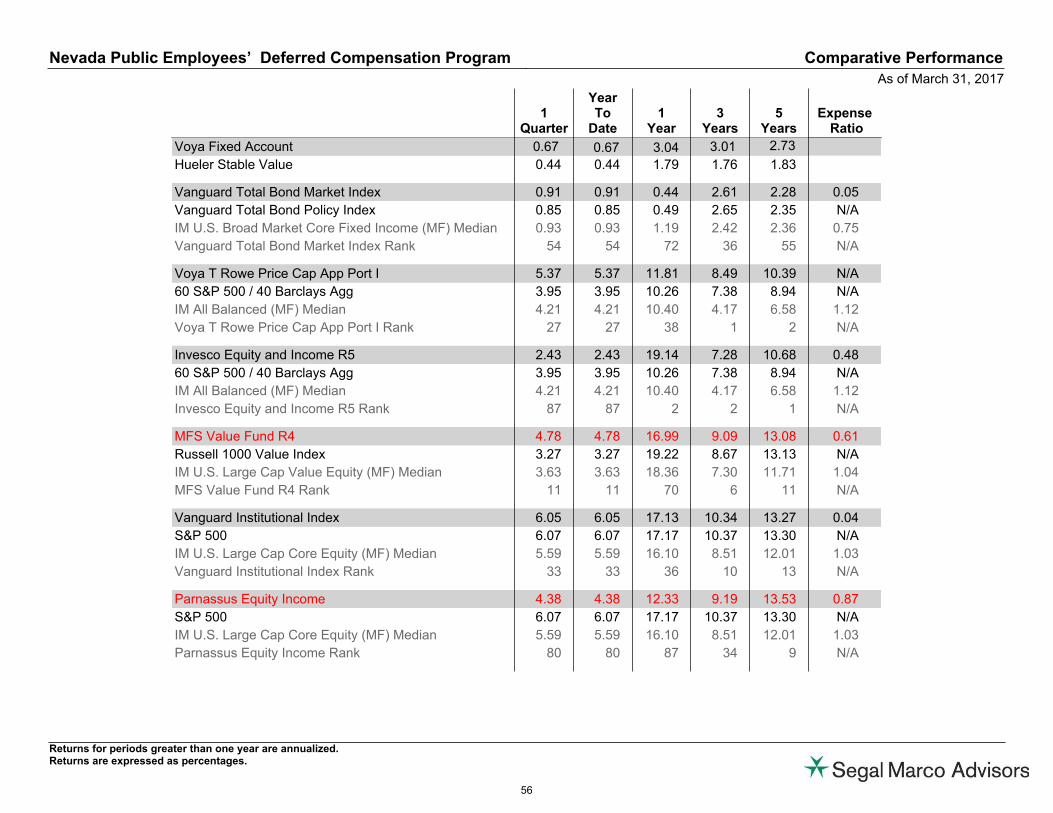
1Quarter
YearTo
Date1
Year3
Years5
YearsExpense
Ratio
Voya Fixed Account 0.67 0.67 3.04 3.01 2.73Hueler Stable Value 0.44 0.44 1.79 1.76 1.83
Vanguard Total Bond Market Index 0.91 0.91 0.44 2.61 2.28 0.05
Vanguard Total Bond Policy Index 0.85 0.85 0.49 2.65 2.35 N/A
IM U.S. Broad Market Core Fixed Income (MF) Median 0.93 0.93 1.19 2.42 2.36 0.75
Vanguard Total Bond Market Index Rank 54 54 72 36 55 N/A
Voya T Rowe Price Cap App Port I 5.37 5.37 11.81 8.49 10.39 N/A
60 S&P 500 / 40 Barclays Agg 3.95 3.95 10.26 7.38 8.94 N/A
IM All Balanced (MF) Median 4.21 4.21 10.40 4.17 6.58 1.12
Voya T Rowe Price Cap App Port I Rank 27 27 38 1 2 N/A
Invesco Equity and Income R5 2.43 2.43 19.14 7.28 10.68 0.48
60 S&P 500 / 40 Barclays Agg 3.95 3.95 10.26 7.38 8.94 N/A
IM All Balanced (MF) Median 4.21 4.21 10.40 4.17 6.58 1.12
Invesco Equity and Income R5 Rank 87 87 2 2 1 N/A
MFS Value Fund R4 4.78 4.78 16.99 9.09 13.08 0.61
Russell 1000 Value Index 3.27 3.27 19.22 8.67 13.13 N/A
IM U.S. Large Cap Value Equity (MF) Median 3.63 3.63 18.36 7.30 11.71 1.04
MFS Value Fund R4 Rank 11 11 70 6 11 N/A
Vanguard Institutional Index 6.05 6.05 17.13 10.34 13.27 0.04
S&P 500 6.07 6.07 17.17 10.37 13.30 N/A
IM U.S. Large Cap Core Equity (MF) Median 5.59 5.59 16.10 8.51 12.01 1.03
Vanguard Institutional Index Rank 33 33 36 10 13 N/A
Parnassus Equity Income 4.38 4.38 12.33 9.19 13.53 0.87
S&P 500 6.07 6.07 17.17 10.37 13.30 N/A
IM U.S. Large Cap Core Equity (MF) Median 5.59 5.59 16.10 8.51 12.01 1.03
Parnassus Equity Income Rank 80 80 87 34 9 N/A
Nevada Public Employees’ Deferred Compensation Program Comparative Performance
As of March 31, 2017
Returns for periods greater than one year are annualized.Returns are expressed as percentages.
56

Nevada Public Employees’ Deferred Compensation Program Comparative Performance
As of March 31, 2017
1Quarter
YearTo
Date1
Year3
Years5
YearsExpense
Ratio
American Funds Growth Fund R3 8.01 8.01 19.94 9.83 13.35 0.98
Russell 1000 Growth Index 8.91 8.91 15.76 11.27 13.32 N/A
IM U.S. Large Cap Growth Equity (MF) Median 9.34 9.34 14.56 9.27 11.57 1.08
American Funds Growth Fund R3 Rank 79 79 6 35 14 N/A
T.Rowe Price Growth Stock 11.14 11.14 19.10 11.24 13.57 0.67
Russell 1000 Growth Index 8.91 8.91 15.76 11.27 13.32 N/A
IM U.S. Large Cap Growth Equity (MF) Median 9.34 9.34 14.56 9.27 11.57 1.08
T.Rowe Price Growth Stock Rank 13 13 11 11 11 N/A
Fidelity Contrafund 10.09 10.09 15.61 9.72 12.48 0.71
Russell 1000 Growth Index 8.91 8.91 15.76 11.27 13.32 N/A
IM U.S. Large Cap Growth Equity (MF) Median 9.34 9.34 14.56 9.27 11.57 1.08
Fidelity Contrafund Rank 31 31 34 38 32 N/A
Hartford Mid Cap HLS 5.85 5.85 17.76 8.61 13.70 0.95
Russell Midcap Index 5.15 5.15 17.03 8.48 13.09 N/A
IM U.S. Mid Cap Core Equity (MF) Median 4.24 4.24 17.35 6.87 11.62 1.20
Hartford Mid Cap HLS Rank 14 14 47 20 7 N/A
Oppenheimer Main Street Mid Cap Fund 5.84 5.84 17.13 6.68 11.55 0.86
Russell Midcap Index 5.15 5.15 17.03 8.48 13.09 N/A
IM U.S. Mid Cap Core Equity (MF) Median 4.24 4.24 17.35 6.87 11.62 1.20
Oppenheimer Main Street Mid Cap Fund Rank 14 14 53 53 53 N/A
Vanguard Extended Market Idx I 4.57 4.57 22.52 7.16 12.62 0.07
S&P Completion Index 4.57 4.57 22.36 7.02 12.51 N/A
IM U.S. SMID Cap Core Equity (MF) Median 2.36 2.36 21.21 6.78 11.64 1.18
Vanguard Extended Market Idx I Rank 10 10 35 43 30 N/A
Goldman Sachs Small/Mid Cap Growth 10.20 10.20 15.48 5.12 11.20 1.31
Russell 2500 Growth Index 6.25 6.25 19.77 7.23 12.17 N/A
IM U.S. SMID Cap Growth Equity (MF) Median 6.27 6.27 21.55 5.34 10.61 1.26
Goldman Sachs Small/Mid Cap Growth Rank 6 6 95 54 39 N/A
Returns for periods greater than one year are annualized.Returns are expressed as percentages.
57
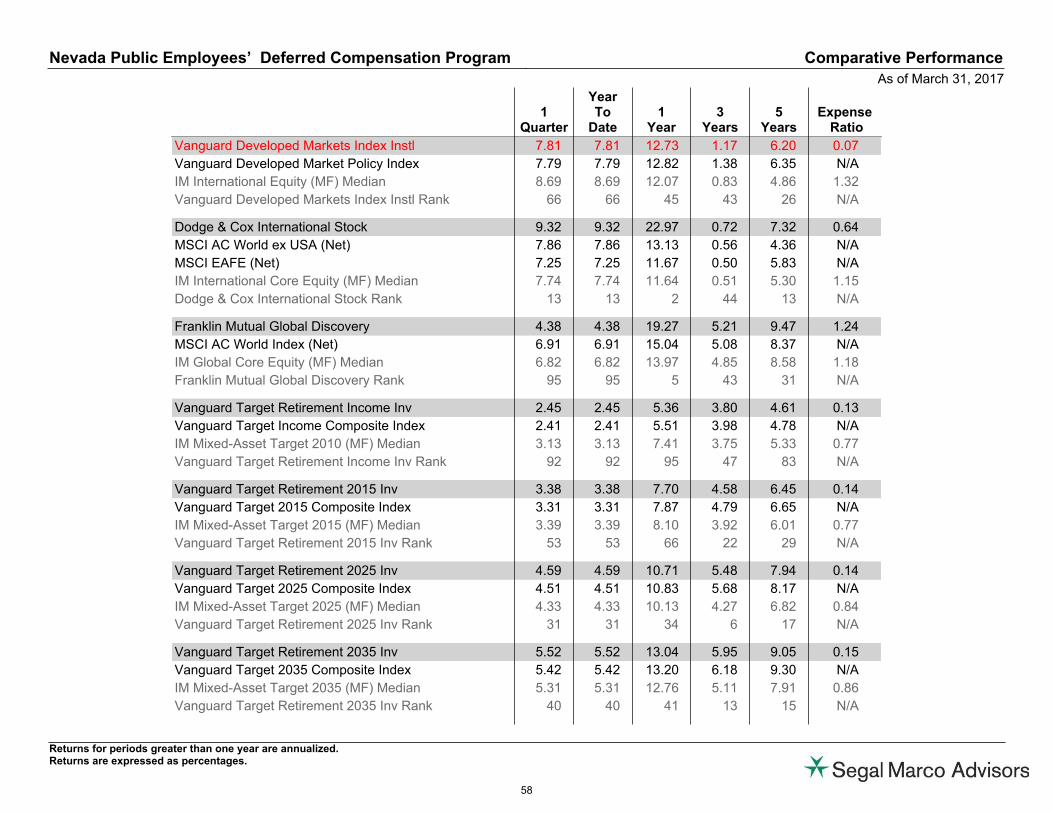
Nevada Public Employees’ Deferred Compensation Program Comparative Performance
As of March 31, 2017
1Quarter
YearTo
Date1
Year3
Years5
YearsExpense
Ratio
Vanguard Developed Markets Index Instl 7.81 7.81 12.73 1.17 6.20 0.07
Vanguard Developed Market Policy Index 7.79 7.79 12.82 1.38 6.35 N/A
IM International Equity (MF) Median 8.69 8.69 12.07 0.83 4.86 1.32
Vanguard Developed Markets Index Instl Rank 66 66 45 43 26 N/A
Dodge & Cox International Stock 9.32 9.32 22.97 0.72 7.32 0.64
MSCI AC World ex USA (Net) 7.86 7.86 13.13 0.56 4.36 N/A
MSCI EAFE (Net) 7.25 7.25 11.67 0.50 5.83 N/A
IM International Core Equity (MF) Median 7.74 7.74 11.64 0.51 5.30 1.15
Dodge & Cox International Stock Rank 13 13 2 44 13 N/A
Franklin Mutual Global Discovery 4.38 4.38 19.27 5.21 9.47 1.24
MSCI AC World Index (Net) 6.91 6.91 15.04 5.08 8.37 N/A
IM Global Core Equity (MF) Median 6.82 6.82 13.97 4.85 8.58 1.18
Franklin Mutual Global Discovery Rank 95 95 5 43 31 N/A
Vanguard Target Retirement Income Inv 2.45 2.45 5.36 3.80 4.61 0.13
Vanguard Target Income Composite Index 2.41 2.41 5.51 3.98 4.78 N/A
IM Mixed-Asset Target 2010 (MF) Median 3.13 3.13 7.41 3.75 5.33 0.77
Vanguard Target Retirement Income Inv Rank 92 92 95 47 83 N/A
Vanguard Target Retirement 2015 Inv 3.38 3.38 7.70 4.58 6.45 0.14
Vanguard Target 2015 Composite Index 3.31 3.31 7.87 4.79 6.65 N/A
IM Mixed-Asset Target 2015 (MF) Median 3.39 3.39 8.10 3.92 6.01 0.77
Vanguard Target Retirement 2015 Inv Rank 53 53 66 22 29 N/A
Vanguard Target Retirement 2025 Inv 4.59 4.59 10.71 5.48 7.94 0.14
Vanguard Target 2025 Composite Index 4.51 4.51 10.83 5.68 8.17 N/A
IM Mixed-Asset Target 2025 (MF) Median 4.33 4.33 10.13 4.27 6.82 0.84
Vanguard Target Retirement 2025 Inv Rank 31 31 34 6 17 N/A
Vanguard Target Retirement 2035 Inv 5.52 5.52 13.04 5.95 9.05 0.15
Vanguard Target 2035 Composite Index 5.42 5.42 13.20 6.18 9.30 N/A
IM Mixed-Asset Target 2035 (MF) Median 5.31 5.31 12.76 5.11 7.91 0.86
Vanguard Target Retirement 2035 Inv Rank 40 40 41 13 15 N/A
Returns for periods greater than one year are annualized.Returns are expressed as percentages.
58

Nevada Public Employees’ Deferred Compensation Program Comparative Performance
As of March 31, 2017
1Quarter
YearTo
Date1
Year3
Years5
YearsExpense
Ratio
Vanguard Target Retirement 2045 Inv 6.19 6.19 14.71 6.24 9.50 0.16
Vanguard Target 2045 Composite Index 6.04 6.04 14.76 6.51 9.77 N/A
IM Mixed-Asset Target 2045 (MF) Median 5.86 5.86 14.08 5.50 8.60 0.87
Vanguard Target Retirement 2045 Inv Rank 32 32 31 14 16 N/A
Vanguard Target Retirement 2055 Inv 6.17 6.17 14.70 6.19 9.47 0.16
Vanguard Target 2055 Composite Index 6.04 6.04 14.76 6.51 9.77 N/A
IM Mixed-Asset Target 2055+ (MF) Median 6.06 6.06 14.45 5.59 8.93 0.87
Vanguard Target Retirement 2055 Inv Rank 43 43 40 19 26 N/A
Returns for periods greater than one year are annualized.Returns are expressed as percentages.
59

60

0
Investment Manager Performance
61

Peer Group Analysis - IM U.S. Broad Market Core Fixed Income (MF)
-3.0
-2.0
-1.0
0.0
1.0
2.0
3.0
4.0
5.0
6.0
7.0
Re
turn
1 Qtr YTD 1 Yr 3 Yrs 5 Yrs 7 Yrs 10 Yrs
Vanguard Total Bond Market Index 0.91 (54) 0.91 (54) 0.44 (72) 2.61 (36) 2.28 (55) 3.44 (55) 4.26 (38)¢£
Vanguard Total Bond Policy Index 0.85 (63) 0.85 (63) 0.49 (71) 2.65 (32) 2.35 (51) 3.51 (50) 4.30 (37)��
5th Percentile 1.33 1.33 3.58 3.25 3.44 4.65 5.02
1st Quartile 1.10 1.10 2.04 2.70 2.78 3.94 4.52
Median 0.93 0.93 1.19 2.42 2.36 3.51 4.06
3rd Quartile 0.76 0.76 0.33 1.94 1.95 3.07 3.60
95th Percentile 0.56 0.56 -0.45 1.36 1.37 2.37 2.17
Vanguard Total Bond Market Index
Nevada Public Employees’ Deferred Compensation ProgramMarch 31, 2017
62
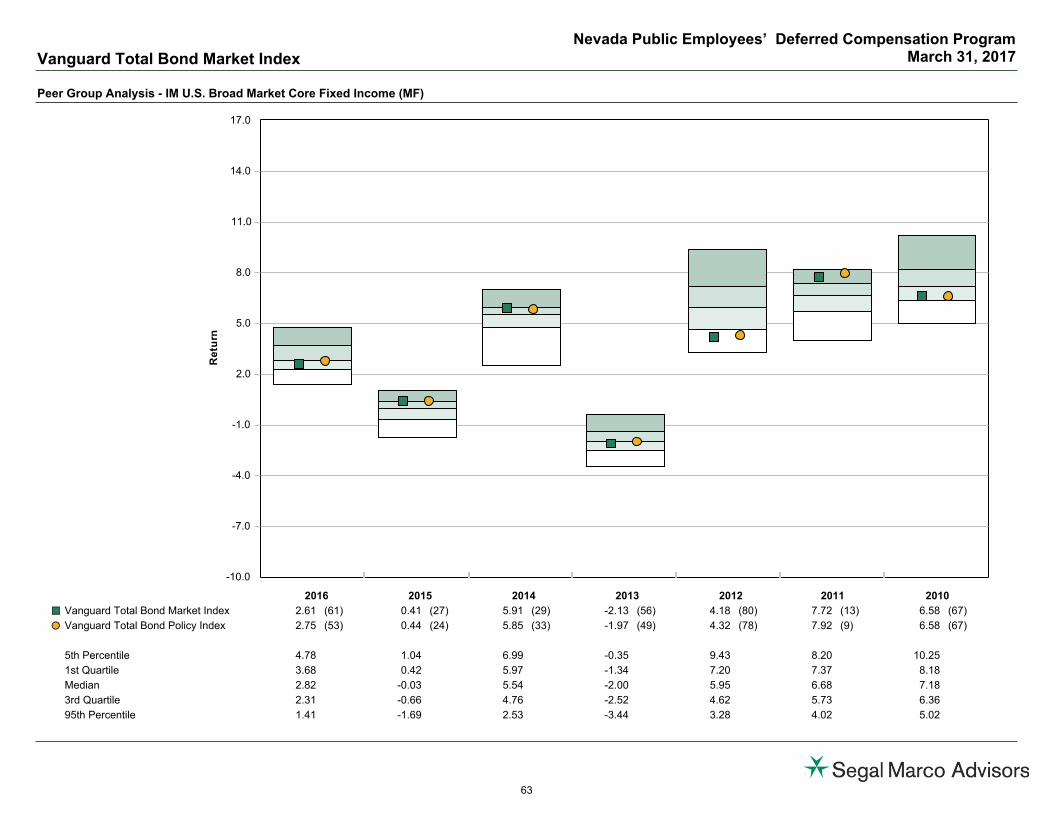
Peer Group Analysis - IM U.S. Broad Market Core Fixed Income (MF)
-10.0
-7.0
-4.0
-1.0
2.0
5.0
8.0
11.0
14.0
17.0
Re
turn
2016 2015 2014 2013 2012 2011 2010
Vanguard Total Bond Market Index 2.61 (61) 0.41 (27) 5.91 (29) -2.13 (56) 4.18 (80) 7.72 (13) 6.58 (67)¢£
Vanguard Total Bond Policy Index 2.75 (53) 0.44 (24) 5.85 (33) -1.97 (49) 4.32 (78) 7.92 (9) 6.58 (67)��
5th Percentile 4.78 1.04 6.99 -0.35 9.43 8.20 10.25
1st Quartile 3.68 0.42 5.97 -1.34 7.20 7.37 8.18
Median 2.82 -0.03 5.54 -2.00 5.95 6.68 7.18
3rd Quartile 2.31 -0.66 4.76 -2.52 4.62 5.73 6.36
95th Percentile 1.41 -1.69 2.53 -3.44 3.28 4.02 5.02
Vanguard Total Bond Market Index
Nevada Public Employees’ Deferred Compensation ProgramMarch 31, 2017
63
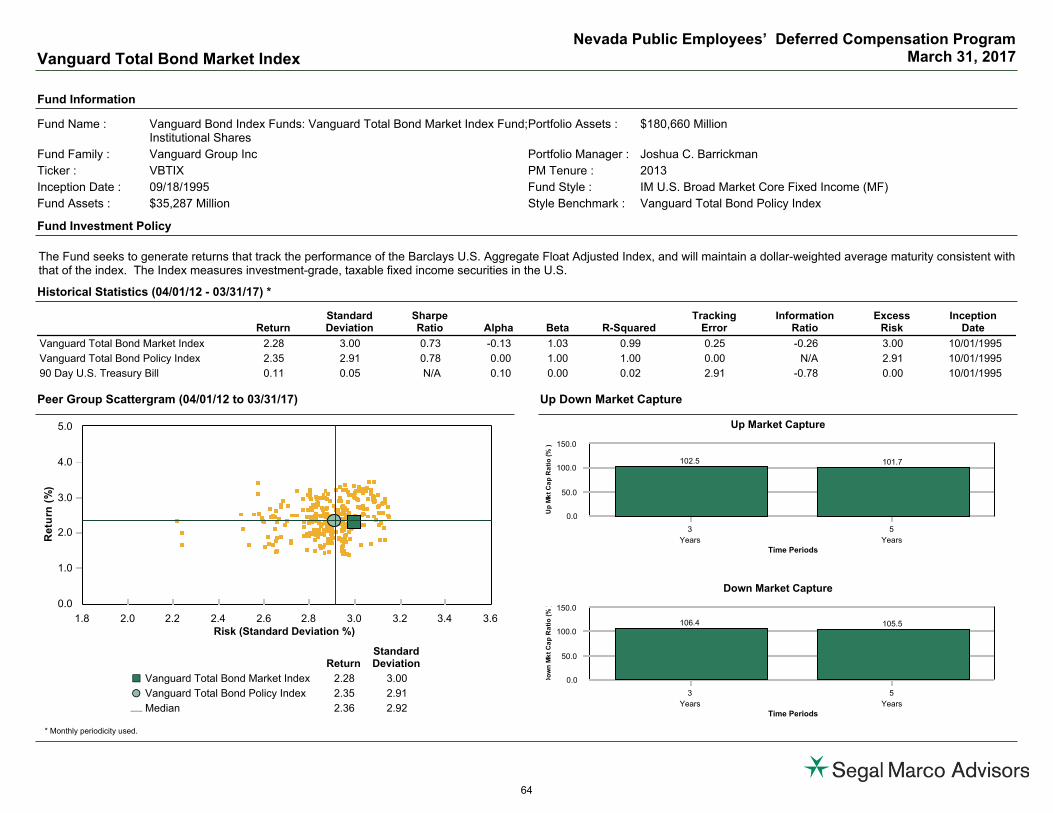
Peer Group Scattergram (04/01/12 to 03/31/17) Up Down Market Capture
Fund Information
Fund Investment Policy
Historical Statistics (04/01/12 - 03/31/17) *
* Monthly periodicity used.
Fund Name : Vanguard Bond Index Funds: Vanguard Total Bond Market Index Fund;Institutional Shares
Portfolio Assets : $180,660 Million
Fund Family : Vanguard Group Inc Portfolio Manager : Joshua C. Barrickman
Ticker : VBTIX PM Tenure : 2013
Inception Date : 09/18/1995 Fund Style : IM U.S. Broad Market Core Fixed Income (MF)
Fund Assets : $35,287 Million Style Benchmark : Vanguard Total Bond Policy Index
Portfolio Turnover : 61%
The Fund seeks to generate returns that track the performance of the Barclays U.S. Aggregate Float Adjusted Index, and will maintain a dollar-weighted average maturity consistent withthat of the index. The Index measures investment-grade, taxable fixed income securities in the U.S.
ReturnStandardDeviation
SharpeRatio Alpha Beta R-Squared
TrackingError
InformationRatio
ExcessRisk
InceptionDate
Vanguard Total Bond Market Index 2.28 3.00 0.73 -0.13 1.03 0.99 0.25 -0.26 3.00 10/01/1995
Vanguard Total Bond Policy Index 2.35 2.91 0.78 0.00 1.00 1.00 0.00 N/A 2.91 10/01/1995
90 Day U.S. Treasury Bill 0.11 0.05 N/A 0.10 0.00 0.02 2.91 -0.78 0.00 10/01/1995
0.0
1.0
2.0
3.0
4.0
5.0
Re
turn
(%)
1.8 2.0 2.2 2.4 2.6 2.8 3.0 3.2 3.4 3.6Risk (Standard Deviation %)
ReturnStandardDeviation
Vanguard Total Bond Market Index 2.28 3.00¢£
Vanguard Total Bond Policy Index 2.35 2.91��
Median 2.36 2.92¾
Up Market Capture
0.0
50.0
100.0
150.0
Up
Mk
t
Ca
p R
ati
o (%
)
3
Years
5
YearsTime Periods
102.5 101.7
Down Market Capture
0.0
50.0
100.0
150.0
Do
wn
Mk
t
Ca
p R
ati
o (%
)
3
Years
5
YearsTime Periods
106.4 105.5
Vanguard Total Bond Market Index
Nevada Public Employees’ Deferred Compensation ProgramMarch 31, 2017
64

Peer Group Analysis - IM All Balanced (MF)
-7.0
-4.0
-1.0
2.0
5.0
8.0
11.0
14.0
17.0
20.0
23.0
Re
turn
1 Qtr YTD 1 Yr 3 Yrs 5 Yrs 7 Yrs 10 Yrs
Voya T Rowe Price Cap App Port I 5.37 (27) 5.37 (27) 11.81 (38) 8.49 (1) 10.39 (2) 10.41 (1) 7.80 (1)¢£
60 S&P 500 / 40 Barclays Agg 3.95 (56) 3.95 (56) 10.26 (52) 7.38 (1) 8.94 (11) 9.29 (7) 6.52 (4)��
5th Percentile 6.45 6.45 15.73 6.48 9.44 9.40 6.27
1st Quartile 5.44 5.44 13.25 5.25 8.07 8.19 5.20
Median 4.21 4.21 10.40 4.17 6.58 7.00 4.47
3rd Quartile 3.11 3.11 7.79 3.07 4.98 5.65 3.65
95th Percentile 1.47 1.47 4.07 0.82 2.42 3.56 2.35
Voya T Rowe Price Cap App Port I
Nevada Public Employees’ Deferred Compensation ProgramMarch 31, 2017
65

Peer Group Analysis - IM All Balanced (MF)
-22.0
-16.0
-10.0
-4.0
2.0
8.0
14.0
20.0
26.0
32.0
38.0
Re
turn
2016 2015 2014 2013 2012 2011 2010
Voya T Rowe Price Cap App Port I 8.31 (25) 3.83 (2) 10.92 (2) 19.05 (34) 14.78 (21) 3.16 (10) 14.30 (23)¢£
60 S&P 500 / 40 Barclays Agg 8.31 (25) 1.28 (4) 10.62 (3) 17.56 (40) 11.31 (60) 4.69 (5) 12.13 (53)��
5th Percentile 11.18 0.73 9.20 25.76 16.61 4.63 16.48
1st Quartile 8.27 -0.71 6.20 20.69 14.34 1.15 14.02
Median 6.73 -1.66 4.74 15.20 12.11 -1.47 12.29
3rd Quartile 5.22 -2.75 3.45 8.34 9.81 -3.74 10.43
95th Percentile 2.01 -7.40 0.11 0.55 5.31 -7.25 6.83
Voya T Rowe Price Cap App Port I
Nevada Public Employees’ Deferred Compensation ProgramMarch 31, 2017
66

Peer Group Scattergram (04/01/12 to 03/31/17) Up Down Market Capture
Historical Statistics (04/01/12 - 03/31/17) *
* Monthly periodicity used.
ReturnStandardDeviation
SharpeRatio Alpha Beta R-Squared
TrackingError
InformationRatio
ExcessRisk
InceptionDate
Voya T Rowe Price Cap App Port I 10.39 6.97 1.44 8.55 0.22 0.04 8.32 0.17 6.96 01/01/2004
60 S&P 500 / 40 Barclays Agg 8.94 6.07 1.43 0.00 1.00 1.00 0.00 N/A 6.07 01/01/2004
90 Day U.S. Treasury Bill 0.11 0.05 N/A 0.11 0.00 0.00 6.07 -1.43 0.00 01/01/2004
0.0
5.0
10.0
15.0
Re
turn
(%)
0.0 2.0 4.0 6.0 8.0 10.0 12.0Risk (Standard Deviation %)
ReturnStandardDeviation
Voya T Rowe Price Cap App Port I 10.39 6.97¢£
60 S&P 500 / 40 Barclays Agg 8.94 6.07��
Median 6.58 7.08¾
Up Market Capture
0.0
25.0
50.0
75.0
100.0
Up
Mk
t
Ca
p R
ati
o (%
)
3
Years
5
YearsTime Periods
39.7
65.0
Down Market Capture
-100.0
-75.0
-50.0
-25.0
0.0
Do
wn
Mk
t
Ca
p R
ati
o (%
)
3
Years
5
Years
Time Periods
-67.1
-26.1
Voya T Rowe Price Cap App Port I
Nevada Public Employees’ Deferred Compensation ProgramMarch 31, 2017
67
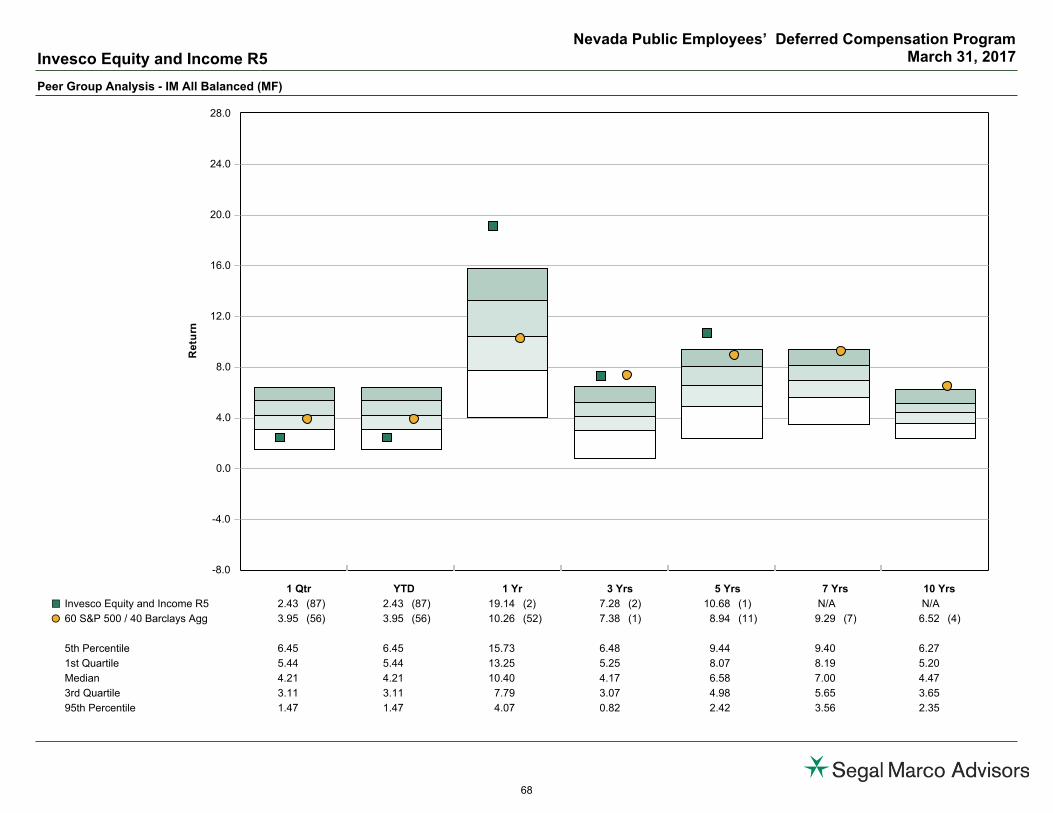
Peer Group Analysis - IM All Balanced (MF)
-8.0
-4.0
0.0
4.0
8.0
12.0
16.0
20.0
24.0
28.0
Re
turn
1 Qtr YTD 1 Yr 3 Yrs 5 Yrs 7 Yrs 10 Yrs
Invesco Equity and Income R5 2.43 (87) 2.43 (87) 19.14 (2) 7.28 (2) 10.68 (1) N/A N/A¢£
60 S&P 500 / 40 Barclays Agg 3.95 (56) 3.95 (56) 10.26 (52) 7.38 (1) 8.94 (11) 9.29 (7) 6.52 (4)��
5th Percentile 6.45 6.45 15.73 6.48 9.44 9.40 6.27
1st Quartile 5.44 5.44 13.25 5.25 8.07 8.19 5.20
Median 4.21 4.21 10.40 4.17 6.58 7.00 4.47
3rd Quartile 3.11 3.11 7.79 3.07 4.98 5.65 3.65
95th Percentile 1.47 1.47 4.07 0.82 2.42 3.56 2.35
Invesco Equity and Income R5
Nevada Public Employees’ Deferred Compensation ProgramMarch 31, 2017
68
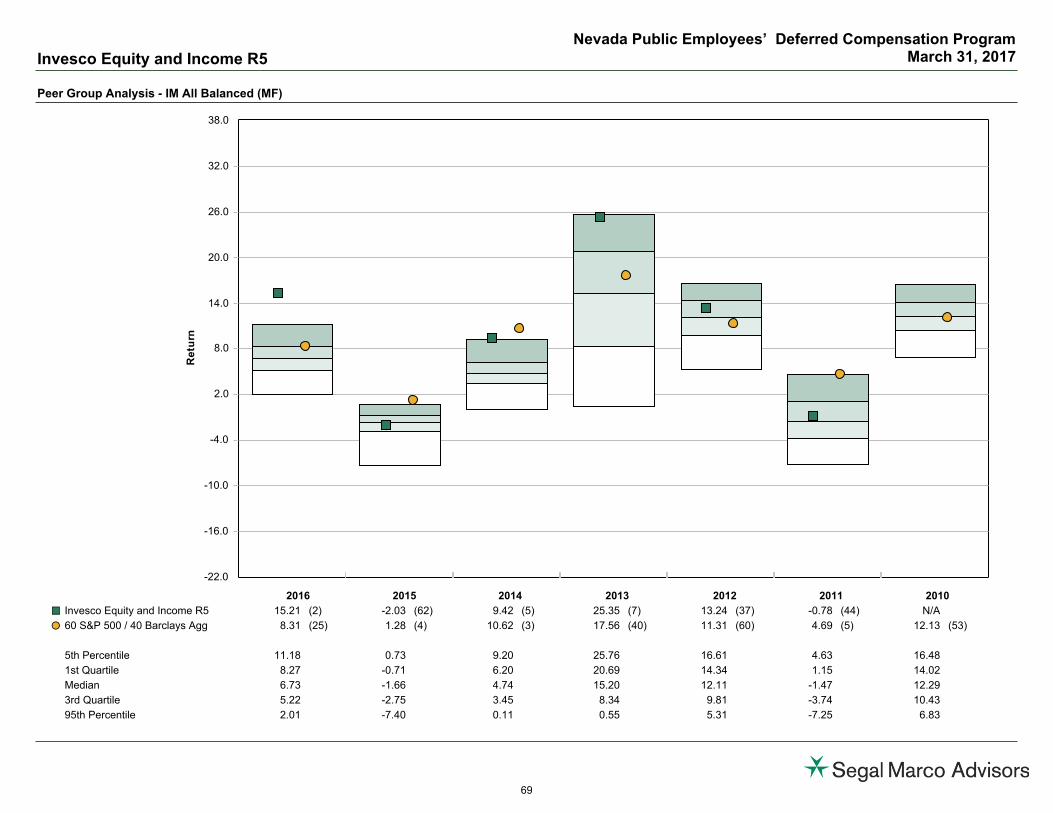
Peer Group Analysis - IM All Balanced (MF)
-22.0
-16.0
-10.0
-4.0
2.0
8.0
14.0
20.0
26.0
32.0
38.0
Re
turn
2016 2015 2014 2013 2012 2011 2010
Invesco Equity and Income R5 15.21 (2) -2.03 (62) 9.42 (5) 25.35 (7) 13.24 (37) -0.78 (44) N/A¢£
60 S&P 500 / 40 Barclays Agg 8.31 (25) 1.28 (4) 10.62 (3) 17.56 (40) 11.31 (60) 4.69 (5) 12.13 (53)��
5th Percentile 11.18 0.73 9.20 25.76 16.61 4.63 16.48
1st Quartile 8.27 -0.71 6.20 20.69 14.34 1.15 14.02
Median 6.73 -1.66 4.74 15.20 12.11 -1.47 12.29
3rd Quartile 5.22 -2.75 3.45 8.34 9.81 -3.74 10.43
95th Percentile 2.01 -7.40 0.11 0.55 5.31 -7.25 6.83
Invesco Equity and Income R5
Nevada Public Employees’ Deferred Compensation ProgramMarch 31, 2017
69
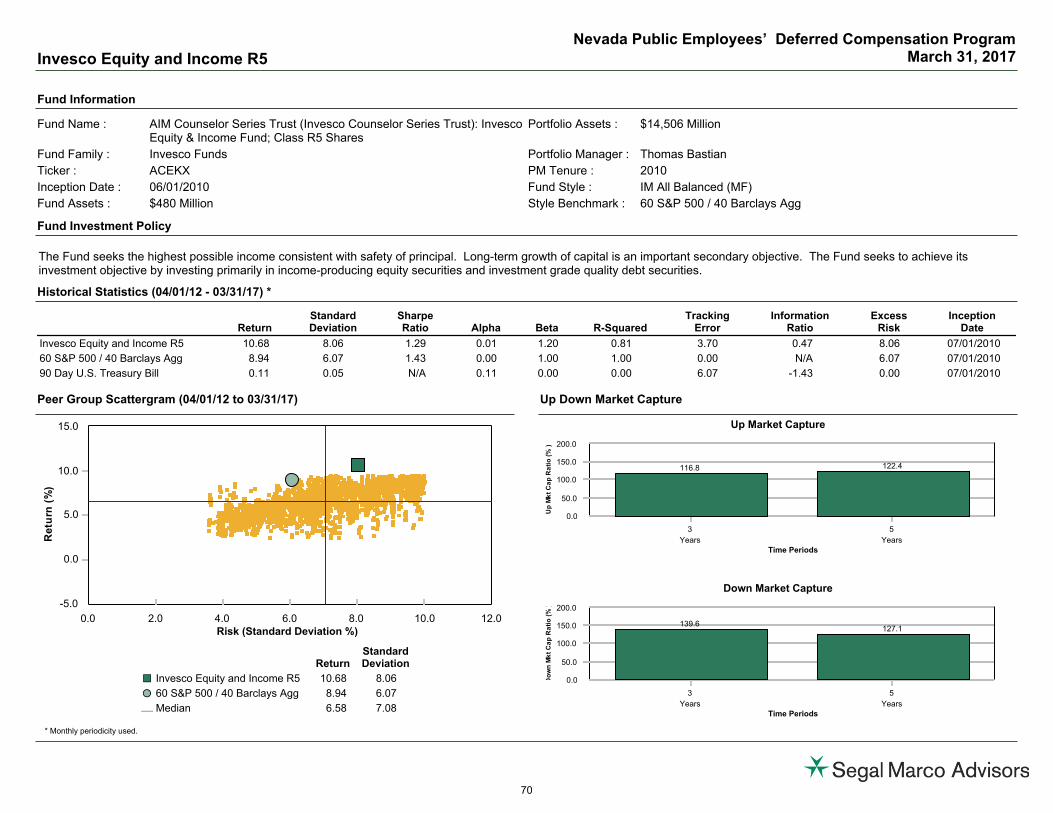
Peer Group Scattergram (04/01/12 to 03/31/17) Up Down Market Capture
Fund Information
Fund Investment Policy
Historical Statistics (04/01/12 - 03/31/17) *
* Monthly periodicity used.
Fund Name : AIM Counselor Series Trust (Invesco Counselor Series Trust): InvescoEquity & Income Fund; Class R5 Shares
Portfolio Assets : $14,506 Million
Fund Family : Invesco Funds Portfolio Manager : Thomas Bastian
Ticker : ACEKX PM Tenure : 2010
Inception Date : 06/01/2010 Fund Style : IM All Balanced (MF)
Fund Assets : $480 Million Style Benchmark : 60 S&P 500 / 40 Barclays Agg
Portfolio Turnover : 93%
The Fund seeks the highest possible income consistent with safety of principal. Long-term growth of capital is an important secondary objective. The Fund seeks to achieve itsinvestment objective by investing primarily in income-producing equity securities and investment grade quality debt securities.
ReturnStandardDeviation
SharpeRatio Alpha Beta R-Squared
TrackingError
InformationRatio
ExcessRisk
InceptionDate
Invesco Equity and Income R5 10.68 8.06 1.29 0.01 1.20 0.81 3.70 0.47 8.06 07/01/2010
60 S&P 500 / 40 Barclays Agg 8.94 6.07 1.43 0.00 1.00 1.00 0.00 N/A 6.07 07/01/2010
90 Day U.S. Treasury Bill 0.11 0.05 N/A 0.11 0.00 0.00 6.07 -1.43 0.00 07/01/2010
-5.0
0.0
5.0
10.0
15.0
Re
turn
(%)
0.0 2.0 4.0 6.0 8.0 10.0 12.0Risk (Standard Deviation %)
ReturnStandardDeviation
Invesco Equity and Income R5 10.68 8.06¢£
60 S&P 500 / 40 Barclays Agg 8.94 6.07��
Median 6.58 7.08¾
Up Market Capture
0.0
50.0
100.0
150.0
200.0
Up
Mk
t
Ca
p R
ati
o (%
)
3
Years
5
YearsTime Periods
116.8 122.4
Down Market Capture
0.0
50.0
100.0
150.0
200.0
Do
wn
Mk
t
Ca
p R
ati
o (%
)
3
Years
5
YearsTime Periods
139.6127.1
Invesco Equity and Income R5
Nevada Public Employees’ Deferred Compensation ProgramMarch 31, 2017
70
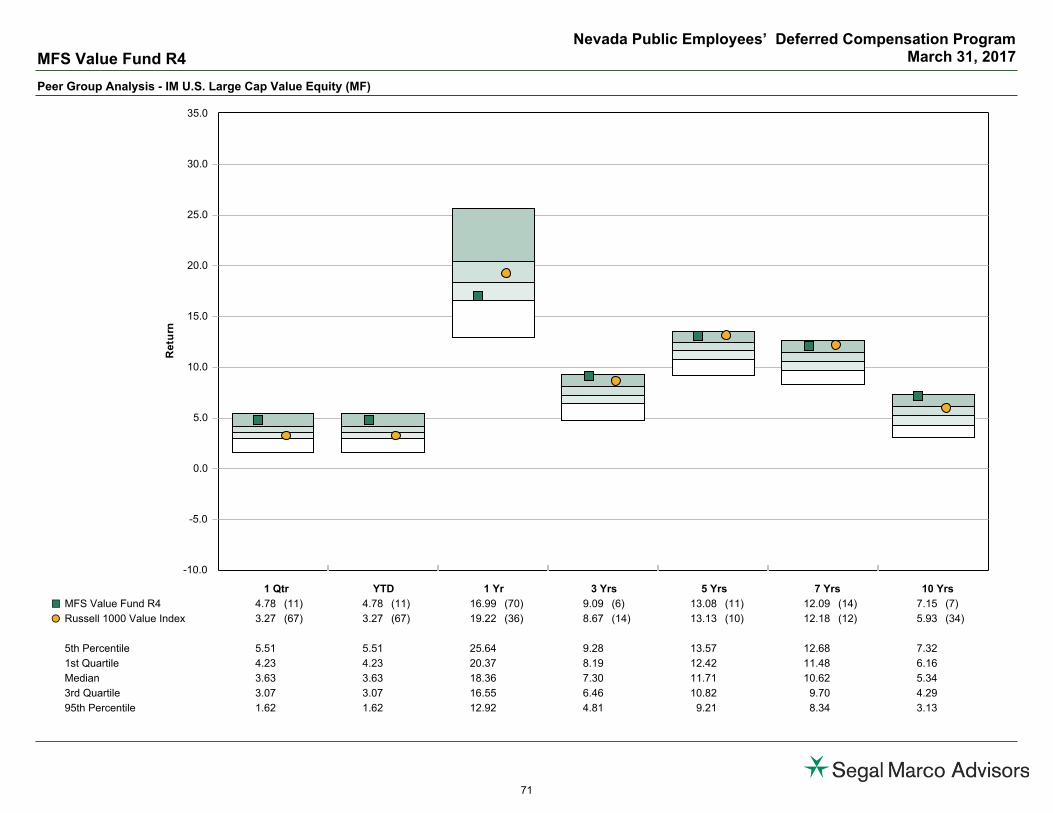
Peer Group Analysis - IM U.S. Large Cap Value Equity (MF)
-10.0
-5.0
0.0
5.0
10.0
15.0
20.0
25.0
30.0
35.0
Re
turn
1 Qtr YTD 1 Yr 3 Yrs 5 Yrs 7 Yrs 10 Yrs
MFS Value Fund R4 4.78 (11) 4.78 (11) 16.99 (70) 9.09 (6) 13.08 (11) 12.09 (14) 7.15 (7)¢£
Russell 1000 Value Index 3.27 (67) 3.27 (67) 19.22 (36) 8.67 (14) 13.13 (10) 12.18 (12) 5.93 (34)��
5th Percentile 5.51 5.51 25.64 9.28 13.57 12.68 7.32
1st Quartile 4.23 4.23 20.37 8.19 12.42 11.48 6.16
Median 3.63 3.63 18.36 7.30 11.71 10.62 5.34
3rd Quartile 3.07 3.07 16.55 6.46 10.82 9.70 4.29
95th Percentile 1.62 1.62 12.92 4.81 9.21 8.34 3.13
MFS Value Fund R4
Nevada Public Employees’ Deferred Compensation ProgramMarch 31, 2017
71

Peer Group Analysis - IM U.S. Large Cap Value Equity (MF)
-30.0
-20.0
-10.0
0.0
10.0
20.0
30.0
40.0
50.0
60.0
Re
turn
2016 2015 2014 2013 2012 2011 2010
MFS Value Fund R4 14.14 (48) -0.54 (7) 10.57 (58) 35.81 (17) 16.42 (39) 0.05 (23) 11.68 (69)¢£
Russell 1000 Value Index 17.34 (23) -3.83 (51) 13.45 (6) 32.53 (49) 17.51 (25) 0.39 (21) 15.51 (21)��
5th Percentile 21.13 -0.22 13.98 39.27 20.07 6.33 19.31
1st Quartile 17.04 -2.38 11.87 34.93 17.47 -0.25 15.09
Median 14.04 -3.81 10.80 32.44 15.56 -2.59 12.78
3rd Quartile 12.34 -5.76 9.74 30.95 13.67 -5.08 11.26
95th Percentile 9.65 -9.18 6.50 26.64 10.01 -8.58 9.18
MFS Value Fund R4
Nevada Public Employees’ Deferred Compensation ProgramMarch 31, 2017
72
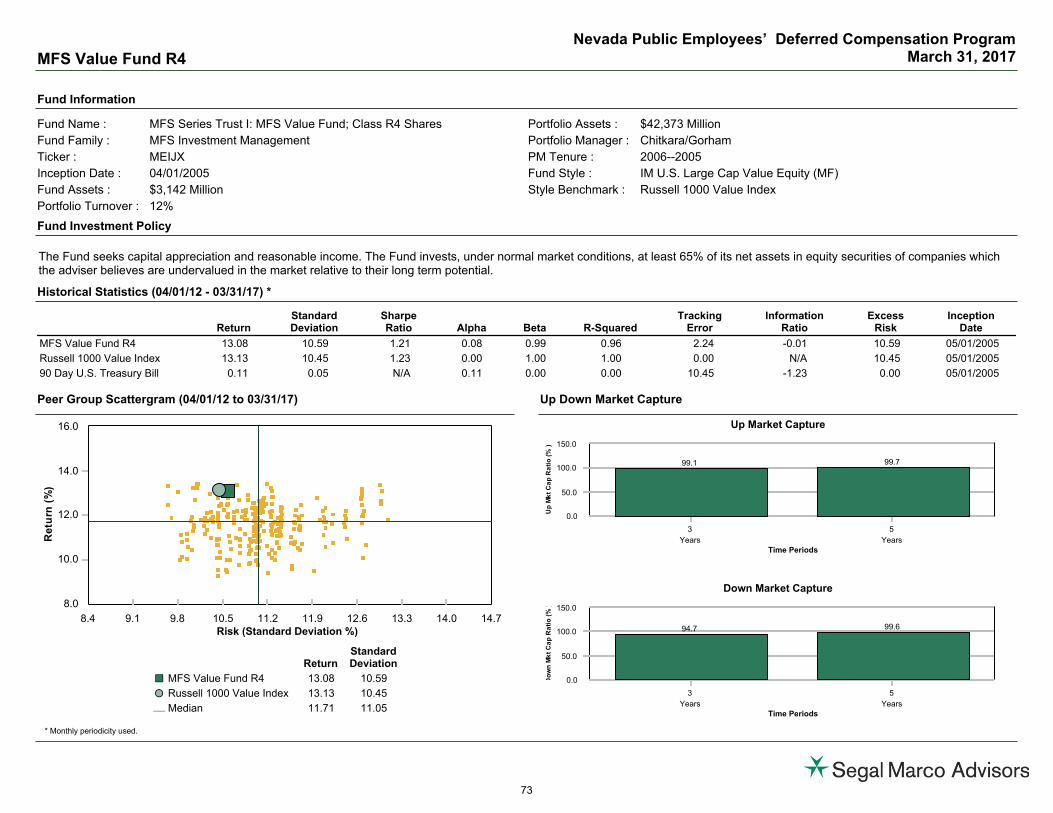
Peer Group Scattergram (04/01/12 to 03/31/17) Up Down Market Capture
Fund Information
Fund Investment Policy
Historical Statistics (04/01/12 - 03/31/17) *
* Monthly periodicity used.
Fund Name : MFS Series Trust I: MFS Value Fund; Class R4 Shares Portfolio Assets : $42,373 Million
Fund Family : MFS Investment Management Portfolio Manager : Chitkara/Gorham
Ticker : MEIJX PM Tenure : 2006--2005
Inception Date : 04/01/2005 Fund Style : IM U.S. Large Cap Value Equity (MF)
Fund Assets : $3,142 Million Style Benchmark : Russell 1000 Value Index
Portfolio Turnover : 12%
The Fund seeks capital appreciation and reasonable income. The Fund invests, under normal market conditions, at least 65% of its net assets in equity securities of companies whichthe adviser believes are undervalued in the market relative to their long term potential.
ReturnStandardDeviation
SharpeRatio Alpha Beta R-Squared
TrackingError
InformationRatio
ExcessRisk
InceptionDate
MFS Value Fund R4 13.08 10.59 1.21 0.08 0.99 0.96 2.24 -0.01 10.59 05/01/2005
Russell 1000 Value Index 13.13 10.45 1.23 0.00 1.00 1.00 0.00 N/A 10.45 05/01/2005
90 Day U.S. Treasury Bill 0.11 0.05 N/A 0.11 0.00 0.00 10.45 -1.23 0.00 05/01/2005
8.0
10.0
12.0
14.0
16.0
Re
turn
(%)
8.4 9.1 9.8 10.5 11.2 11.9 12.6 13.3 14.0 14.7Risk (Standard Deviation %)
ReturnStandardDeviation
MFS Value Fund R4 13.08 10.59¢£
Russell 1000 Value Index 13.13 10.45��
Median 11.71 11.05¾
Up Market Capture
0.0
50.0
100.0
150.0
Up
Mk
t
Ca
p R
ati
o (%
)
3
Years
5
YearsTime Periods
99.1 99.7
Down Market Capture
0.0
50.0
100.0
150.0
Do
wn
Mk
t
Ca
p R
ati
o (%
)
3
Years
5
YearsTime Periods
94.7 99.6
MFS Value Fund R4
Nevada Public Employees’ Deferred Compensation ProgramMarch 31, 2017
73
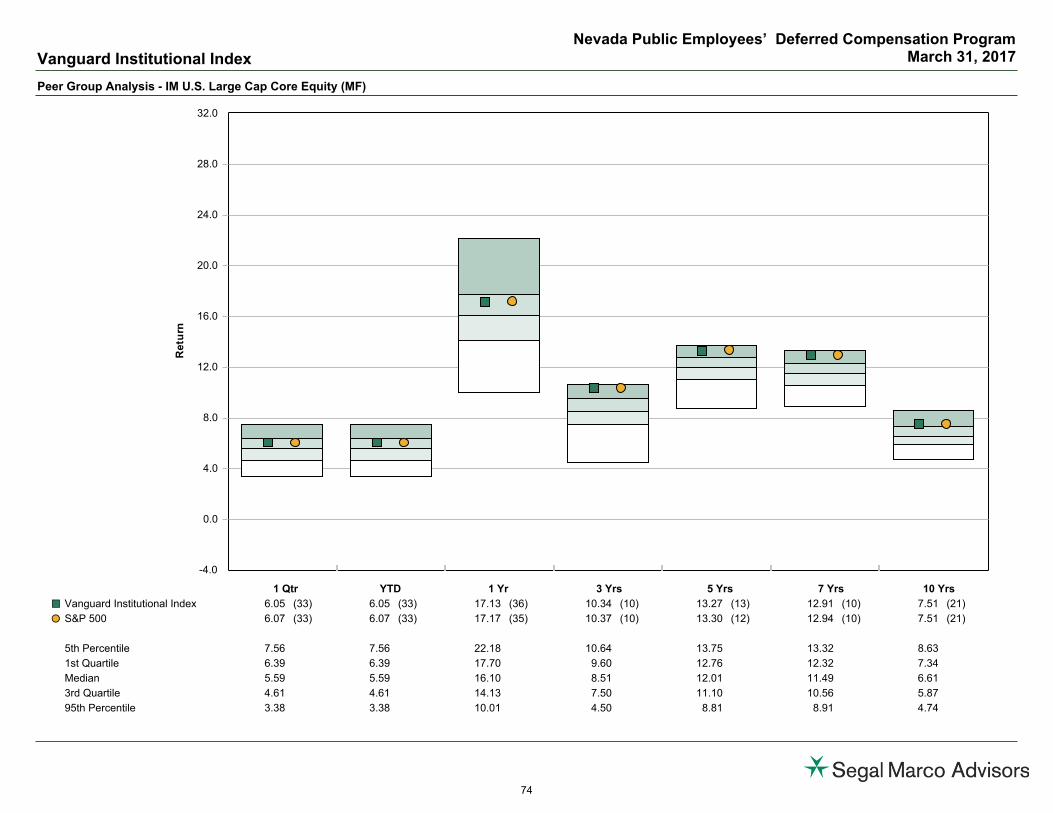
Peer Group Analysis - IM U.S. Large Cap Core Equity (MF)
-4.0
0.0
4.0
8.0
12.0
16.0
20.0
24.0
28.0
32.0
Re
turn
1 Qtr YTD 1 Yr 3 Yrs 5 Yrs 7 Yrs 10 Yrs
Vanguard Institutional Index 6.05 (33) 6.05 (33) 17.13 (36) 10.34 (10) 13.27 (13) 12.91 (10) 7.51 (21)¢£
S&P 500 6.07 (33) 6.07 (33) 17.17 (35) 10.37 (10) 13.30 (12) 12.94 (10) 7.51 (21)��
5th Percentile 7.56 7.56 22.18 10.64 13.75 13.32 8.63
1st Quartile 6.39 6.39 17.70 9.60 12.76 12.32 7.34
Median 5.59 5.59 16.10 8.51 12.01 11.49 6.61
3rd Quartile 4.61 4.61 14.13 7.50 11.10 10.56 5.87
95th Percentile 3.38 3.38 10.01 4.50 8.81 8.91 4.74
Vanguard Institutional Index
Nevada Public Employees’ Deferred Compensation ProgramMarch 31, 2017
74
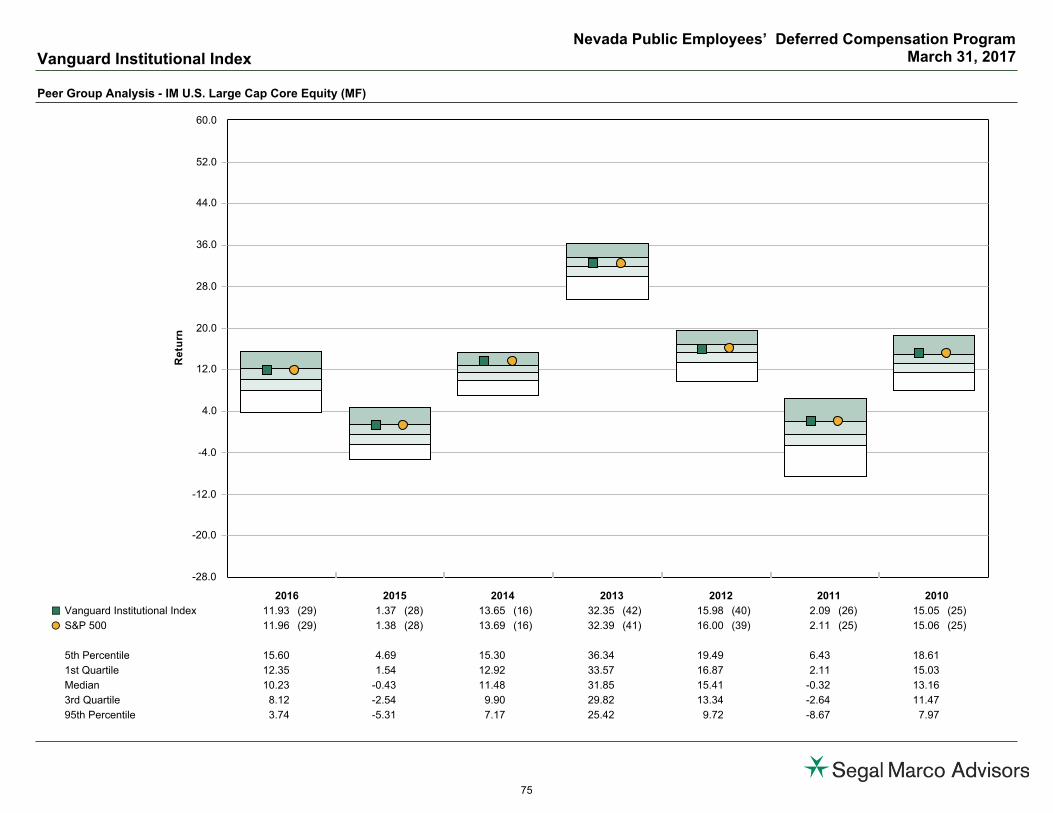
Peer Group Analysis - IM U.S. Large Cap Core Equity (MF)
-28.0
-20.0
-12.0
-4.0
4.0
12.0
20.0
28.0
36.0
44.0
52.0
60.0
Re
turn
2016 2015 2014 2013 2012 2011 2010
Vanguard Institutional Index 11.93 (29) 1.37 (28) 13.65 (16) 32.35 (42) 15.98 (40) 2.09 (26) 15.05 (25)¢£
S&P 500 11.96 (29) 1.38 (28) 13.69 (16) 32.39 (41) 16.00 (39) 2.11 (25) 15.06 (25)��
5th Percentile 15.60 4.69 15.30 36.34 19.49 6.43 18.61
1st Quartile 12.35 1.54 12.92 33.57 16.87 2.11 15.03
Median 10.23 -0.43 11.48 31.85 15.41 -0.32 13.16
3rd Quartile 8.12 -2.54 9.90 29.82 13.34 -2.64 11.47
95th Percentile 3.74 -5.31 7.17 25.42 9.72 -8.67 7.97
Vanguard Institutional Index
Nevada Public Employees’ Deferred Compensation ProgramMarch 31, 2017
75

Peer Group Scattergram (04/01/12 to 03/31/17) Up Down Market Capture
Fund Information
Fund Investment Policy
Historical Statistics (04/01/12 - 03/31/17) *
* Monthly periodicity used.
Fund Name : Vanguard Institutional Index Fund: Vanguard Institutional Index Fund;Institutional Shares
Portfolio Assets : $224,915 Million
Fund Family : Vanguard Group Inc Portfolio Manager : Donald M. Butler
Ticker : VINIX PM Tenure : 2000
Inception Date : 07/31/1990 Fund Style : IM U.S. Large Cap Core Equity (MF)
Fund Assets : $128,517 Million Style Benchmark : S&P 500
Portfolio Turnover : 5%
The Fund seeks to match the investment performance of the Standard & Poor's 500 Composite Stock Price Index.
ReturnStandardDeviation
SharpeRatio Alpha Beta R-Squared
TrackingError
InformationRatio
ExcessRisk
InceptionDate
Vanguard Institutional Index 13.27 10.12 1.28 -0.03 1.00 1.00 0.01 -2.00 10.12 08/01/1990
S&P 500 13.30 10.12 1.28 0.00 1.00 1.00 0.00 N/A 10.12 08/01/1990
90 Day U.S. Treasury Bill 0.11 0.05 N/A 0.11 0.00 0.00 10.12 -1.28 0.00 08/01/1990
6.0
8.0
10.0
12.0
14.0
16.0
Re
turn
(%)
9.0 9.6 10.2 10.8 11.4 12.0 12.6Risk (Standard Deviation %)
ReturnStandardDeviation
Vanguard Institutional Index 13.27 10.12¢£
S&P 500 13.30 10.12��
Median 12.01 10.41¾
Up Market Capture
0.0
50.0
100.0
150.0
Up
Mk
t
Ca
p R
ati
o (%
)
3
Years
5
YearsTime Periods
99.9 99.9
Down Market Capture
0.0
50.0
100.0
150.0
Do
wn
Mk
t
Ca
p R
ati
o (%
)
3
Years
5
YearsTime Periods
100.1 100.1
Vanguard Institutional Index
Nevada Public Employees’ Deferred Compensation ProgramMarch 31, 2017
76

Peer Group Analysis - IM U.S. Large Cap Core Equity (MF)
-4.0
0.0
4.0
8.0
12.0
16.0
20.0
24.0
28.0
32.0
Re
turn
1 Qtr YTD 1 Yr 3 Yrs 5 Yrs 7 Yrs 10 Yrs
Parnassus Equity Income 4.38 (80) 4.38 (80) 12.33 (87) 9.19 (34) 13.53 (9) 11.88 (38) 9.56 (2)¢£
S&P 500 6.07 (33) 6.07 (33) 17.17 (35) 10.37 (10) 13.30 (12) 12.94 (10) 7.51 (21)��
5th Percentile 7.56 7.56 22.18 10.64 13.75 13.32 8.63
1st Quartile 6.39 6.39 17.70 9.60 12.76 12.32 7.34
Median 5.59 5.59 16.10 8.51 12.01 11.49 6.61
3rd Quartile 4.61 4.61 14.13 7.50 11.10 10.56 5.87
95th Percentile 3.38 3.38 10.01 4.50 8.81 8.91 4.74
Parnassus Equity Income
Nevada Public Employees’ Deferred Compensation ProgramMarch 31, 2017
77

Peer Group Analysis - IM U.S. Large Cap Core Equity (MF)
-28.0
-20.0
-12.0
-4.0
4.0
12.0
20.0
28.0
36.0
44.0
52.0
60.0
Re
turn
2016 2015 2014 2013 2012 2011 2010
Parnassus Equity Income 10.40 (48) -0.55 (52) 14.48 (9) 34.01 (22) 15.43 (50) 3.13 (20) 8.89 (92)¢£
S&P 500 11.96 (29) 1.38 (28) 13.69 (16) 32.39 (41) 16.00 (39) 2.11 (25) 15.06 (25)��
5th Percentile 15.60 4.69 15.30 36.34 19.49 6.43 18.61
1st Quartile 12.35 1.54 12.92 33.57 16.87 2.11 15.03
Median 10.23 -0.43 11.48 31.85 15.41 -0.32 13.16
3rd Quartile 8.12 -2.54 9.90 29.82 13.34 -2.64 11.47
95th Percentile 3.74 -5.31 7.17 25.42 9.72 -8.67 7.97
Parnassus Equity Income
Nevada Public Employees’ Deferred Compensation ProgramMarch 31, 2017
78
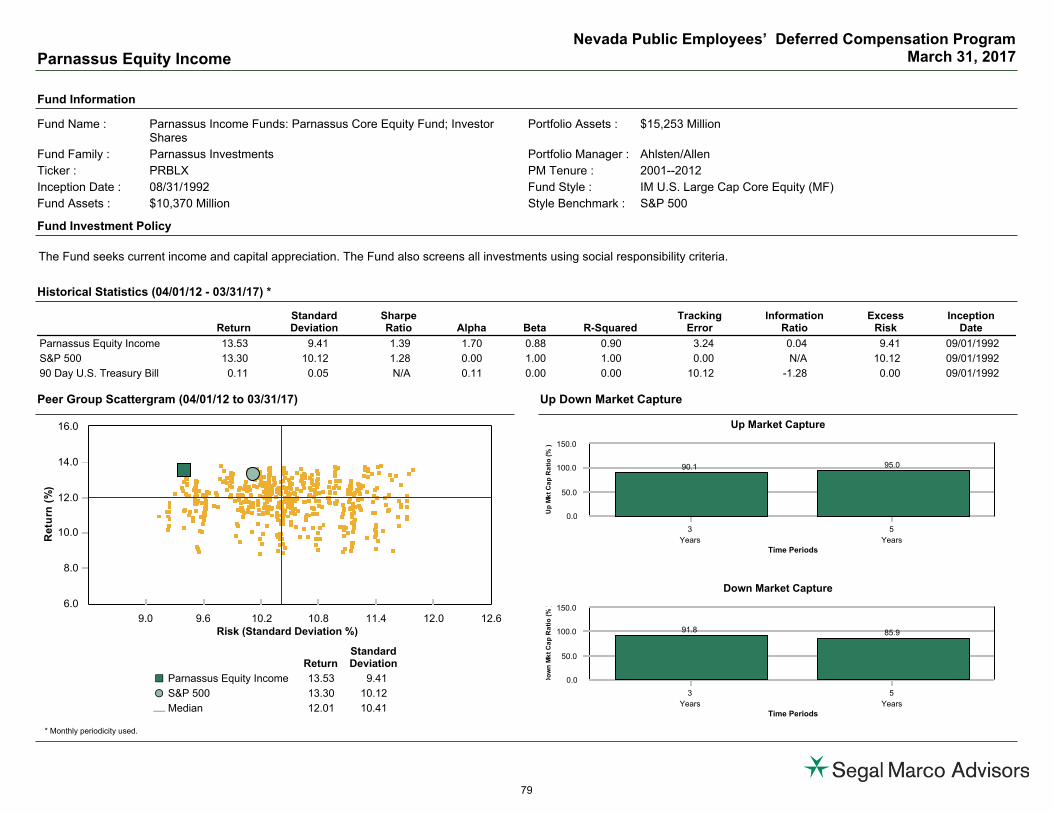
Peer Group Scattergram (04/01/12 to 03/31/17) Up Down Market Capture
Fund Information
Fund Investment Policy
Historical Statistics (04/01/12 - 03/31/17) *
* Monthly periodicity used.
Fund Name : Parnassus Income Funds: Parnassus Core Equity Fund; InvestorShares
Portfolio Assets : $15,253 Million
Fund Family : Parnassus Investments Portfolio Manager : Ahlsten/Allen
Ticker : PRBLX PM Tenure : 2001--2012
Inception Date : 08/31/1992 Fund Style : IM U.S. Large Cap Core Equity (MF)
Fund Assets : $10,370 Million Style Benchmark : S&P 500
Portfolio Turnover : 27%
The Fund seeks current income and capital appreciation. The Fund also screens all investments using social responsibility criteria.
ReturnStandardDeviation
SharpeRatio Alpha Beta R-Squared
TrackingError
InformationRatio
ExcessRisk
InceptionDate
Parnassus Equity Income 13.53 9.41 1.39 1.70 0.88 0.90 3.24 0.04 9.41 09/01/1992
S&P 500 13.30 10.12 1.28 0.00 1.00 1.00 0.00 N/A 10.12 09/01/1992
90 Day U.S. Treasury Bill 0.11 0.05 N/A 0.11 0.00 0.00 10.12 -1.28 0.00 09/01/1992
6.0
8.0
10.0
12.0
14.0
16.0
Re
turn
(%)
9.0 9.6 10.2 10.8 11.4 12.0 12.6Risk (Standard Deviation %)
ReturnStandardDeviation
Parnassus Equity Income 13.53 9.41¢£
S&P 500 13.30 10.12��
Median 12.01 10.41¾
Up Market Capture
0.0
50.0
100.0
150.0
Up
Mk
t
Ca
p R
ati
o (%
)
3
Years
5
YearsTime Periods
90.1 95.0
Down Market Capture
0.0
50.0
100.0
150.0
Do
wn
Mk
t
Ca
p R
ati
o (%
)
3
Years
5
YearsTime Periods
91.8 85.9
Parnassus Equity Income
Nevada Public Employees’ Deferred Compensation ProgramMarch 31, 2017
79

Peer Group Analysis - IM U.S. Large Cap Growth Equity (MF)
-1.0
2.0
5.0
8.0
11.0
14.0
17.0
20.0
23.0
26.0
Re
turn
1 Qtr YTD 1 Yr 3 Yrs 5 Yrs 7 Yrs 10 Yrs
American Funds Growth Fund R3 8.01 (79) 8.01 (79) 19.94 (6) 9.83 (35) 13.35 (14) 11.82 (54) 7.31 (70)¢£
Russell 1000 Growth Index 8.91 (58) 8.91 (58) 15.76 (32) 11.27 (11) 13.32 (15) 13.68 (9) 9.13 (16)��
5th Percentile 11.96 11.96 19.97 12.02 13.98 14.23 10.06
1st Quartile 10.46 10.46 16.14 10.37 12.80 12.82 8.85
Median 9.34 9.34 14.56 9.27 11.57 11.86 8.06
3rd Quartile 8.16 8.16 12.74 8.04 10.51 11.09 7.00
95th Percentile 5.98 5.98 9.27 6.02 9.02 9.67 5.59
American Funds Growth Fund R3
Nevada Public Employees’ Deferred Compensation ProgramMarch 31, 2017
80

Peer Group Analysis - IM U.S. Large Cap Growth Equity (MF)
-30.0
-20.0
-10.0
0.0
10.0
20.0
30.0
40.0
50.0
60.0
70.0
Re
turn
2016 2015 2014 2013 2012 2011 2010
American Funds Growth Fund R3 8.12 (4) 5.03 (57) 8.94 (72) 33.43 (55) 20.20 (6) -5.14 (82) 11.95 (76)¢£
Russell 1000 Growth Index 7.08 (7) 5.67 (49) 13.05 (22) 33.48 (55) 15.26 (47) 2.64 (10) 16.71 (33)��
5th Percentile 7.51 11.16 14.81 42.87 20.41 3.63 22.36
1st Quartile 4.58 7.77 12.72 36.42 17.64 0.61 17.45
Median 2.00 5.57 10.52 33.93 14.84 -1.79 15.13
3rd Quartile -0.55 3.12 8.71 31.26 12.93 -4.43 12.08
95th Percentile -6.25 -0.09 6.11 28.15 10.58 -7.82 8.97
American Funds Growth Fund R3
Nevada Public Employees’ Deferred Compensation ProgramMarch 31, 2017
81

Peer Group Scattergram (04/01/12 to 03/31/17) Up Down Market Capture
Fund Information
Fund Investment Policy
Historical Statistics (04/01/12 - 03/31/17) *
* Monthly periodicity used.
Fund Name : Growth Fund of America; Class R-3 Shares Portfolio Assets : $156,221 Million
Fund Family : American Funds Portfolio Manager : Team Managed
Ticker : RGACX PM Tenure :
Inception Date : 05/21/2002 Fund Style : IM U.S. Large Cap Growth Equity (MF)
Fund Assets : $6,448 Million Style Benchmark : Russell 1000 Growth Index
Portfolio Turnover : 31%
The Fund seeks to provide growth of capital. The Fund invests primarily in common stocks in companies that appear to offer superior opportunities for growth of capital. The Fund seeksto invest in attractively valued companies that, it the Adviser's opinion, represent good, long-term investment opportunities.
ReturnStandardDeviation
SharpeRatio Alpha Beta R-Squared
TrackingError
InformationRatio
ExcessRisk
InceptionDate
American Funds Growth Fund R3 13.35 10.60 1.23 0.49 0.97 0.92 2.96 0.01 10.60 06/01/2002
Russell 1000 Growth Index 13.32 10.54 1.23 0.00 1.00 1.00 0.00 N/A 10.54 06/01/2002
90 Day U.S. Treasury Bill 0.11 0.05 N/A 0.11 0.00 0.00 10.54 -1.23 0.00 06/01/2002
6.0
8.0
10.0
12.0
14.0
16.0
Re
turn
(%)
9.1 9.8 10.5 11.2 11.9 12.6 13.3 14.0 14.7Risk (Standard Deviation %)
ReturnStandardDeviation
American Funds Growth Fund R3 13.35 10.60¢£
Russell 1000 Growth Index 13.32 10.54��
Median 11.57 11.46¾
Up Market Capture
0.0
50.0
100.0
150.0
Up
Mk
t
Ca
p R
ati
o (%
)
3
Years
5
YearsTime Periods
93.7 97.8
Down Market Capture
0.0
50.0
100.0
150.0
Do
wn
Mk
t
Ca
p R
ati
o (%
)
3
Years
5
YearsTime Periods
99.9 94.1
American Funds Growth Fund R3
Nevada Public Employees’ Deferred Compensation ProgramMarch 31, 2017
82
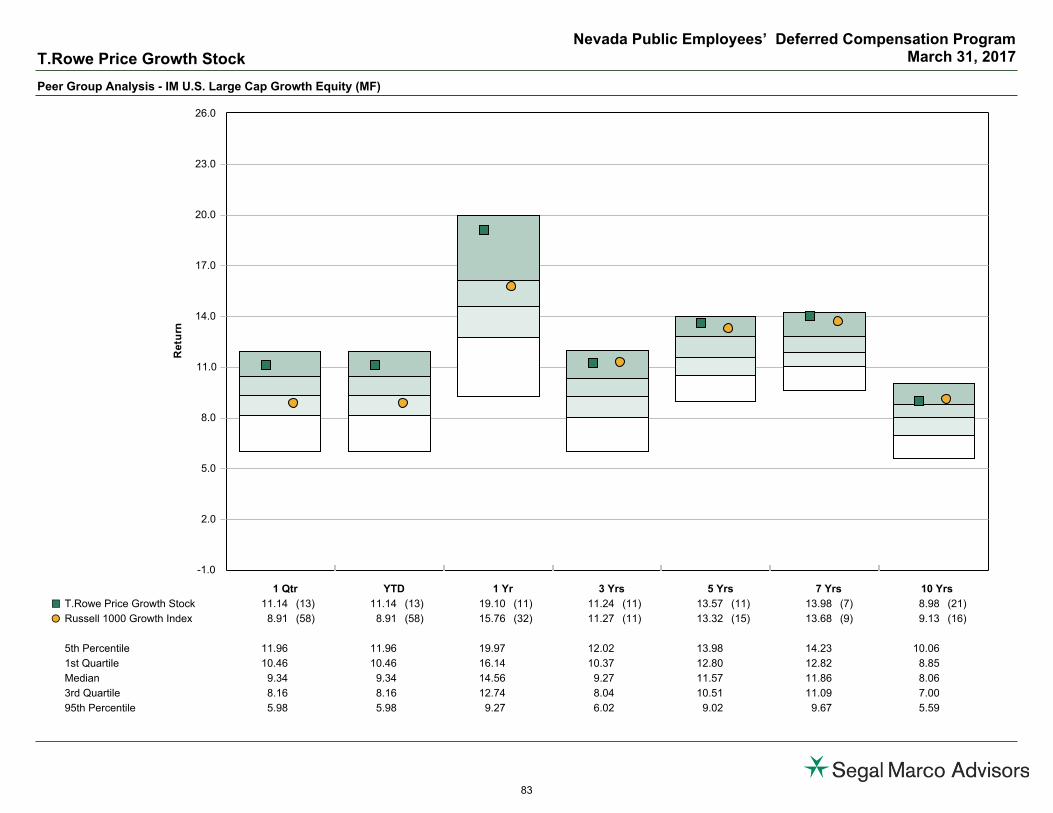
Peer Group Analysis - IM U.S. Large Cap Growth Equity (MF)
-1.0
2.0
5.0
8.0
11.0
14.0
17.0
20.0
23.0
26.0
Re
turn
1 Qtr YTD 1 Yr 3 Yrs 5 Yrs 7 Yrs 10 Yrs
T.Rowe Price Growth Stock 11.14 (13) 11.14 (13) 19.10 (11) 11.24 (11) 13.57 (11) 13.98 (7) 8.98 (21)¢£
Russell 1000 Growth Index 8.91 (58) 8.91 (58) 15.76 (32) 11.27 (11) 13.32 (15) 13.68 (9) 9.13 (16)��
5th Percentile 11.96 11.96 19.97 12.02 13.98 14.23 10.06
1st Quartile 10.46 10.46 16.14 10.37 12.80 12.82 8.85
Median 9.34 9.34 14.56 9.27 11.57 11.86 8.06
3rd Quartile 8.16 8.16 12.74 8.04 10.51 11.09 7.00
95th Percentile 5.98 5.98 9.27 6.02 9.02 9.67 5.59
T.Rowe Price Growth Stock
Nevada Public Employees’ Deferred Compensation ProgramMarch 31, 2017
83
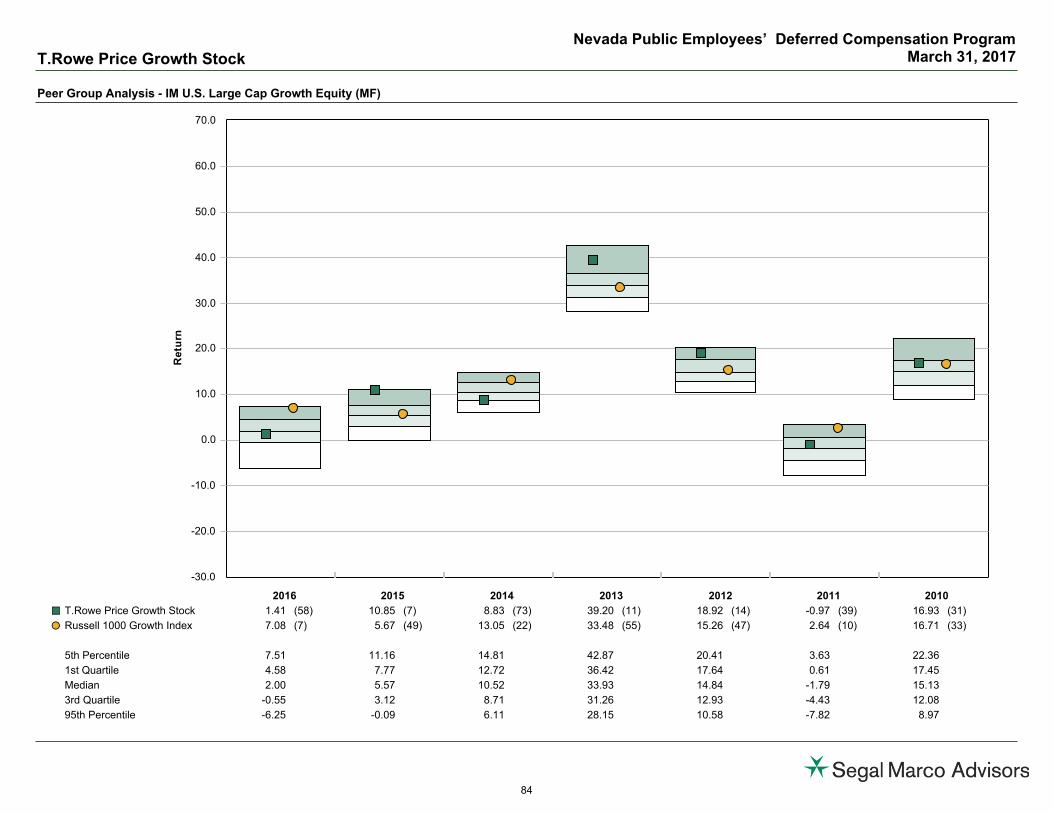
Peer Group Analysis - IM U.S. Large Cap Growth Equity (MF)
-30.0
-20.0
-10.0
0.0
10.0
20.0
30.0
40.0
50.0
60.0
70.0
Re
turn
2016 2015 2014 2013 2012 2011 2010
T.Rowe Price Growth Stock 1.41 (58) 10.85 (7) 8.83 (73) 39.20 (11) 18.92 (14) -0.97 (39) 16.93 (31)¢£
Russell 1000 Growth Index 7.08 (7) 5.67 (49) 13.05 (22) 33.48 (55) 15.26 (47) 2.64 (10) 16.71 (33)��
5th Percentile 7.51 11.16 14.81 42.87 20.41 3.63 22.36
1st Quartile 4.58 7.77 12.72 36.42 17.64 0.61 17.45
Median 2.00 5.57 10.52 33.93 14.84 -1.79 15.13
3rd Quartile -0.55 3.12 8.71 31.26 12.93 -4.43 12.08
95th Percentile -6.25 -0.09 6.11 28.15 10.58 -7.82 8.97
T.Rowe Price Growth Stock
Nevada Public Employees’ Deferred Compensation ProgramMarch 31, 2017
84

Peer Group Scattergram (04/01/12 to 03/31/17) Up Down Market Capture
Fund Information
Fund Investment Policy
Historical Statistics (04/01/12 - 03/31/17) *
* Monthly periodicity used.
Fund Name : T Rowe Price Growth Stock Fund, Inc Portfolio Assets : $48,942 Million
Fund Family : T. Rowe Price Associates Inc Portfolio Manager : Joseph B. Fath
Ticker : PRGFX PM Tenure : 2014
Inception Date : 04/11/1950 Fund Style : IM U.S. Large Cap Growth Equity (MF)
Fund Assets : $39,359 Million Style Benchmark : Russell 1000 Growth Index
Portfolio Turnover : 38%
The Fund seeks long-term capital growth through investments in stocks. The Fund will normally invest at least 80% of its net assets in the common stocks of a diversified group ofgrowth companies. While it may invest in any market capitalization, it generally seeks investments in stocks of large-capitalization companies.
ReturnStandardDeviation
SharpeRatio Alpha Beta R-Squared
TrackingError
InformationRatio
ExcessRisk
InceptionDate
T.Rowe Price Growth Stock 13.57 11.99 1.12 -0.57 1.07 0.89 4.04 0.10 11.99 01/01/1960
Russell 1000 Growth Index 13.32 10.54 1.23 0.00 1.00 1.00 0.00 N/A 10.54 01/01/1960
90 Day U.S. Treasury Bill 0.11 0.05 N/A 0.11 0.00 0.00 10.54 -1.23 0.00 01/01/1960
6.0
8.0
10.0
12.0
14.0
16.0
Re
turn
(%)
9.1 9.8 10.5 11.2 11.9 12.6 13.3 14.0 14.7Risk (Standard Deviation %)
ReturnStandardDeviation
T.Rowe Price Growth Stock 13.57 11.99¢£
Russell 1000 Growth Index 13.32 10.54��
Median 11.57 11.46¾
Up Market Capture
0.0
50.0
100.0
150.0
Up
Mk
t
Ca
p R
ati
o (%
)
3
Years
5
YearsTime Periods
102.8 105.1
Down Market Capture
0.0
50.0
100.0
150.0
Do
wn
Mk
t
Ca
p R
ati
o (%
)
3
Years
5
YearsTime Periods
104.7 108.1
T.Rowe Price Growth Stock
Nevada Public Employees’ Deferred Compensation ProgramMarch 31, 2017
85
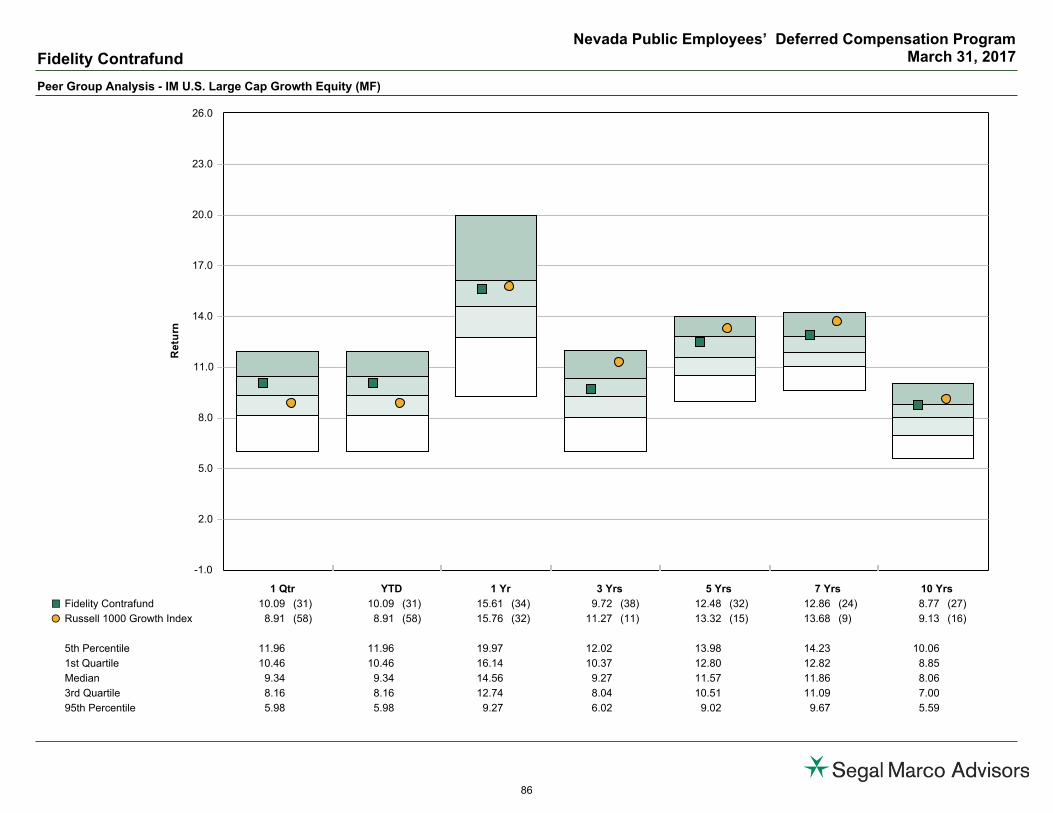
Peer Group Analysis - IM U.S. Large Cap Growth Equity (MF)
-1.0
2.0
5.0
8.0
11.0
14.0
17.0
20.0
23.0
26.0
Re
turn
1 Qtr YTD 1 Yr 3 Yrs 5 Yrs 7 Yrs 10 Yrs
Fidelity Contrafund 10.09 (31) 10.09 (31) 15.61 (34) 9.72 (38) 12.48 (32) 12.86 (24) 8.77 (27)¢£
Russell 1000 Growth Index 8.91 (58) 8.91 (58) 15.76 (32) 11.27 (11) 13.32 (15) 13.68 (9) 9.13 (16)��
5th Percentile 11.96 11.96 19.97 12.02 13.98 14.23 10.06
1st Quartile 10.46 10.46 16.14 10.37 12.80 12.82 8.85
Median 9.34 9.34 14.56 9.27 11.57 11.86 8.06
3rd Quartile 8.16 8.16 12.74 8.04 10.51 11.09 7.00
95th Percentile 5.98 5.98 9.27 6.02 9.02 9.67 5.59
Fidelity Contrafund
Nevada Public Employees’ Deferred Compensation ProgramMarch 31, 2017
86
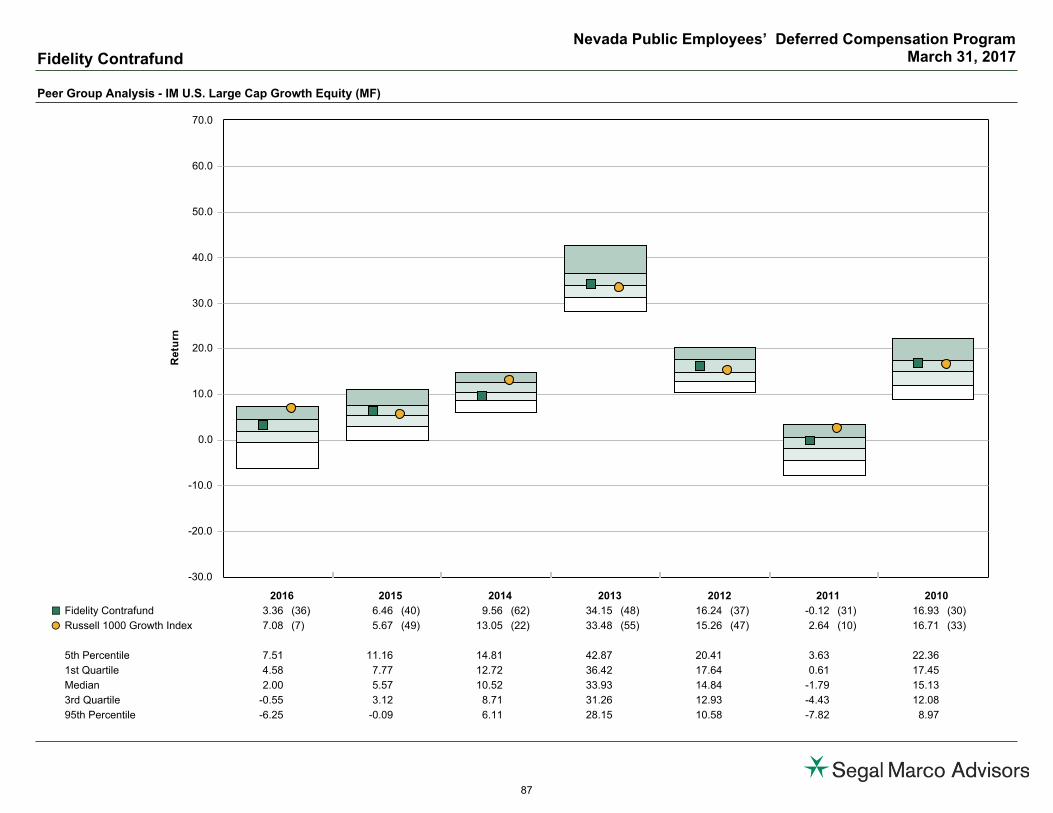
Peer Group Analysis - IM U.S. Large Cap Growth Equity (MF)
-30.0
-20.0
-10.0
0.0
10.0
20.0
30.0
40.0
50.0
60.0
70.0
Re
turn
2016 2015 2014 2013 2012 2011 2010
Fidelity Contrafund 3.36 (36) 6.46 (40) 9.56 (62) 34.15 (48) 16.24 (37) -0.12 (31) 16.93 (30)¢£
Russell 1000 Growth Index 7.08 (7) 5.67 (49) 13.05 (22) 33.48 (55) 15.26 (47) 2.64 (10) 16.71 (33)��
5th Percentile 7.51 11.16 14.81 42.87 20.41 3.63 22.36
1st Quartile 4.58 7.77 12.72 36.42 17.64 0.61 17.45
Median 2.00 5.57 10.52 33.93 14.84 -1.79 15.13
3rd Quartile -0.55 3.12 8.71 31.26 12.93 -4.43 12.08
95th Percentile -6.25 -0.09 6.11 28.15 10.58 -7.82 8.97
Fidelity Contrafund
Nevada Public Employees’ Deferred Compensation ProgramMarch 31, 2017
87

Peer Group Scattergram (04/01/12 to 03/31/17) Up Down Market Capture
Fund Information
Fund Investment Policy
Historical Statistics (04/01/12 - 03/31/17) *
* Monthly periodicity used.
Fund Name : Fidelity Contrafund Portfolio Assets : $108,469 Million
Fund Family : Fidelity Management & Research Company Portfolio Manager : William Danoff
Ticker : FCNTX PM Tenure : 1990
Inception Date : 05/17/1967 Fund Style : IM U.S. Large Cap Growth Equity (MF)
Fund Assets : $78,127 Million Style Benchmark : Russell 1000 Growth Index
Portfolio Turnover : 41%
The Fund seeks capital appreciation. The Fund seeks to achieve its investment objective by investing in securities of companies whose value it believes is not fully recognized by thepublic. The Fund normally invests primarily in common stocks and may invest in both domestic and foreign issuers.
ReturnStandardDeviation
SharpeRatio Alpha Beta R-Squared
TrackingError
InformationRatio
ExcessRisk
InceptionDate
Fidelity Contrafund 12.48 10.12 1.21 0.10 0.93 0.94 2.53 -0.31 10.12 06/01/1967
Russell 1000 Growth Index 13.32 10.54 1.23 0.00 1.00 1.00 0.00 N/A 10.54 06/01/1967
90 Day U.S. Treasury Bill 0.11 0.05 N/A 0.11 0.00 0.00 10.54 -1.23 0.00 06/01/1967
6.0
8.0
10.0
12.0
14.0
16.0
Re
turn
(%)
9.1 9.8 10.5 11.2 11.9 12.6 13.3 14.0 14.7Risk (Standard Deviation %)
ReturnStandardDeviation
Fidelity Contrafund 12.48 10.12¢£
Russell 1000 Growth Index 13.32 10.54��
Median 11.57 11.46¾
Up Market Capture
0.0
50.0
100.0
150.0
Up
Mk
t
Ca
p R
ati
o (%
)
3
Years
5
YearsTime Periods
86.2 93.0
Down Market Capture
0.0
50.0
100.0
150.0
Do
wn
Mk
t
Ca
p R
ati
o (%
)
3
Years
5
YearsTime Periods
85.4 91.5
Fidelity Contrafund
Nevada Public Employees’ Deferred Compensation ProgramMarch 31, 2017
88
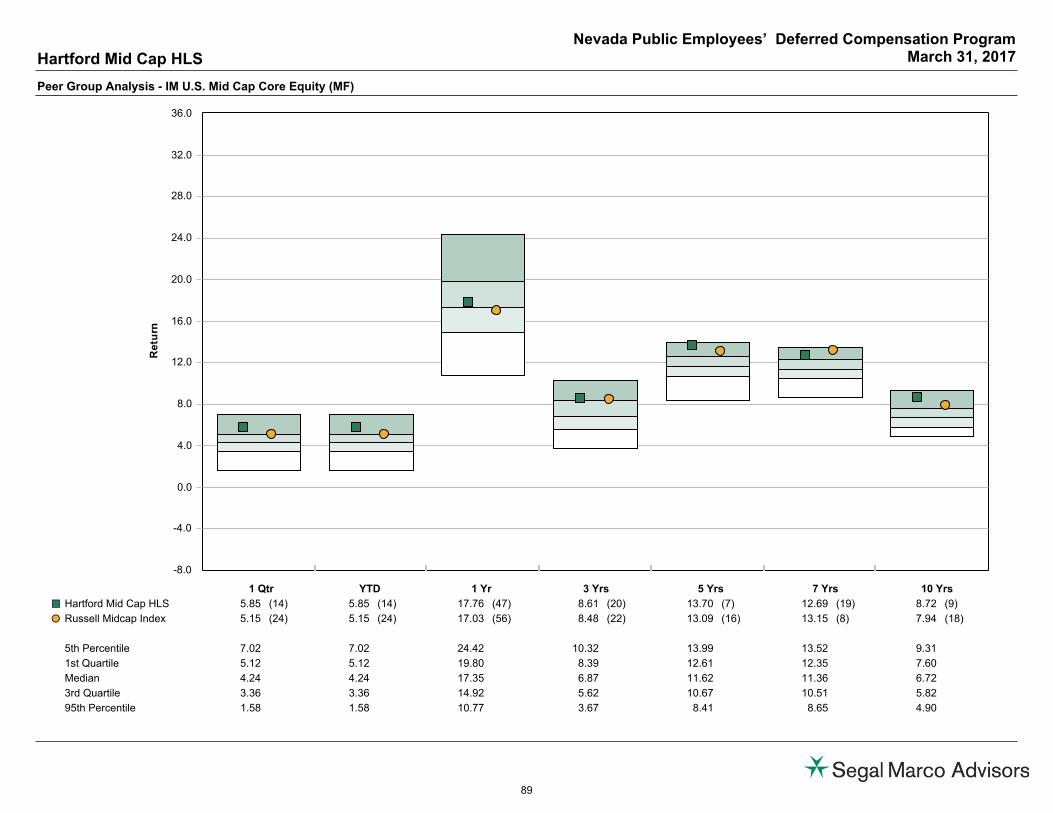
Peer Group Analysis - IM U.S. Mid Cap Core Equity (MF)
-8.0
-4.0
0.0
4.0
8.0
12.0
16.0
20.0
24.0
28.0
32.0
36.0
Re
turn
1 Qtr YTD 1 Yr 3 Yrs 5 Yrs 7 Yrs 10 Yrs
Hartford Mid Cap HLS 5.85 (14) 5.85 (14) 17.76 (47) 8.61 (20) 13.70 (7) 12.69 (19) 8.72 (9)¢£
Russell Midcap Index 5.15 (24) 5.15 (24) 17.03 (56) 8.48 (22) 13.09 (16) 13.15 (8) 7.94 (18)��
5th Percentile 7.02 7.02 24.42 10.32 13.99 13.52 9.31
1st Quartile 5.12 5.12 19.80 8.39 12.61 12.35 7.60
Median 4.24 4.24 17.35 6.87 11.62 11.36 6.72
3rd Quartile 3.36 3.36 14.92 5.62 10.67 10.51 5.82
95th Percentile 1.58 1.58 10.77 3.67 8.41 8.65 4.90
Hartford Mid Cap HLS
Nevada Public Employees’ Deferred Compensation ProgramMarch 31, 2017
89

Peer Group Analysis - IM U.S. Mid Cap Core Equity (MF)
-30.0
-20.0
-10.0
0.0
10.0
20.0
30.0
40.0
50.0
60.0
70.0
Re
turn
2016 2015 2014 2013 2012 2011 2010
Hartford Mid Cap HLS 11.69 (75) 1.34 (8) 11.09 (32) 39.46 (13) 19.14 (11) -8.16 (92) 23.15 (50)¢£
Russell Midcap Index 13.80 (59) -2.44 (37) 13.22 (14) 34.76 (48) 17.28 (32) -1.55 (26) 25.47 (19)��
5th Percentile 21.61 1.69 14.54 41.86 21.18 2.70 28.06
1st Quartile 17.92 -1.36 11.93 37.17 17.73 -1.45 24.85
Median 14.53 -3.37 8.99 34.45 15.80 -3.40 23.15
3rd Quartile 11.66 -6.16 6.80 31.93 12.91 -5.37 19.83
95th Percentile 6.11 -10.87 3.76 27.65 9.06 -9.36 14.24
Hartford Mid Cap HLS
Nevada Public Employees’ Deferred Compensation ProgramMarch 31, 2017
90

Peer Group Scattergram (04/01/12 to 03/31/17) Up Down Market Capture
Fund Information
Fund Investment Policy
Historical Statistics (04/01/12 - 03/31/17) *
* Monthly periodicity used.
Fund Name : Hartford Series Fund, Inc: Hartford MidCap HLS Fund; Class IB Portfolio Assets : -
Fund Family : Hartford Funds Management Company LLC Portfolio Manager : Team Managed
Ticker : PM Tenure :
Inception Date : 11/09/1999 Fund Style : IM U.S. Mid Cap Core Equity (MF)
Fund Assets : - Style Benchmark : Russell Midcap Index
Portfolio Turnover : 32%
The Fund seeks long-term growth of capital. The Fund invests at least 80% of its assets in common stocks of mid-capitalization companies. The Fund may invest up to 20% of its totalassets in securities of foreign issuers and non-dollar securities.
ReturnStandardDeviation
SharpeRatio Alpha Beta R-Squared
TrackingError
InformationRatio
ExcessRisk
InceptionDate
Hartford Mid Cap HLS 13.70 12.19 1.11 -0.34 1.08 0.94 3.15 0.22 12.19 12/01/1999
Russell Midcap Index 13.09 10.94 1.18 0.00 1.00 1.00 0.00 N/A 10.94 12/01/1999
90 Day U.S. Treasury Bill 0.11 0.05 N/A 0.11 0.00 0.00 10.94 -1.18 0.00 12/01/1999
6.0
9.0
12.0
15.0
18.0
Re
turn
(%)
8.4 9.1 9.8 10.5 11.2 11.9 12.6 13.3 14.0 14.7Risk (Standard Deviation %)
ReturnStandardDeviation
Hartford Mid Cap HLS 13.70 12.19¢£
Russell Midcap Index 13.09 10.94��
Median 11.62 11.62¾
Up Market Capture
0.0
50.0
100.0
150.0
Up
Mk
t
Ca
p R
ati
o (%
)
3
Years
5
YearsTime Periods
109.8 107.1
Down Market Capture
0.0
50.0
100.0
150.0
Do
wn
Mk
t
Ca
p R
ati
o (%
)
3
Years
5
YearsTime Periods
114.8 109.5
Hartford Mid Cap HLS
Nevada Public Employees’ Deferred Compensation ProgramMarch 31, 2017
91
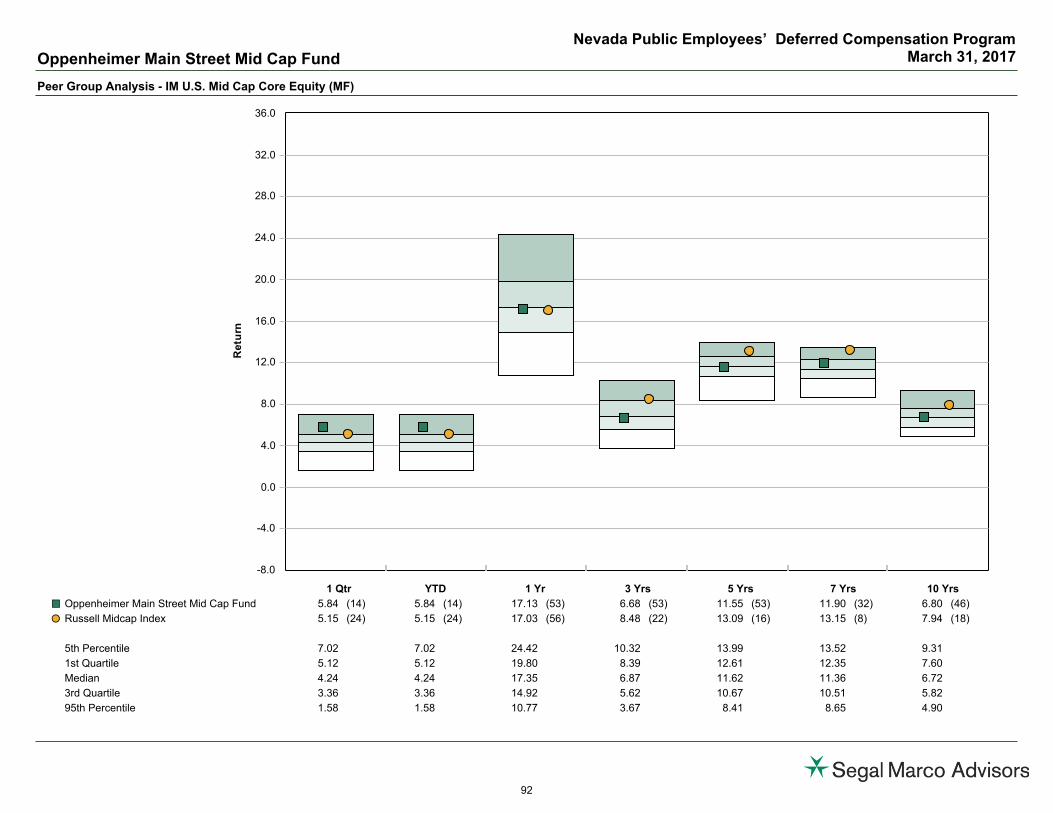
Peer Group Analysis - IM U.S. Mid Cap Core Equity (MF)
-8.0
-4.0
0.0
4.0
8.0
12.0
16.0
20.0
24.0
28.0
32.0
36.0
Re
turn
1 Qtr YTD 1 Yr 3 Yrs 5 Yrs 7 Yrs 10 Yrs
Oppenheimer Main Street Mid Cap Fund 5.84 (14) 5.84 (14) 17.13 (53) 6.68 (53) 11.55 (53) 11.90 (32) 6.80 (46)¢£
Russell Midcap Index 5.15 (24) 5.15 (24) 17.03 (56) 8.48 (22) 13.09 (16) 13.15 (8) 7.94 (18)��
5th Percentile 7.02 7.02 24.42 10.32 13.99 13.52 9.31
1st Quartile 5.12 5.12 19.80 8.39 12.61 12.35 7.60
Median 4.24 4.24 17.35 6.87 11.62 11.36 6.72
3rd Quartile 3.36 3.36 14.92 5.62 10.67 10.51 5.82
95th Percentile 1.58 1.58 10.77 3.67 8.41 8.65 4.90
Oppenheimer Main Street Mid Cap Fund
Nevada Public Employees’ Deferred Compensation ProgramMarch 31, 2017
92

Peer Group Analysis - IM U.S. Mid Cap Core Equity (MF)
-30.0
-20.0
-10.0
0.0
10.0
20.0
30.0
40.0
50.0
60.0
70.0
Re
turn
2016 2015 2014 2013 2012 2011 2010
Oppenheimer Main Street Mid Cap Fund 13.68 (61) -6.99 (80) 12.57 (19) 33.82 (58) 17.26 (32) -2.31 (36) 23.72 (41)¢£
Russell Midcap Index 13.80 (59) -2.44 (37) 13.22 (14) 34.76 (48) 17.28 (32) -1.55 (26) 25.47 (19)��
5th Percentile 21.61 1.69 14.54 41.86 21.18 2.70 28.06
1st Quartile 17.92 -1.36 11.93 37.17 17.73 -1.45 24.85
Median 14.53 -3.37 8.99 34.45 15.80 -3.40 23.15
3rd Quartile 11.66 -6.16 6.80 31.93 12.91 -5.37 19.83
95th Percentile 6.11 -10.87 3.76 27.65 9.06 -9.36 14.24
Oppenheimer Main Street Mid Cap Fund
Nevada Public Employees’ Deferred Compensation ProgramMarch 31, 2017
93
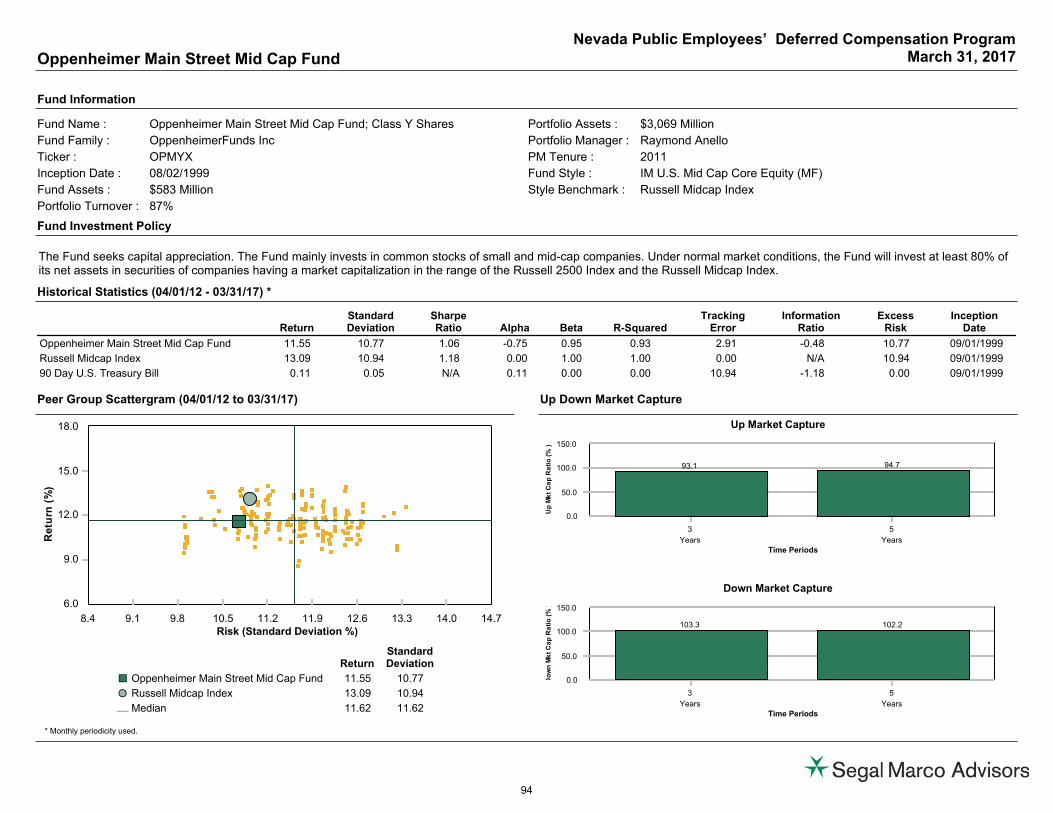
Peer Group Scattergram (04/01/12 to 03/31/17) Up Down Market Capture
Fund Information
Fund Investment Policy
Historical Statistics (04/01/12 - 03/31/17) *
* Monthly periodicity used.
Fund Name : Oppenheimer Main Street Mid Cap Fund; Class Y Shares Portfolio Assets : $3,069 Million
Fund Family : OppenheimerFunds Inc Portfolio Manager : Raymond Anello
Ticker : OPMYX PM Tenure : 2011
Inception Date : 08/02/1999 Fund Style : IM U.S. Mid Cap Core Equity (MF)
Fund Assets : $583 Million Style Benchmark : Russell Midcap Index
Portfolio Turnover : 87%
The Fund seeks capital appreciation. The Fund mainly invests in common stocks of small and mid-cap companies. Under normal market conditions, the Fund will invest at least 80% ofits net assets in securities of companies having a market capitalization in the range of the Russell 2500 Index and the Russell Midcap Index.
ReturnStandardDeviation
SharpeRatio Alpha Beta R-Squared
TrackingError
InformationRatio
ExcessRisk
InceptionDate
Oppenheimer Main Street Mid Cap Fund 11.55 10.77 1.06 -0.75 0.95 0.93 2.91 -0.48 10.77 09/01/1999
Russell Midcap Index 13.09 10.94 1.18 0.00 1.00 1.00 0.00 N/A 10.94 09/01/1999
90 Day U.S. Treasury Bill 0.11 0.05 N/A 0.11 0.00 0.00 10.94 -1.18 0.00 09/01/1999
6.0
9.0
12.0
15.0
18.0
Re
turn
(%)
8.4 9.1 9.8 10.5 11.2 11.9 12.6 13.3 14.0 14.7Risk (Standard Deviation %)
ReturnStandardDeviation
Oppenheimer Main Street Mid Cap Fund 11.55 10.77¢£
Russell Midcap Index 13.09 10.94��
Median 11.62 11.62¾
Up Market Capture
0.0
50.0
100.0
150.0
Up
Mk
t
Ca
p R
ati
o (%
)
3
Years
5
YearsTime Periods
93.1 94.7
Down Market Capture
0.0
50.0
100.0
150.0
Do
wn
Mk
t
Ca
p R
ati
o (%
)
3
Years
5
YearsTime Periods
103.3 102.2
Oppenheimer Main Street Mid Cap Fund
Nevada Public Employees’ Deferred Compensation ProgramMarch 31, 2017
94
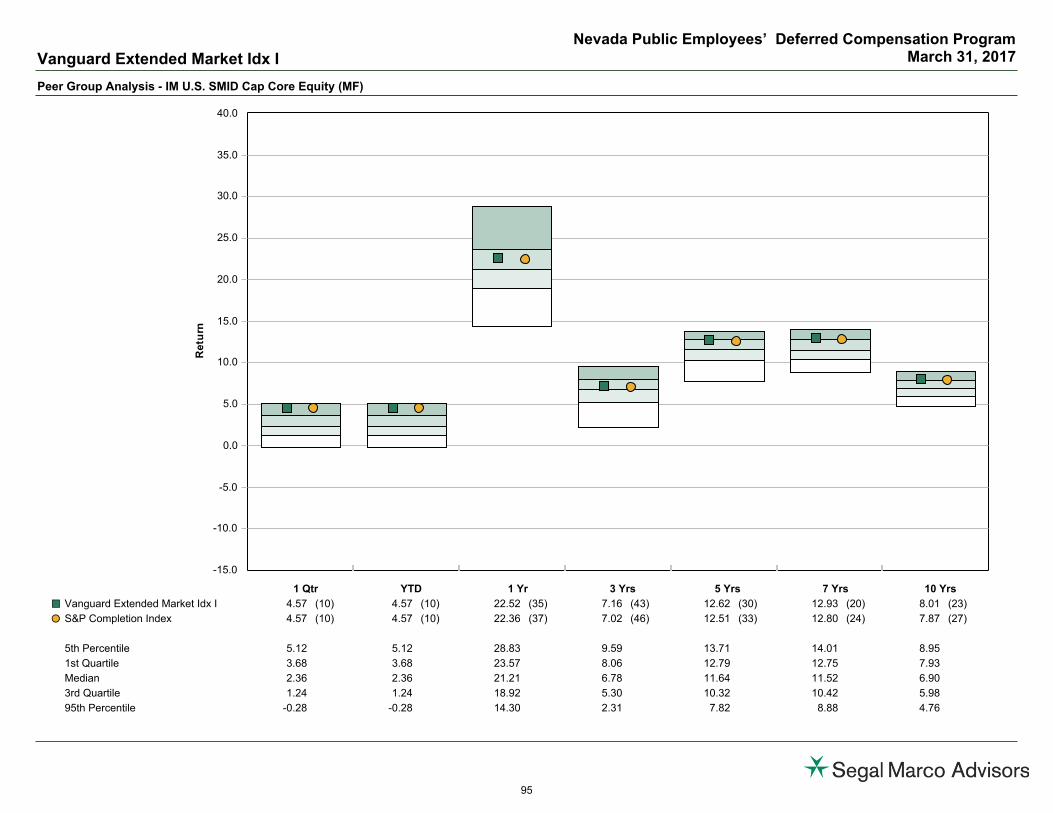
Peer Group Analysis - IM U.S. SMID Cap Core Equity (MF)
-15.0
-10.0
-5.0
0.0
5.0
10.0
15.0
20.0
25.0
30.0
35.0
40.0
Re
turn
1 Qtr YTD 1 Yr 3 Yrs 5 Yrs 7 Yrs 10 Yrs
Vanguard Extended Market Idx I 4.57 (10) 4.57 (10) 22.52 (35) 7.16 (43) 12.62 (30) 12.93 (20) 8.01 (23)¢£
S&P Completion Index 4.57 (10) 4.57 (10) 22.36 (37) 7.02 (46) 12.51 (33) 12.80 (24) 7.87 (27)��
5th Percentile 5.12 5.12 28.83 9.59 13.71 14.01 8.95
1st Quartile 3.68 3.68 23.57 8.06 12.79 12.75 7.93
Median 2.36 2.36 21.21 6.78 11.64 11.52 6.90
3rd Quartile 1.24 1.24 18.92 5.30 10.32 10.42 5.98
95th Percentile -0.28 -0.28 14.30 2.31 7.82 8.88 4.76
Vanguard Extended Market Idx I
Nevada Public Employees’ Deferred Compensation ProgramMarch 31, 2017
95

Peer Group Analysis - IM U.S. SMID Cap Core Equity (MF)
-40.0
-30.0
-20.0
-10.0
0.0
10.0
20.0
30.0
40.0
50.0
60.0
70.0
Re
turn
2016 2015 2014 2013 2012 2011 2010
Vanguard Extended Market Idx I 16.15 (79) -3.24 (33) 7.56 (22) 38.42 (28) 18.50 (15) -3.57 (50) 27.59 (23)¢£
S&P Completion Index 15.95 (81) -3.35 (35) 7.50 (24) 38.24 (30) 18.45 (16) -3.71 (52) 27.46 (25)��
5th Percentile 28.14 -0.55 9.72 42.86 21.13 2.68 32.36
1st Quartile 23.26 -2.70 7.37 38.75 17.67 -1.66 27.46
Median 19.96 -4.33 5.23 36.27 15.47 -3.60 25.65
3rd Quartile 16.83 -6.13 3.20 33.38 12.92 -5.91 23.28
95th Percentile 11.52 -11.38 -1.32 28.39 9.00 -10.14 19.04
Vanguard Extended Market Idx I
Nevada Public Employees’ Deferred Compensation ProgramMarch 31, 2017
96

Peer Group Scattergram (04/01/12 to 03/31/17) Up Down Market Capture
Fund Information
Fund Investment Policy
Historical Statistics (04/01/12 - 03/31/17) *
* Monthly periodicity used.
Fund Name : Vanguard Index Funds: Vanguard Extended Market Index Fund;Institutional Shares
Portfolio Assets : $56,538 Million
Fund Family : Vanguard Group Inc Portfolio Manager : Donald M. Butler
Ticker : VIEIX PM Tenure : 1997
Inception Date : 07/07/1997 Fund Style : IM U.S. SMID Cap Core Equity (MF)
Fund Assets : $11,681 Million Style Benchmark : S&P Completion Index
Portfolio Turnover : 12%
The Fund seeks to track the performance of a benchmark index that measures the investment return of small and mid capitalization stocks. The Fund employs a passive managementor indexing investment approach designed to track the performance of the Standard & Poors Completion Index.
ReturnStandardDeviation
SharpeRatio Alpha Beta R-Squared
TrackingError
InformationRatio
ExcessRisk
InceptionDate
Vanguard Extended Market Idx I 12.62 12.64 1.00 0.08 1.00 1.00 0.08 1.27 12.64 08/01/1997
S&P Completion Index 12.51 12.62 0.99 0.00 1.00 1.00 0.00 N/A 12.62 08/01/1997
90 Day U.S. Treasury Bill 0.11 0.05 N/A 0.11 0.00 0.00 12.62 -0.99 0.00 08/01/1997
6.0
9.0
12.0
15.0
18.0
Re
turn
(%)
10.4 11.2 12.0 12.8 13.6 14.4 15.2 16.0Risk (Standard Deviation %)
ReturnStandardDeviation
Vanguard Extended Market Idx I 12.62 12.64¢£
S&P Completion Index 12.51 12.62��
Median 11.64 12.95¾
Up Market Capture
0.0
50.0
100.0
150.0
Up
Mk
t
Ca
p R
ati
o (%
)
3
Years
5
YearsTime Periods
100.4 100.4
Down Market Capture
0.0
50.0
100.0
150.0
Do
wn
Mk
t
Ca
p R
ati
o (%
)
3
Years
5
YearsTime Periods
99.7 99.9
Vanguard Extended Market Idx I
Nevada Public Employees’ Deferred Compensation ProgramMarch 31, 2017
97
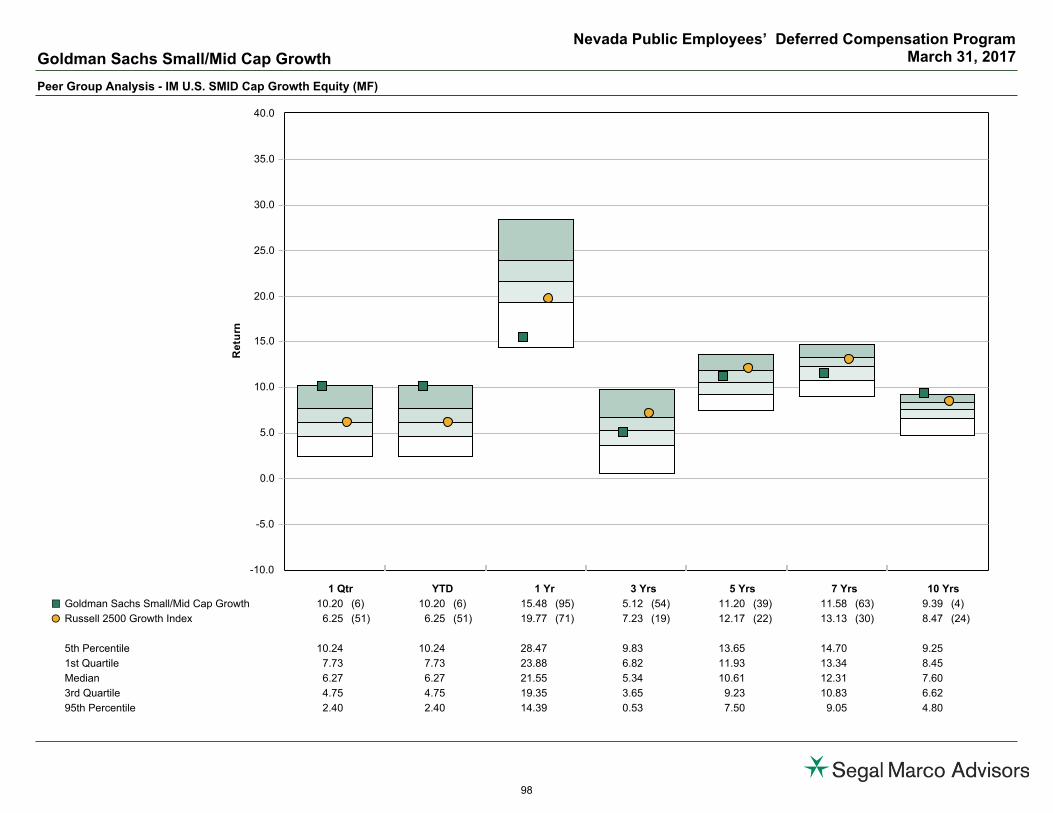
Peer Group Analysis - IM U.S. SMID Cap Growth Equity (MF)
-10.0
-5.0
0.0
5.0
10.0
15.0
20.0
25.0
30.0
35.0
40.0
Re
turn
1 Qtr YTD 1 Yr 3 Yrs 5 Yrs 7 Yrs 10 Yrs
Goldman Sachs Small/Mid Cap Growth 10.20 (6) 10.20 (6) 15.48 (95) 5.12 (54) 11.20 (39) 11.58 (63) 9.39 (4)¢£
Russell 2500 Growth Index 6.25 (51) 6.25 (51) 19.77 (71) 7.23 (19) 12.17 (22) 13.13 (30) 8.47 (24)��
5th Percentile 10.24 10.24 28.47 9.83 13.65 14.70 9.25
1st Quartile 7.73 7.73 23.88 6.82 11.93 13.34 8.45
Median 6.27 6.27 21.55 5.34 10.61 12.31 7.60
3rd Quartile 4.75 4.75 19.35 3.65 9.23 10.83 6.62
95th Percentile 2.40 2.40 14.39 0.53 7.50 9.05 4.80
Goldman Sachs Small/Mid Cap Growth
Nevada Public Employees’ Deferred Compensation ProgramMarch 31, 2017
98

Peer Group Analysis - IM U.S. SMID Cap Growth Equity (MF)
-40.0
-25.0
-10.0
5.0
20.0
35.0
50.0
65.0
80.0
Re
turn
2016 2015 2014 2013 2012 2011 2010
Goldman Sachs Small/Mid Cap Growth -0.24 (95) -1.16 (40) 10.62 (1) 35.54 (88) 20.81 (4) -4.27 (73) 21.12 (92)¢£
Russell 2500 Growth Index 9.73 (45) -0.19 (29) 7.05 (12) 40.65 (58) 16.13 (29) -1.57 (48) 28.86 (50)��
5th Percentile 19.39 5.12 8.62 49.47 19.96 5.41 36.54
1st Quartile 12.36 0.38 5.43 45.32 16.43 1.08 33.76
Median 8.96 -1.81 3.03 41.88 14.46 -1.77 28.71
3rd Quartile 6.02 -3.97 0.19 37.73 12.43 -4.73 24.00
95th Percentile -0.38 -8.51 -6.42 32.61 8.99 -10.23 20.18
Goldman Sachs Small/Mid Cap Growth
Nevada Public Employees’ Deferred Compensation ProgramMarch 31, 2017
99

Peer Group Scattergram (04/01/12 to 03/31/17) Up Down Market Capture
Fund Information
Fund Investment Policy
Historical Statistics (04/01/12 - 03/31/17) *
* Monthly periodicity used.
Fund Name : Goldman Sachs Trust: Goldman Sachs Small/Mid-Cap Growth Fund;Class A Shares
Portfolio Assets : $1,405 Million
Fund Family : Goldman Sachs & Co/GSAM Portfolio Manager : Barry/Zimmerman
Ticker : GSMAX PM Tenure : 2005--2014
Inception Date : 06/30/2005 Fund Style : IM U.S. SMID Cap Growth Equity (MF)
Fund Assets : - Style Benchmark : Russell 2500 Growth Index
Portfolio Turnover : 67%
The Fund seeks long-term growth of capital. The Fund achieves this objective by investing at least 90% of its assets in equity investments with a primary focus on small and mid-capitalization companies.
ReturnStandardDeviation
SharpeRatio Alpha Beta R-Squared
TrackingError
InformationRatio
ExcessRisk
InceptionDate
Goldman Sachs Small/Mid Cap Growth 11.20 12.85 0.89 0.23 0.90 0.91 4.15 -0.23 12.85 07/01/2005
Russell 2500 Growth Index 12.17 13.52 0.91 0.00 1.00 1.00 0.00 N/A 13.52 07/01/2005
90 Day U.S. Treasury Bill 0.11 0.05 N/A 0.11 0.00 0.00 13.52 -0.91 0.00 07/01/2005
3.0
6.0
9.0
12.0
15.0
18.0
Re
turn
(%)
10.0 12.0 14.0 16.0 18.0Risk (Standard Deviation %)
ReturnStandardDeviation
Goldman Sachs Small/Mid Cap Growth 11.20 12.85¢£
Russell 2500 Growth Index 12.17 13.52��
Median 10.61 14.42¾
Up Market Capture
0.0
50.0
100.0
150.0
Up
Mk
t
Ca
p R
ati
o (%
)
3
Years
5
YearsTime Periods
89.5 90.7
Down Market Capture
0.0
50.0
100.0
150.0
Do
wn
Mk
t
Ca
p R
ati
o (%
)
3
Years
5
YearsTime Periods
96.6 89.1
Goldman Sachs Small/Mid Cap Growth
Nevada Public Employees’ Deferred Compensation ProgramMarch 31, 2017
100

Peer Group Analysis - IM International Equity (MF)
-15.0
-10.0
-5.0
0.0
5.0
10.0
15.0
20.0
25.0
30.0
35.0
Re
turn
1 Qtr YTD 1 Yr 3 Yrs 5 Yrs 7 Yrs 10 Yrs
Vanguard Developed Markets Index Instl 7.81 (66) 7.81 (66) 12.73 (45) 1.17 (43) 6.20 (26) 5.06 (34) 1.41 (53)¢£
Vanguard Developed Market Policy Index 7.79 (67) 7.79 (67) 12.82 (45) 1.38 (40) 6.35 (24) 5.09 (34) 1.30 (55)��
5th Percentile 14.51 14.51 22.99 6.17 9.61 8.83 5.27
1st Quartile 11.12 11.12 16.02 2.37 6.25 5.56 2.99
Median 8.69 8.69 12.07 0.83 4.86 4.27 1.52
3rd Quartile 7.42 7.42 8.66 -0.81 2.69 2.83 0.41
95th Percentile 5.19 5.19 4.00 -3.66 -1.46 -0.27 -1.38
Vanguard Developed Markets Index Instl
Nevada Public Employees’ Deferred Compensation ProgramMarch 31, 2017
101
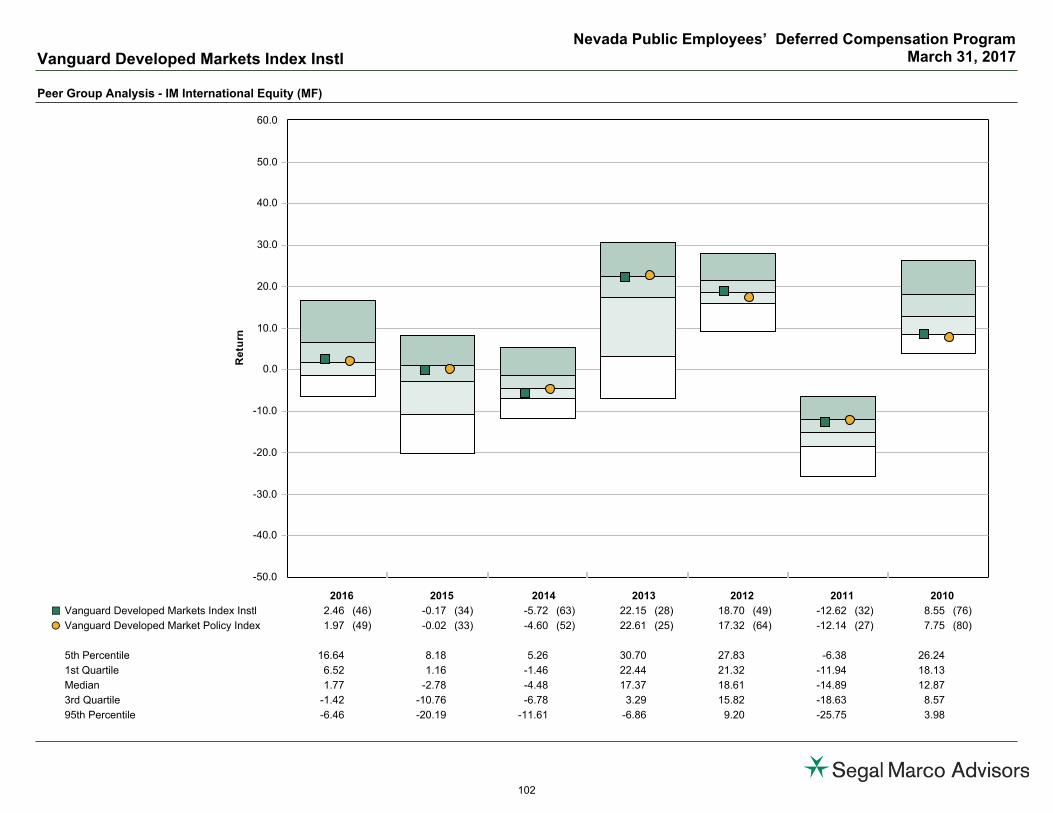
Peer Group Analysis - IM International Equity (MF)
-50.0
-40.0
-30.0
-20.0
-10.0
0.0
10.0
20.0
30.0
40.0
50.0
60.0
Re
turn
2016 2015 2014 2013 2012 2011 2010
Vanguard Developed Markets Index Instl 2.46 (46) -0.17 (34) -5.72 (63) 22.15 (28) 18.70 (49) -12.62 (32) 8.55 (76)¢£
Vanguard Developed Market Policy Index 1.97 (49) -0.02 (33) -4.60 (52) 22.61 (25) 17.32 (64) -12.14 (27) 7.75 (80)��
5th Percentile 16.64 8.18 5.26 30.70 27.83 -6.38 26.24
1st Quartile 6.52 1.16 -1.46 22.44 21.32 -11.94 18.13
Median 1.77 -2.78 -4.48 17.37 18.61 -14.89 12.87
3rd Quartile -1.42 -10.76 -6.78 3.29 15.82 -18.63 8.57
95th Percentile -6.46 -20.19 -11.61 -6.86 9.20 -25.75 3.98
Vanguard Developed Markets Index Instl
Nevada Public Employees’ Deferred Compensation ProgramMarch 31, 2017
102

Peer Group Scattergram (04/01/12 to 03/31/17) Up Down Market Capture
Fund Information
Fund Investment Policy
Historical Statistics (04/01/12 - 03/31/17) *
* Monthly periodicity used.
Fund Name : Vanguard Tax-Managed Funds: Vanguard Developed Markets IndexFund; Institutional Shares
Portfolio Assets : $73,545 Million
Fund Family : Vanguard Group Inc Portfolio Manager : Franquin/Louie
Ticker : VTMNX PM Tenure : 2013--2016
Inception Date : 01/04/2001 Fund Style : IM International Equity (MF)
Fund Assets : $9,661 Million Style Benchmark : Vanguard Developed Market Policy Index
Portfolio Turnover : 11%
The Fund seeks to track the performance of a benchmark index that measures the investment return of stocks issued by companies located in the major markets of Europe and thePacific Region. The Fund employs an indexing investment approach designed to track the performance of FTSE Developed All Cap ex US Index.
ReturnStandardDeviation
SharpeRatio Alpha Beta R-Squared
TrackingError
InformationRatio
ExcessRisk
InceptionDate
Vanguard Developed Markets Index Instl 6.20 12.78 0.53 0.04 0.97 0.98 1.88 -0.09 12.77 02/01/2001
Vanguard Developed Market Policy Index 6.35 13.02 0.53 0.00 1.00 1.00 0.00 N/A 13.02 02/01/2001
90 Day U.S. Treasury Bill 0.11 0.05 N/A 0.11 0.00 0.01 13.02 -0.53 0.00 02/01/2001
-10.0
-5.0
0.0
5.0
10.0
15.0
Re
turn
(%)
8.0 10.0 12.0 14.0 16.0 18.0 20.0 22.0Risk (Standard Deviation %)
ReturnStandardDeviation
Vanguard Developed Markets Index Instl 6.20 12.78¢£
Vanguard Developed Market Policy Index 6.35 13.02��
Median 4.86 12.86¾
Up Market Capture
0.0
50.0
100.0
150.0
Up
Mk
t
Ca
p R
ati
o (%
)
3
Years
5
YearsTime Periods
92.5 97.7
Down Market Capture
0.0
50.0
100.0
150.0
Do
wn
Mk
t
Ca
p R
ati
o (%
)
3
Years
5
YearsTime Periods
93.3 97.7
Vanguard Developed Markets Index Instl
Nevada Public Employees’ Deferred Compensation ProgramMarch 31, 2017
103
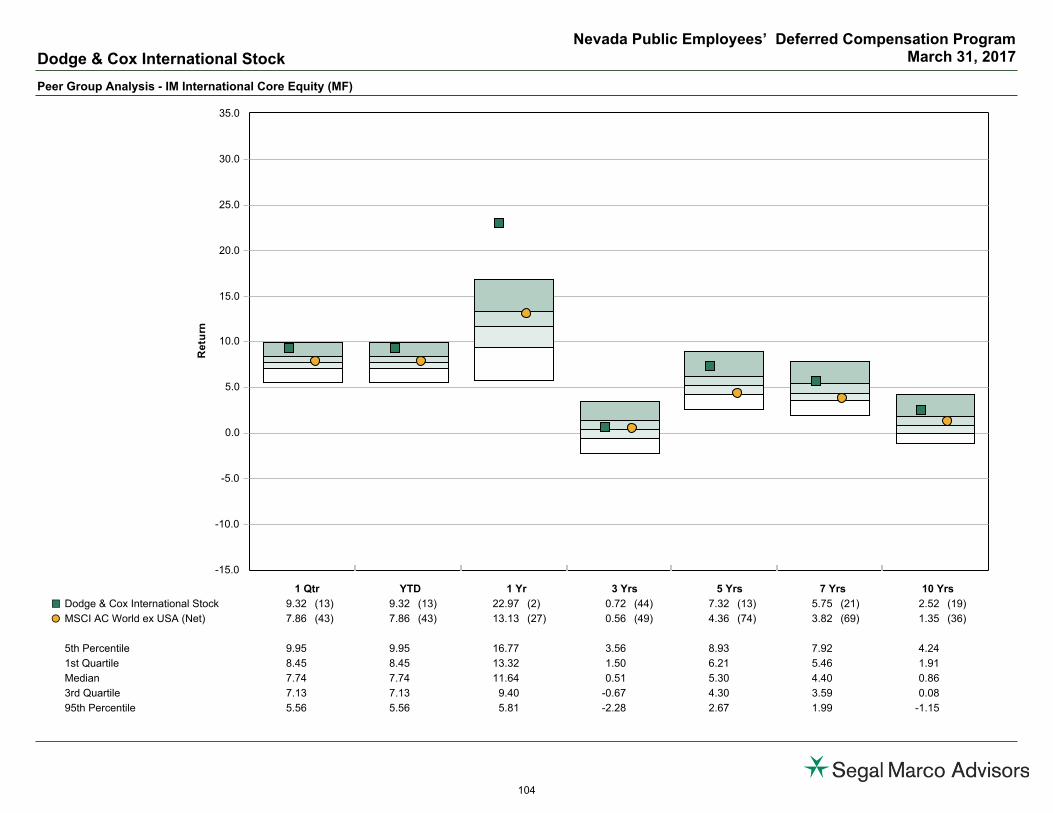
Peer Group Analysis - IM International Core Equity (MF)
-15.0
-10.0
-5.0
0.0
5.0
10.0
15.0
20.0
25.0
30.0
35.0
Re
turn
1 Qtr YTD 1 Yr 3 Yrs 5 Yrs 7 Yrs 10 Yrs
Dodge & Cox International Stock 9.32 (13) 9.32 (13) 22.97 (2) 0.72 (44) 7.32 (13) 5.75 (21) 2.52 (19)¢£
MSCI AC World ex USA (Net) 7.86 (43) 7.86 (43) 13.13 (27) 0.56 (49) 4.36 (74) 3.82 (69) 1.35 (36)��
5th Percentile 9.95 9.95 16.77 3.56 8.93 7.92 4.24
1st Quartile 8.45 8.45 13.32 1.50 6.21 5.46 1.91
Median 7.74 7.74 11.64 0.51 5.30 4.40 0.86
3rd Quartile 7.13 7.13 9.40 -0.67 4.30 3.59 0.08
95th Percentile 5.56 5.56 5.81 -2.28 2.67 1.99 -1.15
Dodge & Cox International Stock
Nevada Public Employees’ Deferred Compensation ProgramMarch 31, 2017
104

Peer Group Analysis - IM International Core Equity (MF)
-40.0
-30.0
-20.0
-10.0
0.0
10.0
20.0
30.0
40.0
50.0
Re
turn
2016 2015 2014 2013 2012 2011 2010
Dodge & Cox International Stock 8.26 (5) -11.35 (98) 0.08 (9) 26.31 (12) 21.03 (18) -15.97 (80) 13.69 (20)¢£
MSCI AC World ex USA (Net) 4.50 (20) -5.66 (87) -3.87 (25) 15.29 (82) 16.83 (68) -13.71 (51) 11.15 (38)��
5th Percentile 8.03 5.97 1.08 28.76 24.98 -6.99 23.75
1st Quartile 3.31 1.07 -3.96 22.97 19.97 -11.67 12.62
Median 1.10 -1.09 -5.51 20.69 17.94 -13.61 9.92
3rd Quartile -0.87 -2.93 -6.71 16.61 16.16 -15.61 7.17
95th Percentile -3.28 -9.49 -9.92 10.96 12.34 -21.25 4.45
Dodge & Cox International Stock
Nevada Public Employees’ Deferred Compensation ProgramMarch 31, 2017
105
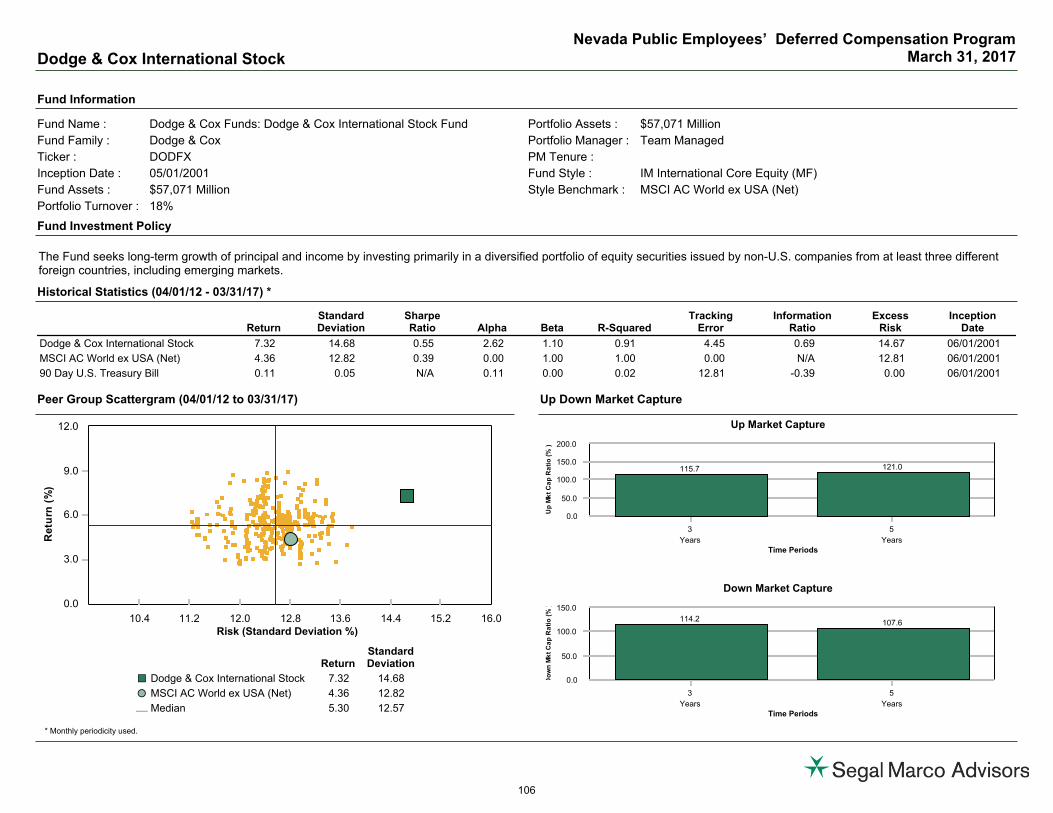
Peer Group Scattergram (04/01/12 to 03/31/17) Up Down Market Capture
Fund Information
Fund Investment Policy
Historical Statistics (04/01/12 - 03/31/17) *
* Monthly periodicity used.
Fund Name : Dodge & Cox Funds: Dodge & Cox International Stock Fund Portfolio Assets : $57,071 Million
Fund Family : Dodge & Cox Portfolio Manager : Team Managed
Ticker : DODFX PM Tenure :
Inception Date : 05/01/2001 Fund Style : IM International Core Equity (MF)
Fund Assets : $57,071 Million Style Benchmark : MSCI AC World ex USA (Net)
Portfolio Turnover : 18%
The Fund seeks long-term growth of principal and income by investing primarily in a diversified portfolio of equity securities issued by non-U.S. companies from at least three differentforeign countries, including emerging markets.
ReturnStandardDeviation
SharpeRatio Alpha Beta R-Squared
TrackingError
InformationRatio
ExcessRisk
InceptionDate
Dodge & Cox International Stock 7.32 14.68 0.55 2.62 1.10 0.91 4.45 0.69 14.67 06/01/2001
MSCI AC World ex USA (Net) 4.36 12.82 0.39 0.00 1.00 1.00 0.00 N/A 12.81 06/01/2001
90 Day U.S. Treasury Bill 0.11 0.05 N/A 0.11 0.00 0.02 12.81 -0.39 0.00 06/01/2001
0.0
3.0
6.0
9.0
12.0
Re
turn
(%)
10.4 11.2 12.0 12.8 13.6 14.4 15.2 16.0Risk (Standard Deviation %)
ReturnStandardDeviation
Dodge & Cox International Stock 7.32 14.68¢£
MSCI AC World ex USA (Net) 4.36 12.82��
Median 5.30 12.57¾
Up Market Capture
0.0
50.0
100.0
150.0
200.0
Up
Mk
t
Ca
p R
ati
o (%
)
3
Years
5
YearsTime Periods
115.7 121.0
Down Market Capture
0.0
50.0
100.0
150.0
Do
wn
Mk
t
Ca
p R
ati
o (%
)
3
Years
5
YearsTime Periods
114.2 107.6
Dodge & Cox International Stock
Nevada Public Employees’ Deferred Compensation ProgramMarch 31, 2017
106

Peer Group Analysis - IM Global Core Equity (MF)
-8.0
-4.0
0.0
4.0
8.0
12.0
16.0
20.0
24.0
28.0
Re
turn
1 Qtr YTD 1 Yr 3 Yrs 5 Yrs 7 Yrs 10 Yrs
Franklin Mutual Global Discovery 4.38 (95) 4.38 (95) 19.27 (5) 5.21 (43) 9.47 (31) 8.22 (46) 5.47 (14)¢£
MSCI AC World Index (Net) 6.91 (46) 6.91 (46) 15.04 (33) 5.08 (46) 8.37 (58) 7.81 (57) 4.00 (53)��
5th Percentile 8.56 8.56 18.98 8.37 11.77 10.48 6.51
1st Quartile 7.44 7.44 15.52 5.74 9.64 9.21 4.89
Median 6.82 6.82 13.97 4.85 8.58 8.07 4.05
3rd Quartile 5.81 5.81 12.04 3.37 7.17 7.01 3.16
95th Percentile 4.28 4.28 7.13 1.47 5.05 4.66 1.48
Franklin Mutual Global Discovery
Nevada Public Employees’ Deferred Compensation ProgramMarch 31, 2017
107

Peer Group Analysis - IM Global Core Equity (MF)
-40.0
-30.0
-20.0
-10.0
0.0
10.0
20.0
30.0
40.0
50.0
60.0
Re
turn
2016 2015 2014 2013 2012 2011 2010
Franklin Mutual Global Discovery 12.56 (5) -3.63 (83) 5.01 (31) 25.26 (51) 13.34 (75) -2.99 (11) 11.08 (65)¢£
MSCI AC World Index (Net) 7.86 (24) -2.36 (64) 4.16 (39) 22.80 (73) 16.13 (44) -7.35 (47) 12.67 (52)��
5th Percentile 11.95 3.10 10.08 32.56 22.42 0.32 21.37
1st Quartile 7.72 -0.35 5.87 28.06 18.23 -4.81 15.55
Median 6.45 -1.88 3.66 25.28 15.40 -7.54 12.94
3rd Quartile 4.81 -2.87 0.88 22.18 13.25 -10.52 10.09
95th Percentile 0.21 -7.68 -1.47 8.41 4.22 -19.13 6.89
Franklin Mutual Global Discovery
Nevada Public Employees’ Deferred Compensation ProgramMarch 31, 2017
108

Peer Group Scattergram (04/01/12 to 03/31/17) Up Down Market Capture
Fund Information
Fund Investment Policy
Historical Statistics (04/01/12 - 03/31/17) *
* Monthly periodicity used.
Fund Name : Franklin Mutual Series Funds: Franklin Mutual Global Discovery Fund;Class A Shares
Portfolio Assets : $23,235 Million
Fund Family : Franklin Templeton Investments Portfolio Manager : Langerman/Brugere-Trelat/Ranki
Ticker : TEDIX PM Tenure : 2009--2009--2013
Inception Date : 11/01/1996 Fund Style : IM Global Core Equity (MF)
Fund Assets : $10,289 Million Style Benchmark : MSCI AC World Index (Net)
Portfolio Turnover : 17%
The Fund seeks capital appreciation. Under normal market conditions, the Fund invests mainly in equity securities of companies that the Manager believes are available at marketprices less than their value based on certain recognized criteria. The fund generally invests a majority of its assets in foreign securities.
ReturnStandardDeviation
SharpeRatio Alpha Beta R-Squared
TrackingError
InformationRatio
ExcessRisk
InceptionDate
Franklin Mutual Global Discovery 9.47 9.49 0.99 2.48 0.82 0.89 3.71 0.23 9.49 12/01/1996
MSCI AC World Index (Net) 8.37 10.97 0.78 0.00 1.00 1.00 0.00 N/A 10.97 12/01/1996
90 Day U.S. Treasury Bill 0.11 0.05 N/A 0.11 0.00 0.01 10.97 -0.78 0.00 12/01/1996
3.0
6.0
9.0
12.0
15.0
Re
turn
(%)
6.0 8.0 10.0 12.0 14.0 16.0Risk (Standard Deviation %)
ReturnStandardDeviation
Franklin Mutual Global Discovery 9.47 9.49¢£
MSCI AC World Index (Net) 8.37 10.97��
Median 8.58 10.95¾
Up Market Capture
0.0
50.0
100.0
150.0
Up
Mk
t
Ca
p R
ati
o (%
)
3
Years
5
YearsTime Periods
92.7 90.7
Down Market Capture
0.0
50.0
100.0
150.0
Do
wn
Mk
t
Ca
p R
ati
o (%
)
3
Years
5
YearsTime Periods
88.975.4
Franklin Mutual Global Discovery
Nevada Public Employees’ Deferred Compensation ProgramMarch 31, 2017
109

Peer Group Analysis - IM Mixed-Asset Target 2010 (MF)
-2.0
0.0
2.0
4.0
6.0
8.0
10.0
12.0
Re
turn
1 Qtr YTD 1 Yr 3 Yrs 5 Yrs 7 Yrs 10 Yrs
Vanguard Target Retirement Income Inv 2.45 (92) 2.45 (92) 5.36 (95) 3.80 (47) 4.61 (83) 5.59 (71) 4.95 (2)¢£
Vanguard Target Income Composite Index 2.41 (92) 2.41 (92) 5.51 (94) 3.98 (33) 4.78 (79) 5.72 (66) 5.00 (1)��
5th Percentile 3.78 3.78 9.26 4.52 6.35 6.85 4.87
1st Quartile 3.33 3.33 7.97 4.09 5.84 6.40 4.47
Median 3.13 3.13 7.41 3.75 5.33 6.00 3.82
3rd Quartile 2.96 2.96 6.99 3.33 4.83 5.44 3.33
95th Percentile 2.30 2.30 3.93 1.79 3.10 4.02 2.81
Vanguard Target Retirement Income Inv
Nevada Public Employees’ Deferred Compensation ProgramMarch 31, 2017
110

Peer Group Analysis - IM Mixed-Asset Target 2010 (MF)
-10.0
-7.0
-4.0
-1.0
2.0
5.0
8.0
11.0
14.0
17.0
20.0
Re
turn
2016 2015 2014 2013 2012 2011 2010
Vanguard Target Retirement Income Inv 5.25 (79) -0.17 (8) 5.54 (11) 5.87 (80) 8.23 (79) 5.25 (1) 9.39 (85)¢£
Vanguard Target Income Composite Index 5.35 (74) 0.13 (3) 5.76 (9) 6.03 (79) 8.42 (78) 5.30 (1) 9.42 (85)��
5th Percentile 7.42 -0.05 6.01 11.94 12.38 3.50 13.10
1st Quartile 6.57 -0.79 4.65 10.67 11.19 1.83 11.81
Median 5.98 -1.18 4.11 8.67 9.78 0.75 10.78
3rd Quartile 5.32 -1.60 3.33 6.50 8.56 -0.40 9.92
95th Percentile 3.70 -2.11 2.31 1.73 5.80 -1.70 7.90
Vanguard Target Retirement Income Inv
Nevada Public Employees’ Deferred Compensation ProgramMarch 31, 2017
111

Peer Group Scattergram (04/01/12 to 03/31/17) Up Down Market Capture
Fund Information
Fund Investment Policy
Historical Statistics (04/01/12 - 03/31/17) *
* Monthly periodicity used.
Fund Name : Vanguard Chester Funds: Vanguard Target Retirement Income Fund;Investor Class Shares
Portfolio Assets : $10,729 Million
Fund Family : Vanguard Group Inc Portfolio Manager : Buek/Coleman/Nejman
Ticker : VTINX PM Tenure : 2013--2013--2013
Inception Date : 10/27/2003 Fund Style : IM Mixed-Asset Target 2010 (MF)
Fund Assets : $10,729 Million Style Benchmark : Vanguard Target Income Composite Index
Portfolio Turnover : 11%
The Fund seeks to provide current income and some capital appreciation The Fund is a fund-of-funds with an asset allocation strategy designed is for investors currently in retirement.
ReturnStandardDeviation
SharpeRatio Alpha Beta R-Squared
TrackingError
InformationRatio
ExcessRisk
InceptionDate
Vanguard Target Retirement Income Inv 4.61 3.58 1.25 -0.14 0.99 0.99 0.28 -0.61 3.58 11/01/2003
Vanguard Target Income Composite Index 4.78 3.59 1.29 0.00 1.00 1.00 0.00 N/A 3.59 11/01/2003
90 Day U.S. Treasury Bill 0.11 0.05 N/A 0.10 0.00 0.02 3.59 -1.29 0.00 11/01/2003
2.0
4.0
6.0
8.0
Re
turn
(%)
2.8 3.2 3.6 4.0 4.4 4.8 5.2 5.6 6.0 6.4Risk (Standard Deviation %)
ReturnStandardDeviation
Vanguard Target Retirement Income Inv 4.61 3.58¢£
Vanguard Target Income Composite Index 4.78 3.59��
Median 5.33 5.08¾
Up Market Capture
0.0
50.0
100.0
150.0
Up
Mk
t
Ca
p R
ati
o (%
)
3
Years
5
YearsTime Periods
98.0 98.6
Down Market Capture
0.0
50.0
100.0
150.0
Do
wn
Mk
t
Ca
p R
ati
o (%
)
3
Years
5
YearsTime Periods
100.8 101.7
Vanguard Target Retirement Income Inv
Nevada Public Employees’ Deferred Compensation ProgramMarch 31, 2017
112

Peer Group Analysis - IM Mixed-Asset Target 2015 (MF)
-2.0
0.0
2.0
4.0
6.0
8.0
10.0
12.0
14.0
Re
turn
1 Qtr YTD 1 Yr 3 Yrs 5 Yrs 7 Yrs 10 Yrs
Vanguard Target Retirement 2015 Inv 3.38 (53) 3.38 (53) 7.70 (66) 4.58 (22) 6.45 (29) 7.08 (19) 5.02 (9)¢£
Vanguard Target 2015 Composite Index 3.31 (59) 3.31 (59) 7.87 (61) 4.79 (9) 6.65 (17) 7.20 (13) 5.06 (5)��
5th Percentile 4.31 4.31 10.41 4.91 7.03 7.44 5.06
1st Quartile 3.71 3.71 9.22 4.54 6.52 6.99 4.69
Median 3.39 3.39 8.10 3.92 6.01 6.54 4.44
3rd Quartile 3.11 3.11 7.39 3.47 5.36 6.03 4.03
95th Percentile 2.64 2.64 4.38 1.97 4.58 5.36 3.73
Vanguard Target Retirement 2015 Inv
Nevada Public Employees’ Deferred Compensation ProgramMarch 31, 2017
113
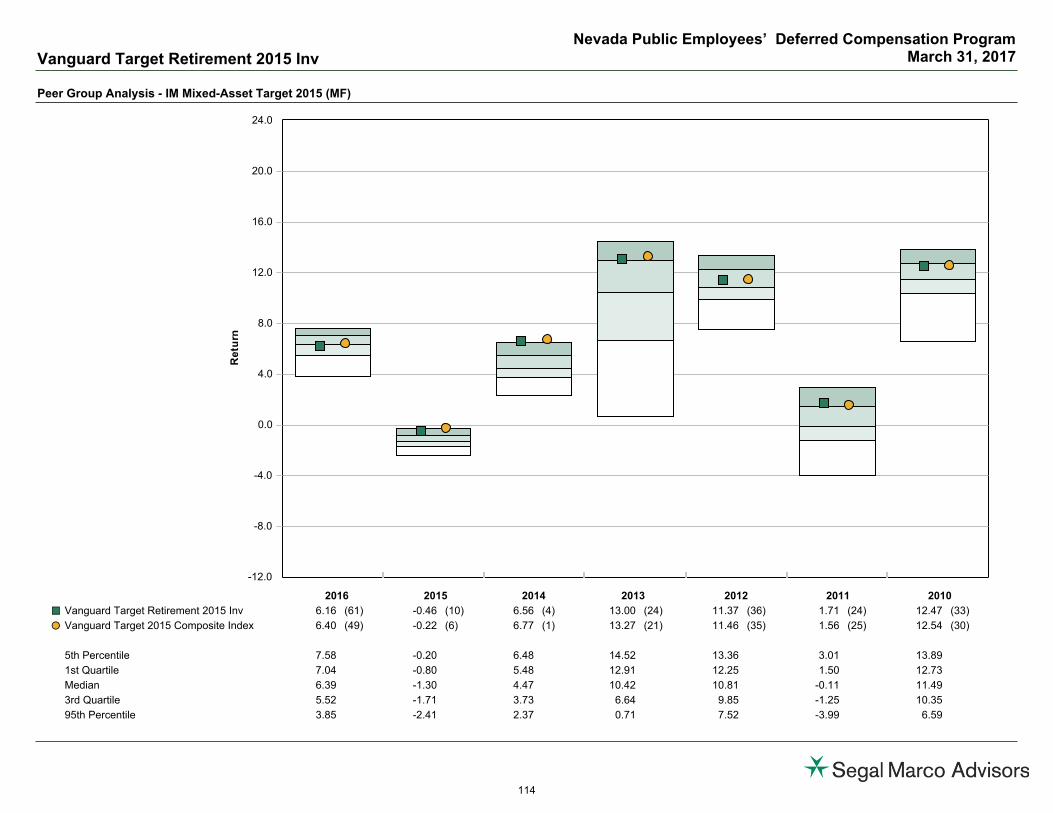
Peer Group Analysis - IM Mixed-Asset Target 2015 (MF)
-12.0
-8.0
-4.0
0.0
4.0
8.0
12.0
16.0
20.0
24.0
Re
turn
2016 2015 2014 2013 2012 2011 2010
Vanguard Target Retirement 2015 Inv 6.16 (61) -0.46 (10) 6.56 (4) 13.00 (24) 11.37 (36) 1.71 (24) 12.47 (33)¢£
Vanguard Target 2015 Composite Index 6.40 (49) -0.22 (6) 6.77 (1) 13.27 (21) 11.46 (35) 1.56 (25) 12.54 (30)��
5th Percentile 7.58 -0.20 6.48 14.52 13.36 3.01 13.89
1st Quartile 7.04 -0.80 5.48 12.91 12.25 1.50 12.73
Median 6.39 -1.30 4.47 10.42 10.81 -0.11 11.49
3rd Quartile 5.52 -1.71 3.73 6.64 9.85 -1.25 10.35
95th Percentile 3.85 -2.41 2.37 0.71 7.52 -3.99 6.59
Vanguard Target Retirement 2015 Inv
Nevada Public Employees’ Deferred Compensation ProgramMarch 31, 2017
114

Peer Group Scattergram (04/01/12 to 03/31/17) Up Down Market Capture
Fund Information
Fund Investment Policy
Historical Statistics (04/01/12 - 03/31/17) *
* Monthly periodicity used.
Fund Name : Vanguard Chester Funds: Vanguard Target Retirement 2015 Fund;Investor Class Shares
Portfolio Assets : $17,182 Million
Fund Family : Vanguard Group Inc Portfolio Manager : Buek/Coleman/Nejman
Ticker : VTXVX PM Tenure : 2013--2013--2013
Inception Date : 10/27/2003 Fund Style : IM Mixed-Asset Target 2015 (MF)
Fund Assets : $17,182 Million Style Benchmark : Vanguard Target 2015 Composite Index
Portfolio Turnover : 9%
The Fund seeks capital appreciation and current income consistent with its current asset allocation. The Fund is a fund-of-funds with the asset allocation becoming more conservativeover time. The allocation strategy designed is for investors planning to retire in or within a few years of 2015.
ReturnStandardDeviation
SharpeRatio Alpha Beta R-Squared
TrackingError
InformationRatio
ExcessRisk
InceptionDate
Vanguard Target Retirement 2015 Inv 6.45 5.49 1.15 -0.14 0.99 1.00 0.34 -0.57 5.49 11/01/2003
Vanguard Target 2015 Composite Index 6.65 5.52 1.18 0.00 1.00 1.00 0.00 N/A 5.52 11/01/2003
90 Day U.S. Treasury Bill 0.11 0.05 N/A 0.10 0.00 0.01 5.52 -1.18 0.00 11/01/2003
3.0
4.0
5.0
6.0
7.0
8.0
Re
turn
(%)
4.5 4.8 5.1 5.4 5.7 6.0 6.3 6.6Risk (Standard Deviation %)
ReturnStandardDeviation
Vanguard Target Retirement 2015 Inv 6.45 5.49¢£
Vanguard Target 2015 Composite Index 6.65 5.52��
Median 6.01 5.83¾
Up Market Capture
0.0
50.0
100.0
150.0
Up
Mk
t
Ca
p R
ati
o (%
)
3
Years
5
YearsTime Periods
97.8 98.5
Down Market Capture
0.0
50.0
100.0
150.0
Do
wn
Mk
t
Ca
p R
ati
o (%
)
3
Years
5
YearsTime Periods
99.7 100.4
Vanguard Target Retirement 2015 Inv
Nevada Public Employees’ Deferred Compensation ProgramMarch 31, 2017
115
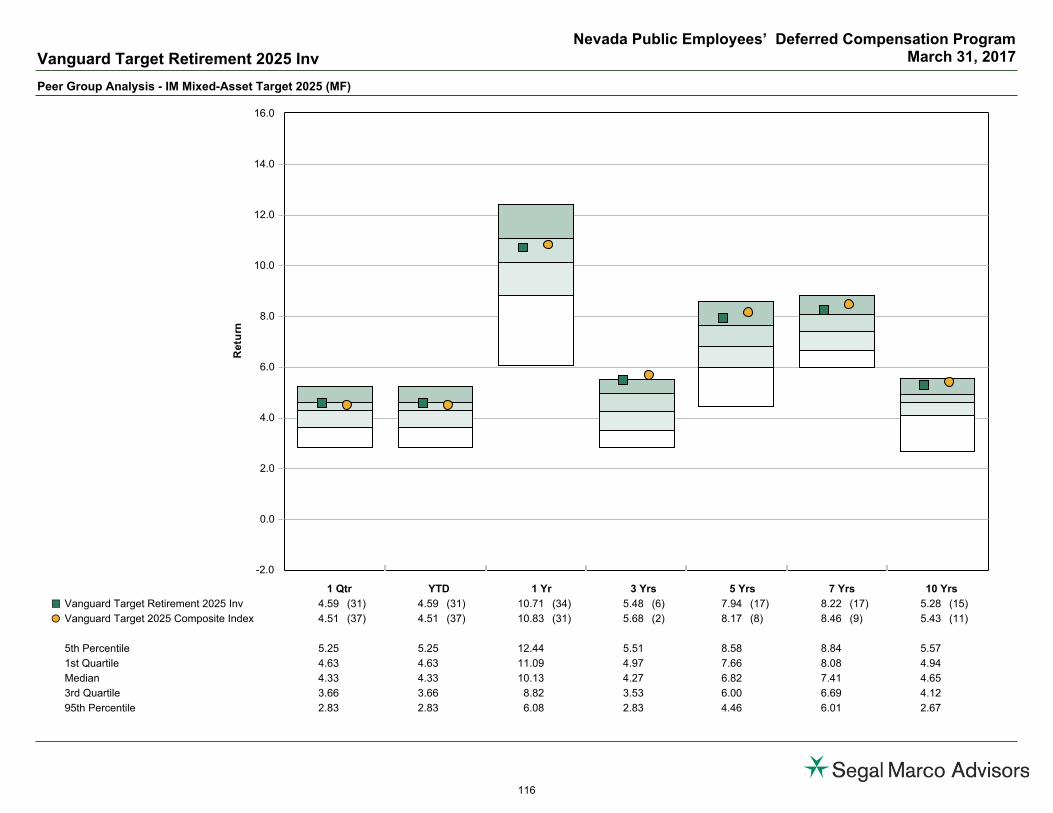
Peer Group Analysis - IM Mixed-Asset Target 2025 (MF)
-2.0
0.0
2.0
4.0
6.0
8.0
10.0
12.0
14.0
16.0
Re
turn
1 Qtr YTD 1 Yr 3 Yrs 5 Yrs 7 Yrs 10 Yrs
Vanguard Target Retirement 2025 Inv 4.59 (31) 4.59 (31) 10.71 (34) 5.48 (6) 7.94 (17) 8.22 (17) 5.28 (15)¢£
Vanguard Target 2025 Composite Index 4.51 (37) 4.51 (37) 10.83 (31) 5.68 (2) 8.17 (8) 8.46 (9) 5.43 (11)��
5th Percentile 5.25 5.25 12.44 5.51 8.58 8.84 5.57
1st Quartile 4.63 4.63 11.09 4.97 7.66 8.08 4.94
Median 4.33 4.33 10.13 4.27 6.82 7.41 4.65
3rd Quartile 3.66 3.66 8.82 3.53 6.00 6.69 4.12
95th Percentile 2.83 2.83 6.08 2.83 4.46 6.01 2.67
Vanguard Target Retirement 2025 Inv
Nevada Public Employees’ Deferred Compensation ProgramMarch 31, 2017
116

Peer Group Analysis - IM Mixed-Asset Target 2025 (MF)
-15.0
-10.0
-5.0
0.0
5.0
10.0
15.0
20.0
25.0
30.0
Re
turn
2016 2015 2014 2013 2012 2011 2010
Vanguard Target Retirement 2025 Inv 7.48 (26) -0.85 (24) 7.17 (4) 18.14 (24) 13.29 (45) -0.37 (18) 13.84 (39)¢£
Vanguard Target 2025 Composite Index 7.67 (19) -0.58 (18) 7.45 (1) 18.52 (21) 13.39 (43) 0.07 (14) 13.94 (33)��
5th Percentile 8.38 -0.16 7.07 20.61 15.54 0.84 15.14
1st Quartile 7.50 -0.90 6.20 17.87 14.45 -0.96 14.19
Median 6.87 -1.44 5.16 15.86 13.00 -2.03 13.42
3rd Quartile 6.15 -1.93 4.35 13.13 11.74 -2.86 12.57
95th Percentile 3.62 -4.51 2.72 4.78 10.37 -5.46 10.93
Vanguard Target Retirement 2025 Inv
Nevada Public Employees’ Deferred Compensation ProgramMarch 31, 2017
117

Peer Group Scattergram (04/01/12 to 03/31/17) Up Down Market Capture
Fund Information
Fund Investment Policy
Historical Statistics (04/01/12 - 03/31/17) *
* Monthly periodicity used.
Fund Name : Vanguard Chester Funds: Vanguard Target Retirement 2025 Fund;Investor Class Shares
Portfolio Assets : $33,669 Million
Fund Family : Vanguard Group Inc Portfolio Manager : Buek/Coleman/Nejman
Ticker : VTTVX PM Tenure : 2013--2013--2013
Inception Date : 10/27/2003 Fund Style : IM Mixed-Asset Target 2025 (MF)
Fund Assets : $33,669 Million Style Benchmark : Vanguard Target 2025 Composite Index
Portfolio Turnover : 15%
The Fund seeks capital appreciation and current income consistent with its current asset allocation. The Fund is a fund-of-funds with the asset allocation becoming more conservativeover time. The allocation strategy designed is for investors planning to retire in or within a few years of 2025.
ReturnStandardDeviation
SharpeRatio Alpha Beta R-Squared
TrackingError
InformationRatio
ExcessRisk
InceptionDate
Vanguard Target Retirement 2025 Inv 7.94 7.21 1.08 -0.13 0.99 1.00 0.43 -0.51 7.21 11/01/2003
Vanguard Target 2025 Composite Index 8.17 7.28 1.10 0.00 1.00 1.00 0.00 N/A 7.28 11/01/2003
90 Day U.S. Treasury Bill 0.11 0.05 N/A 0.10 0.00 0.00 7.28 -1.10 0.00 11/01/2003
2.0
4.0
6.0
8.0
10.0
Re
turn
(%)
4.8 5.4 6.0 6.6 7.2 7.8 8.4 9.0 9.6Risk (Standard Deviation %)
ReturnStandardDeviation
Vanguard Target Retirement 2025 Inv 7.94 7.21¢£
Vanguard Target 2025 Composite Index 8.17 7.28��
Median 6.82 7.32¾
Up Market Capture
0.0
50.0
100.0
150.0
Up
Mk
t
Ca
p R
ati
o (%
)
3
Years
5
YearsTime Periods
98.3 98.6
Down Market Capture
0.0
50.0
100.0
150.0
Do
wn
Mk
t
Ca
p R
ati
o (%
)
3
Years
5
YearsTime Periods
99.7 100.2
Vanguard Target Retirement 2025 Inv
Nevada Public Employees’ Deferred Compensation ProgramMarch 31, 2017
118

Peer Group Analysis - IM Mixed-Asset Target 2035 (MF)
-1.0
2.0
5.0
8.0
11.0
14.0
17.0
20.0
Re
turn
1 Qtr YTD 1 Yr 3 Yrs 5 Yrs 7 Yrs 10 Yrs
Vanguard Target Retirement 2035 Inv 5.52 (40) 5.52 (40) 13.04 (41) 5.95 (13) 9.05 (15) 9.08 (17) 5.46 (18)¢£
Vanguard Target 2035 Composite Index 5.42 (45) 5.42 (45) 13.20 (34) 6.18 (8) 9.30 (7) 9.33 (8) 5.61 (15)��
5th Percentile 6.43 6.43 15.27 6.35 9.60 9.57 6.10
1st Quartile 5.88 5.88 13.50 5.67 8.87 8.89 5.30
Median 5.31 5.31 12.76 5.11 7.91 8.27 4.88
3rd Quartile 4.94 4.94 12.00 4.40 7.24 7.72 4.36
95th Percentile 4.24 4.24 10.44 3.43 5.57 7.22 3.59
Vanguard Target Retirement 2035 Inv
Nevada Public Employees’ Deferred Compensation ProgramMarch 31, 2017
119
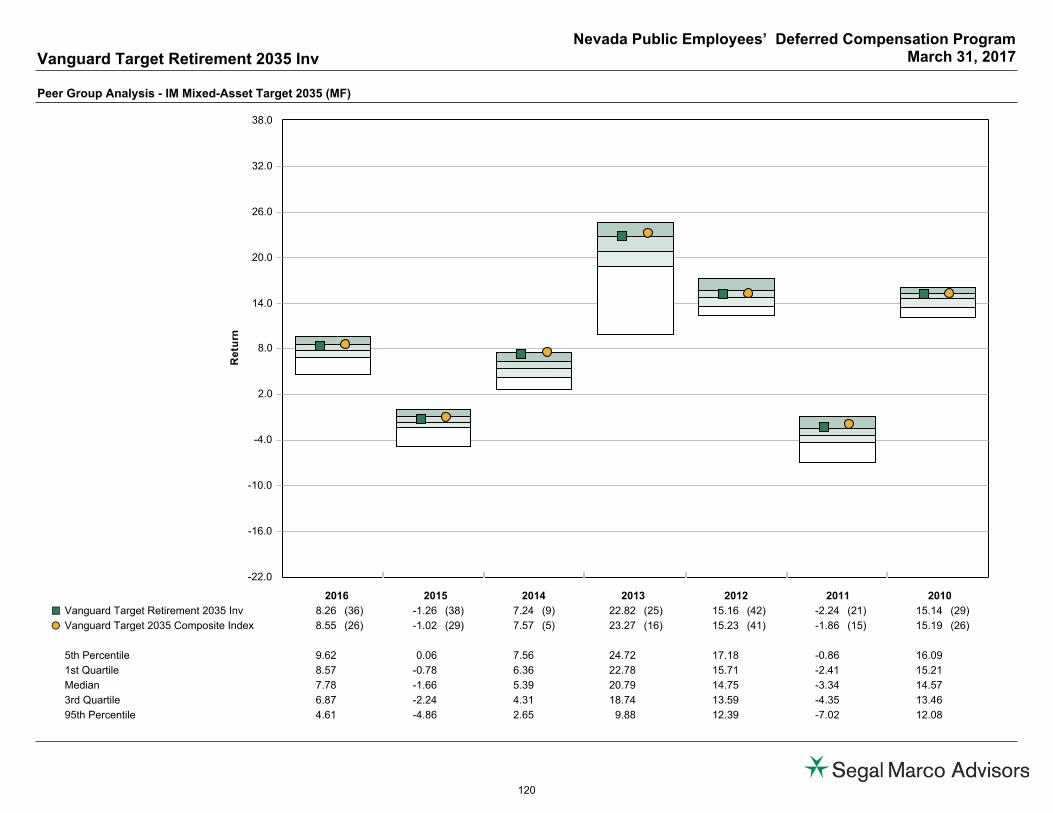
Peer Group Analysis - IM Mixed-Asset Target 2035 (MF)
-22.0
-16.0
-10.0
-4.0
2.0
8.0
14.0
20.0
26.0
32.0
38.0
Re
turn
2016 2015 2014 2013 2012 2011 2010
Vanguard Target Retirement 2035 Inv 8.26 (36) -1.26 (38) 7.24 (9) 22.82 (25) 15.16 (42) -2.24 (21) 15.14 (29)¢£
Vanguard Target 2035 Composite Index 8.55 (26) -1.02 (29) 7.57 (5) 23.27 (16) 15.23 (41) -1.86 (15) 15.19 (26)��
5th Percentile 9.62 0.06 7.56 24.72 17.18 -0.86 16.09
1st Quartile 8.57 -0.78 6.36 22.78 15.71 -2.41 15.21
Median 7.78 -1.66 5.39 20.79 14.75 -3.34 14.57
3rd Quartile 6.87 -2.24 4.31 18.74 13.59 -4.35 13.46
95th Percentile 4.61 -4.86 2.65 9.88 12.39 -7.02 12.08
Vanguard Target Retirement 2035 Inv
Nevada Public Employees’ Deferred Compensation ProgramMarch 31, 2017
120

Peer Group Scattergram (04/01/12 to 03/31/17) Up Down Market Capture
Fund Information
Fund Investment Policy
Historical Statistics (04/01/12 - 03/31/17) *
* Monthly periodicity used.
Fund Name : Vanguard Chester Funds: Vanguard Target Retirement 2035 Fund;Investor Class Shares
Portfolio Assets : $26,504 Million
Fund Family : Vanguard Group Inc Portfolio Manager : Buek/Coleman/Nejman
Ticker : VTTHX PM Tenure : 2013--2013--2013
Inception Date : 10/27/2003 Fund Style : IM Mixed-Asset Target 2035 (MF)
Fund Assets : $26,504 Million Style Benchmark : Vanguard Target 2035 Composite Index
Portfolio Turnover : 14%
The Fund seeks capital appreciation and current income consistent with its current asset allocation. The Fund is a fund-of-funds with the asset allocation becoming more conservativeover time. The allocation strategy designed is for investors planning to retire in or within a few years of 2035.
ReturnStandardDeviation
SharpeRatio Alpha Beta R-Squared
TrackingError
InformationRatio
ExcessRisk
InceptionDate
Vanguard Target Retirement 2035 Inv 9.05 8.76 1.02 -0.13 0.99 1.00 0.49 -0.48 8.76 11/01/2003
Vanguard Target 2035 Composite Index 9.30 8.84 1.04 0.00 1.00 1.00 0.00 N/A 8.84 11/01/2003
90 Day U.S. Treasury Bill 0.11 0.05 N/A 0.11 0.00 0.00 8.84 -1.04 0.00 11/01/2003
4.0
6.0
8.0
10.0
12.0
Re
turn
(%)
6.0 6.6 7.2 7.8 8.4 9.0 9.6 10.2 10.8Risk (Standard Deviation %)
ReturnStandardDeviation
Vanguard Target Retirement 2035 Inv 9.05 8.76¢£
Vanguard Target 2035 Composite Index 9.30 8.84��
Median 7.91 8.69¾
Up Market Capture
0.0
50.0
100.0
150.0
Up
Mk
t
Ca
p R
ati
o (%
)
3
Years
5
YearsTime Periods
99.5 99.2
Down Market Capture
0.0
50.0
100.0
150.0
Do
wn
Mk
t
Ca
p R
ati
o (%
)
3
Years
5
YearsTime Periods
101.8 101.1
Vanguard Target Retirement 2035 Inv
Nevada Public Employees’ Deferred Compensation ProgramMarch 31, 2017
121
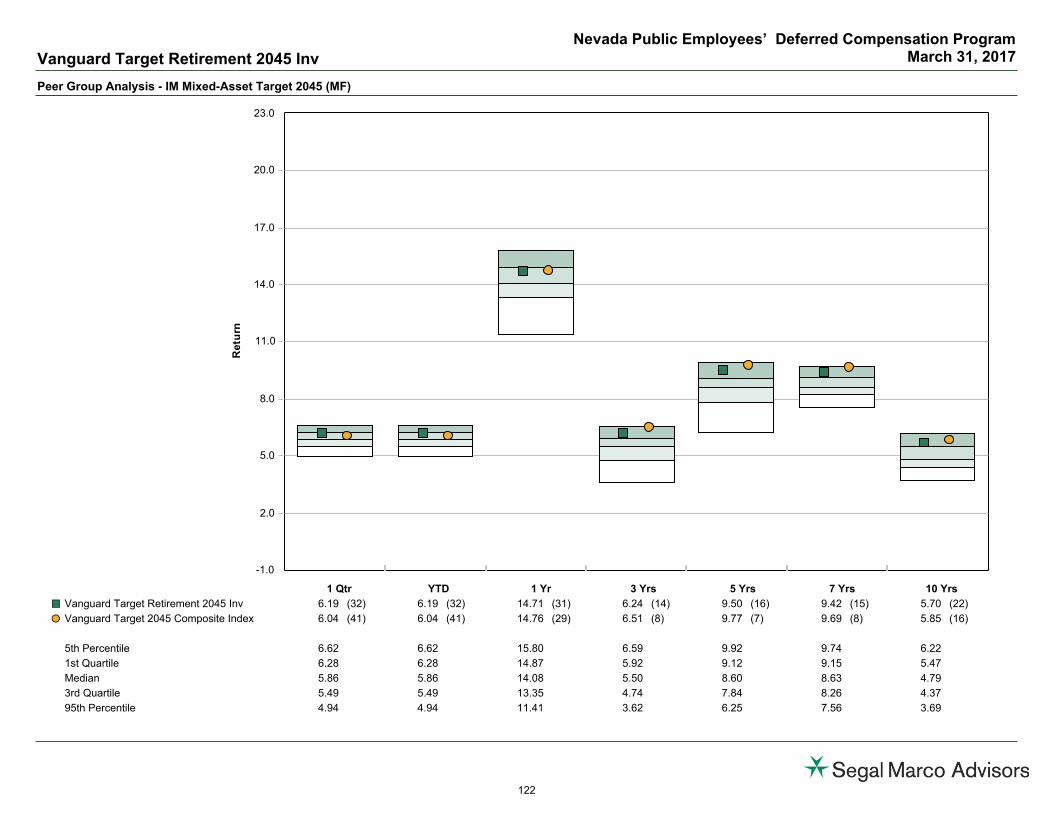
Peer Group Analysis - IM Mixed-Asset Target 2045 (MF)
-1.0
2.0
5.0
8.0
11.0
14.0
17.0
20.0
23.0
Re
turn
1 Qtr YTD 1 Yr 3 Yrs 5 Yrs 7 Yrs 10 Yrs
Vanguard Target Retirement 2045 Inv 6.19 (32) 6.19 (32) 14.71 (31) 6.24 (14) 9.50 (16) 9.42 (15) 5.70 (22)¢£
Vanguard Target 2045 Composite Index 6.04 (41) 6.04 (41) 14.76 (29) 6.51 (8) 9.77 (7) 9.69 (8) 5.85 (16)��
5th Percentile 6.62 6.62 15.80 6.59 9.92 9.74 6.22
1st Quartile 6.28 6.28 14.87 5.92 9.12 9.15 5.47
Median 5.86 5.86 14.08 5.50 8.60 8.63 4.79
3rd Quartile 5.49 5.49 13.35 4.74 7.84 8.26 4.37
95th Percentile 4.94 4.94 11.41 3.62 6.25 7.56 3.69
Vanguard Target Retirement 2045 Inv
Nevada Public Employees’ Deferred Compensation ProgramMarch 31, 2017
122

Peer Group Analysis - IM Mixed-Asset Target 2045 (MF)
-22.0
-16.0
-10.0
-4.0
2.0
8.0
14.0
20.0
26.0
32.0
38.0
Re
turn
2016 2015 2014 2013 2012 2011 2010
Vanguard Target Retirement 2045 Inv 8.87 (30) -1.57 (44) 7.16 (13) 24.37 (27) 15.58 (44) -2.51 (15) 15.19 (43)¢£
Vanguard Target 2045 Composite Index 9.13 (23) -1.25 (37) 7.61 (10) 24.79 (19) 15.58 (45) -2.11 (9) 15.33 (36)��
5th Percentile 10.03 0.10 8.09 25.95 17.32 -1.48 16.44
1st Quartile 9.06 -0.88 6.53 24.49 16.22 -2.97 15.65
Median 8.20 -1.75 5.55 23.07 15.47 -4.03 15.03
3rd Quartile 7.15 -2.43 4.25 20.66 14.70 -4.91 13.41
95th Percentile 4.77 -4.96 2.64 13.38 12.99 -7.78 11.96
Vanguard Target Retirement 2045 Inv
Nevada Public Employees’ Deferred Compensation ProgramMarch 31, 2017
123
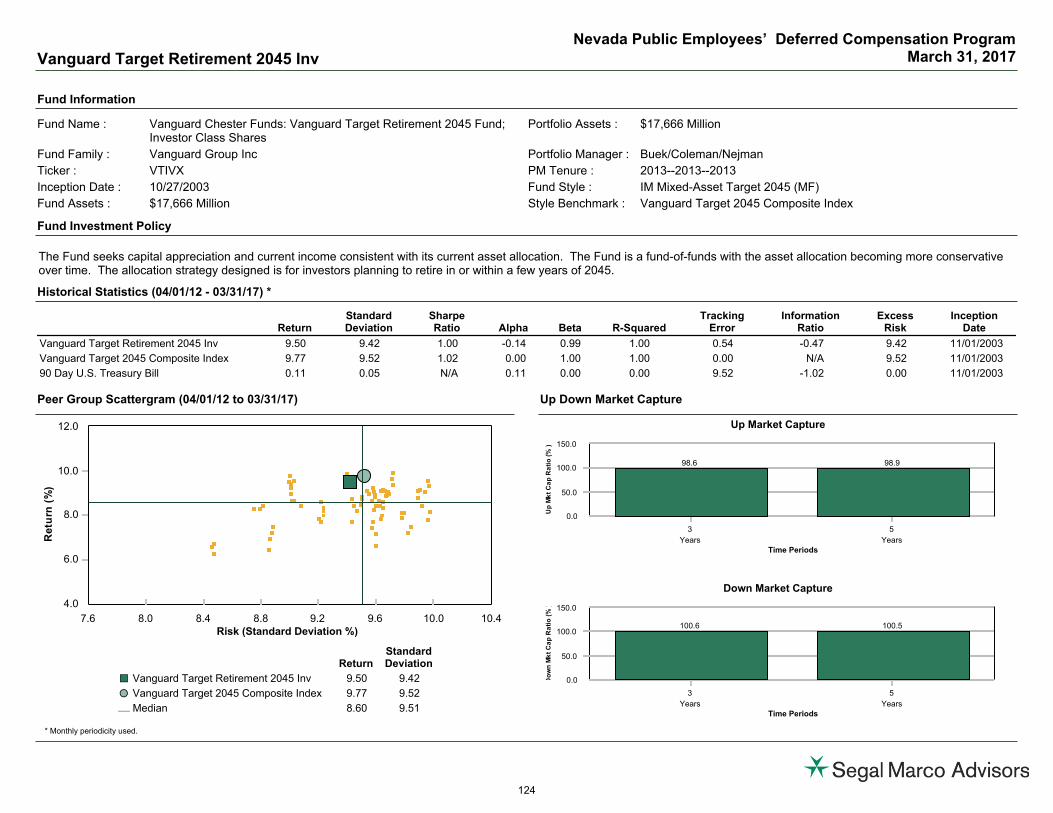
Peer Group Scattergram (04/01/12 to 03/31/17) Up Down Market Capture
Fund Information
Fund Investment Policy
Historical Statistics (04/01/12 - 03/31/17) *
* Monthly periodicity used.
Fund Name : Vanguard Chester Funds: Vanguard Target Retirement 2045 Fund;Investor Class Shares
Portfolio Assets : $17,666 Million
Fund Family : Vanguard Group Inc Portfolio Manager : Buek/Coleman/Nejman
Ticker : VTIVX PM Tenure : 2013--2013--2013
Inception Date : 10/27/2003 Fund Style : IM Mixed-Asset Target 2045 (MF)
Fund Assets : $17,666 Million Style Benchmark : Vanguard Target 2045 Composite Index
Portfolio Turnover : 13%
The Fund seeks capital appreciation and current income consistent with its current asset allocation. The Fund is a fund-of-funds with the asset allocation becoming more conservativeover time. The allocation strategy designed is for investors planning to retire in or within a few years of 2045.
ReturnStandardDeviation
SharpeRatio Alpha Beta R-Squared
TrackingError
InformationRatio
ExcessRisk
InceptionDate
Vanguard Target Retirement 2045 Inv 9.50 9.42 1.00 -0.14 0.99 1.00 0.54 -0.47 9.42 11/01/2003
Vanguard Target 2045 Composite Index 9.77 9.52 1.02 0.00 1.00 1.00 0.00 N/A 9.52 11/01/2003
90 Day U.S. Treasury Bill 0.11 0.05 N/A 0.11 0.00 0.00 9.52 -1.02 0.00 11/01/2003
4.0
6.0
8.0
10.0
12.0
Re
turn
(%)
7.6 8.0 8.4 8.8 9.2 9.6 10.0 10.4Risk (Standard Deviation %)
ReturnStandardDeviation
Vanguard Target Retirement 2045 Inv 9.50 9.42¢£
Vanguard Target 2045 Composite Index 9.77 9.52��
Median 8.60 9.51¾
Up Market Capture
0.0
50.0
100.0
150.0
Up
Mk
t
Ca
p R
ati
o (%
)
3
Years
5
YearsTime Periods
98.6 98.9
Down Market Capture
0.0
50.0
100.0
150.0
Do
wn
Mk
t
Ca
p R
ati
o (%
)
3
Years
5
YearsTime Periods
100.6 100.5
Vanguard Target Retirement 2045 Inv
Nevada Public Employees’ Deferred Compensation ProgramMarch 31, 2017
124
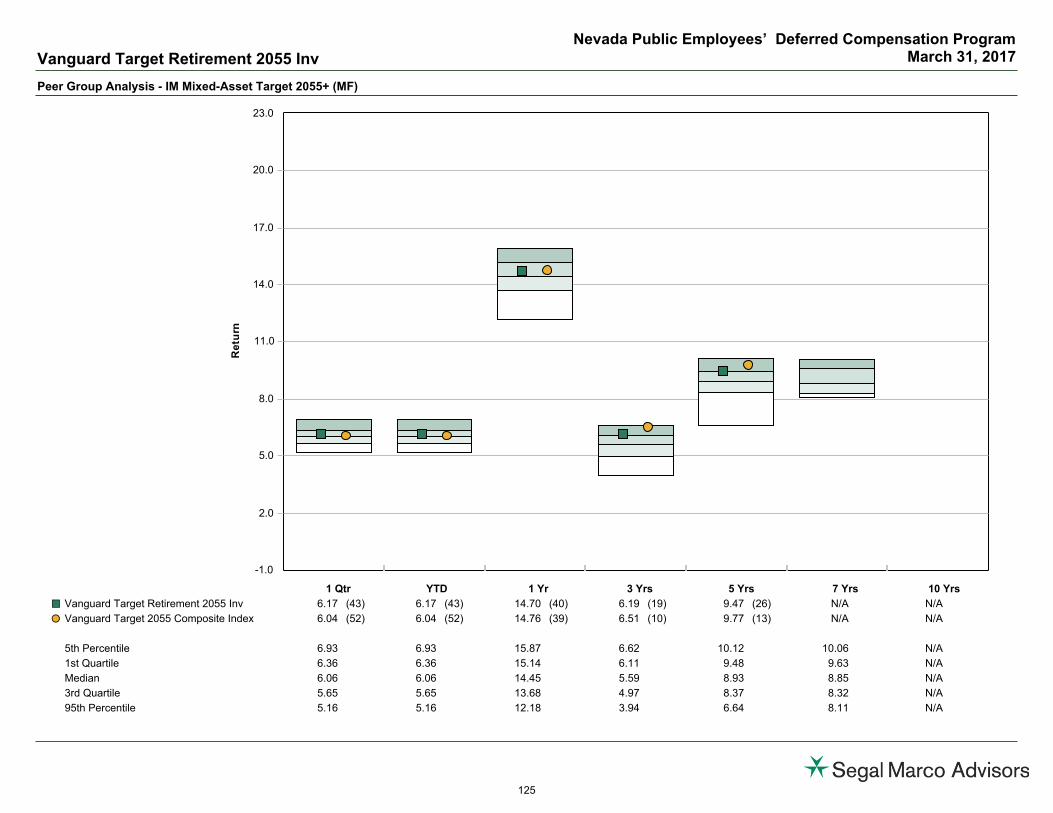
Peer Group Analysis - IM Mixed-Asset Target 2055+ (MF)
-1.0
2.0
5.0
8.0
11.0
14.0
17.0
20.0
23.0
Re
turn
1 Qtr YTD 1 Yr 3 Yrs 5 Yrs 7 Yrs 10 Yrs
Vanguard Target Retirement 2055 Inv 6.17 (43) 6.17 (43) 14.70 (40) 6.19 (19) 9.47 (26) N/A N/A¢£
Vanguard Target 2055 Composite Index 6.04 (52) 6.04 (52) 14.76 (39) 6.51 (10) 9.77 (13) N/A N/A��
5th Percentile 6.93 6.93 15.87 6.62 10.12 10.06 N/A
1st Quartile 6.36 6.36 15.14 6.11 9.48 9.63 N/A
Median 6.06 6.06 14.45 5.59 8.93 8.85 N/A
3rd Quartile 5.65 5.65 13.68 4.97 8.37 8.32 N/A
95th Percentile 5.16 5.16 12.18 3.94 6.64 8.11 N/A
Vanguard Target Retirement 2055 Inv
Nevada Public Employees’ Deferred Compensation ProgramMarch 31, 2017
125

Peer Group Analysis - IM Mixed-Asset Target 2055+ (MF)
-22.0
-16.0
-10.0
-4.0
2.0
8.0
14.0
20.0
26.0
32.0
38.0
44.0
Re
turn
2016 2015 2014 2013 2012 2011 2010
Vanguard Target Retirement 2055 Inv 8.88 (28) -1.72 (55) 7.20 (17) 24.33 (38) 15.58 (51) -2.27 (1) N/A¢£
Vanguard Target 2055 Composite Index 9.13 (24) -1.25 (39) 7.61 (13) 24.79 (31) 15.58 (51) -2.11 (1) N/A��
5th Percentile 10.18 0.15 8.57 26.18 17.28 -2.44 16.02
1st Quartile 9.02 -0.73 6.73 25.04 16.45 -3.78 15.16
Median 8.12 -1.63 5.44 23.26 15.58 -4.66 14.78
3rd Quartile 7.20 -2.32 4.29 22.02 14.83 -5.26 12.45
95th Percentile 4.87 -4.60 2.91 19.92 13.47 -8.51 11.28
Vanguard Target Retirement 2055 Inv
Nevada Public Employees’ Deferred Compensation ProgramMarch 31, 2017
126

Peer Group Scattergram (04/01/12 to 03/31/17) Up Down Market Capture
Fund Information
Fund Investment Policy
Historical Statistics (04/01/12 - 03/31/17) *
* Monthly periodicity used.
Fund Name : Vanguard Chester Funds: Vanguard Target Retirement 2055 Fund;Investor Class Shares
Portfolio Assets : $4,253 Million
Fund Family : Vanguard Group Inc Portfolio Manager : Buek/Coleman/Nejman
Ticker : VFFVX PM Tenure : 2013--2013--2013
Inception Date : 08/18/2010 Fund Style : IM Mixed-Asset Target 2055+ (MF)
Fund Assets : $4,253 Million Style Benchmark : Vanguard Target 2055 Composite Index
Portfolio Turnover : 8%
The Fund seeks capital appreciation and current income consistent with its current asset allocation. The Fund is a fund-of-funds with the asset allocation becoming more conservativeover time. The allocation strategy designed is for investors planning to retire in or within a few years of 2055.
ReturnStandardDeviation
SharpeRatio Alpha Beta R-Squared
TrackingError
InformationRatio
ExcessRisk
InceptionDate
Vanguard Target Retirement 2055 Inv 9.47 9.41 1.00 -0.15 0.99 1.00 0.53 -0.53 9.41 09/01/2010
Vanguard Target 2055 Composite Index 9.77 9.52 1.02 0.00 1.00 1.00 0.00 N/A 9.52 09/01/2010
90 Day U.S. Treasury Bill 0.11 0.05 N/A 0.11 0.00 0.00 9.52 -1.02 0.00 09/01/2010
4.0
6.0
8.0
10.0
12.0
Re
turn
(%)
8.7 9.0 9.3 9.6 9.9 10.2 10.5 10.8Risk (Standard Deviation %)
ReturnStandardDeviation
Vanguard Target Retirement 2055 Inv 9.47 9.41¢£
Vanguard Target 2055 Composite Index 9.77 9.52��
Median 8.93 9.62¾
Up Market Capture
0.0
50.0
100.0
150.0
Up
Mk
t
Ca
p R
ati
o (%
)
3
Years
5
YearsTime Periods
98.4 98.8
Down Market Capture
0.0
50.0
100.0
150.0
Do
wn
Mk
t
Ca
p R
ati
o (%
)
3
Years
5
YearsTime Periods
100.7 100.6
Vanguard Target Retirement 2055 Inv
Nevada Public Employees’ Deferred Compensation ProgramMarch 31, 2017
127