Embed Size (px)
Citation preview

1 High Performance Computing Center The City University of New York www.csi.cuny.edu/cunyhpc
Analysis of Intel SSDs on SGI UV 300 Benchmark results on CUNY HPC Center’s SGI® UV™ 300 “Appel”
with 12 Intel® SSD DC P3700 for NVMe.
HPC User Forum - Austin, TX September 7, 2016
Nikos Trikoupis, HPC architecture manager
[email protected] Paul Muzio, director

2 High Performance Computing Center The City University of New York www.csi.cuny.edu/cunyhpc
Objective
• CUNY HPCC Proof of Concept (POC) project to investigate benefits of PCIe NVMe Flash Storage for in-memory databases.
• Typical database configuration varies from a few terabytes to multiple petabytes.
• The workload is highly sequential, read intensive I/O.
3 High Performance Computing Center The City University of New York www.csi.cuny.edu/cunyhpc
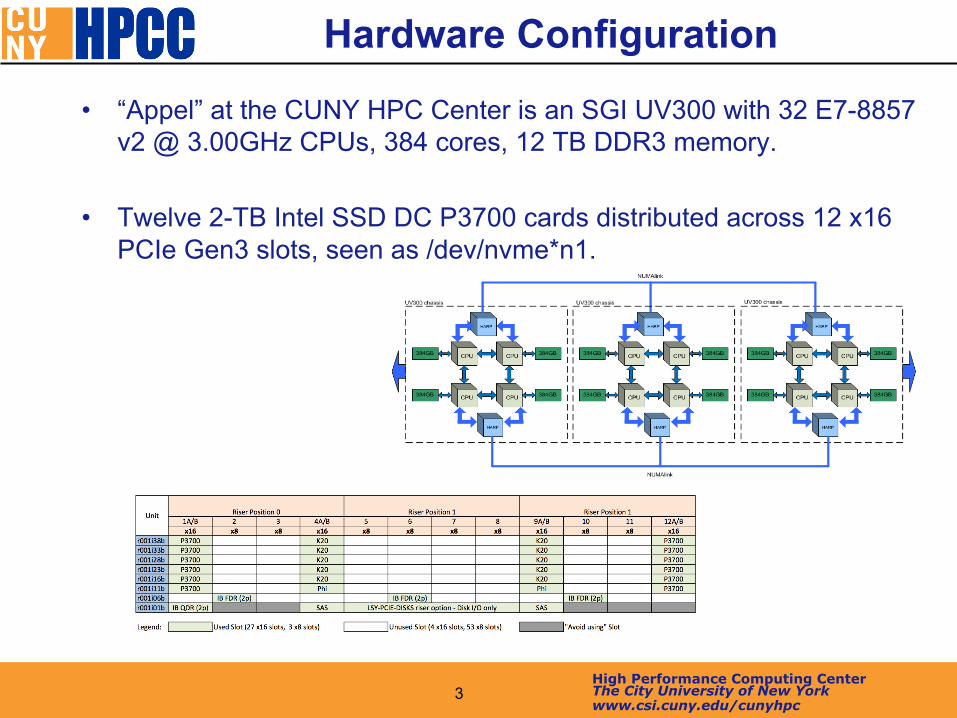
Hardware Configuration
• “Appel” at the CUNY HPC Center is an SGI UV300 with 32 E7-8857 v2 @ 3.00GHz CPUs, 384 cores, 12 TB DDR3 memory.
• Twelve 2-TB Intel SSD DC P3700 cards distributed across 12 x16 PCIe Gen3 slots, seen as /dev/nvme*n1.

4 High Performance Computing Center The City University of New York www.csi.cuny.edu/cunyhpc
Software Configuration(s)
• SGI-enhanced NVM Express (NVMe) driver v 1.1 • SLES 11 SP3 • PBS Pro 13 • Linux Software RAID with Intel's RSTe extensions • XVM Volume Manager v 3.4 • XFS File system • GPFS file system v 3.5.0.26

5 High Performance Computing Center The City University of New York www.csi.cuny.edu/cunyhpc
Methodology
• Measuring streaming (sequential) throughput of the the P3700 SSD cards on the UV300 under a variety of volume manager and file system configurations.
– First, establish a performance baseline for a single SSD. – Assemble all SSDs into a single RAID-0 volume using
• Linux Software RAID • XVM Volume Manager
– Format using the XFS and the GPFS file systems. • Aggregate read and write throughput measured using the IOR
benchmark with the following options: -a POSIX, -B (use direct I/O) -e (close and sync files at the end of test) -t 1m (for e.g. 1 MB transfer size) -b 1m (for e.g. 1 MB block size) -C (reorder tasks so that the same process does not read a cached version of what they wrote before) -F (file-per-process) -k (keep files after test) -s xxxx (controls the total amount of the data transferred). -N is the number of MPI threads used.

6 High Performance Computing Center The City University of New York www.csi.cuny.edu/cunyhpc
System Tuning • The following script was used to set the affinity in
accordance with the driver hints for all Intel NVMe devices in the system:
find /proc/irq/*/nvme* | cut -d/ -f4 | xargs -I '{}' sh -c "cat /proc/irq/{}/affinity_hint > /proc/irq/{}/smp_affinity”
• C1E state is disabled in BIOS settings: for p in $(seq $(sed 's/-/ /' /sys/devices/system/cpu/online)); do wrmsr -p $p 0x1fc 0x35040041; done
• All cards were wiped using blkdiscard before each test. Each test was then run twice, in an attempt to approach the SSD’s steady state. The second round of numbers were recorded.
7 High Performance Computing Center The City University of New York www.csi.cuny.edu/cunyhpc
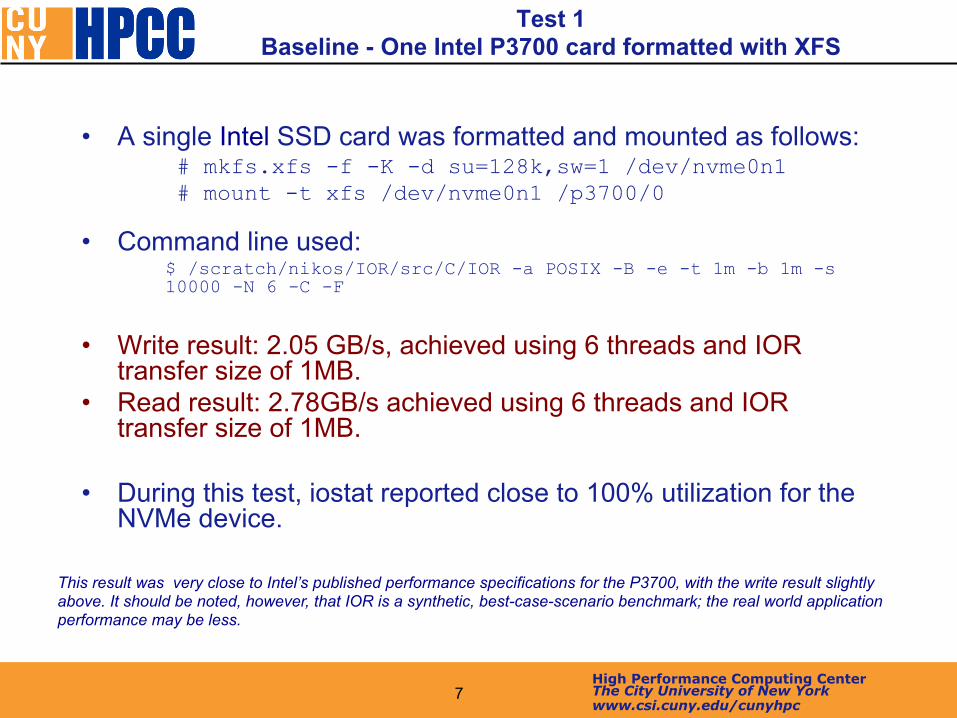
• A single Intel SSD card was formatted and mounted as follows: # mkfs.xfs -f -K -d su=128k,sw=1 /dev/nvme0n1 # mount -t xfs /dev/nvme0n1 /p3700/0
• Command line used: $ /scratch/nikos/IOR/src/C/IOR -a POSIX -B -e -t 1m -b 1m -s 10000 -N 6 -C -F
• Write result: 2.05 GB/s, achieved using 6 threads and IOR
transfer size of 1MB. • Read result: 2.78GB/s achieved using 6 threads and IOR
transfer size of 1MB. • During this test, iostat reported close to 100% utilization for the
NVMe device.
Test 1 Baseline - One Intel P3700 card formatted with XFS
This result was very close to Intel’s published performance specifications for the P3700, with the write result slightly above. It should be noted, however, that IOR is a synthetic, best-case-scenario benchmark; the real world application performance may be less.

8 High Performance Computing Center The City University of New York www.csi.cuny.edu/cunyhpc
• The SSDs were formatted as in Test 1 and mounted under
12 separate mount points below /p3700: # mount -t xfs /dev/nvme0n1 /p3700/0 … # mount -t xfs /dev/nvme0n1 /p3700/11
• IOR is run using 33 to 264 threads. We are testing with
IOR transfer sizes from 1MB to 16 MB. During each run, IOR is writing on all Intel cards simultaneously.
• Example command IOR line: mpiexec_mpt /scratch/
nikos/IOR/src/C/IOR -a POSIX -B -e -t 1m -b 1m -s 10000 –N 132 -C -F -k -o 0/0@1/1@2/2@3/3@4/4@5/5@6/6@7/7@8/8@9/9@10/10@11/11
• Best write result: 24.1 GB/s, using 132 threads and
transfer size of 16 MB. • Best read result: 32.9 GB/s, using 132 threads and
transfer size of 16 MB. • During the test, iostat reported close to 100% utilization
for the NVMe devices.
2000.00
7000.00
12000.00
17000.00
22000.00
27000.00
32000.00
37000.00
33 66 99 132 264
MB
/S
IOR threads
Test 2: IOR throughput for 12 SSDs and 1 XFS Filesystem per card
Write-1MB Write-4MB Write-8MB Write-16MB
Read-1MB Read-4MB Read-8MB Read-16MB
Test 2 Twelve Intel P3700 cards, one XFS file system per card
With 33 IOR threads, 1MB reads show an 81% scalability and 1 MB writes are at 90% scalability. With 132 IOR threads, the comparable percentages are each close to 100%. This setup gave the best overall performance among all our tests. Note that the results of all four write tests are shown in the chart and so closely overlap in performance that the distinct lines are not easily visible.

9 High Performance Computing Center The City University of New York www.csi.cuny.edu/cunyhpc
• For this test, GPFS version v3.5.0.26 is set up as a single file system with each of the raw /dev/nvme* devices as NSD drives. It is created using 1M as block size and mounted as follows: # mmcrfs p3700 -F p3700.lst –B 1M -v no -n 32 -j scatter -T/global/p3700 -A no
# mmmount /global/p3700 –o nomtime,noatime
• Tests were run inside the NSD server, the
UV300 - no remote clients were involved.
• IOR is run using 33 to 264 threads with IOR transfer sizes from 1MB to 16 MB.
• Example IOR command line used:
mpiexec_mpt /scratch/nikos/IOR/src/C/IOR -a POSIX -B -e -t 1m -b 1m -s 1000 –N 33 -C -F –k
• Best read result: 31.6 GB/s, with 66 threads and
transfer size of 16 MB, although very similar numbers were observed using 1MB of transfer size.
• Best write result: 18.8 GB/s, using 33 threads and transfer size of 16 MB.
Test 3 Twelve P3700 cards, one GPFS file system with 1M block size
Although read performance using GPFS was comparable to the results from Test 2 using XFS with 95% scalability at 66 IOR threads, write performance was decidedly not, with only 31% scalability. We expect that newer versions of GPFS with tuning for NVMe drives will show better performance on writes.
2000.00
7000.00
12000.00
17000.00
22000.00
27000.00
32000.00
37000.00
33 66 99 132 264 M
B/s
IOR threads
Test 3: IOR throughput: 12 SSDs and 1 GPFS file system with 1 MB blocksize
Write-1MB Write-4MB Write-8MB Write-16MB
Read-1MB Read-4MB Read-8MB Read-16MB

10 High Performance Computing Center The City University of New York www.csi.cuny.edu/cunyhpc
• GPFS version v3.5.0.26 is set up with each of the raw /dev/nvme* devices as NSD drives. It is created using 4M as block size and mounted as follows: # mmcrfs p3700 -F p3700.lst –B 4M -v no -n 32 -j scatter -T/global/p3700 -A no # mmmount /global/p3700 –o nomtime,noatime
• Tests were run inside the NSD server, the UV300 - no
remote clients were involved.
• IOR is run using 33 to 264 threads and tested with IOR transfer sizes from 1MB to 16 MB.
• Example command line used: mpiexec_mpt /scratch/nikos/IOR/src/C/IOR -a POSIX -B -e -t 1m -b 1m -s 1000 –N 66 -C -F –k
• Best read result: 31.3 GB/s, using 99 threads and IOR transfer size of 16MB (although very similar numbers were achieved using 1 MB transfer size).
• Best write result: 22.4 GB/s, using 66 threads and IOR transfer size of 16 MB.
Test 4 Twelve P3700 cards, one GPFS file system with 4M block size
Formatting using a larger, 4MB GPFS block size, improved performance for large sequential writes compared to Test 3, but results still lagged compared to Test 2 with XFS. Again, we expect that newer versions of GPFS with tuning for NVMe drives will show better performance on writes. Read performance remained excellent for a single file system spread over 12 NVMe cards.
2000.00
7000.00
12000.00
17000.00
22000.00
27000.00
32000.00
37000.00
33 66 99 132 264 M
B/s
IOR threads
IORthroughputfor12Cards,1GPFSFilesystem,4MBblocksize
Write-1MB Write-4MB Write-8MB Write-16MB
Read-1MB Read-4MB Read-8MB Read-16MB
11 High Performance Computing Center The City University of New York www.csi.cuny.edu/cunyhpc
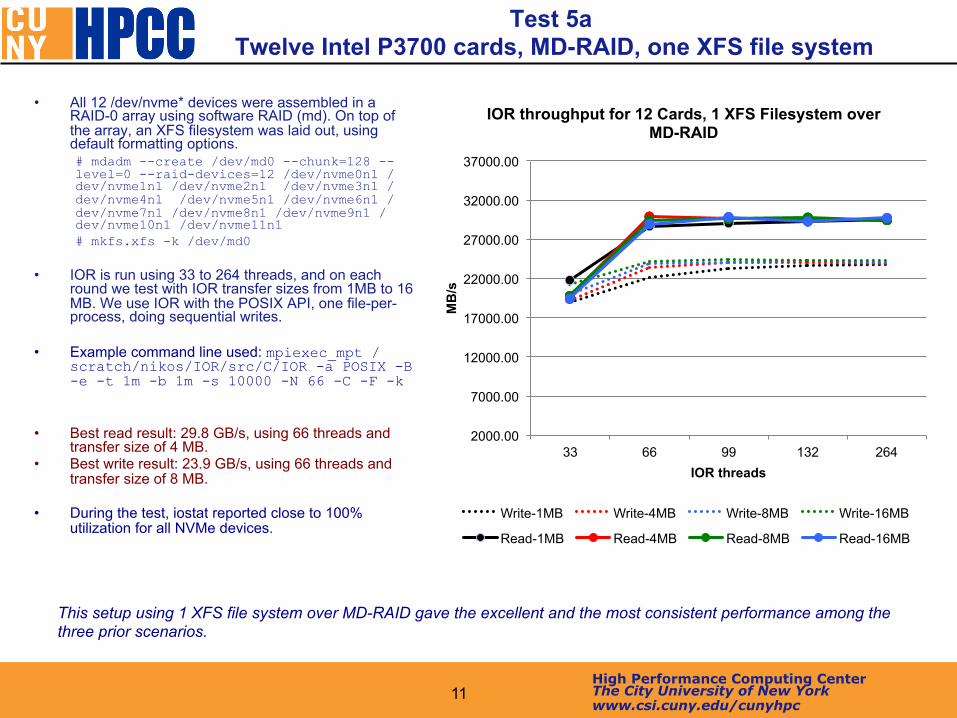
• All 12 /dev/nvme* devices were assembled in a RAID-0 array using software RAID (md). On top of the array, an XFS filesystem was laid out, using default formatting options. # mdadm --create /dev/md0 --chunk=128 --level=0 --raid-devices=12 /dev/nvme0n1 /dev/nvme1n1 /dev/nvme2n1 /dev/nvme3n1 /dev/nvme4n1 /dev/nvme5n1 /dev/nvme6n1 /dev/nvme7n1 /dev/nvme8n1 /dev/nvme9n1 /dev/nvme10n1 /dev/nvme11n1 # mkfs.xfs -k /dev/md0
• IOR is run using 33 to 264 threads, and on each
round we test with IOR transfer sizes from 1MB to 16 MB. We use IOR with the POSIX API, one file-per-process, doing sequential writes.
• Example command line used: mpiexec_mpt /
scratch/nikos/IOR/src/C/IOR -a POSIX -B -e -t 1m -b 1m -s 10000 -N 66 -C -F -k
• Best read result: 29.8 GB/s, using 66 threads and
transfer size of 4 MB. • Best write result: 23.9 GB/s, using 66 threads and
transfer size of 8 MB. • During the test, iostat reported close to 100%
utilization for all NVMe devices.
Test 5a Twelve Intel P3700 cards, MD-RAID, one XFS file system
This setup using 1 XFS file system over MD-RAID gave the excellent and the most consistent performance among the three prior scenarios.
2000.00
7000.00
12000.00
17000.00
22000.00
27000.00
32000.00
37000.00
33 66 99 132 264 M
B/s
IOR threads
IOR throughput for 12 Cards, 1 XFS Filesystem over MD-RAID
Write-1MB Write-4MB Write-8MB Write-16MB
Read-1MB Read-4MB Read-8MB Read-16MB

12 High Performance Computing Center The City University of New York www.csi.cuny.edu/cunyhpc
• This test is very similar to Test 5a, with the difference that we are creating the volume using the Intel Storage Technology Enterprise RAID metadata format, which enables Intel RSTe features, such as creating multiple volumes within the same array. Also, instead of formatting the raw /dev/md0 device, we partition it first. We use the following commands to set the array, partition, format and mount it: # mdadm --create /dev/md0 --chunk=128 --level=0 --raid-devices=12 /dev/nvme0n1 /dev/nvme1n1 /dev/nvme2n1 /dev/nvme3n1 /dev/nvme4n1 /dev/nvme5n1 /dev/nvme6n1 /dev/nvme7n1 /dev/nvme8n1 /dev/nvme9n1 /dev/nvme10n1 /dev/nvme11n1 # mkfs.xfs -k /dev/md0
• IOR is run using 33 to 264 threads, and on each
round we test with IOR transfer sizes netween 1MB to 16 MB
• Example command line used: mpiexec_mpt /
scratch/nikos/IOR/src/C/IOR -a POSIX -B -e -t 1m -b 1m -s 10000 -N 66 -C -F –k
• Best read result: 29.9 GB/s using 66 threads and
transfer size of 4MB. • Best write result: 24.2 GB/s using 66 threads and
transfer size of 8MB. • During the test, iostat reported close to 100%
utilization for all NVMe devices.
Test 5b Twelve P3700 cards, MD-RAID with RSTe, one XFS file system
This setup using 1 XFS file system over MD-RAID/IMSM, gave excellent performance, marginally better to that of MD-RAID, but the performance was slightly less consistent across the number of IOR threads.
2000.00
7000.00
12000.00
17000.00
22000.00
27000.00
32000.00
37000.00
33 66 99 132 264 M
B/s
IOR threads
IOR throughput for 12 Cards, 1 XFS Filesystem over MD-RAID/IMSM
Write-1MB Write-4MB Write-8MB Write-16MB
Read-1MB Read-4MB Read-8MB Read-16MB

13 High Performance Computing Center The City University of New York www.csi.cuny.edu/cunyhpc
• All /dev/nvme* devices are assembled in a basic striped XVM volume using SGI's xvmgr. On top of the volume, an XFS file system was laid out, using default formatting options.
• XFS/XVM version was 3.4. • IOR is run using 33 to 264 threads, and on each
round we test with IOR transfer sizes between 1MB and 16 MB.
• Example command line used:
mpiexec_mpt /scratch/nikos/IOR/src/C/IOR -a POSIX -B -e -t 1m -b 1m -s 10000 -N 66 -C -F -k
• Best read result: 28.9 GB/s, using 66 threads and transfer size of 16 MB.
• Best write result: 23.8 GB/s, using 66 threads and transfer size of 8 MB.
Test 6: Twelve P3700 cards, XVM volume manager, one XFS file system
2000.00
7000.00
12000.00
17000.00
22000.00
27000.00
32000.00
37000.00
33 66 132 264 M
B/s
IOR threads
IOR throughput for 12 Cards, 1 XFS Filesystem over XVM
Write-1MB Write-4MB Write-8MB Write-16MB
Read-1MB Read-4MB Read-8MB Read-16MB
The results for this setup were similar to Tests 5a and 5b (XFS over MD-RAID), with the latter two giving marginally better and more consistent performance.

14 High Performance Computing Center The City University of New York www.csi.cuny.edu/cunyhpc
Conclusions • Evaluated the sequential throughput performance of 12 Intel DC P3700
NVMe SSDs on a SGI UV 300 system with different volume managers and file systems.
• Typically installed aiming for high IOPS - they offer excellent throughput performance, slightly better than the published specifications, for sequential reads and writes.
• Non-RAID layout gave the best overall performance: 32.9 GB/s read and 24.1 GB/s write. Excellent scalar performance compared to the single card baseline numbers, very little overhead.
• Linux Software RAID with Intel's IMSM extensions had a throughput of 29.9 MB/s read and 24.2 MB/s write.
• Although write throughput is the same in both options, there was a 9.1% tax in read throughput in the Linux Software RAID option. Probably because the /dev/md0 virtual device in MD-RAID still suffers from the classic architectural limitation in the Linux block layer of a single submission-completion queue for block devices.
15 High Performance Computing Center The City University of New York www.csi.cuny.edu/cunyhpc
Acknowledgements
• We thank the following people for their support and their help in this project:
• From Intel: Chris Allison, Melanie Fekete, Andrey
Kudryavtsev, Cyndi Peach. • From Silicon Graphics International: James Hooks,
John Kichury, Kirill Malkin.
16 High Performance Computing Center The City University of New York www.csi.cuny.edu/cunyhpc
Thank you!
https://cunyhpc.csi.cuny.edu/publications/CUNYHPC-P3700-UV300.pdf
Questions?