Embed Size (px)
Citation preview
GREYLOCK MCKINNON ASSOCIATES
ANALYSIS OF INDUSTRIAL WIND TURBINES
SUMMER INTERNSHIP
KOFI AM0AKO-GYAN
7/10/2012
2
Contents LIST OF FIGURES ............................................................................................................................................ 3
LIST OF TABLES .............................................................................................................................................. 4
ABSTRACT ...................................................................................................................................................... 5
EXECUTIVE SUMMARY .................................................................................................................................. 6
INTRODUCTION ............................................................................................................................................. 7
CURRENT GLOBAL INDUSTRIAL WIND TURBINE (IWT) INSTALLED CAPACITY .............................................. 8
DRIVERS FOR SUSTAINED IWT INSTALLATION IN THE WORLD ................................................................... 11
RESOURCE ASSESSMENT AND SITING OF IWT ............................................................................................ 12
Wind power density (wind class) ............................................................................................................ 13
Shear ....................................................................................................................................................... 14
Turbulence .............................................................................................................................................. 14
Frequency distribution ............................................................................................................................ 14
Wind rose ................................................................................................................................................ 14
MAPPING OF RELEVANT TOPOGRAHPY BY DESIRABILITY OF EXISTING WIND RESOURCE ......................... 14
ONSHORE VERSUS OFFSHORE CONSTRUCTION ......................................................................................... 16
ECONOMIC EFFICIENCY OF INSTALLED CAPACITY ...................................................................................... 19
Construction Issues: ................................................................................................................................ 19
Operation Issues ...................................................................................................................................... 20
Capital cost and cost of power production ......................................................................................... 21
Operation and Maintenance (O&M) Cost ........................................................................................... 21
Weather Limitations ........................................................................................................................... 25
Decommissioning Issues ......................................................................................................................... 27
ECONOMICS OF INSTALLATION .................................................................................................................. 27
Cost of power from wind energy facilities .............................................................................................. 27
Cost of wind power compared to other technologies ............................................................................ 29
REPORTED HEALTH ISSUES ......................................................................................................................... 30
APPENDIX .................................................................................................................................................... 36
3
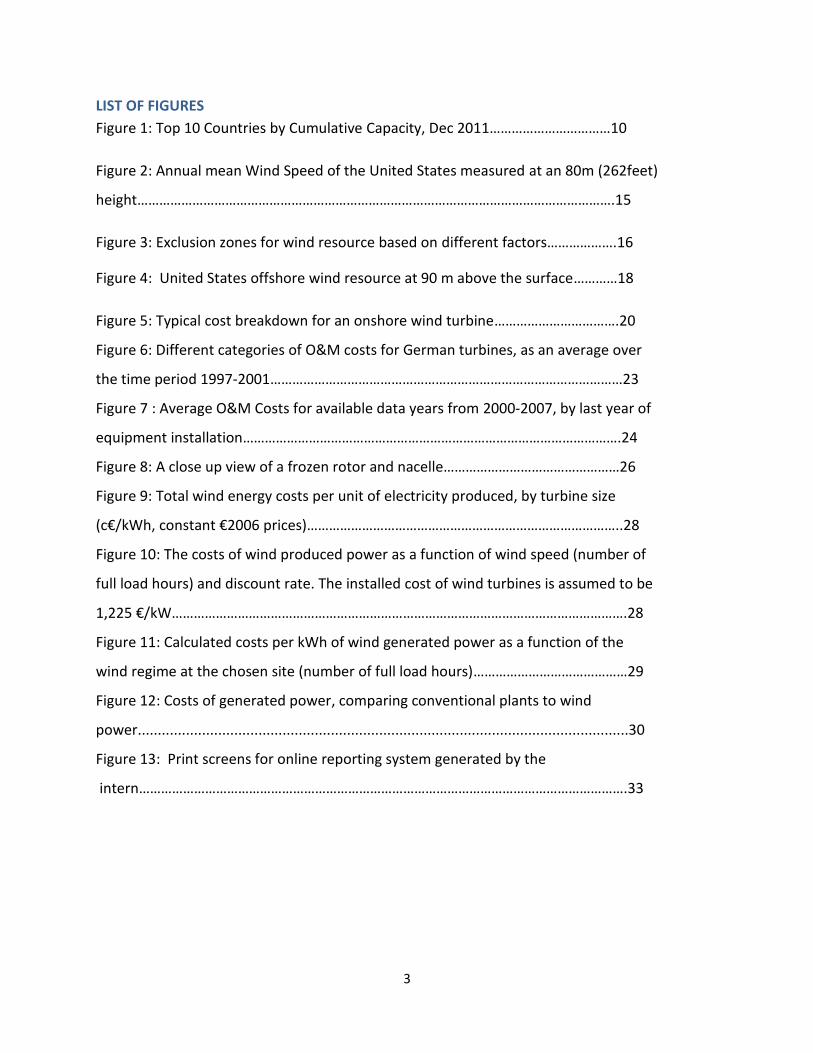
LIST OF FIGURES
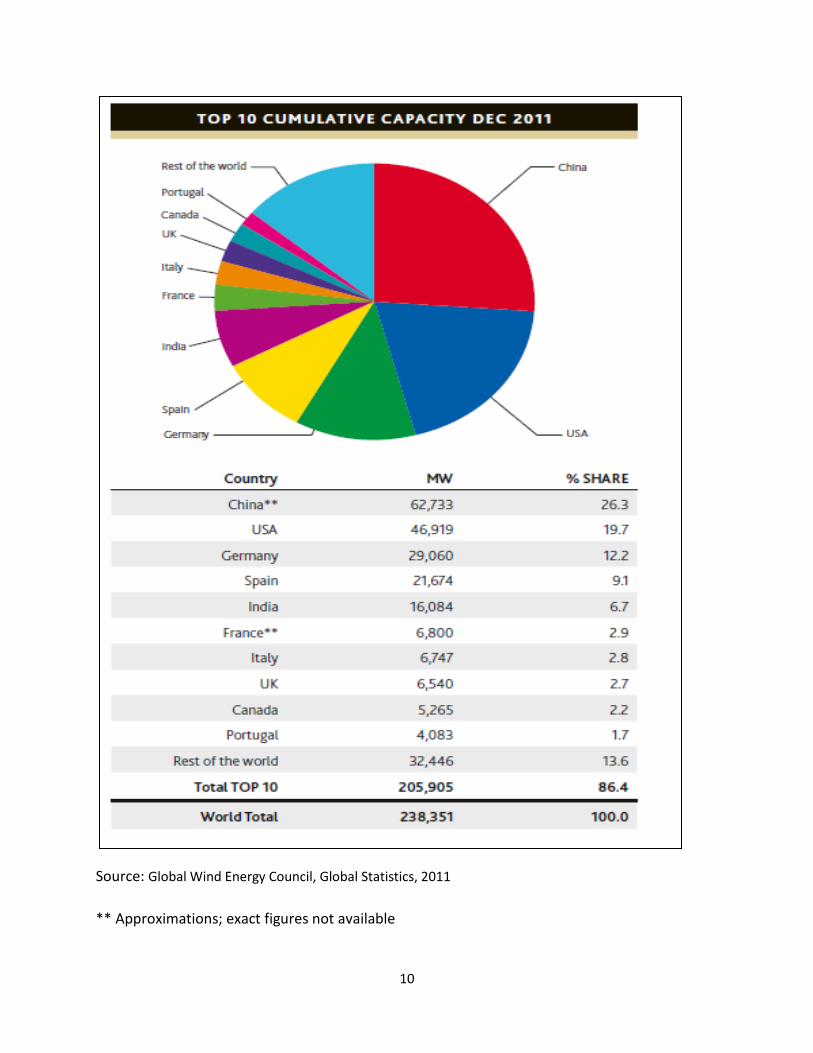
Figure 1: Top 10 Countries by Cumulative Capacity, Dec 2011……………………………10
Figure 2: Annual mean Wind Speed of the United States measured at an 80m (262feet)
height………………………………………………………………………………………………………………….15
Figure 3: Exclusion zones for wind resource based on different factors……………….16
Figure 4: United States offshore wind resource at 90 m above the surface…………18
Figure 5: Typical cost breakdown for an onshore wind turbine…………………………….20
Figure 6: Different categories of O&M costs for German turbines, as an average over
the time period 1997-2001……………………………………………………………………………………23
Figure 7 : Average O&M Costs for available data years from 2000-2007, by last year of
equipment installation………………………………………………………………………………………….24
Figure 8: A close up view of a frozen rotor and nacelle…………………………………………26
Figure 9: Total wind energy costs per unit of electricity produced, by turbine size
(c€/kWh, constant €2006 prices)…………………………………………………………………………..28
Figure 10: The costs of wind produced power as a function of wind speed (number of
full load hours) and discount rate. The installed cost of wind turbines is assumed to be
1,225 €/kW…………………………………………………………………………………………………………….28
Figure 11: Calculated costs per kWh of wind generated power as a function of the
wind regime at the chosen site (number of full load hours)……………………………………29
Figure 12: Costs of generated power, comparing conventional plants to wind
power..........................................................................................................................30
Figure 13: Print screens for online reporting system generated by the
intern…………………………………………………………………………………………………………………….33
4
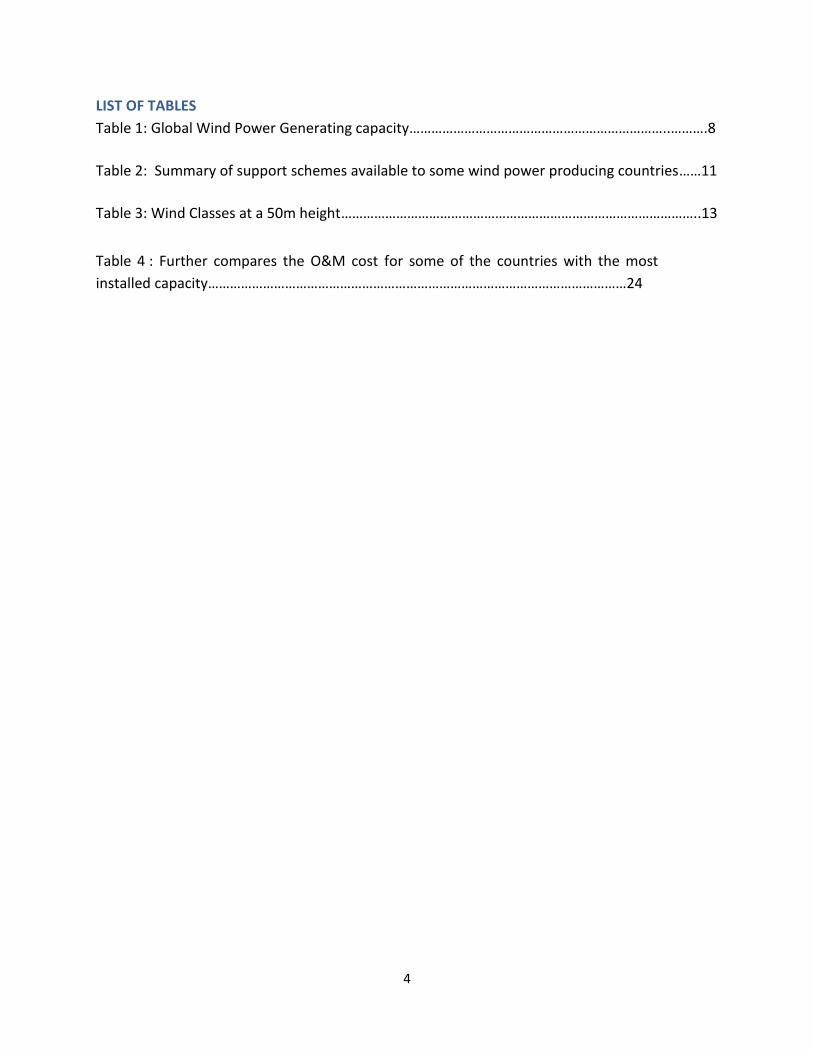
LIST OF TABLES
Table 1: Global Wind Power Generating capacity……………………………………………………………..……….8
Table 2: Summary of support schemes available to some wind power producing countries……11
Table 3: Wind Classes at a 50m height……………………………………………………………………………………..13
Table 4 : Further compares the O&M cost for some of the countries with the most
installed capacity……………………………………………………………………………………………………24
5
ABSTRACT
The report looks at the intern’s progress during the summer internship in establishing how wind
energy has evolved in both design and function from the earliest mechanical designs in the
500ADs to the complex aerodynamic designs in use today. The report examines the top
countries with the most Governmental commitment to wind power in terms of installed and
planned capacity and how that commitment developed and received political support. It further
lays out the intern’s effort at examining the studies undertaken to support siting specific wind
turbines particularly the mapping of relevant topography by desirability of existing wind
resource and the merits of onshore versus offshore construction.
The report then built on that to describe the information the intern found with regards to the
economic subsidies used in some of these countries, the structure and performance of the
industry building the IWTs and the general market demographics such as: market concentration
of the developers, the equipment manufacturers and the builders/installers, the nationality of
these industry entities, their competitiveness, and their general conduct and performance.
The report then chronicles the progress the intern made in identifying the unique issues that
face the IWT industry. It further examines the intern’s effort in determining the economics of
IWT installations ie. the cost of wind generated power compared to other forms of power
generation and whether these installations can survive as private sector investments without
governmental subsidies.
The report additionally lays out the progress made in investigating the health issues that have
arisen as a result of the operation of the installations and finally shows the intern’s efforts at
creating a criterion for the best places to site an IWT based on all the information obtained
during the internship.
6
EXECUTIVE SUMMARY
Grid-connected wind power capacity has increased tremendously in the past decade. With this
growth come economic, political and environmental concerns.
The purpose of the summer project from which this report is derived is to examine the
Industrial Wind Turbine (IWT) market in relation to the economic, political and environmental
concerns and establish a set of recommendations on the best places to site IWTs
The report looks at the progress the intern made in determining the current trend of IWT
installations and the governmental support if any, that drives these installations. The report
further assesses the critical metrics in the selection and siting of IWT installations and compares
onshore and offshore installations.
The report then shows the intern’s efforts at investigating the efficiencies, construction,
operation and decommissioning issues of IWTs already in existence, the economics of the
actual installations compared to other technologies of producing electricity and touches on the
alleged reported cases of health-related issues.
Finally the report lays out the online reporting criteria created by the intern to map complaints
against wind turbines and uses the resulting pictorial chart created together with all the
information obtained from the summer project to show the best places to site IWTs.
7
INTRODUCTION
A background search conducted by the intern on the wind energy applications showed that the
earliest recorded windmills were crafted to automate the task of grain-grinding and water-
pumping. The vertical axis system was the first known design. This system was developed in
Persia about 500-900AD.1 These early designs were essentially used to provide mechanical
power. Since then, wind-powered systems have evolved from uncomplicated devices, driven by
aerodynamic drag forces to the highly complex, material-efficient, aerodynamic outfits
employed to various ends in the modern era.
At the onset of modern industrialization, wind energy sources were substituted by fossil fuel
based engines and the electric grid. These were considered more consistent power sources
relative to the fluctuating and variable wind resource. With the oil price shocks in the early
1970s, wind energy re-emerged as a viable alternative, with the focus having migrated to
electrical energy conversion instead of mechanical energy.
The technology has improved; from the earliest designs, through the 1970s when interest in
wind energy piqued again, to the last decade of the 20th century when the worldwide wind
capacity doubled almost every 3 years.2 Wind turbine technology in particular has improved
very rapidly. In 1999, 1500kW wind turbines with rotor diameters of 70m were available from
manufacturers. 10 years prior, 300kW, 30m diameter rotor turbines were considered state-of-
the-art. Current utility scale turbines installed in the US have an upper range of 114-meter rotor
diameter on a 120-meter tower. With present capacities (The average capacity of all wind
turbines installed in the U.S. in 2009 was 1.75 MW with some 5,700 turbines installed)
forecasted to increase, many manufacturers are developing larger turbines3.
1 http://telosnet.com/wind/early.html
2 Ackerman, Thomas, and Söder Lennart. Wind energy technology and current status: a. Stockholm: Department of
Electric Power Engineering, Electric Power Systems, Royal Institute of Technology, 2000 3 http://www.awea.org/issues/supply_chain/Anatomy-of-a-Wind-Turbine.cfm
8
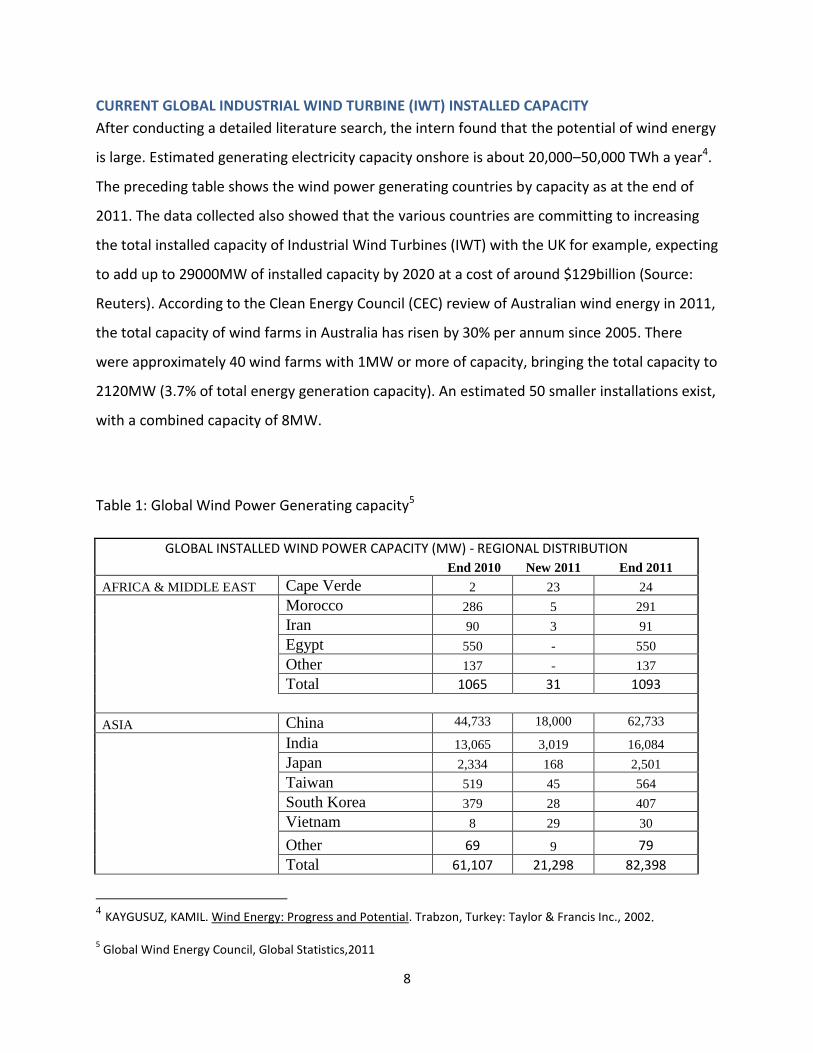
CURRENT GLOBAL INDUSTRIAL WIND TURBINE (IWT) INSTALLED CAPACITY
After conducting a detailed literature search, the intern found that the potential of wind energy
is large. Estimated generating electricity capacity onshore is about 20,000–50,000 TWh a year4.
The preceding table shows the wind power generating countries by capacity as at the end of
2011. The data collected also showed that the various countries are committing to increasing
the total installed capacity of Industrial Wind Turbines (IWT) with the UK for example, expecting
to add up to 29000MW of installed capacity by 2020 at a cost of around $129billion (Source:
Reuters). According to the Clean Energy Council (CEC) review of Australian wind energy in 2011,
the total capacity of wind farms in Australia has risen by 30% per annum since 2005. There
were approximately 40 wind farms with 1MW or more of capacity, bringing the total capacity to
2120MW (3.7% of total energy generation capacity). An estimated 50 smaller installations exist,
with a combined capacity of 8MW.
Table 1: Global Wind Power Generating capacity5
GLOBAL INSTALLED WIND POWER CAPACITY (MW) - REGIONAL DISTRIBUTION
End 2010 New 2011 End 2011
AFRICA & MIDDLE EAST Cape Verde 2 23 24
Morocco 286 5 291
Iran 90 3 91
Egypt 550 - 550
Other 137 - 137
Total 1065 31 1093
ASIA China 44,733 18,000 62,733
India 13,065 3,019 16,084
Japan 2,334 168 2,501
Taiwan 519 45 564
South Korea 379 28 407
Vietnam 8 29 30
Other 69 9 79
Total 61,107 21,298 82,398
4 KAYGUSUZ, KAMIL. Wind Energy: Progress and Potential. Trabzon, Turkey: Taylor & Francis Inc., 2002.
5 Global Wind Energy Council, Global Statistics,2011
9
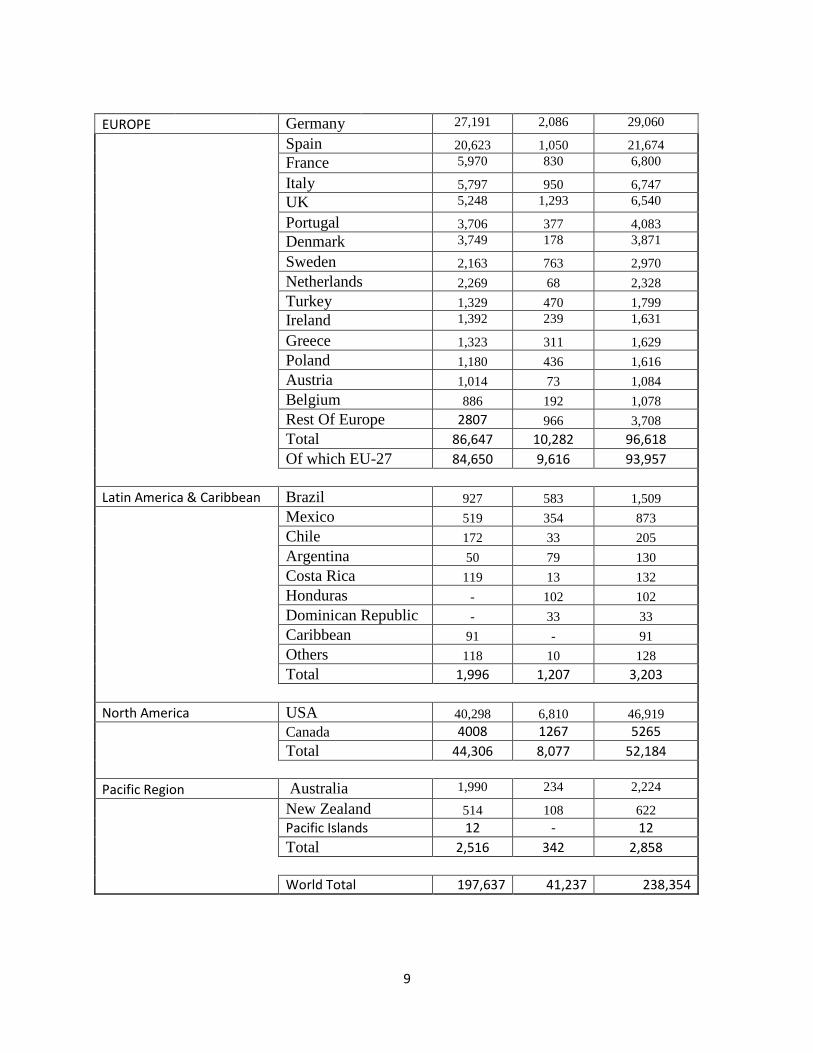
EUROPE Germany 27,191 2,086 29,060
Spain 20,623 1,050 21,674
France 5,970 830 6,800
Italy 5,797 950 6,747
UK 5,248 1,293 6,540
Portugal 3,706 377 4,083
Denmark 3,749 178 3,871
Sweden 2,163 763 2,970
Netherlands 2,269 68 2,328
Turkey 1,329 470 1,799
Ireland 1,392 239 1,631
Greece 1,323 311 1,629
Poland 1,180 436 1,616
Austria 1,014 73 1,084
Belgium 886 192 1,078
Rest Of Europe 2807 966 3,708
Total 86,647 10,282 96,618
Of which EU-27 84,650 9,616 93,957
Latin America & Caribbean Brazil 927 583 1,509
Mexico 519 354 873
Chile 172 33 205
Argentina 50 79 130
Costa Rica 119 13 132
Honduras - 102 102
Dominican Republic - 33 33
Caribbean 91 - 91
Others 118 10 128
Total 1,996 1,207 3,203
North America USA 40,298 6,810 46,919
Canada 4008 1267 5265
Total 44,306 8,077 52,184
Pacific Region Australia 1,990 234 2,224
New Zealand 514 108 622
Pacific Islands 12 - 12
Total 2,516 342 2,858
World Total 197,637 41,237 238,354
10
Source: Global Wind Energy Council, Global Statistics, 2011
** Approximations; exact figures not available
11
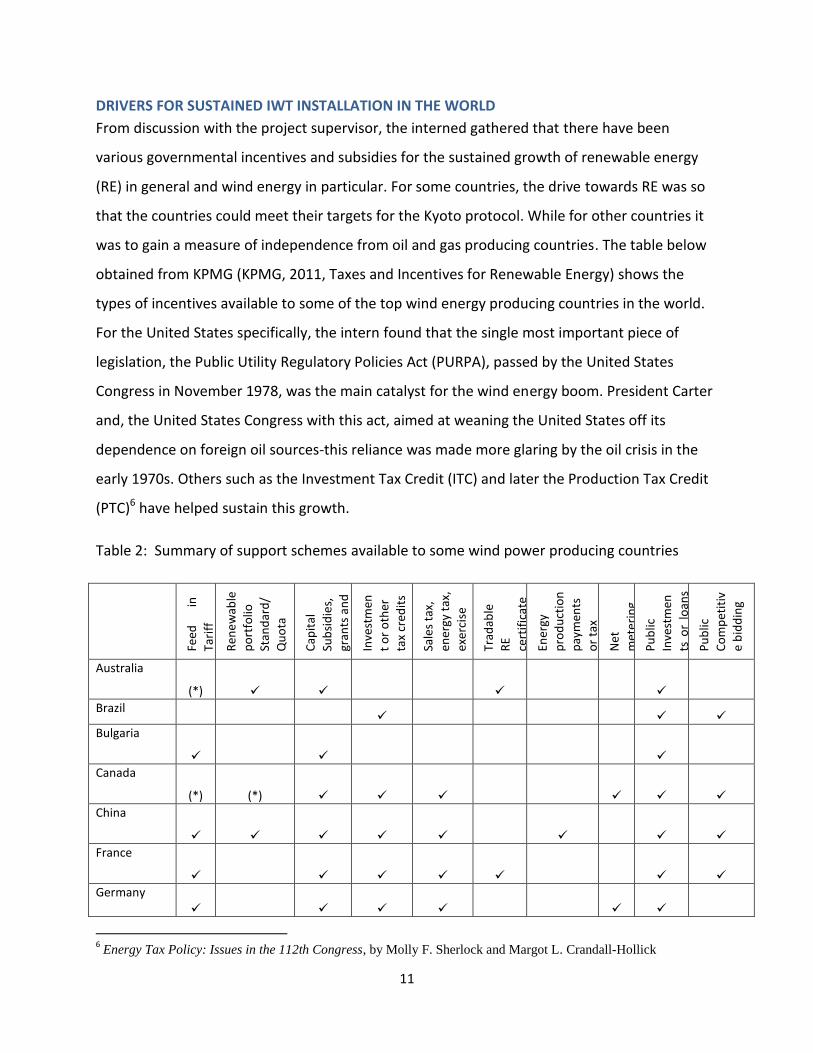
DRIVERS FOR SUSTAINED IWT INSTALLATION IN THE WORLD
From discussion with the project supervisor, the interned gathered that there have been
various governmental incentives and subsidies for the sustained growth of renewable energy
(RE) in general and wind energy in particular. For some countries, the drive towards RE was so
that the countries could meet their targets for the Kyoto protocol. While for other countries it
was to gain a measure of independence from oil and gas producing countries. The table below
obtained from KPMG (KPMG, 2011, Taxes and Incentives for Renewable Energy) shows the
types of incentives available to some of the top wind energy producing countries in the world.
For the United States specifically, the intern found that the single most important piece of
legislation, the Public Utility Regulatory Policies Act (PURPA), passed by the United States
Congress in November 1978, was the main catalyst for the wind energy boom. President Carter
and, the United States Congress with this act, aimed at weaning the United States off its
dependence on foreign oil sources-this reliance was made more glaring by the oil crisis in the
early 1970s. Others such as the Investment Tax Credit (ITC) and later the Production Tax Credit
(PTC)6 have helped sustain this growth.
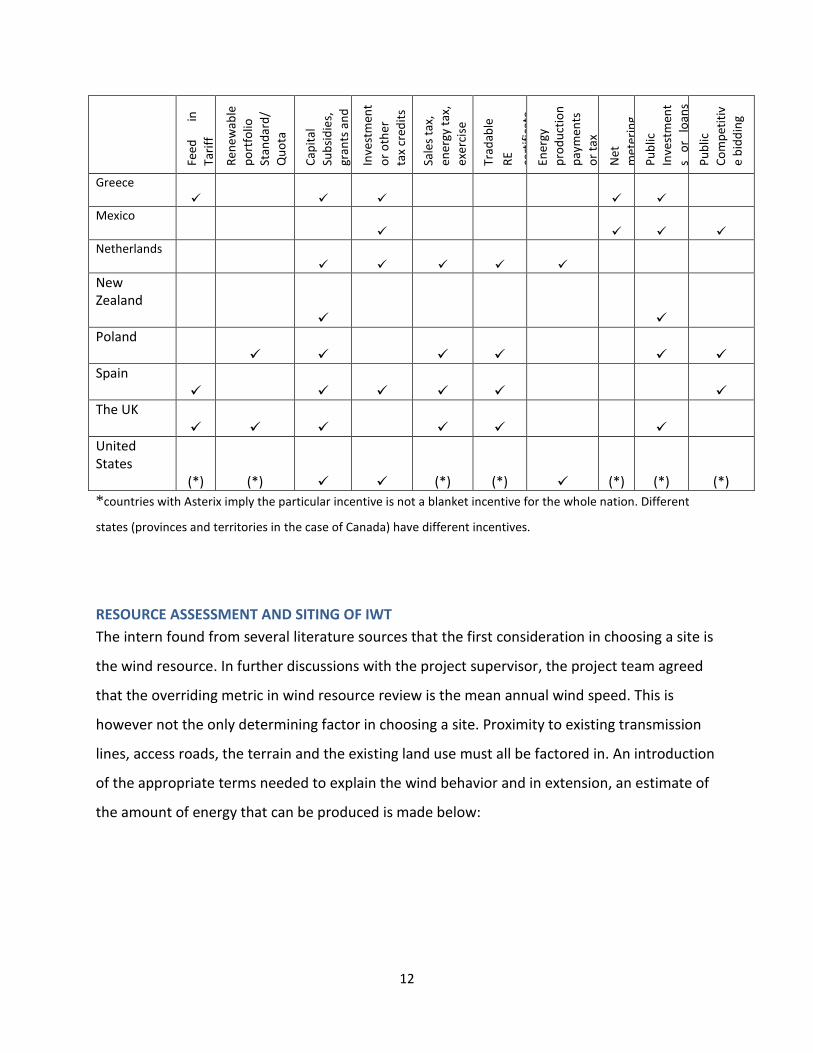
Table 2: Summary of support schemes available to some wind power producing countries
Feed
in
Tari
ff
Ren
ew
able
po
rtfo
lio
Stan
dar
d/
Qu
ota
Cap
ital
Sub
sid
ies,
gran
ts a
nd
reb
ates
In
vest
men
t o
r o
ther
tax
cred
its
Sale
s ta
x,
ener
gy t
ax,
exer
cise
tax
or
VA
T
red
uct
ion
Tr
adab
le
RE
cert
ific
ate
Ener
gy
pro
du
ctio
n
pay
men
ts
or
tax
cred
its
Net
met
erin
g
Pu
blic
Inve
stm
en
ts o
r lo
ans
or
fin
anci
ng
Pu
blic
Co
mp
etit
iv
e b
idd
ing
Australia
(*)
Brazil
Bulgaria
Canada
(*) (*)
China
France
Germany
6 Energy Tax Policy: Issues in the 112th Congress, by Molly F. Sherlock and Margot L. Crandall-Hollick
12
Feed
in
Tari
ff
Ren
ew
able
po
rtfo
lio
Stan
dar
d/
Qu
ota
Cap
ital
Sub
sid
ies,
gran
ts a
nd
reb
ates
In
vest
men
t
or
oth
er
tax
cred
its
Sale
s ta
x,
ener
gy t
ax,
exer
cise
tax
or
VA
T
red
uct
ion
Tr
adab
le
RE
cert
ific
ate
En
ergy
pro
du
ctio
n
pay
men
ts
or
tax
cred
its
Net
met
erin
g
Pu
blic
Inve
stm
ent
s o
r lo
ans
or
fin
anci
ng
Pu
blic
Co
mp
etit
iv
e b
idd
ing
Greece
Mexico
Netherlands
New Zealand
Poland
Spain
The UK
United States (*) (*) (*) (*) (*) (*) (*)
*countries with Asterix imply the particular incentive is not a blanket incentive for the whole nation. Different
states (provinces and territories in the case of Canada) have different incentives.
RESOURCE ASSESSMENT AND SITING OF IWT
The intern found from several literature sources that the first consideration in choosing a site is
the wind resource. In further discussions with the project supervisor, the project team agreed
that the overriding metric in wind resource review is the mean annual wind speed. This is
however not the only determining factor in choosing a site. Proximity to existing transmission
lines, access roads, the terrain and the existing land use must all be factored in. An introduction
of the appropriate terms needed to explain the wind behavior and in extension, an estimate of
the amount of energy that can be produced is made below:
13
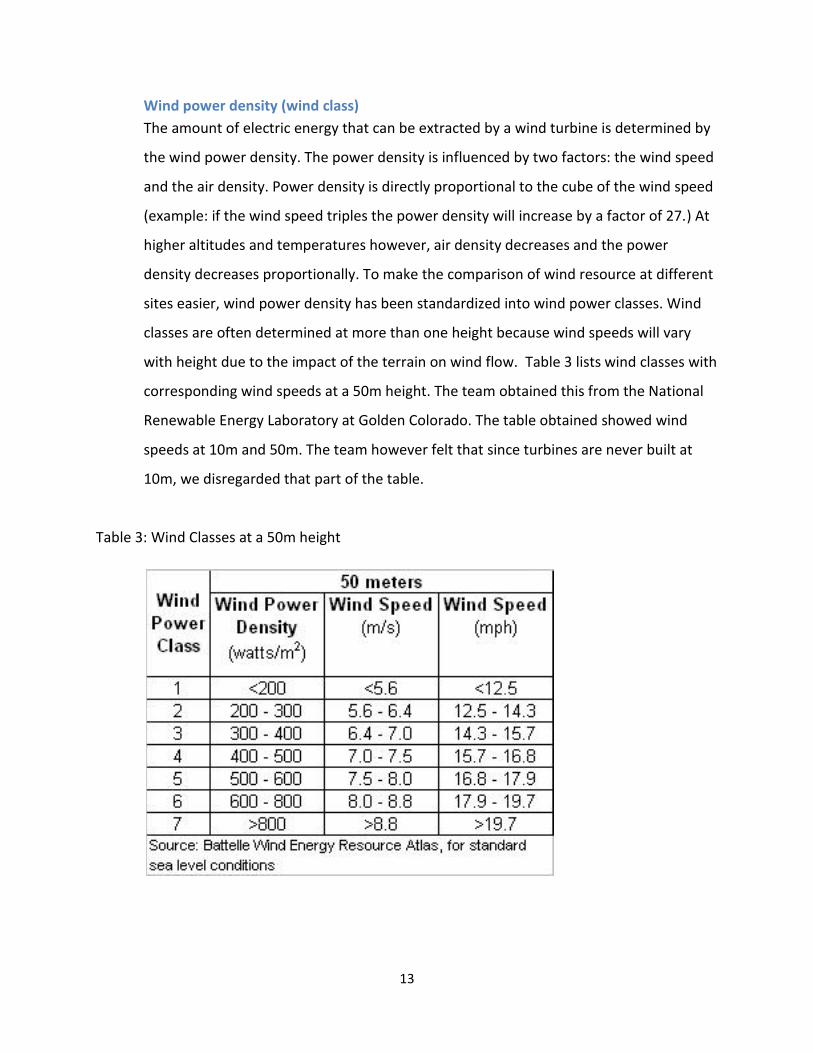
Wind power density (wind class)
The amount of electric energy that can be extracted by a wind turbine is determined by
the wind power density. The power density is influenced by two factors: the wind speed
and the air density. Power density is directly proportional to the cube of the wind speed
(example: if the wind speed triples the power density will increase by a factor of 27.) At
higher altitudes and temperatures however, air density decreases and the power
density decreases proportionally. To make the comparison of wind resource at different
sites easier, wind power density has been standardized into wind power classes. Wind
classes are often determined at more than one height because wind speeds will vary
with height due to the impact of the terrain on wind flow. Table 3 lists wind classes with
corresponding wind speeds at a 50m height. The team obtained this from the National
Renewable Energy Laboratory at Golden Colorado. The table obtained showed wind
speeds at 10m and 50m. The team however felt that since turbines are never built at
10m, we disregarded that part of the table.
Table 3: Wind Classes at a 50m height
14
Shear
The flow of wind close to the ground is always hampered by the friction created by the
site’s vegetation and terrain. The shear of a site is an indication of how rapidly the wind
speed increases with increasing distance from the ground. This number is a good
indication of the wind speed at the height of a proposed turbine even if the wind speed
data were taken at a lower height.
Turbulence
The smooth flow of the wind is affected by obstacles such as trees, buildings, and large
land features. The forces on the turbine blades vary, depending on the wind turbulence.
This affects the electricity production of the turbine.
Frequency distribution
The fraction of time that the wind is blowing at certain speeds over the entire period
when the site is being studied for suitability can best be shown by a frequency
distribution. The wind speeds in a range are binned and a histogram plotted from the
frequency of all speeds within their designated range. The shape of the curve created by
these bins is called a Weibull distribution. While it is assumed that wind speeds can be
affected either by prevailing winds or by storm-driven winds, the ideal forecast is the
one made in an environment with smooth prevailing winds.
Wind rose
A wind rose displays the direction and the percentage of power in the wind that comes
from that direction.
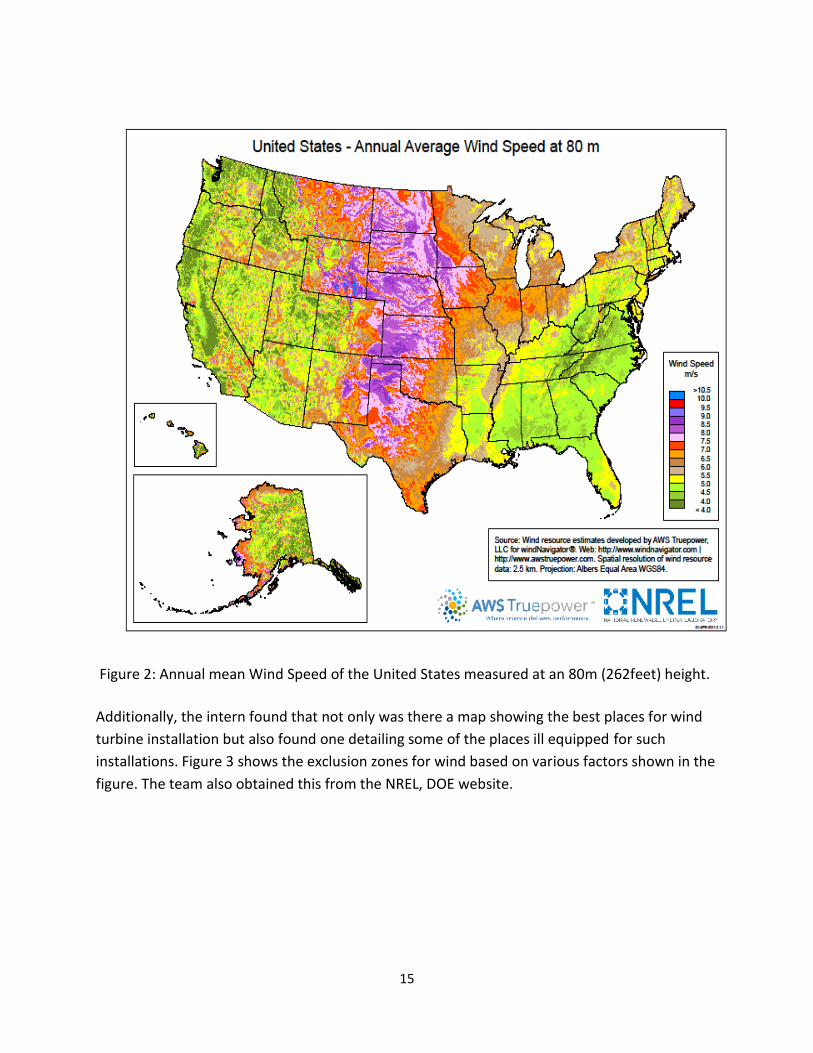
MAPPING OF RELEVANT TOPOGRAHPY BY DESIRABILITY OF EXISTING WIND RESOURCE
With the background the intern obtained on what the determining factors for siting were, the
team obtained a map (See figure 2) of the US from the NREL, Department of Energy (DOE) with
the wind speeds mapped out. On a vertical plane, the middle belt of the country had some of
the most conducive conditions for wind power generation.
15
Figure 2: Annual mean Wind Speed of the United States measured at an 80m (262feet) height.
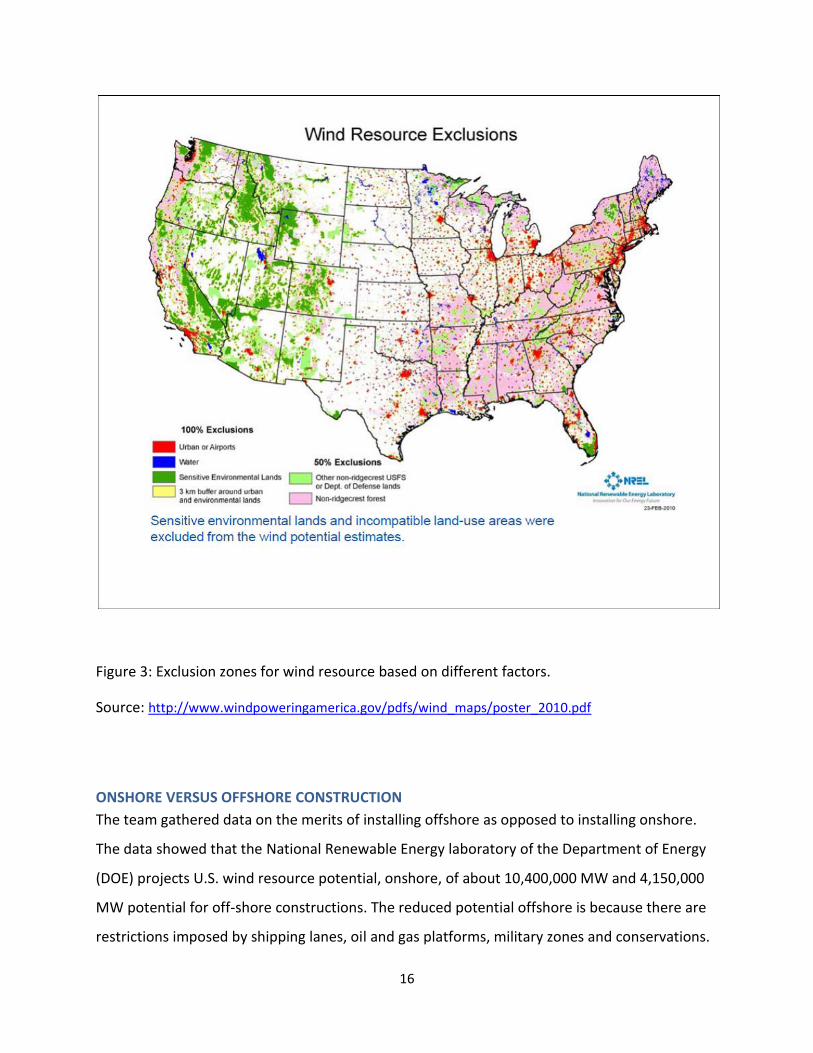
Additionally, the intern found that not only was there a map showing the best places for wind
turbine installation but also found one detailing some of the places ill equipped for such
installations. Figure 3 shows the exclusion zones for wind based on various factors shown in the
figure. The team also obtained this from the NREL, DOE website.
16
Figure 3: Exclusion zones for wind resource based on different factors.
Source: http://www.windpoweringamerica.gov/pdfs/wind_maps/poster_2010.pdf
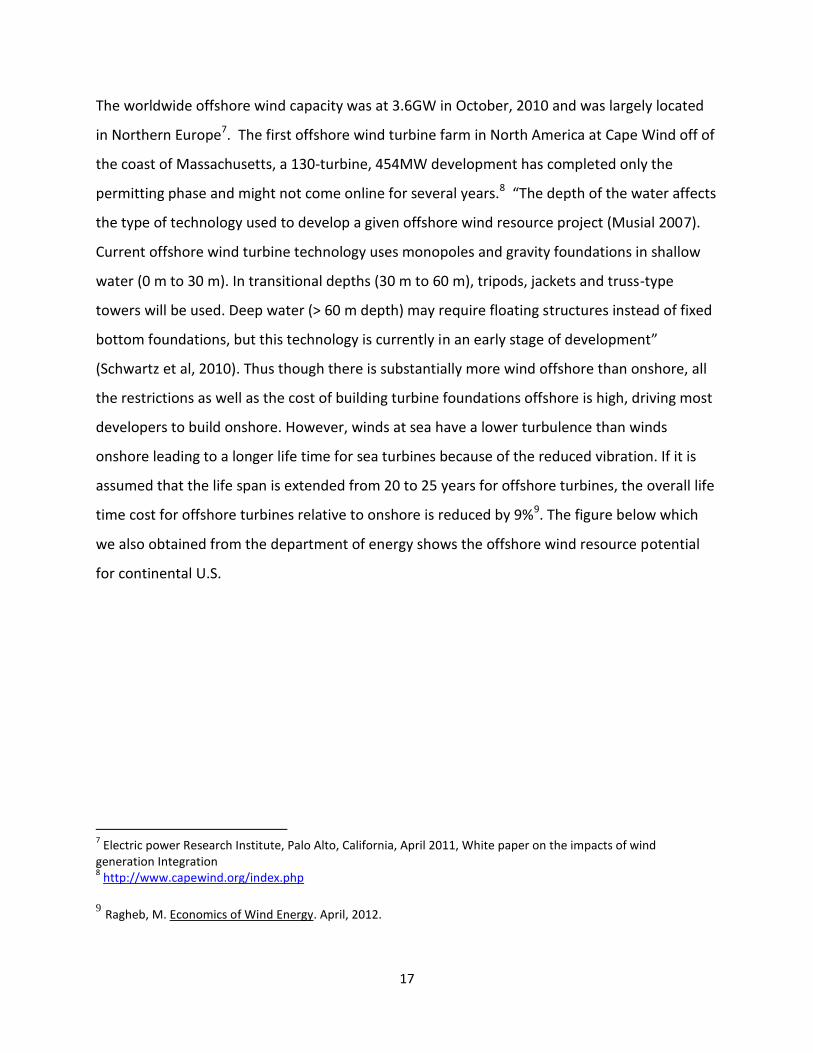
ONSHORE VERSUS OFFSHORE CONSTRUCTION
The team gathered data on the merits of installing offshore as opposed to installing onshore.
The data showed that the National Renewable Energy laboratory of the Department of Energy
(DOE) projects U.S. wind resource potential, onshore, of about 10,400,000 MW and 4,150,000
MW potential for off-shore constructions. The reduced potential offshore is because there are
restrictions imposed by shipping lanes, oil and gas platforms, military zones and conservations.
17
The worldwide offshore wind capacity was at 3.6GW in October, 2010 and was largely located
in Northern Europe7. The first offshore wind turbine farm in North America at Cape Wind off of
the coast of Massachusetts, a 130-turbine, 454MW development has completed only the
permitting phase and might not come online for several years.8 “The depth of the water affects
the type of technology used to develop a given offshore wind resource project (Musial 2007).
Current offshore wind turbine technology uses monopoles and gravity foundations in shallow
water (0 m to 30 m). In transitional depths (30 m to 60 m), tripods, jackets and truss-type
towers will be used. Deep water (> 60 m depth) may require floating structures instead of fixed
bottom foundations, but this technology is currently in an early stage of development”
(Schwartz et al, 2010). Thus though there is substantially more wind offshore than onshore, all
the restrictions as well as the cost of building turbine foundations offshore is high, driving most
developers to build onshore. However, winds at sea have a lower turbulence than winds
onshore leading to a longer life time for sea turbines because of the reduced vibration. If it is
assumed that the life span is extended from 20 to 25 years for offshore turbines, the overall life
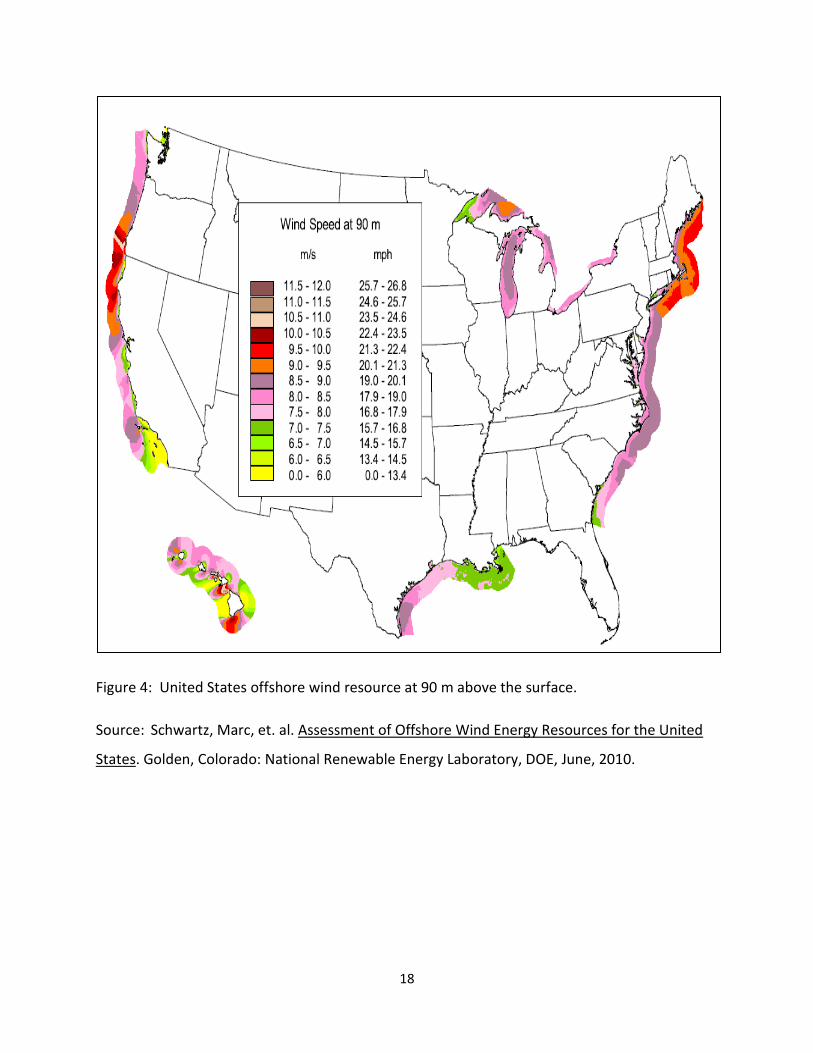
time cost for offshore turbines relative to onshore is reduced by 9%9. The figure below which
we also obtained from the department of energy shows the offshore wind resource potential
for continental U.S.
7 Electric power Research Institute, Palo Alto, California, April 2011, White paper on the impacts of wind
generation Integration 8 http://www.capewind.org/index.php
9 Ragheb, M. Economics of Wind Energy. April, 2012.
18
Figure 4: United States offshore wind resource at 90 m above the surface.
Source: Schwartz, Marc, et. al. Assessment of Offshore Wind Energy Resources for the United
States. Golden, Colorado: National Renewable Energy Laboratory, DOE, June, 2010.
19
ECONOMIC EFFICIENCY OF INSTALLED CAPACITY
Construction Issues:
The intern discovered that selecting a site for erecting an IWT is complex. Land use restrictions or
zoning issues, such as hunting rights, grazing rights, and cultural considerations limit viable site
options. Wildlife issues may also restrict construction due to avian and wildlife migration,
spawning grounds, wetlands and surface water concerns. Last, noise or visual impact
restrictions may affect placement of turbines. Civil, electrical and Supervisory Control and Data
Acquisition (SCADA) system issues must be reviewed once permits are obtained in relation to
the above restrictions.
The intern also noted that in selecting the appropriate site for constructing a wind farm,
scheduling consideration should be given to accessing the site and to constructing the site.
Integral to both of these site selection concerns is the preoperational project schedule.
Development of a wind farm generally takes from 2 to 5 years with construction taking more or
less than a year depending upon decisions made in the development phase10. One of the
primary decisions that can affect the construction schedule is the lead time in ordering the wind
turbine generators. Turbine design, dimensions, weights, and manufacturing locations all affect
the construction of a wind farm and these attributes differ from one manufacturer to the next.
Another distinct factor influencing the schedule and costs is the transportation and road system
between the manufacturing or warehousing point and the wind farm site. Roads selected,
should be able to adequately bear the load of wind turbine parts without buckling. The
transportation routes should have acceptable turning radii to accommodate the wind turbine
part dimensions and with enough vertical clearances to allow wind turbine parts to pass under
bridges, signs, power lines, and other overhead obstacles.
10 COMODECA, PETER J., ESQ. HOW SITE SELECTION AFFECTS WIND FARM CONSTRUCTION. Cleveland, OH: Calfee,
Halter & Griswold LLP,
20
Site soil composition and the presence of rock are issues that will affect construction methods
and costs.
Furthermore, an electrical substation is required to receive power and step it up to match the
voltage in the power grid. Substation placement should ideally be central to the majority of
towers on the site and the underground connection of wires should be able to dissipate heat
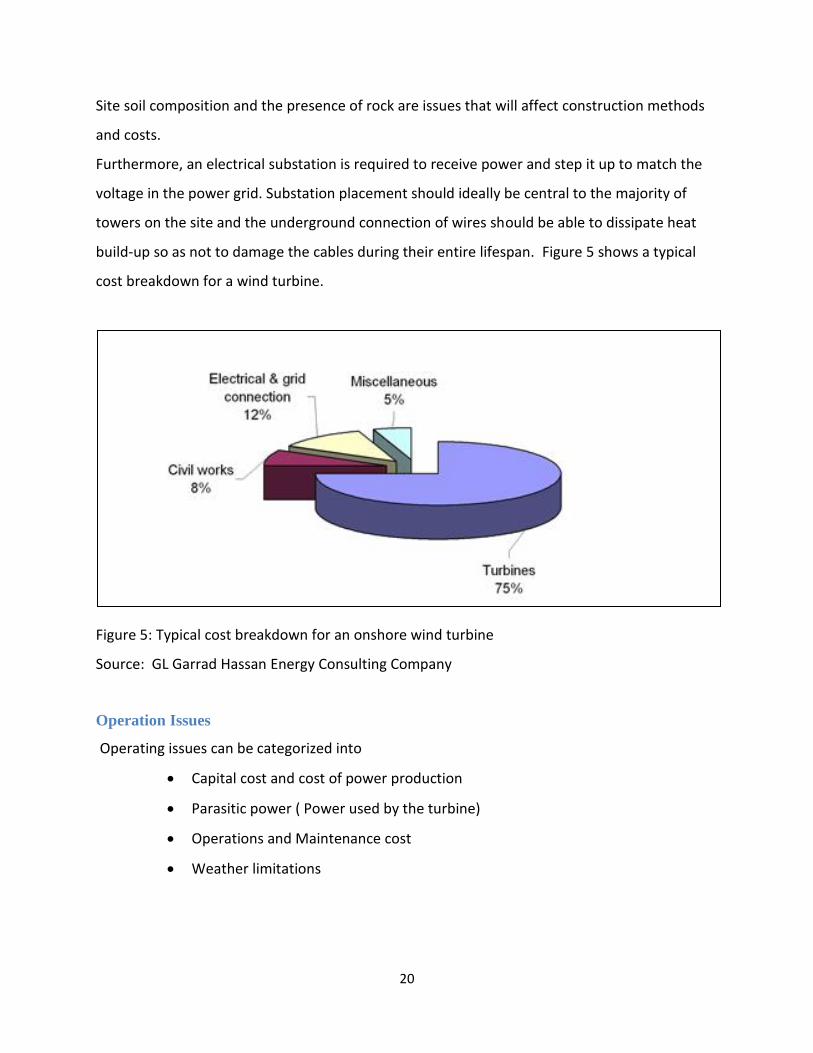
build-up so as not to damage the cables during their entire lifespan. Figure 5 shows a typical
cost breakdown for a wind turbine.
Figure 5: Typical cost breakdown for an onshore wind turbine
Source: GL Garrad Hassan Energy Consulting Company
Operation Issues
Operating issues can be categorized into
Capital cost and cost of power production
Parasitic power ( Power used by the turbine)
Operations and Maintenance cost
Weather limitations
21
Capital cost and cost of power production
I found it really hard coming by capital cost and power production costs.
Data for the capital cost and actual cost of power production is hard to find and verify since
most companies claim ‘trade secrets’. The following data11 was obtained from a 20 month
resource assessment of a 600kW wind turbine installed by the University of Maine for academic
purposes.
Estimated capital cost $1.5 million
Actual capital cost $2 million; an overrun of 33%
The project was financed by UM cash reserves and a $50,000 cash subsidy from the Maine
Public Utilities Commission.
The estimated useful service life was about 20 years.
Predicted power production: 1,000,000 kWh/yr
Predicted capacity factor = 1,000,000 kWh/yr)/ (600 kW x 8,760 hr/yr) = 0.190
Actual power production after 1 year: 609,250 kWh
Actual capacity factor for 1 year = 609,250 kWh/yr/ (600 kW x 8,760 hr/yr) = 0.116; a shortfall
of 39%
Value of power produced = 609,250 kWh/yr x $0.125/ kWh = $76,156/yr; if O&M and financing
costs amortized over 20 years are subtracted, this value will likely be negative.
Actual power production after 1.5 years 920,105 kWh
Actual capacity factor for 1.5 years = (920,105 kWh/1.5 yrs)/ (600 kW x 8,760 hr/yr) = 0.117
Operation and Maintenance (O&M) Cost
Building on the information obtained, the intern determined that O&M costs constituted a
sizeable portion of the total annual cost of a wind turbine. For a new turbine, the cost of O&M
11
http://theenergycollective.com/willem-post/53258/examples-wind-power-learn (examples of other operational wind turbines, their actual cost and operating issues can be found at the same site)
22
could make up about 20-25%12 of the total levelized cost per kWh produced over the lifetime of
the turbine. As a result, O&M costs are attracting greater attention, as manufacturers attempt
to lower these costs significantly by developing new turbine designs that require fewer regular
service visits and less turbine downtime.
The cost components that make up O&M costs are listed below :
Insurance
Regular maintenance
Repair
Spare parts and
Administration
Insurance and regular maintenance are easy to calculate. Repair and related spare
parts are however a bit complex to predict. And although all cost components tend to
increase as the turbine gets older, costs for repair and spare parts are particularly
influenced by turbine age; starting low and increasing over time13. The figure (figure 6)
below obtained from Danish turbine resource assessment shows the distribution of
the different components of O&M.
12
http://www.wind-energy-the-facts.org/en/part-3-economics-of-wind-power/chapter-1-cost-of-on-land-wind-power/operation-and-maintenance-costs-of-wind-generated-power.html 13
Ibid
23
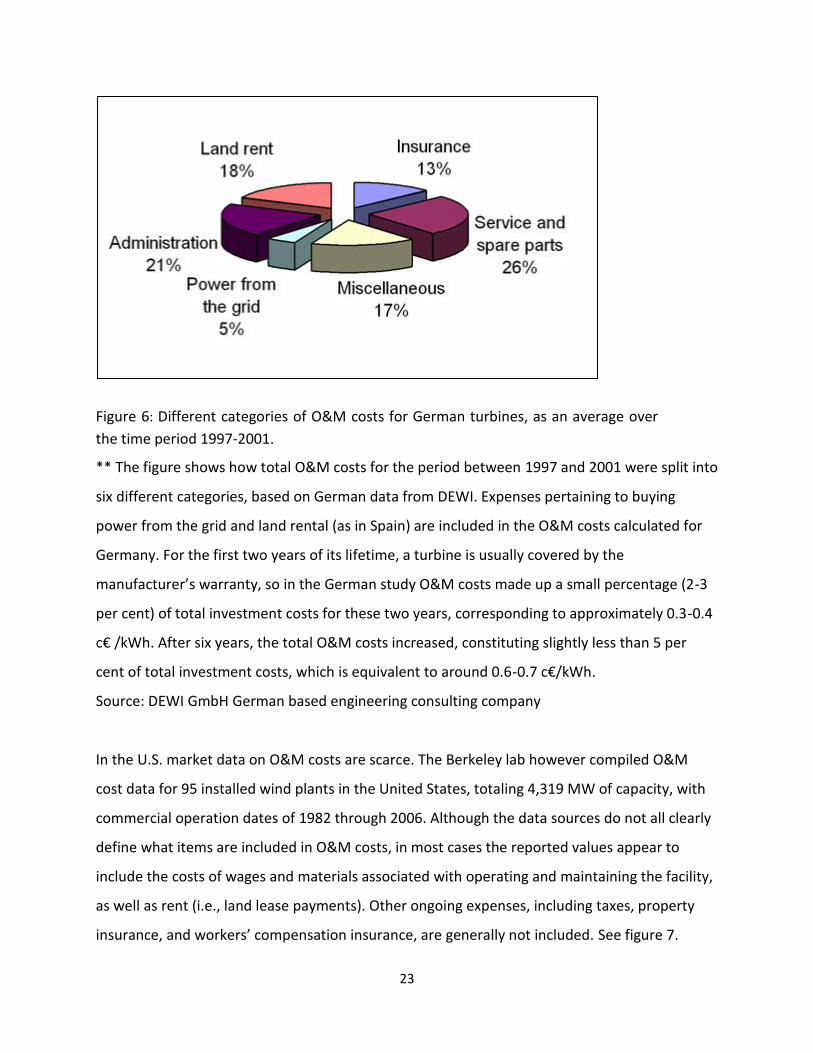
Figure 6: Different categories of O&M costs for German turbines, as an average over
the time period 1997-2001.
** The figure shows how total O&M costs for the period between 1997 and 2001 were split into
six different categories, based on German data from DEWI. Expenses pertaining to buying
power from the grid and land rental (as in Spain) are included in the O&M costs calculated for
Germany. For the first two years of its lifetime, a turbine is usually covered by the
manufacturer’s warranty, so in the German study O&M costs made up a small percentage (2-3
per cent) of total investment costs for these two years, corresponding to approximately 0.3-0.4
c€ /kWh. After six years, the total O&M costs increased, constituting slightly less than 5 per
cent of total investment costs, which is equivalent to around 0.6-0.7 c€/kWh.
Source: DEWI GmbH German based engineering consulting company
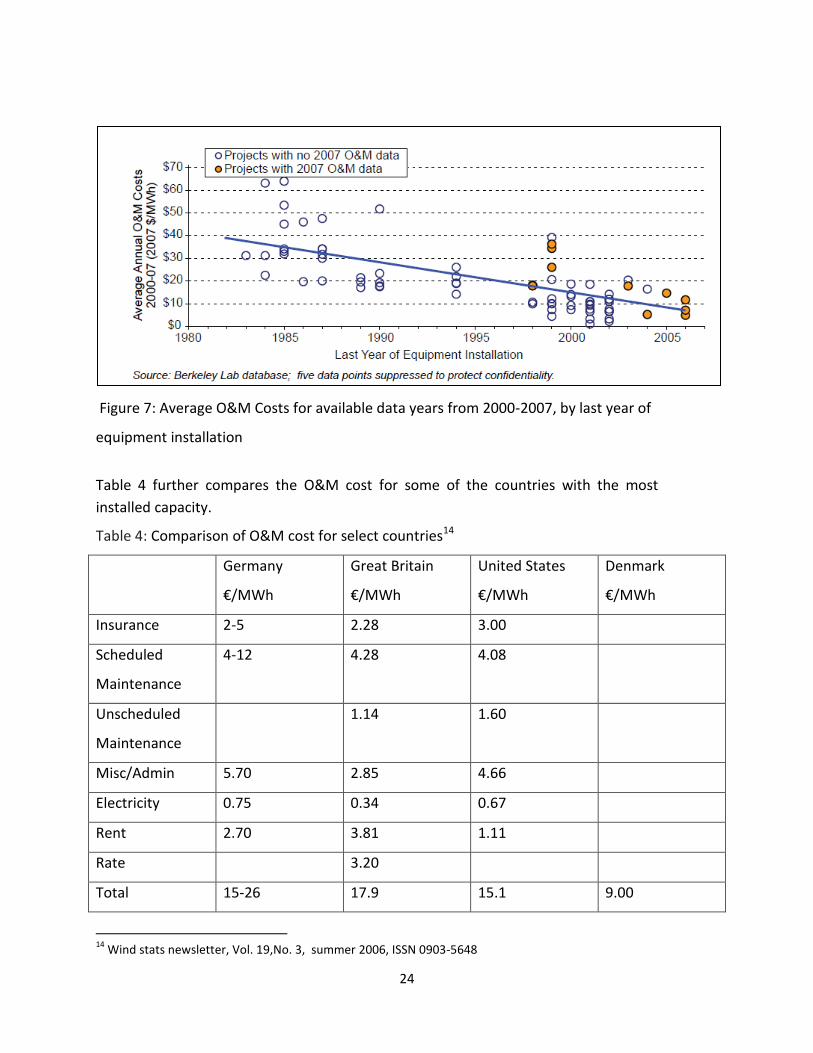
In the U.S. market data on O&M costs are scarce. The Berkeley lab however compiled O&M
cost data for 95 installed wind plants in the United States, totaling 4,319 MW of capacity, with
commercial operation dates of 1982 through 2006. Although the data sources do not all clearly
define what items are included in O&M costs, in most cases the reported values appear to
include the costs of wages and materials associated with operating and maintaining the facility,
as well as rent (i.e., land lease payments). Other ongoing expenses, including taxes, property
insurance, and workers’ compensation insurance, are generally not included. See figure 7.
24
Figure 7: Average O&M Costs for available data years from 2000-2007, by last year of
equipment installation
Table 4 further compares the O&M cost for some of the countries with the most
installed capacity.
Table 4: Comparison of O&M cost for select countries14
Germany
€/MWh
Great Britain
€/MWh
United States
€/MWh
Denmark
€/MWh
Insurance 2-5 2.28 3.00
Scheduled
Maintenance
4-12 4.28 4.08
Unscheduled
Maintenance
1.14 1.60
Misc/Admin 5.70 2.85 4.66
Electricity 0.75 0.34 0.67
Rent 2.70 3.81 1.11
Rate 3.20
Total 15-26 17.9 15.1 9.00
14
Wind stats newsletter, Vol. 19,No. 3, summer 2006, ISSN 0903-5648
25
Weather Limitations
With some help from the project team in finding previous reports about weather effects, the
intern found that turbines do not work from weather related reasons such as too much wind,
where the turbines have to be shut off for safety reason; too little wind and most common of
all, frozen blades due to cold weather.
There are 315 general concerns important to the operation of wind turbines in the cold:
Impact of low temperature on the physical properties of the material
Ice accretion on structures and surfaces
The presence of snow in the vicinity of the turbine
Low Temperature
Low temperatures affect the different materials used in the fabrication of wind turbines, usually
adversely. The mechanical properties of structural elements such as steel and composite
material change at low temperatures. Steel becomes more brittle; its energy absorbing capacity
and deformation prior to failure are both reduced. Composite materials, due to unequal
shrinkage of their fiber/matrix components, will be subjected to a residual stress. If this stress is
sufficient, it can result in micro cracking in the material. These micro cracks reduce both the
stiffness and the impermeability of the material, which can contribute to the deterioration
process (Dutta and Hui, 1997).
Ice
Icing represents the most important threat to the integrity of wind turbines in cold weather.
Based on the duration of inoperative wind measuring equipment at one surveyed mountain in
western Massachusetts, it was determined that icing weather can occur as much as 15% of the
time between the months of December and March (Kirchhoff, 1999). Wind turbines must
therefore be able to sustain at least limited icing without incurring damage preventing normal
15 Lacroix, Antoine, and James F. Manwell, Dr. Wind Energy: Cold Weather Issues. University of Massachusetts at
Amherst, Renewable Energy Research Laboratory, June 2000.
26
operation. Furthermore, it is advisable that power production be maintained in moderate icing
for the following reasons:
To minimize downtime period and benefit from the more favorable winter winds
To keep the rotor turning and therefore limit the ice growth to leading edge part of the
blade that is likely fitted with some ice protection equipment
Figure 4 shows a turbine that is not in operation due to icing.
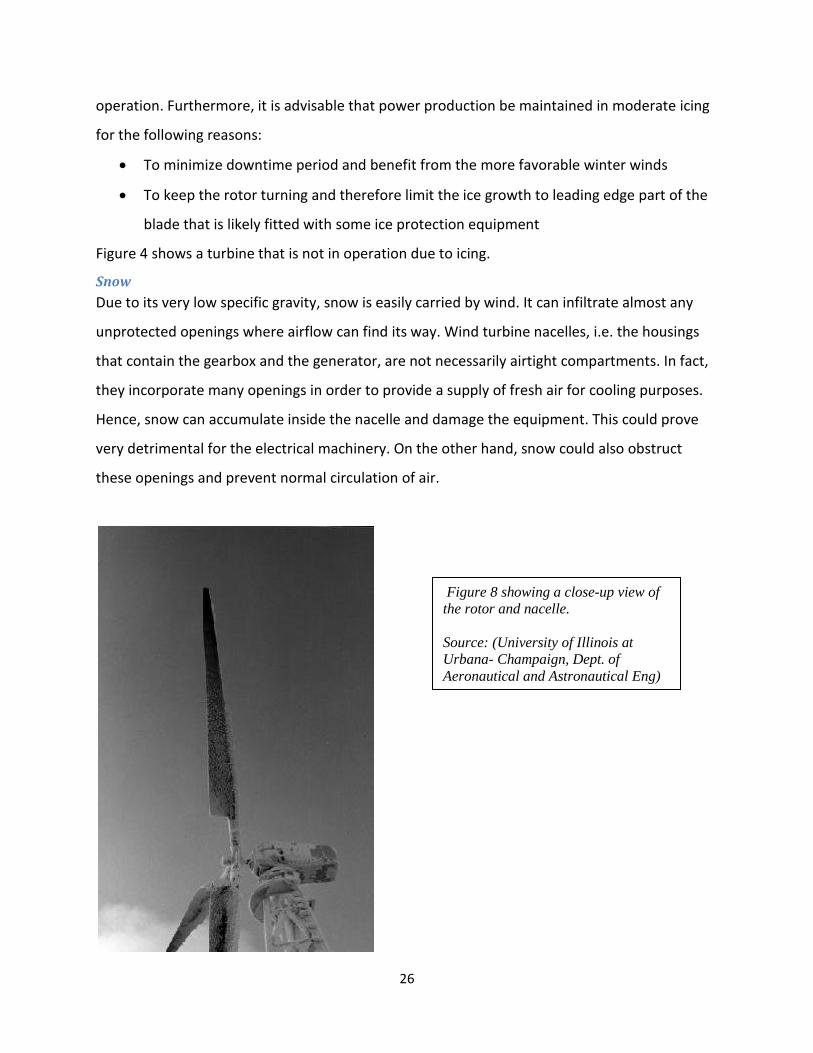
Snow
Due to its very low specific gravity, snow is easily carried by wind. It can infiltrate almost any
unprotected openings where airflow can find its way. Wind turbine nacelles, i.e. the housings
that contain the gearbox and the generator, are not necessarily airtight compartments. In fact,
they incorporate many openings in order to provide a supply of fresh air for cooling purposes.
Hence, snow can accumulate inside the nacelle and damage the equipment. This could prove
very detrimental for the electrical machinery. On the other hand, snow could also obstruct
these openings and prevent normal circulation of air.
Figure 8 showing a close-up view of
the rotor and nacelle.
Source: (University of Illinois at
Urbana- Champaign, Dept. of
Aeronautical and Astronautical Eng)
27
Decommissioning Issues
In the first “wind rush” of the late 1970’s and early 1980’s, thousands of turbines were erected
and over time, many were abandoned. The second “wind rush” of the past decade has not yet
resulted in any meaningful numbers of decommissioned turbines. The project team therefore
agreed that decommissioning of wind turbines at the end of their useful life might pose a
potentially significant expense that might be borne by the landowner or the community at
large. To mitigate this risk, communities typically require a decommissioning plan and security
facility to cover the cost of removal of the turbine and recovery of the site.
ECONOMICS OF INSTALLATION
Cost of power from wind energy facilities
The intern’s investigation revealed that there is no “point price” for wind energy. The annual
production of wind energy is very much reliant on the amount of wind available at a specific
location. Effectively, instead of a single price for electricity generated by wind, there is a price
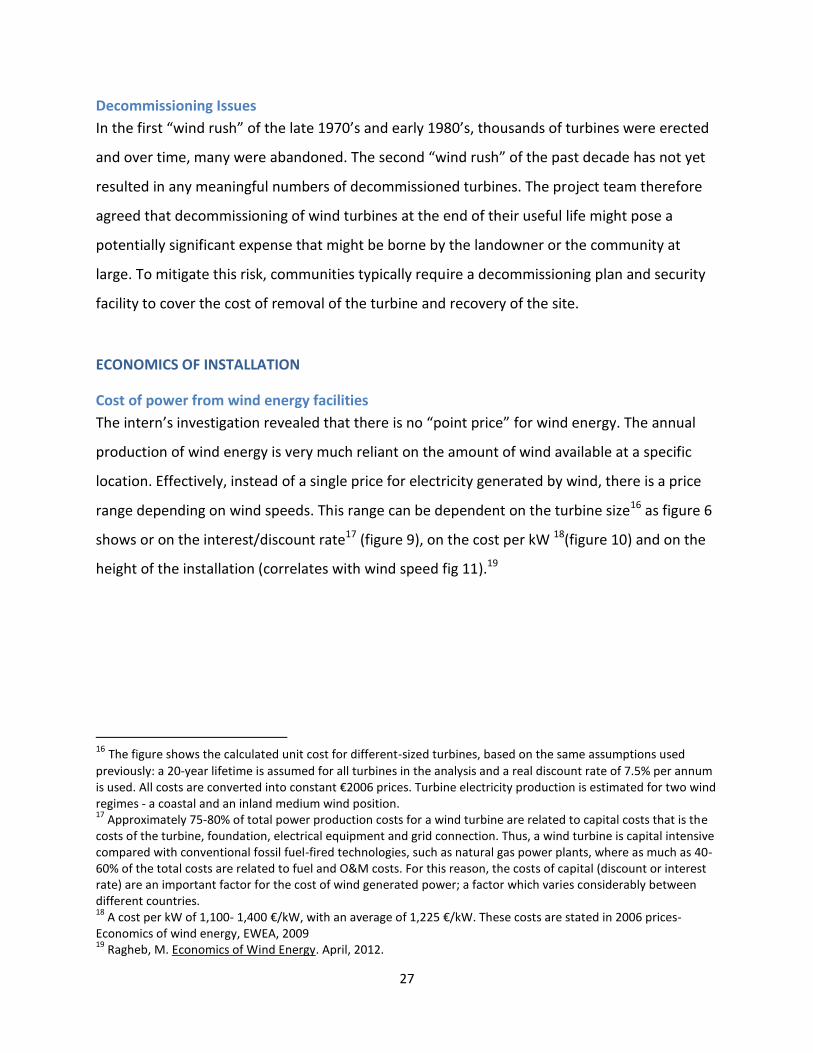
range depending on wind speeds. This range can be dependent on the turbine size16 as figure 6
shows or on the interest/discount rate17 (figure 9), on the cost per kW 18(figure 10) and on the
height of the installation (correlates with wind speed fig 11).19
16 The figure shows the calculated unit cost for different-sized turbines, based on the same assumptions used
previously: a 20-year lifetime is assumed for all turbines in the analysis and a real discount rate of 7.5% per annum is used. All costs are converted into constant €2006 prices. Turbine electricity production is estimated for two wind regimes - a coastal and an inland medium wind position. 17
Approximately 75-80% of total power production costs for a wind turbine are related to capital costs that is the costs of the turbine, foundation, electrical equipment and grid connection. Thus, a wind turbine is capital intensive compared with conventional fossil fuel-fired technologies, such as natural gas power plants, where as much as 40-60% of the total costs are related to fuel and O&M costs. For this reason, the costs of capital (discount or interest rate) are an important factor for the cost of wind generated power; a factor which varies considerably between different countries. 18
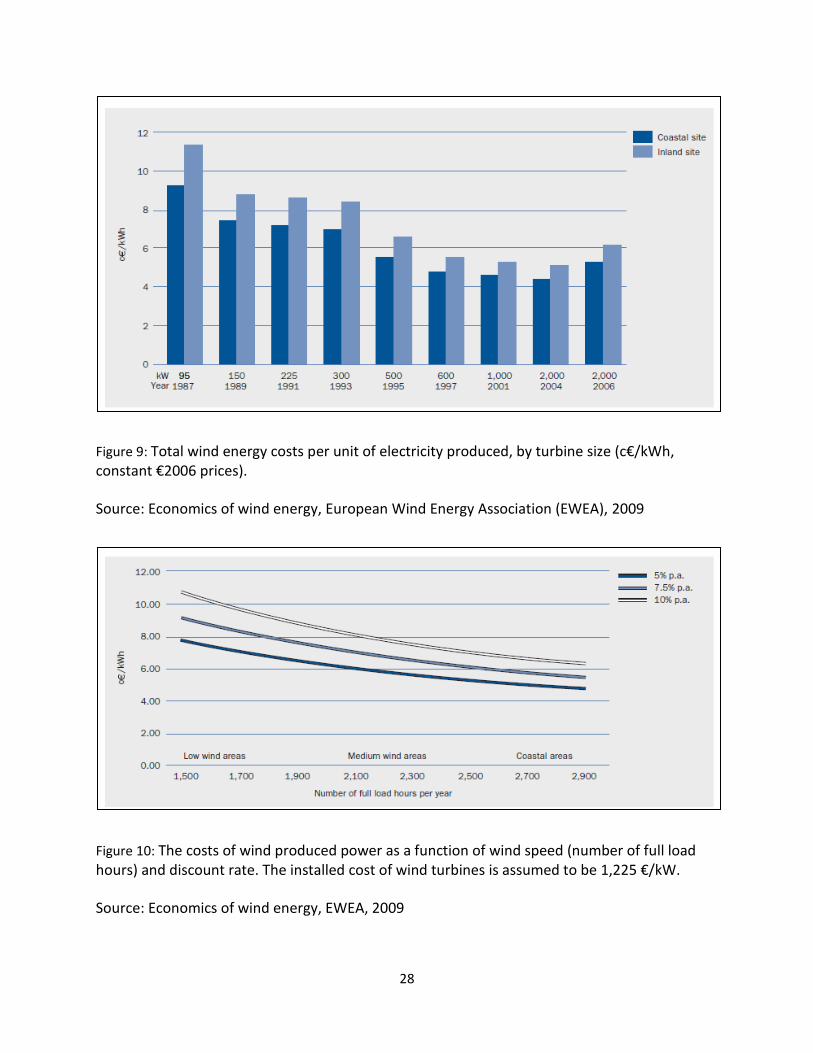
A cost per kW of 1,100- 1,400 €/kW, with an average of 1,225 €/kW. These costs are stated in 2006 prices- Economics of wind energy, EWEA, 2009 19
Ragheb, M. Economics of Wind Energy. April, 2012.
28
Figure 9: Total wind energy costs per unit of electricity produced, by turbine size (c€/kWh, constant €2006 prices).
Source: Economics of wind energy, European Wind Energy Association (EWEA), 2009
Figure 10: The costs of wind produced power as a function of wind speed (number of full load hours) and discount rate. The installed cost of wind turbines is assumed to be 1,225 €/kW.
Source: Economics of wind energy, EWEA, 2009
29
Figure 11: Calculated costs per kWh of wind generated power as a function of the wind regime at the chosen site (number of full load hours).
Source: Economics of wind energy, European Wind Energy Association (EWEA) 2009
Cost of wind power compared to other technologies
From discussion with the project supervisor, the interned gathered that the levelized cost of
electricity (LCOE) is an important metric to compare the generation technologies. It is defined
as “the actualized kWh cost over the complete lifetime of the project, taking into account the
present value of all the cost components.”20
The general cost of electricity production is determined by the following components21:
Fuel cost
Cost of CO2 emissions (as given by the European Trading System for CO2, the ETS)
O&M costs
Capital costs, including planning and site work
The main advantage that wind energy has over other forms of power production is that it is
completely insulated from fluctuations in the price of gas once it is installed. Furthermore, the
cost of CO2 emissions also has no bearing on wind energy.22 Using different discount rates23 that
20
EWEA 21
EWEA 22
There is a lot of argument about the net effects of wind energy on CO2. The next chapter performs an in-depth analysis of the net effects on CO2 emissions. 23
Economics of wind energy, EWEA, 2009
30
account for the risks associated with fuel and CO2 emissions, the calculation of the levelized
cost is performed, resulting in a fair basis of comparison between generation technologies. To
effectively identify and analyze these associated risks, the various cost components should be
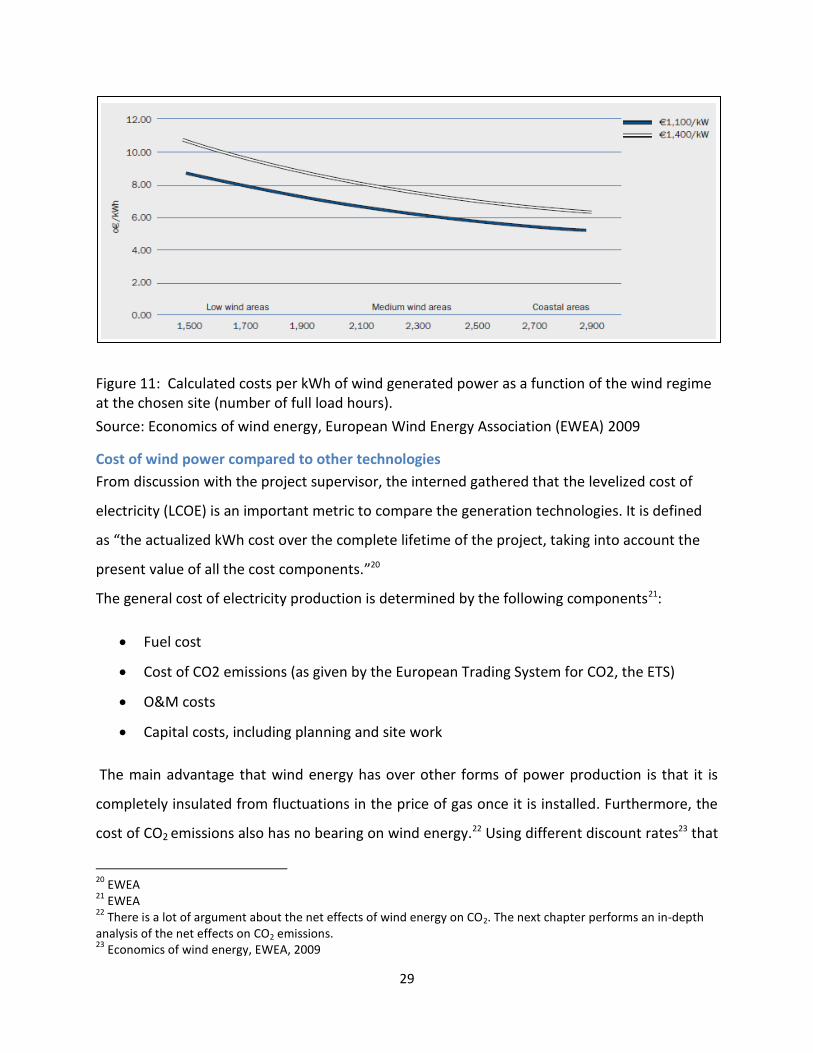
differentiated. Taking into account fuel cost of conventional and nuclear power generation, the
CO2 price and the volatility of these cost components, the following figure shows the levelized
cost of electricity production from different sources.
Figure 12: Costs of generated power, comparing conventional plants to wind power
Source: http://www.ewea.org/index.php?id=1643
The figure above shows the levelized cost of electricity for 2010 for different power generating
technologies. Taking into account the risk associated with the volatility of fuel and CO2 prices,
the cost of conventional technologies (gas and coal) as well as nuclear is increased.
REPORTED HEALTH ISSUES
While it intern found been established that no prior health study or survey were performed
before most IWTs are installed from the literature review done, there have been an increase in
the number of health related complaints made after the turbines are operational. The
complaints have particularly increased in number in the last 10 years from people living

31
adjacent to wind turbines. The range of health grievances has previously not been described in
any medical literature. As technology has improved, the size of turbines have gotten taller and
the blades longer in an attempt to increase the power output. These bigger turbines are also
being installed closer to rural and urban centers in an effort to be closer to transmission lines.
The first recorded cases of the health effects of wind turbines in close proximity to residence
were made by Dr Amanda Harry, a rural GP from the UK. She carried out a community survey
after her patients presented to her with new symptoms and health problems, which they
developed after large wind turbines commenced operation near her village in Cornwall.24
Subsequently, Dr David Iser an Australian GP documented the same range of conditions, using
Dr Harry's initial survey form. Follow up work by the Canadian Wind Vigilance Society's
WindVOICE, cofounded by Dr Robert McMurtry, used Dr Amanda Harry's survey as a basis for
their self reporting survey, and found exactly the same range of symptoms being reported, in
rural Ontario.25
Dr Nina Pierpont (an American Rural Pediatrician) furthered the research by performing the
landmark study which examined the individual case histories of the members of 10 families
from around the world, who had lived adjacent to wind developments, and become so unwell
that they needed to leave their homes. She meticulously recorded details of their health prior
to, during, and after exposure to the turbines, after they had left their homes because of severe
ill health in one or more family members. What she described was a pattern of symptoms
which developed or were exacerbated by the operation of the turbines, and which disappeared
when the subjects left their homes, only to return again when they returned back to their
homes. She called the constellation of symptoms "Wind Turbine Syndrome". Her study,
together with the raw data / case histories, has been published in a book with the same name,
available from windturbinesyndrome.com, and submitted by her to the Senate Inquiry.
24
S. Laurie, Submission to Australian Senate on rural wind Farms, Feb 10, 2011 25
S. Laurie, Submission to Australian Senate on rural wind Farms, Feb 10, 2011

32
The potential or real impact of wind turbines on the health of people has been difficult to
measure. However the following examples represent the considerable intrusion of wind turbine
noise into everyday life and the devastating consequences for ordinary people, regardless of
their backgrounds, ages, and careers. They illustrate the casual dismissive approach of the wind
energy industry as well as the reluctance of governments to undertake impartial and
independent scientific research into the problems, or to adhere to stricter guidelines
recommended by expert reports such as those issued by the World Health Organization.
In June 2005, Mrs. Gwen Burkhardt of New Quay, Wales, UK, reported that the three 'massive'
wind turbines that were built near her family home in 2001, had a significant and negative
impact on her health:
"Having been in the best of health for most of my life, I couldn't understand why I was
suddenly feeling very unwell for no apparent reason. Racing pulse, heart palpitations, a
strange churning in my head, a feeling of nausea, a terrible unease and a need to
escape. Sleep became difficult too." [Burkhardt G. Wind Farm Illness (letter) Wales
Online, 6 June 2005 www.walesonline.co.uk]
In 2006, Gail Mair and her husband settled into their new home in Scansano, Italy. Within four
weeks, the 10 newly erected 121 m wind turbines, with the nearest approximately 900m from
their home, started operating. Within a short time, both Mrs. Mair and her husband
experienced a series of health problems that were new to them both - with the onset not long
after the wind turbines were switched on: insomnia; loss of concentration; nausea; and
depression. During 2007, Mrs. Mair kept a diary of the noise and the symptoms experienced.
Characteristically, the symptoms disappeared when the family left the area for work, extended
visits, and holidays. Coupled with the sleep disturbances, the family also detected a humming
or buzzing noise inside the house, loud enough to distress them and visitors. Finally, in 2008,
after spending ever more extended times away from their new home in order to recuperate,
the couple left permanently-

33
"Abandoning the work of a lifetime.Our house is unsalable, our old age 'pension'
Worthless.”
[Mair G. Italian Windfarm Diary, January 2007 to December 2007. http:// docs. wind
watch.org (mair-diary.pdf]
See Appendix for a more complete list of complaints from people living in close proximity to wind turbines.
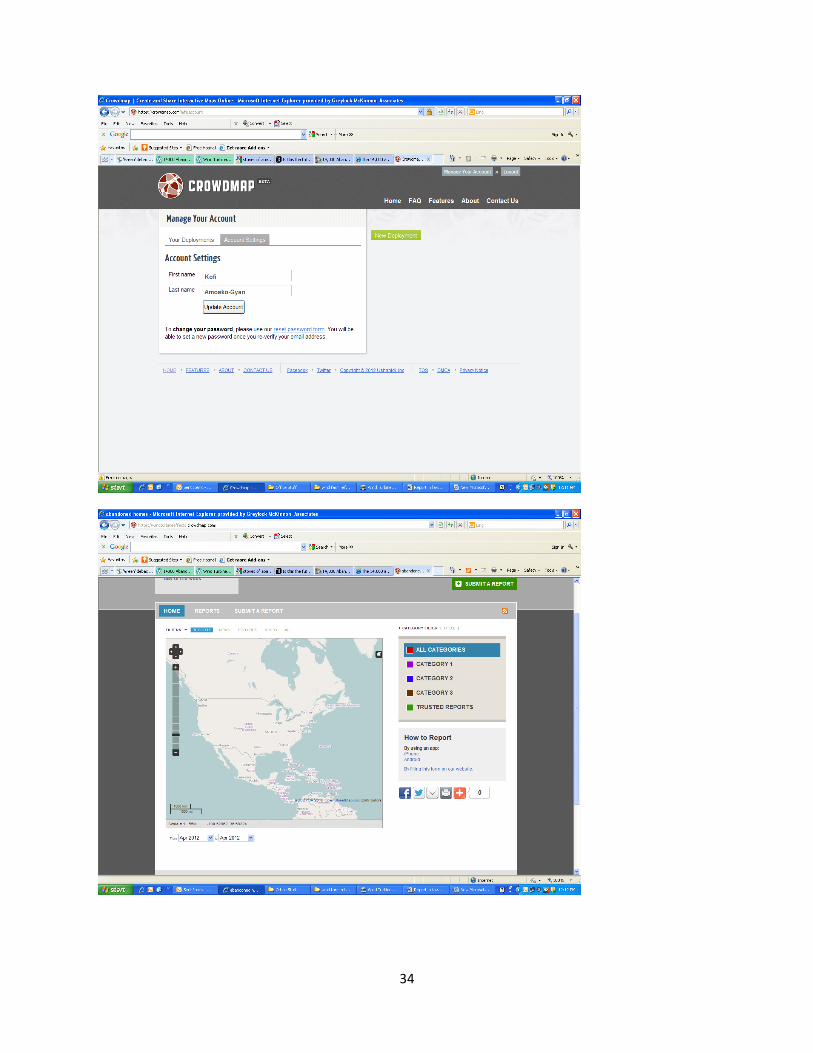
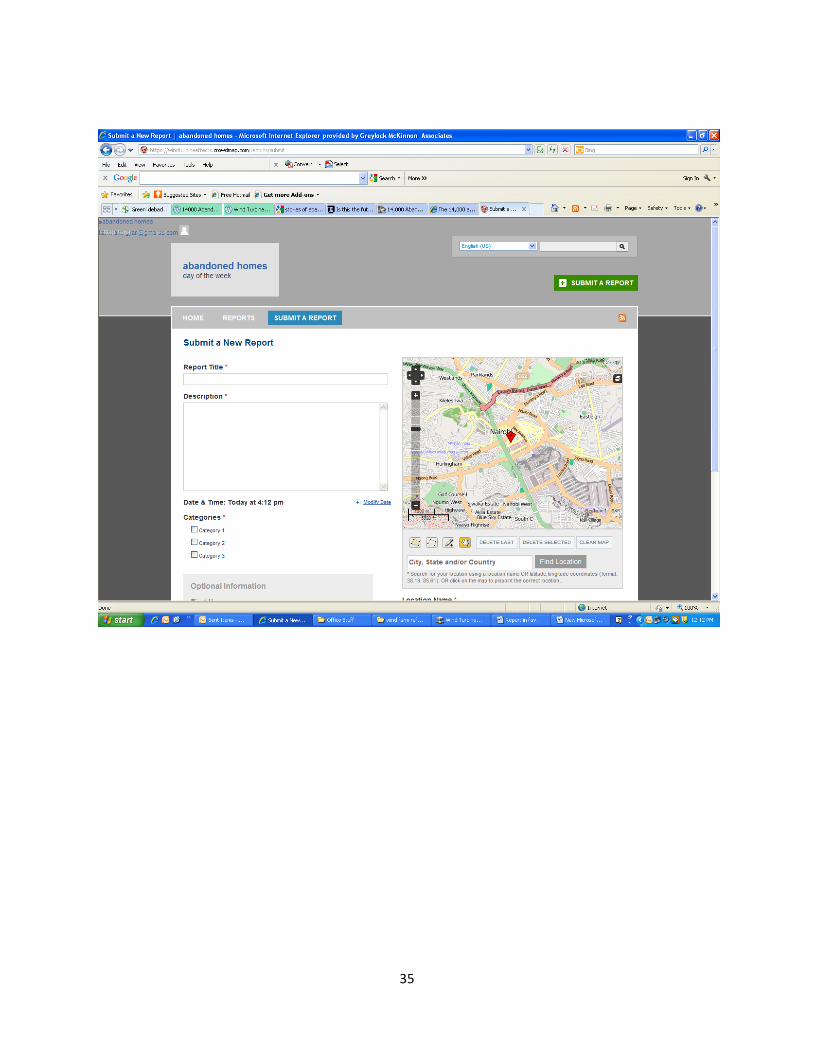
To preempt the complaints, the intern designed an online reporting system for people who
have concerns about wind turbine health effects; reduced property values as a result of
proximity to wind turbines (see figures below). The reporting criteria track complaints all over
the world and display it on a global map. This results gives a pictorial overview of where there
are the most complains and where there are the last. This coupled with the maps for wind
resource and wind exclusion maps give a good idea of where to site a wind farm given
opposition, available wind resource, favorable governmental support etc.
34
35
36
APPENDIX
Jane and Julian Davis live at Deeping St Nicholas, Spalding, Lincolnshire, UK. In 2006, a wind
turbine array began operating, with the nearest turbine 930m from two homes: theirs and the
home of Mr. Davis' parents. As advocates of renewable energy, the Davis family did not object
to the scheme, particularly as the developer assured the community that noise would not be
problematic. The reality was quite different. The Davis family kept a record of the health
problems suffered because of the noise from the wind turbines. Most significantly the problems
included severe sleep deprivation and disturbance, but also heart palpitations and arrhythmias,
vertigo, depression, not to mention considerable distress. [Davis J. Personal Communication, 13
April 2009; MAS Environmental. Noise Monitoring Graph within first floor bedroom - Davis's
House - Wind Farm Noise, 5 July 2007, in: Assessing Noise from Proposed Wind Turbine
Developments. MAS Environmental. Cambridge, UK, May 2009; Davis J and Davis). General
Statement of Jane & Julian Davis, 16 April 2009; Davis J and Davis J. Letter to MP Re: Deeping St
Nicholas Windfarm noise nuisance, 17 May 2010] their family physician recorded these
problems.
On 17 July 2008, a Valuation Tribunal reduced the Council Tax Banding on their home and the
home of Mr. Davis' parents. The judgment stated:
"It was apparent from the evidence submitted that the construction of the wind farm
930 meters away from the appeal dwellings had had significant detrimental effect on
the Appellants quiet enjoyment of their properties. The Tribunal therefore found that
the nuisance caused by the wind farm was real and not imagined."
[Valuation Tribunal Service. Council Tax Valuation List Appeal for the Farmhouse at
Greys Farm, North Drove Bank, Spalding, Lincolnshire PE11 3JX. Appeal Number
2525475651/032C/20, 17 July 2008 www.valuation-tribunals.qov.uk]
In 2009, in Ontario, Canada, the Barry's Bay This Week reported that a retired pharmacist,
Carmen Krogh, experienced the onset of unwelcome symptoms following the commissioning of
a nearby wind turbine array:

37
"Her symptoms came on quickly. She experienced bad headaches, dizziness, queasiness,
a heart rhythm sensation and a vibration inside her body.
[Woman Tells a Tale of Turbine Torment: Retired Pharmacist Speaks to Killaloe, Hagarty
and Richards about the Effects Industrial Wind Turbines had on her Health. Barry's Bay
This Week, 11 February 2009]
"It was just like the whole room was spinning says Lisa Michaud of Thamesville, Ontario,
as she recalled the weeks after the Kent Breeze wind farm began operating m May. The
noise at night keeps you awake. But it’s not just the noise that you hear. It’s something
else that’s coming at you constantly that you don't hear, but you feel. It's just not right.”
[Seglins D and Nicol J. Wind Farm Health Risks Claimed in $1.5M Suit: Ontario Family
Sues Suncor, Alleging Health Problems. CBC News, 21 September 2011 http://
www.cbc.ca/news/canada/toronto/story/2 011/09/211 seglins-windfarms.html; see
also Seglins D and Nicol J. Ontario Wind Farm Health Risks Downplayed: Documents. CBC
News, 22 September 2011 http://www.cbc.ca/news/health/storv/2011/09/21Lwind-
turbines.html.
In January 2010, Japan's Environment Ministry initiated a study of health complaints by families
living near wind turbine arrays. At 30 of 376 wind turbine sites in Japan, people Iiving nearby
filed complaints about environmental noise problems and the consequent health issues:
insomnia, headaches, dizziness, and tinnitus - a buzzing, ringing, and/or humming in the ears.
With each of these 30 sites, several and as many as 60 residents living near the wind turbine
arrays reported health problems. [Ito A and Takeda T. Sickness Claims Prompt Study of Wind
Turbines. The Asahi Shimbun, 19 January 2010 http://www.asahLcom/english/Herald-
asahifTKY20 1001180410 .html]
In March 2010, the Wall Street Journal reported on the experience of Charlie Porter and his
family after a wind turbine array started operating within 550m of their home:
38
"In 2007, a phalanx of wind turbines was built around Charlie Porter's property in rural northern
Missouri. Soon Mr. Porter began to have trouble sleeping. So did his wife and daughter. The
noise, he told me, made sleeping almost impossible. 'We tried everything - earplugs, leaving the
TV station on all night.' Nothing worked.
Late last year he moved his family off their 20 acre farm ... 'I've spoken to nine people in New
York, Wisconsin, Ontario, New Zealand, Nova Scotia and England who live or lived near wind
turbines. All complained of the noise with sleep deprivation being the most common
complaint....' "
[Bryce R. The Brewing Tempest over Wind Power: People living near Turbines Increasingly
Report Sleep Deprivation, Headaches and Vertigo. The Wind Lobby says there’s No Proof. The
Wall Street Journal, 1 March 2010]
In March 2010, the Daily Telegraph [UK] reported that:
"Barry Moon and Gill Haythornthwaite's home is in the Cumbria fells on the outskirts of the
village of Askam in Furness ... The seven turbines have sparked the most complaints about wind
farms in the country. Residents complain of a noise like someone is 'mixing cement in the sky'
or a 'clay stuck in the tumble dryer', and they are not the only ones ... New figures reveal that at
least one in six wind farms have had complaints about noise causing a lack of sleep or just
'dreadfully irritating'. “Ms Haythornthwaite concurred: 'It is a dreadfully irritating whoosh
whoosh noise ... It is unbearable to be outside in the garden when there is the noise.'”
[Gray l. Noise Complaints about One in Six Wind Farms. Daily Telegraph, 6 March 2010]
As reported in the Huron Daily Tribune in May 2010, sixteen Huron residents filed a lawsuit that
detailed several noise problems with a wind turbine array in proximity to their homes, including
low frequency noise and infrasound, which though inaudible, can travel long distances from the
source, and even penetrate buildings:

39
"Intrusions detailed in the lawsuit include: LFN and sub audible infrasound and/or
impulse noise created by and emitted from the wind turbines which range as close as
1,000ft (333 meters) and 1,700 feet (515 meters), away from each plaintiff's home."
The plaintiffs experienced "actual physical discomforts" of the kind that would cause physical discomfort to an ordinary person.
"Physical harm and negative health effects listed In the law suit included: Inability to
sleep and repeated awakening during sleep, headaches dizziness, stress and tension,
extreme fatigue, diminished ability to concentrate, nausea, and other physiological and
cognitive effects, "
The lawsuit notes that at least one family, the Peplinskis, experienced adverse health effects so
severe that they left their home and rented an apartment away from the wind turbines.
[Hessling K. Residents Sue Wind Companies. Huron Daily Tribune (Michigan, USA), 29 May
2010; WNEM TV5 (Michigan) Investigates: Possible Conflict of Interest; Lawsuit against Wind
Energy Cos: This Man's Family Can't Sleep, 29 May 2010]
In July 2010, Mr. and Mrs. Dean received a Noise Impact Assessment Report from Noise
Measurement Services Pty Ltd, Brisbane, detailing the noise impact of the Waubra wind turbine
array near their home and farm. The consultant's report stated:
"Wind Farm activity appears to create a pulsating Infrasound and low frequency pattern.
These patterns are Illustrated In sonograms ... My hypothesis at this stage is that wind
farm sound has an adverse effect on individuals due to this pulsating nature, as well as
audible noise due to the wind turbine. These effects are cumulative.”
The report notes that the effects include sleep disturbance, anxiety, stress, and headaches:
"I am of the opinion, based on m own research that wind farm noise can and does
create unreasonable noise within residences and consequential adverse effects in the
sense of sleep disturbance, annoyance, and potential health effects to residents living
within 2km of large wind turbines set in a wind farm. These risks are quantifiable and
the effect is significantly more than minor." [Executive Summary p 6, and 5.7, p 64]
Moreover, the consultant's report observed similar consequences at two other wind turbine
arrays, at Manawatu and Makara, noting that:
40
“... Wind farm sound can be heard within residences situated within 3.5km of large
turbines."
[Thorne B. Noise Impact Assessment Report: Waubra Wind Farm. Report No 1537.
Noise Measurement Services Pty Ltd, South Brisbane, Australia, July 2010; see also
Stateline Victoria. Claims of Wind Farm Illness, 19 February 2010 (available online only
through 20 May 2010); White L. Wind Farms Can Cause Significant Health Problems.
Weekly Times Now, 24 December 2009
http://www.weeklytimesnow.com.au/articie/2009/12/24/144511 nationalnews.html;
Rolfe P. Turbines Declared Nasty Neighbour as Secret Buyout is Revealed. Sunday Herald
Sun, 30 January 2011 http://www.heraldsun.com.au/news/victoria/turbines-declared-
a–nasty-neighbour/story-e6frf7kx 1225996775637; Waubra Resident Tells Court of
Wind Farm "Hell". The Courier (Australia), 18 January 2011 http://
www.thecourier.com.au/news/local/ news/genera1/waubra-resident–tells-court-of-
wind-farm-hell/2 049825.aspx]
A Torrington, Devon, UK, couple is selling their home and business following the construction of
three wind turbines in a field opposite their bungalow:
"Pat and Arthur Poulton say they are being kept awake at night by the noise from a trio
of giant turbines less than 500 metres from their home at Higher Darracott ... 'I can hear
the turbines through my pillow at night said Mrs Poulton'." [Keeble A. Our Sleepless
Nights with the Wind Turbines. North Devon Gazette, 8 June 2011] (Note: The scheme
was refused consent by the local Council but approved on appeal by an Inspector, even
though the Official was advised during the Public Inquiry that the noise intrusion was
likely to engage a Human Rights violation.)
According to Allen Haas of Malone, Wisconsin:
"I have 3 wind turbines on my property and get $4,000 for each one. It's been 2 years".
People are not really mad directly at the wind turbines or even know what they are mad
about; they're just mad, aggressive. The nearest wind turbine is] "3 000 feet away - way

41
too close. You don't get sleep at night because they roar like an airport. I get shadow
flicker in my house, but down in the village of Johnsburg where those are about another
1,500 feet away from the turbines – oh probably 4,500 feet total, those blades are
throwing shadows right over all the house roofs."
"I go to my doctor and now I'm on a lot of different medications. I've been to the
hospital a couple of times in the past 2 years with chest pains. And they can't figure out
what it is but now we're all being diagnosed with wind turbine syndrome ... It definitely
causes depression. Memory loss is the worse issue. I see it so bad in myself and
especially my parents who are older". My dad is a totally different person since these
things went up. He stays in bed all day now. Even if he does get up to eat, he just goes
back to bed. There is no will any more. I ask the doctor - how are they doing this to us?"
[Haas A. To the PSC Commissioners. Malone, Wisconsin. August 2010
http://psc.wi.gov//apps35/erf_search/content/homesearch.aspx?partl =
l&part2=AC&part3-231&type=Comments and http://www.wind-
watch.org/documents/to-the-psc-commissioners/]
These examples represent a small number of the number of families who have made
complains whenever wind turbines are built in proximity to family homes. The
complaints have gathered momentum that the Federal Health Minister of Canada,
Leona Aglukkaq announced Tuesday that Ottawa will conduct a study, which “is in
response to questions from residents living near wind farms about possible health
effects of low-frequency noise generated by wind turbines.”
The $1.8-million study will initially focus on residents in 2,000 dwellings near eight to 12
wind-turbine installations. There are about 140 such land based wind farms in Canada,
most of them in Ontario and Quebec.
Sherri Lange, CEO of North American Platform Against Wind Power said she is
encouraged to see the federal government undertaking a study on the safety of wind
turbines.

42
“I hope it will be independent and at an arm’s length” from the government, said Lange,
whose opposition to wind farms began with a fight to stop a proposed installation of the
energy-producing towers in Lake Ontario, offshore from her east Toronto
neighborhood.”