Embed Size (px)
Citation preview

Analysis of in silico tools for evaluating missense variants
A summary report
Simon Williams, PhD

Analysis of in silico tools for evaluating missense variants November 2012
2
Contents
Background 3
Objectives 3
Methods 4
Results 5
Recommendations 12
References 13

Analysis of in silico tools for evaluating missense variants November 2012
3
Background
A single nucleotide polymorphism (SNP) in a coding region of DNA that results in an amino acid
change in the corresponding protein is termed a non-synonymous or missense variant. Many of these
variants have been implicated in human disease phenotypes but, in the absence of functional assays,
the related pathogenicity of many remains unclassified. A number of in silico tools have been
developed to predict the effect of missense variants. Some of these tools are used routinely by
diagnostic labs to advise clinicians of disease likelihood in the absence of previous evidence.
The tools can be broadly divided into three groups: sequence and evolutionary conservation-based
methods, protein sequence and structure-based methods and machine learning methods. A more
detailed description of each tool is available at the NGRL Manchester website:
(http://www.ngrl.org.uk/Manchester/page/missense-prediction-tools)
Objectives
Using variants of known pathogenicity, we assess a variety of predictive algorithms in a gene-specific
manner. We show that optimum predictions are achieved by different tools in different genes and
that their performance can vary markedly. We also assess the use of these tools when predictions
are combined and a consensus taken. All possible combinations of tools are used in consensus
predictions and optimum combinations are compared to the currently popular choice of using SIFT,
PolyPhen-2 and Align-GVGD. Additionally, in algorithms that require a multiple sequence alignment
(MSA) as input, we demonstrate the sensitivity of predictions to variations in the alignment. Here,
algorithms are shown to be relatively insensitive to commonly used statistical parameters and instead
predictions remain stable, despite the diversity of aligned orthologues. However, we also show that,
in the context of individual missense mutations, the alignment quality and depth are important in
achieving more accurate predictions of pathogenicity.

Analysis of in silico tools for evaluating missense variants November 2012
4
Methods
AlgorithmsThirteen algorithms were tested. Of these, 11 were run using the default settings and, where
appropriate, alignments were generated by the individual tool. The algorithms tested in this way
were:
SIFT (Kumar et al. 2009)
Align-GVGD (Tavtigian et al. 2006)
Mutation assessor (Reva et al. 2011)
PANTHER (Brunham et al. 2006)
PolyPhen-2 (Adzhubei et al. 2010)
PMut (Ferrer-Costa et al. 2004)
SNAP (Bromberg et al. 2008)
MutPred (Li et al. 2009)
Hansa (Acharya et al. 2012)
SNPs&GO (Calabrese et al. 2009)
CONDEL (González-Pérez and López-Bigas, 2011)
Three algorithms were run locally with user submitted alignments.
SIFT
MAPP (Stone et al. 2005)
Parepro (Tian et al. 2007)
MAPP requires a phylogenetic tree as input as well as a MSA to determine the evolutionary
relationships between the species. SEMPHY (Friedman et al 2002) was downloaded and used to
generate the phylogenetic trees.
Assessment of alignment sensitivity The alignments for BRCA1, BRCA2, MLH1 and MSH2 alignments were taken from the Alamut
(http://www.interactive-biosoftware.com/alamut.html) package. Of these, the BRCA1 curated
alignment is used from Align-GVGD whilst the others have been developed by Alamut. These
alignments feature 9-12 species (including Human) and have been generated to satisfy suggested
levels of divergence, in terms of mean substitutions per site and median information content.
The sensitivity of each of the three algorithms to the alignment given was assessed by generating
alignments featuring all possible combinations of species with human (Warrender, 2010). Each of
these was then used as input for the algorithm and the sensitivity, specificity and MCC of the
Analysis of in silico tools for evaluating missense variants November 2012
5
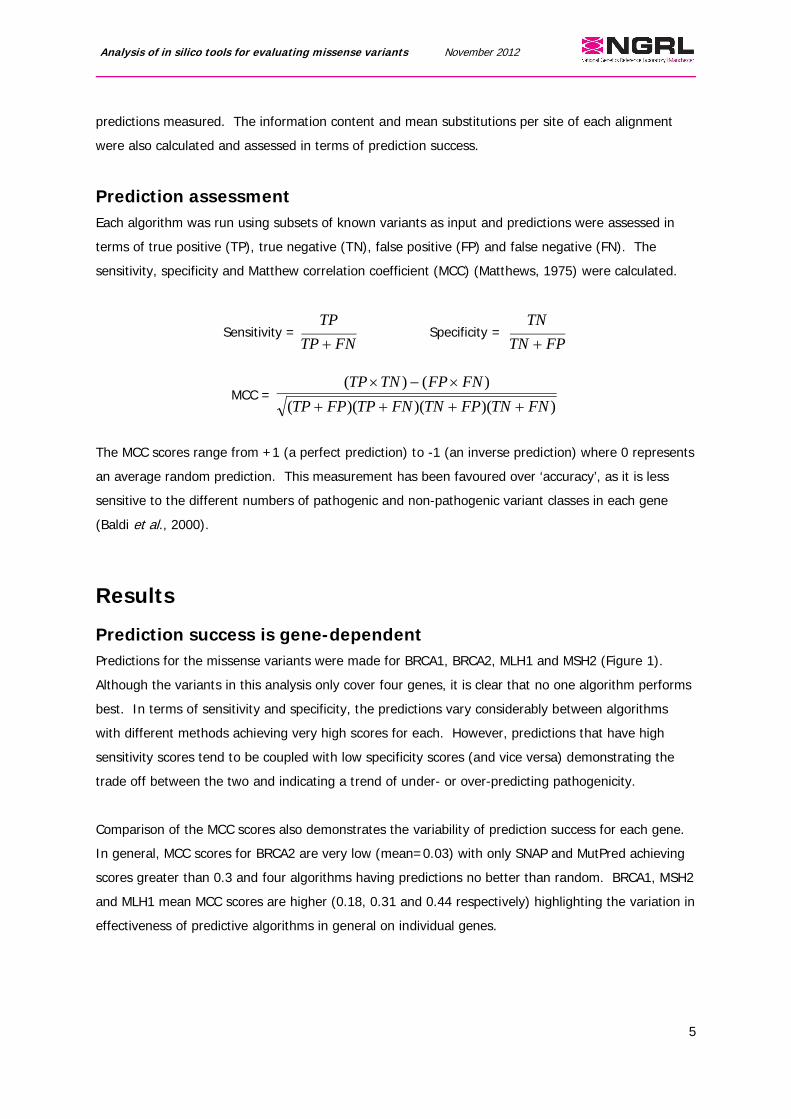
predictions measured. The information content and mean substitutions per site of each alignment
were also calculated and assessed in terms of prediction success.
Prediction assessment Each algorithm was run using subsets of known variants as input and predictions were assessed in
terms of true positive (TP), true negative (TN), false positive (FP) and false negative (FN). The
sensitivity, specificity and Matthew correlation coefficient (MCC) (Matthews, 1975) were calculated.
Sensitivity =FNTP
TP
Specificity =
FPTN
TN
MCC =))()()((
)()(
FNTNFPTNFNTPFPTP
FNFPTNTP
The MCC scores range from +1 (a perfect prediction) to -1 (an inverse prediction) where 0 represents
an average random prediction. This measurement has been favoured over ‘accuracy’, as it is less
sensitive to the different numbers of pathogenic and non-pathogenic variant classes in each gene
(Baldi et al., 2000).
Results
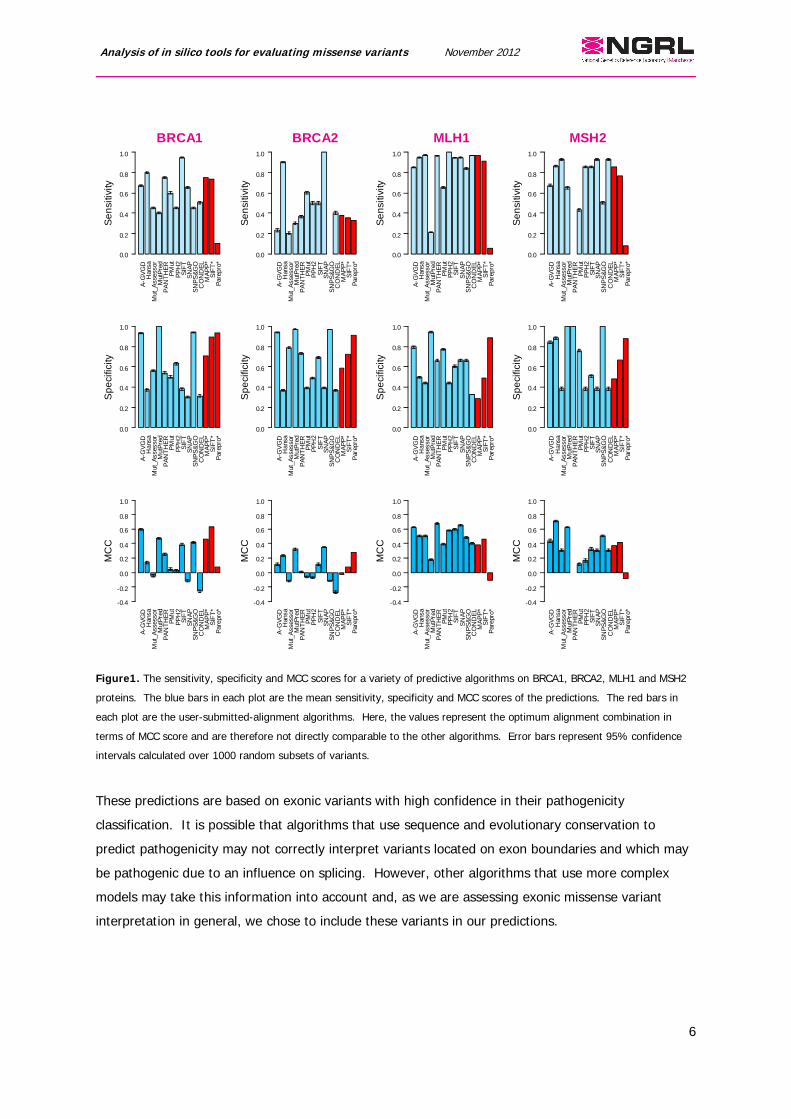
Prediction success is gene-dependentPredictions for the missense variants were made for BRCA1, BRCA2, MLH1 and MSH2 (Figure 1).
Although the variants in this analysis only cover four genes, it is clear that no one algorithm performs
best. In terms of sensitivity and specificity, the predictions vary considerably between algorithms
with different methods achieving very high scores for each. However, predictions that have high
sensitivity scores tend to be coupled with low specificity scores (and vice versa) demonstrating the
trade off between the two and indicating a trend of under- or over-predicting pathogenicity.
Comparison of the MCC scores also demonstrates the variability of prediction success for each gene.
In general, MCC scores for BRCA2 are very low (mean=0.03) with only SNAP and MutPred achieving
scores greater than 0.3 and four algorithms having predictions no better than random. BRCA1, MSH2
and MLH1 mean MCC scores are higher (0.18, 0.31 and 0.44 respectively) highlighting the variation in
effectiveness of predictive algorithms in general on individual genes.
Analysis of in silico tools for evaluating missense variants November 2012
6
A-G
VG
DH
ansa
Mut
_Ass
esso
rM
utP
red
PA
NT
HE
RP
Mut
PP
H2
SIF
TS
NA
PS
NP
S&
GO
CO
ND
EL
MA
PP
*S
IFT
*P
arep
ro*
BRCA1
Se
nsi
tivity
0.0
0.2
0.4
0.6
0.8
1.0
A-G
VG
DH
ansa
Mut
_Ass
esso
rM
utP
red
PA
NT
HE
RP
Mut
PP
H2
SIF
TS
NA
PS
NP
S&
GO
CO
ND
EL
MA
PP
*S
IFT
*P
arep
ro*
Sp
eci
ficity
0.0
0.2
0.4
0.6
0.8
1.0
A-G
VG
DH
ansa
Mut
_Ass
esso
rM
utP
red
PA
NT
HE
RP
Mut
PP
H2
SIF
TS
NA
PS
NP
S&
GO
CO
ND
EL
MA
PP
*S
IFT
*P
arep
ro*
MC
C
-0.4
-0.2
0.0
0.2
0.4
0.6
0.8
1.0
A-G
VG
DH
ansa
Mut
_Ass
esso
rM
utP
red
PA
NT
HE
RP
Mut
PP
H2
SIF
TS
NA
PS
NP
S&
GO
CO
ND
EL
MA
PP
*S
IFT
*P
arep
ro*
BRCA2
Se
nsi
tivity
0.0
0.2
0.4
0.6
0.8
1.0
A-G
VG
DH
ansa
Mut
_Ass
esso
rM
utP
red
PA
NT
HE
RP
Mut
PP
H2
SIF
TS
NA
PS
NP
S&
GO
CO
ND
EL
MA
PP
*S
IFT
*P
arep
ro*
Sp
eci
ficity
0.0
0.2
0.4
0.6
0.8
1.0
A-G
VG
DH
ansa
Mut
_Ass
esso
rM
utP
red
PA
NT
HE
RP
Mut
PP
H2
SIF
TS
NA
PS
NP
S&
GO
CO
ND
EL
MA
PP
*S
IFT
*P
arep
ro*
MC
C
-0.4
-0.2
0.0
0.2
0.4
0.6
0.8
1.0
A-G
VG
DH
ansa
Mut
_Ass
esso
rM
utP
red
PA
NT
HE
RP
Mut
PP
H2
SIF
TS
NA
PS
NP
S&
GO
CO
ND
EL
MA
PP
*S
IFT
*P
arep
ro*
MLH1
Se
nsi
tivity
0.0
0.2
0.4
0.6
0.8
1.0
A-G
VG
DH
ansa
Mut
_Ass
esso
rM
utP
red
PA
NT
HE
RP
Mut
PP
H2
SIF
TS
NA
PS
NP
S&
GO
CO
ND
EL
MA
PP
*S
IFT
*P
arep
ro*
Sp
eci
ficity
0.0
0.2
0.4
0.6
0.8
1.0
A-G
VG
DH
ansa
Mut
_Ass
esso
rM
utP
red
PA
NT
HE
RP
Mut
PP
H2
SIF
TS
NA
PS
NP
S&
GO
CO
ND
EL
MA
PP
*S
IFT
*P
arep
ro*
MC
C
-0.4
-0.2
0.0
0.2
0.4
0.6
0.8
1.0
A-G
VG
DH
ansa
Mut
_Ass
esso
rM
utP
red
PA
NT
HE
RP
Mut
PP
H2
SIF
TS
NA
PS
NP
S&
GO
CO
ND
EL
MA
PP
*S
IFT
*P
arep
ro*
MSH2
Se
nsi
tivity
0.0
0.2
0.4
0.6
0.8
1.0
A-G
VG
DH
ansa
Mut
_Ass
esso
rM
utP
red
PA
NT
HE
RP
Mut
PP
H2
SIF
TS
NA
PS
NP
S&
GO
CO
ND
EL
MA
PP
*S
IFT
*P
arep
ro*
Sp
eci
ficity
0.0
0.2
0.4
0.6
0.8
1.0
A-G
VG
DH
ansa
Mut
_Ass
esso
rM
utP
red
PA
NT
HE
RP
Mut
PP
H2
SIF
TS
NA
PS
NP
S&
GO
CO
ND
EL
MA
PP
*S
IFT
*P
arep
ro*
MC
C
-0.4
-0.2
0.0
0.2
0.4
0.6
0.8
1.0
Figure1. The sensitivity, specificity and MCC scores for a variety of predictive algorithms on BRCA1, BRCA2, MLH1 and MSH2
proteins. The blue bars in each plot are the mean sensitivity, specificity and MCC scores of the predictions. The red bars in
each plot are the user-submitted-alignment algorithms. Here, the values represent the optimum alignment combination in
terms of MCC score and are therefore not directly comparable to the other algorithms. Error bars represent 95% confidence
intervals calculated over 1000 random subsets of variants.
These predictions are based on exonic variants with high confidence in their pathogenicity
classification. It is possible that algorithms that use sequence and evolutionary conservation to
predict pathogenicity may not correctly interpret variants located on exon boundaries and which may
be pathogenic due to an influence on splicing. However, other algorithms that use more complex
models may take this information into account and, as we are assessing exonic missense variant
interpretation in general, we chose to include these variants in our predictions.

Analysis of in silico tools for evaluating missense variants November 2012
7
Comparison of consensus predictionsIt has previously been found that when multiple algorithms give the same prediction, the accuracy of
the result is improved (Chan et al., 2007). In practice multiple algorithms can be used to make
predictions and a consensus prediction taken. We investigated which algorithms performed optimally
when used together in this way by taking every possible combination and making predictions on all of
the available variants. We excluded Parepro from this analysis as predictions were so poor they would
be unlikely to meaningfully contribute to a consensus prediction. This resulted in 8178 combinations
of two or more algorithms that were used to predict pathogenicity, giving a prediction only when a
consensus was reached.
In Figure 2 the top five algorithm combinations are shown in comparison to the top five individual
algorithms run over the same variants. The algorithms included in each of the five consensus
combinations are shown in Table 1. When run over all the variants the best consensus approach
achieves higher MCC scores than using any of the individual algorithms alone. The optimum
combinations commonly include SNPs&GO, MutPred and one other algorithm.
The consensus predictions from SIFT, PolyPhen-2 and Align-GVGD are shown for comparison (Figure
2) as these tools are commonly used in diagnostic labs. The top consensus predictions and top
individual tool predictions perform better than taking the SIFT, PolyPhen-2 and Align-GVGD
consensus prediction. As predictions from SIFT and Align-GVGD tend to be ranked among the top
performing individual algorithms this implies that in these cases predictions are often contradictory,
with each performing well with certain variants.
ID Algorithms
1 MutPred, SNPs&GO, MAPP
2 MutPred, SNPs&GO, Hansa
3 MutPred, SNPs&GO, SIFT
4 MutPred, SNPs&GO, SIFT*
5 MutPred, SNPs&GO, SNAP
Table 1. The individual algorithms included in the top five consensus predictions over all four genes.
*Algorithms run with user-submitted alignments.

Analysis of in silico tools for evaluating missense variants November 2012
8
A-G
VG
D
SN
PS
&G
O
SIF
T
MA
PP
*
PA
NT
HE
R
Combined Variants
MC
C
0.0
0.2
0.4
0.6
0.8
1.0
1 2 3 4 5
SIF
T,P
PH
2,A
GV
GD
consensus
Figure 2. The success of the top five consensus predictions in comparison with the top five individual algorithms over variants
from all four genes combined. The algorithms included in each of these consensus predictions can be seen in Table 1. Error
bars represent 95% confidence intervals calculated over 1000 random subsets of variants. *Algorithms run with user-submitted
alignments.
Key points:1. The optimum algorithms for predicting variant pathogenicity vary depending on the gene.
2. Over the four genes tested, the top five individual tools in terms of MCC score are Align-
GVGD, SNPs&GO, SIFT, MAPP and PANTHER.
3. For some genes, taking a consensus prediction can give improved results over individual
algorithms.
4. The optimum combination of tools for inclusion in a consensus prediction are SNPs&GO,
MutPred one other algorithm.
5. When running predictive tools on a gene where the optimum algorithm is unknown it is
advisable to adopt a consensus approach to predict pathogenicity.
6. The consensus prediction from SIFT, PolyPhen-2 and Align-GVGD performs less well than the
top consensus predictions and top individual predictions.

Analysis of in silico tools for evaluating missense variants November 2012
9
Analysis of alignment sensitivityThe diversity captured in a MSA can influence the predictions that in silico tools make. Sites under
functional constraint will be conserved in an alignment of orthologues whereas sites less crucial for
function are more able to accommodate sequence variants. As such, the average number of
substitutions at positions with non-pathogenic variants should exceed that of sites with known
pathogenic variants. This is found to be the case, with the difference between pathogenic and non-
pathogenic sites increasing as more orthologues are added to the alignments (i.e. as more
orthologues are added to an alignment, the pathogenic sites remain conserved and the non-
pathogenic sites become more and more diverse).
Despite this relationship, the effect that this increased alignment diversity has on prediction success is
limited. Figure 3 shows the relationship between MCC score and the number of sequences in the
alignment. There is no clear correlation between them indicating that overall MCC scores are not
particularly sensitive to the number of orthologues in a MSA and consequently the extra diversity that
an increased number of orthologues provides. However, it is worth considering that these overall
MCC scores may mask the effect of prediction changes at individual sites, an important consideration
when testing a single missense variant.

Analysis of in silico tools for evaluating missense variants November 2012
10
2 3 4 5 6 7 8 9 10 11 12
0.36
0.38
0.40
0.42
0.44
0.46
0.48
BRCA1
No. seqs in alignment
MC
CM
AP
P
2 3 4 5 6 7 8 9 10
-0.25
-0.20
-0.15
-0.10
-0.05
0.00
BRCA2
No. seqs in alignment
MC
C
2 3 4 5 6 7 8 9 10 11
0.20
0.25
0.30
0.35
0.40
MLH1
No. seqs in alignment
MC
C
2 3 4 5 6 7 8 9
0.30
0.32
0.34
0.36
0.38
MSH2
No. seqs in alignment
MC
C
2 3 4 5 6 7 8 9 10 11 12
0.48
0.50
0.52
0.54
0.56
0.58
0.60
0.62
0.64
No. seqs in alignment
MC
CS
IFT
2 3 4 5 6 7 8 9 10
-0.100
-0.075
-0.050
-0.025
0.000
0.025
0.050
0.075
0.100
No. seqs in alignment
MC
C
2 3 4 5 6 7 8 9 10 11
0.25
0.30
0.35
0.40
0.45
0.50
No. seqs in alignment
MC
C
2 3 4 5 6 7 8 9
0.28
0.30
0.32
0.34
0.36
0.38
0.40
0.42
No. seqs in alignment
MC
C
2 3 4 5 6 7 8 9 10 11 12
-0.6
-0.5
-0.4
-0.3
-0.2
-0.1
0.0
0.1
No. seqs in alignment
MC
CP
arep
ro
2 3 4 5 6 7 8 9 10
-0.4
-0.3
-0.2
-0.1
0.0
0.1
0.2
0.3
No. seqs in alignment
MC
C
2 3 4 5 6 7 8 9 10 11
-0.35
-0.30
-0.25
-0.20
-0.15
-0.10
No. seqs in alignment
MC
C
2 3 4 5 6 7 8 9
-0.55
-0.50
-0.45
-0.40
-0.35
-0.30
-0.25
-0.20
-0.15
-0.10
-0.05
No. seqs in alignment
MC
C
Figure 3. The relationship between number of sequences in the alignment and MCC scores for all four genes using MAPP,
SIFT and Parepro algorithms.
Assessment of individual variants can be influenced by alignment diversityPrediction of individual variants can be highly sensitive to the alignment. Both the number and type
of orthologues aligned at the mutation site can affect predictions of pathogenicity. For example, the
BRCA1 variant S1512I (Box 1) is known to be non-pathogenic but when alignment 1 is used in Align-
GVGD the high degree of conservation at the site indicates that any change would likely be
pathogenic. Adding orthologues to the alignment introduces extra diversity and a prediction of non-
pathogenicity. The reverse situation can also occur where the addition of orthologues can lead to
pathogenic variants being predicted non-pathogenic due to the extra diversity that more distant
orthologues can bring. An example of this can be seen in MLH1 variant S247P. The orthologous
sequences from Drosophila melanogaster (fruitfly), Aedes (mosquito) and Saccharomyces cerevisiae
(yeast) introduce more diversity at the site and Align-GVGD consequently predicts a non-pathogenic

Analysis of in silico tools for evaluating missense variants November 2012
11
change. Here it is important to scrutinise the choice of orthologues to ensure that appropriate
sequences are aligned whilst bearing in mind that a certain level of overall sequence divergence is
required. It should also be noted that Align-GVGD gives the option of setting different alignment
depths when using their own library alignments.
Hsap DDRWYMHSCSGSLQN
Ptro DDRWYMHSCSGSLQN
Ggor DDRWYMHSCSGSLQN
Ppyg DDRWYMHSCSGSLQN
Mmul EDRWYVHSSSGSLQN
Mmus GSRGSAHGCSRHLQK
Cfam DTRWYVHSCPRSLQD
Btau YNRWYMHS-SRSLQD
Mdom NRVWSPLSRSRTPWE
Hsap DDRWYMHSCSGSLQN
Ptro DDRWYMHSCSGSLQN
Ggor DDRWYMHSCSGSLQN
Ppyg DDRWYMHSCSGSLQN
Mmul EDRWYVHSSSGSLQN
Cfam DTRWYVHSCPRSLQD
A-GVGD prediction = C65 (pathogenic)
Variant: BRCA1 S1512I – Non-pathogenic
Alignment 1 Alignment 2
A-GVGD prediction = C0 (non-pathogenic)
Hsap -KMNGYISNANYSVK
Ptro -KMNGYISNANYSVK
Mmus -KMNGYISNANYSVK
Rnor -KMNGYISNANYSVK
Btau -KMNGYISNANYSVK
Ecab -KMNGYISNANYSVK
Xlae -KMKGYVTNANYSMK
Drer -KVKGYISNANYSVK
A-GVGD prediction = C65 (pathogenic)
Variant: MLH1 S247P – Pathogenic
Alignment 1 Alignment 2
A-GVGD prediction = C0 (non-pathogenic)
Hsap KMNGYISNANYSVK
Ptro KMNGYISNANYSVK
Mmus KMNGYISNANYSVK
Rnor KMNGYISNANYSVK
Btau KMNGYISNANYSVK
Ecab KMNGYISNANYSVK

Analysis of in silico tools for evaluating missense variants November 2012
12
Key points:1. Some algorithms require gene-specific multiple sequence alignments as input
2. The more orthologues that are added to a multiple sequence alignment, the greater the
power to discriminate between sites of pathogenic and non-pathogenic substitutions. (ie.
pathogenic sites remain conserved and non-pathogenic sites exhibit increased diversity)
3. Despite this, using alignments featuring greater numbers of orthologues does not lead to
improved predictions of pathogenicity with these tools when MCC score is calculated over a
large group of variants
4. Conversely, prediction of individual missense variants can be highly sensitive to the sequence
diversity at the aligned site and as such, manual inspection of alignment position is
recommended in order to ensure predictions are as accurate as possible
Recommendations
Use of in silico toolsWhen using in silico algorithms for assessing missense variants the ‘best’ tool is likely to be different
depending on the gene. Where this ‘best’ tool is unknown it is advisable to take a consensus
prediction. On the basis of the genes tested here, we would recommend using a consensus
prediction from MutPred, SNPs&GO and one other algorithm to produce the optimum predictions.
Taking a consensus from SIFT, PolyPhen-2 and Align-GVGD does not produce the best results.
Use of MSAs with in silico toolsThe algorithms that allow custom MSAs, can display great variability in performance depending on the
orthologues aligned. To reduce this variability it is recommended that alignments contain a diverse
set of orthologues to satisfy statistical considerations. Although an ‘optimum’ alignment is difficult to
identify and is likely to vary depending on the variants tested, these alignments must be carefully
constructed to ensure that the best possible chance is given to achieve correct predictions. We
propose that reference alignments should be created and made available through the NGRL
Manchester website to enable diagnostic labs to have access to standardised datasets. Further
information on the use of multiple sequence alignments in missense prediction tools can be found
here: http://www.ngrl.org.uk/Manchester/page/MSAs

Analysis of in silico tools for evaluating missense variants November 2012
13
References
Acharya V. and Nagarajaram HA. Hansa: An automated method for discriminating disease and neutral
human nsSNPs. Human Mutation (2012) 2:332-337.
Adzhubei IA, Schmidt S, Peshkin L, Ramensky VE, Gerasimova A, Bork P, Kondrashov AS, Sunyaev
SR. A method and server for predicting damaging missense mutations. Nature Methods (2010) 7 (4)
248-249.
Baldi P, Brunak S, Chauvin Y, Andersen CAF, Nielsen H. Bioinformatics (2000) 16 412-424.
Brunham LR, Singaraja RR, Pape TD, Kejariwal A, Thomas PD, Hayden MR. Accurate prediction of the
functional significance of nucleotide polymorphisms and mutations in the ABCA1 gene. PLoS Genetics
(2005) 1 (6) e83.
Bromberg Y, Tachdav G, Rost B. SNAP predicts effect of mutations on protein function. Bioinformatics
(2008) 24, 2397-2398.
Calabrese R, Capriotti E, Fariselli P, Martelli P.L, Casadio R. Functional annotations improve the
predictive score of human disease-related mutations in proteins. Human Mutation.(2009) 30 1237-
1244.
Chan PA, Duraisamy S, Miller PJ, Newell JA, McBride C, Bond JP, Raevaara T, Ollila S, Nyström M,
Grimm AJ, Christodoulou J, Oetting WS, Greenblatt MS. Interpreting missense variants: Comparing
computational methods in human disease genes CDKN2A, MLH1, MSH2, MECP2, and Tyrosine (TYR).
Human Mutation (2007) 28 683-693.
Ferrer-Costa C, Orozco M, de la Cruz X. Sequence-based prediction of pathological mutations.
Proteins (2004) 57 811-819.
Friedman N, Pe’er I, Pupko T. A structural EM algorithm for phylogenetic inference. Journal of
computational biology (2002) 9 331-353.
González-Pérez A, López-Bigas N. Improving the assessment of the outcome of nonsynonymous SNVs
with a consensus deleteriousness score, Condel. The American Journal of Human Genetics (2011) 88
440-449.

Analysis of in silico tools for evaluating missense variants November 2012
14
Kumar P, Henikoff S, Ng PC. Predicting the effects of coding non-synonymous variants on protein
function using the SIFT algorithm. Nature Protocols. (2009) 4 (7) 1073-1081.
Li B, Krishnan VG, Mort ME, Xin F, Kamati KK, Cooper DN, Mooney SD, Radivojac P. Automated
inference of molecular mechanisms of disease from amino acid substitutions. Bioinformatics (2009) 25
(21) 2744-2750.
Reva B, Antipin Y, Sander C. Predicting the functional impact of protein mutations: Applications to
cancer genomics. Nucleic Acids Research. (2011) 39(17):e118.
Stone EA, Sidow A. Physicochemical constraint violation by missense substitution mediates
impairment of protein function and disease severity. Genome Research (2005) 15 978-986.
Tavtigian SV, Deffenbaugh AM, Yin L, Judkins T, Scholl T, Samollow PB, de Silva D, Zharkikh A,
Thomas A. Comprehensive statistical study of 452 BRCA1 missense substitutions with classification of
eight recurrent substitutions as neutral. J Med Genet. (2006) 43 (4) 295-305.
Warrender J. Optimization parameters for the assessment of the unclassified disease gene sequence
variants. Thesis (MRes.) (2010) The University of Newcastle.