Embed Size (px)
Citation preview
Analysis of Immunization Financing Indicators of the
WHO-UNICEF Joint Reporting Form (JRF), 2010-2014
Department of Immunization Vaccines and Biologicals, World Health Organization
February 2016
1
Acknowledgements
This report has been prepared by Nikhil Mandalia (WHO consultant) and Claudio Politi (WHO/HQ),
with input and contributions from WHO immunization financing regional focal points Amos Petu
(AFRO), Alexis Satoulou-Maleyo (AFRO), Jorge Mendoza Aldana (WPRO), Irtaza Chaudhri (EMRO),
Niyazi Osman Cakmak (EURO), Pushpa Wijesinghe (SEARO), Claudia Patricia Castillo (PAHO/AMRO)
and Cara Bess Janusz (PAHO/AMRO).
2
Contents Acknowledgements ................................................................................................................................. 1
List of Figures .......................................................................................................................................... 4
List of Tables ........................................................................................................................................... 5
List of abbreviations ................................................................................................................................ 6
Executive summary ................................................................................................................................. 7
Introduction ............................................................................................................................................ 8
Data and Methodology ......................................................................................................................... 10
Data Sources ..................................................................................................................................... 10
Identification and estimation of missing and inconsistent data ....................................................... 11
Country selection criteria .................................................................................................................. 13
Reporting Statistics ............................................................................................................................... 14
Global Analysis ...................................................................................................................................... 17
African Region ....................................................................................................................................... 25
Region of the Americas ......................................................................................................................... 32
Eastern Mediterranean Region ............................................................................................................. 39
European Region ................................................................................................................................... 46
South Eastern Asia Region .................................................................................................................... 52
Western Pacific Region ......................................................................................................................... 58
Gavi Countries ....................................................................................................................................... 65
Conclusion ............................................................................................................................................. 74
Annexes ................................................................................................................................................. 76
Annex 1 - African Region Tables ....................................................................................................... 76
AFR - Government expenditure on routine immunization (JRF 6540) ......................................... 76
AFR - Percentage of government expenditure on routine immunization funded by government
(JRF 6560) ...................................................................................................................................... 77
AFR - Government expenditure on vaccines (JRF 6510) ............................................................... 78
AFR – Total expenditure on vaccines (JRF 6520) .......................................................................... 80
AFR – Percentage of government expenditure on vaccines funded by government (JRF 6530) . 81
Annex 2 – Region of the Americas Tables ......................................................................................... 83
AMR – Government expenditure on routine immunization (JRF 6540) ....................................... 83
AMR – Percentage of government expenditure on routine immunization funded by government
(JRF 6560) ...................................................................................................................................... 84
AMR – Government expenditure on vaccines (JRF 6510) ............................................................. 85
AMR – Total expenditure on vaccines (JRF 6530) ......................................................................... 86
3
AMR – Percentage of vaccine expenditures funded by government (JRF 6530) .......................... 87
Annex 3 – Eastern Mediterranean Region Tables ............................................................................. 88
EMR – Government expenditure on routine immunization (JRF 6540) ....................................... 88
EMR – Percentage of total routine immunization expenditures funded by government (JRF 6560)
...................................................................................................................................................... 88
EMR – Government expenditure on vaccines (JRF 6510) ............................................................. 89
EMR – Total expenditure on vaccines (JRF 6520) ......................................................................... 90
EMR – Percentage of total expenditure on vaccines funded by government .............................. 90
Annex 4 – European Region Tables ................................................................................................... 92
EUR – Government expenditure on routine immunization (JRF 6540) ........................................ 92
EUR – Percentage of total expenditure on routine immunization funded by government (JRF
6560) ............................................................................................................................................. 93
EUR – Government expenditure on vaccines (JRF 6510) .............................................................. 95
EUR – Total expenditure on vaccines (JRF 6520) .......................................................................... 96
EUR – Percentage of total expenditure on vaccines funded by government ............................... 98
Annex 5 – South Eastern Asia Region Tables .................................................................................. 100
SEAR – Government expenditure on routine immunization (JRF 6540) ..................................... 100
SEAR – Percentage of government expenditure on routine immunization funded by government
(JRF 6560) .................................................................................................................................... 100
SEAR – Government expenditure on vaccines (JRF 6510) .......................................................... 101
SEAR – Total expenditure on vaccines (JRF 6520) ...................................................................... 101
SEAR – Percentage of total expenditure on vaccines funded by government (JRF 6530) .......... 102
Annex 6 – Western Pacific Region Tables ....................................................................................... 103
WPR – Government expenditure on routine immunization (JRF 6540) ..................................... 103
WPR – Percentage of total expenditure on routine immunization funded by government (JRF
6560) ........................................................................................................................................... 104
WPR – Government expenditure on vaccines (JRF 6510) ........................................................... 105
WPR – Total expenditure on vaccines (JRF 6520) ....................................................................... 106
WPR – Percentage of total expenditure on vaccines funded by government (JRF 6530) .......... 107
Annex 7 – International exchange rate comparison – government expenditure on routine
immunization per live birth............................................................................................................. 108
4
List of Figures
Figure 1 – Global – Government expenditure on RI ............................................................................. 19
Figure 2 – Global – Government expenditure on vaccines ................................................................... 22
Figure 3 – Global – Government expenditure on RI per live birth........................................................ 23
Figure 4 – Global – Total expenditure on vaccines per live birth ......................................................... 24
Figure 5 – African Region – Government expenditure on RI ................................................................ 26
Figure 6 – African Region - Government expenditure on vaccines ...................................................... 27
Figure 7 – African Region - Government expenditure on RI per live birth ........................................... 29
Figure 8 - African Region - Total expenditure on vaccines per live birth .............................................. 30
Figure 9 - Region of the Americas - Government expenditure on RI .................................................... 33
Figure 10 - Region of the Americas - Government expenditure on vaccines ....................................... 34
Figure 11 – Region of the Americas – Government expenditure on RI per live birth .......................... 36
Figure 12 – Region of the Americas – Total expenditure on vaccines per live birth ............................ 37
Figure 13 - Eastern Mediterranean Region - Government expenditure on RI...................................... 40
Figure 14 - Eastern Mediterranean Region - Government expenditure on vaccines ........................... 41
Figure 15 - Eastern Mediterranean Region - Government expenditure on RI per live birth ................ 43
Figure 16 - Eastern Mediterranean Region - Total expenditure on vaccines per live birth .................. 44
Figure 17 - European Region - Government expenditure on RI ........................................................... 47
Figure 18 - European Region - Government expenditure on vaccines ................................................. 48
Figure 19 - European region - Government expenditure on RI per live birth ....................................... 49
Figure 20 - European Region -Total expenditure on vaccines per live birth ......................................... 50
Figure 21 - South Eastern Asia Region - Government expenditure on RI ............................................. 53
Figure 22 - South Eastern Asia Region - Government expenditure on vaccines .................................. 54
Figure 23 - South Eastern Asia Region - Government expenditure on RI per live birth ....................... 55
Figure 24 - South Eastern Asia Region - Total expenditure on vaccines per live birth ......................... 56
Figure 25 - Western Pacific Region - Government expenditure on RI .................................................. 59
Figure 26 - Western Pacific Region - Government expenditure on vaccines ....................................... 60
Figure 27 - Western Pacific Region - Government expenditure on RI per live birth ............................ 62
Figure 28 - Western Pacific Region - Total expenditure on vaccines per live birth .............................. 63
Figure 29 - Gavi countries - Government expenditure on RI ................................................................ 66
Figure 30 - Gavi countries - Government expenditure on vaccines ..................................................... 67
Figure 31 - Gavi countries (Low income group) – Total expenditure on vaccines per live birth .......... 70
Figure 32 - Gavi countries (Phase 1 group) - Total expenditure on vaccines per live birth .................. 71
Figure 33 - Gavi countries (Phase 2 & 3 groups) - Total expenditure on vaccines per live birth .......... 72
5
List of Tables
Table 1 - No. of countries selected in each analysis group ................................................................... 13
Table 2 – Reporting Statistics – All Quantitative Indicators .................................................................. 14
Table 3 – Reporting Statistics - Government expenditure on vaccines (JRF 6510) .............................. 15
Table 4 – Reporting Statistics - Total expenditure on vaccines (JRF 6520) ........................................... 15
Table 5 – Reporting Statistics - Percentage of total expenditure on vaccines funded by government (JRF 6530) .............................................................................................................................................. 15
Table 6 – Reporting Statistics - Government expenditure on RI (JRF 6540) ......................................... 15
Table 7 – Reporting Statistics - Total expenditure on RI (JRF 6550) ..................................................... 15
Table 8 – Reporting Statistics - Percentage of total expenditure on RI funded by government (JRF 6560) ..................................................................................................................................................... 16
Table 9 – Global – Line item in national budget for vaccines ............................................................... 17
Table 10 – Global – Government Expenditure on Routine Immunization ............................................ 18
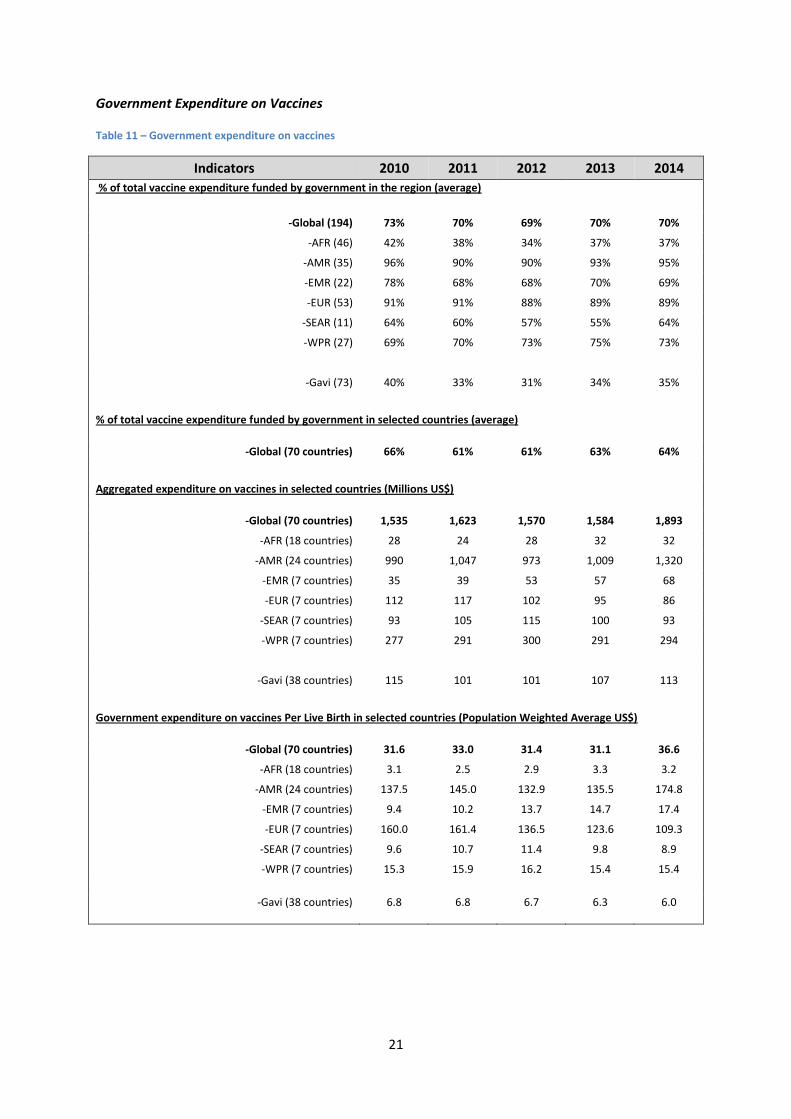
Table 11 – Government expenditure on vaccines ................................................................................ 21
Table 12 – African Region – Indicators summary ................................................................................. 25
Table 13 – African Region - Government expenditure on RI per live birth .......................................... 28
Table 14 – African Region – Reporting Statistics .................................................................................. 31
Table 15 – Region of the Americas – Indicators summary ................................................................... 32
Table 16 – Region of the Americas - Government expenditure on RI per live birth............................. 35
Table 17– Region of the Americas – Reporting statistics ..................................................................... 37
Table 18– Eastern Mediterranean Region – Indicators summary ........................................................ 39
Table 19 – Eastern Mediterranean Region - Government expenditure on routine immunization per live birth ................................................................................................................................................ 42
Table 20 - Eastern Mediterranean Region - Reporting statistics .......................................................... 45
Table 21 – European Region – Indicators summary ............................................................................. 46
Table 22 – European Region - Government expenditure on routine immunization per live birth ...... 48
Table 23 – European Region – Reporting statistics .............................................................................. 51
Table 24 – South Eastern Asia Region – Indicators summary ............................................................... 52
Table 25 - South Eastern Asia Region - Government expenditure on RI per live birth ......................... 55
Table 26 - South Eastern Asia Region – Reporting statistics ................................................................. 57
Table 27 – Western Pacific Region – Indicators summary ................................................................... 58
Table 28 - Western Pacific Region - Government expenditure on RI per live birth .............................. 61
Table 29 - Western Pacific Region – Reporting statistics ...................................................................... 64
Table 30 – Gavi countries – Indicators summary .................................................................................. 65
Table 31 - Government expenditure on RI per live birth by Gavi (2016) co-financing groupings ........ 68
Table 32 – Gavi countries – Distribution of defaulting countries ......................................................... 69
Table 33 - Gavi Phase 2 & 3 countries - Government expenditure on vaccines per live birth (17 Countries with full time series) ............................................................................................................. 73
Table 34 - Gavi Phase 2 & 3 countries - Total expenditure on vaccines per live birth (17 Countries with full time series) ............................................................................................................................. 73
6
List of abbreviations
AFR WHO African Region
AMR WHO Region of the Americas
cMYP comprehensive Multi-Year Plan
EIU The Economist Intelligence Unit
EMR WHO Eastern Mediterranean Region
EUR WHO European Region
HIC High Income Country
HPV Human Papillomavirus
JRF Joint Reporting Form
LIC Low Income Country
LMIC Lower Middle Income Country
PCV Pneumococcal Conjugate Vaccine
PWA Population Weighted Average
RI Routine Immunization
SEAR WHO South Eastern Asia Region
SHA System of Health Accounts
UMIC Upper Middle Income Country
WPR WHO Western Pacific Region
7
Executive summary
This report presents an analysis of the financing indicators included in the WHO-UNICEF Joint
Reporting Form (JRF) for the period 2010-2014.
By 2014 the majority of WHO member states had reported a specific line item in the national budget
for the purchasing of vaccines. The number of countries reporting the inclusion of the line item in
2014 was 173 (89% of all member states), additionally 90% (66 countries) of all Gavi eligible
countries reported the line item, an increase from 2010.
As governments increased their expenditure on vaccines over the five year period, the aggregated
expenditure of 70 countries with a full time-series increased from 1,535 million US$ in 2010 to 1,893
million US$ in 2014. Donor funds for vaccines also increased over the same period, resulting in a
decrease to the percentage of total vaccine costs funded by government, from 73% to 70%.
The aggregated government expenditure on routine immunization was calculated over the same 70
countries, with results showing an increase from 1,759 million US$ in 2010, to 2,164 million in 2014.
As routine immunization costs also capture the costs of vaccines, the growth in donor support for
vaccine costs has had an effect on the percentage of total routine immunization costs funded by
government, illustrated by a decrease from 75% in 2010 to 73% in 2014.
The results of the global analysis indicate that financial commitment to immunization is increasing,
as represented by the increasing domestic funds that governments are allocating for the use of
immunization. Despite this, Gavi and other donor support is growing at such a rate that is drowning
out the proportion of government funding for immunization, reducing the overall financial
ownership of countries.
Analysis of individual regions displayed a large disparity that exists between relatively richer and
poorer regions; the countries in both the European region and the region of the Americas show
greater self-sufficiency in supporting their own immunization costs, with over 90% of total routine
immunization costs being funded by government on average over the five years period. However,
the African region is the most reliant on donor support having only funded 50% of total routine
immunization costs with domestic funds in 2010; but this has fallen to 40% in 2014.
8
Introduction
In December 2010, global health leaders committed to making the following 10 years the Decade of
Vaccines (2011-2020), and in doing so initiated the Global Vaccine Action Plan (GVAP).
During the last 15 years significant progress has been made in expanding the reach of immunization
programmes globally. In spite of large increases to populations, immunization coverage remains on
an upward trend – playing a crucial part in reducing child mortality. Important too, are the increasing
number of vaccines being introduced into the immunization schedules of many countries, with
vaccines against Hepatitis B and Haemophilus type B integrated into routine operations in 176 and
192 countries respectively. Over a ten year period (2000-2010) it is estimated that the number of
deaths caused by traditional vaccine-preventable diseases (diphtheria, measles neonatal tetanus,
pertussis and poliomyelitis) fell by 0.9 million1.
In addition to the uptake of an increased amount of traditional vaccines, the past 15 years has also
witnessed the rise in availability of new and more sophisticated vaccines, such as pneumococcal
conjugate, Rotavirus and Human papillomavirus virus vaccine. Accelerated initiatives have been
implemented in order to shorten the historic time lag that has existed in the introduction of these
new vaccines between high and low income countries. However, with these new and underused
vaccines comes the burden of additional cost. These new vaccines come at a significantly higher cost
than traditional vaccines, and it is important to note that the burden is relatively greater for
countries that are classified as being Low and Lower-middle income, given the harsher fiscal
constraints they face in comparison to Upper-middle and High come countries.
As one of the most cost-effective public health interventions, countries are continually encouraged
to give priority to national immunization programs. The Global Vaccine Action Plan (GVAP) re-
iterates this, advocating country commitment and ownership of immunization as key tenets of
effective immunization systems. The GVAP provides the global framework for planning immunization
strategies over the period 2011 to 2020, and insists that the demonstration of commitment must
come through a combination of actions. This includes the setting of ambitious but attainable targets,
allocating sufficient domestic resources so that these targets can be reached, ensuring immunization
plans are well integrated into national health plans and additionally making sure that the
implementation of these plans are fully carried out.
Instrumental in providing support to low income countries is the Gavi Alliance, whose key goal is to
accelerate the uptake and use of underused and new vaccines. Gavi facilitate the introduction of
vaccines through co-financing arrangements with each country, reducing the financial encumbrance
on the country by taking the majority of the financial cost of the vaccines initially and then gradually
increasing the proportion paid by countries overtime.
1 Sources for estimates: measles and neonatal tetanus, in World Health Statistics 2012, Geneva, World Health
Organization, 2012; diphtheria and poliomyelitis, for 2000: http://www.who.int/entity/healthinfo/global_burden_disease/GHE_Deaths_2000_country.xls?ua=1 (accessed 10/02/2016)
9
Given the rise in immunization costs and the increased external support that countries are now able
to receive, many questions are now being raised over the sustainability of these immunization
programmes. Accordingly, the importance of government ownership over immunization planning,
budgeting and financing has been pushed to the foreground. Unfortunately, the abundance of donor
support, whilst no doubt beneficial, may inadvertently serve to undermine the long-term
sustainability of immunization services. The goal of self-sufficiency is apparent for countries;
however a misalignment of incentives could occur between the donor and country in the short-term
leading to governments treating the external aid as a substitution for, rather than an addition to,
government immunization spending. Additionally, if there is a smaller share of domestic resources
being mobilized relative to a large share of external resources, incentives for the governments to
address the inefficiencies or bottlenecks in the delivery of immunization services is somewhat
diminished. This shirking of responsibility may stunt the development of national capacity and will
likely hinder progress towards the building of proper governance, undermining the long-term
sustainability of the immunization programme.
Another key concern of low ownership is its potential distortive effect on the budgeting and
planning processes. As external funding often comes in the form of direct support for a
vaccine/project, it becomes difficult for governments to discern the exact flow of resources coming
into the country and with this comes uncertainty over what the outlay for expenditure on
immunization should be. This budgetary uncertainty can have a detrimental effect in the way of
producing discontinuous and unproductive delivery of immunization services. For example, if district
managers are unaware of their own budget allocations they then face an impossible task in their
processes of planning and implementation.
Given the concerns over long-term sustainability, ownership and commitment, Gavi and other
partners have implemented policies targeted at addressing these issues. Particularly important is the
Gavi co-financing policy for the introduction of new and underused vaccines, which looks to address
the issue of financial sustainability by gradually transferring financial ownership of vaccine costs over
a period of time according to the growth in income of the country.
Since 1998, the WHO-UNICEF Joint Reporting Form (JRF) mechanism has been collecting data on
immunization financing as part of a set of immunization indicators designed to measure
immunization coverage and system performance in WHO member states.
The financing indicators included in the JRF aim to capture the expenditure on routine immunization,
the expenditure on vaccines, the percentage financed by government and the existence of a national
budget line for the purchase of vaccines.
With the current focus on the sustainability of immunization programmes, the JRF financing
indicators analysis provides a good opportunity explore the global, regional and country trends in
financial ownership of, and commitment to immunization. This report presents an analysis of the
financing indicators for the period 2010-2014.
10
Data and Methodology
Data Sources
The main source of data is the WHO-UNICEF Joint Reporting Forms (JRF) reported by countries for
the period 2010-2014. JRF data is reported annually by countries, with this data then uploaded to
the JRF database which is available on the WHO Immunization surveillance, assessment and
monitoring website.2
The JRF includes one qualitative indicator and six immunization expenditure indicators:
The qualitative indicator is expressed in the form of a “Yes/No” answer:
o Availability of a specific line item in the national budget for the purchase of vaccines
used in routine immunization (JRF 6500).
Four indicators are expressed in absolute values (US$ or local currency):
o Government expenditure on vaccines used for routine immunization (JRF 6510).
o Total expenditure (from all sources) on vaccines used for routine immunization (JRF
6520).
o Government expenditure on routine immunization, including vaccines (JRF 6540).
o Total expenditure (from all sources) on routine immunization, including vaccines
(JRF 6550).
Two indicators are expressed in percentages (%):
o Percentage of vaccine expenditure used for routine immunization financed by
government (JRF 6530).
o Percentage of routine immunization expenditure financed by government (JRF 6560).
Data reported in local currency amounts has been converted to US dollars, using the annual average
exchange rate available on the Economic Intelligence Unit (EIU)3 database.
Three additional sources of data have been used in the preparation of this analysis: countries’
comprehensive Multi-Year Plans (cMYPs)4, multi-country immunization costing and financing studies
(EPIC)5 co-ordinated by the Bill and Melinda Gates Foundation, and the UN Population Division’s
database6. Both the cMYPs and EPIC studies were used to cross-check and in some cases supplement
countries’ reported JRF data (see section: Identification and estimation of missing and inconsistent
data). From the UN population data, information regarding the number of live births for each
country was extracted to allow for the financing indicators to be expressed in terms of per live birth
per year and additionally to provide data for population weighted average estimates. In addition,
Gross National Income (GNI) per capita data extracted from the World Bank World Development
2 http://apps.who.int/immunization_monitoring/globalsummary/indicators
3 https://eiu.bvdep.com/version-2015612/cgi/template.dll?product=101&user=ipaddress
4 http://www.who.int/immunization/programmes_systems/financing/countries/en/
5 http://www.immunizationcosting.org/
6 http://www.un.org/en/development/desa/population/publications/development/population-development-
database-2014.shtml
11
Indicators7 has been used for the aggregation of countries by Income group and Gavi co-financing
group.
Identification and estimation of missing and inconsistent data
Interest in the JRF financing indicators has increased over time alongside the increased focus on
financial sustainability of immunization. The utilization of the indicators has also improved with
countries paying closer attention to the emerging trends, as are the global community and the
World Health Assembly.
In spite of this, the completeness and accuracy of immunization and vaccine expenditure data for
the full range of countries is currently lacking; errors, inconsistencies and missing data frequently
identified when compiling and analysing the JRF data.
When the JRF data is reported, various techniques are used to assess its consistency and accuracy.
The following five rules of internal validity were used to assess the consistency of the country
reported data:
1. Total expenditure (from all sources) on routine immunization must be higher than total
expenditure (from all sources) on vaccines.
2. Total expenditure (from all sources) on routine immunization must higher than or equal to
government expenditure on routine immunization.
3. Total expenditure (from all sources) on vaccines must be higher than or equal to
government expenditure on vaccines.
4. Government expenditure on routine immunization must be higher than the government
expenditures on vaccines.
5. The reported percentage of government funding and the calculated percentage of
government funding (obtained by dividing the reported amount of government funding by
the total expenditure for both routine immunization and vaccine expenditures) must be
equal.
Reported expenditure figures were compared against Gavi disbursement and co-financing amounts
where data was available. The time-series of each of the indicators were thoroughly examined to
help recognise extremely divergent values reported from one year to the other, alongside mistakes
such as typing and currency reporting errors. These potential inconsistencies were recorded and
shared with member states through WHO regional offices as a mechanism of providing active
feedback, allowing for the member states to revise their JRF submissions. Due to this, data used in
previous JRF financing indicator analyses has been subject to change.
Inconsistent data points were either dropped or replaced with WHO estimates. In addition to
replacing data, estimates were used in place of missing data to help create a full time-series of
observations for countries. Of course, the use of estimates were used sparingly so as not to augment
the dataset too heavily. A number of methods different were used to develop the estimations:
7 http://data.worldbank.org/data-catalog/world-development-indicators
12
Estimations for the qualitative budget line item indicator were assessed based on the trends
observed over the time-series. If for a given year, a country had not reported data but had
done so for the other years, uniformly reporting “Yes” or “No”, and then the observed trend
was taken as sufficient reason for imputing missing values so as to continue the trend.
Estimations for the quantitative expenditure indicators were calculated as follows:
o If a country was missing one of the three expenditure figures (for either vaccines or
routine immunization) but reported the other two (i.e. missing government
expenditure, but reported total expenditure and percentage of total expenditure
funded by government) then the missing indicator would be calculated accordingly.
o By taking the average of available data i.e. if a country failed to report an indicator
for a certain year but managed to report for the previous and subsequent year, then
the average of those two data points may have been used to fill the missing
observation.
o By assuming the continuation of a previous long running time series trend, using
simple linear stepwise extrapolation i.e. if the subsequent 3 years of data was
available, then it would be used to calculate the 4th and missing year of data.
o By using data extracted from a country’s comprehensive Multi-Year Plan (cMYP)
Costing and Financing tool, if the missing data was that of the country’s baseline
expenditure year.
o By using data extracted from the BMGF EPIC studies.
The country response rates, number of inconsistencies and the number of estimations calculated
have been summarised and are elaborated on in the reporting statistics section.
13
Country selection criteria
To allow for consistent analysis over the time period, across countries in each region, and across the
regions themselves countries were only selected for analysis if they reported a full 5 year time series
(2010 to 2014) for each of the following three indicators:
Government expenditure on vaccines used in routine immunization.
Total expenditure (from all sources) on vaccines used in routine immunization.
Government expenditure on routine immunization, including vaccines.
By ensuring consistency amongst the countries in these 3 indicators, the analysis was able to make
use of the relationship that exists between the indicators in order to examine the expenditure trends
in absolute amounts as well as the manner in which the trends move in proportion to one and other.
The full time-series was also necessary so that population weighted averages could be calculated
using a consistent population over time. If a country were to fail to report for a given year but still
have its population weight taken into account, this would have created biased and deflated averages.
The following table presents the number of countries included in each of the regional analyses:
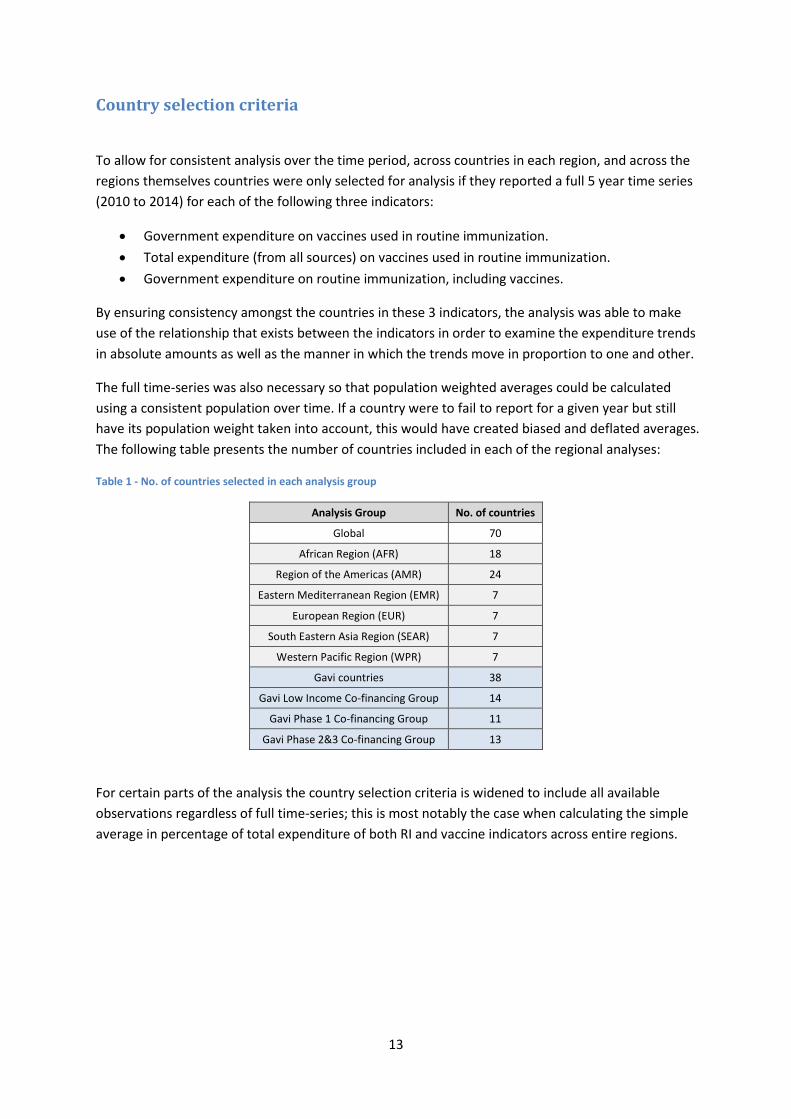
Table 1 - No. of countries selected in each analysis group
Analysis Group No. of countries
Global 70
African Region (AFR) 18
Region of the Americas (AMR) 24
Eastern Mediterranean Region (EMR) 7
European Region (EUR) 7
South Eastern Asia Region (SEAR) 7
Western Pacific Region (WPR) 7
Gavi countries 38
Gavi Low Income Co-financing Group 14
Gavi Phase 1 Co-financing Group 11
Gavi Phase 2&3 Co-financing Group 13
For certain parts of the analysis the country selection criteria is widened to include all available
observations regardless of full time-series; this is most notably the case when calculating the simple
average in percentage of total expenditure of both RI and vaccine indicators across entire regions.
14
Reporting Statistics
The following provides a brief analysis of the trends in reporting for each of the JRF financing
indicators. As stated earlier, the quality of country reporting for the JRF financing indicators has long
been an issue, with countries facing many challenges when looking to quantify immunization
expenditure data. In response to this, initiatives have been undertaken as a comprehensive effort to
strengthen local and regional capacities, active feedback, and use of immunization financing data;
these initiatives include the preparation and dissemination of a JRF guidance note by the Gavi
Immunization and Financing Sustainability (IF&S) Task Team. The guidance note provides countries
with comprehensive definitions for each indicator as well as assistance on how to collect, estimate,
validate and report the correct data.
Additionally, a JRF peer review workshop was organised in early April of 2014 for countries in East
and Southern Africa. This allowed for the sharing of best practice amongst country participants,
through the critical analysis 2013 JRF data, and additionally gave countries a platform to present
feedback to WHO regarding the clarity and general understanding of variables in the JRF template.
Particularly important was the fact that the workshop aided the development of capacity at county-
level, contributing to the improvement of reporting for future years.
The tables below summarise the reporting statistics for each of the JRF financing indicators over the
period 2010 to 2014.
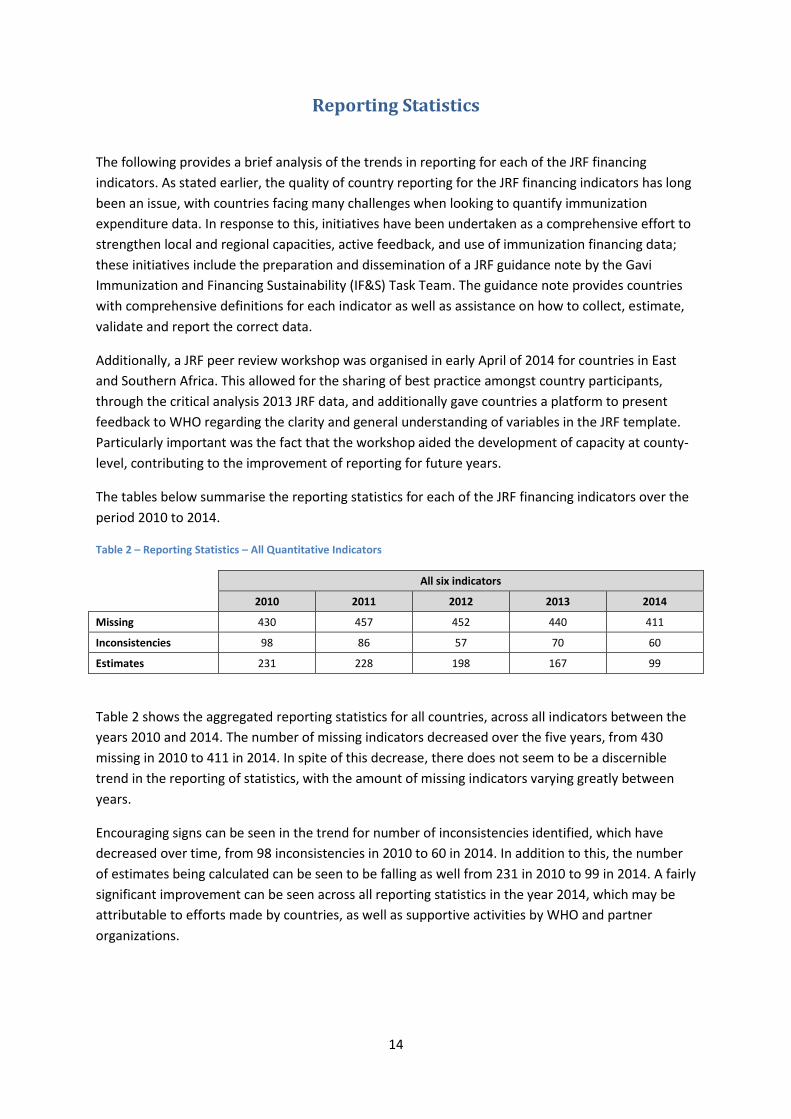
Table 2 – Reporting Statistics – All Quantitative Indicators
All six indicators
2010 2011 2012 2013 2014
Missing 430 457 452 440 411
Inconsistencies 98 86 57 70 60
Estimates 231 228 198 167 99
Table 2 shows the aggregated reporting statistics for all countries, across all indicators between the
years 2010 and 2014. The number of missing indicators decreased over the five years, from 430
missing in 2010 to 411 in 2014. In spite of this decrease, there does not seem to be a discernible
trend in the reporting of statistics, with the amount of missing indicators varying greatly between
years.
Encouraging signs can be seen in the trend for number of inconsistencies identified, which have
decreased over time, from 98 inconsistencies in 2010 to 60 in 2014. In addition to this, the number
of estimates being calculated can be seen to be falling as well from 231 in 2010 to 99 in 2014. A fairly
significant improvement can be seen across all reporting statistics in the year 2014, which may be
attributable to efforts made by countries, as well as supportive activities by WHO and partner
organizations.

15
Table 3 – Reporting Statistics - Government expenditure on vaccines (JRF 6510)
Government Expenditure on Vaccines (JRF 6510)
2010 2011 2012 2013 2014
Missing 46 56 56 49 52
Inconsistencies 17 13 8 12 12
Estimates 19 27 19 14 9
Table 4 – Reporting Statistics - Total expenditure on vaccines (JRF 6520)
Total Expenditure on Vaccines (from all sources) (JRF 6520)
2010 2011 2012 2013 2014
Missing 73 77 67 62 59
Inconsistencies 14 13 6 13 11
Estimates 40 41 29 24 12
Table 5 – Reporting Statistics - Percentage of total expenditure on vaccines funded by government (JRF 6530)
Percentage of Total Expenditure on Vaccines Funded by Government (JRF 6530)
2010 2011 2012 2013 2014
Missing 59 59 61 60 60
Inconsistencies 7 7 3 4 6
Estimates 41 40 37 34 33
Table 6 – Reporting Statistics - Government expenditure on RI (JRF 6540)
Government Expenditure on Routine Immunization (JRF 6540)
2010 2011 2012 2013 2014
Missing 86 95 93 96 84
Inconsistencies 25 20 21 15 14
Estimates 34 32 33 27 11
Table 7 – Reporting Statistics - Total expenditure on RI (JRF 6550)
Total Expenditure on Routine Immunization (from all sources) (JRF 6550)
2010 2011 2012 2013 2014
Missing 97 100 98 99 85
Inconsistencies 23 23 13 17 15
Estimates 40 38 30 26 9
16
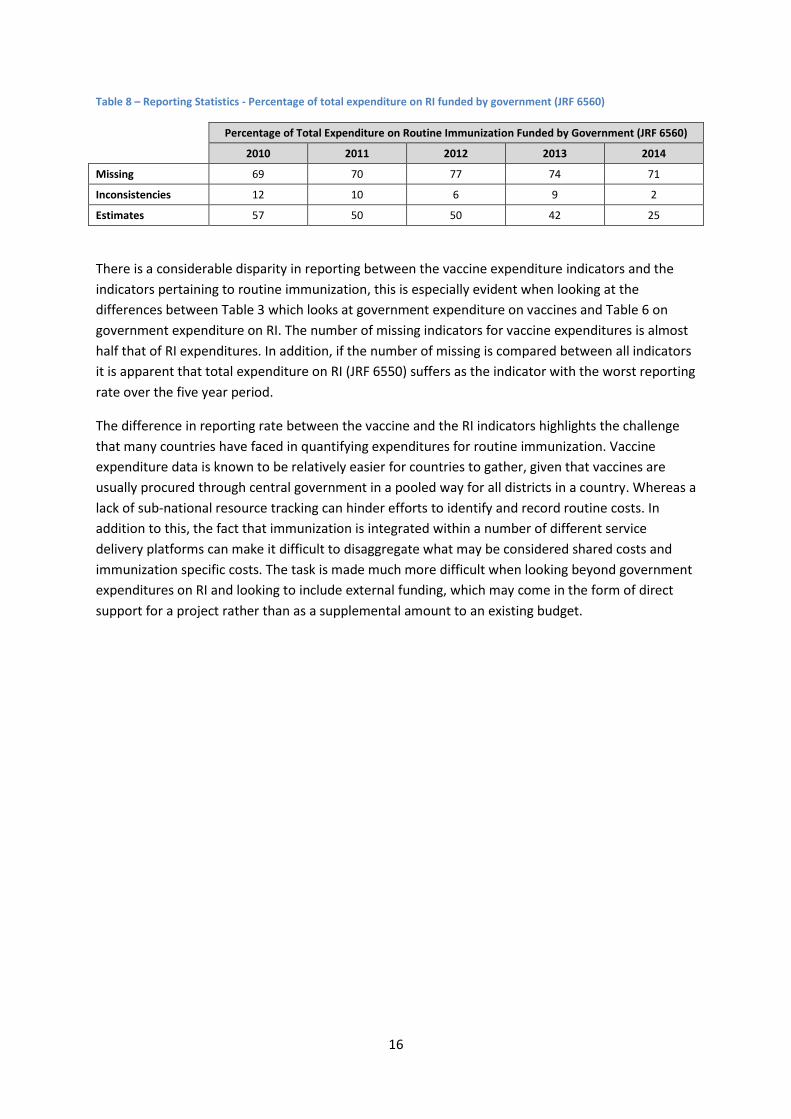
Table 8 – Reporting Statistics - Percentage of total expenditure on RI funded by government (JRF 6560)
Percentage of Total Expenditure on Routine Immunization Funded by Government (JRF 6560)
2010 2011 2012 2013 2014
Missing 69 70 77 74 71
Inconsistencies 12 10 6 9 2
Estimates 57 50 50 42 25
There is a considerable disparity in reporting between the vaccine expenditure indicators and the
indicators pertaining to routine immunization, this is especially evident when looking at the
differences between Table 3 which looks at government expenditure on vaccines and Table 6 on
government expenditure on RI. The number of missing indicators for vaccine expenditures is almost
half that of RI expenditures. In addition, if the number of missing is compared between all indicators
it is apparent that total expenditure on RI (JRF 6550) suffers as the indicator with the worst reporting
rate over the five year period.
The difference in reporting rate between the vaccine and the RI indicators highlights the challenge
that many countries have faced in quantifying expenditures for routine immunization. Vaccine
expenditure data is known to be relatively easier for countries to gather, given that vaccines are
usually procured through central government in a pooled way for all districts in a country. Whereas a
lack of sub-national resource tracking can hinder efforts to identify and record routine costs. In
addition to this, the fact that immunization is integrated within a number of different service
delivery platforms can make it difficult to disaggregate what may be considered shared costs and
immunization specific costs. The task is made much more difficult when looking beyond government
expenditures on RI and looking to include external funding, which may come in the form of direct
support for a project rather than as a supplemental amount to an existing budget.
17
Global Analysis
194 countries by income classification and Gavi eligibility:
Income Classification Group
Low Income Lower Middle
Income Upper Middle
Income High Income N/A Total
Total no. of countries 34 48 54 55 3 194
Of which are Gavi eligible 34 36 3 0 0 73
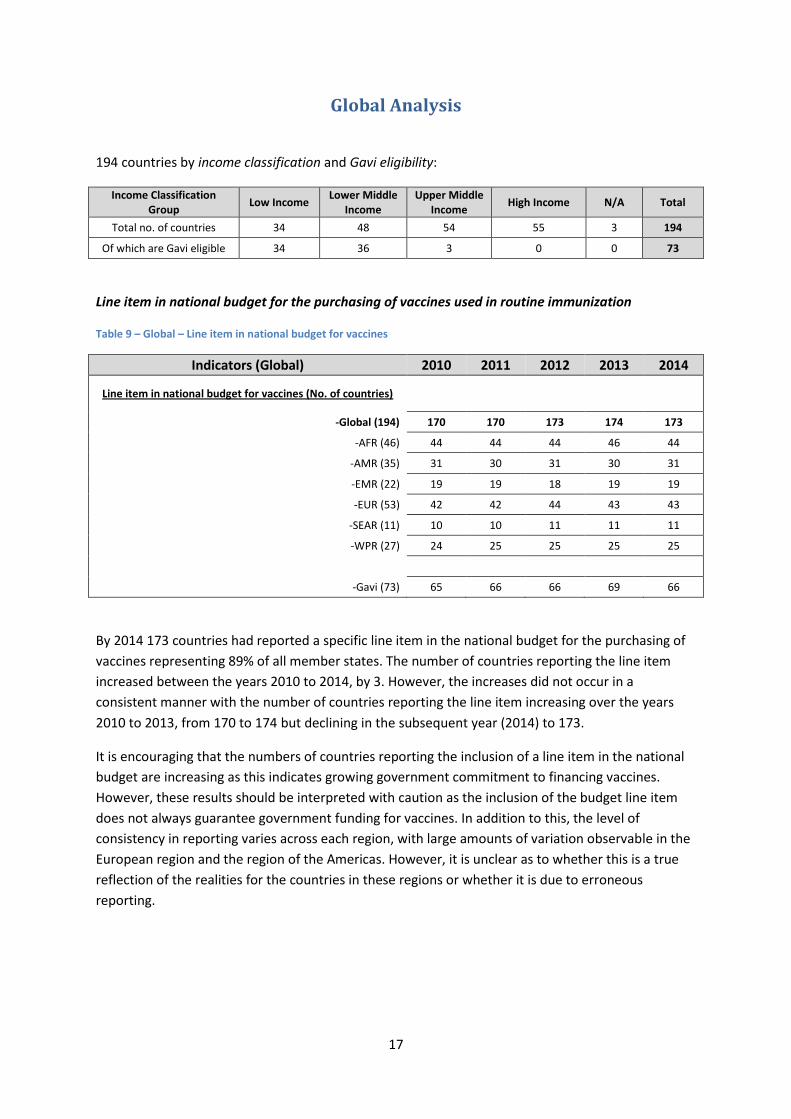
Line item in national budget for the purchasing of vaccines used in routine immunization
Table 9 – Global – Line item in national budget for vaccines
Indicators (Global) 2010 2011 2012 2013 2014
Line item in national budget for vaccines (No. of countries)
-Global (194) 170 170 173 174 173
-AFR (46) 44 44 44 46 44
-AMR (35) 31 30 31 30 31
-EMR (22) 19 19 18 19 19
-EUR (53) 42 42 44 43 43
-SEAR (11) 10 10 11 11 11
-WPR (27) 24 25 25 25 25
-Gavi (73) 65 66 66 69 66
By 2014 173 countries had reported a specific line item in the national budget for the purchasing of
vaccines representing 89% of all member states. The number of countries reporting the line item
increased between the years 2010 to 2014, by 3. However, the increases did not occur in a
consistent manner with the number of countries reporting the line item increasing over the years
2010 to 2013, from 170 to 174 but declining in the subsequent year (2014) to 173.
It is encouraging that the numbers of countries reporting the inclusion of a line item in the national
budget are increasing as this indicates growing government commitment to financing vaccines.
However, these results should be interpreted with caution as the inclusion of the budget line item
does not always guarantee government funding for vaccines. In addition to this, the level of
consistency in reporting varies across each region, with large amounts of variation observable in the
European region and the region of the Americas. However, it is unclear as to whether this is a true
reflection of the realities for the countries in these regions or whether it is due to erroneous
reporting.

18
Government Expenditures on Routine Immunization
Table 10 – Global – Government Expenditure on Routine Immunization
Indicators 2010 2011 2012 2013 2014
% of total RI funded by government in the region (average)
-Global (194) 75% 74% 74% 73% 73%
-AFR (46) 50% 48% 46% 40% 40%
-AMR (35) 95% 93% 94% 95% 95%
-EMR (22) 73% 70% 75% 73% 74%
-EUR (53) 92% 91% 91% 89% 92%
-SEAR (11) 69% 63% 62% 72% 63%
-WPR (27) 59% 65% 66% 71% 71%
-Gavi (73) 46% 42% 43% 42% 42%
% of total RI funded by government in selected countries (average)
-Global (70 countries) 68% 64% 66% 68% 67%
Aggregated expenditure on RI in selected countries (Millions US$)
-Global (70 countries) 1,759 1,843 1,821 1,816 2,164
-AFR (18 countries) 52 49 50 52 58
-AMR (24 countries) 1,076 1,128 1,070 1,076 1,419
-EMR (7 countries) 45 48 66 70 85
-EUR (7 countries) 147 159 149 144 136
-SEAR (7 countries) 125 128 146 147 123
-WPR (7 countries) 314 331 340 328 345
-Gavi (38 countries) 236 237 242 245 259
Government expenditure on RI Per Live Birth in selected countries (Population Weighted Average US$)
-Global (70 countries) 36.2 37.5 36.4 35.6 41.9
-AFR (18 countries) 5.7 5.3 5.3 5.3 5.8
-AMR (24 countries) 149.5 156.2 146.2 144.6 187.9
-EMR (7 countries) 12.1 12.6 17.2 17.9 21.7
-EUR (7 countries) 210.0 220.8 198.9 186.4 173.1
-SEAR (7 countries) 12.9 13.1 14.5 14.3 11.7
-WPR (7 countries) 17.3 18.1 18.3 17.4 18.0
-Gavi (38 countries) 10.1 10.0 10.0 9.9 10.4
19
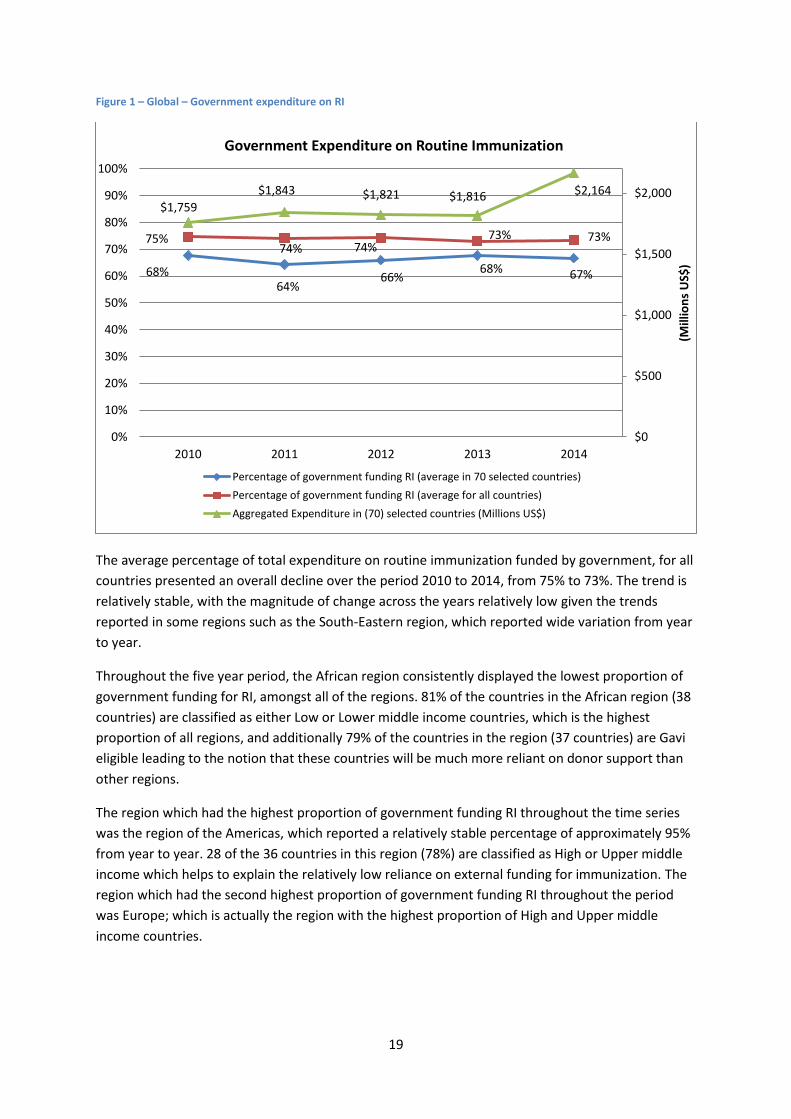
Figure 1 – Global – Government expenditure on RI
The average percentage of total expenditure on routine immunization funded by government, for all
countries presented an overall decline over the period 2010 to 2014, from 75% to 73%. The trend is
relatively stable, with the magnitude of change across the years relatively low given the trends
reported in some regions such as the South-Eastern region, which reported wide variation from year
to year.
Throughout the five year period, the African region consistently displayed the lowest proportion of
government funding for RI, amongst all of the regions. 81% of the countries in the African region (38
countries) are classified as either Low or Lower middle income countries, which is the highest
proportion of all regions, and additionally 79% of the countries in the region (37 countries) are Gavi
eligible leading to the notion that these countries will be much more reliant on donor support than
other regions.
The region which had the highest proportion of government funding RI throughout the time series
was the region of the Americas, which reported a relatively stable percentage of approximately 95%
from year to year. 28 of the 36 countries in this region (78%) are classified as High or Upper middle
income which helps to explain the relatively low reliance on external funding for immunization. The
region which had the second highest proportion of government funding RI throughout the period
was Europe; which is actually the region with the highest proportion of High and Upper middle
income countries.
68% 64%
66% 68% 67%
75% 74% 74%
73% 73%
$1,759
$1,843 $1,821 $1,816 $2,164
$0
$500
$1,000
$1,500
$2,000
0%
10%
20%
30%
40%
50%
60%
70%
80%
90%
100%
2010 2011 2012 2013 2014
(Mill
ion
s U
S$)
Government Expenditure on Routine Immunization
Percentage of government funding RI (average in 70 selected countries)
Percentage of government funding RI (average for all countries)
Aggregated Expenditure in (70) selected countries (Millions US$)
20
The aggregated government expenditures on RI for 70 selected countries8, with a full time-series,
increased between the years 2010 and 2014. The increase did not occur in a consistent manner
however, with the expenditure increasing initially from $1,759 million to $1,843 million between
2010 and 2011, after which it saw a slight decline over the next two years to $1,816 million (2013)
before a sharp increase in 2014 to $2,164 million. This substantial increase towards the end of the
five years was driven mainly by the region of the Americas who reported an increase in aggregate
expenditure of over $300 million between 2013 and 2014.
8 Cfr. Table 1
21
Government Expenditure on Vaccines
Table 11 – Government expenditure on vaccines
Indicators 2010 2011 2012 2013 2014
% of total vaccine expenditure funded by government in the region (average)
-Global (194) 73% 70% 69% 70% 70%
-AFR (46) 42% 38% 34% 37% 37%
-AMR (35) 96% 90% 90% 93% 95%
-EMR (22) 78% 68% 68% 70% 69%
-EUR (53) 91% 91% 88% 89% 89%
-SEAR (11) 64% 60% 57% 55% 64%
-WPR (27) 69% 70% 73% 75% 73%
-Gavi (73) 40% 33% 31% 34% 35%
% of total vaccine expenditure funded by government in selected countries (average)
-Global (70 countries) 66% 61% 61% 63% 64%
Aggregated expenditure on vaccines in selected countries (Millions US$)
-Global (70 countries) 1,535 1,623 1,570 1,584 1,893
-AFR (18 countries) 28 24 28 32 32
-AMR (24 countries) 990 1,047 973 1,009 1,320
-EMR (7 countries) 35 39 53 57 68
-EUR (7 countries) 112 117 102 95 86
-SEAR (7 countries) 93 105 115 100 93
-WPR (7 countries) 277 291 300 291 294
-Gavi (38 countries) 115 101 101 107 113
Government expenditure on vaccines Per Live Birth in selected countries (Population Weighted Average US$)
-Global (70 countries) 31.6 33.0 31.4 31.1 36.6
-AFR (18 countries) 3.1 2.5 2.9 3.3 3.2
-AMR (24 countries) 137.5 145.0 132.9 135.5 174.8
-EMR (7 countries) 9.4 10.2 13.7 14.7 17.4
-EUR (7 countries) 160.0 161.4 136.5 123.6 109.3
-SEAR (7 countries) 9.6 10.7 11.4 9.8 8.9
-WPR (7 countries) 15.3 15.9 16.2 15.4 15.4
-Gavi (38 countries) 6.8 6.8 6.7 6.3 6.0

22
Figure 2 – Global – Government expenditure on vaccines
The average percentage of government funding for vaccines declined over the period between 2010
and 2014, from 73% to 70%. The trend is somewhat irregular as the percentage initially drops from
73% in 2010 to 70% in 2011 and further to 69% the following year; but rises to 70% in 2013 and then
remains at 70% for 2014. Whilst the trend fluctuates, the magnitude of change between years is
relatively low and so it can be said that the percentage of government funding vaccines remains
stable throughout the five year period.
The region of the Americas reported the highest proportion of government funding vaccines
throughout the years of the analysis, with the European region not far behind. Once again these
results are to be expected given the high and upper middle income status which the majority of the
countries in these regions reside in, leading to only a small amount of Gavi support in the region and
little reliance on external funding for vaccines.
The African region reported the lowest proportion of government funding for vaccines, with a
decline reported over the five years from 42% to 37%. Given the high amount of Gavi support in this
region, it would be expected that the proportion of government funding would be relatively lower
than other regions.
The Gavi eligible countries display a decreasing trend in percentage of vaccines funded by
government over the five years. Whilst this would seem to be counterintuitive to the Gavi co-
financing mechanism, it is most likely due to the large number of Low and Lower middle income
countries who are still introducing new and underused vaccines into their immunization
programmes, but are paying relatively low amounts due to co-financing arrangements still being in
their infancy.
66% 61% 61%
63% 64%
73% 70%
69%
70% 70%
$1,535 $1,623
$1,570 $1,584 $1,893
$0
$200
$400
$600
$800
$1,000
$1,200
$1,400
$1,600
$1,800
0%
10%
20%
30%
40%
50%
60%
70%
80%
90%
100%
2010 2011 2012 2013 2014
(Mill
ion
s U
S$)
Government Expenditure on Vaccines
Percentage of government funding vaccines (average in 70 selected countries)
Percentage of government funding vaccines (average over all countries)
Aggregated Expenditure in (70) selected countries (Millions US$)
23
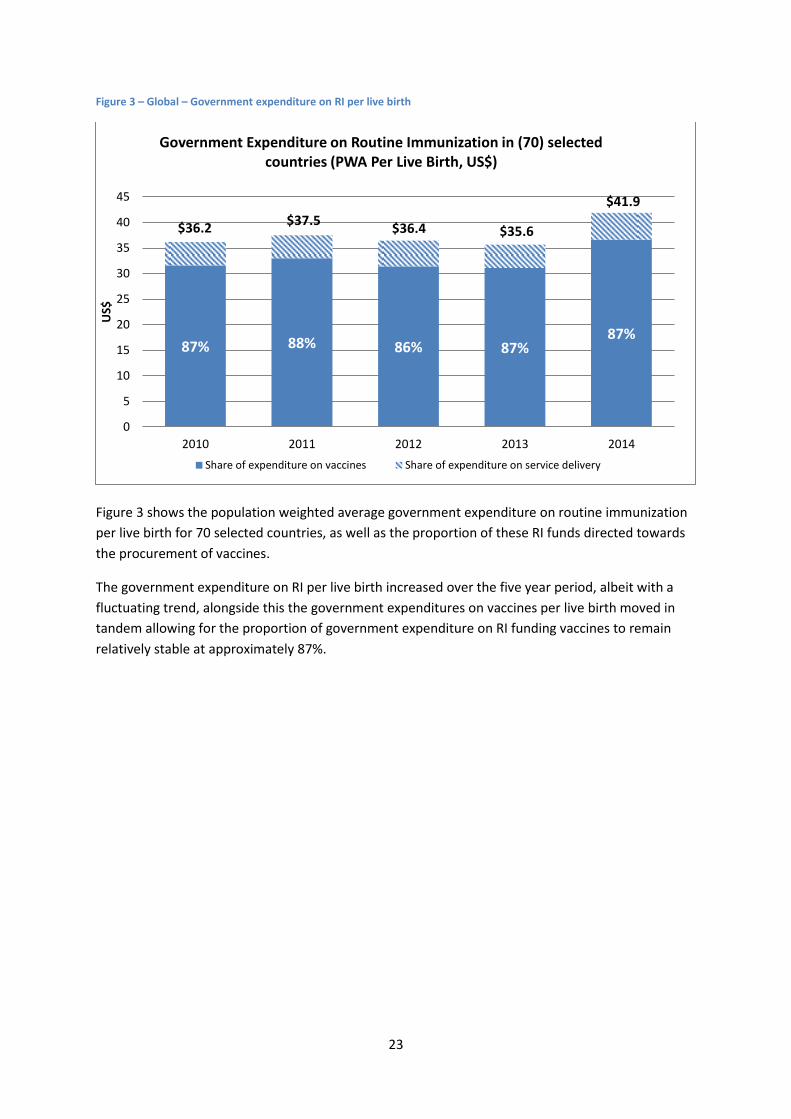
Figure 3 – Global – Government expenditure on RI per live birth
Figure 3 shows the population weighted average government expenditure on routine immunization
per live birth for 70 selected countries, as well as the proportion of these RI funds directed towards
the procurement of vaccines.
The government expenditure on RI per live birth increased over the five year period, albeit with a
fluctuating trend, alongside this the government expenditures on vaccines per live birth moved in
tandem allowing for the proportion of government expenditure on RI funding vaccines to remain
relatively stable at approximately 87%.
87% 88% 86% 87% 87%
$36.2 $37.5
$36.4 $35.6
$41.9
0
5
10
15
20
25
30
35
40
45
2010 2011 2012 2013 2014
US$
Government Expenditure on Routine Immunization in (70) selected countries (PWA Per Live Birth, US$)
Share of expenditure on vaccines Share of expenditure on service delivery
24
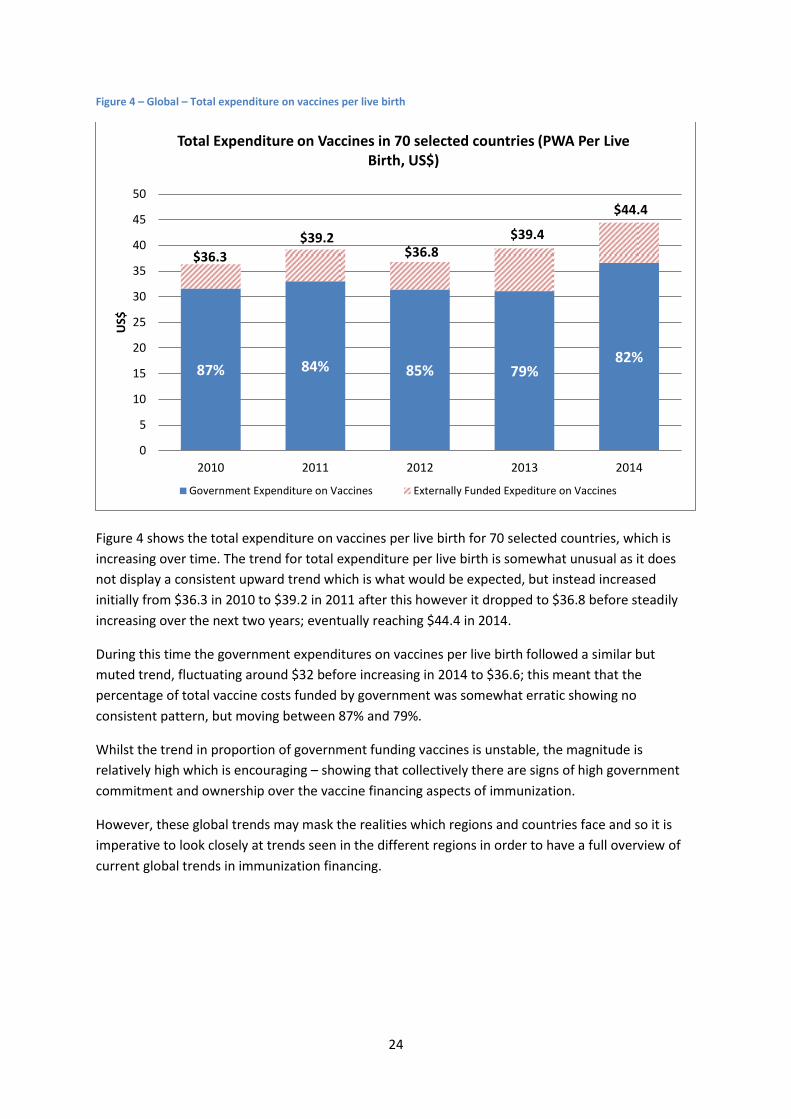
Figure 4 – Global – Total expenditure on vaccines per live birth
Figure 4 shows the total expenditure on vaccines per live birth for 70 selected countries, which is
increasing over time. The trend for total expenditure per live birth is somewhat unusual as it does
not display a consistent upward trend which is what would be expected, but instead increased
initially from $36.3 in 2010 to $39.2 in 2011 after this however it dropped to $36.8 before steadily
increasing over the next two years; eventually reaching $44.4 in 2014.
During this time the government expenditures on vaccines per live birth followed a similar but
muted trend, fluctuating around $32 before increasing in 2014 to $36.6; this meant that the
percentage of total vaccine costs funded by government was somewhat erratic showing no
consistent pattern, but moving between 87% and 79%.
Whilst the trend in proportion of government funding vaccines is unstable, the magnitude is
relatively high which is encouraging – showing that collectively there are signs of high government
commitment and ownership over the vaccine financing aspects of immunization.
However, these global trends may mask the realities which regions and countries face and so it is
imperative to look closely at trends seen in the different regions in order to have a full overview of
current global trends in immunization financing.
87% 84% 85% 79% 82%
$36.3
$39.2 $36.8
$39.4
$44.4
0
5
10
15
20
25
30
35
40
45
50
2010 2011 2012 2013 2014
US$
Total Expenditure on Vaccines in 70 selected countries (PWA Per Live Birth, US$)
Government Expenditure on Vaccines Externally Funded Expediture on Vaccines

25
African Region
47 countries by income classification and Gavi eligibility:
Income Classification Group Low Income Lower Middle Income Upper Middle Income High Income Total
Total no. of countries 25 13 8 1 47
Of which are Gavi eligible 25 11 1 0 37
Table 12 – African Region – Indicators summary
Indicators 2010 2011 2012 2013 2014
Line item in national budget for vaccines (No. of countries) 44 44 44 46 44
Government Routine Immunization Expenditures:
% of total RI funded by government in the region (average) 50% 48% 46% 40% 40%
% of total RI funded by government in (18) selected countries (average)
40% 35% 37% 36% 33%
Aggregated Expenditure in (18) selected countries (Millions US$) 52 49 50 52 58
Expenditure Per Live Birth in (18) selected countries (PWA US$) 5.7 5.3 5.3 5.3 5.8
Government Vaccine Expenditures:
% of total vaccines funded by government in the region (average) 42% 38% 34% 37% 37%
% of total vaccines funded by government in (18) selected
countries (average) 32% 24% 25% 27% 29%
Aggregated Expenditure in (18) selected countries (Millions US$) 28 24 28 32 32
Expenditure Per Live Birth in (18) selected countries (PWA US$) 3.1 2.5 2.9 3.3 3.2
DTP3 Coverage:
DTP3 Coverage in the region (%) 72 72 72 76 77
DTP3 Coverage in (18) selected countries (%) 75 77 80 79 82
Introduction of New and Underused Vaccines (Cumulative no. of countries):
Rotavirus 1 1 5 10 24
PCV 3 12 18 26 33
HPV 0 1 2 2 4
The 18 countries selected for analysis are listed in Table 12.
Most of the countries in the African region report having line items in their national budgets for
purchasing vaccines. The trend in number of countries reporting a line item for the purchase of
vaccines appears relatively stable over the period 2010-2014 at 44 countries, however this masks
the unstable trends that a number of countries are reporting; it appears that whilst some countries
are reporting to adding the line item in the national budget, others are dropping it in equal measure.
Two countries reported to dropping the line item between 2013 and 2014, they were The Congo and
South Africa.
26
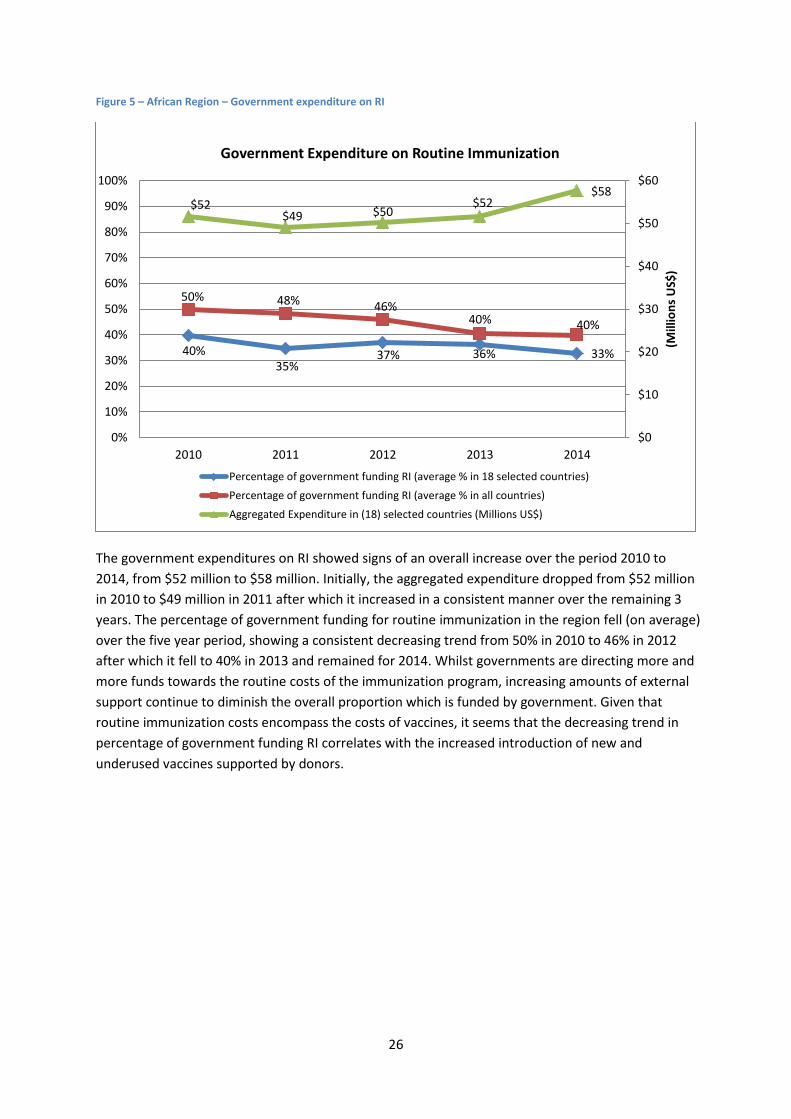
Figure 5 – African Region – Government expenditure on RI
The government expenditures on RI showed signs of an overall increase over the period 2010 to
2014, from $52 million to $58 million. Initially, the aggregated expenditure dropped from $52 million
in 2010 to $49 million in 2011 after which it increased in a consistent manner over the remaining 3
years. The percentage of government funding for routine immunization in the region fell (on average)
over the five year period, showing a consistent decreasing trend from 50% in 2010 to 46% in 2012
after which it fell to 40% in 2013 and remained for 2014. Whilst governments are directing more and
more funds towards the routine costs of the immunization program, increasing amounts of external
support continue to diminish the overall proportion which is funded by government. Given that
routine immunization costs encompass the costs of vaccines, it seems that the decreasing trend in
percentage of government funding RI correlates with the increased introduction of new and
underused vaccines supported by donors.
40% 35%
37% 36% 33%
50% 48% 46% 40% 40%
$52 $49 $50
$52 $58
$0
$10
$20
$30
$40
$50
$60
0%
10%
20%
30%
40%
50%
60%
70%
80%
90%
100%
2010 2011 2012 2013 2014
(Mill
ion
s U
S$)
Government Expenditure on Routine Immunization
Percentage of government funding RI (average % in 18 selected countries)
Percentage of government funding RI (average % in all countries)
Aggregated Expenditure in (18) selected countries (Millions US$)
27
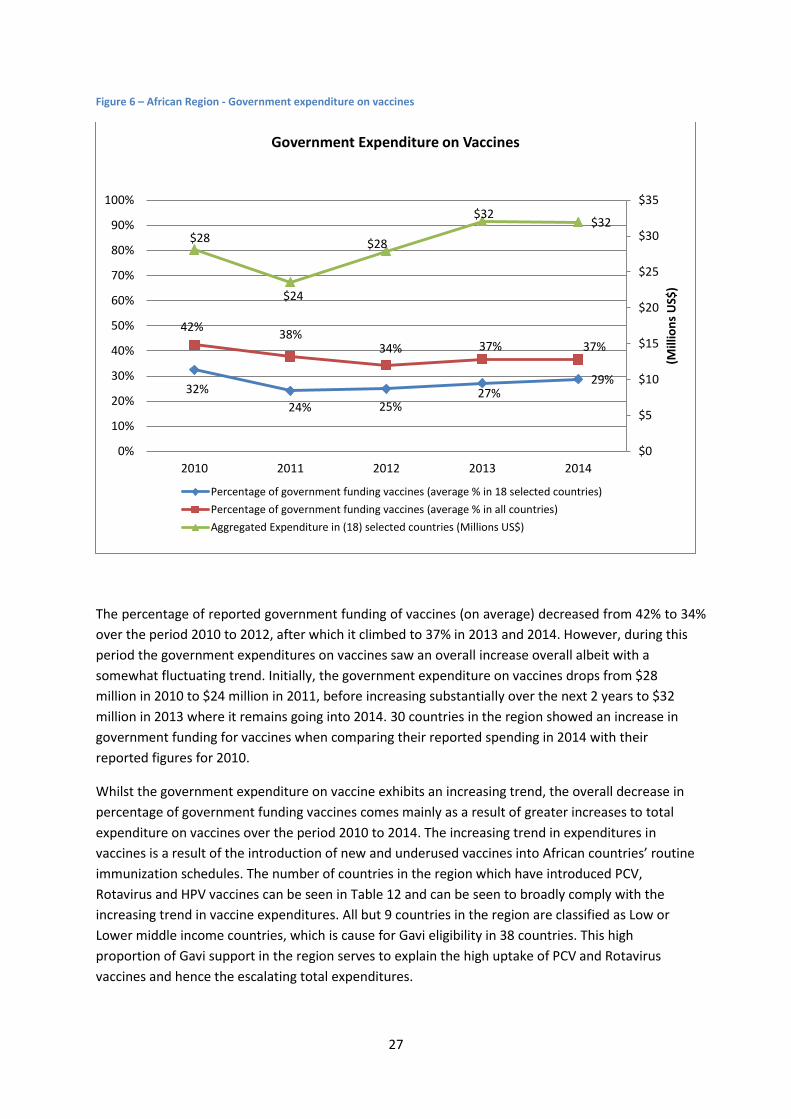
Figure 6 – African Region - Government expenditure on vaccines
The percentage of reported government funding of vaccines (on average) decreased from 42% to 34%
over the period 2010 to 2012, after which it climbed to 37% in 2013 and 2014. However, during this
period the government expenditures on vaccines saw an overall increase overall albeit with a
somewhat fluctuating trend. Initially, the government expenditure on vaccines drops from $28
million in 2010 to $24 million in 2011, before increasing substantially over the next 2 years to $32
million in 2013 where it remains going into 2014. 30 countries in the region showed an increase in
government funding for vaccines when comparing their reported spending in 2014 with their
reported figures for 2010.
Whilst the government expenditure on vaccine exhibits an increasing trend, the overall decrease in
percentage of government funding vaccines comes mainly as a result of greater increases to total
expenditure on vaccines over the period 2010 to 2014. The increasing trend in expenditures in
vaccines is a result of the introduction of new and underused vaccines into African countries’ routine
immunization schedules. The number of countries in the region which have introduced PCV,
Rotavirus and HPV vaccines can be seen in Table 12 and can be seen to broadly comply with the
increasing trend in vaccine expenditures. All but 9 countries in the region are classified as Low or
Lower middle income countries, which is cause for Gavi eligibility in 38 countries. This high
proportion of Gavi support in the region serves to explain the high uptake of PCV and Rotavirus
vaccines and hence the escalating total expenditures.
32%
24% 25% 27%
29%
42% 38%
34% 37% 37%
$28
$24
$28
$32 $32
$0
$5
$10
$15
$20
$25
$30
$35
0%
10%
20%
30%
40%
50%
60%
70%
80%
90%
100%
2010 2011 2012 2013 2014
(Mill
ion
s U
S$)
Government Expenditure on Vaccines
Percentage of government funding vaccines (average % in 18 selected countries)
Percentage of government funding vaccines (average % in all countries)
Aggregated Expenditure in (18) selected countries (Millions US$)
28
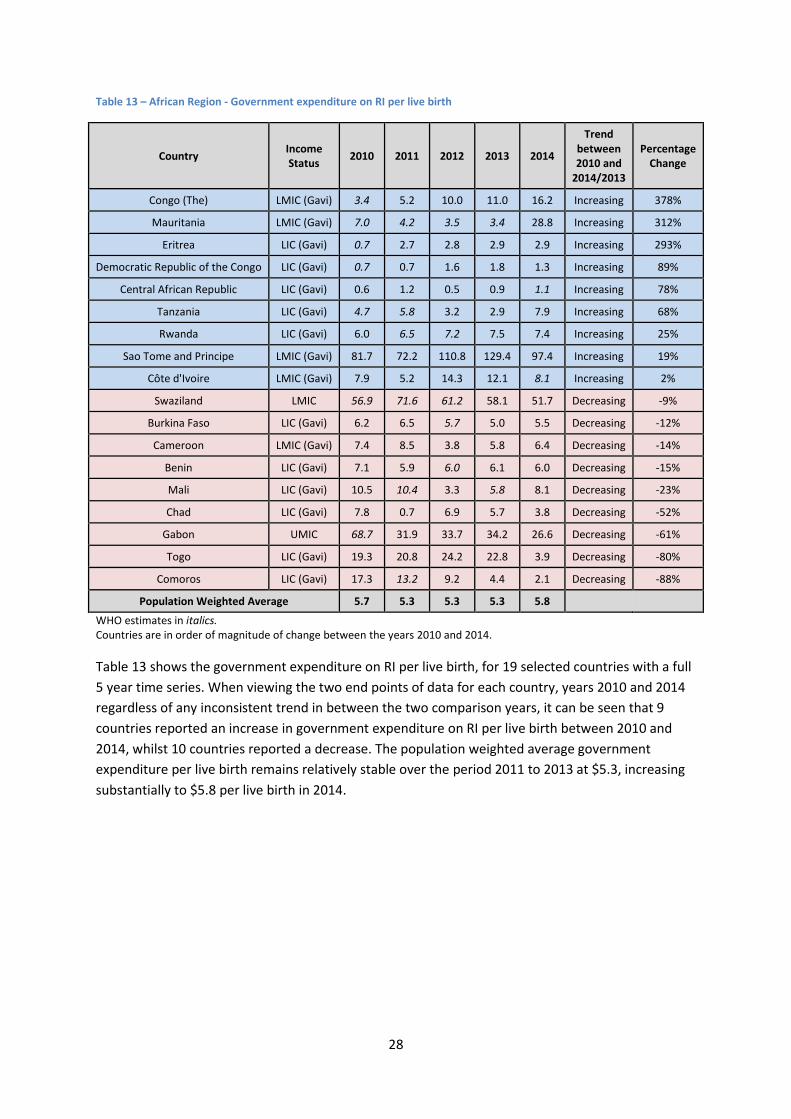
Table 13 – African Region - Government expenditure on RI per live birth
Country Income Status
2010 2011 2012 2013 2014
Trend between 2010 and
2014/2013
Percentage Change
Congo (The) LMIC (Gavi) 3.4 5.2 10.0 11.0 16.2 Increasing 378%
Mauritania LMIC (Gavi) 7.0 4.2 3.5 3.4 28.8 Increasing 312%
Eritrea LIC (Gavi) 0.7 2.7 2.8 2.9 2.9 Increasing 293%
Democratic Republic of the Congo LIC (Gavi) 0.7 0.7 1.6 1.8 1.3 Increasing 89%
Central African Republic LIC (Gavi) 0.6 1.2 0.5 0.9 1.1 Increasing 78%
Tanzania LIC (Gavi) 4.7 5.8 3.2 2.9 7.9 Increasing 68%
Rwanda LIC (Gavi) 6.0 6.5 7.2 7.5 7.4 Increasing 25%
Sao Tome and Principe LMIC (Gavi) 81.7 72.2 110.8 129.4 97.4 Increasing 19%
Côte d'Ivoire LMIC (Gavi) 7.9 5.2 14.3 12.1 8.1 Increasing 2%
Swaziland LMIC 56.9 71.6 61.2 58.1 51.7 Decreasing -9%
Burkina Faso LIC (Gavi) 6.2 6.5 5.7 5.0 5.5 Decreasing -12%
Cameroon LMIC (Gavi) 7.4 8.5 3.8 5.8 6.4 Decreasing -14%
Benin LIC (Gavi) 7.1 5.9 6.0 6.1 6.0 Decreasing -15%
Mali LIC (Gavi) 10.5 10.4 3.3 5.8 8.1 Decreasing -23%
Chad LIC (Gavi) 7.8 0.7 6.9 5.7 3.8 Decreasing -52%
Gabon UMIC 68.7 31.9 33.7 34.2 26.6 Decreasing -61%
Togo LIC (Gavi) 19.3 20.8 24.2 22.8 3.9 Decreasing -80%
Comoros LIC (Gavi) 17.3 13.2 9.2 4.4 2.1 Decreasing -88%
Population Weighted Average 5.7 5.3 5.3 5.3 5.8
WHO estimates in italics. Countries are in order of magnitude of change between the years 2010 and 2014.
Table 13 shows the government expenditure on RI per live birth, for 19 selected countries with a full
5 year time series. When viewing the two end points of data for each country, years 2010 and 2014
regardless of any inconsistent trend in between the two comparison years, it can be seen that 9
countries reported an increase in government expenditure on RI per live birth between 2010 and
2014, whilst 10 countries reported a decrease. The population weighted average government
expenditure per live birth remains relatively stable over the period 2011 to 2013 at $5.3, increasing
substantially to $5.8 per live birth in 2014.
29
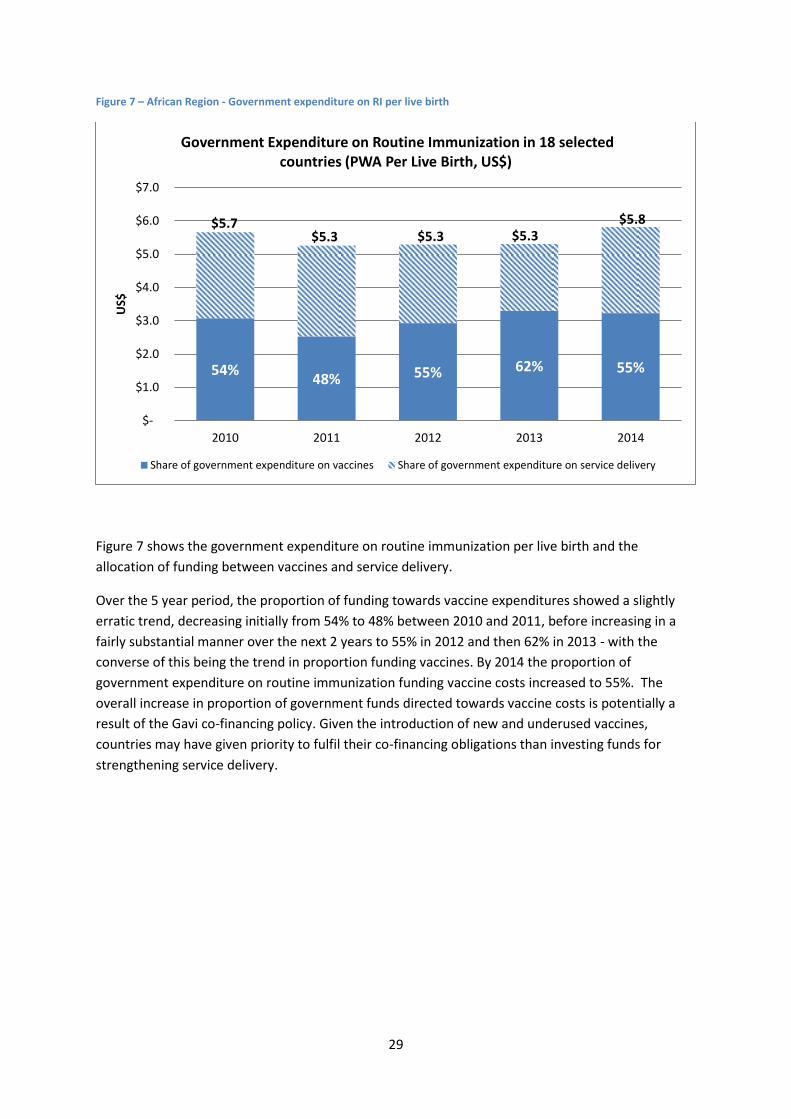
Figure 7 – African Region - Government expenditure on RI per live birth
Figure 7 shows the government expenditure on routine immunization per live birth and the
allocation of funding between vaccines and service delivery.
Over the 5 year period, the proportion of funding towards vaccine expenditures showed a slightly
erratic trend, decreasing initially from 54% to 48% between 2010 and 2011, before increasing in a
fairly substantial manner over the next 2 years to 55% in 2012 and then 62% in 2013 - with the
converse of this being the trend in proportion funding vaccines. By 2014 the proportion of
government expenditure on routine immunization funding vaccine costs increased to 55%. The
overall increase in proportion of government funds directed towards vaccine costs is potentially a
result of the Gavi co-financing policy. Given the introduction of new and underused vaccines,
countries may have given priority to fulfil their co-financing obligations than investing funds for
strengthening service delivery.
54% 48% 55% 62% 55%
$5.7 $5.3 $5.3 $5.3
$5.8
$-
$1.0
$2.0
$3.0
$4.0
$5.0
$6.0
$7.0
2010 2011 2012 2013 2014
US$
Government Expenditure on Routine Immunization in 18 selected countries (PWA Per Live Birth, US$)
Share of government expenditure on vaccines Share of government expenditure on service delivery
30
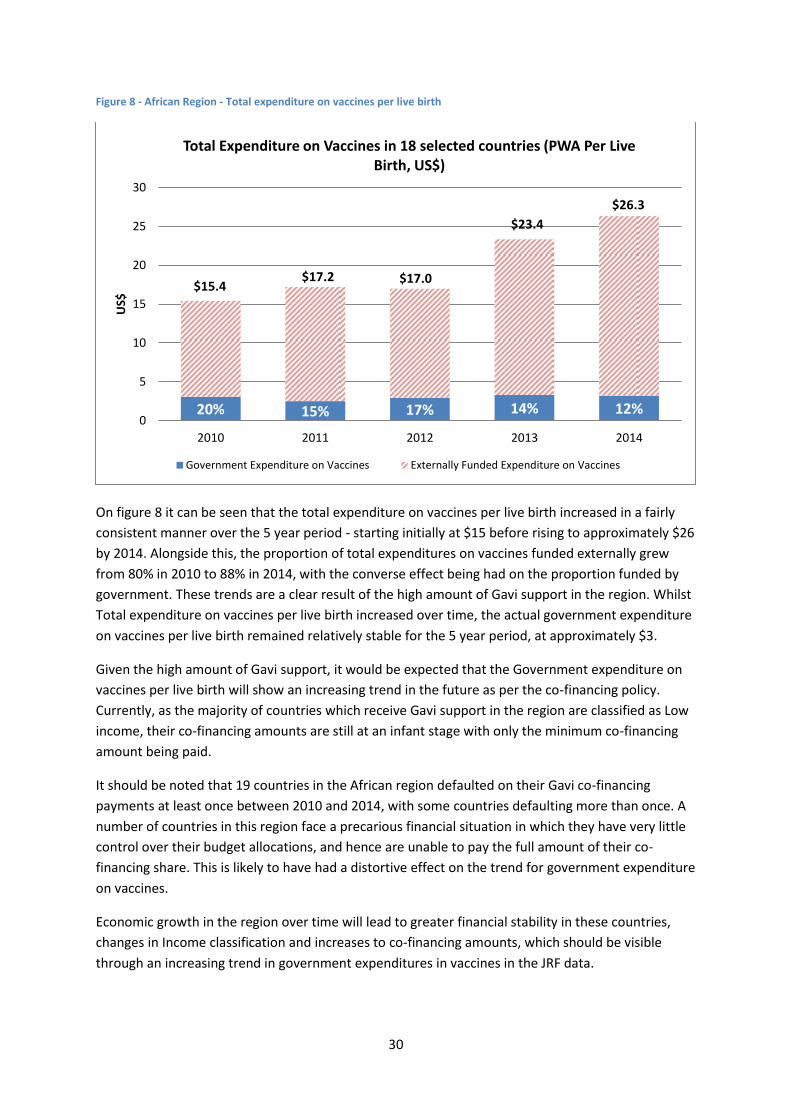
Figure 8 - African Region - Total expenditure on vaccines per live birth
On figure 8 it can be seen that the total expenditure on vaccines per live birth increased in a fairly
consistent manner over the 5 year period - starting initially at $15 before rising to approximately $26
by 2014. Alongside this, the proportion of total expenditures on vaccines funded externally grew
from 80% in 2010 to 88% in 2014, with the converse effect being had on the proportion funded by
government. These trends are a clear result of the high amount of Gavi support in the region. Whilst
Total expenditure on vaccines per live birth increased over time, the actual government expenditure
on vaccines per live birth remained relatively stable for the 5 year period, at approximately $3.
Given the high amount of Gavi support, it would be expected that the Government expenditure on
vaccines per live birth will show an increasing trend in the future as per the co-financing policy.
Currently, as the majority of countries which receive Gavi support in the region are classified as Low
income, their co-financing amounts are still at an infant stage with only the minimum co-financing
amount being paid.
It should be noted that 19 countries in the African region defaulted on their Gavi co-financing
payments at least once between 2010 and 2014, with some countries defaulting more than once. A
number of countries in this region face a precarious financial situation in which they have very little
control over their budget allocations, and hence are unable to pay the full amount of their co-
financing share. This is likely to have had a distortive effect on the trend for government expenditure
on vaccines.
Economic growth in the region over time will lead to greater financial stability in these countries,
changes in Income classification and increases to co-financing amounts, which should be visible
through an increasing trend in government expenditures in vaccines in the JRF data.
20% 15% 17% 14% 12%
$15.4 $17.2 $17.0
$23.4
$26.3
0
5
10
15
20
25
30
2010 2011 2012 2013 2014
US$
Total Expenditure on Vaccines in 18 selected countries (PWA Per Live Birth, US$)
Government Expenditure on Vaccines Externally Funded Expenditure on Vaccines
31
Reporting Statistics
Table 14 – African Region – Reporting Statistics
All indicators (276)
2010 2011 2012 2013 2014
Missing 71 (26%) 66 (24%) 81 (29%) 56 (20%) 43 (16%)
Inconsistencies 20 (7%) 28 (10%) 18 (7%) 18 (7%) 18 (7%)
Estimates 42 (15%) 51 (18%) 46 (17%) 23 (8%) 7 (3%)
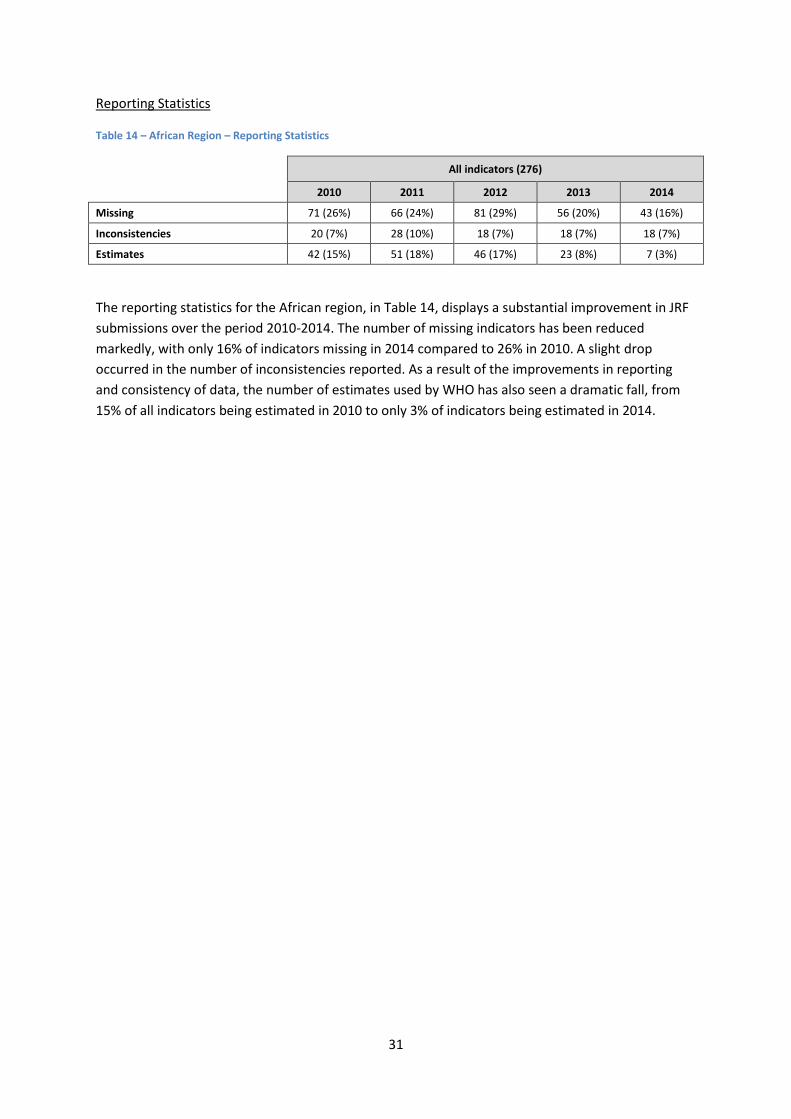
The reporting statistics for the African region, in Table 14, displays a substantial improvement in JRF
submissions over the period 2010-2014. The number of missing indicators has been reduced
markedly, with only 16% of indicators missing in 2014 compared to 26% in 2010. A slight drop
occurred in the number of inconsistencies reported. As a result of the improvements in reporting
and consistency of data, the number of estimates used by WHO has also seen a dramatic fall, from
15% of all indicators being estimated in 2010 to only 3% of indicators being estimated in 2014.

32
Region of the Americas
35 countries by income classification and Gavi eligibility:
Income Classification Group Low Income Lower Middle
Income Upper Middle
Income High Income Total
Total no. of countries 1 7 18 10 36
Of which are Gavi eligible 1 0 4 1 5
Table 15 – Region of the Americas – Indicators summary
Indicators 2010 2011 2012 2013 2014 Line item in national budget for vaccines (No. of
countries) 31 30 31 30 31
Government Routine Immunization Expenditures:
% of total RI funded by government in the region (average)
95% 93% 94% 95% 95%
% of total RI funded by government in (24) selected countries (average)
94% 91% 92% 94% 94%
Aggregated Expenditure in (24) selected countries (Millions US$)
1,076 1,128 1,070 1,076 1,419
Expenditure Per Live Birth in (24) selected countries (PWA US$)
149.5 156.2 146.2 144.6 187.9
Government Vaccine Expenditures:
% of total vaccines funded by government in the region (average)
96% 90% 90% 93% 95%
% of total vaccines funded by government in (24) selected countries (average)
95% 91% 91% 92% 94%
Aggregated Expenditure in (24) selected countries (Millions US$)
990 1,047 973 1,009 1,320
Expenditure Per Live Birth in (24) selected countries (PWA US$)
137.5 145.0 132.9 135.5 174.8
DTP3 Coverage:
DTP3 Coverage in the region (%) 94% 93% 94% 91% 90%
DTP3 Coverage in (24) selected countries (%) 94% 92% 92% 92% 90%
Introduction of New and Underused Vaccines (Cumulative no. of countries):
Rotavirus 15 15 16 16 17
PCV 13 17 21 22 24
HPV 3 5 7 11 15
The 24 countries selected for analysis are listed in Table 16
Of the 35 countries in the region of the Americas, 31 have reported to having a line item in the
national budget for the procurement of vaccines in 2014. Prior to this, the countries reporting a line
item fluctuated between 31 and 30 over the five year period (2010-2014). This trend is not due to
any single country, but rather a group of countries. Belize reported to dropping the line item in 2011,
33
before re-adding in 2014. Dominica reintroduced the line item in 2012 having dropped it in 2010,
and Saint Lucia dropped the line item in 2013. Canada and the USA are the only two countries to in
the region which have not reported any data for this indicator, whilst Haiti is the only country to
have never reported having a national budget line item for vaccines.
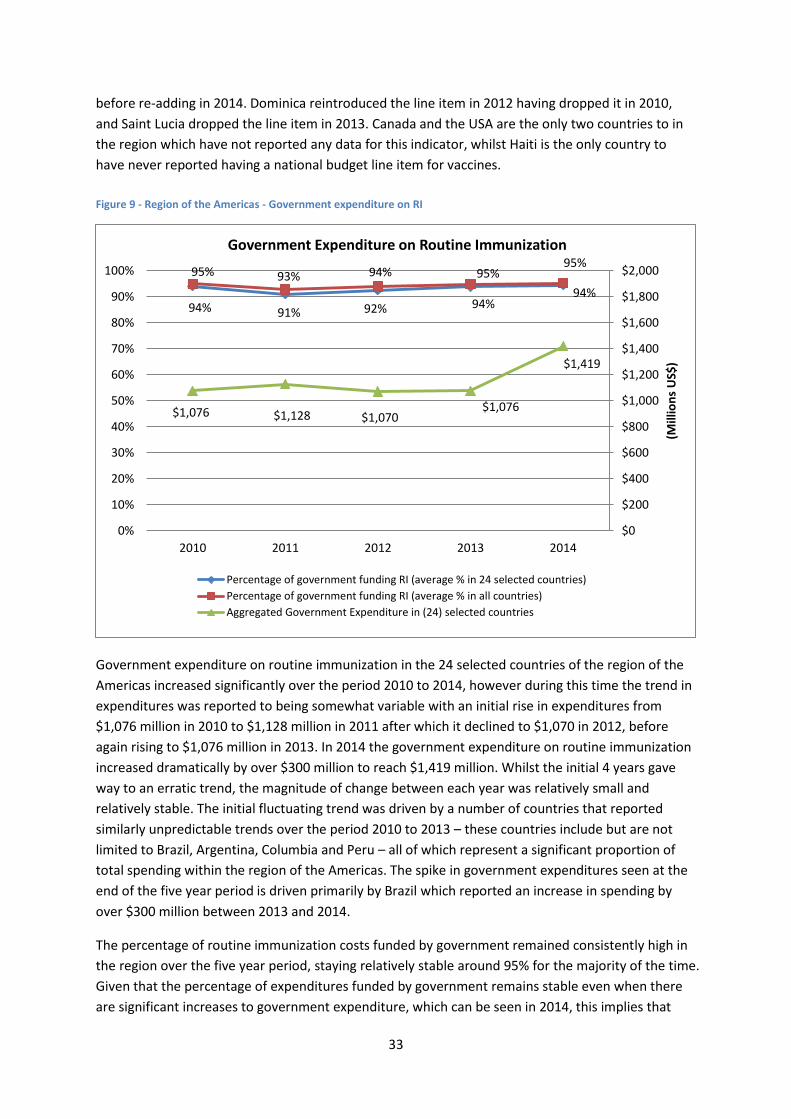
Figure 9 - Region of the Americas - Government expenditure on RI
Government expenditure on routine immunization in the 24 selected countries of the region of the
Americas increased significantly over the period 2010 to 2014, however during this time the trend in
expenditures was reported to being somewhat variable with an initial rise in expenditures from
$1,076 million in 2010 to $1,128 million in 2011 after which it declined to $1,070 in 2012, before
again rising to $1,076 million in 2013. In 2014 the government expenditure on routine immunization
increased dramatically by over $300 million to reach $1,419 million. Whilst the initial 4 years gave
way to an erratic trend, the magnitude of change between each year was relatively small and
relatively stable. The initial fluctuating trend was driven by a number of countries that reported
similarly unpredictable trends over the period 2010 to 2013 – these countries include but are not
limited to Brazil, Argentina, Columbia and Peru – all of which represent a significant proportion of
total spending within the region of the Americas. The spike in government expenditures seen at the
end of the five year period is driven primarily by Brazil which reported an increase in spending by
over $300 million between 2013 and 2014.
The percentage of routine immunization costs funded by government remained consistently high in
the region over the five year period, staying relatively stable around 95% for the majority of the time.
Given that the percentage of expenditures funded by government remains stable even when there
are significant increases to government expenditure, which can be seen in 2014, this implies that
94% 91% 92% 94% 94%
95% 93% 94% 95% 95%
$1,076 $1,128 $1,070 $1,076
$1,419
$0
$200
$400
$600
$800
$1,000
$1,200
$1,400
$1,600
$1,800
$2,000
0%
10%
20%
30%
40%
50%
60%
70%
80%
90%
100%
2010 2011 2012 2013 2014
(Mill
ion
s U
S$)
Government Expenditure on Routine Immunization
Percentage of government funding RI (average % in 24 selected countries)
Percentage of government funding RI (average % in all countries)
Aggregated Government Expenditure in (24) selected countries
34
total expenditure on routine immunization moves in unison with government expenditure, with
each increasing or decreasing in parallel.
Figure 10 - Region of the Americas - Government expenditure on vaccines
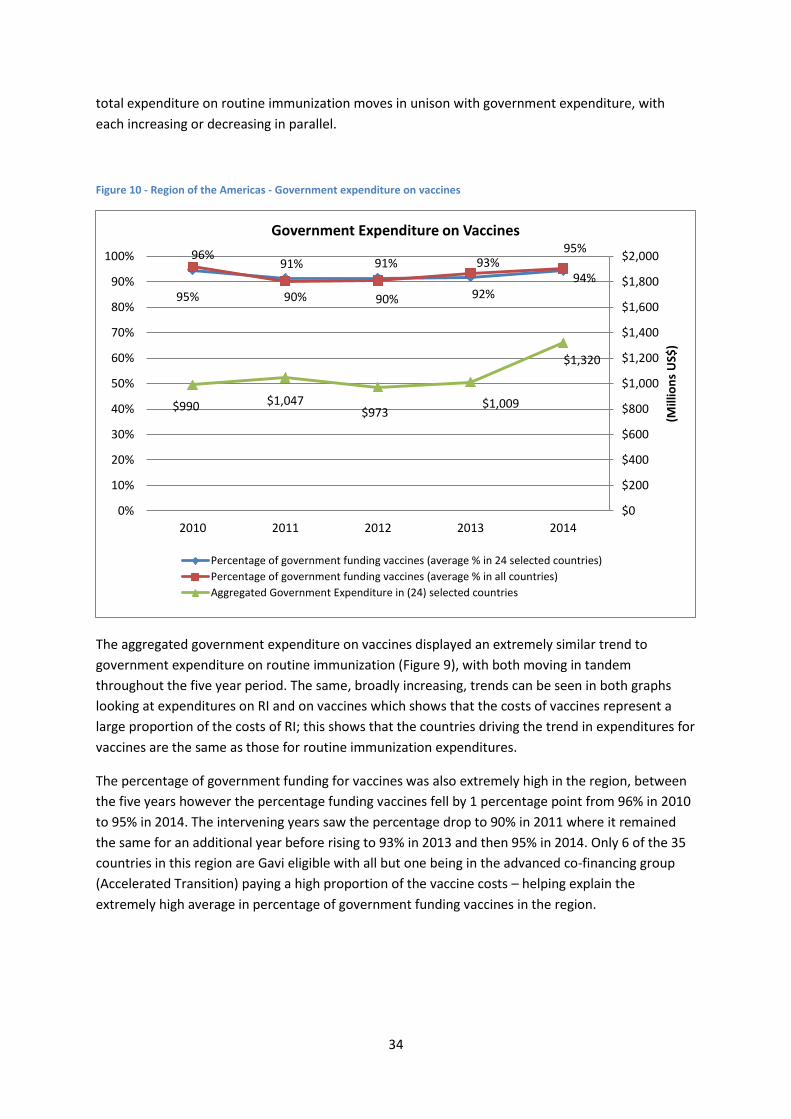
The aggregated government expenditure on vaccines displayed an extremely similar trend to
government expenditure on routine immunization (Figure 9), with both moving in tandem
throughout the five year period. The same, broadly increasing, trends can be seen in both graphs
looking at expenditures on RI and on vaccines which shows that the costs of vaccines represent a
large proportion of the costs of RI; this shows that the countries driving the trend in expenditures for
vaccines are the same as those for routine immunization expenditures.
The percentage of government funding for vaccines was also extremely high in the region, between
the five years however the percentage funding vaccines fell by 1 percentage point from 96% in 2010
to 95% in 2014. The intervening years saw the percentage drop to 90% in 2011 where it remained
the same for an additional year before rising to 93% in 2013 and then 95% in 2014. Only 6 of the 35
countries in this region are Gavi eligible with all but one being in the advanced co-financing group
(Accelerated Transition) paying a high proportion of the vaccine costs – helping explain the
extremely high average in percentage of government funding vaccines in the region.
95%
91% 91%
92% 94%
96%
90% 90%
93% 95%
$990 $1,047 $973
$1,009
$1,320
$0
$200
$400
$600
$800
$1,000
$1,200
$1,400
$1,600
$1,800
$2,000
0%
10%
20%
30%
40%
50%
60%
70%
80%
90%
100%
2010 2011 2012 2013 2014
(Mill
ion
s U
S$)
Government Expenditure on Vaccines
Percentage of government funding vaccines (average % in 24 selected countries)
Percentage of government funding vaccines (average % in all countries)
Aggregated Government Expenditure in (24) selected countries
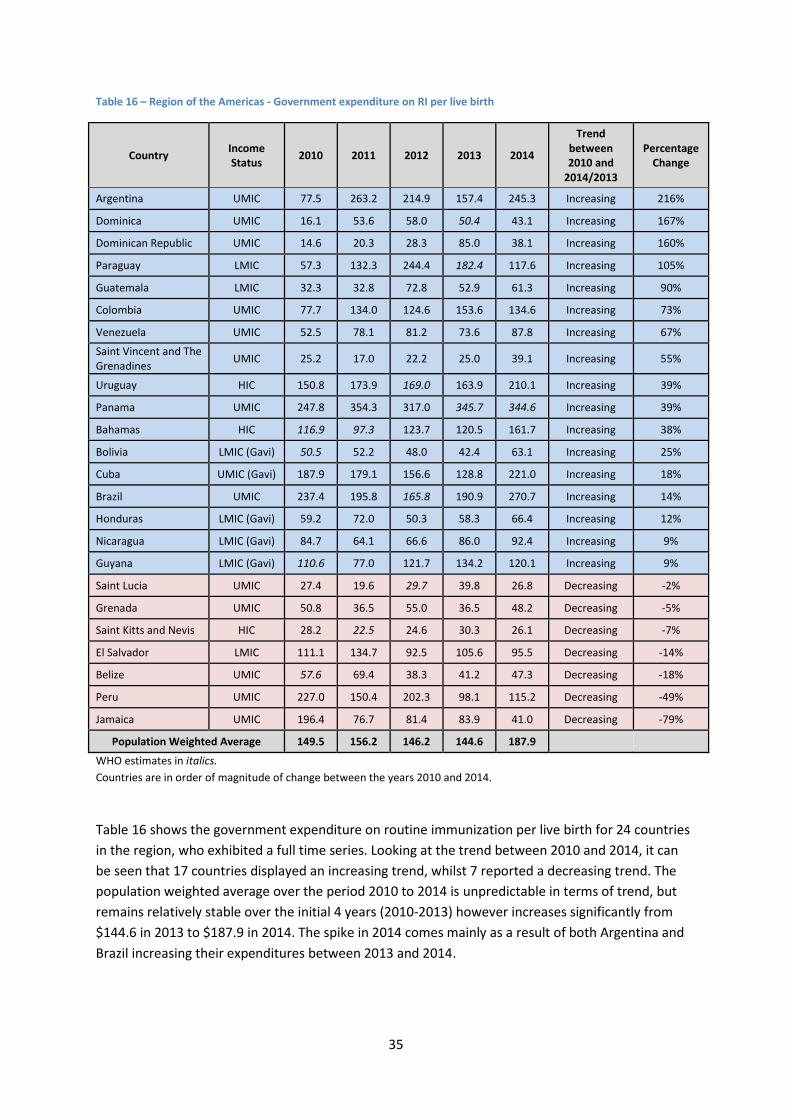
35
Table 16 – Region of the Americas - Government expenditure on RI per live birth
Country Income Status
2010 2011 2012 2013 2014
Trend between 2010 and
2014/2013
Percentage Change
Argentina UMIC 77.5 263.2 214.9 157.4 245.3 Increasing 216%
Dominica UMIC 16.1 53.6 58.0 50.4 43.1 Increasing 167%
Dominican Republic UMIC 14.6 20.3 28.3 85.0 38.1 Increasing 160%
Paraguay LMIC 57.3 132.3 244.4 182.4 117.6 Increasing 105%
Guatemala LMIC 32.3 32.8 72.8 52.9 61.3 Increasing 90%
Colombia UMIC 77.7 134.0 124.6 153.6 134.6 Increasing 73%
Venezuela UMIC 52.5 78.1 81.2 73.6 87.8 Increasing 67%
Saint Vincent and The Grenadines
UMIC 25.2 17.0 22.2 25.0 39.1 Increasing 55%
Uruguay HIC 150.8 173.9 169.0 163.9 210.1 Increasing 39%
Panama UMIC 247.8 354.3 317.0 345.7 344.6 Increasing 39%
Bahamas HIC 116.9 97.3 123.7 120.5 161.7 Increasing 38%
Bolivia LMIC (Gavi) 50.5 52.2 48.0 42.4 63.1 Increasing 25%
Cuba UMIC (Gavi) 187.9 179.1 156.6 128.8 221.0 Increasing 18%
Brazil UMIC 237.4 195.8 165.8 190.9 270.7 Increasing 14%
Honduras LMIC (Gavi) 59.2 72.0 50.3 58.3 66.4 Increasing 12%
Nicaragua LMIC (Gavi) 84.7 64.1 66.6 86.0 92.4 Increasing 9%
Guyana LMIC (Gavi) 110.6 77.0 121.7 134.2 120.1 Increasing 9%
Saint Lucia UMIC 27.4 19.6 29.7 39.8 26.8 Decreasing -2%
Grenada UMIC 50.8 36.5 55.0 36.5 48.2 Decreasing -5%
Saint Kitts and Nevis HIC 28.2 22.5 24.6 30.3 26.1 Decreasing -7%
El Salvador LMIC 111.1 134.7 92.5 105.6 95.5 Decreasing -14%
Belize UMIC 57.6 69.4 38.3 41.2 47.3 Decreasing -18%
Peru UMIC 227.0 150.4 202.3 98.1 115.2 Decreasing -49%
Jamaica UMIC 196.4 76.7 81.4 83.9 41.0 Decreasing -79%
Population Weighted Average 149.5 156.2 146.2 144.6 187.9
WHO estimates in italics.
Countries are in order of magnitude of change between the years 2010 and 2014.
Table 16 shows the government expenditure on routine immunization per live birth for 24 countries
in the region, who exhibited a full time series. Looking at the trend between 2010 and 2014, it can
be seen that 17 countries displayed an increasing trend, whilst 7 reported a decreasing trend. The
population weighted average over the period 2010 to 2014 is unpredictable in terms of trend, but
remains relatively stable over the initial 4 years (2010-2013) however increases significantly from
$144.6 in 2013 to $187.9 in 2014. The spike in 2014 comes mainly as a result of both Argentina and
Brazil increasing their expenditures between 2013 and 2014.
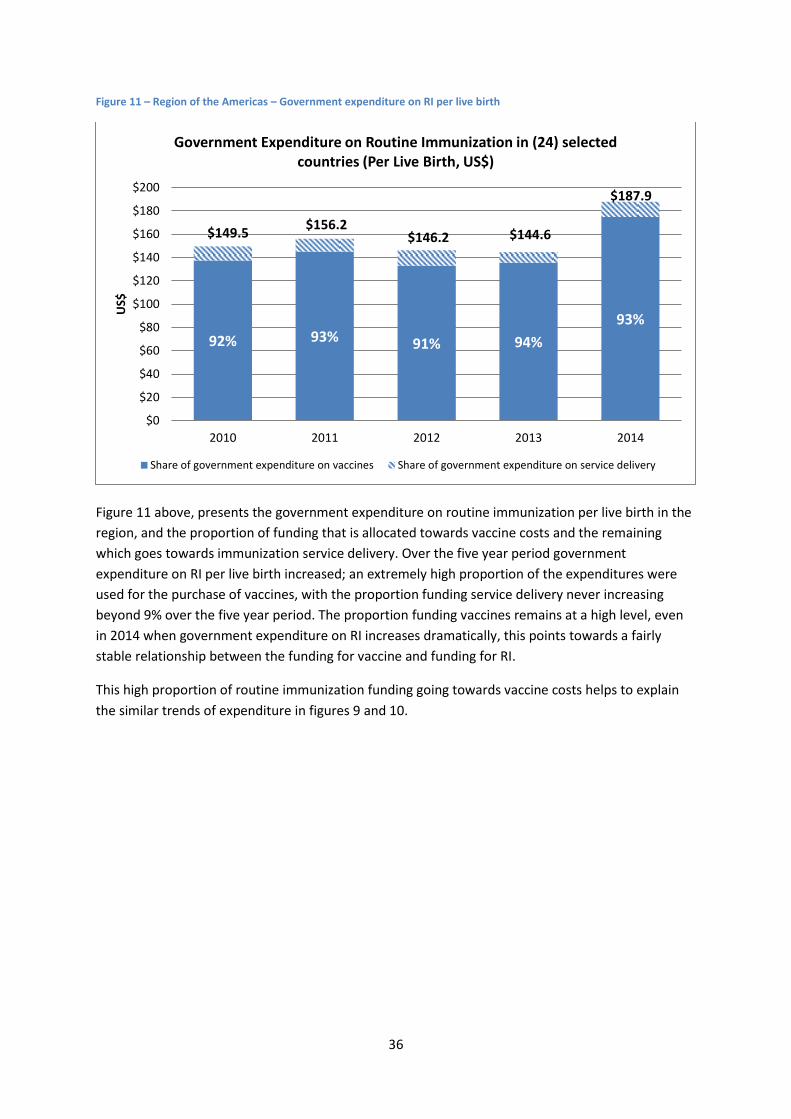
36
Figure 11 – Region of the Americas – Government expenditure on RI per live birth
Figure 11 above, presents the government expenditure on routine immunization per live birth in the
region, and the proportion of funding that is allocated towards vaccine costs and the remaining
which goes towards immunization service delivery. Over the five year period government
expenditure on RI per live birth increased; an extremely high proportion of the expenditures were
used for the purchase of vaccines, with the proportion funding service delivery never increasing
beyond 9% over the five year period. The proportion funding vaccines remains at a high level, even
in 2014 when government expenditure on RI increases dramatically, this points towards a fairly
stable relationship between the funding for vaccine and funding for RI.
This high proportion of routine immunization funding going towards vaccine costs helps to explain
the similar trends of expenditure in figures 9 and 10.
92% 93% 91% 94%
93%
$149.5 $156.2
$146.2 $144.6
$187.9
$0
$20
$40
$60
$80
$100
$120
$140
$160
$180
$200
2010 2011 2012 2013 2014
US$
Government Expenditure on Routine Immunization in (24) selected countries (Per Live Birth, US$)
Share of government expenditure on vaccines Share of government expenditure on service delivery
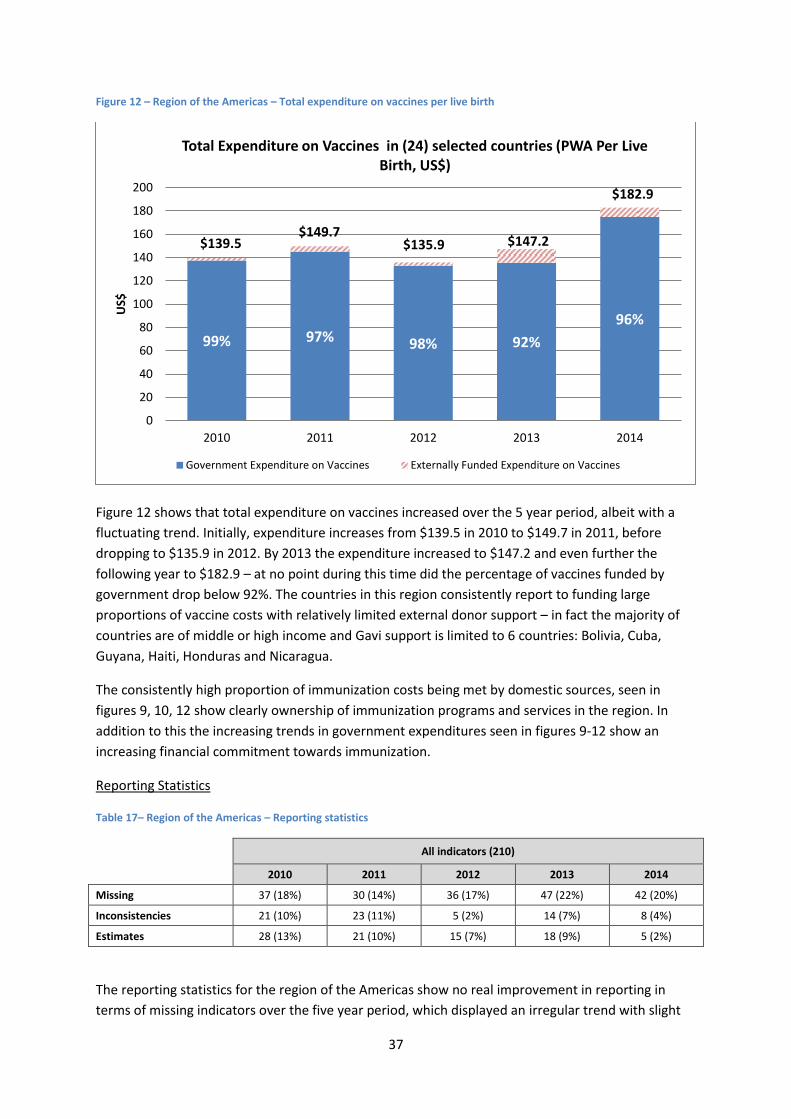
37
Figure 12 – Region of the Americas – Total expenditure on vaccines per live birth
Figure 12 shows that total expenditure on vaccines increased over the 5 year period, albeit with a
fluctuating trend. Initially, expenditure increases from $139.5 in 2010 to $149.7 in 2011, before
dropping to $135.9 in 2012. By 2013 the expenditure increased to $147.2 and even further the
following year to $182.9 – at no point during this time did the percentage of vaccines funded by
government drop below 92%. The countries in this region consistently report to funding large
proportions of vaccine costs with relatively limited external donor support – in fact the majority of
countries are of middle or high income and Gavi support is limited to 6 countries: Bolivia, Cuba,
Guyana, Haiti, Honduras and Nicaragua.
The consistently high proportion of immunization costs being met by domestic sources, seen in
figures 9, 10, 12 show clearly ownership of immunization programs and services in the region. In
addition to this the increasing trends in government expenditures seen in figures 9-12 show an
increasing financial commitment towards immunization.
Reporting Statistics
Table 17– Region of the Americas – Reporting statistics
All indicators (210)
2010 2011 2012 2013 2014
Missing 37 (18%) 30 (14%) 36 (17%) 47 (22%) 42 (20%)
Inconsistencies 21 (10%) 23 (11%) 5 (2%) 14 (7%) 8 (4%)
Estimates 28 (13%) 21 (10%) 15 (7%) 18 (9%) 5 (2%)
The reporting statistics for the region of the Americas show no real improvement in reporting in
terms of missing indicators over the five year period, which displayed an irregular trend with slight
99% 97% 98% 92%
96%
$139.5 $149.7
$135.9 $147.2
$182.9
0
20
40
60
80
100
120
140
160
180
200
2010 2011 2012 2013 2014
US$
Total Expenditure on Vaccines in (24) selected countries (PWA Per Live Birth, US$)
Government Expenditure on Vaccines Externally Funded Expenditure on Vaccines
38
variation from year-to-year. 10% of all indicators reported were regarded as inconsistent in 2010,
whereas only 4% were regarded as inconsistent in 2014. However, this this should be interpreted
with caution as there has been large variation between the years in the number of inconsistencies
and whilst there may have been improvement in 2014 but this is not to mean that these
improvements will carry-over into 2015 data.
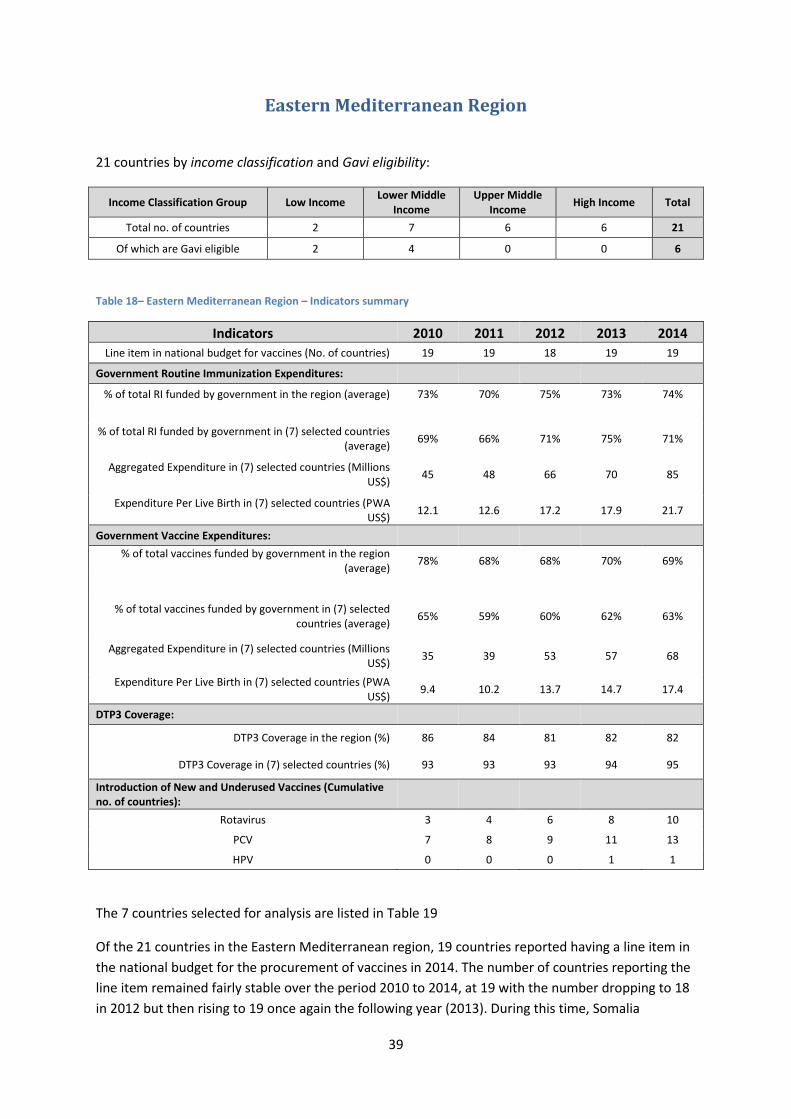
39
Eastern Mediterranean Region
21 countries by income classification and Gavi eligibility:
Income Classification Group Low Income Lower Middle
Income Upper Middle
Income High Income Total
Total no. of countries 2 7 6 6 21
Of which are Gavi eligible 2 4 0 0 6
Table 18– Eastern Mediterranean Region – Indicators summary
Indicators 2010 2011 2012 2013 2014
Line item in national budget for vaccines (No. of countries) 19 19 18 19 19
Government Routine Immunization Expenditures:
% of total RI funded by government in the region (average) 73% 70% 75% 73% 74%
% of total RI funded by government in (7) selected countries (average)
69% 66% 71% 75% 71%
Aggregated Expenditure in (7) selected countries (Millions US$)
45 48 66 70 85
Expenditure Per Live Birth in (7) selected countries (PWA US$)
12.1 12.6 17.2 17.9 21.7
Government Vaccine Expenditures:
% of total vaccines funded by government in the region (average)
78% 68% 68% 70% 69%
% of total vaccines funded by government in (7) selected countries (average)
65% 59% 60% 62% 63%
Aggregated Expenditure in (7) selected countries (Millions US$)
35 39 53 57 68
Expenditure Per Live Birth in (7) selected countries (PWA US$)
9.4 10.2 13.7 14.7 17.4
DTP3 Coverage:
DTP3 Coverage in the region (%) 86 84 81 82 82
DTP3 Coverage in (7) selected countries (%) 93 93 93 94 95
Introduction of New and Underused Vaccines (Cumulative no. of countries):
Rotavirus 3 4 6 8 10
PCV 7 8 9 11 13
HPV 0 0 0 1 1
The 7 countries selected for analysis are listed in Table 19
Of the 21 countries in the Eastern Mediterranean region, 19 countries reported having a line item in
the national budget for the procurement of vaccines in 2014. The number of countries reporting the
line item remained fairly stable over the period 2010 to 2014, at 19 with the number dropping to 18
in 2012 but then rising to 19 once again the following year (2013). During this time, Somalia
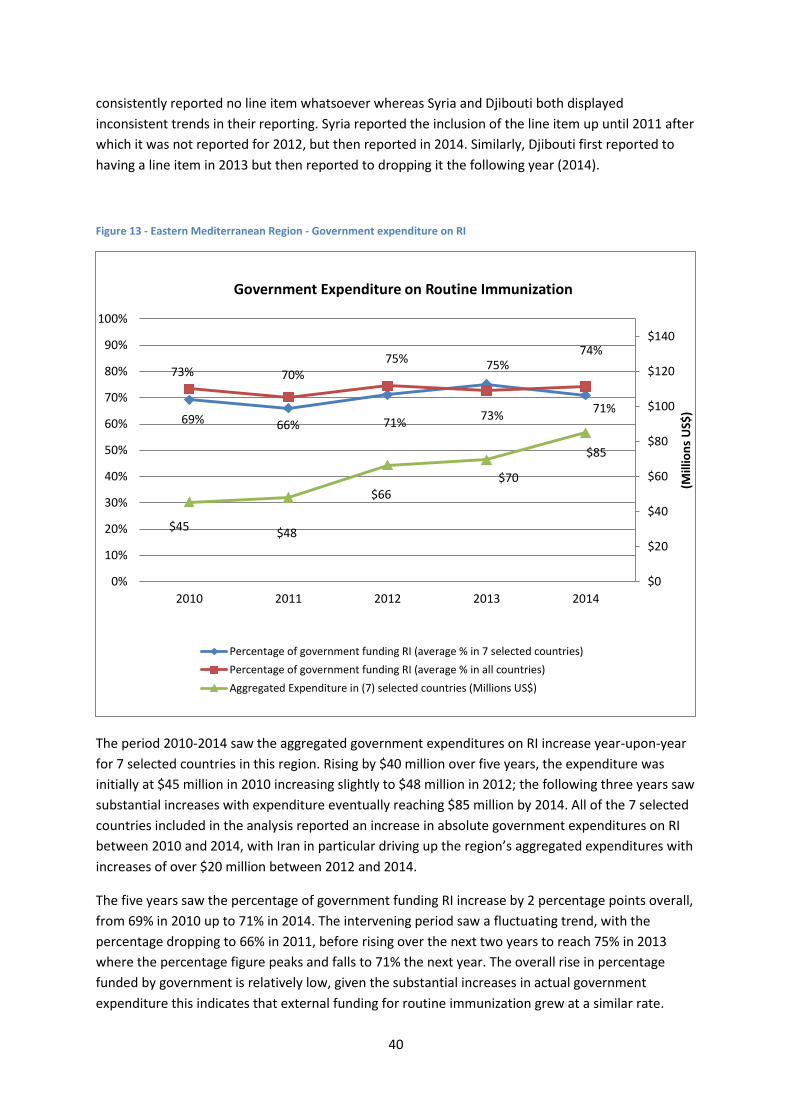
40
consistently reported no line item whatsoever whereas Syria and Djibouti both displayed
inconsistent trends in their reporting. Syria reported the inclusion of the line item up until 2011 after
which it was not reported for 2012, but then reported in 2014. Similarly, Djibouti first reported to
having a line item in 2013 but then reported to dropping it the following year (2014).
Figure 13 - Eastern Mediterranean Region - Government expenditure on RI
The period 2010-2014 saw the aggregated government expenditures on RI increase year-upon-year
for 7 selected countries in this region. Rising by $40 million over five years, the expenditure was
initially at $45 million in 2010 increasing slightly to $48 million in 2012; the following three years saw
substantial increases with expenditure eventually reaching $85 million by 2014. All of the 7 selected
countries included in the analysis reported an increase in absolute government expenditures on RI
between 2010 and 2014, with Iran in particular driving up the region’s aggregated expenditures with
increases of over $20 million between 2012 and 2014.
The five years saw the percentage of government funding RI increase by 2 percentage points overall,
from 69% in 2010 up to 71% in 2014. The intervening period saw a fluctuating trend, with the
percentage dropping to 66% in 2011, before rising over the next two years to reach 75% in 2013
where the percentage figure peaks and falls to 71% the next year. The overall rise in percentage
funded by government is relatively low, given the substantial increases in actual government
expenditure this indicates that external funding for routine immunization grew at a similar rate.
69% 66% 71%
75%
71%
73% 70% 75%
73%
74%
$45 $48
$66
$70
$85
$0
$20
$40
$60
$80
$100
$120
$140
0%
10%
20%
30%
40%
50%
60%
70%
80%
90%
100%
2010 2011 2012 2013 2014
(Mill
ion
s U
S$)
Government Expenditure on Routine Immunization
Percentage of government funding RI (average % in 7 selected countries)
Percentage of government funding RI (average % in all countries)
Aggregated Expenditure in (7) selected countries (Millions US$)

41
Figure 14 - Eastern Mediterranean Region - Government expenditure on vaccines
The aggregated government expenditures on vaccines in Figure 14 follow the same trend as the
expenditures on RI seen in figure 13, with consistent year-upon-year increases over the whole 5 year
period. The government expenditure on vaccines almost doubles, going from $35 million in 2010 to
$68 million in 2014. Given the close relationship between the government expenditures on RI and
government expenditures on vaccines, it seems clear that the vaccine costs form a large proportion
of the overall routine immunization costs.
The percentage of vaccine costs funded by government can be seen to fall drastically over the five
year period, starting initially at 78% in 2010 and then dropping by 10 percentage points for the next
year (2011), after which the figure remained relatively stable but increased slightly over the next 3
years to reach 69% in 2014.
Only 2 of the 21 Eastern Mediterranean countries are classified as Low income, with the majority (13)
classified as middle income, and 6 being of High income – this serves to explain the relatively high
proportion of government funding for routine immunization and vaccines, in comparison to other
regions with relatively lower income.
65%
59% 60% 62% 63%
78% 68% 68% 70% 69%
$35 $39
$53
$57
$68
$0
$20
$40
$60
$80
$100
$120
$140
0%
10%
20%
30%
40%
50%
60%
70%
80%
90%
100%
2010 2011 2012 2013 2014
(Mill
ion
s U
S$)
Government Expenditure on Vaccines
Percentage of government funding vaccines (average in 7 selected countries)
Percentage of government funding vaccines (average % in all countries)
Aggregated Expenditure in (7) selected countries (Millions US$)
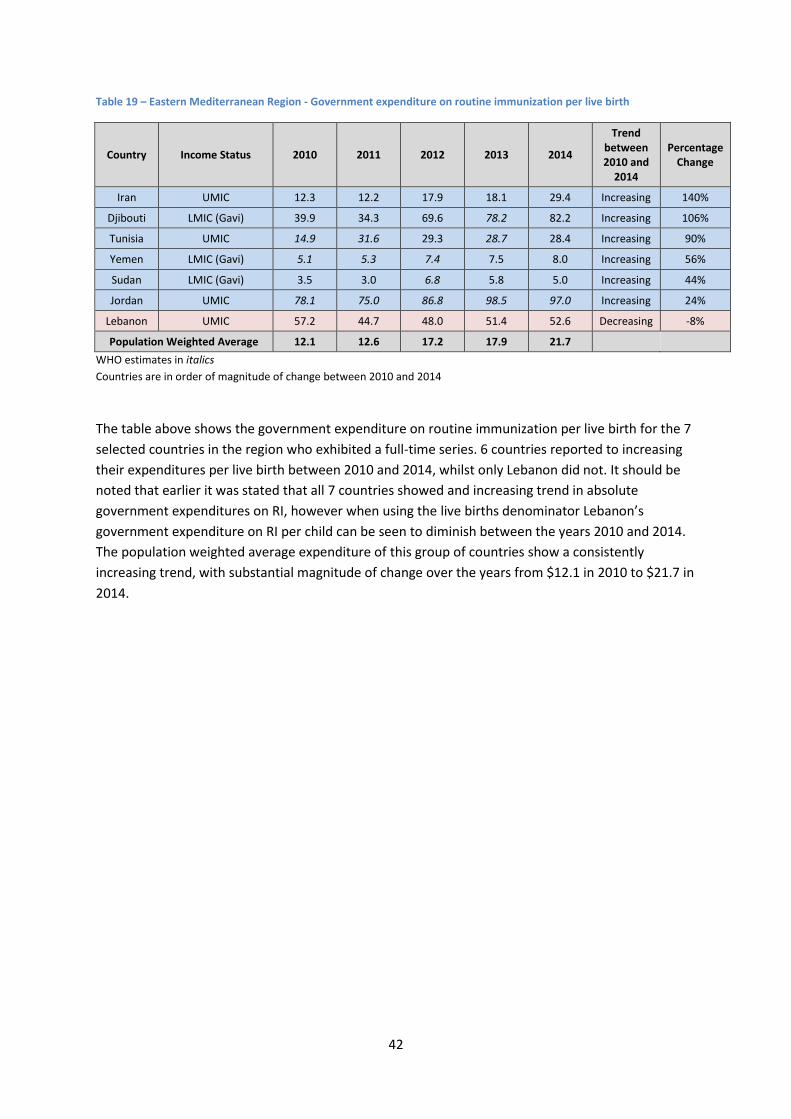
42
Table 19 – Eastern Mediterranean Region - Government expenditure on routine immunization per live birth
Country Income Status 2010 2011 2012 2013 2014
Trend between 2010 and
2014
Percentage Change
Iran UMIC 12.3 12.2 17.9 18.1 29.4 Increasing 140%
Djibouti LMIC (Gavi) 39.9 34.3 69.6 78.2 82.2 Increasing 106%
Tunisia UMIC 14.9 31.6 29.3 28.7 28.4 Increasing 90%
Yemen LMIC (Gavi) 5.1 5.3 7.4 7.5 8.0 Increasing 56%
Sudan LMIC (Gavi) 3.5 3.0 6.8 5.8 5.0 Increasing 44%
Jordan UMIC 78.1 75.0 86.8 98.5 97.0 Increasing 24%
Lebanon UMIC 57.2 44.7 48.0 51.4 52.6 Decreasing -8%
Population Weighted Average 12.1 12.6 17.2 17.9 21.7
WHO estimates in italics
Countries are in order of magnitude of change between 2010 and 2014
The table above shows the government expenditure on routine immunization per live birth for the 7
selected countries in the region who exhibited a full-time series. 6 countries reported to increasing
their expenditures per live birth between 2010 and 2014, whilst only Lebanon did not. It should be
noted that earlier it was stated that all 7 countries showed and increasing trend in absolute
government expenditures on RI, however when using the live births denominator Lebanon’s
government expenditure on RI per child can be seen to diminish between the years 2010 and 2014.
The population weighted average expenditure of this group of countries show a consistently
increasing trend, with substantial magnitude of change over the years from $12.1 in 2010 to $21.7 in
2014.
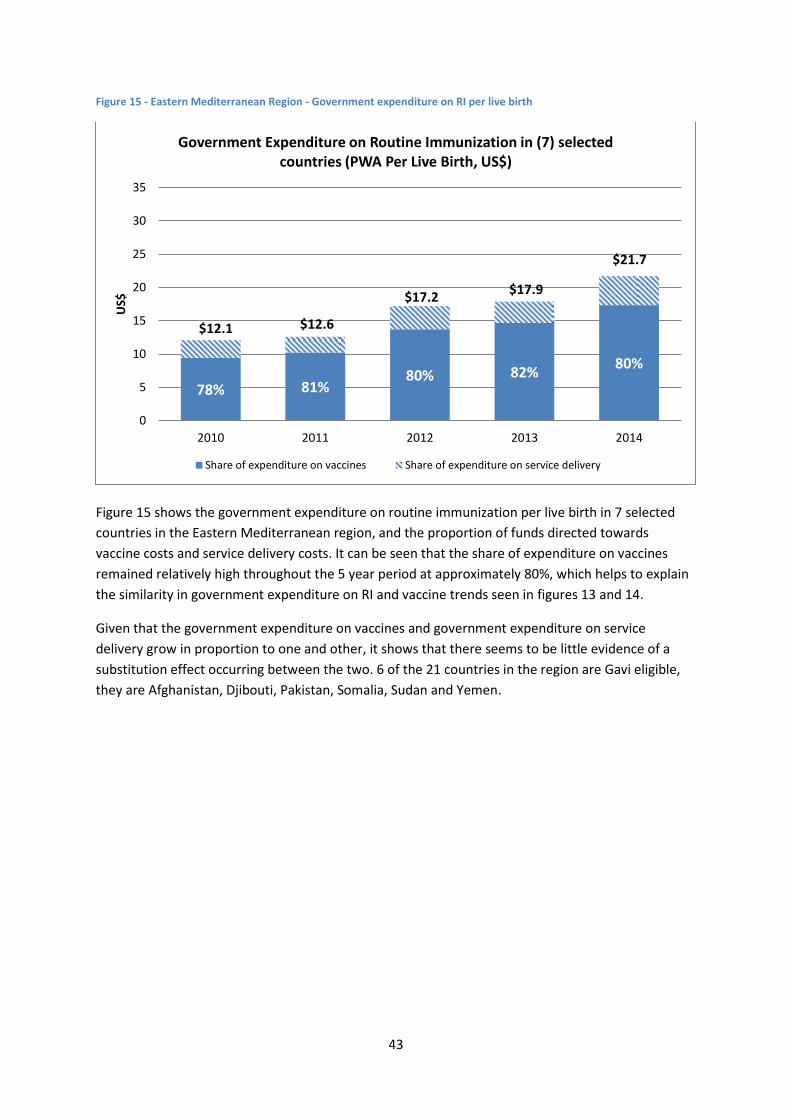
43
Figure 15 - Eastern Mediterranean Region - Government expenditure on RI per live birth
Figure 15 shows the government expenditure on routine immunization per live birth in 7 selected
countries in the Eastern Mediterranean region, and the proportion of funds directed towards
vaccine costs and service delivery costs. It can be seen that the share of expenditure on vaccines
remained relatively high throughout the 5 year period at approximately 80%, which helps to explain
the similarity in government expenditure on RI and vaccine trends seen in figures 13 and 14.
Given that the government expenditure on vaccines and government expenditure on service
delivery grow in proportion to one and other, it shows that there seems to be little evidence of a
substitution effect occurring between the two. 6 of the 21 countries in the region are Gavi eligible,
they are Afghanistan, Djibouti, Pakistan, Somalia, Sudan and Yemen.
78% 81% 80% 82%
80%
$12.1 $12.6
$17.2 $17.9
$21.7
0
5
10
15
20
25
30
35
2010 2011 2012 2013 2014
US$
Government Expenditure on Routine Immunization in (7) selected countries (PWA Per Live Birth, US$)
Share of expenditure on vaccines Share of expenditure on service delivery
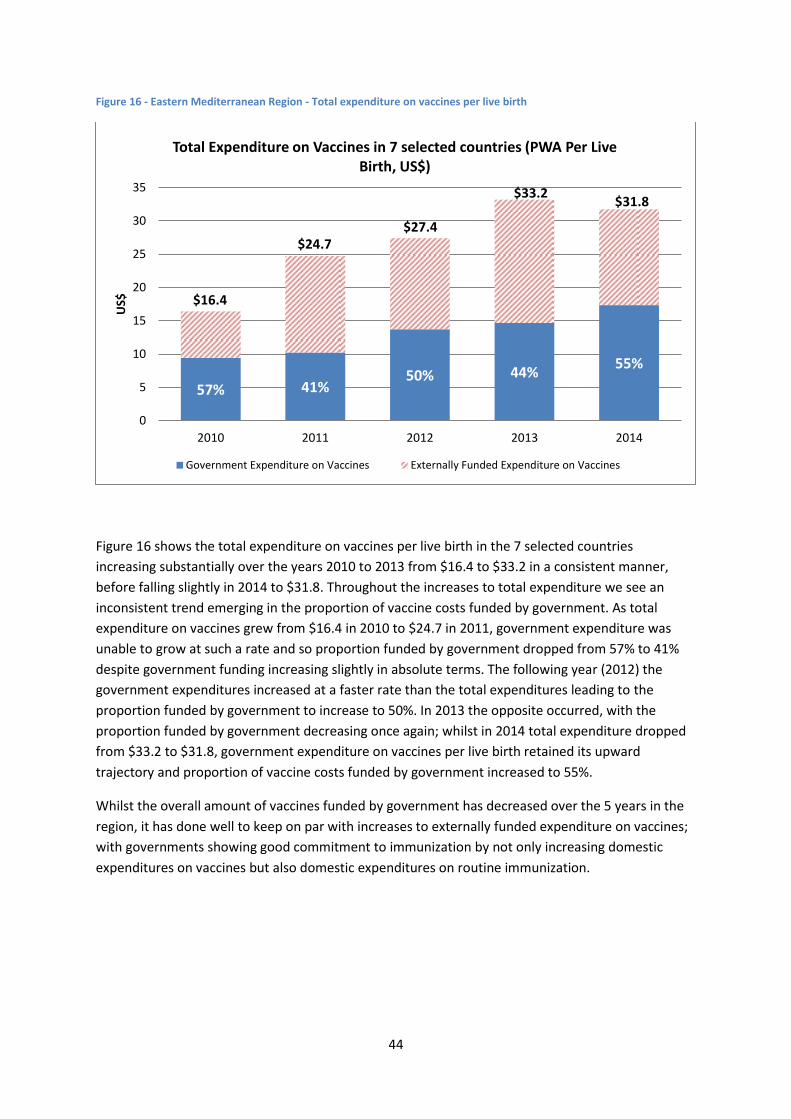
44
Figure 16 - Eastern Mediterranean Region - Total expenditure on vaccines per live birth
Figure 16 shows the total expenditure on vaccines per live birth in the 7 selected countries
increasing substantially over the years 2010 to 2013 from $16.4 to $33.2 in a consistent manner,
before falling slightly in 2014 to $31.8. Throughout the increases to total expenditure we see an
inconsistent trend emerging in the proportion of vaccine costs funded by government. As total
expenditure on vaccines grew from $16.4 in 2010 to $24.7 in 2011, government expenditure was
unable to grow at such a rate and so proportion funded by government dropped from 57% to 41%
despite government funding increasing slightly in absolute terms. The following year (2012) the
government expenditures increased at a faster rate than the total expenditures leading to the
proportion funded by government to increase to 50%. In 2013 the opposite occurred, with the
proportion funded by government decreasing once again; whilst in 2014 total expenditure dropped
from $33.2 to $31.8, government expenditure on vaccines per live birth retained its upward
trajectory and proportion of vaccine costs funded by government increased to 55%.
Whilst the overall amount of vaccines funded by government has decreased over the 5 years in the
region, it has done well to keep on par with increases to externally funded expenditure on vaccines;
with governments showing good commitment to immunization by not only increasing domestic
expenditures on vaccines but also domestic expenditures on routine immunization.
57% 41% 50% 44%
55%
$16.4
$24.7 $27.4
$33.2 $31.8
0
5
10
15
20
25
30
35
2010 2011 2012 2013 2014
US$
Total Expenditure on Vaccines in 7 selected countries (PWA Per Live Birth, US$)
Government Expenditure on Vaccines Externally Funded Expenditure on Vaccines
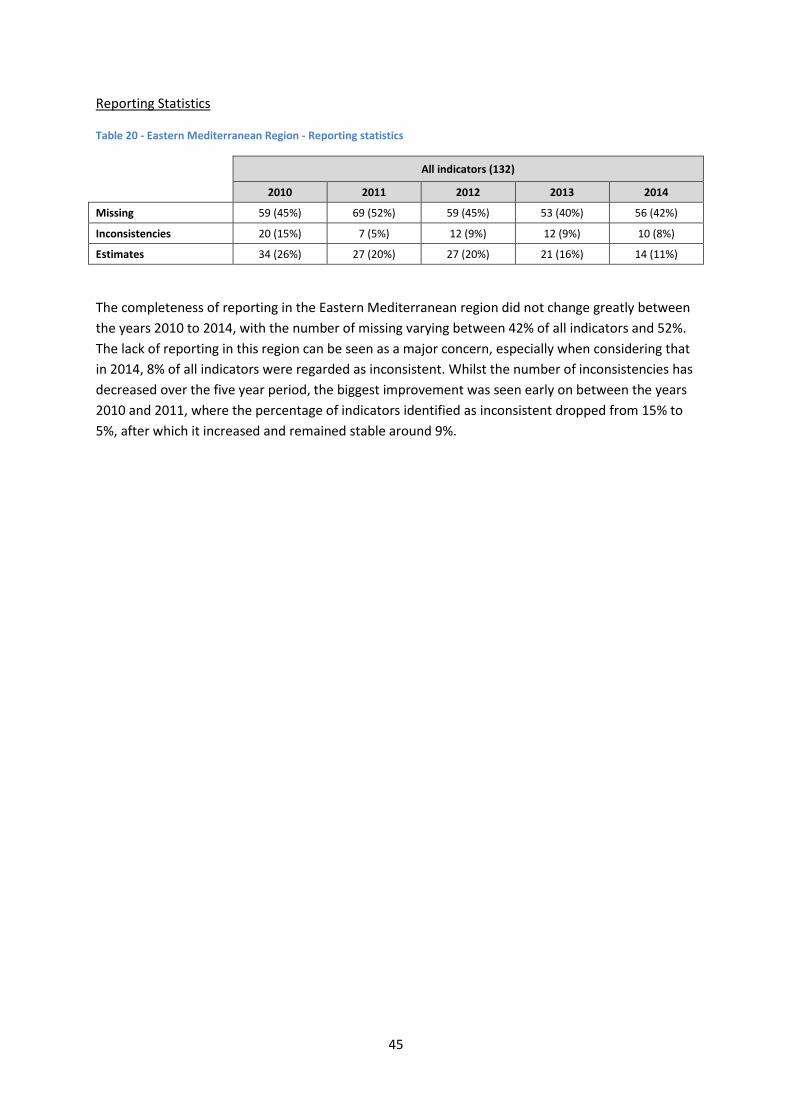
45
Reporting Statistics
Table 20 - Eastern Mediterranean Region - Reporting statistics
All indicators (132)
2010 2011 2012 2013 2014
Missing 59 (45%) 69 (52%) 59 (45%) 53 (40%) 56 (42%)
Inconsistencies 20 (15%) 7 (5%) 12 (9%) 12 (9%) 10 (8%)
Estimates 34 (26%) 27 (20%) 27 (20%) 21 (16%) 14 (11%)
The completeness of reporting in the Eastern Mediterranean region did not change greatly between
the years 2010 to 2014, with the number of missing varying between 42% of all indicators and 52%.
The lack of reporting in this region can be seen as a major concern, especially when considering that
in 2014, 8% of all indicators were regarded as inconsistent. Whilst the number of inconsistencies has
decreased over the five year period, the biggest improvement was seen early on between the years
2010 and 2011, where the percentage of indicators identified as inconsistent dropped from 15% to
5%, after which it increased and remained stable around 9%.
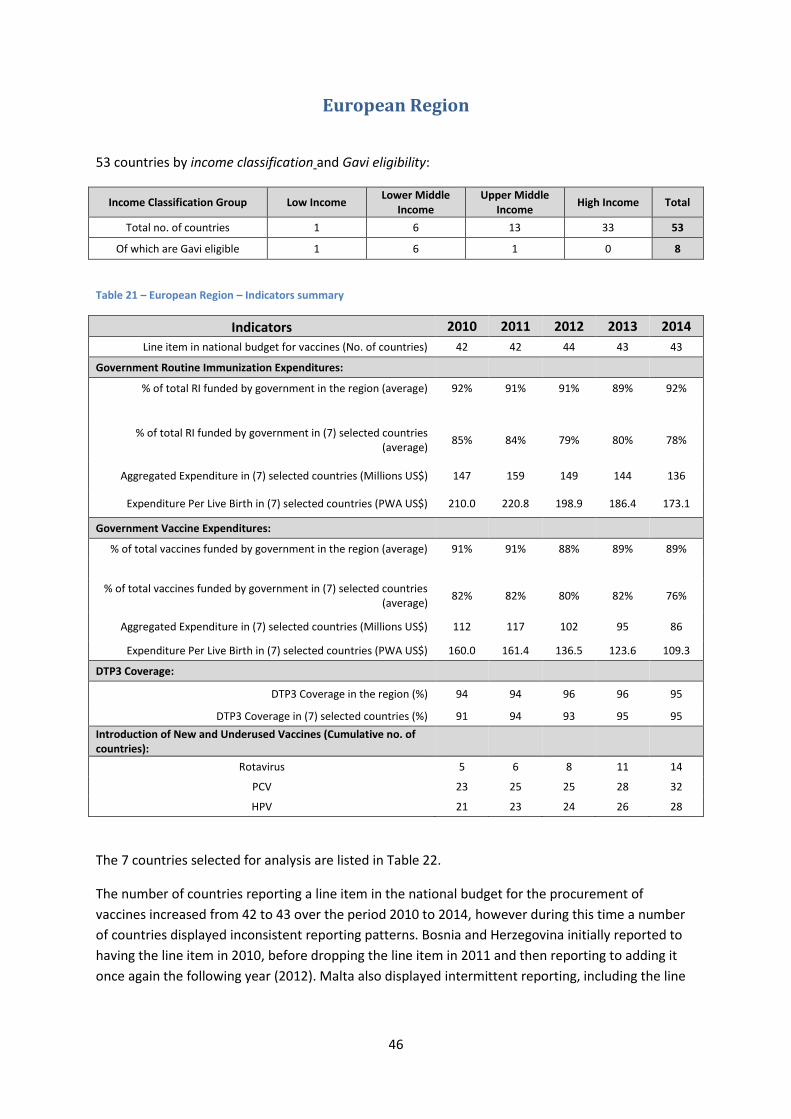
46
European Region
53 countries by income classification and Gavi eligibility:
Income Classification Group Low Income Lower Middle
Income Upper Middle
Income High Income Total
Total no. of countries 1 6 13 33 53
Of which are Gavi eligible 1 6 1 0 8
Table 21 – European Region – Indicators summary
Indicators 2010 2011 2012 2013 2014
Line item in national budget for vaccines (No. of countries) 42 42 44 43 43
Government Routine Immunization Expenditures:
% of total RI funded by government in the region (average) 92% 91% 91% 89% 92%
% of total RI funded by government in (7) selected countries (average)
85% 84% 79% 80% 78%
Aggregated Expenditure in (7) selected countries (Millions US$) 147 159 149 144 136
Expenditure Per Live Birth in (7) selected countries (PWA US$) 210.0 220.8 198.9 186.4 173.1
Government Vaccine Expenditures:
% of total vaccines funded by government in the region (average) 91% 91% 88% 89% 89%
% of total vaccines funded by government in (7) selected countries (average)
82% 82% 80% 82% 76%
Aggregated Expenditure in (7) selected countries (Millions US$) 112 117 102 95 86
Expenditure Per Live Birth in (7) selected countries (PWA US$) 160.0 161.4 136.5 123.6 109.3
DTP3 Coverage:
DTP3 Coverage in the region (%) 94 94 96 96 95
DTP3 Coverage in (7) selected countries (%) 91 94 93 95 95
Introduction of New and Underused Vaccines (Cumulative no. of countries):
Rotavirus 5 6 8 11 14
PCV 23 25 25 28 32
HPV 21 23 24 26 28
The 7 countries selected for analysis are listed in Table 22.
The number of countries reporting a line item in the national budget for the procurement of
vaccines increased from 42 to 43 over the period 2010 to 2014, however during this time a number
of countries displayed inconsistent reporting patterns. Bosnia and Herzegovina initially reported to
having the line item in 2010, before dropping the line item in 2011 and then reporting to adding it
once again the following year (2012). Malta also displayed intermittent reporting, including the line
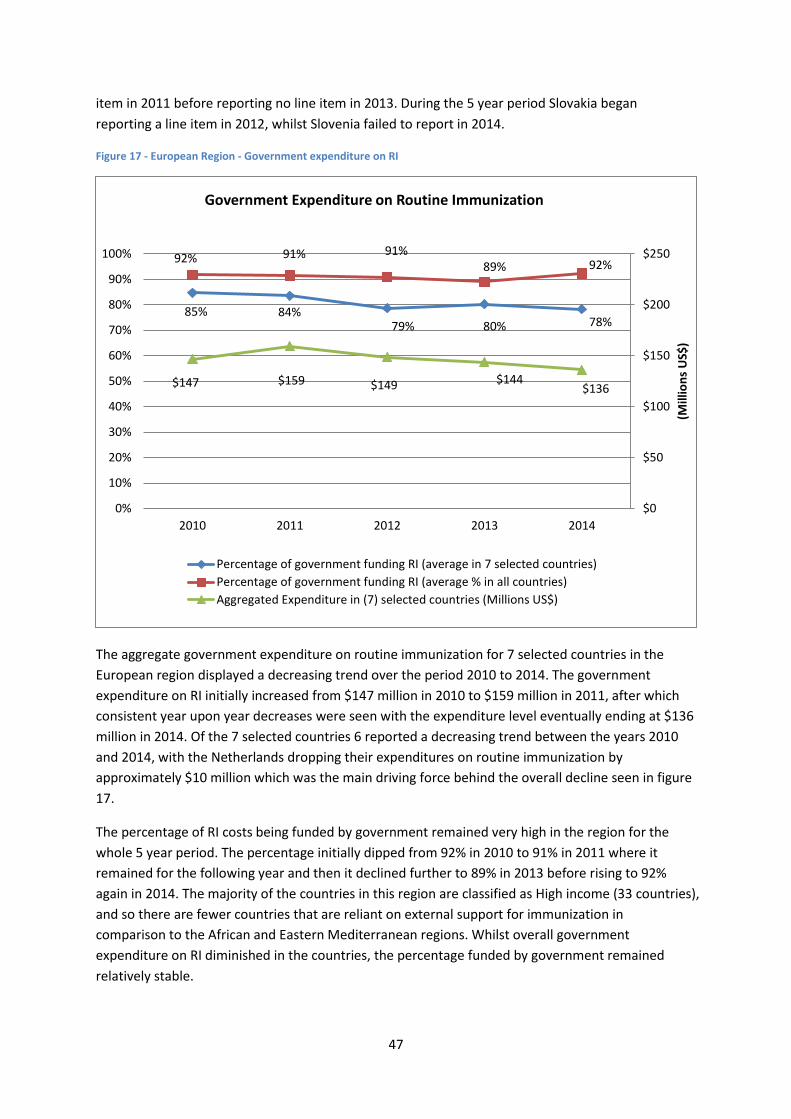
47
item in 2011 before reporting no line item in 2013. During the 5 year period Slovakia began
reporting a line item in 2012, whilst Slovenia failed to report in 2014.
Figure 17 - European Region - Government expenditure on RI
The aggregate government expenditure on routine immunization for 7 selected countries in the
European region displayed a decreasing trend over the period 2010 to 2014. The government
expenditure on RI initially increased from $147 million in 2010 to $159 million in 2011, after which
consistent year upon year decreases were seen with the expenditure level eventually ending at $136
million in 2014. Of the 7 selected countries 6 reported a decreasing trend between the years 2010
and 2014, with the Netherlands dropping their expenditures on routine immunization by
approximately $10 million which was the main driving force behind the overall decline seen in figure
17.
The percentage of RI costs being funded by government remained very high in the region for the
whole 5 year period. The percentage initially dipped from 92% in 2010 to 91% in 2011 where it
remained for the following year and then it declined further to 89% in 2013 before rising to 92%
again in 2014. The majority of the countries in this region are classified as High income (33 countries),
and so there are fewer countries that are reliant on external support for immunization in
comparison to the African and Eastern Mediterranean regions. Whilst overall government
expenditure on RI diminished in the countries, the percentage funded by government remained
relatively stable.
85% 84% 79% 80% 78%
92% 91% 91% 89% 92%
$147 $159 $149 $144 $136
$0
$50
$100
$150
$200
$250
0%
10%
20%
30%
40%
50%
60%
70%
80%
90%
100%
2010 2011 2012 2013 2014
(Mill
ion
s U
S$)
Government Expenditure on Routine Immunization
Percentage of government funding RI (average in 7 selected countries)
Percentage of government funding RI (average % in all countries)
Aggregated Expenditure in (7) selected countries (Millions US$)
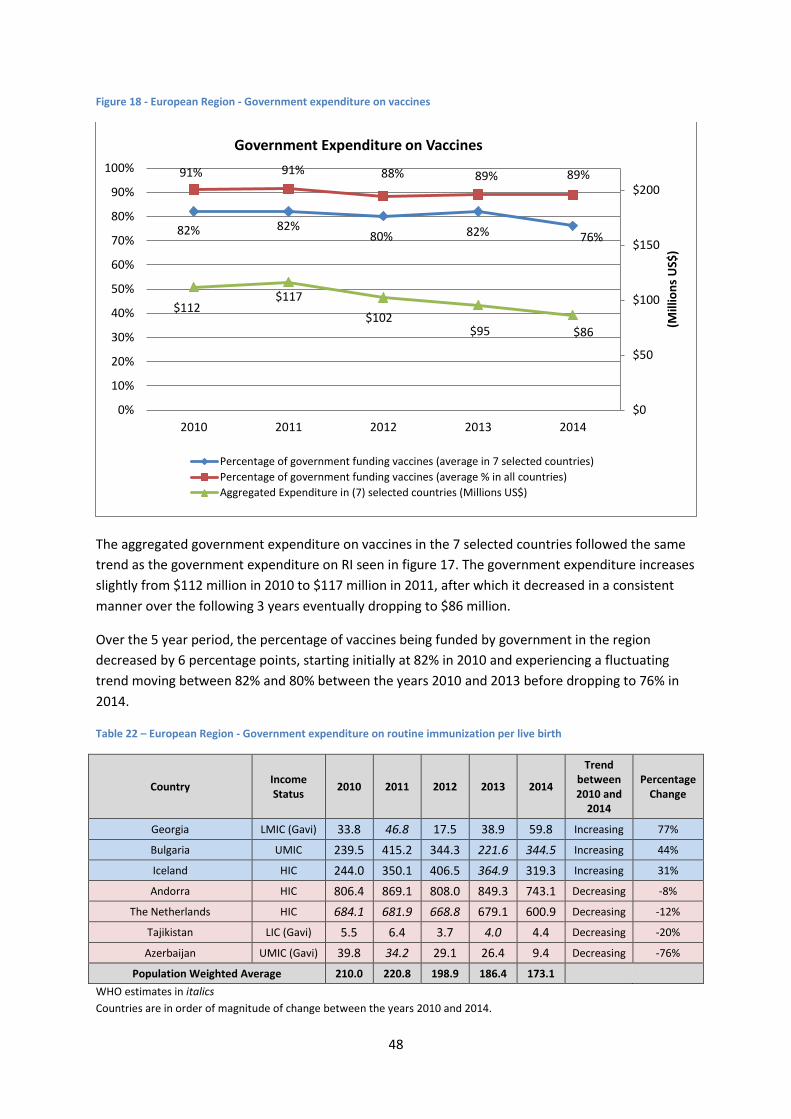
48
Figure 18 - European Region - Government expenditure on vaccines
The aggregated government expenditure on vaccines in the 7 selected countries followed the same
trend as the government expenditure on RI seen in figure 17. The government expenditure increases
slightly from $112 million in 2010 to $117 million in 2011, after which it decreased in a consistent
manner over the following 3 years eventually dropping to $86 million.
Over the 5 year period, the percentage of vaccines being funded by government in the region
decreased by 6 percentage points, starting initially at 82% in 2010 and experiencing a fluctuating
trend moving between 82% and 80% between the years 2010 and 2013 before dropping to 76% in
2014.
Table 22 – European Region - Government expenditure on routine immunization per live birth
Country Income Status
2010 2011 2012 2013 2014
Trend between 2010 and
2014
Percentage Change
Georgia LMIC (Gavi) 33.8 46.8 17.5 38.9 59.8 Increasing 77%
Bulgaria UMIC 239.5 415.2 344.3 221.6 344.5 Increasing 44%
Iceland HIC 244.0 350.1 406.5 364.9 319.3 Increasing 31%
Andorra HIC 806.4 869.1 808.0 849.3 743.1 Decreasing -8%
The Netherlands HIC 684.1 681.9 668.8 679.1 600.9 Decreasing -12%
Tajikistan LIC (Gavi) 5.5 6.4 3.7 4.0 4.4 Decreasing -20%
Azerbaijan UMIC (Gavi) 39.8 34.2 29.1 26.4 9.4 Decreasing -76%
Population Weighted Average 210.0 220.8 198.9 186.4 173.1 WHO estimates in italics
Countries are in order of magnitude of change between the years 2010 and 2014.
82% 82% 80% 82% 76%
91% 91% 88% 89% 89%
$112 $117
$102 $95 $86
$0
$50
$100
$150
$200
0%
10%
20%
30%
40%
50%
60%
70%
80%
90%
100%
2010 2011 2012 2013 2014
(Mill
ion
s U
S$)
Government Expenditure on Vaccines
Percentage of government funding vaccines (average in 7 selected countries)
Percentage of government funding vaccines (average % in all countries)
Aggregated Expenditure in (7) selected countries (Millions US$)
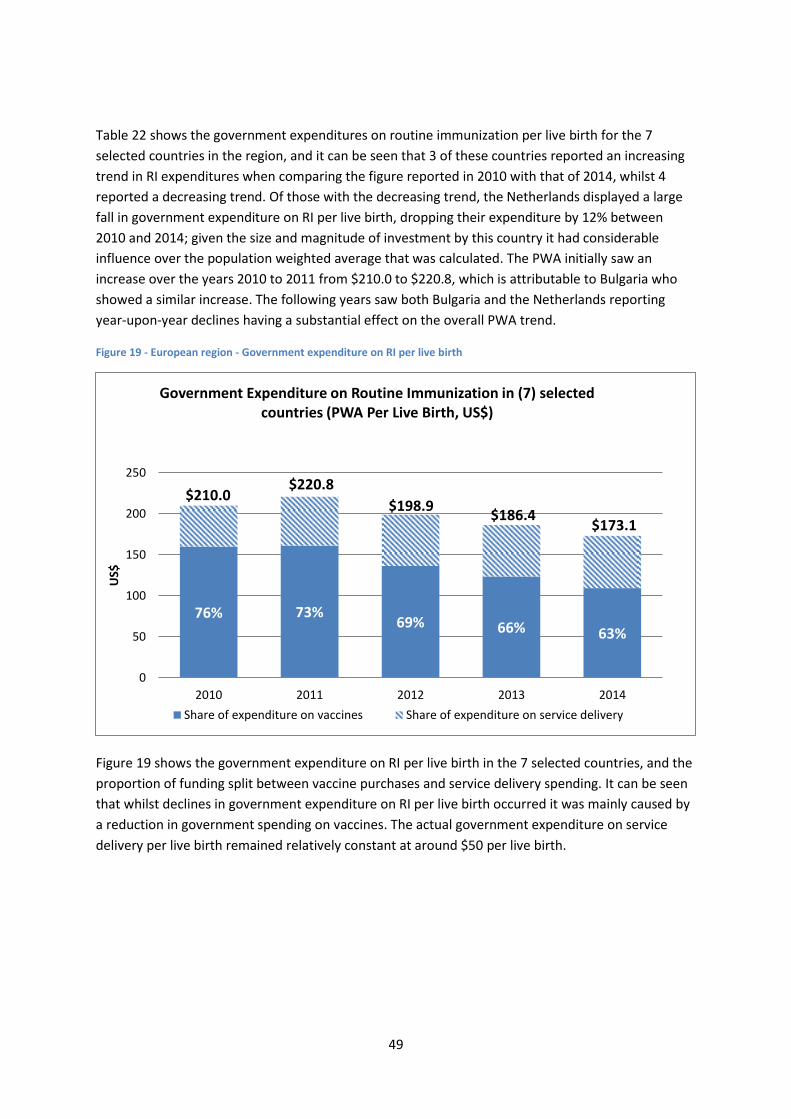
49
Table 22 shows the government expenditures on routine immunization per live birth for the 7
selected countries in the region, and it can be seen that 3 of these countries reported an increasing
trend in RI expenditures when comparing the figure reported in 2010 with that of 2014, whilst 4
reported a decreasing trend. Of those with the decreasing trend, the Netherlands displayed a large
fall in government expenditure on RI per live birth, dropping their expenditure by 12% between
2010 and 2014; given the size and magnitude of investment by this country it had considerable
influence over the population weighted average that was calculated. The PWA initially saw an
increase over the years 2010 to 2011 from $210.0 to $220.8, which is attributable to Bulgaria who
showed a similar increase. The following years saw both Bulgaria and the Netherlands reporting
year-upon-year declines having a substantial effect on the overall PWA trend.
Figure 19 - European region - Government expenditure on RI per live birth
Figure 19 shows the government expenditure on RI per live birth in the 7 selected countries, and the
proportion of funding split between vaccine purchases and service delivery spending. It can be seen
that whilst declines in government expenditure on RI per live birth occurred it was mainly caused by
a reduction in government spending on vaccines. The actual government expenditure on service
delivery per live birth remained relatively constant at around $50 per live birth.
76% 73% 69% 66% 63%
$210.0 $220.8
$198.9 $186.4
$173.1
0
50
100
150
200
250
2010 2011 2012 2013 2014
US$
Government Expenditure on Routine Immunization in (7) selected countries (PWA Per Live Birth, US$)
Share of expenditure on vaccines Share of expenditure on service delivery
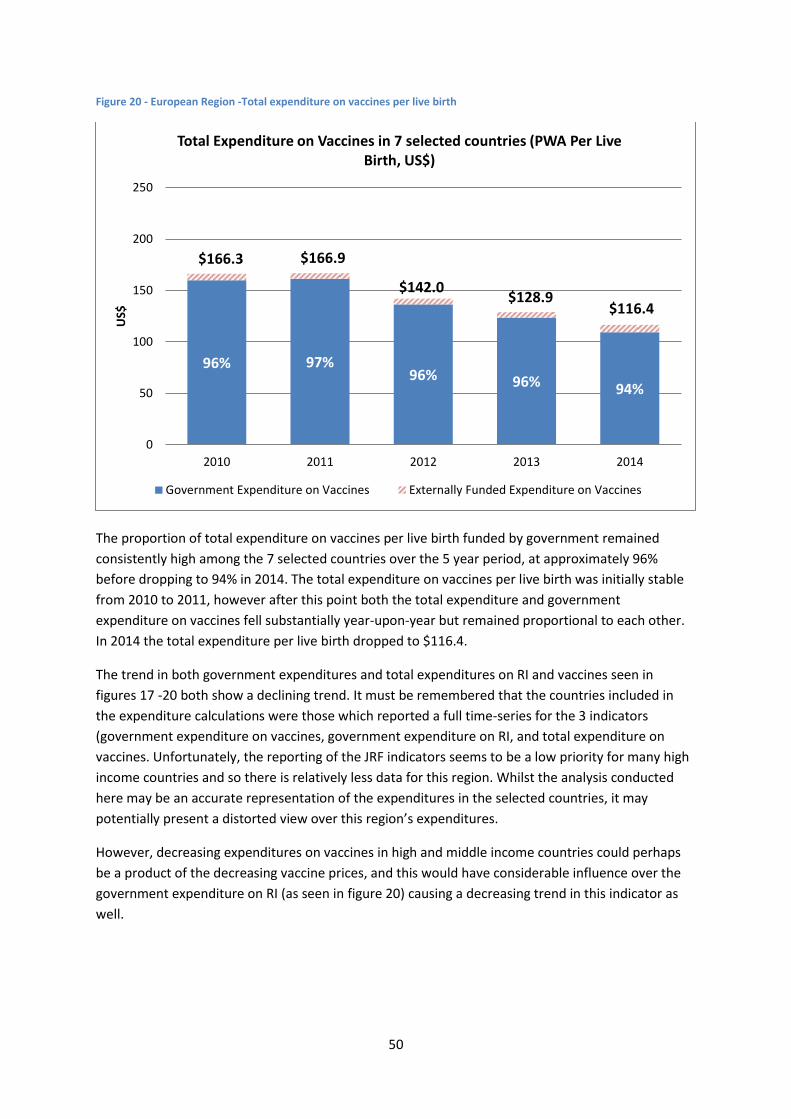
50
Figure 20 - European Region -Total expenditure on vaccines per live birth
The proportion of total expenditure on vaccines per live birth funded by government remained
consistently high among the 7 selected countries over the 5 year period, at approximately 96%
before dropping to 94% in 2014. The total expenditure on vaccines per live birth was initially stable
from 2010 to 2011, however after this point both the total expenditure and government
expenditure on vaccines fell substantially year-upon-year but remained proportional to each other.
In 2014 the total expenditure per live birth dropped to $116.4.
The trend in both government expenditures and total expenditures on RI and vaccines seen in
figures 17 -20 both show a declining trend. It must be remembered that the countries included in
the expenditure calculations were those which reported a full time-series for the 3 indicators
(government expenditure on vaccines, government expenditure on RI, and total expenditure on
vaccines. Unfortunately, the reporting of the JRF indicators seems to be a low priority for many high
income countries and so there is relatively less data for this region. Whilst the analysis conducted
here may be an accurate representation of the expenditures in the selected countries, it may
potentially present a distorted view over this region’s expenditures.
However, decreasing expenditures on vaccines in high and middle income countries could perhaps
be a product of the decreasing vaccine prices, and this would have considerable influence over the
government expenditure on RI (as seen in figure 20) causing a decreasing trend in this indicator as
well.
96% 97% 96% 96% 94%
$166.3 $166.9
$142.0 $128.9
$116.4
0
50
100
150
200
250
2010 2011 2012 2013 2014
US$
Total Expenditure on Vaccines in 7 selected countries (PWA Per Live Birth, US$)
Government Expenditure on Vaccines Externally Funded Expenditure on Vaccines
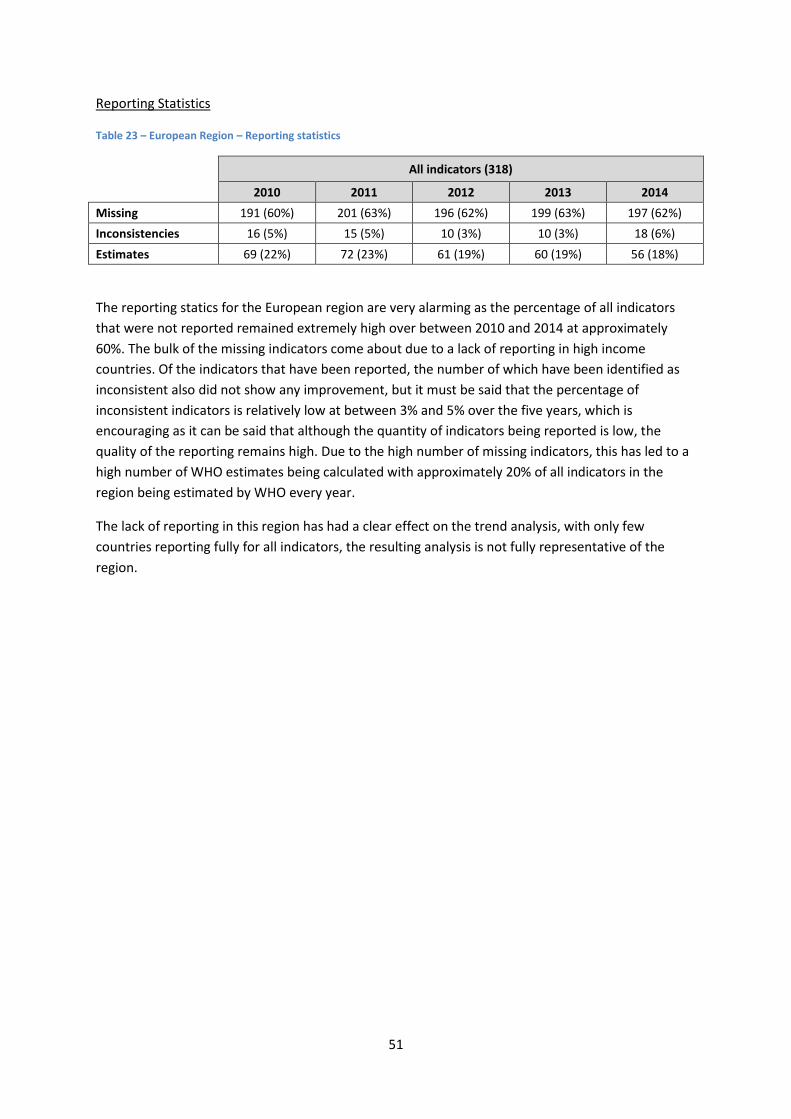
51
Reporting Statistics
Table 23 – European Region – Reporting statistics
All indicators (318)
2010 2011 2012 2013 2014
Missing 191 (60%) 201 (63%) 196 (62%) 199 (63%) 197 (62%)
Inconsistencies 16 (5%) 15 (5%) 10 (3%) 10 (3%) 18 (6%)
Estimates 69 (22%) 72 (23%) 61 (19%) 60 (19%) 56 (18%)
The reporting statics for the European region are very alarming as the percentage of all indicators
that were not reported remained extremely high over between 2010 and 2014 at approximately
60%. The bulk of the missing indicators come about due to a lack of reporting in high income
countries. Of the indicators that have been reported, the number of which have been identified as
inconsistent also did not show any improvement, but it must be said that the percentage of
inconsistent indicators is relatively low at between 3% and 5% over the five years, which is
encouraging as it can be said that although the quantity of indicators being reported is low, the
quality of the reporting remains high. Due to the high number of missing indicators, this has led to a
high number of WHO estimates being calculated with approximately 20% of all indicators in the
region being estimated by WHO every year.
The lack of reporting in this region has had a clear effect on the trend analysis, with only few
countries reporting fully for all indicators, the resulting analysis is not fully representative of the
region.
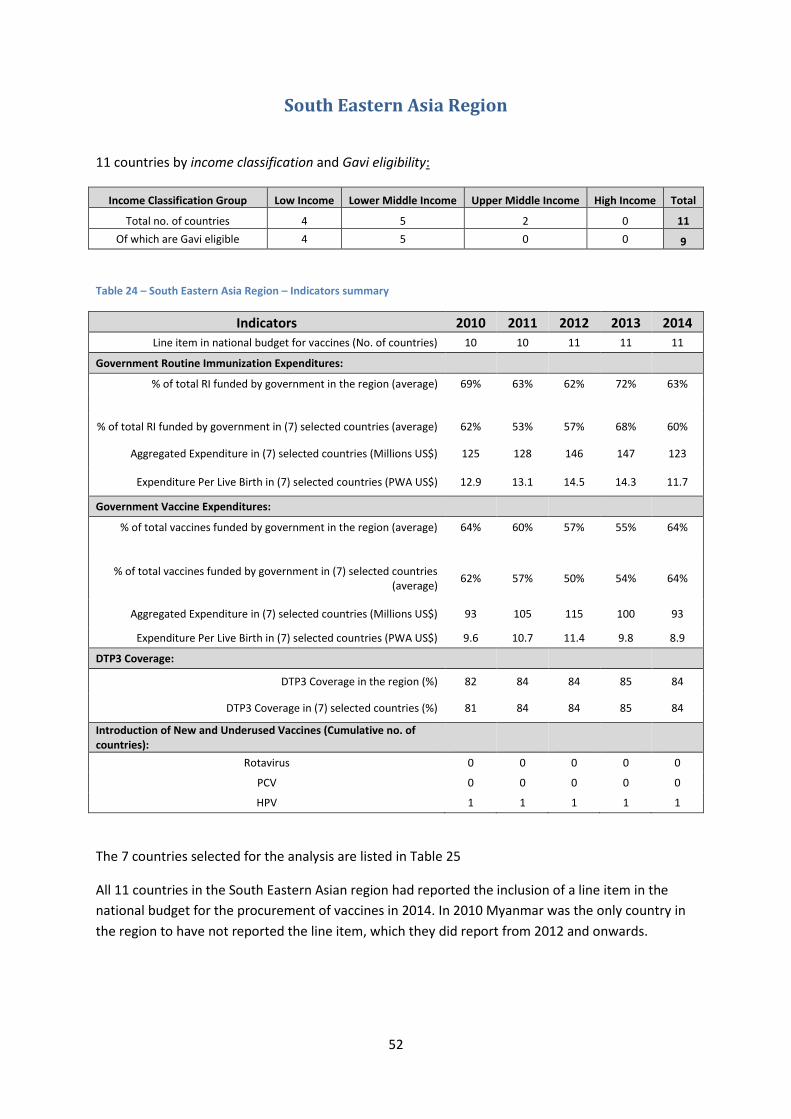
52
South Eastern Asia Region
11 countries by income classification and Gavi eligibility:
Income Classification Group Low Income Lower Middle Income Upper Middle Income High Income Total
Total no. of countries 4 5 2 0 11
Of which are Gavi eligible 4 5 0 0 9
Table 24 – South Eastern Asia Region – Indicators summary
Indicators 2010 2011 2012 2013 2014
Line item in national budget for vaccines (No. of countries) 10 10 11 11 11
Government Routine Immunization Expenditures:
% of total RI funded by government in the region (average) 69% 63% 62% 72% 63%
% of total RI funded by government in (7) selected countries (average) 62% 53% 57% 68% 60%
Aggregated Expenditure in (7) selected countries (Millions US$) 125 128 146 147 123
Expenditure Per Live Birth in (7) selected countries (PWA US$) 12.9 13.1 14.5 14.3 11.7
Government Vaccine Expenditures:
% of total vaccines funded by government in the region (average) 64% 60% 57% 55% 64%
% of total vaccines funded by government in (7) selected countries (average)
62% 57% 50% 54% 64%
Aggregated Expenditure in (7) selected countries (Millions US$) 93 105 115 100 93
Expenditure Per Live Birth in (7) selected countries (PWA US$) 9.6 10.7 11.4 9.8 8.9
DTP3 Coverage:
DTP3 Coverage in the region (%) 82 84 84 85 84
DTP3 Coverage in (7) selected countries (%) 81 84 84 85 84
Introduction of New and Underused Vaccines (Cumulative no. of countries):
Rotavirus 0 0 0 0 0
PCV 0 0 0 0 0
HPV 1 1 1 1 1
The 7 countries selected for the analysis are listed in Table 25
All 11 countries in the South Eastern Asian region had reported the inclusion of a line item in the
national budget for the procurement of vaccines in 2014. In 2010 Myanmar was the only country in
the region to have not reported the line item, which they did report from 2012 and onwards.
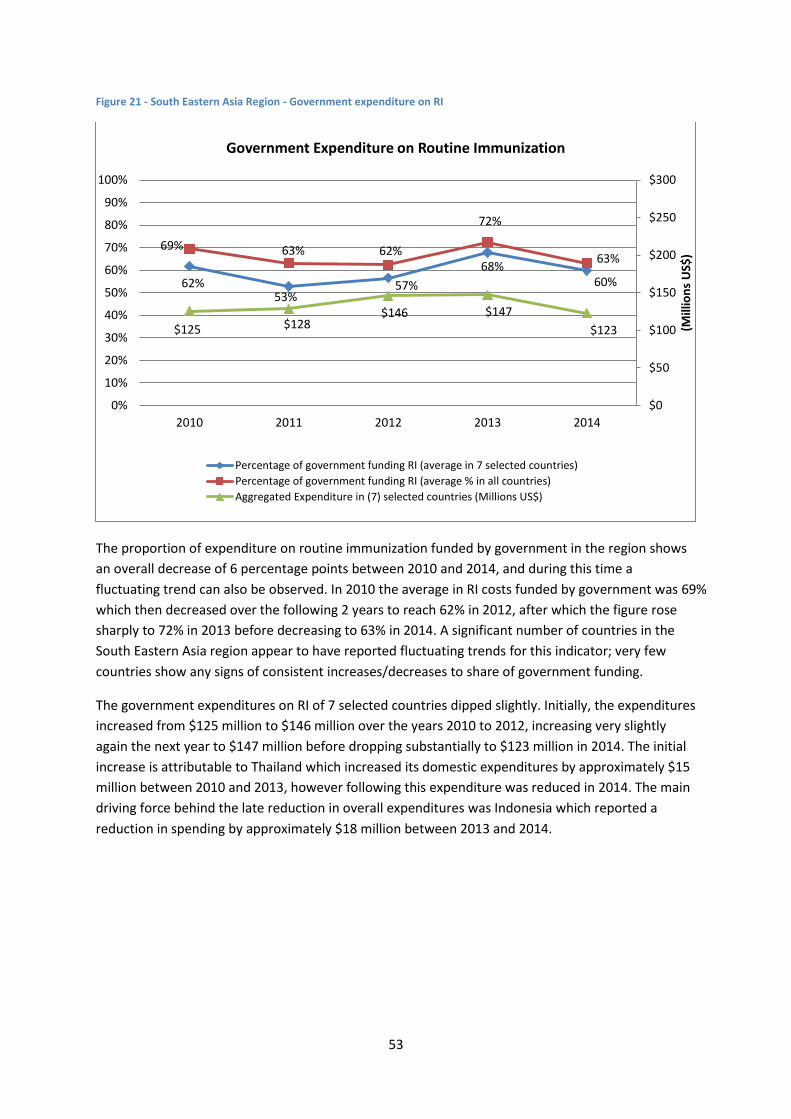
53
Figure 21 - South Eastern Asia Region - Government expenditure on RI
The proportion of expenditure on routine immunization funded by government in the region shows
an overall decrease of 6 percentage points between 2010 and 2014, and during this time a
fluctuating trend can also be observed. In 2010 the average in RI costs funded by government was 69%
which then decreased over the following 2 years to reach 62% in 2012, after which the figure rose
sharply to 72% in 2013 before decreasing to 63% in 2014. A significant number of countries in the
South Eastern Asia region appear to have reported fluctuating trends for this indicator; very few
countries show any signs of consistent increases/decreases to share of government funding.
The government expenditures on RI of 7 selected countries dipped slightly. Initially, the expenditures
increased from $125 million to $146 million over the years 2010 to 2012, increasing very slightly
again the next year to $147 million before dropping substantially to $123 million in 2014. The initial
increase is attributable to Thailand which increased its domestic expenditures by approximately $15
million between 2010 and 2013, however following this expenditure was reduced in 2014. The main
driving force behind the late reduction in overall expenditures was Indonesia which reported a
reduction in spending by approximately $18 million between 2013 and 2014.
62% 53%
57%
68% 60%
69% 63% 62%
72%
63%
$125 $128 $146 $147
$123
$0
$50
$100
$150
$200
$250
$300
0%
10%
20%
30%
40%
50%
60%
70%
80%
90%
100%
2010 2011 2012 2013 2014
(Mill
ion
s U
S$)
Government Expenditure on Routine Immunization
Percentage of government funding RI (average in 7 selected countries)
Percentage of government funding RI (average % in all countries)
Aggregated Expenditure in (7) selected countries (Millions US$)
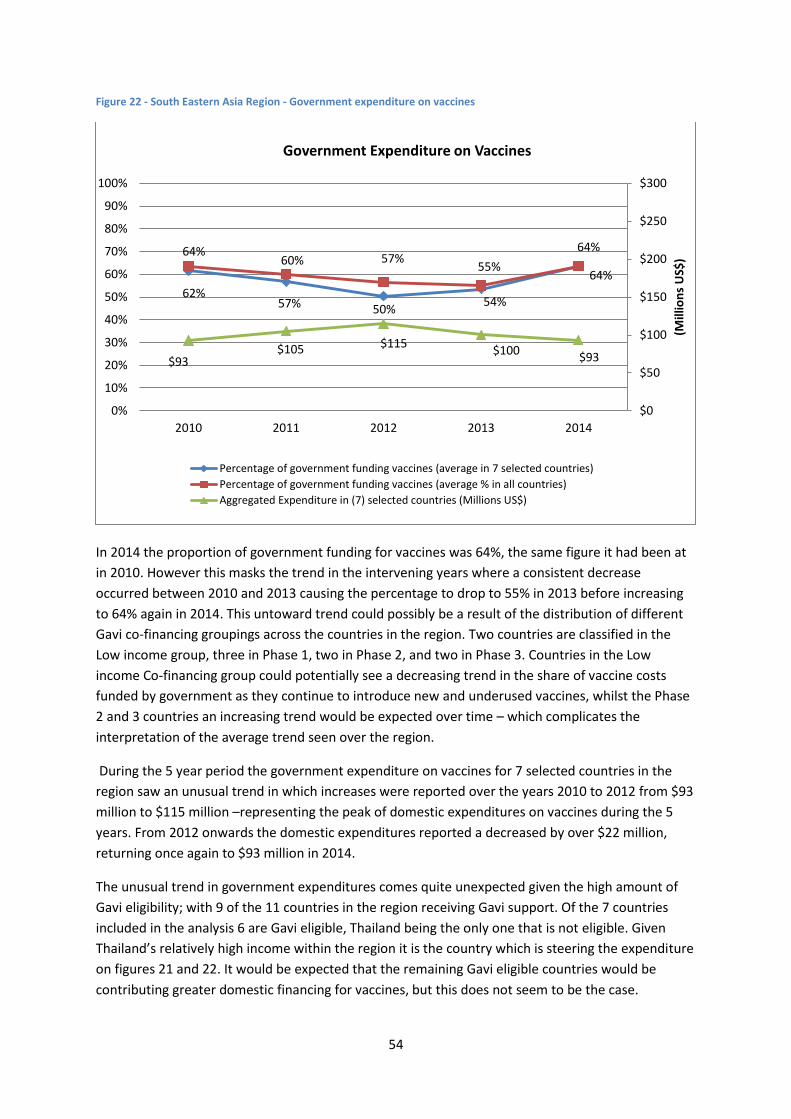
54
Figure 22 - South Eastern Asia Region - Government expenditure on vaccines
In 2014 the proportion of government funding for vaccines was 64%, the same figure it had been at
in 2010. However this masks the trend in the intervening years where a consistent decrease
occurred between 2010 and 2013 causing the percentage to drop to 55% in 2013 before increasing
to 64% again in 2014. This untoward trend could possibly be a result of the distribution of different
Gavi co-financing groupings across the countries in the region. Two countries are classified in the
Low income group, three in Phase 1, two in Phase 2, and two in Phase 3. Countries in the Low
income Co-financing group could potentially see a decreasing trend in the share of vaccine costs
funded by government as they continue to introduce new and underused vaccines, whilst the Phase
2 and 3 countries an increasing trend would be expected over time – which complicates the
interpretation of the average trend seen over the region.
During the 5 year period the government expenditure on vaccines for 7 selected countries in the
region saw an unusual trend in which increases were reported over the years 2010 to 2012 from $93
million to $115 million –representing the peak of domestic expenditures on vaccines during the 5
years. From 2012 onwards the domestic expenditures reported a decreased by over $22 million,
returning once again to $93 million in 2014.
The unusual trend in government expenditures comes quite unexpected given the high amount of
Gavi eligibility; with 9 of the 11 countries in the region receiving Gavi support. Of the 7 countries
included in the analysis 6 are Gavi eligible, Thailand being the only one that is not eligible. Given
Thailand’s relatively high income within the region it is the country which is steering the expenditure
on figures 21 and 22. It would be expected that the remaining Gavi eligible countries would be
contributing greater domestic financing for vaccines, but this does not seem to be the case.
62% 57% 50%
54%
64% 64% 60% 57%
55% 64%
$93 $105 $115
$100 $93
$0
$50
$100
$150
$200
$250
$300
0%
10%
20%
30%
40%
50%
60%
70%
80%
90%
100%
2010 2011 2012 2013 2014
(Mill
ion
s U
S$)
Government Expenditure on Vaccines
Percentage of government funding vaccines (average in 7 selected countries)
Percentage of government funding vaccines (average % in all countries)
Aggregated Expenditure in (7) selected countries (Millions US$)
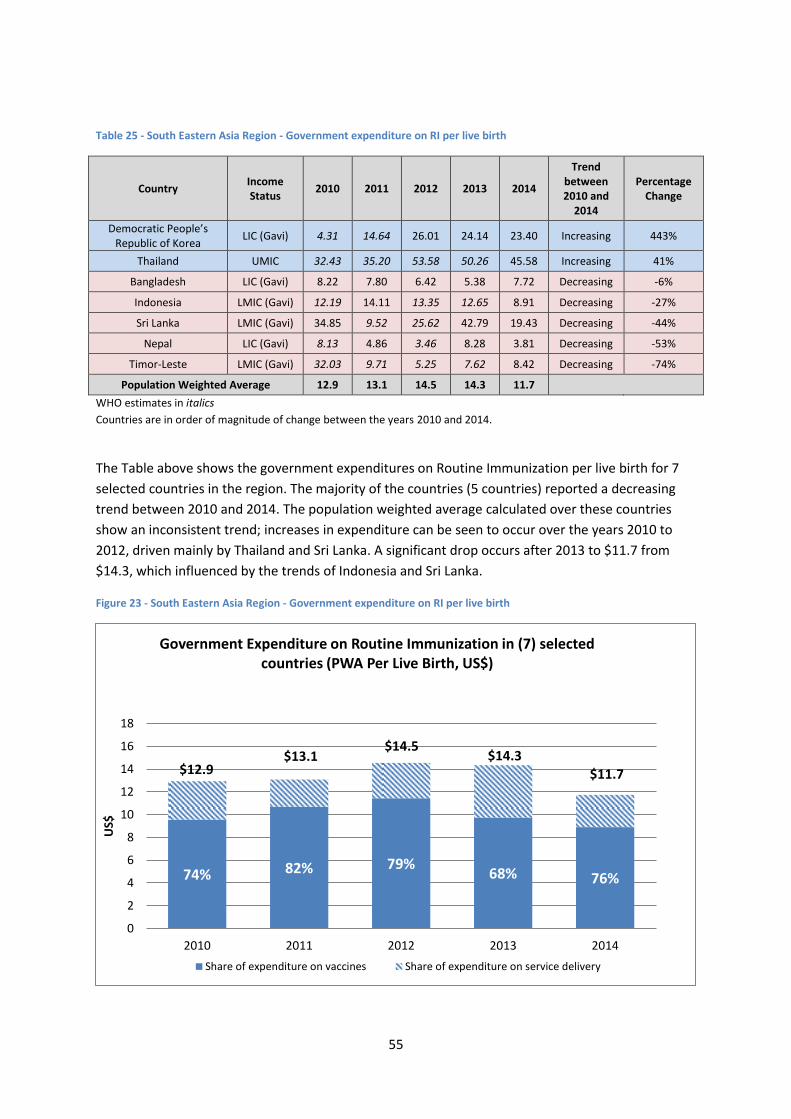
55
Table 25 - South Eastern Asia Region - Government expenditure on RI per live birth
Country Income Status
2010 2011 2012 2013 2014
Trend between 2010 and
2014
Percentage Change
Democratic People’s Republic of Korea
LIC (Gavi) 4.31 14.64 26.01 24.14 23.40 Increasing 443%
Thailand UMIC 32.43 35.20 53.58 50.26 45.58 Increasing 41%
Bangladesh LIC (Gavi) 8.22 7.80 6.42 5.38 7.72 Decreasing -6%
Indonesia LMIC (Gavi) 12.19 14.11 13.35 12.65 8.91 Decreasing -27%
Sri Lanka LMIC (Gavi) 34.85 9.52 25.62 42.79 19.43 Decreasing -44%
Nepal LIC (Gavi) 8.13 4.86 3.46 8.28 3.81 Decreasing -53%
Timor-Leste LMIC (Gavi) 32.03 9.71 5.25 7.62 8.42 Decreasing -74%
Population Weighted Average 12.9 13.1 14.5 14.3 11.7
WHO estimates in italics
Countries are in order of magnitude of change between the years 2010 and 2014.
The Table above shows the government expenditures on Routine Immunization per live birth for 7
selected countries in the region. The majority of the countries (5 countries) reported a decreasing
trend between 2010 and 2014. The population weighted average calculated over these countries
show an inconsistent trend; increases in expenditure can be seen to occur over the years 2010 to
2012, driven mainly by Thailand and Sri Lanka. A significant drop occurs after 2013 to $11.7 from
$14.3, which influenced by the trends of Indonesia and Sri Lanka.
Figure 23 - South Eastern Asia Region - Government expenditure on RI per live birth
74% 82% 79% 68% 76%
$12.9 $13.1
$14.5 $14.3
$11.7
0
2
4
6
8
10
12
14
16
18
2010 2011 2012 2013 2014
US$
Government Expenditure on Routine Immunization in (7) selected countries (PWA Per Live Birth, US$)
Share of expenditure on vaccines Share of expenditure on service delivery
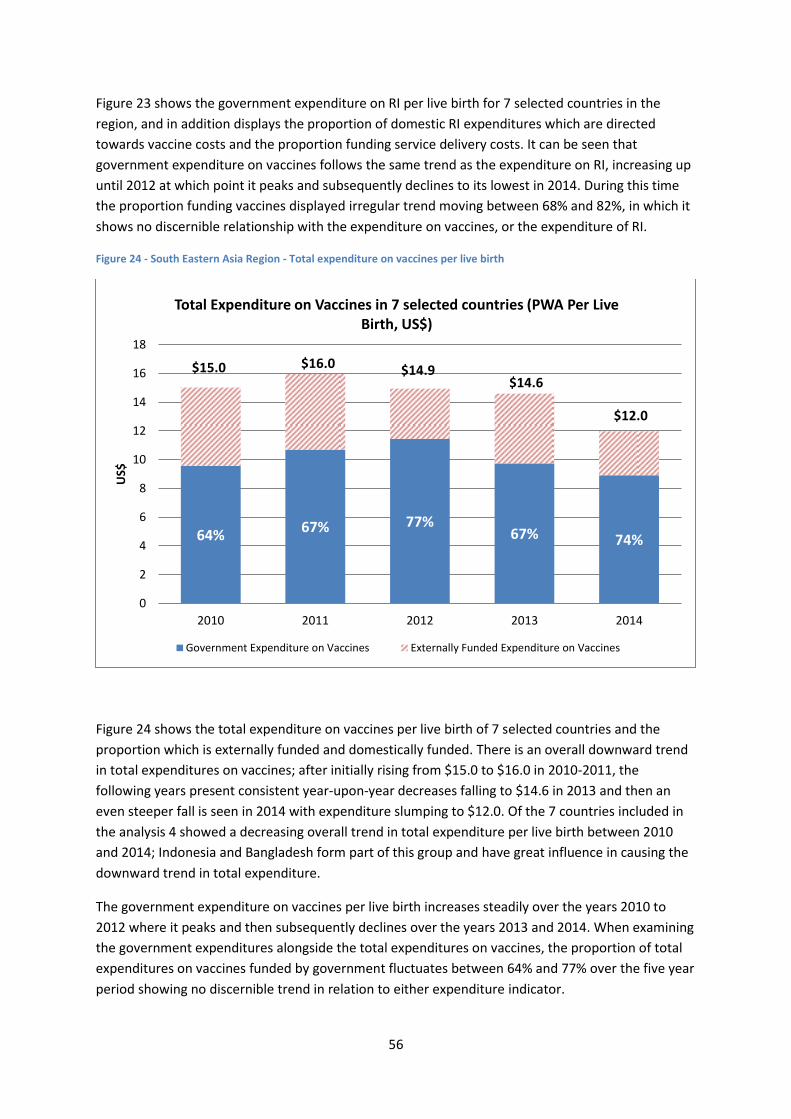
56
Figure 23 shows the government expenditure on RI per live birth for 7 selected countries in the
region, and in addition displays the proportion of domestic RI expenditures which are directed
towards vaccine costs and the proportion funding service delivery costs. It can be seen that
government expenditure on vaccines follows the same trend as the expenditure on RI, increasing up
until 2012 at which point it peaks and subsequently declines to its lowest in 2014. During this time
the proportion funding vaccines displayed irregular trend moving between 68% and 82%, in which it
shows no discernible relationship with the expenditure on vaccines, or the expenditure of RI.
Figure 24 - South Eastern Asia Region - Total expenditure on vaccines per live birth
Figure 24 shows the total expenditure on vaccines per live birth of 7 selected countries and the
proportion which is externally funded and domestically funded. There is an overall downward trend
in total expenditures on vaccines; after initially rising from $15.0 to $16.0 in 2010-2011, the
following years present consistent year-upon-year decreases falling to $14.6 in 2013 and then an
even steeper fall is seen in 2014 with expenditure slumping to $12.0. Of the 7 countries included in
the analysis 4 showed a decreasing overall trend in total expenditure per live birth between 2010
and 2014; Indonesia and Bangladesh form part of this group and have great influence in causing the
downward trend in total expenditure.
The government expenditure on vaccines per live birth increases steadily over the years 2010 to
2012 where it peaks and then subsequently declines over the years 2013 and 2014. When examining
the government expenditures alongside the total expenditures on vaccines, the proportion of total
expenditures on vaccines funded by government fluctuates between 64% and 77% over the five year
period showing no discernible trend in relation to either expenditure indicator.
64% 67% 77%
67% 74%
$15.0 $16.0 $14.9 $14.6
$12.0
0
2
4
6
8
10
12
14
16
18
2010 2011 2012 2013 2014
US$
Total Expenditure on Vaccines in 7 selected countries (PWA Per Live Birth, US$)
Government Expenditure on Vaccines Externally Funded Expenditure on Vaccines
57
It can be seen in Table 24 that only one country in the region has introduced HPV (Bhutan), whilst all
other countries have not introduced this vaccine, Rotavirus vaccine or Pneumococcal conjugate
vaccine all of which are relatively expensive vaccines supported by Gavi. This potentially explains
why there have been no significant increases to total expenditure on vaccines in this region.
Reporting Statistics
Table 26 - South Eastern Asia Region – Reporting statistics
All indicators (66)
2010 2011 2012 2013 2014
Missing 20 (30%) 23 (35%) 23 (35%) 14 (21%) 6 (9%)
Inconsistencies 10 (15%) 3 (5%) 3 (5%) 6 (9%) 4 (6%)
Estimates 20 (30%) 13 (20%) 21 (32%) 12 (18%) 3 (5%)
Table 26 shows a fairly substantial improvement in reporting from countries in the South Eastern
Asian region over the five year period. The percentage of missing indicators decreased from 30% to
9%, signifying an improvement in the quantity of data reported; additionally an improvement in
quality of reporting was reported through the reduction in identified inconsistencies. The
improvement in reporting has allowed for a reduction in the number of estimates calculated by
WHO from 30% to 5% between the years 2010 and 2014.

58
Western Pacific Region
27 countries by income classification and Gavi eligibility:
Income Classification Group
Low Income Lower Middle
Income Upper Middle
Income High Income N/A Total
Total no. of countries 1 10 7 6 3 27
Of which are Gavi eligible 1 6 0 0 0 7
Table 27 – Western Pacific Region – Indicators summary
Indicators 2010 2011 2012 2013 2014
Line item in national budget for vaccines (No. of countries) 24 25 25 25 25
Government Routine Immunization Expenditures:
% of total RI funded by government in the region (average) 59% 65% 66% 77% 71%
% of total RI funded by government in (7) selected countries (average)
36% 40% 41% 52% 48%
Aggregated Expenditure in (7) selected countries (Millions US$) 314 331 340 328 345
Expenditure Per Live Birth in (7) selected countries (PWA US$) 17.3 18.1 18.3 17.4 18.0
Government Vaccine Expenditures:
% of total vaccines funded by government in the region (average) 69% 70% 73% 80% 73%
% of total vaccines funded by government in (7) selected countries (average)
40% 36% 43% 58% 43%
Aggregated Expenditure in (7) selected countries (Millions US$) 277 291 300 291 294
Expenditure Per Live Birth in (7) selected countries (PWA US$) 15.3 15.9 16.2 15.4 15.4
DTP3 Coverage:
DTP3 Coverage in the region (%) 96 96 97 96 96
DTP3 Coverage in (7) selected countries (%) 98 98 98 95 98
Introduction of New and Underused Vaccines (Cumulative no. of countries):
Rotavirus 4 4 5 5 6
PCV 7 8 9 12 14
HPV 7 9 10 11 11
The 7 countries selected for analysis are listed on Table 28
By 2014, 25 of the 27 countries in the Western Pacific region had reported a line item in the national
budget for the procurement of vaccines. In 2011 Solomon Islands reported to having added the line
item to the national budget, but later reported no line item. In 2014 Japan began reporting to having
the line item in their national budget. The two countries in the region who did not report to having a
line item in 2014 were the Solomon Islands and Palau.
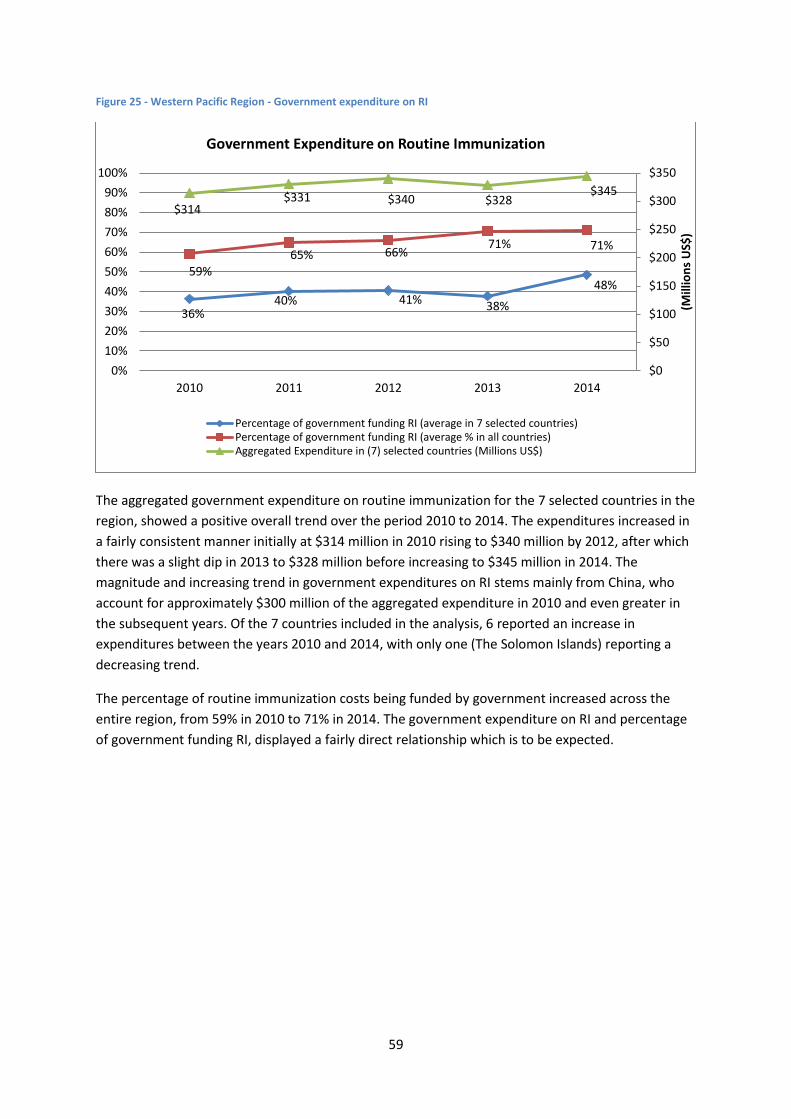
59
Figure 25 - Western Pacific Region - Government expenditure on RI
The aggregated government expenditure on routine immunization for the 7 selected countries in the
region, showed a positive overall trend over the period 2010 to 2014. The expenditures increased in
a fairly consistent manner initially at $314 million in 2010 rising to $340 million by 2012, after which
there was a slight dip in 2013 to $328 million before increasing to $345 million in 2014. The
magnitude and increasing trend in government expenditures on RI stems mainly from China, who
account for approximately $300 million of the aggregated expenditure in 2010 and even greater in
the subsequent years. Of the 7 countries included in the analysis, 6 reported an increase in
expenditures between the years 2010 and 2014, with only one (The Solomon Islands) reporting a
decreasing trend.
The percentage of routine immunization costs being funded by government increased across the
entire region, from 59% in 2010 to 71% in 2014. The government expenditure on RI and percentage
of government funding RI, displayed a fairly direct relationship which is to be expected.
36% 40% 41% 38%
48% 59%
65% 66% 71% 71%
$314 $331 $340 $328
$345
$0
$50
$100
$150
$200
$250
$300
$350
0%
10%
20%
30%
40%
50%
60%
70%
80%
90%
100%
2010 2011 2012 2013 2014
(Mill
ion
s U
S$)
Government Expenditure on Routine Immunization
Percentage of government funding RI (average in 7 selected countries)Percentage of government funding RI (average % in all countries)Aggregated Expenditure in (7) selected countries (Millions US$)
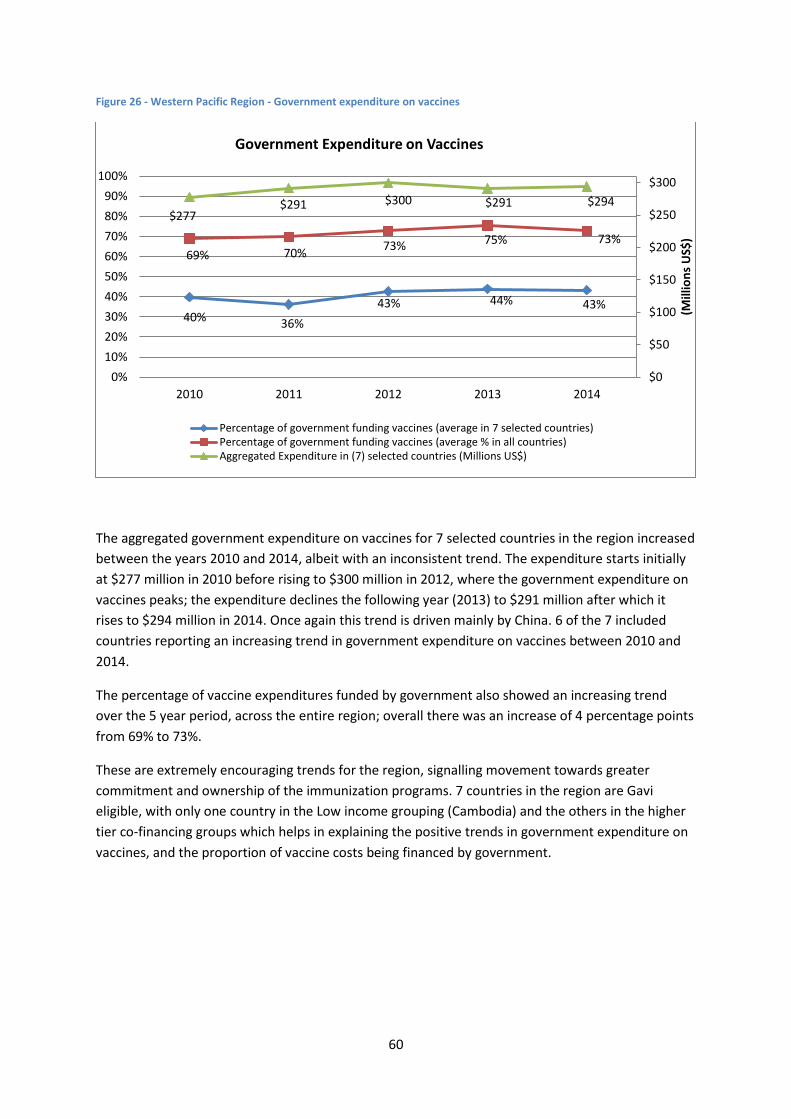
60
Figure 26 - Western Pacific Region - Government expenditure on vaccines
The aggregated government expenditure on vaccines for 7 selected countries in the region increased
between the years 2010 and 2014, albeit with an inconsistent trend. The expenditure starts initially
at $277 million in 2010 before rising to $300 million in 2012, where the government expenditure on
vaccines peaks; the expenditure declines the following year (2013) to $291 million after which it
rises to $294 million in 2014. Once again this trend is driven mainly by China. 6 of the 7 included
countries reporting an increasing trend in government expenditure on vaccines between 2010 and
2014.
The percentage of vaccine expenditures funded by government also showed an increasing trend
over the 5 year period, across the entire region; overall there was an increase of 4 percentage points
from 69% to 73%.
These are extremely encouraging trends for the region, signalling movement towards greater
commitment and ownership of the immunization programs. 7 countries in the region are Gavi
eligible, with only one country in the Low income grouping (Cambodia) and the others in the higher
tier co-financing groups which helps in explaining the positive trends in government expenditure on
vaccines, and the proportion of vaccine costs being financed by government.
40% 36%
43% 44% 43%
69% 70% 73% 75% 73%
$277 $291 $300 $291 $294
$0
$50
$100
$150
$200
$250
$300
0%
10%
20%
30%
40%
50%
60%
70%
80%
90%
100%
2010 2011 2012 2013 2014
(Mill
ion
s U
S$)
Government Expenditure on Vaccines
Percentage of government funding vaccines (average in 7 selected countries)Percentage of government funding vaccines (average % in all countries)Aggregated Expenditure in (7) selected countries (Millions US$)
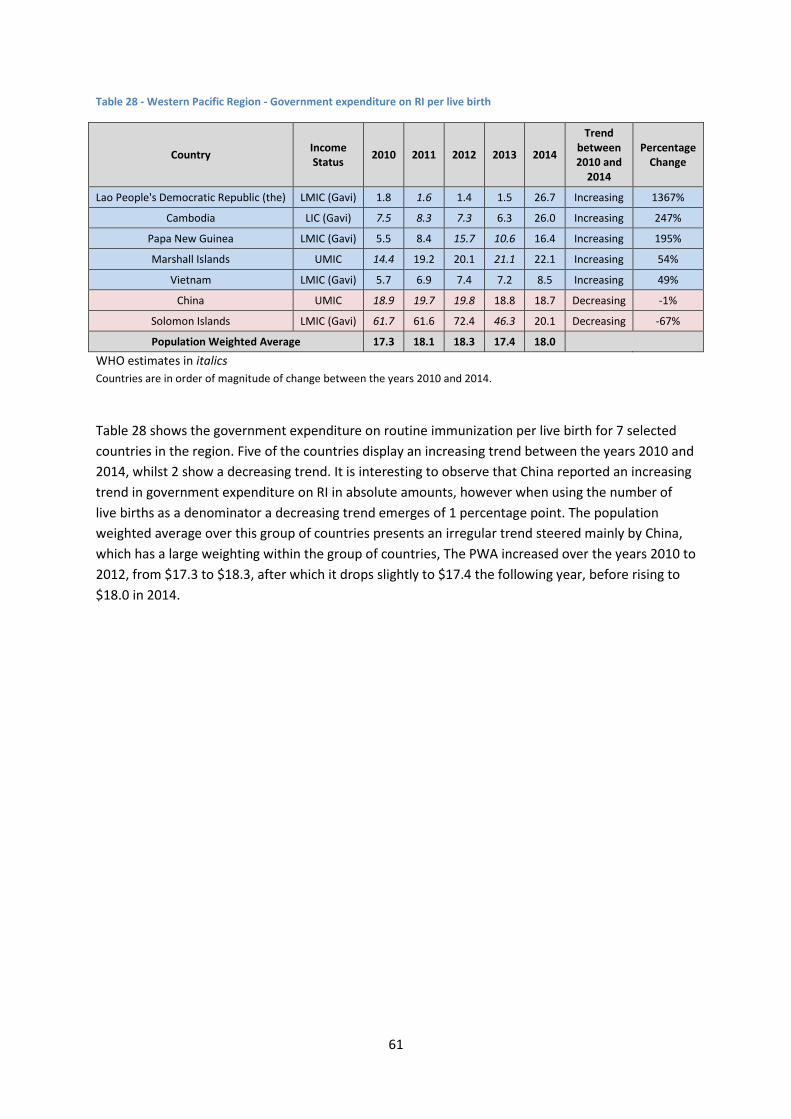
61
Table 28 - Western Pacific Region - Government expenditure on RI per live birth
Country Income Status
2010 2011 2012 2013 2014
Trend between 2010 and
2014
Percentage Change
Lao People's Democratic Republic (the) LMIC (Gavi) 1.8 1.6 1.4 1.5 26.7 Increasing 1367%
Cambodia LIC (Gavi) 7.5 8.3 7.3 6.3 26.0 Increasing 247%
Papa New Guinea LMIC (Gavi) 5.5 8.4 15.7 10.6 16.4 Increasing 195%
Marshall Islands UMIC 14.4 19.2 20.1 21.1 22.1 Increasing 54%
Vietnam LMIC (Gavi) 5.7 6.9 7.4 7.2 8.5 Increasing 49%
China UMIC 18.9 19.7 19.8 18.8 18.7 Decreasing -1%
Solomon Islands LMIC (Gavi) 61.7 61.6 72.4 46.3 20.1 Decreasing -67%
Population Weighted Average 17.3 18.1 18.3 17.4 18.0
WHO estimates in italics
Countries are in order of magnitude of change between the years 2010 and 2014.
Table 28 shows the government expenditure on routine immunization per live birth for 7 selected
countries in the region. Five of the countries display an increasing trend between the years 2010 and
2014, whilst 2 show a decreasing trend. It is interesting to observe that China reported an increasing
trend in government expenditure on RI in absolute amounts, however when using the number of
live births as a denominator a decreasing trend emerges of 1 percentage point. The population
weighted average over this group of countries presents an irregular trend steered mainly by China,
which has a large weighting within the group of countries, The PWA increased over the years 2010 to
2012, from $17.3 to $18.3, after which it drops slightly to $17.4 the following year, before rising to
$18.0 in 2014.
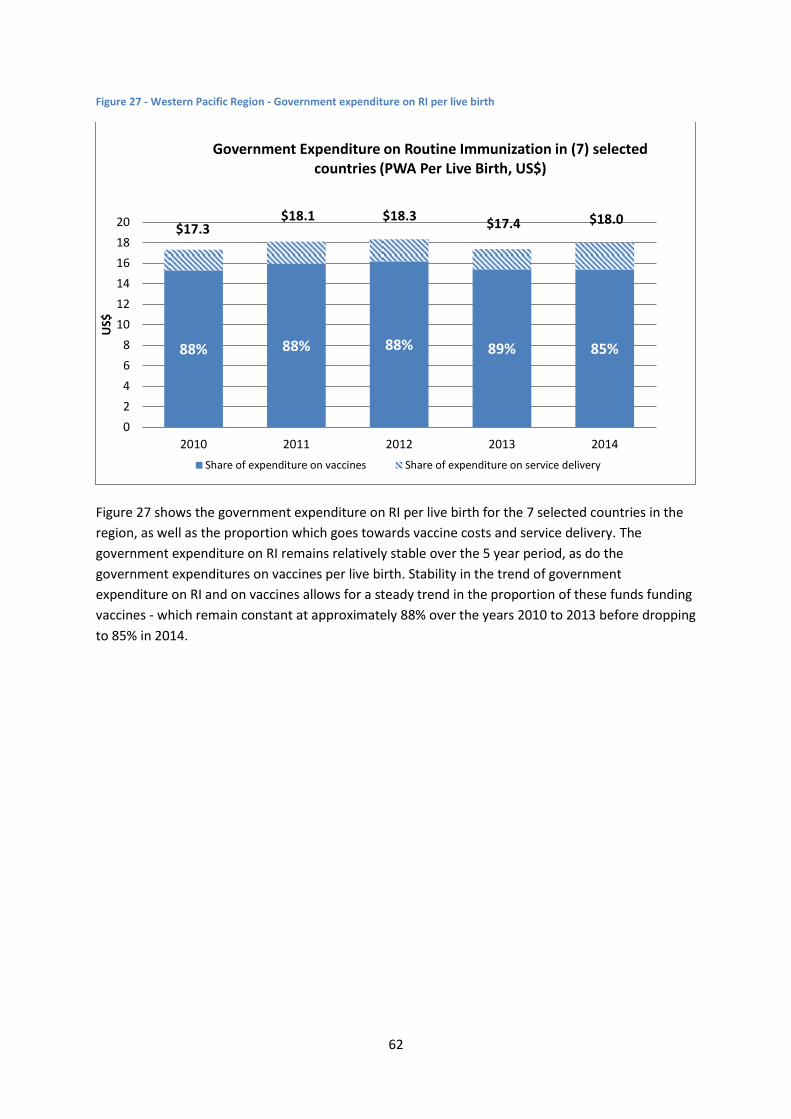
62
Figure 27 - Western Pacific Region - Government expenditure on RI per live birth
Figure 27 shows the government expenditure on RI per live birth for the 7 selected countries in the
region, as well as the proportion which goes towards vaccine costs and service delivery. The
government expenditure on RI remains relatively stable over the 5 year period, as do the
government expenditures on vaccines per live birth. Stability in the trend of government
expenditure on RI and on vaccines allows for a steady trend in the proportion of these funds funding
vaccines - which remain constant at approximately 88% over the years 2010 to 2013 before dropping
to 85% in 2014.
88% 88% 88% 89% 85%
$17.3 $18.1 $18.3
$17.4 $18.0
0
2
4
6
8
10
12
14
16
18
20
2010 2011 2012 2013 2014
US$
Government Expenditure on Routine Immunization in (7) selected countries (PWA Per Live Birth, US$)
Share of expenditure on vaccines Share of expenditure on service delivery
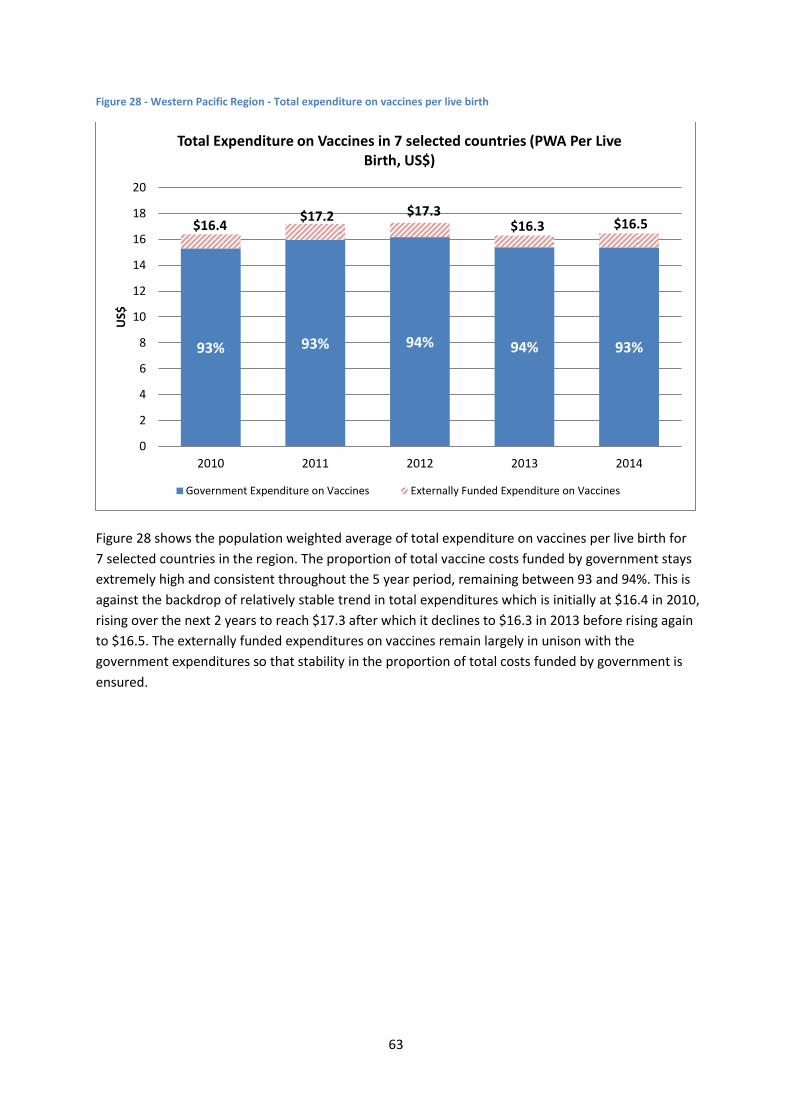
63
Figure 28 - Western Pacific Region - Total expenditure on vaccines per live birth
Figure 28 shows the population weighted average of total expenditure on vaccines per live birth for
7 selected countries in the region. The proportion of total vaccine costs funded by government stays
extremely high and consistent throughout the 5 year period, remaining between 93 and 94%. This is
against the backdrop of relatively stable trend in total expenditures which is initially at $16.4 in 2010,
rising over the next 2 years to reach $17.3 after which it declines to $16.3 in 2013 before rising again
to $16.5. The externally funded expenditures on vaccines remain largely in unison with the
government expenditures so that stability in the proportion of total costs funded by government is
ensured.
93% 93% 94% 94% 93%
$16.4 $17.2 $17.3
$16.3 $16.5
0
2
4
6
8
10
12
14
16
18
20
2010 2011 2012 2013 2014
US$
Total Expenditure on Vaccines in 7 selected countries (PWA Per Live Birth, US$)
Government Expenditure on Vaccines Externally Funded Expenditure on Vaccines
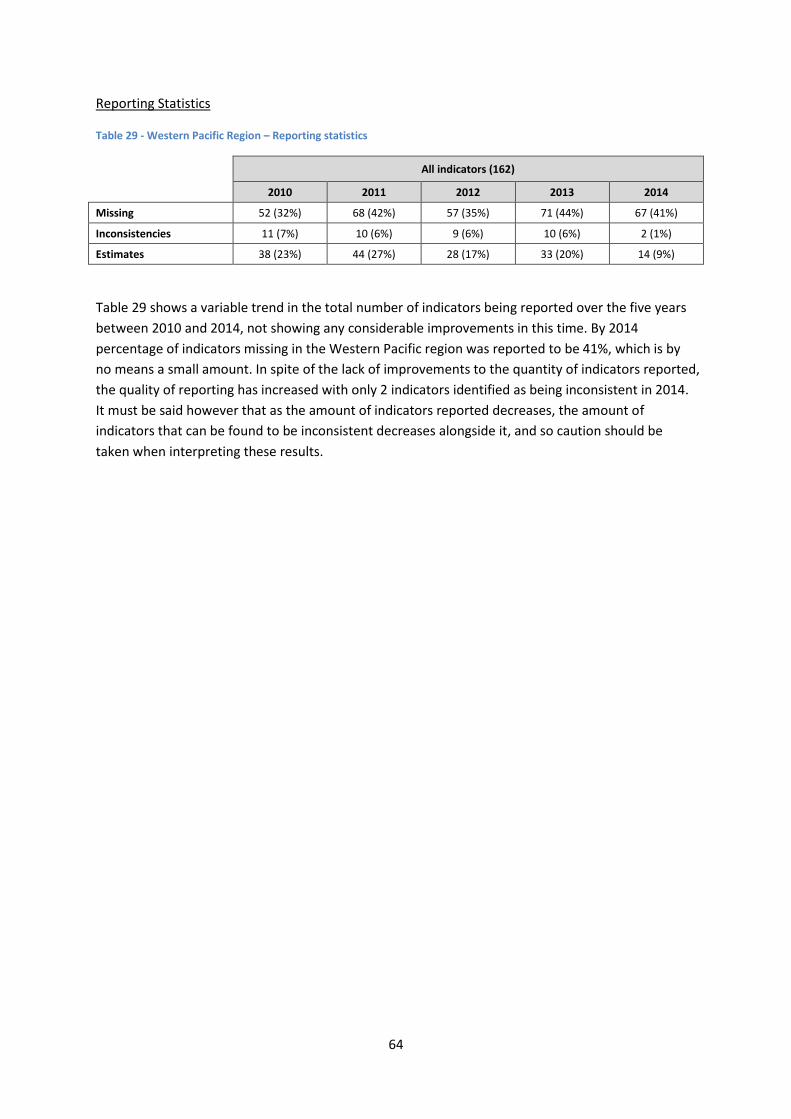
64
Reporting Statistics
Table 29 - Western Pacific Region – Reporting statistics
All indicators (162)
2010 2011 2012 2013 2014
Missing 52 (32%) 68 (42%) 57 (35%) 71 (44%) 67 (41%)
Inconsistencies 11 (7%) 10 (6%) 9 (6%) 10 (6%) 2 (1%)
Estimates 38 (23%) 44 (27%) 28 (17%) 33 (20%) 14 (9%)
Table 29 shows a variable trend in the total number of indicators being reported over the five years
between 2010 and 2014, not showing any considerable improvements in this time. By 2014
percentage of indicators missing in the Western Pacific region was reported to be 41%, which is by
no means a small amount. In spite of the lack of improvements to the quantity of indicators reported,
the quality of reporting has increased with only 2 indicators identified as being inconsistent in 2014.
It must be said however that as the amount of indicators reported decreases, the amount of
indicators that can be found to be inconsistent decreases alongside it, and so caution should be
taken when interpreting these results.
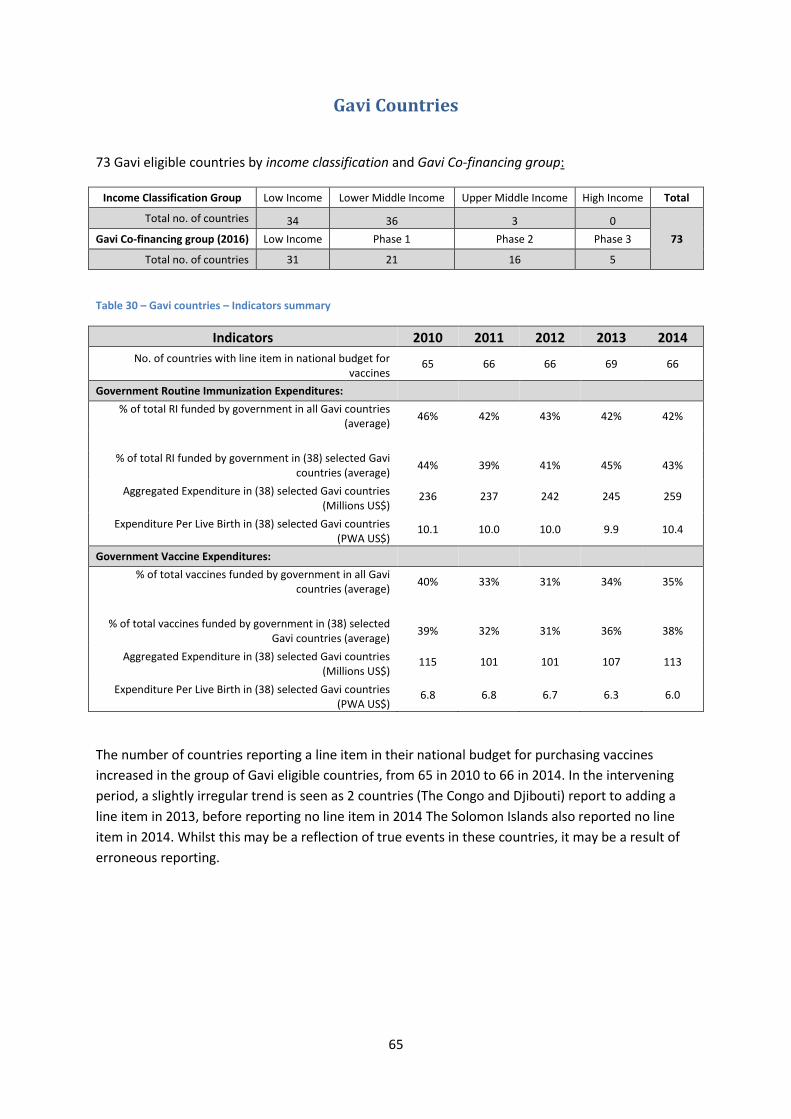
65
Gavi Countries
73 Gavi eligible countries by income classification and Gavi Co-financing group:
Income Classification Group Low Income Lower Middle Income Upper Middle Income High Income Total
Total no. of countries 34 36 3 0
73 Gavi Co-financing group (2016) Low Income Phase 1 Phase 2 Phase 3
Total no. of countries 31 21 16 5
Table 30 – Gavi countries – Indicators summary
Indicators 2010 2011 2012 2013 2014
No. of countries with line item in national budget for vaccines
65 66 66 69 66
Government Routine Immunization Expenditures:
% of total RI funded by government in all Gavi countries (average)
46% 42% 43% 42% 42%
% of total RI funded by government in (38) selected Gavi countries (average)
44% 39% 41% 45% 43%
Aggregated Expenditure in (38) selected Gavi countries (Millions US$)
236 237 242 245 259
Expenditure Per Live Birth in (38) selected Gavi countries (PWA US$)
10.1 10.0 10.0 9.9 10.4
Government Vaccine Expenditures:
% of total vaccines funded by government in all Gavi countries (average)
40% 33% 31% 34% 35%
% of total vaccines funded by government in (38) selected Gavi countries (average)
39% 32% 31% 36% 38%
Aggregated Expenditure in (38) selected Gavi countries (Millions US$)
115 101 101 107 113
Expenditure Per Live Birth in (38) selected Gavi countries (PWA US$)
6.8 6.8 6.7 6.3 6.0
The number of countries reporting a line item in their national budget for purchasing vaccines
increased in the group of Gavi eligible countries, from 65 in 2010 to 66 in 2014. In the intervening
period, a slightly irregular trend is seen as 2 countries (The Congo and Djibouti) report to adding a
line item in 2013, before reporting no line item in 2014 The Solomon Islands also reported no line
item in 2014. Whilst this may be a reflection of true events in these countries, it may be a result of
erroneous reporting.

66
Figure 29 - Gavi countries - Government expenditure on RI
Amongst the 38 Gavi countries9 with full time-series that were included in the analysis, an overall
increasing trend is seen in the government expenditure on routine immunization, from $236 million
to $259 million.
The percentage of government funding for routine immunization across all Gavi countries showed an
varying trend over the five-year period, however the magnitude of change between each of the
years was relatively small allowing the percentage of government funding to remain fairly stable
around 43%.
9 See Table 1
46% 42% 43%
42% 42%
44% 39% 41%
45% 43%
$236 $237 $242 $245 $259
$0
$50
$100
$150
$200
$250
$300
0%
10%
20%
30%
40%
50%
60%
70%
80%
90%
100%
2010 2011 2012 2013 2014
(Mill
ion
s U
S$)
Government Expenditure on Routine Immunization
Percentage of government funding RI (Average % in all Gavi countries)
Percentage of government funding RI (Average % in 38 selected countries)
Aggregated Government Expenditure on RI (in 38 selected countries US$)
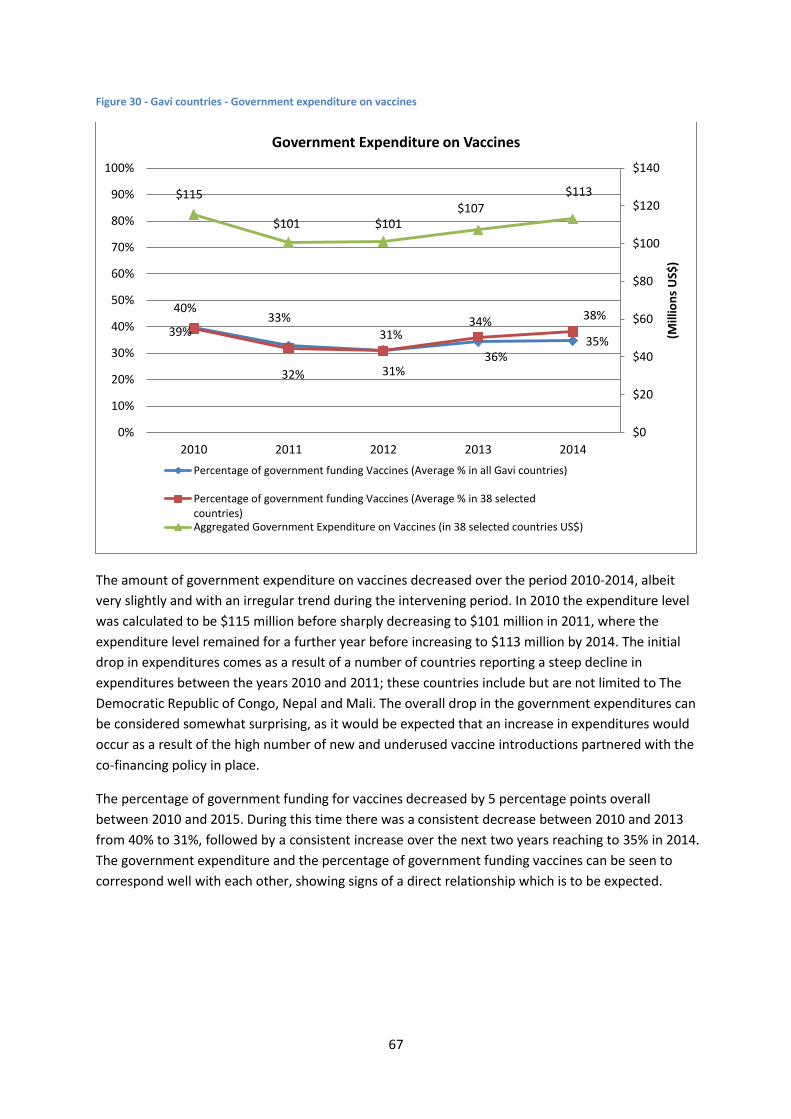
67
Figure 30 - Gavi countries - Government expenditure on vaccines
The amount of government expenditure on vaccines decreased over the period 2010-2014, albeit
very slightly and with an irregular trend during the intervening period. In 2010 the expenditure level
was calculated to be $115 million before sharply decreasing to $101 million in 2011, where the
expenditure level remained for a further year before increasing to $113 million by 2014. The initial
drop in expenditures comes as a result of a number of countries reporting a steep decline in
expenditures between the years 2010 and 2011; these countries include but are not limited to The
Democratic Republic of Congo, Nepal and Mali. The overall drop in the government expenditures can
be considered somewhat surprising, as it would be expected that an increase in expenditures would
occur as a result of the high number of new and underused vaccine introductions partnered with the
co-financing policy in place.
The percentage of government funding for vaccines decreased by 5 percentage points overall
between 2010 and 2015. During this time there was a consistent decrease between 2010 and 2013
from 40% to 31%, followed by a consistent increase over the next two years reaching to 35% in 2014.
The government expenditure and the percentage of government funding vaccines can be seen to
correspond well with each other, showing signs of a direct relationship which is to be expected.
40% 33%
31%
34%
35% 39%
32%
31%
36%
38%
$115
$101 $101 $107
$113
$0
$20
$40
$60
$80
$100
$120
$140
0%
10%
20%
30%
40%
50%
60%
70%
80%
90%
100%
2010 2011 2012 2013 2014
(Mill
ion
s U
S$)
Government Expenditure on Vaccines
Percentage of government funding Vaccines (Average % in all Gavi countries)
Percentage of government funding Vaccines (Average % in 38 selectedcountries)Aggregated Government Expenditure on Vaccines (in 38 selected countries US$)
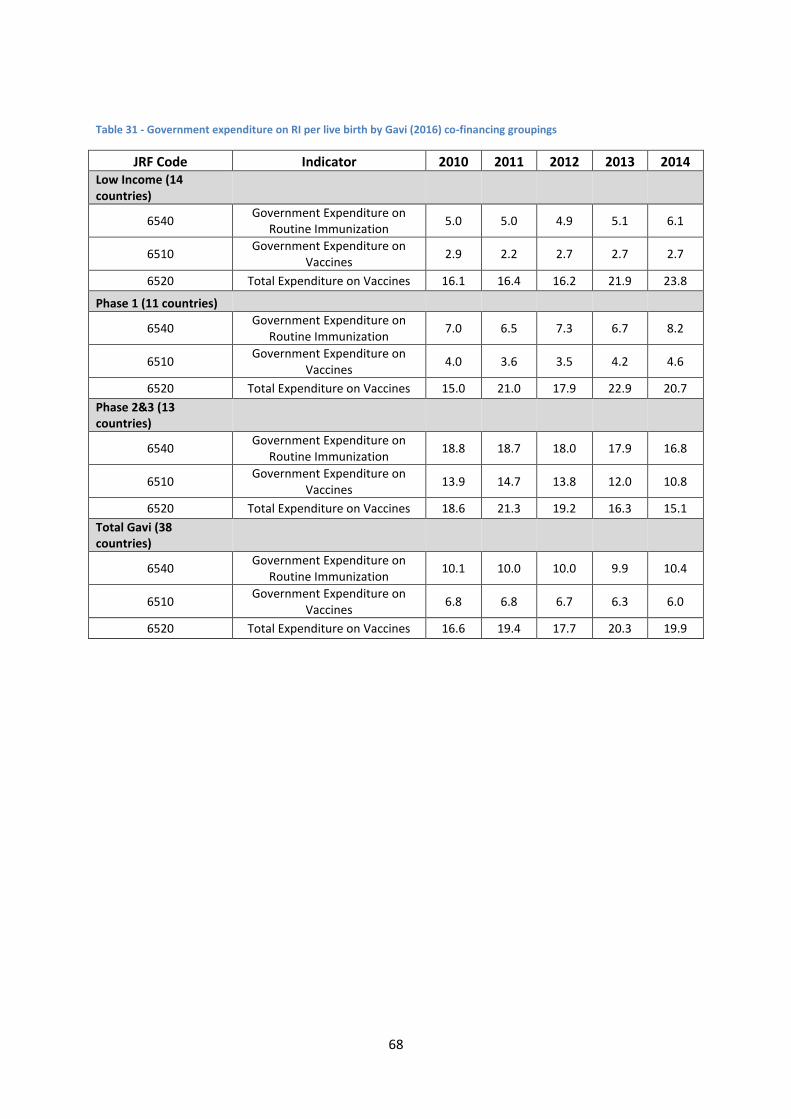
68
Table 31 - Government expenditure on RI per live birth by Gavi (2016) co-financing groupings
JRF Code Indicator 2010 2011 2012 2013 2014 Low Income (14 countries)
6540 Government Expenditure on
Routine Immunization 5.0 5.0 4.9 5.1 6.1
6510 Government Expenditure on
Vaccines 2.9 2.2 2.7 2.7 2.7
6520 Total Expenditure on Vaccines 16.1 16.4 16.2 21.9 23.8
Phase 1 (11 countries)
6540 Government Expenditure on
Routine Immunization 7.0 6.5 7.3 6.7 8.2
6510 Government Expenditure on
Vaccines 4.0 3.6 3.5 4.2 4.6
6520 Total Expenditure on Vaccines 15.0 21.0 17.9 22.9 20.7
Phase 2&3 (13 countries)
6540 Government Expenditure on
Routine Immunization 18.8 18.7 18.0 17.9 16.8
6510 Government Expenditure on
Vaccines 13.9 14.7 13.8 12.0 10.8
6520 Total Expenditure on Vaccines 18.6 21.3 19.2 16.3 15.1
Total Gavi (38 countries)
6540 Government Expenditure on
Routine Immunization 10.1 10.0 10.0 9.9 10.4
6510 Government Expenditure on
Vaccines 6.8 6.8 6.7 6.3 6.0
6520 Total Expenditure on Vaccines 16.6 19.4 17.7 20.3 19.9
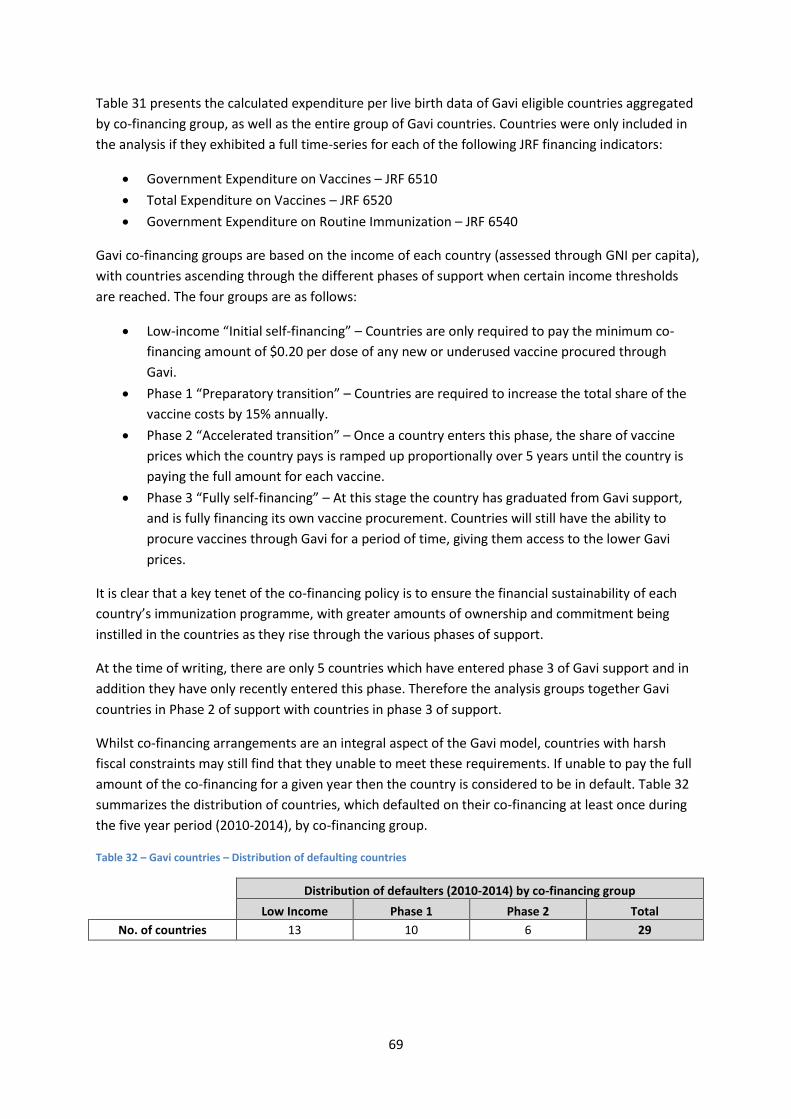
69
Table 31 presents the calculated expenditure per live birth data of Gavi eligible countries aggregated
by co-financing group, as well as the entire group of Gavi countries. Countries were only included in
the analysis if they exhibited a full time-series for each of the following JRF financing indicators:
Government Expenditure on Vaccines – JRF 6510
Total Expenditure on Vaccines – JRF 6520
Government Expenditure on Routine Immunization – JRF 6540
Gavi co-financing groups are based on the income of each country (assessed through GNI per capita),
with countries ascending through the different phases of support when certain income thresholds
are reached. The four groups are as follows:
Low-income “Initial self-financing” – Countries are only required to pay the minimum co-
financing amount of $0.20 per dose of any new or underused vaccine procured through
Gavi.
Phase 1 “Preparatory transition” – Countries are required to increase the total share of the
vaccine costs by 15% annually.
Phase 2 “Accelerated transition” – Once a country enters this phase, the share of vaccine
prices which the country pays is ramped up proportionally over 5 years until the country is
paying the full amount for each vaccine.
Phase 3 “Fully self-financing” – At this stage the country has graduated from Gavi support,
and is fully financing its own vaccine procurement. Countries will still have the ability to
procure vaccines through Gavi for a period of time, giving them access to the lower Gavi
prices.
It is clear that a key tenet of the co-financing policy is to ensure the financial sustainability of each
country’s immunization programme, with greater amounts of ownership and commitment being
instilled in the countries as they rise through the various phases of support.
At the time of writing, there are only 5 countries which have entered phase 3 of Gavi support and in
addition they have only recently entered this phase. Therefore the analysis groups together Gavi
countries in Phase 2 of support with countries in phase 3 of support.
Whilst co-financing arrangements are an integral aspect of the Gavi model, countries with harsh
fiscal constraints may still find that they unable to meet these requirements. If unable to pay the full
amount of the co-financing for a given year then the country is considered to be in default. Table 32
summarizes the distribution of countries, which defaulted on their co-financing at least once during
the five year period (2010-2014), by co-financing group.
Table 32 – Gavi countries – Distribution of defaulting countries
Distribution of defaulters (2010-2014) by co-financing group
Low Income Phase 1 Phase 2 Total
No. of countries 13 10 6 29
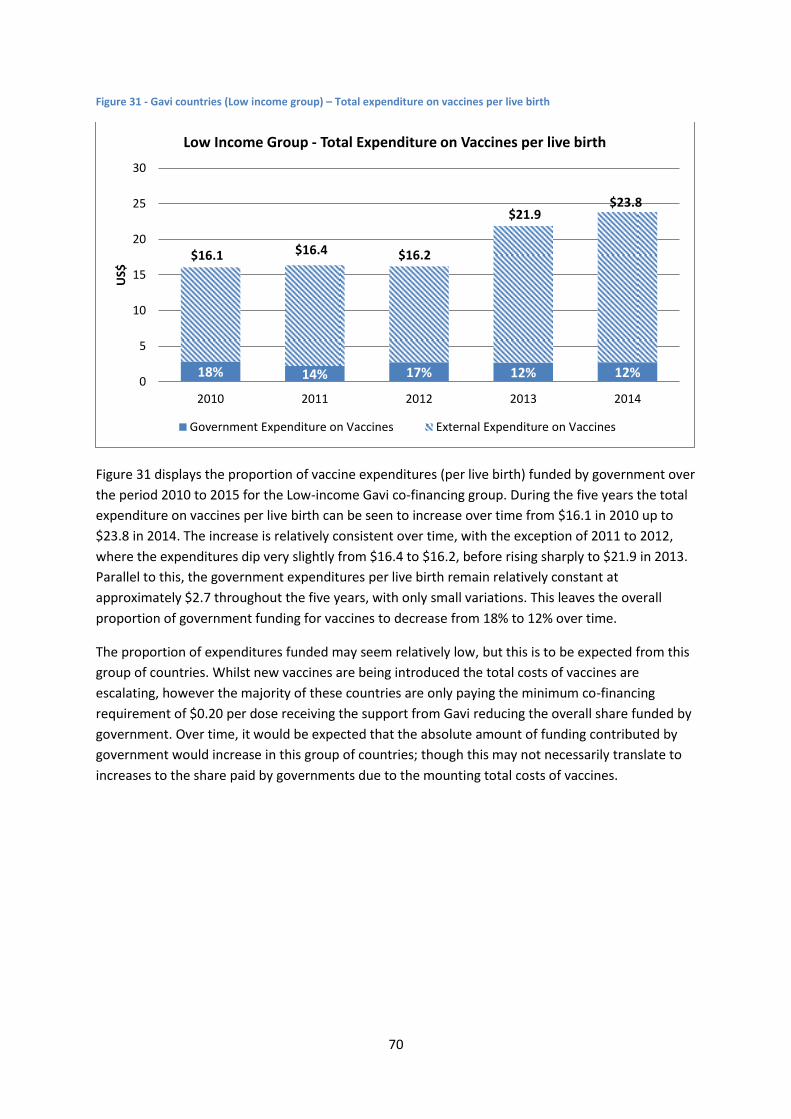
70
Figure 31 - Gavi countries (Low income group) – Total expenditure on vaccines per live birth
Figure 31 displays the proportion of vaccine expenditures (per live birth) funded by government over
the period 2010 to 2015 for the Low-income Gavi co-financing group. During the five years the total
expenditure on vaccines per live birth can be seen to increase over time from $16.1 in 2010 up to
$23.8 in 2014. The increase is relatively consistent over time, with the exception of 2011 to 2012,
where the expenditures dip very slightly from $16.4 to $16.2, before rising sharply to $21.9 in 2013.
Parallel to this, the government expenditures per live birth remain relatively constant at
approximately $2.7 throughout the five years, with only small variations. This leaves the overall
proportion of government funding for vaccines to decrease from 18% to 12% over time.
The proportion of expenditures funded may seem relatively low, but this is to be expected from this
group of countries. Whilst new vaccines are being introduced the total costs of vaccines are
escalating, however the majority of these countries are only paying the minimum co-financing
requirement of $0.20 per dose receiving the support from Gavi reducing the overall share funded by
government. Over time, it would be expected that the absolute amount of funding contributed by
government would increase in this group of countries; though this may not necessarily translate to
increases to the share paid by governments due to the mounting total costs of vaccines.
18% 14% 17% 12% 12%
$16.1 $16.4 $16.2
$21.9 $23.8
0
5
10
15
20
25
30
2010 2011 2012 2013 2014
US$
Low Income Group - Total Expenditure on Vaccines per live birth
Government Expenditure on Vaccines External Expenditure on Vaccines
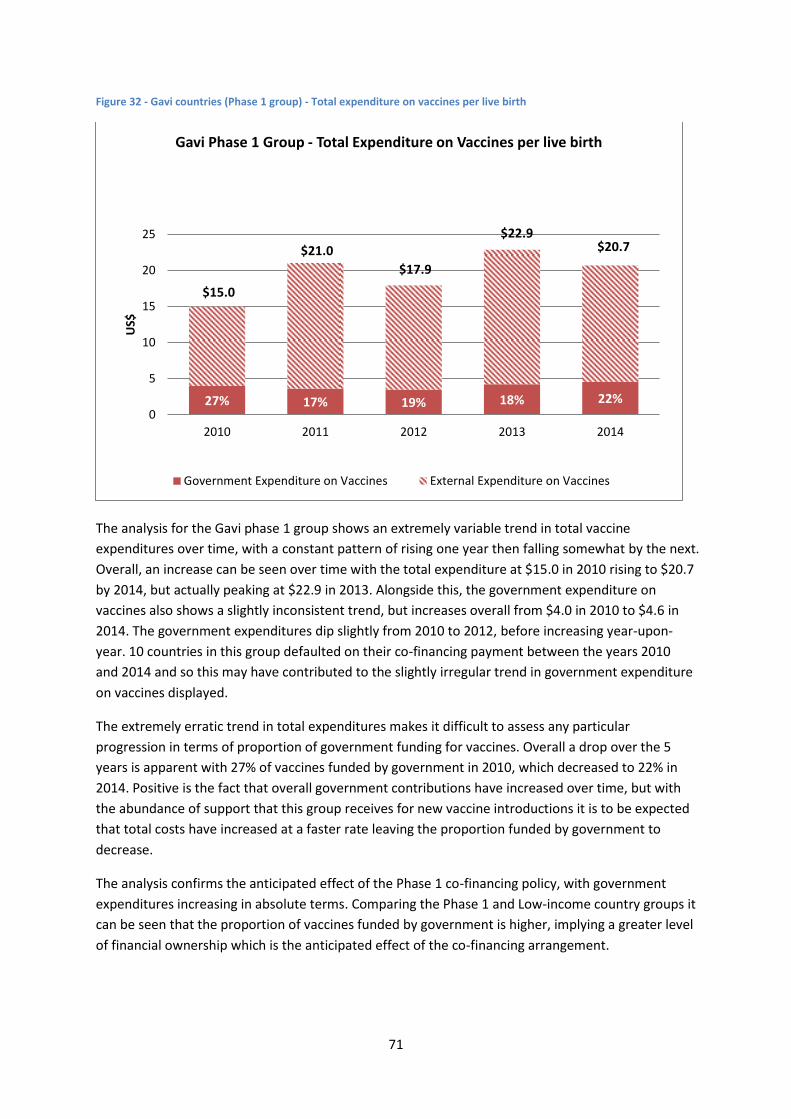
71
Figure 32 - Gavi countries (Phase 1 group) - Total expenditure on vaccines per live birth
The analysis for the Gavi phase 1 group shows an extremely variable trend in total vaccine
expenditures over time, with a constant pattern of rising one year then falling somewhat by the next.
Overall, an increase can be seen over time with the total expenditure at $15.0 in 2010 rising to $20.7
by 2014, but actually peaking at $22.9 in 2013. Alongside this, the government expenditure on
vaccines also shows a slightly inconsistent trend, but increases overall from $4.0 in 2010 to $4.6 in
2014. The government expenditures dip slightly from 2010 to 2012, before increasing year-upon-
year. 10 countries in this group defaulted on their co-financing payment between the years 2010
and 2014 and so this may have contributed to the slightly irregular trend in government expenditure
on vaccines displayed.
The extremely erratic trend in total expenditures makes it difficult to assess any particular
progression in terms of proportion of government funding for vaccines. Overall a drop over the 5
years is apparent with 27% of vaccines funded by government in 2010, which decreased to 22% in
2014. Positive is the fact that overall government contributions have increased over time, but with
the abundance of support that this group receives for new vaccine introductions it is to be expected
that total costs have increased at a faster rate leaving the proportion funded by government to
decrease.
The analysis confirms the anticipated effect of the Phase 1 co-financing policy, with government
expenditures increasing in absolute terms. Comparing the Phase 1 and Low-income country groups it
can be seen that the proportion of vaccines funded by government is higher, implying a greater level
of financial ownership which is the anticipated effect of the co-financing arrangement.
27% 17% 19% 18% 22%
$15.0
$21.0
$17.9
$22.9 $20.7
0
5
10
15
20
25
2010 2011 2012 2013 2014
US$
Gavi Phase 1 Group - Total Expenditure on Vaccines per live birth
Government Expenditure on Vaccines External Expenditure on Vaccines
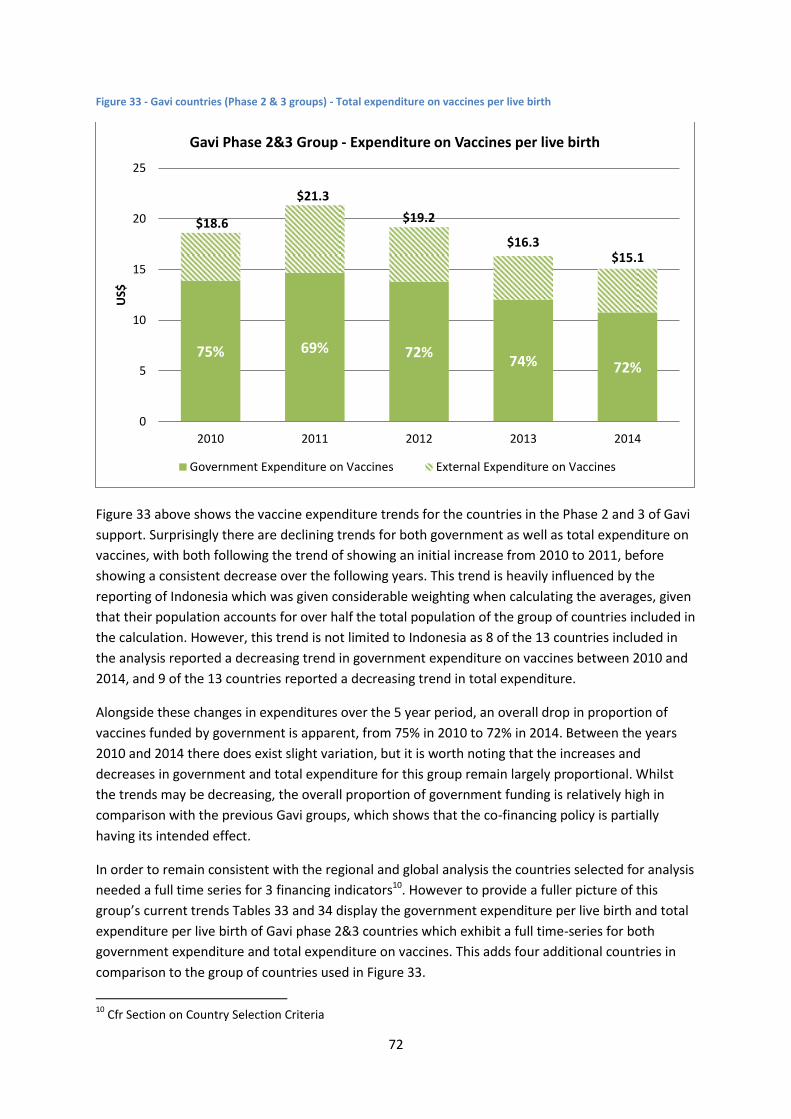
72
Figure 33 - Gavi countries (Phase 2 & 3 groups) - Total expenditure on vaccines per live birth
Figure 33 above shows the vaccine expenditure trends for the countries in the Phase 2 and 3 of Gavi
support. Surprisingly there are declining trends for both government as well as total expenditure on
vaccines, with both following the trend of showing an initial increase from 2010 to 2011, before
showing a consistent decrease over the following years. This trend is heavily influenced by the
reporting of Indonesia which was given considerable weighting when calculating the averages, given
that their population accounts for over half the total population of the group of countries included in
the calculation. However, this trend is not limited to Indonesia as 8 of the 13 countries included in
the analysis reported a decreasing trend in government expenditure on vaccines between 2010 and
2014, and 9 of the 13 countries reported a decreasing trend in total expenditure.
Alongside these changes in expenditures over the 5 year period, an overall drop in proportion of
vaccines funded by government is apparent, from 75% in 2010 to 72% in 2014. Between the years
2010 and 2014 there does exist slight variation, but it is worth noting that the increases and
decreases in government and total expenditure for this group remain largely proportional. Whilst
the trends may be decreasing, the overall proportion of government funding is relatively high in
comparison with the previous Gavi groups, which shows that the co-financing policy is partially
having its intended effect.
In order to remain consistent with the regional and global analysis the countries selected for analysis
needed a full time series for 3 financing indicators10. However to provide a fuller picture of this
group’s current trends Tables 33 and 34 display the government expenditure per live birth and total
expenditure per live birth of Gavi phase 2&3 countries which exhibit a full time-series for both
government expenditure and total expenditure on vaccines. This adds four additional countries in
comparison to the group of countries used in Figure 33.
10
Cfr Section on Country Selection Criteria
75% 69% 72% 74% 72%
$18.6
$21.3
$19.2
$16.3 $15.1
0
5
10
15
20
25
2010 2011 2012 2013 2014
US$
Gavi Phase 2&3 Group - Expenditure on Vaccines per live birth
Government Expenditure on Vaccines External Expenditure on Vaccines
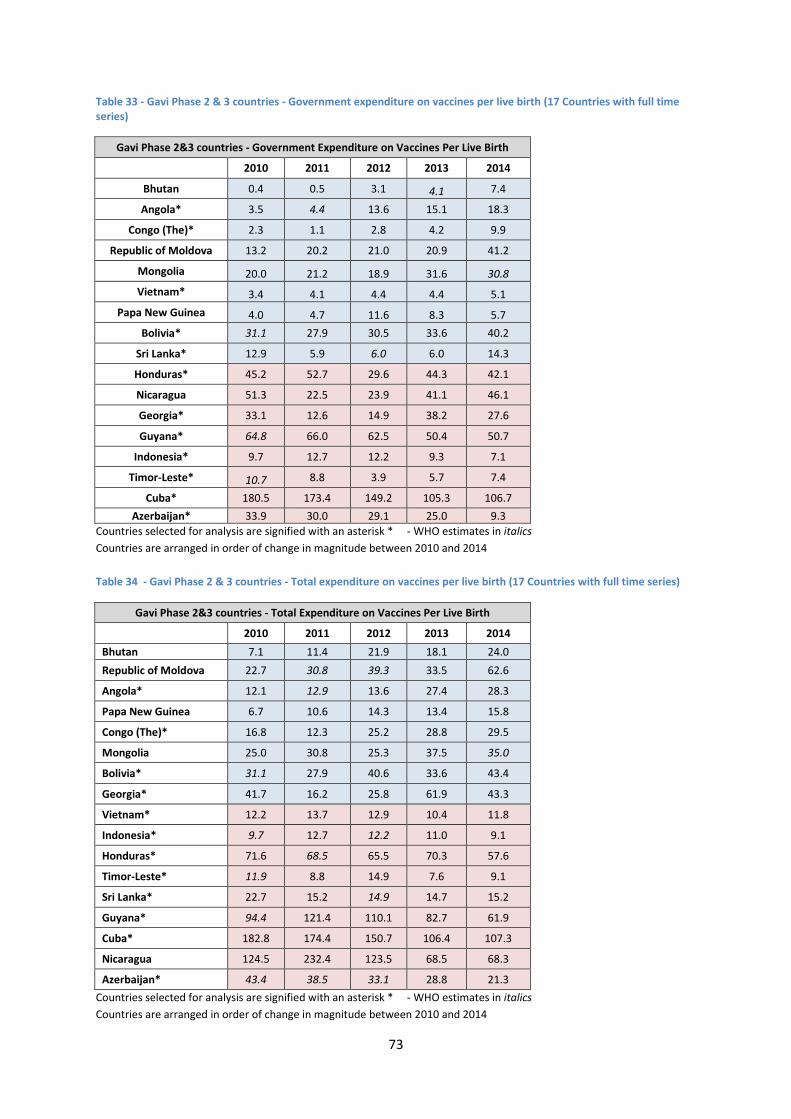
73
Table 33 - Gavi Phase 2 & 3 countries - Government expenditure on vaccines per live birth (17 Countries with full time series)
Gavi Phase 2&3 countries - Government Expenditure on Vaccines Per Live Birth
2010 2011 2012 2013 2014
Bhutan 0.4 0.5 3.1 4.1 7.4
Angola* 3.5 4.4 13.6 15.1 18.3
Congo (The)* 2.3 1.1 2.8 4.2 9.9
Republic of Moldova 13.2 20.2 21.0 20.9 41.2
Mongolia 20.0 21.2 18.9 31.6 30.8
Vietnam* 3.4 4.1 4.4 4.4 5.1
Papa New Guinea 4.0 4.7 11.6 8.3 5.7
Bolivia* 31.1 27.9 30.5 33.6 40.2
Sri Lanka* 12.9 5.9 6.0 6.0 14.3
Honduras* 45.2 52.7 29.6 44.3 42.1
Nicaragua 51.3 22.5 23.9 41.1 46.1
Georgia* 33.1 12.6 14.9 38.2 27.6
Guyana* 64.8 66.0 62.5 50.4 50.7
Indonesia* 9.7 12.7 12.2 9.3 7.1
Timor-Leste* 10.7 8.8 3.9 5.7 7.4
Cuba* 180.5 173.4 149.2 105.3 106.7
Azerbaijan* 33.9 30.0 29.1 25.0 9.3
Countries selected for analysis are signified with an asterisk * - WHO estimates in italics
Countries are arranged in order of change in magnitude between 2010 and 2014
Table 34 - Gavi Phase 2 & 3 countries - Total expenditure on vaccines per live birth (17 Countries with full time series)
Gavi Phase 2&3 countries - Total Expenditure on Vaccines Per Live Birth
2010 2011 2012 2013 2014
Bhutan 7.1 11.4 21.9 18.1 24.0
Republic of Moldova 22.7 30.8 39.3 33.5 62.6
Angola* 12.1 12.9 13.6 27.4 28.3
Papa New Guinea 6.7 10.6 14.3 13.4 15.8
Congo (The)* 16.8 12.3 25.2 28.8 29.5
Mongolia 25.0 30.8 25.3 37.5 35.0
Bolivia* 31.1 27.9 40.6 33.6 43.4
Georgia* 41.7 16.2 25.8 61.9 43.3
Vietnam* 12.2 13.7 12.9 10.4 11.8
Indonesia* 9.7 12.7 12.2 11.0 9.1
Honduras* 71.6 68.5 65.5 70.3 57.6
Timor-Leste* 11.9 8.8 14.9 7.6 9.1
Sri Lanka* 22.7 15.2 14.9 14.7 15.2
Guyana* 94.4 121.4 110.1 82.7 61.9
Cuba* 182.8 174.4 150.7 106.4 107.3
Nicaragua 124.5 232.4 123.5 68.5 68.3
Azerbaijan* 43.4 38.5 33.1 28.8 21.3
Countries selected for analysis are signified with an asterisk * - WHO estimates in italics
Countries are arranged in order of change in magnitude between 2010 and 2014
74
Conclusion
By 2014 the majority of WHO member states had reported a specific line item in the national budget
for the purchasing of vaccines. 89% (173 countries) of all member states reported the inclusion of
the line item in 2014, which represents an increase from 2010 where 88% of all member states (170
countries) reported positively of the line item. Additionally by 2014, 90% of all Gavi eligible countries
had reported the inclusion of the line item. Whilst this can be interpreted fairly positively, in that
governments are showing greater commitment to the financing of immunization, it must be
remembered that the line item does not serve as a guarantee of greater budgetary allocations for
immunization.
The global analysis showed that governments increased their expenditure on vaccines over the five
year period, with the aggregated expenditure of 70 countries with full time-series showing an
increase from 1,535 million US$ in 2010 to 1,893 million US$ in 2014. During this time however,
donor funds for vaccines increased at a faster rate meaning that the percentage of total vaccine
costs funded by government decreased from 73% in 2010 to 70% in 2014.
The analysis also showed that on average, governments channelled approximately 87% of their
domestic routine immunization expenditures towards vaccine costs, which leads to similar trends
appearing when viewing the government expenditures on routine immunization. When the
aggregated government expenditure on routine immunization is calculated over the same 70
countries with a full time series, there is an increase from 1,759 million US$ in 2010, to 2,164 million
in 2014. Given the fact that routine immunization also captures vaccines, the growth in donor
support for vaccine costs has caused the proportion of total routine immunization costs funded by
government, which fell from 75% in 2010 to 73% in 2014.
The results of the global analysis indicate that financial commitment to immunization is increasing,
as signified by the increasing domestic funds that governments are allocating for the use of
immunization. In spite of this Gavi and other donor support is growing at such a rate that is
drowning out the proportion of government funding for immunization and thus limiting the overall
financial ownership of countries.
The regional analysis showed the large disparity which exists between relatively richer and poorer
regions, with the countries in the European region and the region of the Americas have shown
themselves to be the most self-sufficient in supporting their own immunization costs, with over 90%
of total routine immunization costs being funded by government on average, in both regions. The
African region is the most reliant on donor support having only funded 50% of total RI costs with
domestic funds in 2010, and decreasing over time to 40% in 2014.
The data reported not only shows variability in expenditures between regions but also within regions.
A striking example of can be seen in the Region of the Americas when looking Haiti’s total
expenditure on vaccines per live birth in 2014 which corresponds to only 0.02% of Argentina’s
expenditures for the same year. In this case, the large scale disparity exists mainly due to the
difference in income between the two countries, but there may be other reasons for why intra-
regional variability exists. A country’s immunization schedule may have the largest impact on the
cost of immunization; countries which are classified as high income have greater resources for the
75
addition of new and expensive vaccines into the schedule. Countries with lower relative income may
still be hesitant when introducing these vaccines into their schedule, even with the support of Gavi.
Additionally, the organization of an immunization programme within a country can lead to efficiency
gains through shared resources depending on the extent to which immunization is integrated with
other health interventions; when this occurs the costs related to immunization may be distributed
across other areas of the health sector.
The prices of vaccines are of particular importance for high income countries as well as middle
income countries which are not Gavi eligible. Countries which do not have access to Gavi prices are
subject to much higher prices for vaccines, creating problems when middle income countries are
ineligible for Gavi support but do not yet have the fiscal space needed to support vaccine
introductions. Establishing greater price transparency can help provide countries with a better
platform to procure from pharmaceutical companies, and this is one of the main aims of the WHO
Vaccine Product, Price and Procurement (V3P)11 project. It is hoped that this data will be used in the
future to aid the interpretation of expenditure data for high and middle income countries.
The analysis also found that within Gavi eligible countries the policy of co-financing is having its
intended effect only partially realised. Countries with a relatively higher income are paying a greater
share towards their immunization costs; however the total share of vaccine costs being paid by
government is decreasing over time. Whilst this is somewhat expected of the countries in the Low
income co-financing group, the Phase 2 & 3 countries are expected to be displaying greater
movements towards self-sufficiency.
The quality of previously reported data remains an impediment to the interpretation of these
analyses. A number of countries fail to fully report the JRF financing indicators, and in some cases
errors and inconsistencies apparent in the data that is reported. The JRF financing indicators
guidance note 201512 has helped countries with greater understanding of the JRF indicators and
methods for reporting.. Additionally feedback for country reporting has been intensified with a full-
time series of reported indicators presented to each country with potential inconsistencies
highlighted, so that greater emphasis is placed on the revision of erroneously reported data.
The JRF financing indicators remains the most comprehensive source of officially reported
immunization financing data. Whilst not all countries report fully each year, the majority of the 194
member states have contributed data via the JRF mechanism, over the past few years. Not only is
the database of immunization financing data growing but the quality is improving. Data for the year
2014 saw an improvement in reporting in comparison to previous years, as well as a reduction in the
number of WHO estimates calculated in place of missing or inconsistent data. Progression in quality
and reporting are essential for the JRF financing indicators, and with the global initiatives currently
being developed it is hoped that progress with the financing indicators will come in the near future.
11
http://www.who.int/immunization/programmes_systems/procurement/v3p/en/ 12
http://www.who.int/immunization/programmes_systems/financing/data_indicators/JRF_guidance_note.pdf
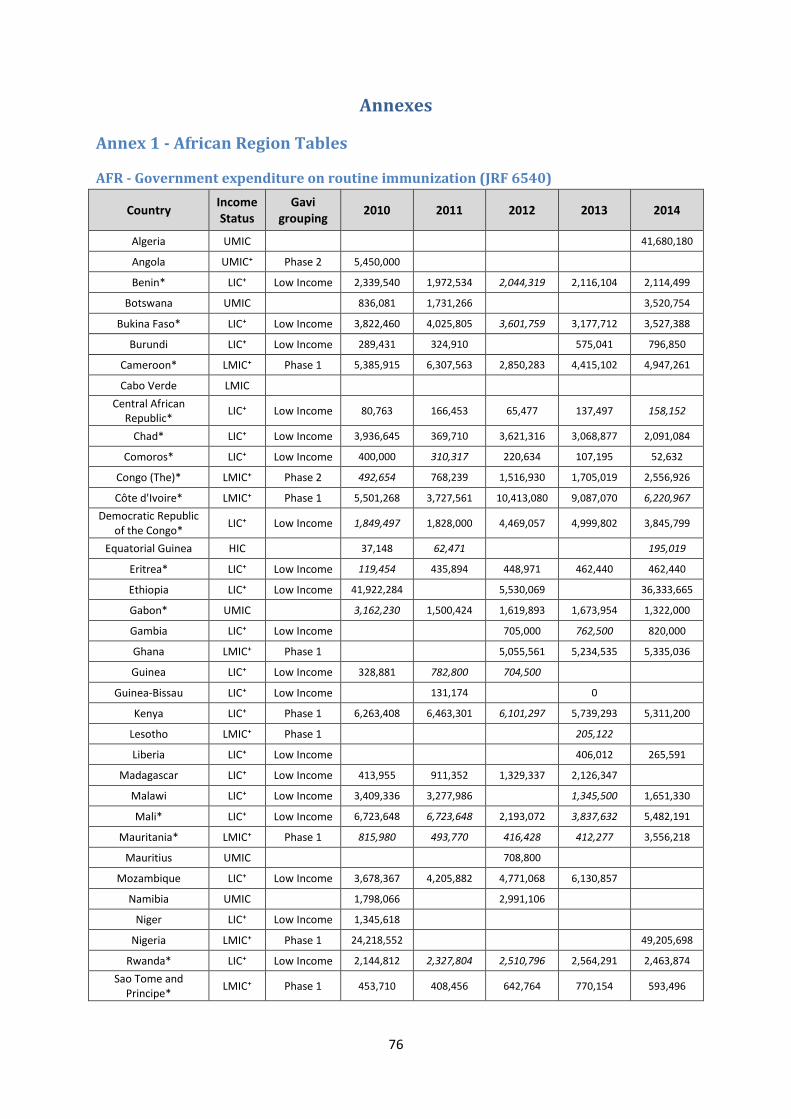
76
Annexes
Annex 1 - African Region Tables
AFR - Government expenditure on routine immunization (JRF 6540)
Country Income Status
Gavi grouping
2010 2011 2012 2013 2014
Algeria UMIC
41,680,180
Angola UMIC⁺ Phase 2 5,450,000
Benin* LIC⁺ Low Income 2,339,540 1,972,534 2,044,319 2,116,104 2,114,499
Botswana UMIC
836,081 1,731,266
3,520,754
Bukina Faso* LIC⁺ Low Income 3,822,460 4,025,805 3,601,759 3,177,712 3,527,388
Burundi LIC⁺ Low Income 289,431 324,910
575,041 796,850
Cameroon* LMIC⁺ Phase 1 5,385,915 6,307,563 2,850,283 4,415,102 4,947,261
Cabo Verde LMIC
Central African Republic*
LIC⁺ Low Income 80,763 166,453 65,477 137,497 158,152
Chad* LIC⁺ Low Income 3,936,645 369,710 3,621,316 3,068,877 2,091,084
Comoros* LIC⁺ Low Income 400,000 310,317 220,634 107,195 52,632
Congo (The)* LMIC⁺ Phase 2 492,654 768,239 1,516,930 1,705,019 2,556,926
Côte d'Ivoire* LMIC⁺ Phase 1 5,501,268 3,727,561 10,413,080 9,087,070 6,220,967
Democratic Republic of the Congo*
LIC⁺ Low Income 1,849,497 1,828,000 4,469,057 4,999,802 3,845,799
Equatorial Guinea HIC
37,148 62,471
195,019
Eritrea* LIC⁺ Low Income 119,454 435,894 448,971 462,440 462,440
Ethiopia LIC⁺ Low Income 41,922,284
5,530,069
36,333,665
Gabon* UMIC
3,162,230 1,500,424 1,619,893 1,673,954 1,322,000
Gambia LIC⁺ Low Income
705,000 762,500 820,000
Ghana LMIC⁺ Phase 1
5,055,561 5,234,535 5,335,036
Guinea LIC⁺ Low Income 328,881 782,800 704,500
Guinea-Bissau LIC⁺ Low Income
131,174
0
Kenya LIC⁺ Phase 1 6,263,408 6,463,301 6,101,297 5,739,293 5,311,200
Lesotho LMIC⁺ Phase 1
205,122
Liberia LIC⁺ Low Income
406,012 265,591
Madagascar LIC⁺ Low Income 413,955 911,352 1,329,337 2,126,347
Malawi LIC⁺ Low Income 3,409,336 3,277,986
1,345,500 1,651,330
Mali* LIC⁺ Low Income 6,723,648 6,723,648 2,193,072 3,837,632 5,482,191
Mauritania* LMIC⁺ Phase 1 815,980 493,770 416,428 412,277 3,556,218
Mauritius UMIC
708,800
Mozambique LIC⁺ Low Income 3,678,367 4,205,882 4,771,068 6,130,857
Namibia UMIC
1,798,066
2,991,106
Niger LIC⁺ Low Income 1,345,618
Nigeria LMIC⁺ Phase 1 24,218,552
49,205,698
Rwanda* LIC⁺ Low Income 2,144,812 2,327,804 2,510,796 2,564,291 2,463,874
Sao Tome and Principe*
LMIC⁺ Phase 1 453,710 408,456 642,764 770,154 593,496
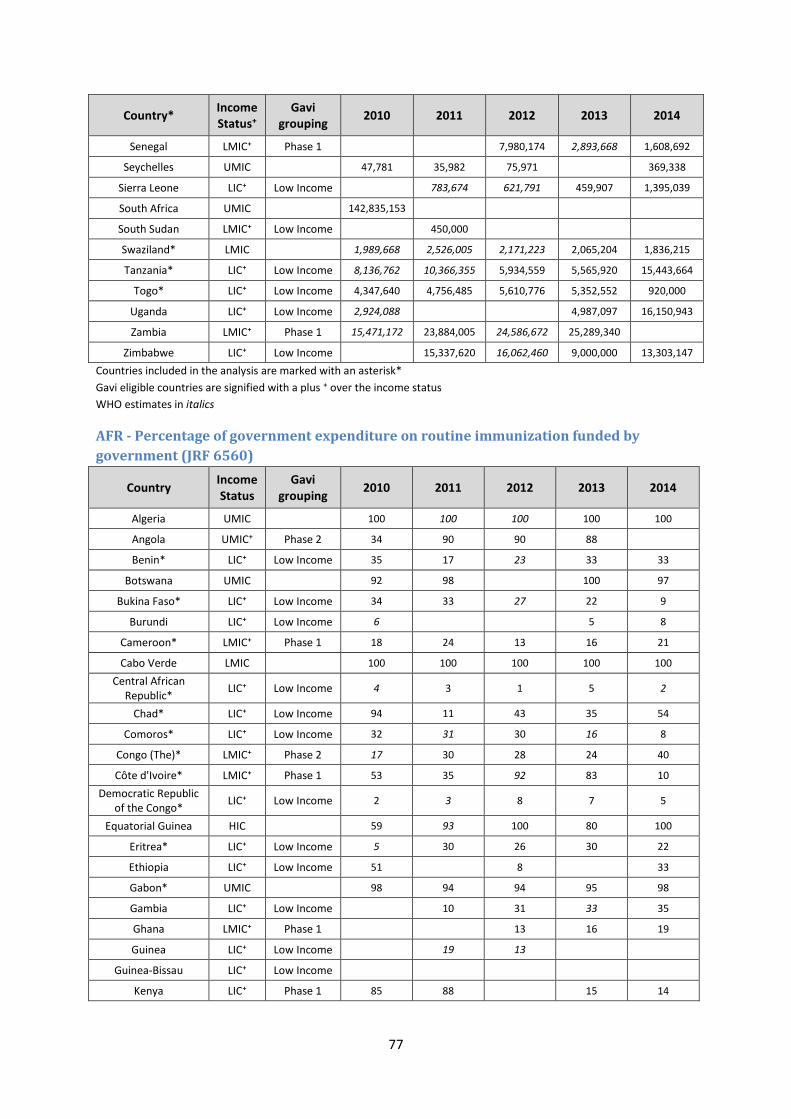
77
Country* Income Status⁺
Gavi grouping
2010 2011 2012 2013 2014
Senegal LMIC⁺ Phase 1
7,980,174 2,893,668 1,608,692
Seychelles UMIC
47,781 35,982 75,971
369,338
Sierra Leone LIC⁺ Low Income
783,674 621,791 459,907 1,395,039
South Africa UMIC
142,835,153
South Sudan LMIC⁺ Low Income
450,000
Swaziland* LMIC
1,989,668 2,526,005 2,171,223 2,065,204 1,836,215
Tanzania* LIC⁺ Low Income 8,136,762 10,366,355 5,934,559 5,565,920 15,443,664
Togo* LIC⁺ Low Income 4,347,640 4,756,485 5,610,776 5,352,552 920,000
Uganda LIC⁺ Low Income 2,924,088
4,987,097 16,150,943
Zambia LMIC⁺ Phase 1 15,471,172 23,884,005 24,586,672 25,289,340
Zimbabwe LIC⁺ Low Income
15,337,620 16,062,460 9,000,000 13,303,147
Countries included in the analysis are marked with an asterisk*
Gavi eligible countries are signified with a plus ⁺ over the income status
WHO estimates in italics
AFR - Percentage of government expenditure on routine immunization funded by
government (JRF 6560)
Country Income Status
Gavi grouping
2010 2011 2012 2013 2014
Algeria UMIC
100 100 100 100 100
Angola UMIC⁺ Phase 2 34 90 90 88
Benin* LIC⁺ Low Income 35 17 23 33 33
Botswana UMIC
92 98
100 97
Bukina Faso* LIC⁺ Low Income 34 33 27 22 9
Burundi LIC⁺ Low Income 6
5 8
Cameroon* LMIC⁺ Phase 1 18 24 13 16 21
Cabo Verde LMIC
100 100 100 100 100
Central African Republic*
LIC⁺ Low Income 4 3 1 5 2
Chad* LIC⁺ Low Income 94 11 43 35 54
Comoros* LIC⁺ Low Income 32 31 30 16 8
Congo (The)* LMIC⁺ Phase 2 17 30 28 24 40
Côte d'Ivoire* LMIC⁺ Phase 1 53 35 92 83 10
Democratic Republic of the Congo*
LIC⁺ Low Income 2 3 8 7 5
Equatorial Guinea HIC
59 93 100 80 100
Eritrea* LIC⁺ Low Income 5 30 26 30 22
Ethiopia LIC⁺ Low Income 51
8
33
Gabon* UMIC
98 94 94 95 98
Gambia LIC⁺ Low Income
10 31 33 35
Ghana LMIC⁺ Phase 1
13 16 19
Guinea LIC⁺ Low Income
19 13
Guinea-Bissau LIC⁺ Low Income
Kenya LIC⁺ Phase 1 85 88
15 14
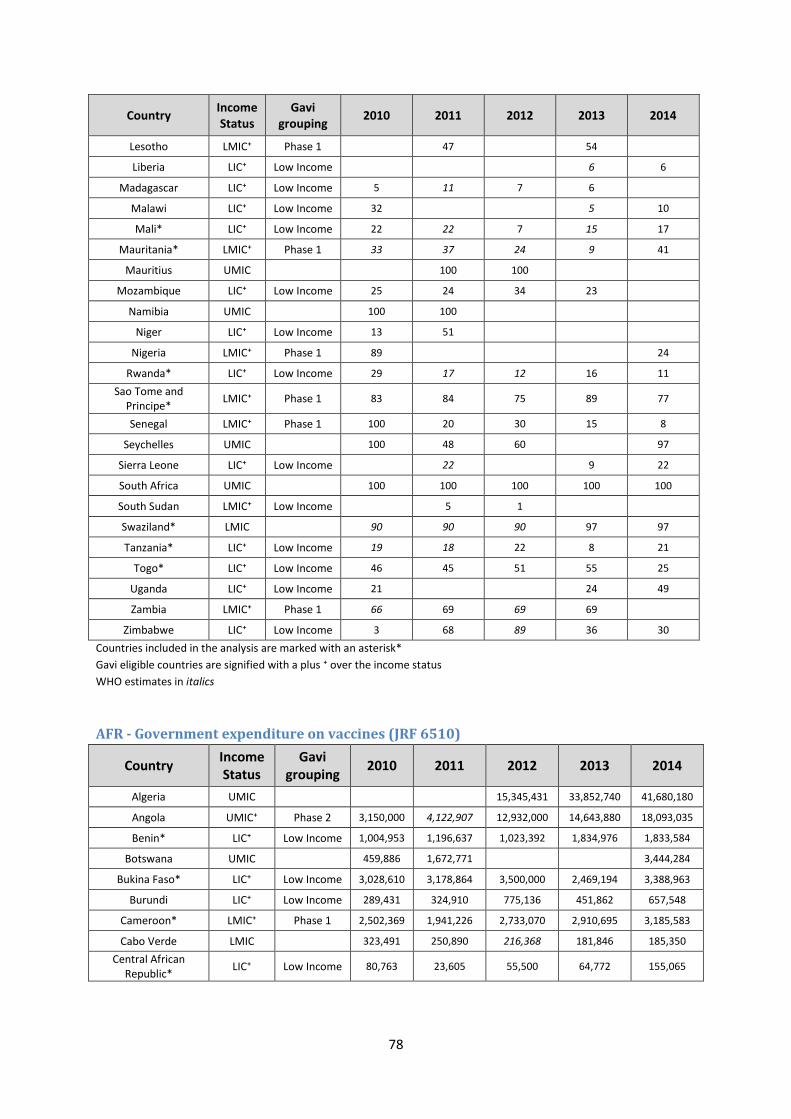
78
Country Income Status
Gavi grouping
2010 2011 2012 2013 2014
Lesotho LMIC⁺ Phase 1
47
54
Liberia LIC⁺ Low Income
6 6
Madagascar LIC⁺ Low Income 5 11 7 6
Malawi LIC⁺ Low Income 32
5 10
Mali* LIC⁺ Low Income 22 22 7 15 17
Mauritania* LMIC⁺ Phase 1 33 37 24 9 41
Mauritius UMIC
100 100
Mozambique LIC⁺ Low Income 25 24 34 23
Namibia UMIC
100 100
Niger LIC⁺ Low Income 13 51
Nigeria LMIC⁺ Phase 1 89
24
Rwanda* LIC⁺ Low Income 29 17 12 16 11
Sao Tome and Principe*
LMIC⁺ Phase 1 83 84 75 89 77
Senegal LMIC⁺ Phase 1 100 20 30 15 8
Seychelles UMIC
100 48 60
97
Sierra Leone LIC⁺ Low Income
22
9 22
South Africa UMIC
100 100 100 100 100
South Sudan LMIC⁺ Low Income
5 1
Swaziland* LMIC
90 90 90 97 97
Tanzania* LIC⁺ Low Income 19 18 22 8 21
Togo* LIC⁺ Low Income 46 45 51 55 25
Uganda LIC⁺ Low Income 21
24 49
Zambia LMIC⁺ Phase 1 66 69 69 69
Zimbabwe LIC⁺ Low Income 3 68 89 36 30
Countries included in the analysis are marked with an asterisk*
Gavi eligible countries are signified with a plus ⁺ over the income status
WHO estimates in italics
AFR - Government expenditure on vaccines (JRF 6510)
Country Income Status
Gavi grouping
2010 2011 2012 2013 2014
Algeria UMIC
15,345,431 33,852,740 41,680,180
Angola UMIC⁺ Phase 2 3,150,000 4,122,907 12,932,000 14,643,880 18,093,035
Benin* LIC⁺ Low Income 1,004,953 1,196,637 1,023,392 1,834,976 1,833,584
Botswana UMIC
459,886 1,672,771
3,444,284
Bukina Faso* LIC⁺ Low Income 3,028,610 3,178,864 3,500,000 2,469,194 3,388,963
Burundi LIC⁺ Low Income 289,431 324,910 775,136 451,862 657,548
Cameroon* LMIC⁺ Phase 1 2,502,369 1,941,226 2,733,070 2,910,695 3,185,583
Cabo Verde LMIC
323,491 250,890 216,368 181,846 185,350
Central African Republic*
LIC⁺ Low Income 80,763 23,605 55,500 64,772 155,065
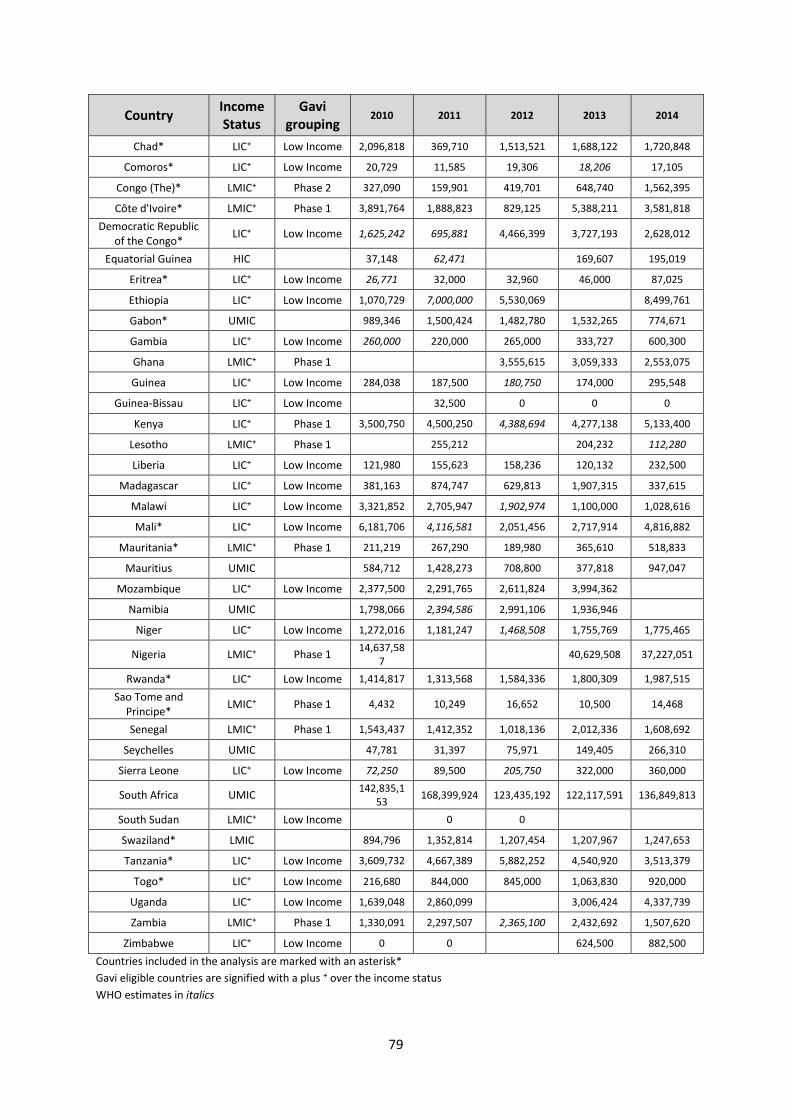
79
Country Income Status
Gavi grouping
2010 2011 2012 2013 2014
Chad* LIC⁺ Low Income 2,096,818 369,710 1,513,521 1,688,122 1,720,848
Comoros* LIC⁺ Low Income 20,729 11,585 19,306 18,206 17,105
Congo (The)* LMIC⁺ Phase 2 327,090 159,901 419,701 648,740 1,562,395
Côte d'Ivoire* LMIC⁺ Phase 1 3,891,764 1,888,823 829,125 5,388,211 3,581,818
Democratic Republic of the Congo*
LIC⁺ Low Income 1,625,242 695,881 4,466,399 3,727,193 2,628,012
Equatorial Guinea HIC
37,148 62,471
169,607 195,019
Eritrea* LIC⁺ Low Income 26,771 32,000 32,960 46,000 87,025
Ethiopia LIC⁺ Low Income 1,070,729 7,000,000 5,530,069
8,499,761
Gabon* UMIC
989,346 1,500,424 1,482,780 1,532,265 774,671
Gambia LIC⁺ Low Income 260,000 220,000 265,000 333,727 600,300
Ghana LMIC⁺ Phase 1
3,555,615 3,059,333 2,553,075
Guinea LIC⁺ Low Income 284,038 187,500 180,750 174,000 295,548
Guinea-Bissau LIC⁺ Low Income
32,500 0 0 0
Kenya LIC⁺ Phase 1 3,500,750 4,500,250 4,388,694 4,277,138 5,133,400
Lesotho LMIC⁺ Phase 1
255,212
204,232 112,280
Liberia LIC⁺ Low Income 121,980 155,623 158,236 120,132 232,500
Madagascar LIC⁺ Low Income 381,163 874,747 629,813 1,907,315 337,615
Malawi LIC⁺ Low Income 3,321,852 2,705,947 1,902,974 1,100,000 1,028,616
Mali* LIC⁺ Low Income 6,181,706 4,116,581 2,051,456 2,717,914 4,816,882
Mauritania* LMIC⁺ Phase 1 211,219 267,290 189,980 365,610 518,833
Mauritius UMIC
584,712 1,428,273 708,800 377,818 947,047
Mozambique LIC⁺ Low Income 2,377,500 2,291,765 2,611,824 3,994,362
Namibia UMIC
1,798,066 2,394,586 2,991,106 1,936,946
Niger LIC⁺ Low Income 1,272,016 1,181,247 1,468,508 1,755,769 1,775,465
Nigeria LMIC⁺ Phase 1 14,637,58
7 40,629,508 37,227,051
Rwanda* LIC⁺ Low Income 1,414,817 1,313,568 1,584,336 1,800,309 1,987,515
Sao Tome and Principe*
LMIC⁺ Phase 1 4,432 10,249 16,652 10,500 14,468
Senegal LMIC⁺ Phase 1 1,543,437 1,412,352 1,018,136 2,012,336 1,608,692
Seychelles UMIC
47,781 31,397 75,971 149,405 266,310
Sierra Leone LIC⁺ Low Income 72,250 89,500 205,750 322,000 360,000
South Africa UMIC
142,835,153
168,399,924 123,435,192 122,117,591 136,849,813
South Sudan LMIC⁺ Low Income
0 0
Swaziland* LMIC
894,796 1,352,814 1,207,454 1,207,967 1,247,653
Tanzania* LIC⁺ Low Income 3,609,732 4,667,389 5,882,252 4,540,920 3,513,379
Togo* LIC⁺ Low Income 216,680 844,000 845,000 1,063,830 920,000
Uganda LIC⁺ Low Income 1,639,048 2,860,099
3,006,424 4,337,739
Zambia LMIC⁺ Phase 1 1,330,091 2,297,507 2,365,100 2,432,692 1,507,620
Zimbabwe LIC⁺ Low Income 0 0
624,500 882,500
Countries included in the analysis are marked with an asterisk*
Gavi eligible countries are signified with a plus ⁺ over the income status
WHO estimates in italics

80
AFR – Total expenditure on vaccines (JRF 6520)
Country Income Status
Gavi grouping
2010 2011 2012 2013 2014
Algeria UMIC
15,345,431 33,852,740 41,680,180
Angola UMIC⁺ Phase 2 10,993,500 11,962,750 12,932,000 26,613,380 28,071,035
Benin* LIC⁺ Low Income 5,580,871 7,249,463 6,092,659 5,680,819 5,676,510
Botswana UMIC
459,886 1,672,771
3,444,284
Bukina Faso* LIC⁺ Low Income 9,115,228 9,788,995 8,881,658 11,425,980 32,177,531
Burundi LIC⁺ Low Income 3,328,353 11,410,685 11,517,715 9,773,702 9,072,982
Cameroon* LMIC⁺ Phase 1 2,616,951 21,191,103 20,844,097 23,754,162 21,214,505
Cabo Verde LMIC
323,491 250,890 216,368 181,846 185,350
Central African Republic*
LIC⁺ Low Income 2,242,833 2,363,942 2,296,330 2,640,268 3,495,031
Chad* LIC⁺ Low Income 3,225,874 3,351,252 6,260,482 4,152,498 1,764,724
Comoros* LIC⁺ Low Income 344,000 165,197 249,878 274,866 204,605
Congo (The)* LMIC⁺ Phase 2 2,432,500 1,834,192 3,837,735 4,467,308 4,656,455
Côte d'Ivoire* LMIC⁺ Phase 1 7,115,064 6,304,025 3,134,085 8,982,291 22,159,318
Democratic Republic of the Congo*
LIC⁺ Low Income 43,442,646 43,442,646 42,252,617 53,946,231 59,020,935
Equatorial Guinea HIC
62,471 67,094
169,607 195,019
Eritrea* LIC⁺ Low Income 1,866,054 1,227,950 1,264,789 1,086,040 1,420,000
Ethiopia LIC⁺ Low Income 20,037,006 95,068,972 66,159,005
72,954,162
Gabon* UMIC
989,346 1,500,424 1,482,780 1,532,265 774,671
Gambia LIC⁺ Low Income 538,571 220,000 1,665,000 1,720,315 1,775,629
Ghana LMIC⁺ Phase 1
33,265,939 20,059,450 22,091,850
Guinea LIC⁺ Low Income 1,205,779 784,109 705,698 420,000
Guinea-Bissau LIC⁺ Low Income
142,843
Kenya LIC⁺ Phase 1 7,250,750 7,850,700
27,727,538 34,220,900
Lesotho LMIC⁺ Phase 1
612,657
379,856 1,168,422
Liberia LIC⁺ Low Income 2,132,880 1,714,317 1,881,164 2,564,374 4,329,252
Madagascar LIC⁺ Low Income 8,155,704 4,214,790 14,865,200 29,839,815 19,462,461
Malawi LIC⁺ Low Income 9,224,949 7,496,685 7,496,685 15,714,286 14,694,514
Mali* LIC⁺ Low Income 30,541,696 23,609,288 16,676,881 19,875,721 19,811,382
Mauritania* LMIC⁺ Phase 1 1,936,363 1,267,385 1,263,922 2,235,017 4,879,429
Mauritius UMIC
584,712 1,428,273 708,800 377,818 947,047
Mozambique LIC⁺ Low Income 8,937,500 11,279,340 8,619,896 20,444,213
Namibia UMIC
1,798,066 2,394,586 6,645,186 1,936,946
Niger LIC⁺ Low Income 9,112,478 8,398,500 6,536,500 4,674,500 4,022,431
Nigeria LMIC⁺ Phase 1 20,625,690
73,764,508 90,962,051
Rwanda* LIC⁺ Low Income 5,565,731 11,868,568 18,701,836 13,882,595 20,052,015
Sao Tome and Principe*
LMIC⁺ Phase 1 72,225 70,162 214,962 187,481 186,823
Senegal LMIC⁺ Phase 1 1,543,437 4,440,693 3,808,483 7,547,336 19,525,290
Seychelles UMIC
47,781 31,397 127,568 314,797 266,310
Sierra Leone LIC⁺ Low Income 4,055,291 3,610,500 4,297,886 4,985,272 5,070,999
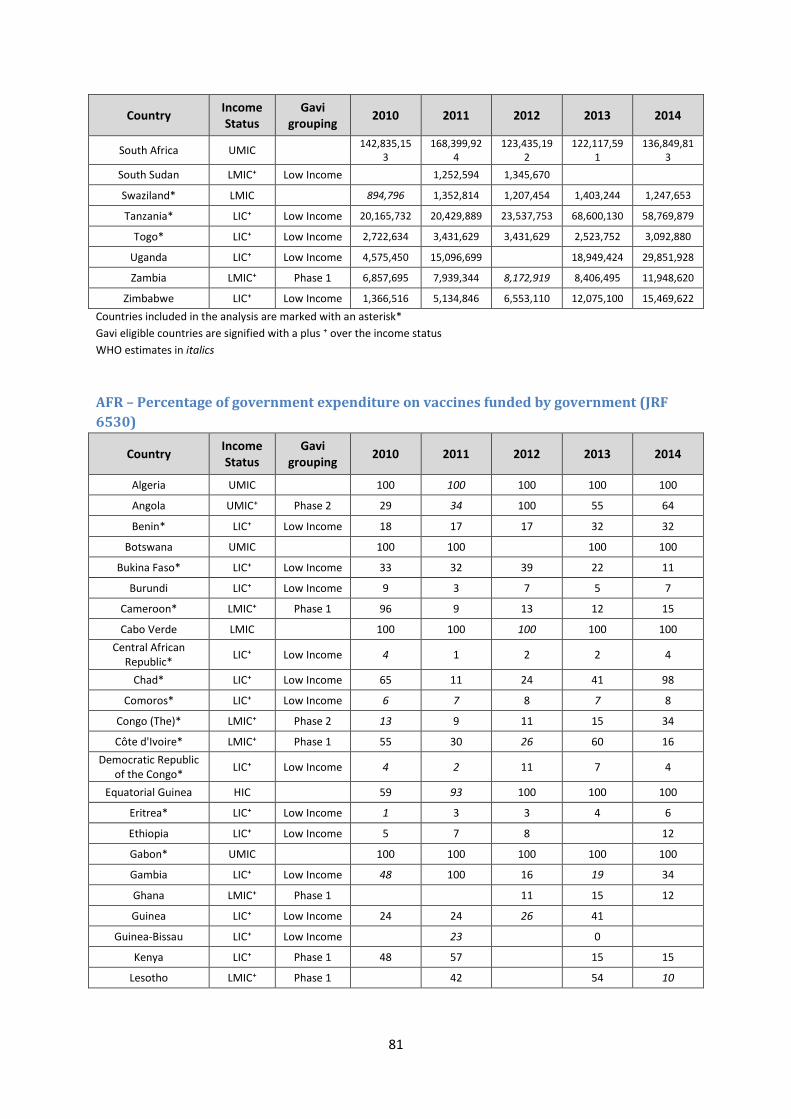
81
Country Income Status
Gavi grouping
2010 2011 2012 2013 2014
South Africa UMIC
142,835,153
168,399,924
123,435,192
122,117,591
136,849,813
South Sudan LMIC⁺ Low Income
1,252,594 1,345,670
Swaziland* LMIC
894,796 1,352,814 1,207,454 1,403,244 1,247,653
Tanzania* LIC⁺ Low Income 20,165,732 20,429,889 23,537,753 68,600,130 58,769,879
Togo* LIC⁺ Low Income 2,722,634 3,431,629 3,431,629 2,523,752 3,092,880
Uganda LIC⁺ Low Income 4,575,450 15,096,699
18,949,424 29,851,928
Zambia LMIC⁺ Phase 1 6,857,695 7,939,344 8,172,919 8,406,495 11,948,620
Zimbabwe LIC⁺ Low Income 1,366,516 5,134,846 6,553,110 12,075,100 15,469,622
Countries included in the analysis are marked with an asterisk*
Gavi eligible countries are signified with a plus ⁺ over the income status
WHO estimates in italics
AFR – Percentage of government expenditure on vaccines funded by government (JRF
6530)
Country Income Status
Gavi grouping
2010 2011 2012 2013 2014
Algeria UMIC
100 100 100 100 100
Angola UMIC⁺ Phase 2 29 34 100 55 64
Benin* LIC⁺ Low Income 18 17 17 32 32
Botswana UMIC
100 100
100 100
Bukina Faso* LIC⁺ Low Income 33 32 39 22 11
Burundi LIC⁺ Low Income 9 3 7 5 7
Cameroon* LMIC⁺ Phase 1 96 9 13 12 15
Cabo Verde LMIC
100 100 100 100 100
Central African Republic*
LIC⁺ Low Income 4 1 2 2 4
Chad* LIC⁺ Low Income 65 11 24 41 98
Comoros* LIC⁺ Low Income 6 7 8 7 8
Congo (The)* LMIC⁺ Phase 2 13 9 11 15 34
Côte d'Ivoire* LMIC⁺ Phase 1 55 30 26 60 16
Democratic Republic of the Congo*
LIC⁺ Low Income 4 2 11 7 4
Equatorial Guinea HIC
59 93 100 100 100
Eritrea* LIC⁺ Low Income 1 3 3 4 6
Ethiopia LIC⁺ Low Income 5 7 8
12
Gabon* UMIC
100 100 100 100 100
Gambia LIC⁺ Low Income 48 100 16 19 34
Ghana LMIC⁺ Phase 1
11 15 12
Guinea LIC⁺ Low Income 24 24 26 41
Guinea-Bissau LIC⁺ Low Income
23
0
Kenya LIC⁺ Phase 1 48 57
15 15
Lesotho LMIC⁺ Phase 1
42
54 10
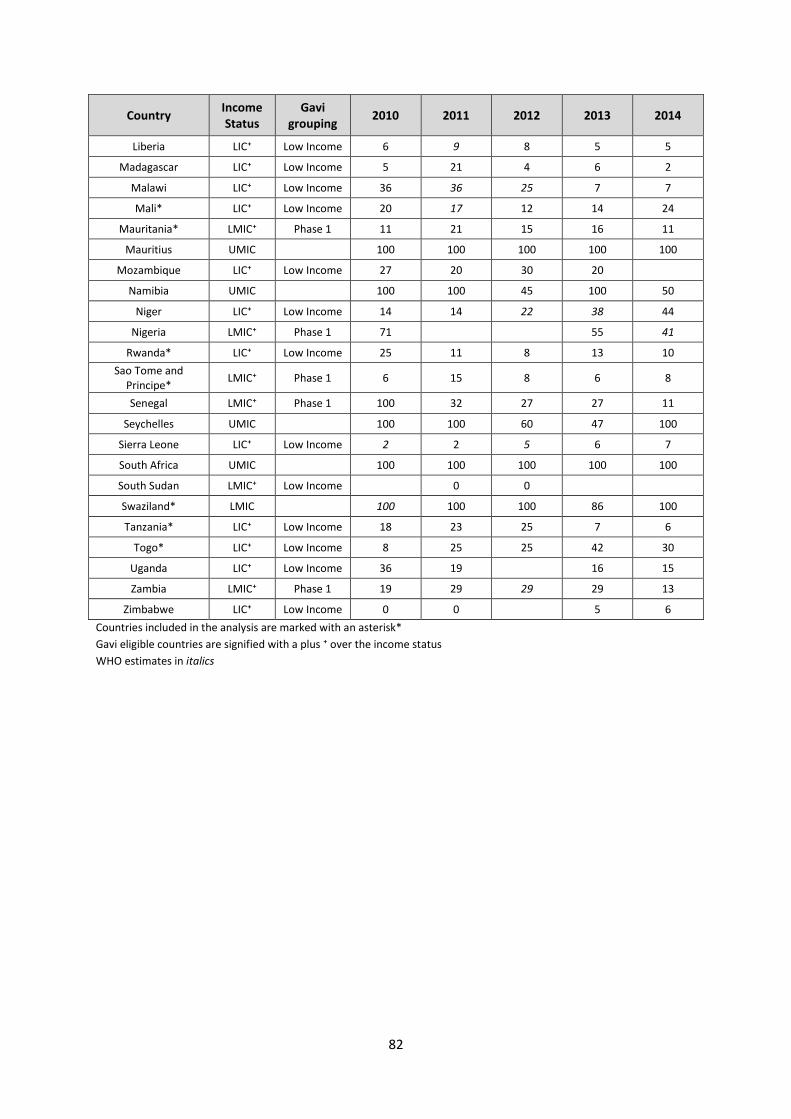
82
Country Income Status
Gavi grouping
2010 2011 2012 2013 2014
Liberia LIC⁺ Low Income 6 9 8 5 5
Madagascar LIC⁺ Low Income 5 21 4 6 2
Malawi LIC⁺ Low Income 36 36 25 7 7
Mali* LIC⁺ Low Income 20 17 12 14 24
Mauritania* LMIC⁺ Phase 1 11 21 15 16 11
Mauritius UMIC
100 100 100 100 100
Mozambique LIC⁺ Low Income 27 20 30 20
Namibia UMIC
100 100 45 100 50
Niger LIC⁺ Low Income 14 14 22 38 44
Nigeria LMIC⁺ Phase 1 71
55 41
Rwanda* LIC⁺ Low Income 25 11 8 13 10
Sao Tome and Principe*
LMIC⁺ Phase 1 6 15 8 6 8
Senegal LMIC⁺ Phase 1 100 32 27 27 11
Seychelles UMIC
100 100 60 47 100
Sierra Leone LIC⁺ Low Income 2 2 5 6 7
South Africa UMIC
100 100 100 100 100
South Sudan LMIC⁺ Low Income
0 0
Swaziland* LMIC
100 100 100 86 100
Tanzania* LIC⁺ Low Income 18 23 25 7 6
Togo* LIC⁺ Low Income 8 25 25 42 30
Uganda LIC⁺ Low Income 36 19
16 15
Zambia LMIC⁺ Phase 1 19 29 29 29 13
Zimbabwe LIC⁺ Low Income 0 0
5 6
Countries included in the analysis are marked with an asterisk*
Gavi eligible countries are signified with a plus ⁺ over the income status
WHO estimates in italics
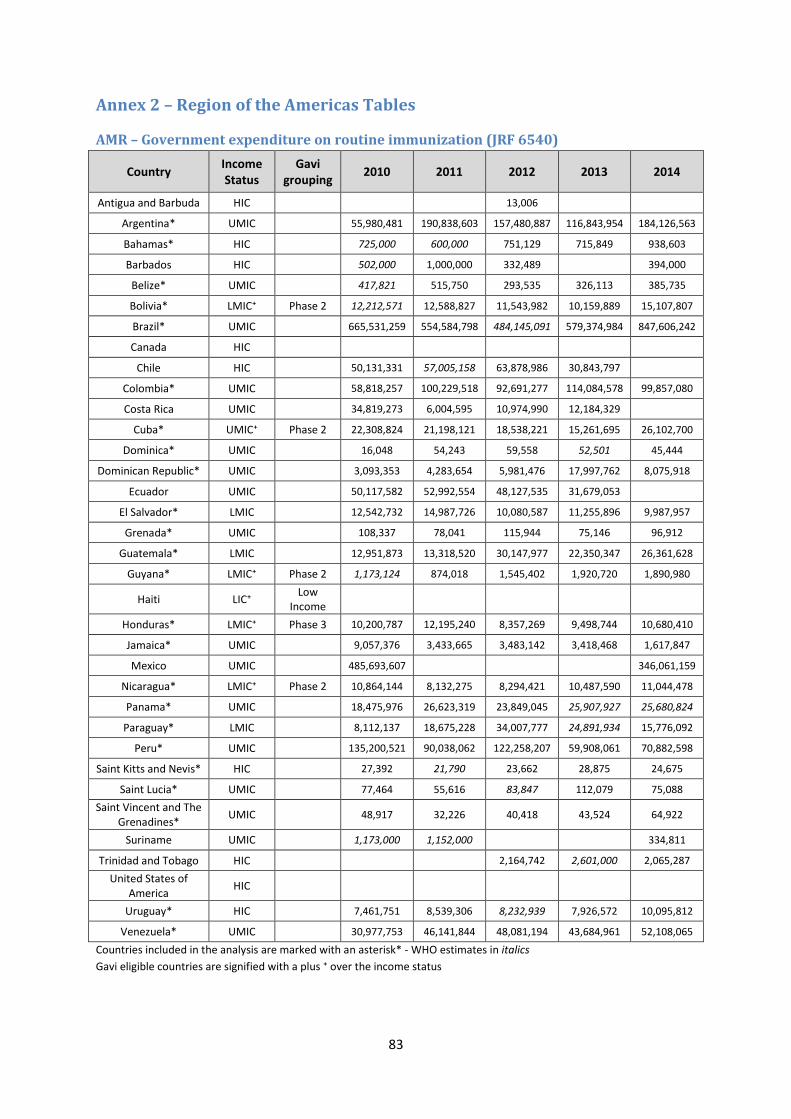
83
Annex 2 – Region of the Americas Tables
AMR – Government expenditure on routine immunization (JRF 6540)
Country Income Status
Gavi grouping
2010 2011 2012 2013 2014
Antigua and Barbuda HIC
13,006
Argentina* UMIC
55,980,481 190,838,603 157,480,887 116,843,954 184,126,563
Bahamas* HIC
725,000 600,000 751,129 715,849 938,603
Barbados HIC
502,000 1,000,000 332,489
394,000
Belize* UMIC
417,821 515,750 293,535 326,113 385,735
Bolivia* LMIC⁺ Phase 2 12,212,571 12,588,827 11,543,982 10,159,889 15,107,807
Brazil* UMIC
665,531,259 554,584,798 484,145,091 579,374,984 847,606,242
Canada HIC
Chile HIC
50,131,331 57,005,158 63,878,986 30,843,797
Colombia* UMIC
58,818,257 100,229,518 92,691,277 114,084,578 99,857,080
Costa Rica UMIC
34,819,273 6,004,595 10,974,990 12,184,329
Cuba* UMIC⁺ Phase 2 22,308,824 21,198,121 18,538,221 15,261,695 26,102,700
Dominica* UMIC
16,048 54,243 59,558 52,501 45,444
Dominican Republic* UMIC
3,093,353 4,283,654 5,981,476 17,997,762 8,075,918
Ecuador UMIC
50,117,582 52,992,554 48,127,535 31,679,053
El Salvador* LMIC
12,542,732 14,987,726 10,080,587 11,255,896 9,987,957
Grenada* UMIC
108,337 78,041 115,944 75,146 96,912
Guatemala* LMIC
12,951,873 13,318,520 30,147,977 22,350,347 26,361,628
Guyana* LMIC⁺ Phase 2 1,173,124 874,018 1,545,402 1,920,720 1,890,980
Haiti LIC⁺ Low
Income
Honduras* LMIC⁺ Phase 3 10,200,787 12,195,240 8,357,269 9,498,744 10,680,410
Jamaica* UMIC
9,057,376 3,433,665 3,483,142 3,418,468 1,617,847
Mexico UMIC
485,693,607
346,061,159
Nicaragua* LMIC⁺ Phase 2 10,864,144 8,132,275 8,294,421 10,487,590 11,044,478
Panama* UMIC
18,475,976 26,623,319 23,849,045 25,907,927 25,680,824
Paraguay* LMIC
8,112,137 18,675,228 34,007,777 24,891,934 15,776,092
Peru* UMIC
135,200,521 90,038,062 122,258,207 59,908,061 70,882,598
Saint Kitts and Nevis* HIC
27,392 21,790 23,662 28,875 24,675
Saint Lucia* UMIC
77,464 55,616 83,847 112,079 75,088
Saint Vincent and The Grenadines*
UMIC
48,917 32,226 40,418 43,524 64,922
Suriname UMIC
1,173,000 1,152,000
334,811
Trinidad and Tobago HIC
2,164,742 2,601,000 2,065,287
United States of America
HIC
Uruguay* HIC
7,461,751 8,539,306 8,232,939 7,926,572 10,095,812
Venezuela* UMIC
30,977,753 46,141,844 48,081,194 43,684,961 52,108,065
Countries included in the analysis are marked with an asterisk* - WHO estimates in italics
Gavi eligible countries are signified with a plus ⁺ over the income status
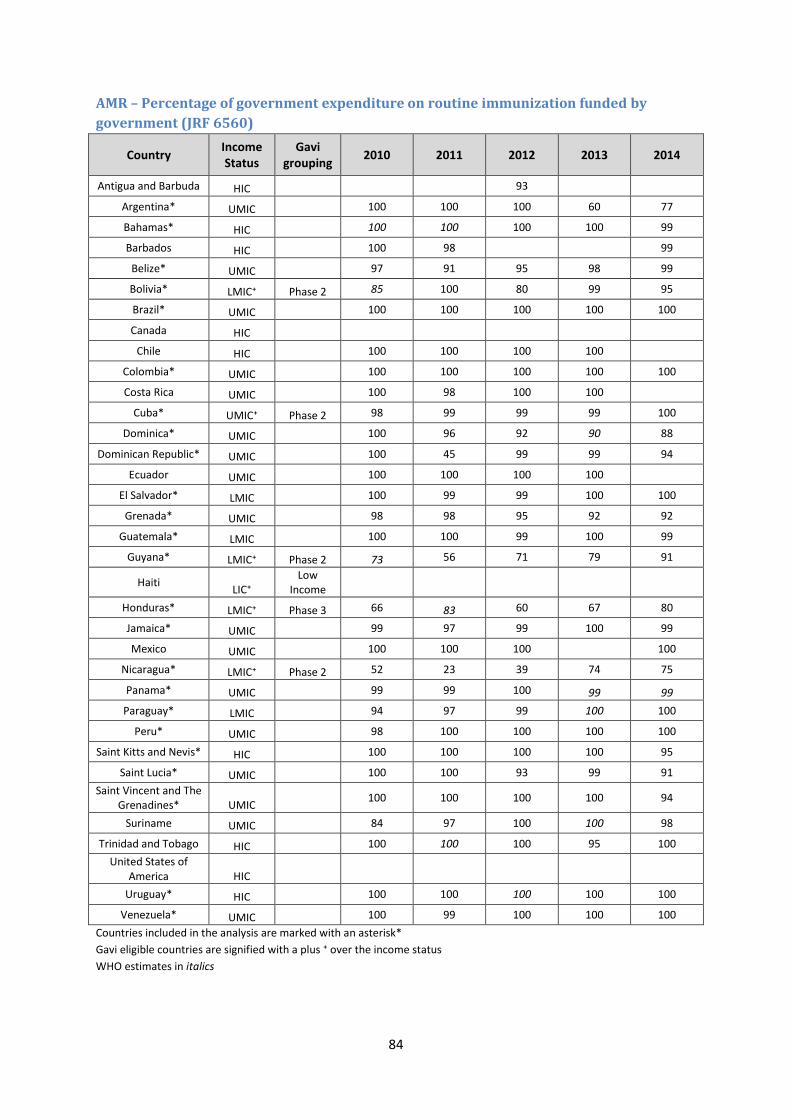
84
AMR – Percentage of government expenditure on routine immunization funded by
government (JRF 6560)
Country Income Status
Gavi grouping
2010 2011 2012 2013 2014
Antigua and Barbuda HIC 93
Argentina* UMIC 100 100 100 60 77
Bahamas* HIC 100 100 100 100 99
Barbados HIC 100 98 99
Belize* UMIC 97 91 95 98 99
Bolivia* LMIC⁺ Phase 2 85 100 80 99 95
Brazil* UMIC 100 100 100 100 100
Canada HIC
Chile HIC 100 100 100 100
Colombia* UMIC 100 100 100 100 100
Costa Rica UMIC 100 98 100 100
Cuba* UMIC⁺ Phase 2 98 99 99 99 100
Dominica* UMIC 100 96 92 90 88
Dominican Republic* UMIC 100 45 99 99 94
Ecuador UMIC 100 100 100 100
El Salvador* LMIC 100 99 99 100 100
Grenada* UMIC 98 98 95 92 92
Guatemala* LMIC 100 100 99 100 99
Guyana* LMIC⁺ Phase 2 73 56 71 79 91
Haiti LIC⁺
Low Income
Honduras* LMIC⁺ Phase 3 66 83 60 67 80
Jamaica* UMIC 99 97 99 100 99
Mexico UMIC 100 100 100 100
Nicaragua* LMIC⁺ Phase 2 52 23 39 74 75
Panama* UMIC 99 99 100 99 99
Paraguay* LMIC 94 97 99 100 100
Peru* UMIC 98 100 100 100 100
Saint Kitts and Nevis* HIC 100 100 100 100 95
Saint Lucia* UMIC 100 100 93 99 91
Saint Vincent and The Grenadines* UMIC
100 100 100 100 94
Suriname UMIC 84 97 100 100 98
Trinidad and Tobago HIC 100 100 100 95 100
United States of America HIC
Uruguay* HIC 100 100 100 100 100
Venezuela* UMIC 100 99 100 100 100
Countries included in the analysis are marked with an asterisk*
Gavi eligible countries are signified with a plus ⁺ over the income status
WHO estimates in italics
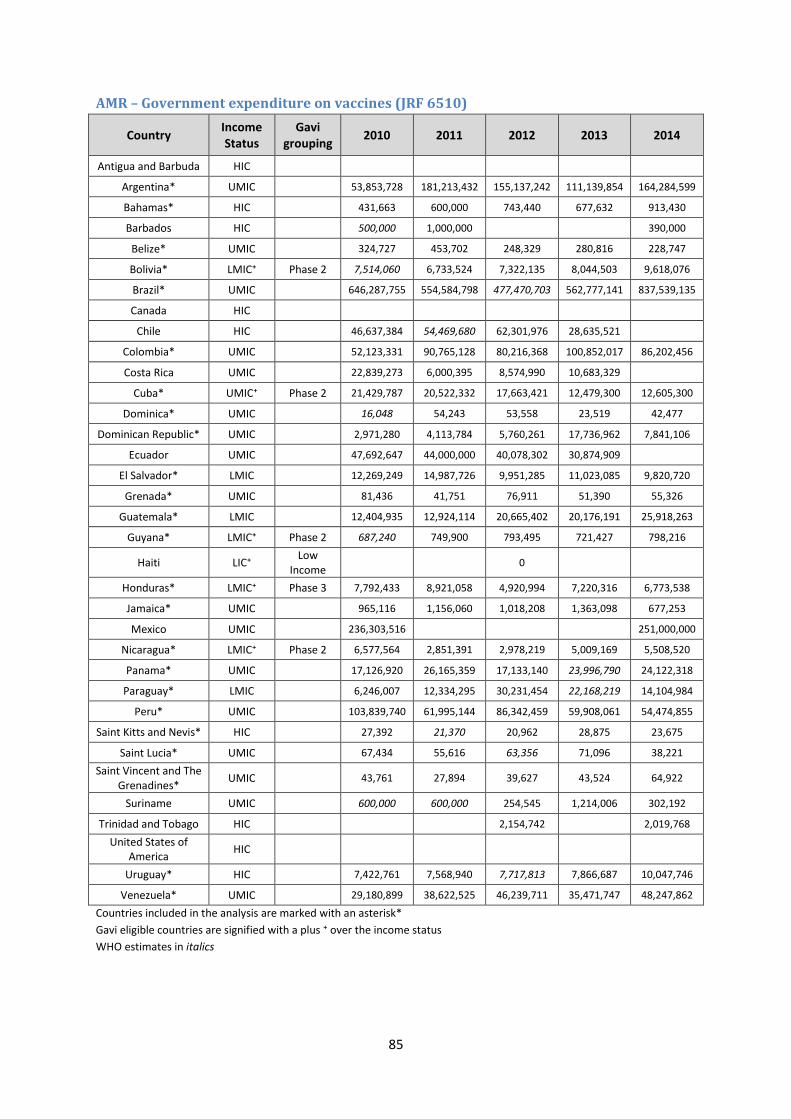
85
AMR – Government expenditure on vaccines (JRF 6510)
Country Income Status
Gavi grouping
2010 2011 2012 2013 2014
Antigua and Barbuda HIC
Argentina* UMIC
53,853,728 181,213,432 155,137,242 111,139,854 164,284,599
Bahamas* HIC
431,663 600,000 743,440 677,632 913,430
Barbados HIC
500,000 1,000,000
390,000
Belize* UMIC
324,727 453,702 248,329 280,816 228,747
Bolivia* LMIC⁺ Phase 2 7,514,060 6,733,524 7,322,135 8,044,503 9,618,076
Brazil* UMIC
646,287,755 554,584,798 477,470,703 562,777,141 837,539,135
Canada HIC
Chile HIC
46,637,384 54,469,680 62,301,976 28,635,521
Colombia* UMIC
52,123,331 90,765,128 80,216,368 100,852,017 86,202,456
Costa Rica UMIC
22,839,273 6,000,395 8,574,990 10,683,329
Cuba* UMIC⁺ Phase 2 21,429,787 20,522,332 17,663,421 12,479,300 12,605,300
Dominica* UMIC
16,048 54,243 53,558 23,519 42,477
Dominican Republic* UMIC
2,971,280 4,113,784 5,760,261 17,736,962 7,841,106
Ecuador UMIC
47,692,647 44,000,000 40,078,302 30,874,909
El Salvador* LMIC
12,269,249 14,987,726 9,951,285 11,023,085 9,820,720
Grenada* UMIC
81,436 41,751 76,911 51,390 55,326
Guatemala* LMIC
12,404,935 12,924,114 20,665,402 20,176,191 25,918,263
Guyana* LMIC⁺ Phase 2 687,240 749,900 793,495 721,427 798,216
Haiti LIC⁺ Low
Income 0
Honduras* LMIC⁺ Phase 3 7,792,433 8,921,058 4,920,994 7,220,316 6,773,538
Jamaica* UMIC
965,116 1,156,060 1,018,208 1,363,098 677,253
Mexico UMIC
236,303,516
251,000,000
Nicaragua* LMIC⁺ Phase 2 6,577,564 2,851,391 2,978,219 5,009,169 5,508,520
Panama* UMIC
17,126,920 26,165,359 17,133,140 23,996,790 24,122,318
Paraguay* LMIC
6,246,007 12,334,295 30,231,454 22,168,219 14,104,984
Peru* UMIC
103,839,740 61,995,144 86,342,459 59,908,061 54,474,855
Saint Kitts and Nevis* HIC
27,392 21,370 20,962 28,875 23,675
Saint Lucia* UMIC
67,434 55,616 63,356 71,096 38,221
Saint Vincent and The Grenadines*
UMIC
43,761 27,894 39,627 43,524 64,922
Suriname UMIC
600,000 600,000 254,545 1,214,006 302,192
Trinidad and Tobago HIC
2,154,742
2,019,768
United States of America
HIC
Uruguay* HIC
7,422,761 7,568,940 7,717,813 7,866,687 10,047,746
Venezuela* UMIC
29,180,899 38,622,525 46,239,711 35,471,747 48,247,862
Countries included in the analysis are marked with an asterisk*
Gavi eligible countries are signified with a plus ⁺ over the income status
WHO estimates in italics
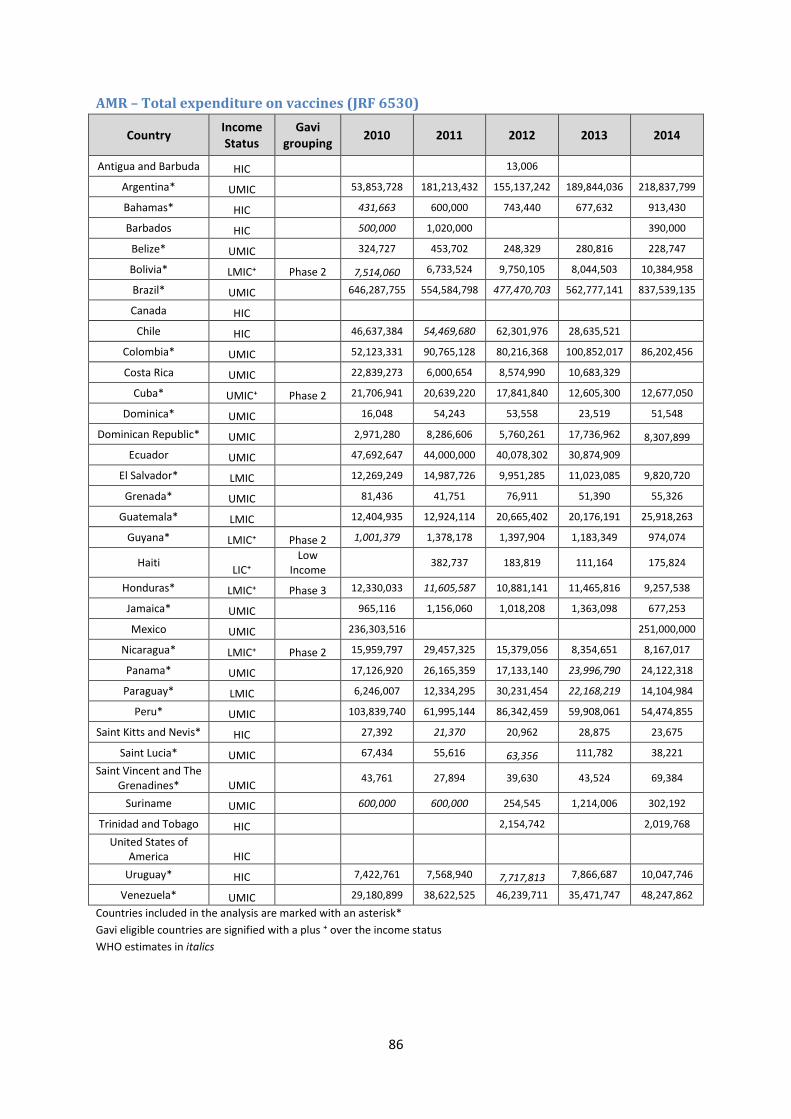
86
AMR – Total expenditure on vaccines (JRF 6530)
Country Income Status
Gavi grouping
2010 2011 2012 2013 2014
Antigua and Barbuda HIC 13,006
Argentina* UMIC 53,853,728 181,213,432 155,137,242 189,844,036 218,837,799
Bahamas* HIC 431,663 600,000 743,440 677,632 913,430
Barbados HIC 500,000 1,020,000 390,000
Belize* UMIC 324,727 453,702 248,329 280,816 228,747
Bolivia* LMIC⁺ Phase 2 7,514,060 6,733,524 9,750,105 8,044,503 10,384,958
Brazil* UMIC 646,287,755 554,584,798 477,470,703 562,777,141 837,539,135
Canada HIC
Chile HIC 46,637,384 54,469,680 62,301,976 28,635,521
Colombia* UMIC 52,123,331 90,765,128 80,216,368 100,852,017 86,202,456
Costa Rica UMIC 22,839,273 6,000,654 8,574,990 10,683,329
Cuba* UMIC⁺ Phase 2 21,706,941 20,639,220 17,841,840 12,605,300 12,677,050
Dominica* UMIC 16,048 54,243 53,558 23,519 51,548
Dominican Republic* UMIC 2,971,280 8,286,606 5,760,261 17,736,962 8,307,899
Ecuador UMIC 47,692,647 44,000,000 40,078,302 30,874,909
El Salvador* LMIC 12,269,249 14,987,726 9,951,285 11,023,085 9,820,720
Grenada* UMIC 81,436 41,751 76,911 51,390 55,326
Guatemala* LMIC 12,404,935 12,924,114 20,665,402 20,176,191 25,918,263
Guyana* LMIC⁺ Phase 2 1,001,379 1,378,178 1,397,904 1,183,349 974,074
Haiti LIC⁺
Low Income
382,737 183,819 111,164 175,824
Honduras* LMIC⁺ Phase 3 12,330,033 11,605,587 10,881,141 11,465,816 9,257,538
Jamaica* UMIC 965,116 1,156,060 1,018,208 1,363,098 677,253
Mexico UMIC 236,303,516 251,000,000
Nicaragua* LMIC⁺ Phase 2 15,959,797 29,457,325 15,379,056 8,354,651 8,167,017
Panama* UMIC 17,126,920 26,165,359 17,133,140 23,996,790 24,122,318
Paraguay* LMIC 6,246,007 12,334,295 30,231,454 22,168,219 14,104,984
Peru* UMIC 103,839,740 61,995,144 86,342,459 59,908,061 54,474,855
Saint Kitts and Nevis* HIC 27,392 21,370 20,962 28,875 23,675
Saint Lucia* UMIC 67,434 55,616 63,356 111,782 38,221
Saint Vincent and The Grenadines* UMIC
43,761 27,894 39,630 43,524 69,384
Suriname UMIC 600,000 600,000 254,545 1,214,006 302,192
Trinidad and Tobago HIC 2,154,742 2,019,768
United States of America HIC
Uruguay* HIC 7,422,761 7,568,940 7,717,813 7,866,687 10,047,746
Venezuela* UMIC 29,180,899 38,622,525 46,239,711 35,471,747 48,247,862
Countries included in the analysis are marked with an asterisk*
Gavi eligible countries are signified with a plus ⁺ over the income status
WHO estimates in italics
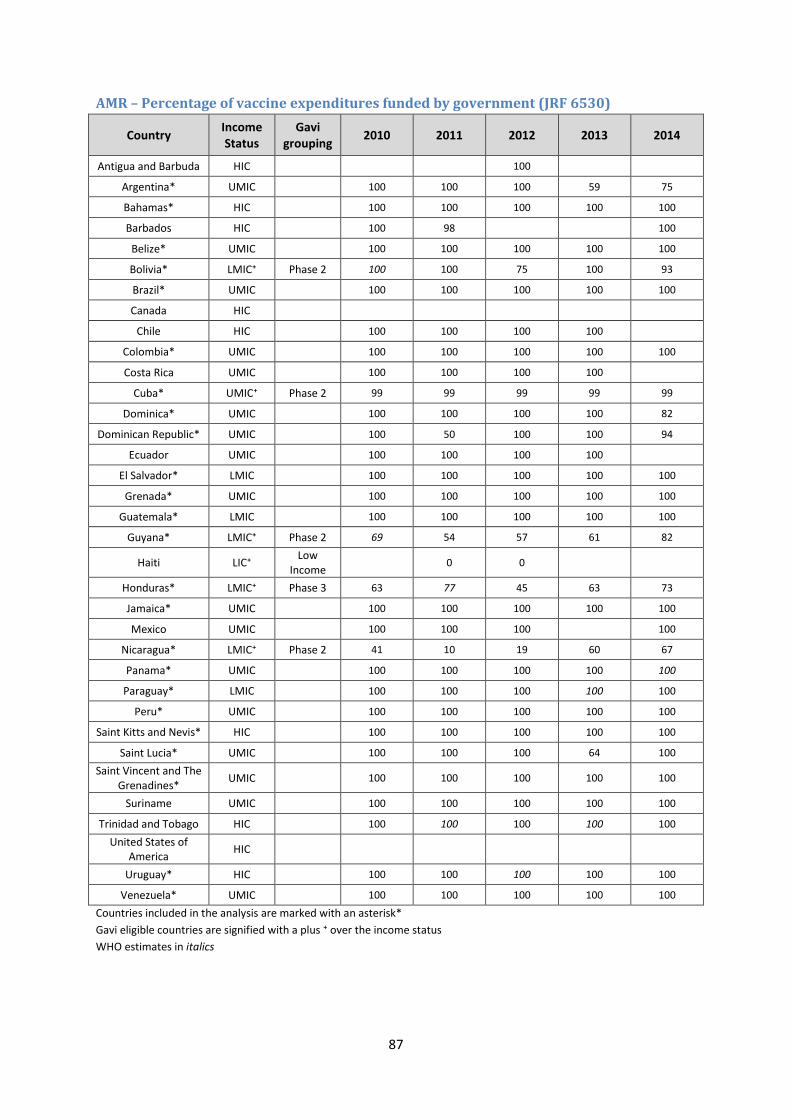
87
AMR – Percentage of vaccine expenditures funded by government (JRF 6530)
Country Income Status
Gavi grouping
2010 2011 2012 2013 2014
Antigua and Barbuda HIC
100
Argentina* UMIC
100 100 100 59 75
Bahamas* HIC
100 100 100 100 100
Barbados HIC
100 98
100
Belize* UMIC
100 100 100 100 100
Bolivia* LMIC⁺ Phase 2 100 100 75 100 93
Brazil* UMIC
100 100 100 100 100
Canada HIC
Chile HIC
100 100 100 100
Colombia* UMIC
100 100 100 100 100
Costa Rica UMIC
100 100 100 100
Cuba* UMIC⁺ Phase 2 99 99 99 99 99
Dominica* UMIC
100 100 100 100 82
Dominican Republic* UMIC
100 50 100 100 94
Ecuador UMIC
100 100 100 100
El Salvador* LMIC
100 100 100 100 100
Grenada* UMIC
100 100 100 100 100
Guatemala* LMIC
100 100 100 100 100
Guyana* LMIC⁺ Phase 2 69 54 57 61 82
Haiti LIC⁺ Low
Income 0 0
Honduras* LMIC⁺ Phase 3 63 77 45 63 73
Jamaica* UMIC
100 100 100 100 100
Mexico UMIC
100 100 100
100
Nicaragua* LMIC⁺ Phase 2 41 10 19 60 67
Panama* UMIC
100 100 100 100 100
Paraguay* LMIC
100 100 100 100 100
Peru* UMIC
100 100 100 100 100
Saint Kitts and Nevis* HIC
100 100 100 100 100
Saint Lucia* UMIC
100 100 100 64 100
Saint Vincent and The Grenadines*
UMIC
100 100 100 100 100
Suriname UMIC
100 100 100 100 100
Trinidad and Tobago HIC
100 100 100 100 100
United States of America
HIC
Uruguay* HIC
100 100 100 100 100
Venezuela* UMIC
100 100 100 100 100
Countries included in the analysis are marked with an asterisk*
Gavi eligible countries are signified with a plus ⁺ over the income status
WHO estimates in italics
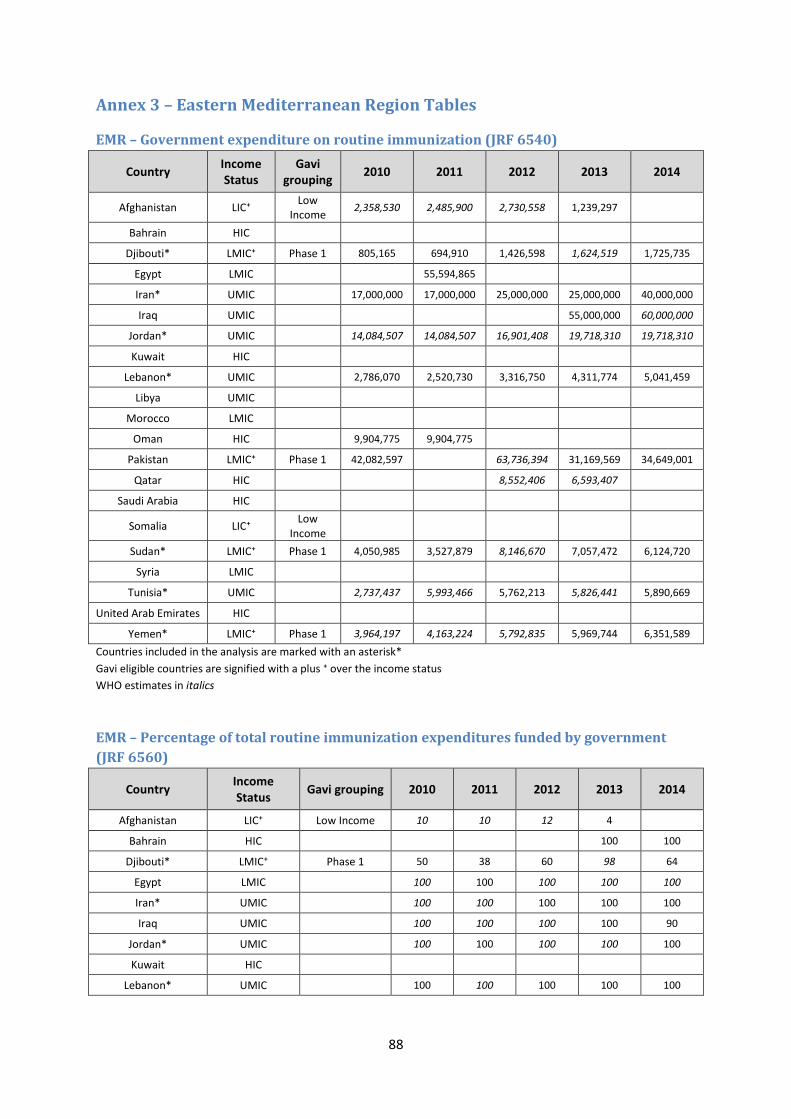
88
Annex 3 – Eastern Mediterranean Region Tables
EMR – Government expenditure on routine immunization (JRF 6540)
Country Income Status
Gavi grouping
2010 2011 2012 2013 2014
Afghanistan LIC⁺ Low
Income 2,358,530 2,485,900 2,730,558 1,239,297
Bahrain HIC
Djibouti* LMIC⁺ Phase 1 805,165 694,910 1,426,598 1,624,519 1,725,735
Egypt LMIC
55,594,865
Iran* UMIC
17,000,000 17,000,000 25,000,000 25,000,000 40,000,000
Iraq UMIC
55,000,000 60,000,000
Jordan* UMIC
14,084,507 14,084,507 16,901,408 19,718,310 19,718,310
Kuwait HIC
Lebanon* UMIC
2,786,070 2,520,730 3,316,750 4,311,774 5,041,459
Libya UMIC
Morocco LMIC
Oman HIC
9,904,775 9,904,775
Pakistan LMIC⁺ Phase 1 42,082,597
63,736,394 31,169,569 34,649,001
Qatar HIC
8,552,406 6,593,407
Saudi Arabia HIC
Somalia LIC⁺ Low
Income
Sudan* LMIC⁺ Phase 1 4,050,985 3,527,879 8,146,670 7,057,472 6,124,720
Syria LMIC
Tunisia* UMIC
2,737,437 5,993,466 5,762,213 5,826,441 5,890,669
United Arab Emirates HIC
Yemen* LMIC⁺ Phase 1 3,964,197 4,163,224 5,792,835 5,969,744 6,351,589
Countries included in the analysis are marked with an asterisk*
Gavi eligible countries are signified with a plus ⁺ over the income status
WHO estimates in italics
EMR – Percentage of total routine immunization expenditures funded by government
(JRF 6560)
Country Income Status
Gavi grouping 2010 2011 2012 2013 2014
Afghanistan LIC⁺ Low Income 10 10 12 4
Bahrain HIC
100 100
Djibouti* LMIC⁺ Phase 1 50 38 60 98 64
Egypt LMIC
100 100 100 100 100
Iran* UMIC
100 100 100 100 100
Iraq UMIC
100 100 100 100 90
Jordan* UMIC
100 100 100 100 100
Kuwait HIC
Lebanon* UMIC
100 100 100 100 100
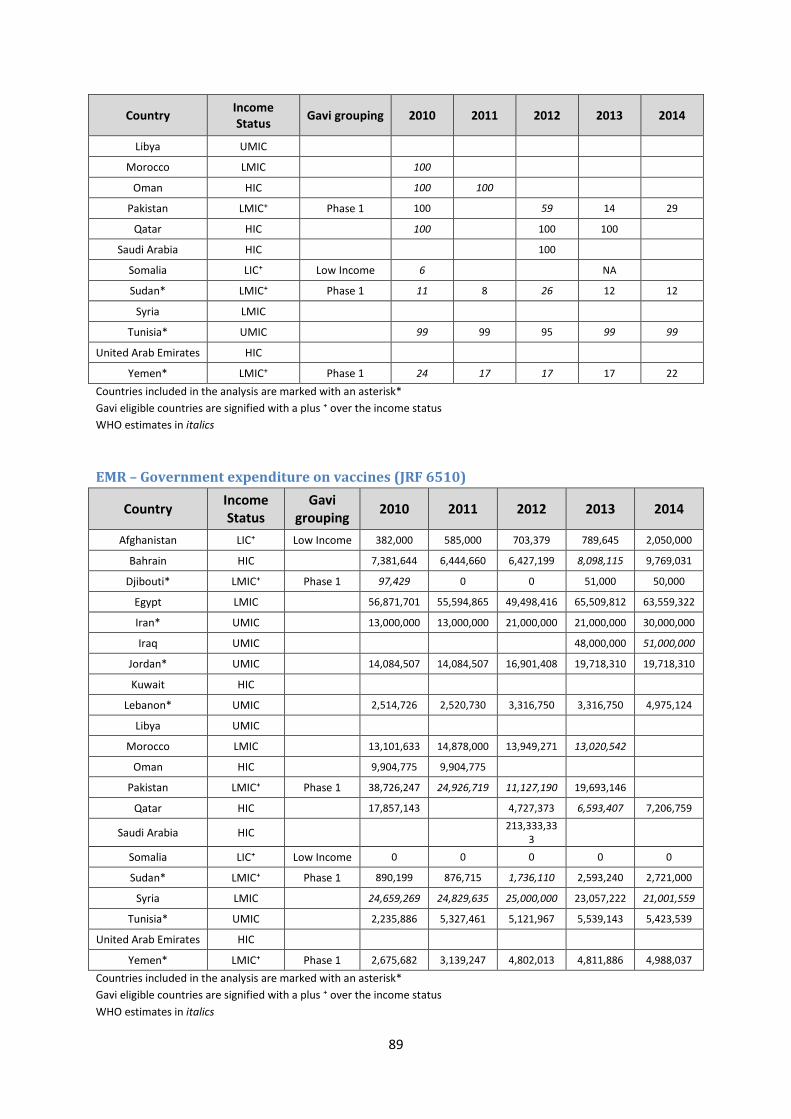
89
Country Income Status
Gavi grouping 2010 2011 2012 2013 2014
Libya UMIC
Morocco LMIC
100
Oman HIC
100 100
Pakistan LMIC⁺ Phase 1 100
59 14 29
Qatar HIC
100
100 100
Saudi Arabia HIC
100
Somalia LIC⁺ Low Income 6
NA
Sudan* LMIC⁺ Phase 1 11 8 26 12 12
Syria LMIC
Tunisia* UMIC
99 99 95 99 99
United Arab Emirates HIC
Yemen* LMIC⁺ Phase 1 24 17 17 17 22
Countries included in the analysis are marked with an asterisk*
Gavi eligible countries are signified with a plus ⁺ over the income status
WHO estimates in italics
EMR – Government expenditure on vaccines (JRF 6510)
Country Income Status
Gavi grouping
2010 2011 2012 2013 2014
Afghanistan LIC⁺ Low Income 382,000 585,000 703,379 789,645 2,050,000
Bahrain HIC
7,381,644 6,444,660 6,427,199 8,098,115 9,769,031
Djibouti* LMIC⁺ Phase 1 97,429 0 0 51,000 50,000
Egypt LMIC
56,871,701 55,594,865 49,498,416 65,509,812 63,559,322
Iran* UMIC
13,000,000 13,000,000 21,000,000 21,000,000 30,000,000
Iraq UMIC
48,000,000 51,000,000
Jordan* UMIC
14,084,507 14,084,507 16,901,408 19,718,310 19,718,310
Kuwait HIC
Lebanon* UMIC
2,514,726 2,520,730 3,316,750 3,316,750 4,975,124
Libya UMIC
Morocco LMIC
13,101,633 14,878,000 13,949,271 13,020,542
Oman HIC
9,904,775 9,904,775
Pakistan LMIC⁺ Phase 1 38,726,247 24,926,719 11,127,190 19,693,146
Qatar HIC
17,857,143
4,727,373 6,593,407 7,206,759
Saudi Arabia HIC
213,333,333
Somalia LIC⁺ Low Income 0 0 0 0 0
Sudan* LMIC⁺ Phase 1 890,199 876,715 1,736,110 2,593,240 2,721,000
Syria LMIC
24,659,269 24,829,635 25,000,000 23,057,222 21,001,559
Tunisia* UMIC
2,235,886 5,327,461 5,121,967 5,539,143 5,423,539
United Arab Emirates HIC
Yemen* LMIC⁺ Phase 1 2,675,682 3,139,247 4,802,013 4,811,886 4,988,037
Countries included in the analysis are marked with an asterisk*
Gavi eligible countries are signified with a plus ⁺ over the income status
WHO estimates in italics
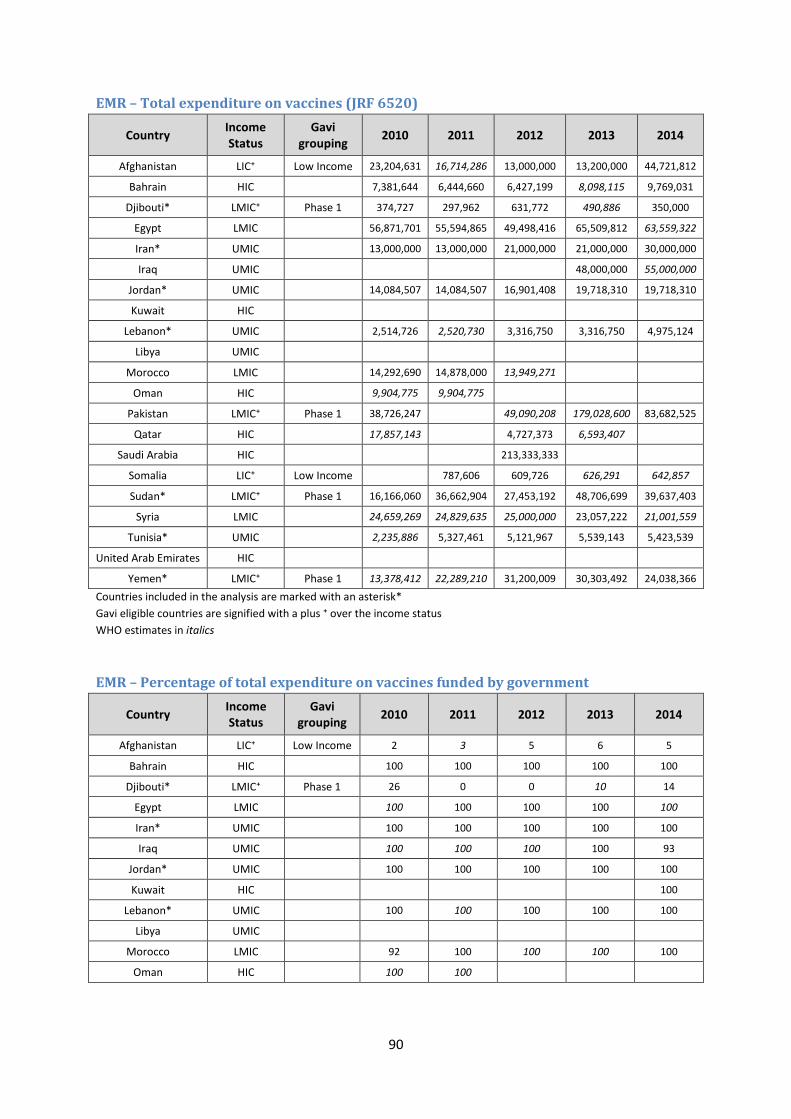
90
EMR – Total expenditure on vaccines (JRF 6520)
Country Income Status
Gavi grouping
2010 2011 2012 2013 2014
Afghanistan LIC⁺ Low Income 23,204,631 16,714,286 13,000,000 13,200,000 44,721,812
Bahrain HIC
7,381,644 6,444,660 6,427,199 8,098,115 9,769,031
Djibouti* LMIC⁺ Phase 1 374,727 297,962 631,772 490,886 350,000
Egypt LMIC
56,871,701 55,594,865 49,498,416 65,509,812 63,559,322
Iran* UMIC
13,000,000 13,000,000 21,000,000 21,000,000 30,000,000
Iraq UMIC
48,000,000 55,000,000
Jordan* UMIC
14,084,507 14,084,507 16,901,408 19,718,310 19,718,310
Kuwait HIC
Lebanon* UMIC
2,514,726 2,520,730 3,316,750 3,316,750 4,975,124
Libya UMIC
Morocco LMIC
14,292,690 14,878,000 13,949,271
Oman HIC
9,904,775 9,904,775
Pakistan LMIC⁺ Phase 1 38,726,247
49,090,208 179,028,600 83,682,525
Qatar HIC
17,857,143
4,727,373 6,593,407
Saudi Arabia HIC
213,333,333
Somalia LIC⁺ Low Income
787,606 609,726 626,291 642,857
Sudan* LMIC⁺ Phase 1 16,166,060 36,662,904 27,453,192 48,706,699 39,637,403
Syria LMIC
24,659,269 24,829,635 25,000,000 23,057,222 21,001,559
Tunisia* UMIC
2,235,886 5,327,461 5,121,967 5,539,143 5,423,539
United Arab Emirates HIC
Yemen* LMIC⁺ Phase 1 13,378,412 22,289,210 31,200,009 30,303,492 24,038,366
Countries included in the analysis are marked with an asterisk*
Gavi eligible countries are signified with a plus ⁺ over the income status
WHO estimates in italics
EMR – Percentage of total expenditure on vaccines funded by government
Country Income Status
Gavi grouping
2010 2011 2012 2013 2014
Afghanistan LIC⁺ Low Income 2 3 5 6 5
Bahrain HIC
100 100 100 100 100
Djibouti* LMIC⁺ Phase 1 26 0 0 10 14
Egypt LMIC
100 100 100 100 100
Iran* UMIC
100 100 100 100 100
Iraq UMIC
100 100 100 100 93
Jordan* UMIC
100 100 100 100 100
Kuwait HIC
100
Lebanon* UMIC
100 100 100 100 100
Libya UMIC
Morocco LMIC
92 100 100 100 100
Oman HIC
100 100
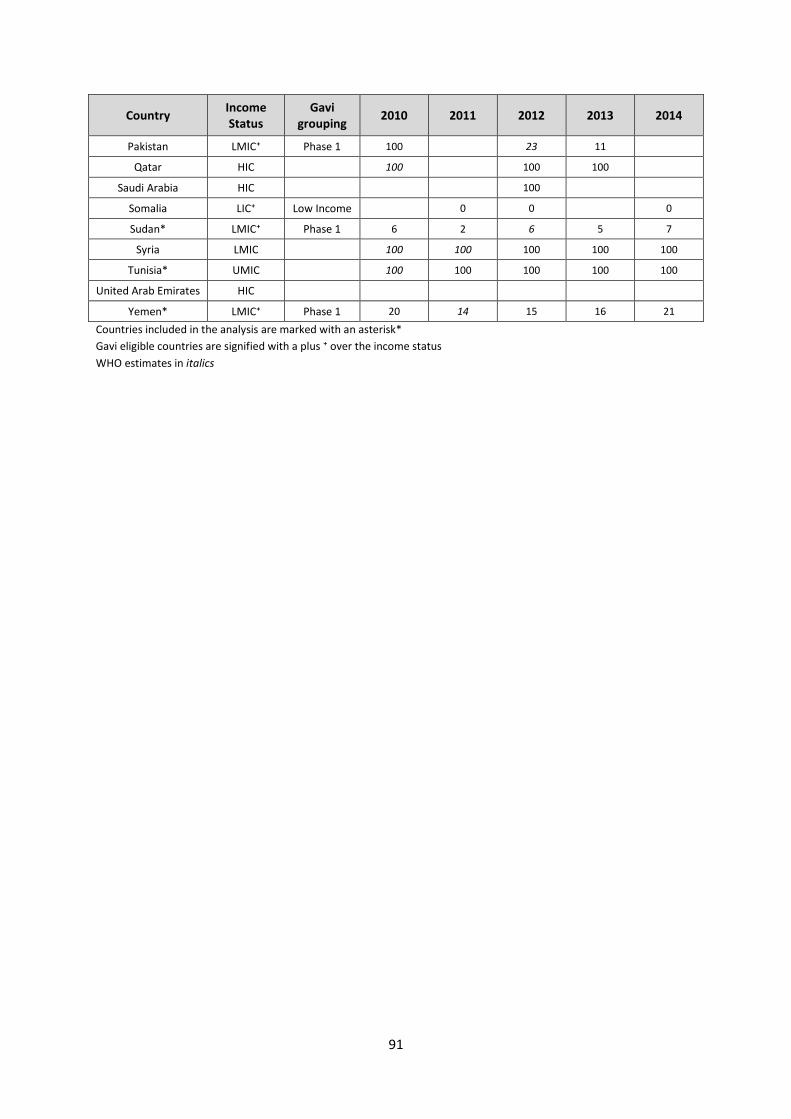
91
Country Income Status
Gavi grouping
2010 2011 2012 2013 2014
Pakistan LMIC⁺ Phase 1 100
23 11
Qatar HIC
100
100 100
Saudi Arabia HIC
100
Somalia LIC⁺ Low Income
0 0
0
Sudan* LMIC⁺ Phase 1 6 2 6 5 7
Syria LMIC
100 100 100 100 100
Tunisia* UMIC
100 100 100 100 100
United Arab Emirates HIC
Yemen* LMIC⁺ Phase 1 20 14 15 16 21
Countries included in the analysis are marked with an asterisk*
Gavi eligible countries are signified with a plus ⁺ over the income status
WHO estimates in italics
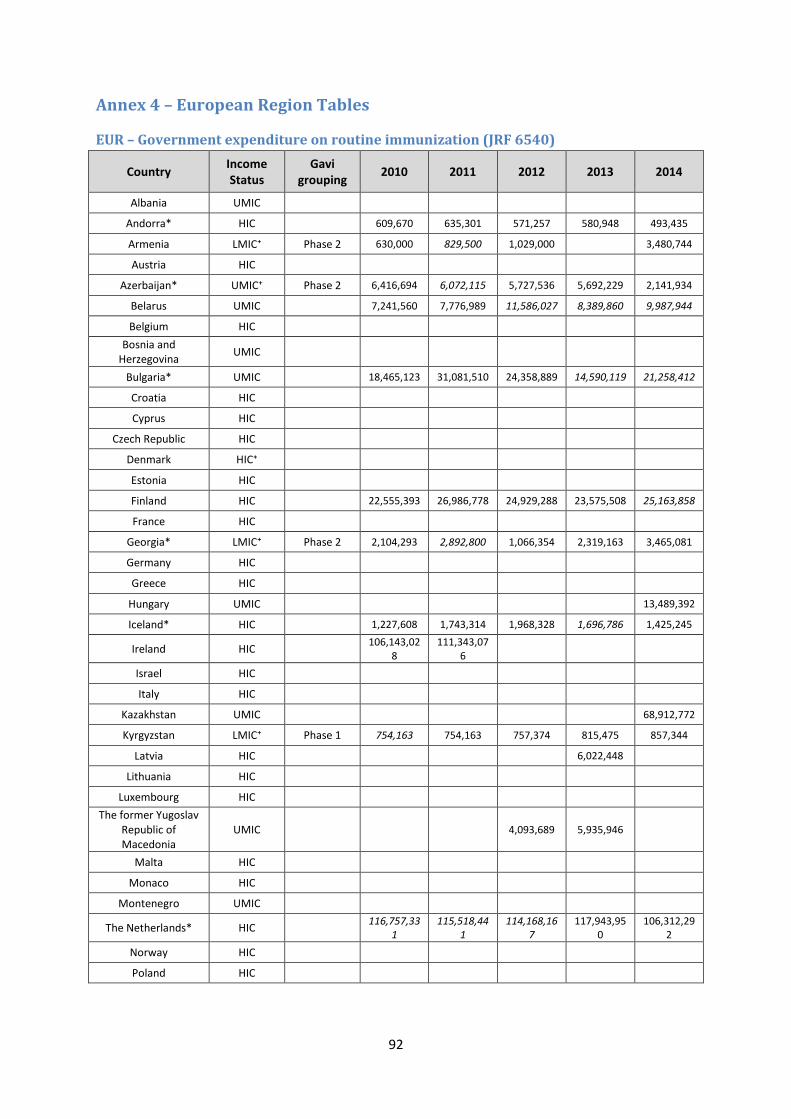
92
Annex 4 – European Region Tables
EUR – Government expenditure on routine immunization (JRF 6540)
Country Income Status
Gavi grouping
2010 2011 2012 2013 2014
Albania UMIC
Andorra* HIC
609,670 635,301 571,257 580,948 493,435
Armenia LMIC⁺ Phase 2 630,000 829,500 1,029,000
3,480,744
Austria HIC
Azerbaijan* UMIC⁺ Phase 2 6,416,694 6,072,115 5,727,536 5,692,229 2,141,934
Belarus UMIC
7,241,560 7,776,989 11,586,027 8,389,860 9,987,944
Belgium HIC
Bosnia and Herzegovina
UMIC
Bulgaria* UMIC
18,465,123 31,081,510 24,358,889 14,590,119 21,258,412
Croatia HIC
Cyprus HIC
Czech Republic HIC
Denmark HIC⁺
Estonia HIC
Finland HIC
22,555,393 26,986,778 24,929,288 23,575,508 25,163,858
France HIC
Georgia* LMIC⁺ Phase 2 2,104,293 2,892,800 1,066,354 2,319,163 3,465,081
Germany HIC
Greece HIC
Hungary UMIC
13,489,392
Iceland* HIC
1,227,608 1,743,314 1,968,328 1,696,786 1,425,245
Ireland HIC
106,143,028
111,343,076
Israel HIC
Italy HIC
Kazakhstan UMIC
68,912,772
Kyrgyzstan LMIC⁺ Phase 1 754,163 754,163 757,374 815,475 857,344
Latvia HIC
6,022,448
Lithuania HIC
Luxembourg HIC
The former Yugoslav Republic of Macedonia
UMIC
4,093,689 5,935,946
Malta HIC
Monaco HIC
Montenegro UMIC
The Netherlands* HIC
116,757,331
115,518,441
114,168,167
117,943,950
106,312,292
Norway HIC
Poland HIC
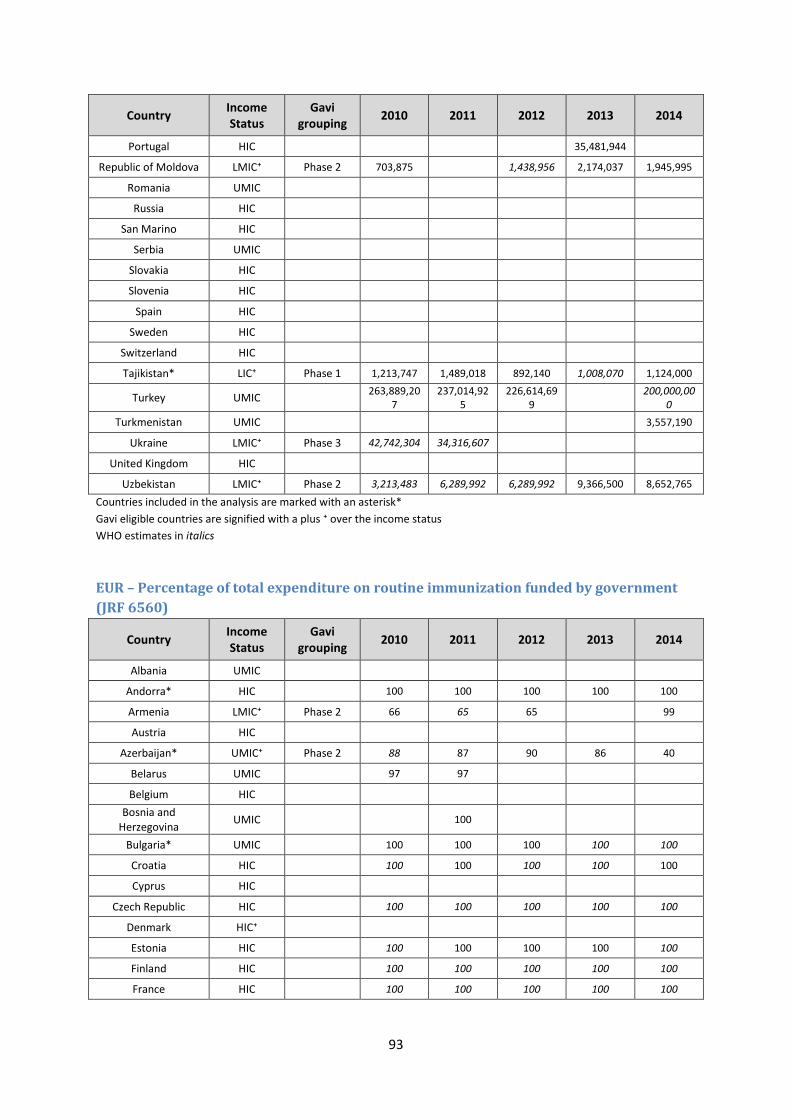
93
Country Income Status
Gavi grouping
2010 2011 2012 2013 2014
Portugal HIC
35,481,944
Republic of Moldova LMIC⁺ Phase 2 703,875
1,438,956 2,174,037 1,945,995
Romania UMIC
Russia HIC
San Marino HIC
Serbia UMIC
Slovakia HIC
Slovenia HIC
Spain HIC
Sweden HIC
Switzerland HIC
Tajikistan* LIC⁺ Phase 1 1,213,747 1,489,018 892,140 1,008,070 1,124,000
Turkey UMIC
263,889,207
237,014,925
226,614,699
200,000,000
Turkmenistan UMIC
3,557,190
Ukraine LMIC⁺ Phase 3 42,742,304 34,316,607
United Kingdom HIC
Uzbekistan LMIC⁺ Phase 2 3,213,483 6,289,992 6,289,992 9,366,500 8,652,765
Countries included in the analysis are marked with an asterisk*
Gavi eligible countries are signified with a plus ⁺ over the income status
WHO estimates in italics
EUR – Percentage of total expenditure on routine immunization funded by government
(JRF 6560)
Country Income Status
Gavi grouping
2010 2011 2012 2013 2014
Albania UMIC
Andorra* HIC
100 100 100 100 100
Armenia LMIC⁺ Phase 2 66 65 65
99
Austria HIC
Azerbaijan* UMIC⁺ Phase 2 88 87 90 86 40
Belarus UMIC
97 97
Belgium HIC
Bosnia and Herzegovina
UMIC
100
Bulgaria* UMIC
100 100 100 100 100
Croatia HIC
100 100 100 100 100
Cyprus HIC
Czech Republic HIC
100 100 100 100 100
Denmark HIC⁺
Estonia HIC
100 100 100 100 100
Finland HIC
100 100 100 100 100
France HIC
100 100 100 100 100
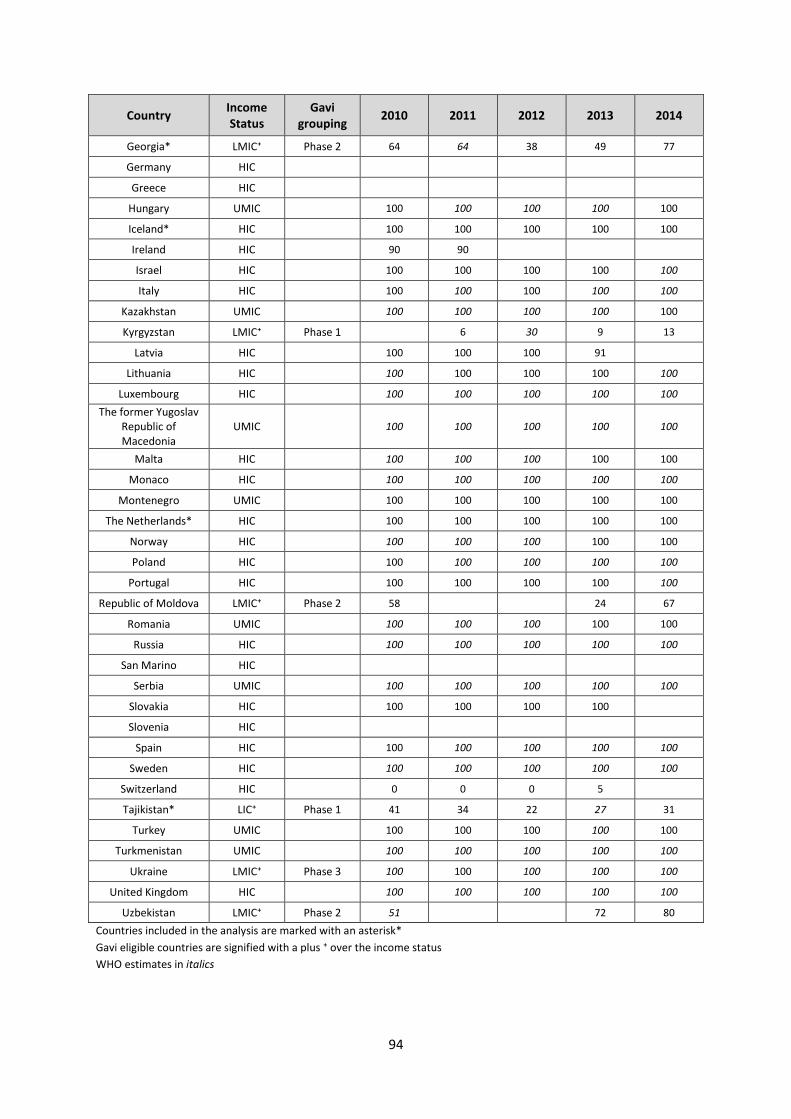
94
Country Income Status
Gavi grouping
2010 2011 2012 2013 2014
Georgia* LMIC⁺ Phase 2 64 64 38 49 77
Germany HIC
Greece HIC
Hungary UMIC
100 100 100 100 100
Iceland* HIC
100 100 100 100 100
Ireland HIC
90 90
Israel HIC
100 100 100 100 100
Italy HIC
100 100 100 100 100
Kazakhstan UMIC
100 100 100 100 100
Kyrgyzstan LMIC⁺ Phase 1
6 30 9 13
Latvia HIC
100 100 100 91
Lithuania HIC
100 100 100 100 100
Luxembourg HIC
100 100 100 100 100
The former Yugoslav Republic of Macedonia
UMIC
100 100 100 100 100
Malta HIC
100 100 100 100 100
Monaco HIC
100 100 100 100 100
Montenegro UMIC
100 100 100 100 100
The Netherlands* HIC
100 100 100 100 100
Norway HIC
100 100 100 100 100
Poland HIC
100 100 100 100 100
Portugal HIC
100 100 100 100 100
Republic of Moldova LMIC⁺ Phase 2 58
24 67
Romania UMIC
100 100 100 100 100
Russia HIC
100 100 100 100 100
San Marino HIC
Serbia UMIC
100 100 100 100 100
Slovakia HIC
100 100 100 100
Slovenia HIC
Spain HIC
100 100 100 100 100
Sweden HIC
100 100 100 100 100
Switzerland HIC
0 0 0 5
Tajikistan* LIC⁺ Phase 1 41 34 22 27 31
Turkey UMIC
100 100 100 100 100
Turkmenistan UMIC
100 100 100 100 100
Ukraine LMIC⁺ Phase 3 100 100 100 100 100
United Kingdom HIC
100 100 100 100 100
Uzbekistan LMIC⁺ Phase 2 51
72 80
Countries included in the analysis are marked with an asterisk*
Gavi eligible countries are signified with a plus ⁺ over the income status
WHO estimates in italics
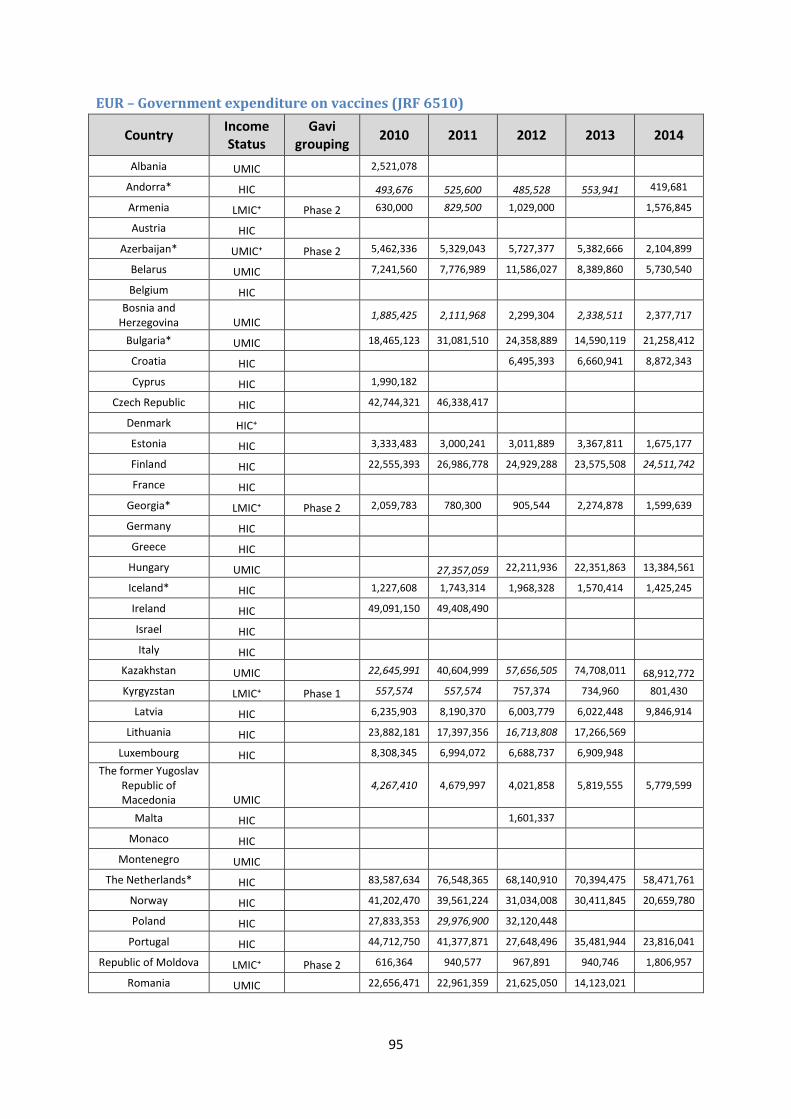
95
EUR – Government expenditure on vaccines (JRF 6510)
Country Income Status
Gavi grouping
2010 2011 2012 2013 2014
Albania UMIC 2,521,078
Andorra* HIC 493,676 525,600 485,528 553,941 419,681
Armenia LMIC⁺ Phase 2 630,000 829,500 1,029,000 1,576,845
Austria HIC
Azerbaijan* UMIC⁺ Phase 2 5,462,336 5,329,043 5,727,377 5,382,666 2,104,899
Belarus UMIC 7,241,560 7,776,989 11,586,027 8,389,860 5,730,540
Belgium HIC
Bosnia and Herzegovina UMIC
1,885,425 2,111,968 2,299,304 2,338,511 2,377,717
Bulgaria* UMIC 18,465,123 31,081,510 24,358,889 14,590,119 21,258,412
Croatia HIC 6,495,393 6,660,941 8,872,343
Cyprus HIC 1,990,182
Czech Republic HIC 42,744,321 46,338,417
Denmark HIC⁺
Estonia HIC 3,333,483 3,000,241 3,011,889 3,367,811 1,675,177
Finland HIC 22,555,393 26,986,778 24,929,288 23,575,508 24,511,742
France HIC
Georgia* LMIC⁺ Phase 2 2,059,783 780,300 905,544 2,274,878 1,599,639
Germany HIC
Greece HIC
Hungary UMIC 27,357,059 22,211,936 22,351,863 13,384,561
Iceland* HIC 1,227,608 1,743,314 1,968,328 1,570,414 1,425,245
Ireland HIC 49,091,150 49,408,490
Israel HIC
Italy HIC
Kazakhstan UMIC 22,645,991 40,604,999 57,656,505 74,708,011 68,912,772
Kyrgyzstan LMIC⁺ Phase 1 557,574 557,574 757,374 734,960 801,430
Latvia HIC 6,235,903 8,190,370 6,003,779 6,022,448 9,846,914
Lithuania HIC 23,882,181 17,397,356 16,713,808 17,266,569
Luxembourg HIC 8,308,345 6,994,072 6,688,737 6,909,948
The former Yugoslav Republic of Macedonia UMIC
4,267,410 4,679,997 4,021,858 5,819,555 5,779,599
Malta HIC 1,601,337
Monaco HIC
Montenegro UMIC
The Netherlands* HIC 83,587,634 76,548,365 68,140,910 70,394,475 58,471,761
Norway HIC 41,202,470 39,561,224 31,034,008 30,411,845 20,659,780
Poland HIC 27,833,353 29,976,900 32,120,448
Portugal HIC 44,712,750 41,377,871 27,648,496 35,481,944 23,816,041
Republic of Moldova LMIC⁺ Phase 2 616,364 940,577 967,891 940,746 1,806,957
Romania UMIC 22,656,471 22,961,359 21,625,050 14,123,021
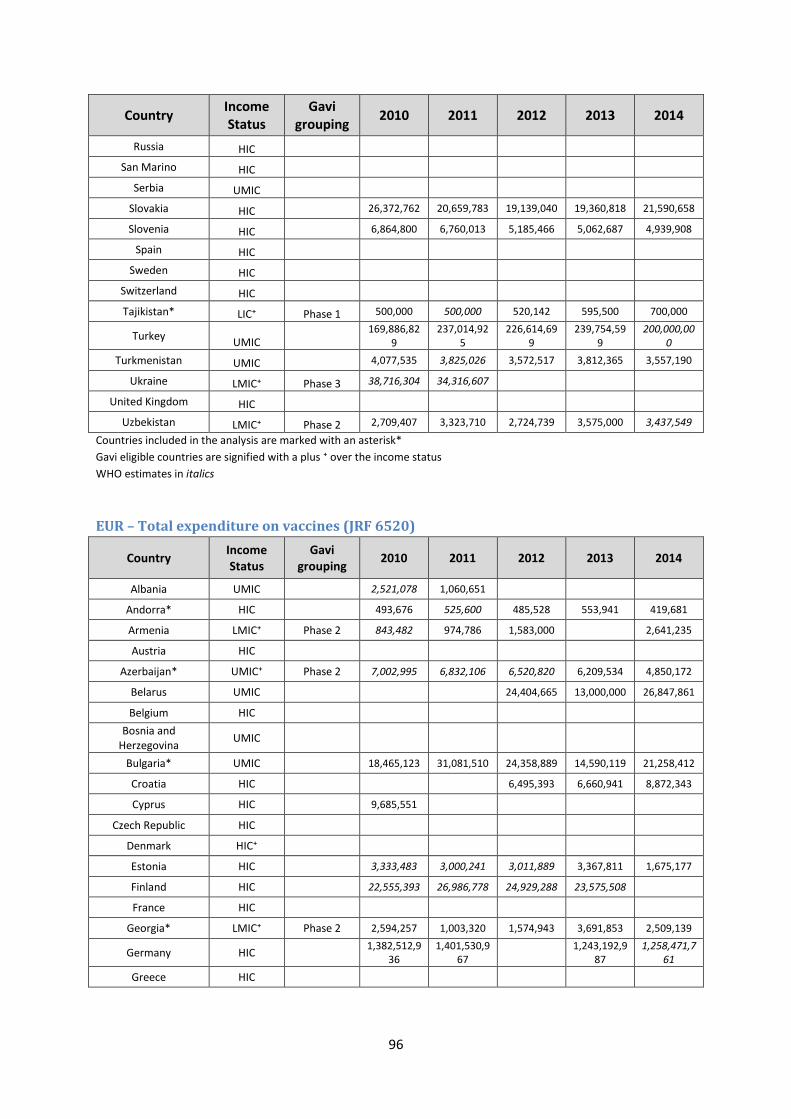
96
Country Income Status
Gavi grouping
2010 2011 2012 2013 2014
Russia HIC
San Marino HIC
Serbia UMIC
Slovakia HIC 26,372,762 20,659,783 19,139,040 19,360,818 21,590,658
Slovenia HIC 6,864,800 6,760,013 5,185,466 5,062,687 4,939,908
Spain HIC
Sweden HIC
Switzerland HIC
Tajikistan* LIC⁺ Phase 1 500,000 500,000 520,142 595,500 700,000
Turkey UMIC
169,886,829
237,014,925
226,614,699
239,754,599
200,000,000
Turkmenistan UMIC 4,077,535 3,825,026 3,572,517 3,812,365 3,557,190
Ukraine LMIC⁺ Phase 3 38,716,304 34,316,607
United Kingdom HIC
Uzbekistan LMIC⁺ Phase 2 2,709,407 3,323,710 2,724,739 3,575,000 3,437,549
Countries included in the analysis are marked with an asterisk*
Gavi eligible countries are signified with a plus ⁺ over the income status
WHO estimates in italics
EUR – Total expenditure on vaccines (JRF 6520)
Country Income Status
Gavi grouping
2010 2011 2012 2013 2014
Albania UMIC
2,521,078 1,060,651
Andorra* HIC
493,676 525,600 485,528 553,941 419,681
Armenia LMIC⁺ Phase 2 843,482 974,786 1,583,000
2,641,235
Austria HIC
Azerbaijan* UMIC⁺ Phase 2 7,002,995 6,832,106 6,520,820 6,209,534 4,850,172
Belarus UMIC
24,404,665 13,000,000 26,847,861
Belgium HIC
Bosnia and Herzegovina
UMIC
Bulgaria* UMIC
18,465,123 31,081,510 24,358,889 14,590,119 21,258,412
Croatia HIC
6,495,393 6,660,941 8,872,343
Cyprus HIC
9,685,551
Czech Republic HIC
Denmark HIC⁺
Estonia HIC
3,333,483 3,000,241 3,011,889 3,367,811 1,675,177
Finland HIC
22,555,393 26,986,778 24,929,288 23,575,508
France HIC
Georgia* LMIC⁺ Phase 2 2,594,257 1,003,320 1,574,943 3,691,853 2,509,139
Germany HIC
1,382,512,936
1,401,530,967
1,243,192,987
1,258,471,761
Greece HIC
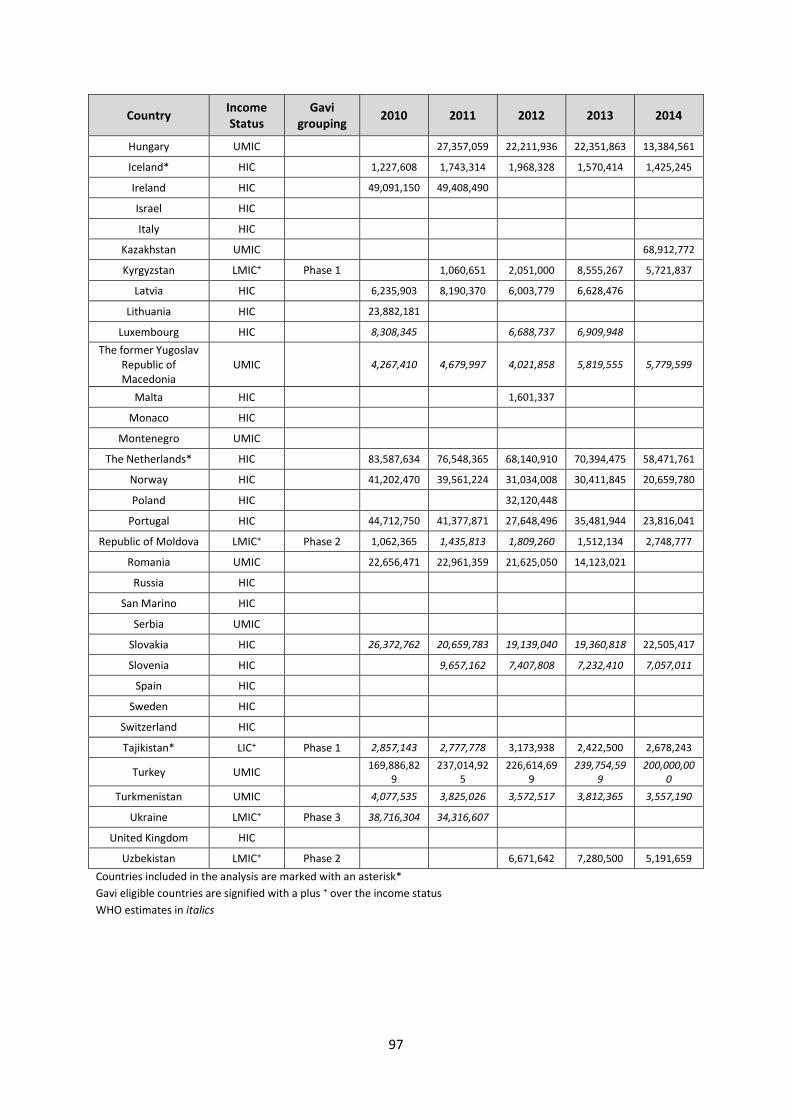
97
Country Income Status
Gavi grouping
2010 2011 2012 2013 2014
Hungary UMIC
27,357,059 22,211,936 22,351,863 13,384,561
Iceland* HIC
1,227,608 1,743,314 1,968,328 1,570,414 1,425,245
Ireland HIC
49,091,150 49,408,490
Israel HIC
Italy HIC
Kazakhstan UMIC
68,912,772
Kyrgyzstan LMIC⁺ Phase 1
1,060,651 2,051,000 8,555,267 5,721,837
Latvia HIC
6,235,903 8,190,370 6,003,779 6,628,476
Lithuania HIC
23,882,181
Luxembourg HIC
8,308,345
6,688,737 6,909,948
The former Yugoslav Republic of Macedonia
UMIC
4,267,410 4,679,997 4,021,858 5,819,555 5,779,599
Malta HIC
1,601,337
Monaco HIC
Montenegro UMIC
The Netherlands* HIC
83,587,634 76,548,365 68,140,910 70,394,475 58,471,761
Norway HIC
41,202,470 39,561,224 31,034,008 30,411,845 20,659,780
Poland HIC
32,120,448
Portugal HIC
44,712,750 41,377,871 27,648,496 35,481,944 23,816,041
Republic of Moldova LMIC⁺ Phase 2 1,062,365 1,435,813 1,809,260 1,512,134 2,748,777
Romania UMIC
22,656,471 22,961,359 21,625,050 14,123,021
Russia HIC
San Marino HIC
Serbia UMIC
Slovakia HIC
26,372,762 20,659,783 19,139,040 19,360,818 22,505,417
Slovenia HIC
9,657,162 7,407,808 7,232,410 7,057,011
Spain HIC
Sweden HIC
Switzerland HIC
Tajikistan* LIC⁺ Phase 1 2,857,143 2,777,778 3,173,938 2,422,500 2,678,243
Turkey UMIC
169,886,829
237,014,925
226,614,699
239,754,599
200,000,000
Turkmenistan UMIC
4,077,535 3,825,026 3,572,517 3,812,365 3,557,190
Ukraine LMIC⁺ Phase 3 38,716,304 34,316,607
United Kingdom HIC
Uzbekistan LMIC⁺ Phase 2
6,671,642 7,280,500 5,191,659
Countries included in the analysis are marked with an asterisk*
Gavi eligible countries are signified with a plus ⁺ over the income status
WHO estimates in italics
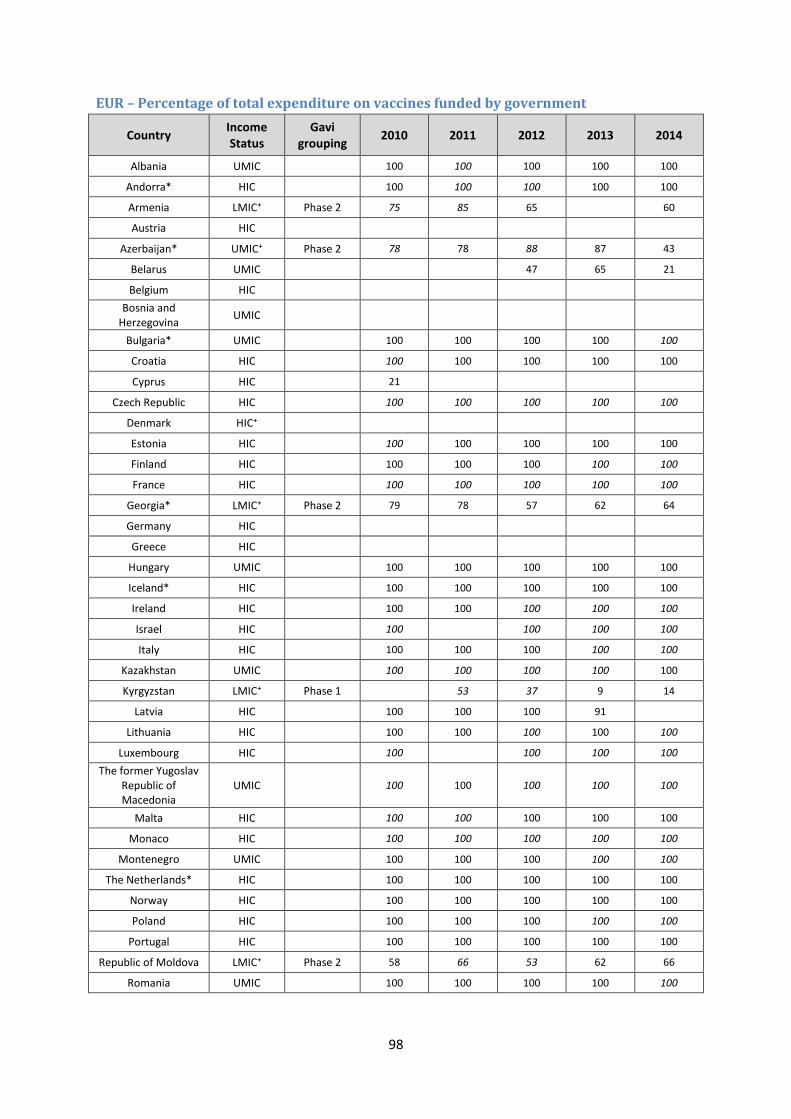
98
EUR – Percentage of total expenditure on vaccines funded by government
Country Income Status
Gavi grouping
2010 2011 2012 2013 2014
Albania UMIC
100 100 100 100 100
Andorra* HIC
100 100 100 100 100
Armenia LMIC⁺ Phase 2 75 85 65
60
Austria HIC
Azerbaijan* UMIC⁺ Phase 2 78 78 88 87 43
Belarus UMIC
47 65 21
Belgium HIC
Bosnia and Herzegovina
UMIC
Bulgaria* UMIC
100 100 100 100 100
Croatia HIC
100 100 100 100 100
Cyprus HIC
21
Czech Republic HIC
100 100 100 100 100
Denmark HIC⁺
Estonia HIC
100 100 100 100 100
Finland HIC
100 100 100 100 100
France HIC
100 100 100 100 100
Georgia* LMIC⁺ Phase 2 79 78 57 62 64
Germany HIC
Greece HIC
Hungary UMIC
100 100 100 100 100
Iceland* HIC
100 100 100 100 100
Ireland HIC
100 100 100 100 100
Israel HIC
100
100 100 100
Italy HIC
100 100 100 100 100
Kazakhstan UMIC
100 100 100 100 100
Kyrgyzstan LMIC⁺ Phase 1
53 37 9 14
Latvia HIC
100 100 100 91
Lithuania HIC
100 100 100 100 100
Luxembourg HIC
100
100 100 100
The former Yugoslav Republic of Macedonia
UMIC
100 100 100 100 100
Malta HIC
100 100 100 100 100
Monaco HIC
100 100 100 100 100
Montenegro UMIC
100 100 100 100 100
The Netherlands* HIC
100 100 100 100 100
Norway HIC
100 100 100 100 100
Poland HIC
100 100 100 100 100
Portugal HIC
100 100 100 100 100
Republic of Moldova LMIC⁺ Phase 2 58 66 53 62 66
Romania UMIC
100 100 100 100 100
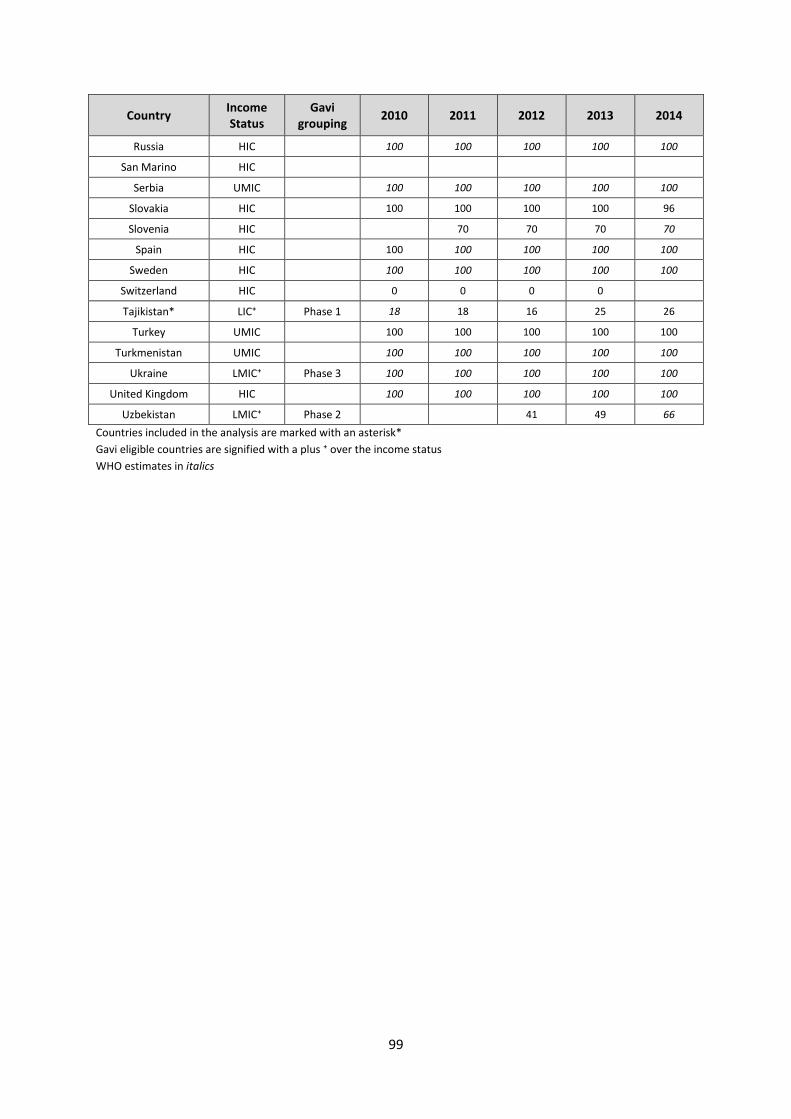
99
Country Income Status
Gavi grouping
2010 2011 2012 2013 2014
Russia HIC
100 100 100 100 100
San Marino HIC
Serbia UMIC
100 100 100 100 100
Slovakia HIC
100 100 100 100 96
Slovenia HIC
70 70 70 70
Spain HIC
100 100 100 100 100
Sweden HIC
100 100 100 100 100
Switzerland HIC
0 0 0 0
Tajikistan* LIC⁺ Phase 1 18 18 16 25 26
Turkey UMIC
100 100 100 100 100
Turkmenistan UMIC
100 100 100 100 100
Ukraine LMIC⁺ Phase 3 100 100 100 100 100
United Kingdom HIC
100 100 100 100 100
Uzbekistan LMIC⁺ Phase 2
41 49 66
Countries included in the analysis are marked with an asterisk*
Gavi eligible countries are signified with a plus ⁺ over the income status
WHO estimates in italics
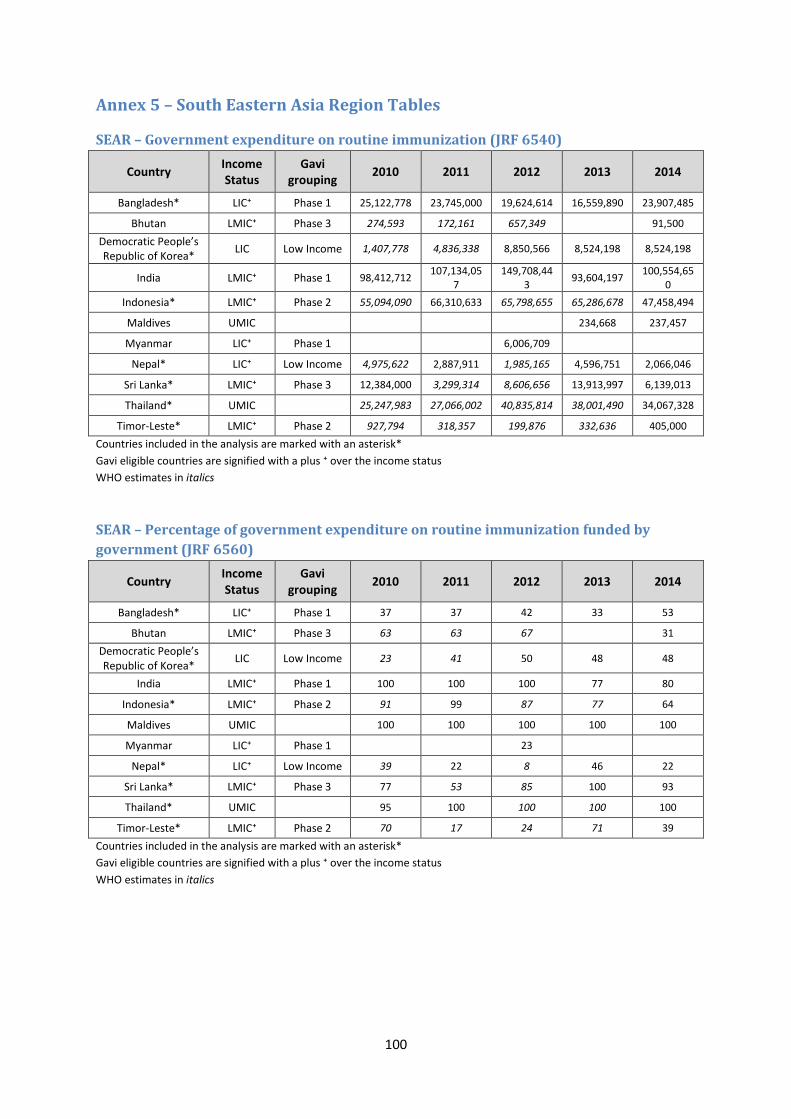
100
Annex 5 – South Eastern Asia Region Tables
SEAR – Government expenditure on routine immunization (JRF 6540)
Country Income Status
Gavi grouping
2010 2011 2012 2013 2014
Bangladesh* LIC⁺ Phase 1 25,122,778 23,745,000 19,624,614 16,559,890 23,907,485
Bhutan LMIC⁺ Phase 3 274,593 172,161 657,349
91,500
Democratic People’s Republic of Korea*
LIC Low Income 1,407,778 4,836,338 8,850,566 8,524,198 8,524,198
India LMIC⁺ Phase 1 98,412,712 107,134,05
7 149,708,44
3 93,604,197
100,554,650
Indonesia* LMIC⁺ Phase 2 55,094,090 66,310,633 65,798,655 65,286,678 47,458,494
Maldives UMIC
234,668 237,457
Myanmar LIC⁺ Phase 1
6,006,709
Nepal* LIC⁺ Low Income 4,975,622 2,887,911 1,985,165 4,596,751 2,066,046
Sri Lanka* LMIC⁺ Phase 3 12,384,000 3,299,314 8,606,656 13,913,997 6,139,013
Thailand* UMIC
25,247,983 27,066,002 40,835,814 38,001,490 34,067,328
Timor-Leste* LMIC⁺ Phase 2 927,794 318,357 199,876 332,636 405,000
Countries included in the analysis are marked with an asterisk*
Gavi eligible countries are signified with a plus ⁺ over the income status
WHO estimates in italics
SEAR – Percentage of government expenditure on routine immunization funded by
government (JRF 6560)
Country Income Status
Gavi grouping
2010 2011 2012 2013 2014
Bangladesh* LIC⁺ Phase 1 37 37 42 33 53
Bhutan LMIC⁺ Phase 3 63 63 67
31
Democratic People’s Republic of Korea*
LIC Low Income 23 41 50 48 48
India LMIC⁺ Phase 1 100 100 100 77 80
Indonesia* LMIC⁺ Phase 2 91 99 87 77 64
Maldives UMIC
100 100 100 100 100
Myanmar LIC⁺ Phase 1
23
Nepal* LIC⁺ Low Income 39 22 8 46 22
Sri Lanka* LMIC⁺ Phase 3 77 53 85 100 93
Thailand* UMIC
95 100 100 100 100
Timor-Leste* LMIC⁺ Phase 2 70 17 24 71 39
Countries included in the analysis are marked with an asterisk*
Gavi eligible countries are signified with a plus ⁺ over the income status
WHO estimates in italics
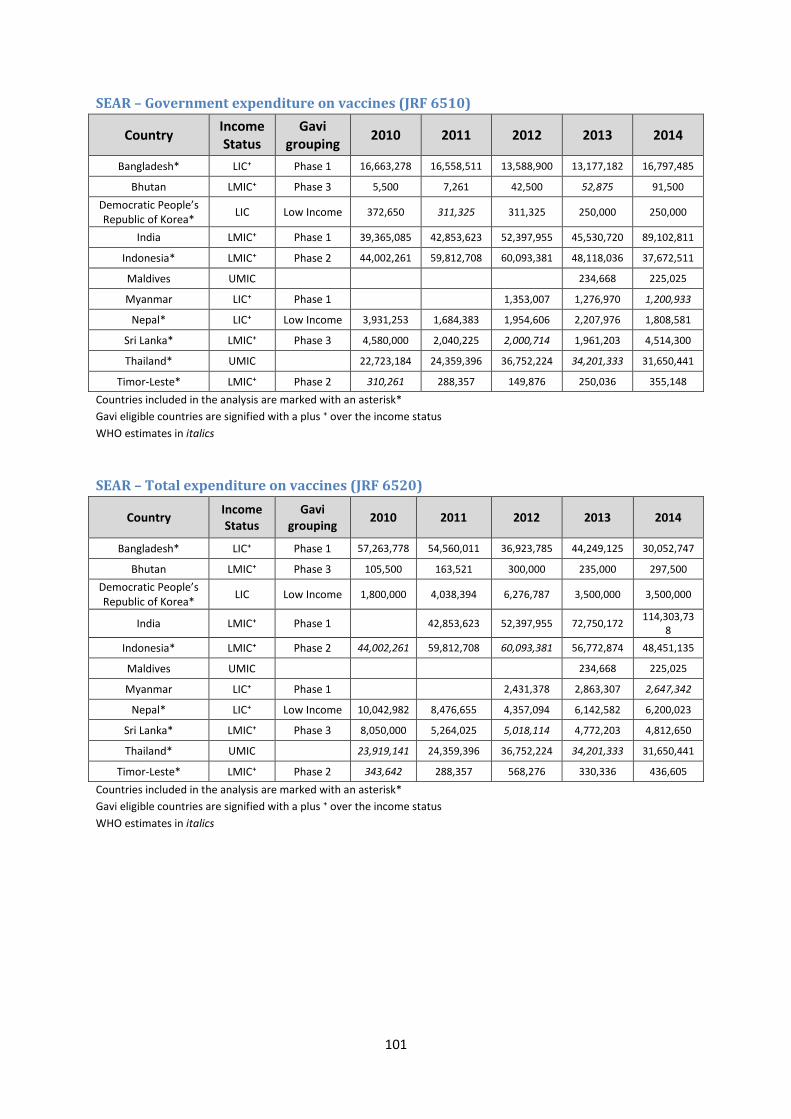
101
SEAR – Government expenditure on vaccines (JRF 6510)
Country Income Status
Gavi grouping
2010 2011 2012 2013 2014
Bangladesh* LIC⁺ Phase 1 16,663,278 16,558,511 13,588,900 13,177,182 16,797,485
Bhutan LMIC⁺ Phase 3 5,500 7,261 42,500 52,875 91,500
Democratic People’s Republic of Korea*
LIC Low Income 372,650 311,325 311,325 250,000 250,000
India LMIC⁺ Phase 1 39,365,085 42,853,623 52,397,955 45,530,720 89,102,811
Indonesia* LMIC⁺ Phase 2 44,002,261 59,812,708 60,093,381 48,118,036 37,672,511
Maldives UMIC
234,668 225,025
Myanmar LIC⁺ Phase 1
1,353,007 1,276,970 1,200,933
Nepal* LIC⁺ Low Income 3,931,253 1,684,383 1,954,606 2,207,976 1,808,581
Sri Lanka* LMIC⁺ Phase 3 4,580,000 2,040,225 2,000,714 1,961,203 4,514,300
Thailand* UMIC
22,723,184 24,359,396 36,752,224 34,201,333 31,650,441
Timor-Leste* LMIC⁺ Phase 2 310,261 288,357 149,876 250,036 355,148
Countries included in the analysis are marked with an asterisk*
Gavi eligible countries are signified with a plus ⁺ over the income status
WHO estimates in italics
SEAR – Total expenditure on vaccines (JRF 6520)
Country Income Status
Gavi grouping
2010 2011 2012 2013 2014
Bangladesh* LIC⁺ Phase 1 57,263,778 54,560,011 36,923,785 44,249,125 30,052,747
Bhutan LMIC⁺ Phase 3 105,500 163,521 300,000 235,000 297,500
Democratic People’s Republic of Korea*
LIC Low Income 1,800,000 4,038,394 6,276,787 3,500,000 3,500,000
India LMIC⁺ Phase 1
42,853,623 52,397,955 72,750,172 114,303,73
8
Indonesia* LMIC⁺ Phase 2 44,002,261 59,812,708 60,093,381 56,772,874 48,451,135
Maldives UMIC
234,668 225,025
Myanmar LIC⁺ Phase 1
2,431,378 2,863,307 2,647,342
Nepal* LIC⁺ Low Income 10,042,982 8,476,655 4,357,094 6,142,582 6,200,023
Sri Lanka* LMIC⁺ Phase 3 8,050,000 5,264,025 5,018,114 4,772,203 4,812,650
Thailand* UMIC
23,919,141 24,359,396 36,752,224 34,201,333 31,650,441
Timor-Leste* LMIC⁺ Phase 2 343,642 288,357 568,276 330,336 436,605
Countries included in the analysis are marked with an asterisk*
Gavi eligible countries are signified with a plus ⁺ over the income status
WHO estimates in italics
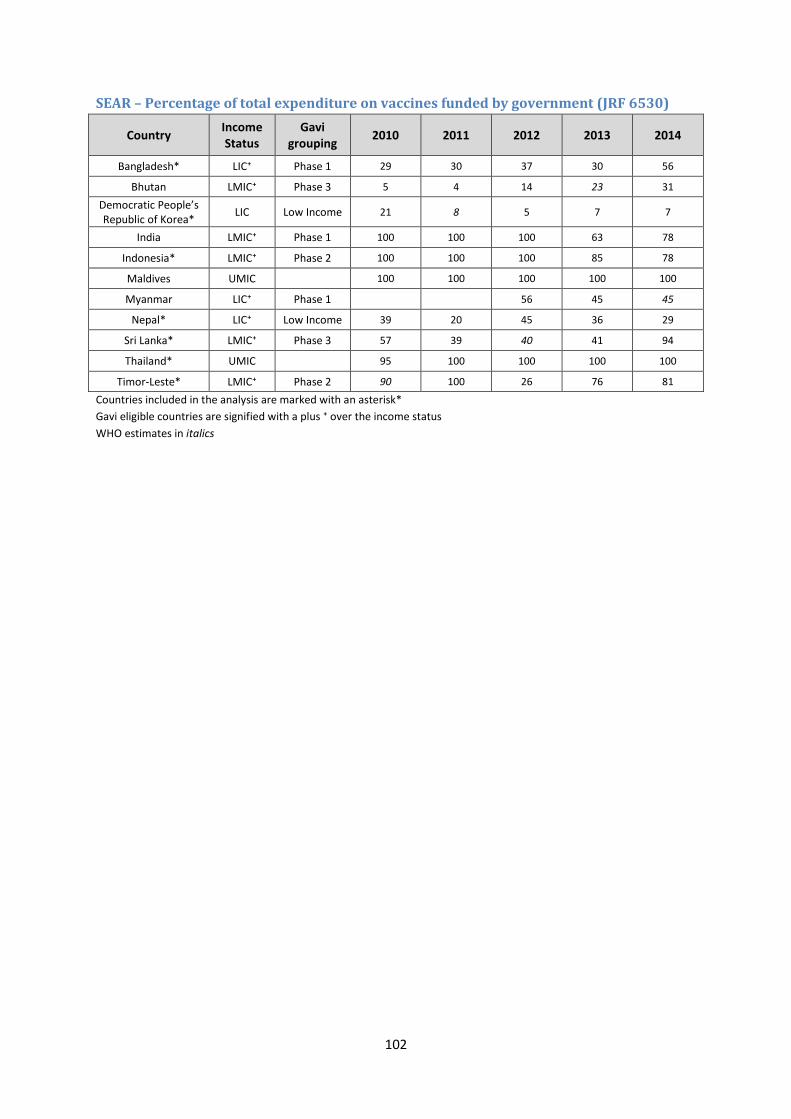
102
SEAR – Percentage of total expenditure on vaccines funded by government (JRF 6530)
Country Income Status
Gavi grouping
2010 2011 2012 2013 2014
Bangladesh* LIC⁺ Phase 1 29 30 37 30 56
Bhutan LMIC⁺ Phase 3 5 4 14 23 31
Democratic People’s Republic of Korea*
LIC Low Income 21 8 5 7 7
India LMIC⁺ Phase 1 100 100 100 63 78
Indonesia* LMIC⁺ Phase 2 100 100 100 85 78
Maldives UMIC
100 100 100 100 100
Myanmar LIC⁺ Phase 1
56 45 45
Nepal* LIC⁺ Low Income 39 20 45 36 29
Sri Lanka* LMIC⁺ Phase 3 57 39 40 41 94
Thailand* UMIC
95 100 100 100 100
Timor-Leste* LMIC⁺ Phase 2 90 100 26 76 81
Countries included in the analysis are marked with an asterisk*
Gavi eligible countries are signified with a plus ⁺ over the income status
WHO estimates in italics
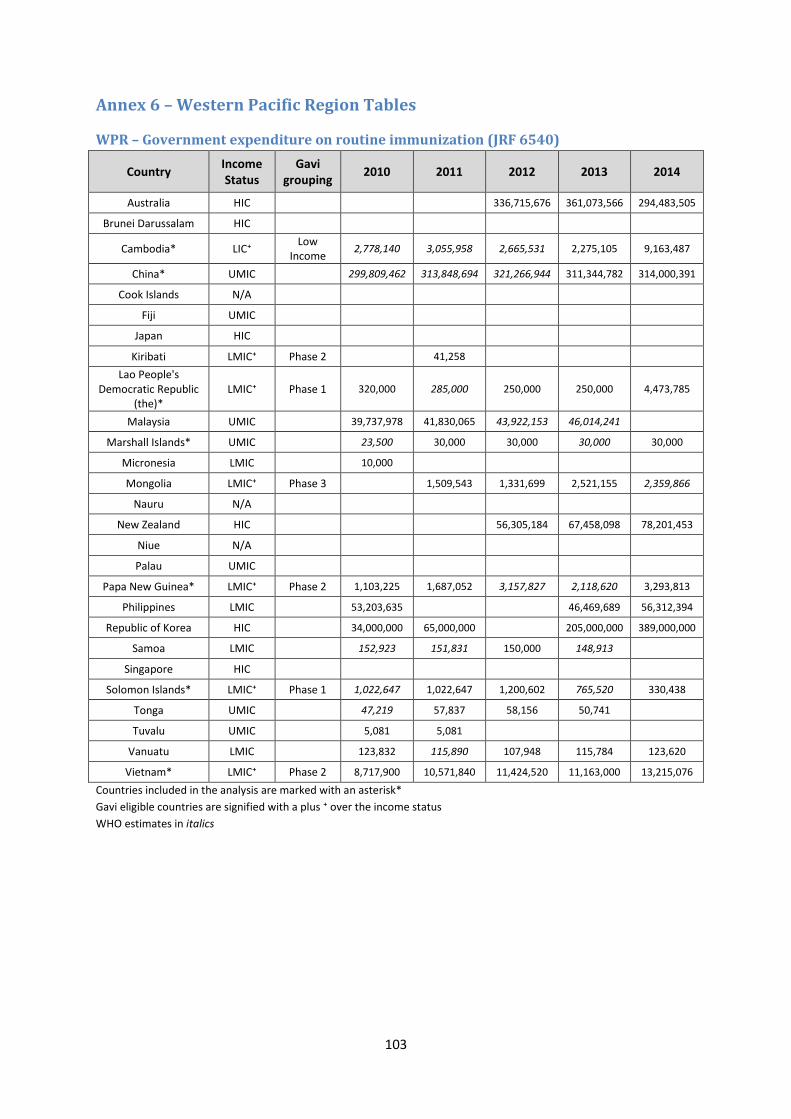
103
Annex 6 – Western Pacific Region Tables
WPR – Government expenditure on routine immunization (JRF 6540)
Country Income Status
Gavi grouping
2010 2011 2012 2013 2014
Australia HIC
336,715,676 361,073,566 294,483,505
Brunei Darussalam HIC
Cambodia* LIC⁺ Low
Income 2,778,140 3,055,958 2,665,531 2,275,105 9,163,487
China* UMIC
299,809,462 313,848,694 321,266,944 311,344,782 314,000,391
Cook Islands N/A
Fiji UMIC
Japan HIC
Kiribati LMIC⁺ Phase 2
41,258
Lao People's Democratic Republic
(the)* LMIC⁺ Phase 1 320,000 285,000 250,000 250,000 4,473,785
Malaysia UMIC
39,737,978 41,830,065 43,922,153 46,014,241
Marshall Islands* UMIC
23,500 30,000 30,000 30,000 30,000
Micronesia LMIC
10,000
Mongolia LMIC⁺ Phase 3
1,509,543 1,331,699 2,521,155 2,359,866
Nauru N/A
New Zealand HIC
56,305,184 67,458,098 78,201,453
Niue N/A
Palau UMIC
Papa New Guinea* LMIC⁺ Phase 2 1,103,225 1,687,052 3,157,827 2,118,620 3,293,813
Philippines LMIC
53,203,635
46,469,689 56,312,394
Republic of Korea HIC
34,000,000 65,000,000
205,000,000 389,000,000
Samoa LMIC
152,923 151,831 150,000 148,913
Singapore HIC
Solomon Islands* LMIC⁺ Phase 1 1,022,647 1,022,647 1,200,602 765,520 330,438
Tonga UMIC
47,219 57,837 58,156 50,741
Tuvalu UMIC
5,081 5,081
Vanuatu LMIC
123,832 115,890 107,948 115,784 123,620
Vietnam* LMIC⁺ Phase 2 8,717,900 10,571,840 11,424,520 11,163,000 13,215,076
Countries included in the analysis are marked with an asterisk*
Gavi eligible countries are signified with a plus ⁺ over the income status
WHO estimates in italics
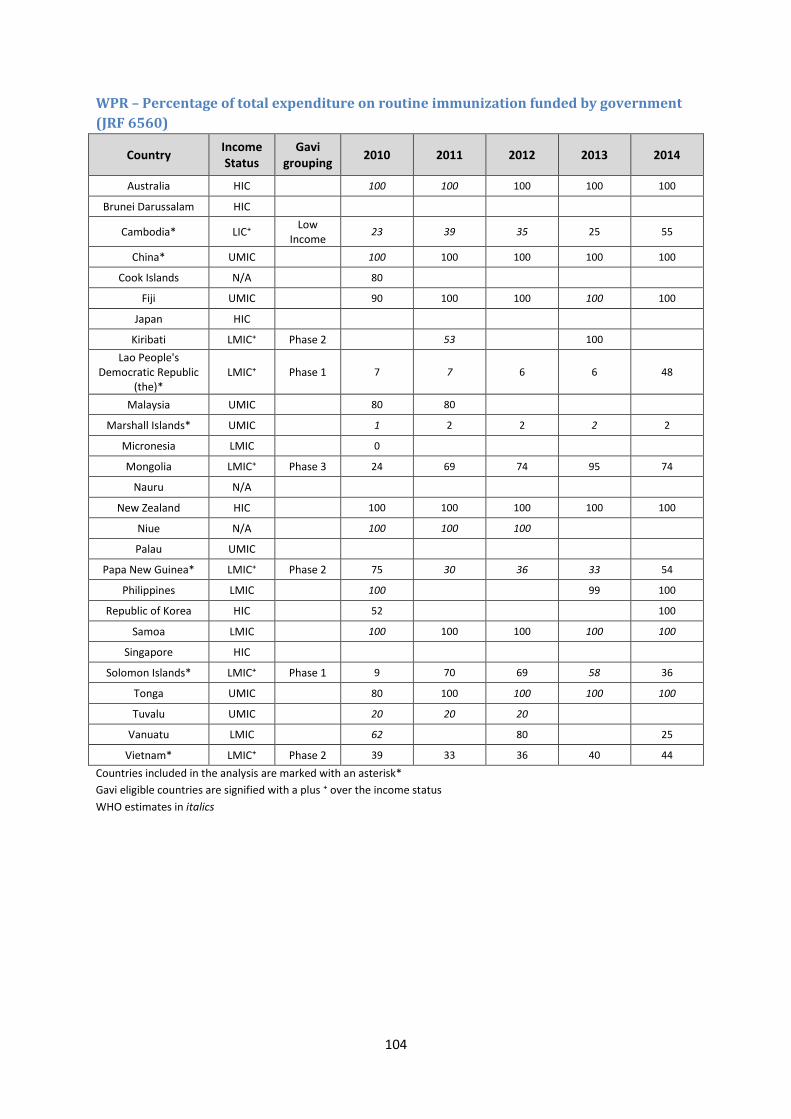
104
WPR – Percentage of total expenditure on routine immunization funded by government
(JRF 6560)
Country Income Status
Gavi grouping
2010 2011 2012 2013 2014
Australia HIC
100 100 100 100 100
Brunei Darussalam HIC
Cambodia* LIC⁺ Low
Income 23 39 35 25 55
China* UMIC
100 100 100 100 100
Cook Islands N/A
80
Fiji UMIC
90 100 100 100 100
Japan HIC
Kiribati LMIC⁺ Phase 2
53
100
Lao People's Democratic Republic
(the)* LMIC⁺ Phase 1 7 7 6 6 48
Malaysia UMIC
80 80
Marshall Islands* UMIC
1 2 2 2 2
Micronesia LMIC
0
Mongolia LMIC⁺ Phase 3 24 69 74 95 74
Nauru N/A
New Zealand HIC
100 100 100 100 100
Niue N/A
100 100 100
Palau UMIC
Papa New Guinea* LMIC⁺ Phase 2 75 30 36 33 54
Philippines LMIC
100
99 100
Republic of Korea HIC
52
100
Samoa LMIC
100 100 100 100 100
Singapore HIC
Solomon Islands* LMIC⁺ Phase 1 9 70 69 58 36
Tonga UMIC
80 100 100 100 100
Tuvalu UMIC
20 20 20
Vanuatu LMIC
62
80
25
Vietnam* LMIC⁺ Phase 2 39 33 36 40 44
Countries included in the analysis are marked with an asterisk*
Gavi eligible countries are signified with a plus ⁺ over the income status
WHO estimates in italics
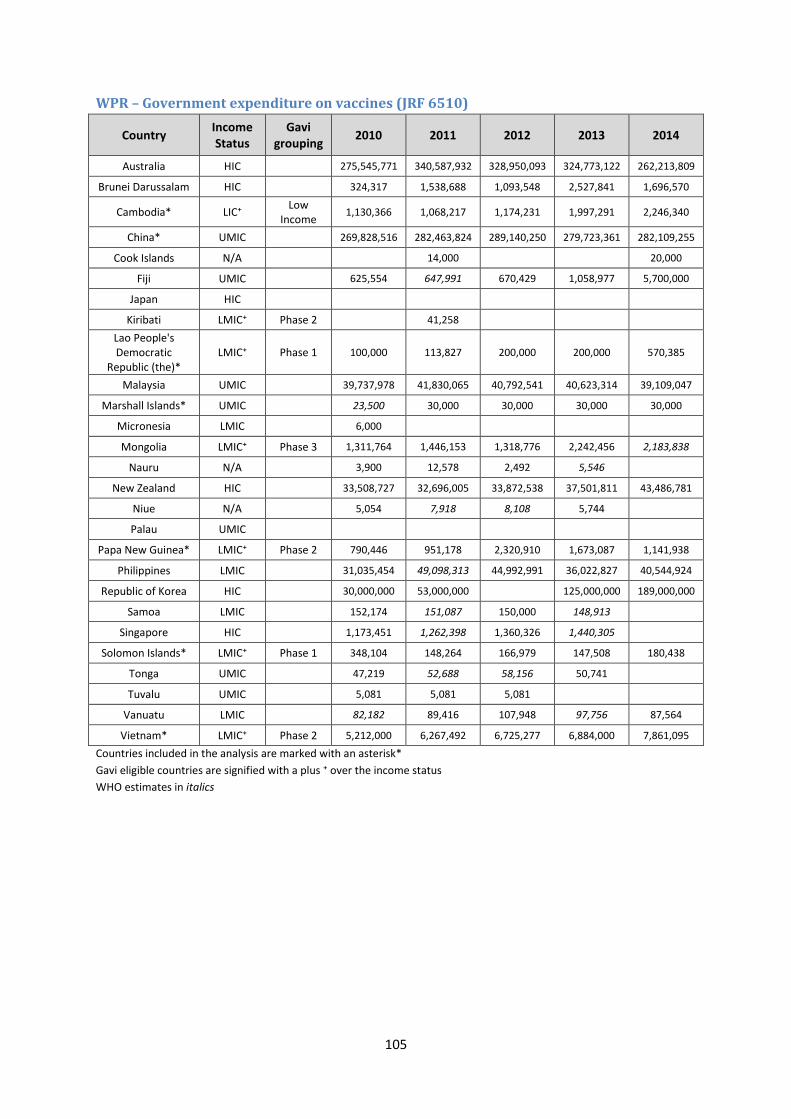
105
WPR – Government expenditure on vaccines (JRF 6510)
Country Income Status
Gavi grouping
2010 2011 2012 2013 2014
Australia HIC
275,545,771 340,587,932 328,950,093 324,773,122 262,213,809
Brunei Darussalam HIC
324,317 1,538,688 1,093,548 2,527,841 1,696,570
Cambodia* LIC⁺ Low
Income 1,130,366 1,068,217 1,174,231 1,997,291 2,246,340
China* UMIC
269,828,516 282,463,824 289,140,250 279,723,361 282,109,255
Cook Islands N/A
14,000
20,000
Fiji UMIC
625,554 647,991 670,429 1,058,977 5,700,000
Japan HIC
Kiribati LMIC⁺ Phase 2
41,258
Lao People's Democratic
Republic (the)* LMIC⁺ Phase 1 100,000 113,827 200,000 200,000 570,385
Malaysia UMIC
39,737,978 41,830,065 40,792,541 40,623,314 39,109,047
Marshall Islands* UMIC
23,500 30,000 30,000 30,000 30,000
Micronesia LMIC
6,000
Mongolia LMIC⁺ Phase 3 1,311,764 1,446,153 1,318,776 2,242,456 2,183,838
Nauru N/A
3,900 12,578 2,492 5,546
New Zealand HIC
33,508,727 32,696,005 33,872,538 37,501,811 43,486,781
Niue N/A
5,054 7,918 8,108 5,744
Palau UMIC
Papa New Guinea* LMIC⁺ Phase 2 790,446 951,178 2,320,910 1,673,087 1,141,938
Philippines LMIC
31,035,454 49,098,313 44,992,991 36,022,827 40,544,924
Republic of Korea HIC
30,000,000 53,000,000
125,000,000 189,000,000
Samoa LMIC
152,174 151,087 150,000 148,913
Singapore HIC
1,173,451 1,262,398 1,360,326 1,440,305
Solomon Islands* LMIC⁺ Phase 1 348,104 148,264 166,979 147,508 180,438
Tonga UMIC
47,219 52,688 58,156 50,741
Tuvalu UMIC
5,081 5,081 5,081
Vanuatu LMIC
82,182 89,416 107,948 97,756 87,564
Vietnam* LMIC⁺ Phase 2 5,212,000 6,267,492 6,725,277 6,884,000 7,861,095
Countries included in the analysis are marked with an asterisk*
Gavi eligible countries are signified with a plus ⁺ over the income status
WHO estimates in italics
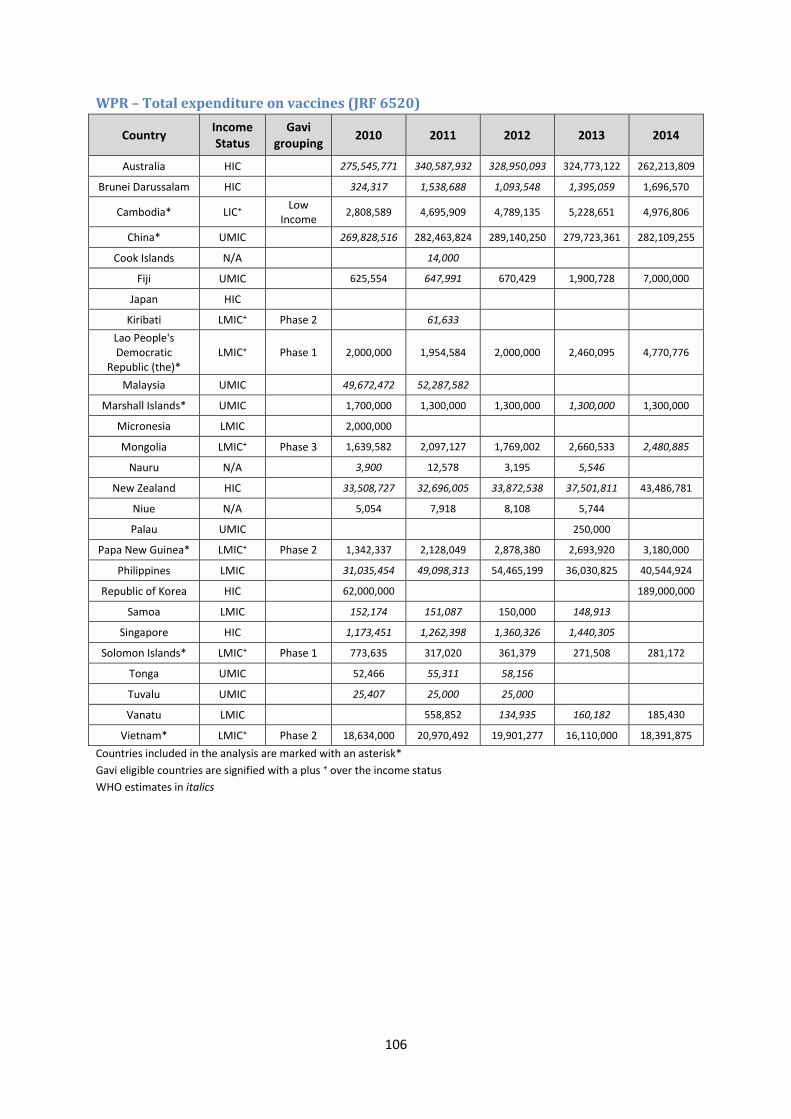
106
WPR – Total expenditure on vaccines (JRF 6520)
Country Income Status
Gavi grouping
2010 2011 2012 2013 2014
Australia HIC
275,545,771 340,587,932 328,950,093 324,773,122 262,213,809
Brunei Darussalam HIC
324,317 1,538,688 1,093,548 1,395,059 1,696,570
Cambodia* LIC⁺ Low
Income 2,808,589 4,695,909 4,789,135 5,228,651 4,976,806
China* UMIC
269,828,516 282,463,824 289,140,250 279,723,361 282,109,255
Cook Islands N/A
14,000
Fiji UMIC
625,554 647,991 670,429 1,900,728 7,000,000
Japan HIC
Kiribati LMIC⁺ Phase 2
61,633
Lao People's Democratic
Republic (the)* LMIC⁺ Phase 1 2,000,000 1,954,584 2,000,000 2,460,095 4,770,776
Malaysia UMIC
49,672,472 52,287,582
Marshall Islands* UMIC
1,700,000 1,300,000 1,300,000 1,300,000 1,300,000
Micronesia LMIC
2,000,000
Mongolia LMIC⁺ Phase 3 1,639,582 2,097,127 1,769,002 2,660,533 2,480,885
Nauru N/A
3,900 12,578 3,195 5,546
New Zealand HIC
33,508,727 32,696,005 33,872,538 37,501,811 43,486,781
Niue N/A
5,054 7,918 8,108 5,744
Palau UMIC
250,000
Papa New Guinea* LMIC⁺ Phase 2 1,342,337 2,128,049 2,878,380 2,693,920 3,180,000
Philippines LMIC
31,035,454 49,098,313 54,465,199 36,030,825 40,544,924
Republic of Korea HIC
62,000,000
189,000,000
Samoa LMIC
152,174 151,087 150,000 148,913
Singapore HIC
1,173,451 1,262,398 1,360,326 1,440,305
Solomon Islands* LMIC⁺ Phase 1 773,635 317,020 361,379 271,508 281,172
Tonga UMIC
52,466 55,311 58,156
Tuvalu UMIC
25,407 25,000 25,000
Vanatu LMIC
558,852 134,935 160,182 185,430
Vietnam* LMIC⁺ Phase 2 18,634,000 20,970,492 19,901,277 16,110,000 18,391,875
Countries included in the analysis are marked with an asterisk*
Gavi eligible countries are signified with a plus ⁺ over the income status
WHO estimates in italics
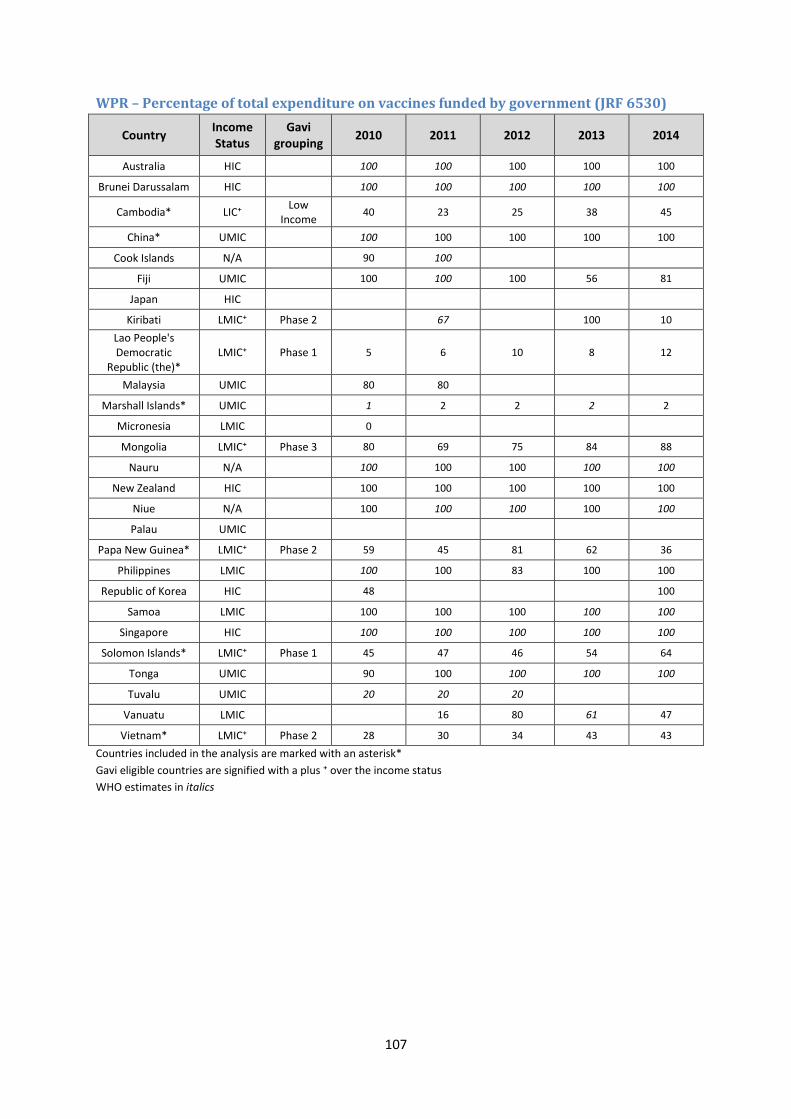
107
WPR – Percentage of total expenditure on vaccines funded by government (JRF 6530)
Country Income Status
Gavi grouping
2010 2011 2012 2013 2014
Australia HIC
100 100 100 100 100
Brunei Darussalam HIC
100 100 100 100 100
Cambodia* LIC⁺ Low
Income 40 23 25 38 45
China* UMIC
100 100 100 100 100
Cook Islands N/A
90 100
Fiji UMIC
100 100 100 56 81
Japan HIC
Kiribati LMIC⁺ Phase 2
67
100 10
Lao People's Democratic
Republic (the)* LMIC⁺ Phase 1 5 6 10 8 12
Malaysia UMIC
80 80
Marshall Islands* UMIC
1 2 2 2 2
Micronesia LMIC
0
Mongolia LMIC⁺ Phase 3 80 69 75 84 88
Nauru N/A
100 100 100 100 100
New Zealand HIC
100 100 100 100 100
Niue N/A
100 100 100 100 100
Palau UMIC
Papa New Guinea* LMIC⁺ Phase 2 59 45 81 62 36
Philippines LMIC
100 100 83 100 100
Republic of Korea HIC
48
100
Samoa LMIC
100 100 100 100 100
Singapore HIC
100 100 100 100 100
Solomon Islands* LMIC⁺ Phase 1 45 47 46 54 64
Tonga UMIC
90 100 100 100 100
Tuvalu UMIC
20 20 20
Vanuatu LMIC
16 80 61 47
Vietnam* LMIC⁺ Phase 2 28 30 34 43 43
Countries included in the analysis are marked with an asterisk*
Gavi eligible countries are signified with a plus ⁺ over the income status
WHO estimates in italics
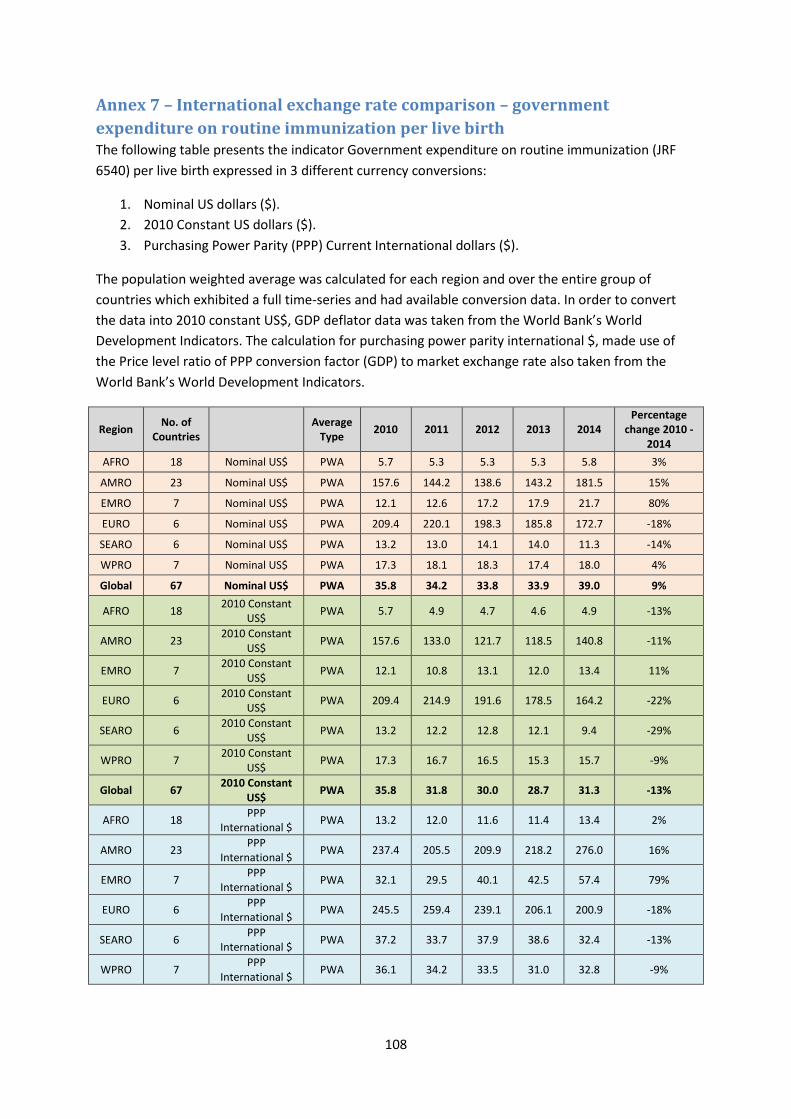
108
Annex 7 – International exchange rate comparison – government
expenditure on routine immunization per live birth The following table presents the indicator Government expenditure on routine immunization (JRF
6540) per live birth expressed in 3 different currency conversions:
1. Nominal US dollars ($).
2. 2010 Constant US dollars ($).
3. Purchasing Power Parity (PPP) Current International dollars ($).
The population weighted average was calculated for each region and over the entire group of
countries which exhibited a full time-series and had available conversion data. In order to convert
the data into 2010 constant US$, GDP deflator data was taken from the World Bank’s World
Development Indicators. The calculation for purchasing power parity international $, made use of
the Price level ratio of PPP conversion factor (GDP) to market exchange rate also taken from the
World Bank’s World Development Indicators.
Region No. of
Countries Average
Type 2010 2011 2012 2013 2014
Percentage change 2010 -
2014
AFRO 18 Nominal US$ PWA 5.7 5.3 5.3 5.3 5.8 3%
AMRO 23 Nominal US$ PWA 157.6 144.2 138.6 143.2 181.5 15%
EMRO 7 Nominal US$ PWA 12.1 12.6 17.2 17.9 21.7 80%
EURO 6 Nominal US$ PWA 209.4 220.1 198.3 185.8 172.7 -18%
SEARO 6 Nominal US$ PWA 13.2 13.0 14.1 14.0 11.3 -14%
WPRO 7 Nominal US$ PWA 17.3 18.1 18.3 17.4 18.0 4%
Global 67 Nominal US$ PWA 35.8 34.2 33.8 33.9 39.0 9%
AFRO 18 2010 Constant
US$ PWA 5.7 4.9 4.7 4.6 4.9 -13%
AMRO 23 2010 Constant
US$ PWA 157.6 133.0 121.7 118.5 140.8 -11%
EMRO 7 2010 Constant
US$ PWA 12.1 10.8 13.1 12.0 13.4 11%
EURO 6 2010 Constant
US$ PWA 209.4 214.9 191.6 178.5 164.2 -22%
SEARO 6 2010 Constant
US$ PWA 13.2 12.2 12.8 12.1 9.4 -29%
WPRO 7 2010 Constant
US$ PWA 17.3 16.7 16.5 15.3 15.7 -9%
Global 67 2010 Constant
US$ PWA 35.8 31.8 30.0 28.7 31.3 -13%
AFRO 18 PPP
International $ PWA 13.2 12.0 11.6 11.4 13.4 2%
AMRO 23 PPP
International $ PWA 237.4 205.5 209.9 218.2 276.0 16%
EMRO 7 PPP
International $ PWA 32.1 29.5 40.1 42.5 57.4 79%
EURO 6 PPP
International $ PWA 245.5 259.4 239.1 206.1 200.9 -18%
SEARO 6 PPP
International $ PWA 37.2 33.7 37.9 38.6 32.4 -13%
WPRO 7 PPP
International $ PWA 36.1 34.2 33.5 31.0 32.8 -9%