Embed Size (px)
Citation preview
Community Noise and CO Levels in Downtown Medellín Abstract # 05-A-530-AWMA; AB-5a: Current Noise Issues
Julian Bedoya V., Ph.D.
Associate Professor, National University of Colombia – Medellín Campus, School of Mines, AA 1027, Medellín, Colombia. Author. e-mail: [email protected]
Norma Lucia Botero, M.A. in Economics
Full Professor, National University of Colombia – Medellín Campus, School of Mines, AA 1027, Medellín, Colombia. Coauthor. e-mail: [email protected]
Eva Cristina Manotas R, I.I.
Assistant Professor, School of Mathematics and Statistics, National University of Colombia – Medellín Campus, AA 1027, Medellín, Colombia. Coauthor. e-mail: [email protected]
Alexandra Giraldo , I.I.
Industrial Engineer, National University of Colombia – Medellin Campus, School of Mines, Medellín, Colombia. Coauthor. e-mail: [email protected]
Lina Marcela Gallego R, I.I.
Industrial Engineer, National University of Colombia – Medellin Campus, School of Mines, Medellín, Colombia. Coauthor. e-mail: [email protected]
ABSTRACT
A research project to evaluate noise and carbon monoxide pollution levels in downtown Medellín was conducted by Redaire and The School of Mines of the National University of Colombia - Medellín Campus. A statistics experimental design and geo-statistics analysis were used to gather data and to evaluate results. The study was done during summer 2004 (July, 23rd thru August, 1st) in an area downtown of Medellin with 4 km2. The area was divided into 10 zones with 16 sampling units (squared blocks of 154 m of side). There were 4 daily sampling periods (05:00 to 09:00; 11:00 to 15:00; 17:00 to 21:00, and night 23:00 to 03:00) and 4 sampling teams working simultaneously in different places. 200 sampling one minute measurements of both CO (ppm) and noise levels dBA were taken randomly for each sampling unit (50 combined records in each sampling period). A total of 32000 records for each independent variable were obtained evenly distributed over the sampling periods and sampling blocks. This information was used to characterize zones and sampling periods. Zone 3 comprised between streets 44 and 49 and avenues 40 and 49) with a global noise average of 71.6 dBA, was found as the noisiest, being the quietest the Carlos E. Restrepo Zone with and average of 66.79 dBA. The sampling period with the highest noise levels 72.68 dBA was from 11:00 to 15:00. Colombia noise limits are 85 dBA for working places and 8-hour averages, 70 dBA during daytime and 60 dBA during night for
1
business districts and similarly in residential areas limits are 65 dBA and 55 dBA respectively. Definitely downtown Medellín does not meet Colombian noise levels. The situation for CO levels is not so critical, but definitely more permanent monitoring for CO has to be undertaken in order to have a better assessment in this matter (some sampling blocks seems to exceed the Colombian standard of 13.1 ppm for 8 hour sampling period). The main reason for these pollutants is the heavy traffic flow in the area. The experimental methodology created a grid of square blocks of 154 m. Measurements were taken in the center of the blocks using a multifactor factor experimental design. Average isophones for environmental noise and isopleths for CO averages were depicted. Downtown noise was found in the range of noise levels reported previously. Night noise levels around the downtown area were found to be quite high. Noise troublesome sites were identified and control measures to improve noise levels in downtown were proposed, especially to limit residential development without good construction control measures to limit indoors noise levels. Those zones ranking high on noise were found to rate high on CO levels, and a strong relationship with high traffic flow was found. Carbon monoxide troublesome sites were identified and control strategies were explored. More research needs to be done in order to be able to come up with a reasonable plan to improve noise and air quality in the downtown area. Solutions are very complex and may impair development of the city downtown area. Some future developments on research should be on building noise codes and public mass transportation system where the metro run on electricity can play a major role in moving people to and out of the downtown area.
Key words: Urban Noise Levels in Medellin, Carbon Monoxide Downtown Medellín, Geo-statistics, Isophones, Noise Sampling Methodology
INTRODUCTION
Industry and transportation play a major role in country and city economic development, but at the same time they affect strongly the environment due to noise and air pollutants. Urban noise and CO pollution are problems clearly identified in downtown Medellín1-7. Even so, the city has not developed yet an urban culture to control noise or air pollution. Periodically local universities and municipal and regional authorities conduct noise and environmental CO studies, but the methodological support has been incipient national regulations, nor a development of a methodological proposal for the country.
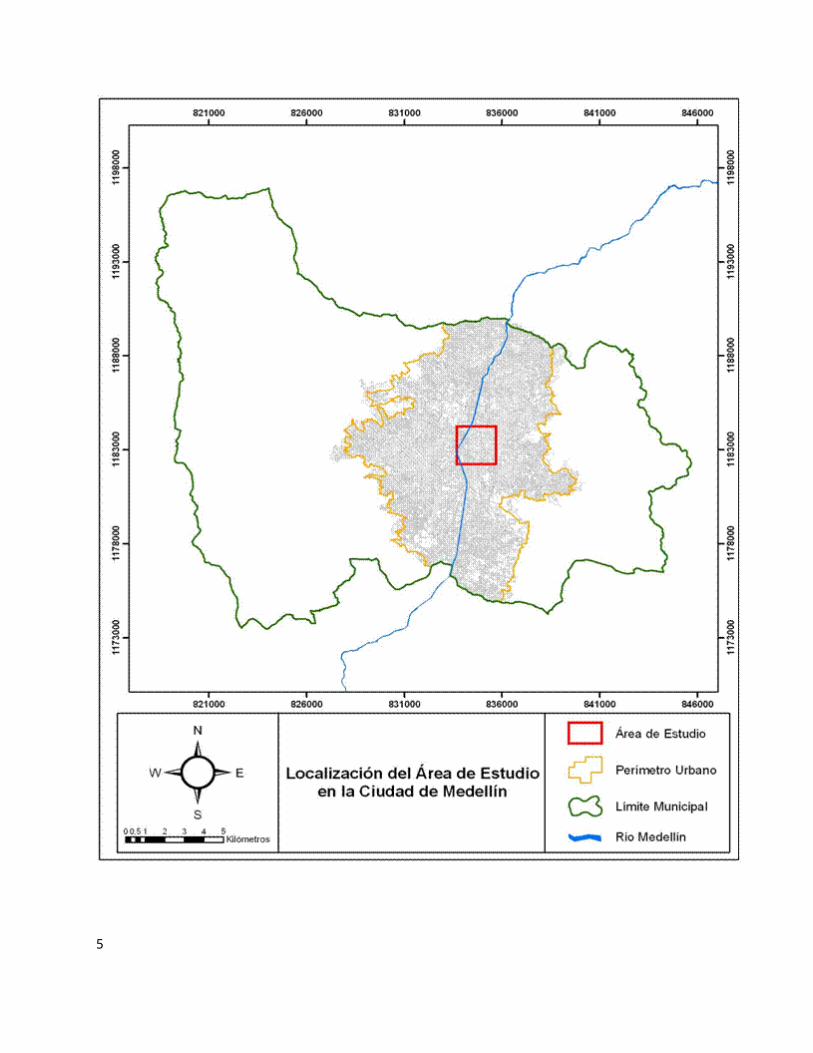
The general objective of this project was to evaluate CO pollution and noise levels in downtown Medellín. The selected area comprises approximately a square of 2 km x 2 km, that covers basically what is known as the yellow zone or the central city ring (Figure 1).
Some of the specific objectives were: To measure environmental noise levels using a statistical experimental design that allows the
maximum of data gathering with good quality and covering the full desired area in a minimum time and effort.
To measure simultaneously concentrations of Carbon Monoxide following the same sampling scheme.
To establish isophones and isopleths for noise and CO evaluation in downtown Medellín
2
To develop a geo statistical sampling technique that allows with a minimum cost and effort to evaluate noise and Carbon Monoxide in large areas.
Figure 1. Sampling area
3
To find out if there is a correlation between noise and Carbon Monoxide levels in downtown Medellín. At the same time to observe variation of pollution with traffic density.
To assess compliance with Colombia regulations for these two pollutants. To develop and support recommendations regarding mass public transportation
improvements. To promote techniques to assure quality information for large areas in advance to coming
regulations on environmental noise for Colombia.
CONCEPTUAL FRAMEWORK
Noise from road traffic is broad band8. To analyze it fully a frequency analysis may be needed, but in most cases the sound noise level dBA is used, although some authors may consider that subjectivity has to be involved in these analysis. There are specific aspects that should be considered in urban noise generation such as: volume of traffic, composition, speed, intersections and pedestrians crossings, road slopes, road widths and surface. All these aspects make that he job for controlling noise be a big challenge.
The heavy traffic load at the downtown area was found as the main cause of urban noise. Streets used for public transportation were found as the most troublesome in regard to noise levels. Whenever there is high congestion the noise levels tend to level out due to lower traffic speed. Traffic composition in downtown is quite homogeneous with heavy presence of compacts and public transportation buses and microbuses. There restrictions for trucks and some other types of vehicles going into downtown area. Intersections are quite noisy especially in the so called “round points”. Most of roads crossing downtown may be considered adequate, but there some exceptions with narrow streets, high buildings and very heavy traffic and consequently high noise levels.
Maximum noise levels in Colombia are regulated by resolution 08321/83. Daytime levels (7:001 am to 9:00 pm) are 65 dBA in residential areas, 70 for business districts and 75 for industrial areas; nighttime levels are 55, 60 and 75 respectively.
Decree 02/82 set Carbon monoxide (CO) standards. The maximum 1-hour average is 43.7 ppm and the 8-hour standard is 13.1 ppm. Sampling periods are from 6:00 am to 10:00 pm in two 8-hour periods. In working environment the standard accepted by Colombian government is the Threshold Limit Value (TLV) for CO is 25 ppm for an 8-hour shift and 40 hours weekly exposure.
Experimental Design and Geo-statistics
Statistical and geo-statistical tools can be used to assess noise and air pollution. Some definitions of tools used by the National University in noise studies are given.
Experimental design is a proposed methodology to gather data on a response variable and how it works with different factors affecting and varying results. An experimental design takes into account the variable being considered: a) controlled factors, and b) factor levels. In addition the 4
number of observations and a randomized sequence is defined9.
Geo-statistics is a branch of statistics involved with three spatial phenomena. It estimates, predicts and simulates such phenomena. The fundamental support of geo-statistical analysis is the auto correlation of data and its usage to predict results over a territory that was not covered by sampling using Krigging techniques. Krigging Interpolation is considered one of the best unbiased linear estimators existing today. It is impossible to obtain data from each point in the real world, due to impractically of such measurements. Interpolations are important to represent and analyze appropriately spatial data. The word Krigging is synonymous of prediction. It is an interpolation method that predicts unknown values for required locations.
EXPERIMENTAL PROCEDURE
The studied area comprises roughly a squared area of 2km by 2 km (380 hectares) in downtown Medellín. The Municipal Secretary of Transportation has called this area the Yellow Zone or City Central Ring (Figure1). The area was broadened to include a contrasting area toward the northwestern portion of downtown area.
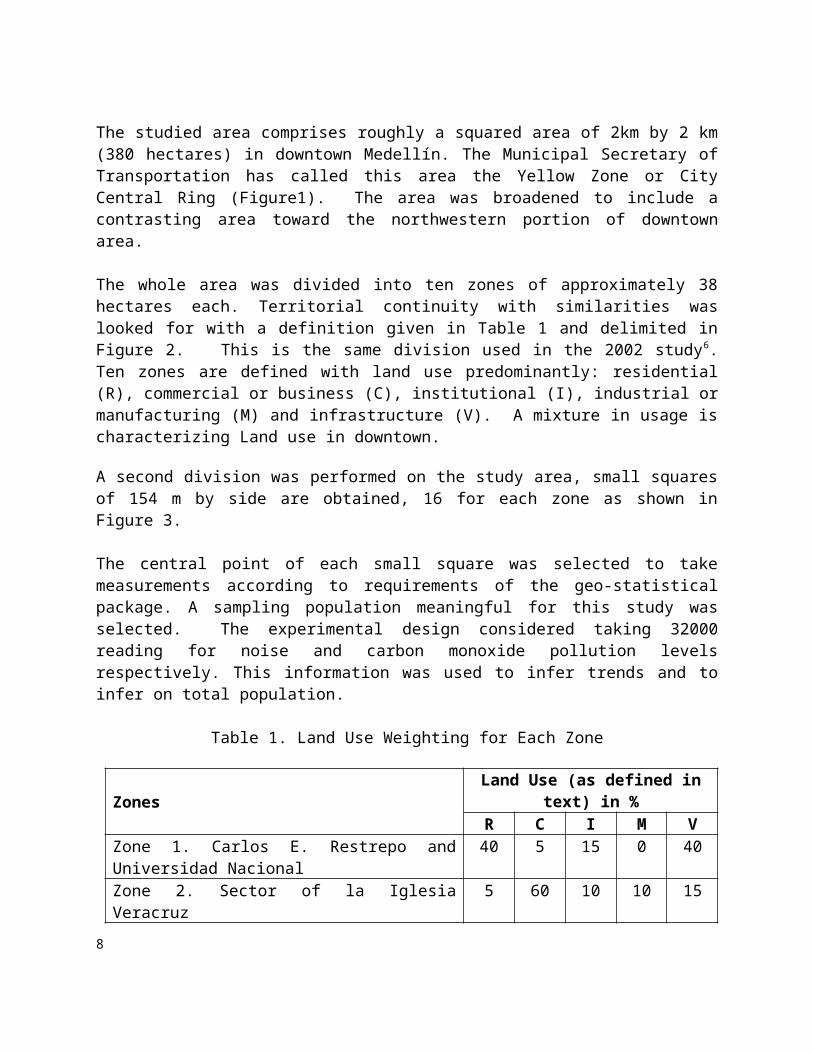
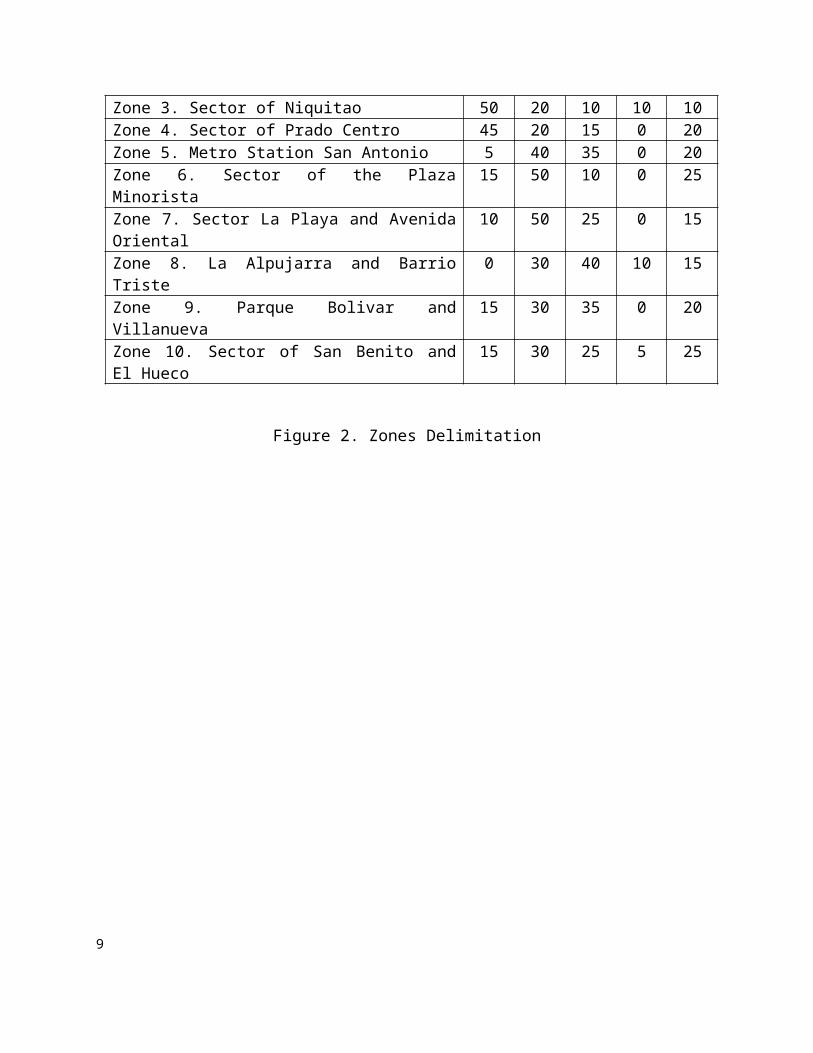
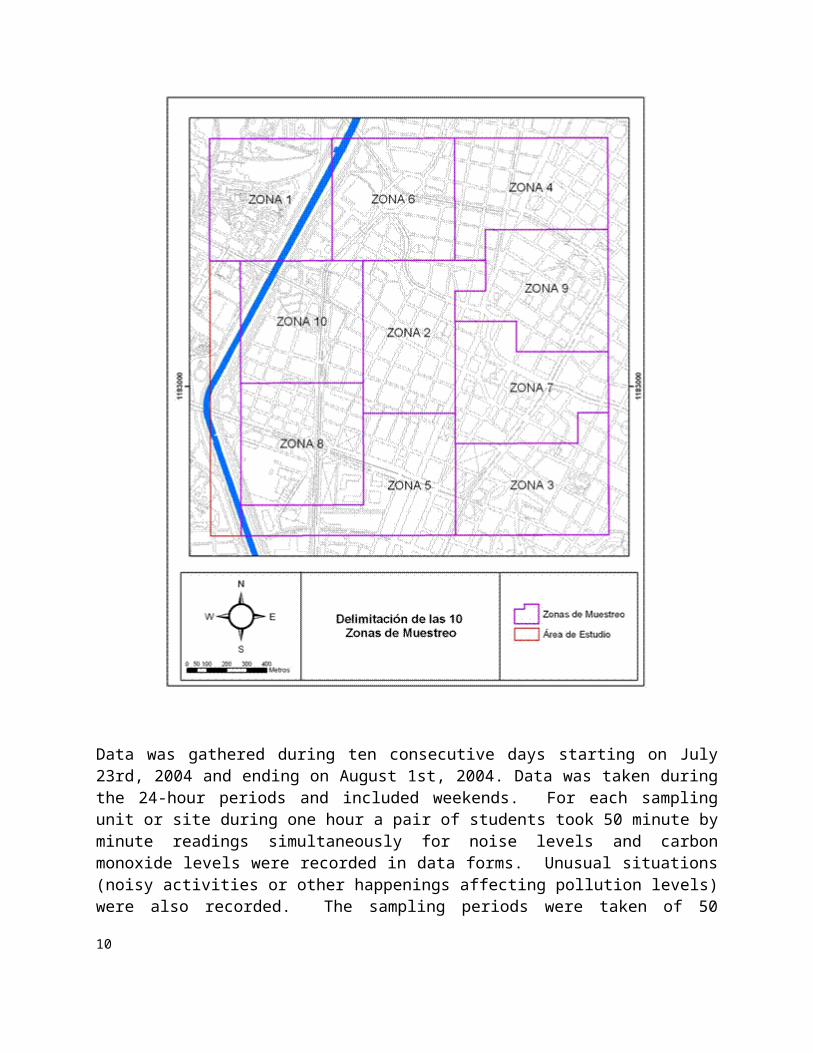
The whole area was divided into ten zones of approximately 38 hectares each. Territorial continuity with similarities was looked for with a definition given in Table 1 and delimited in Figure 2. This is the same division used in the 2002 study6. Ten zones are defined with land use predominantly: residential (R), commercial or business (C), institutional (I), industrial or manufacturing (M) and infrastructure (V). A mixture in usage is characterizing Land use in downtown.
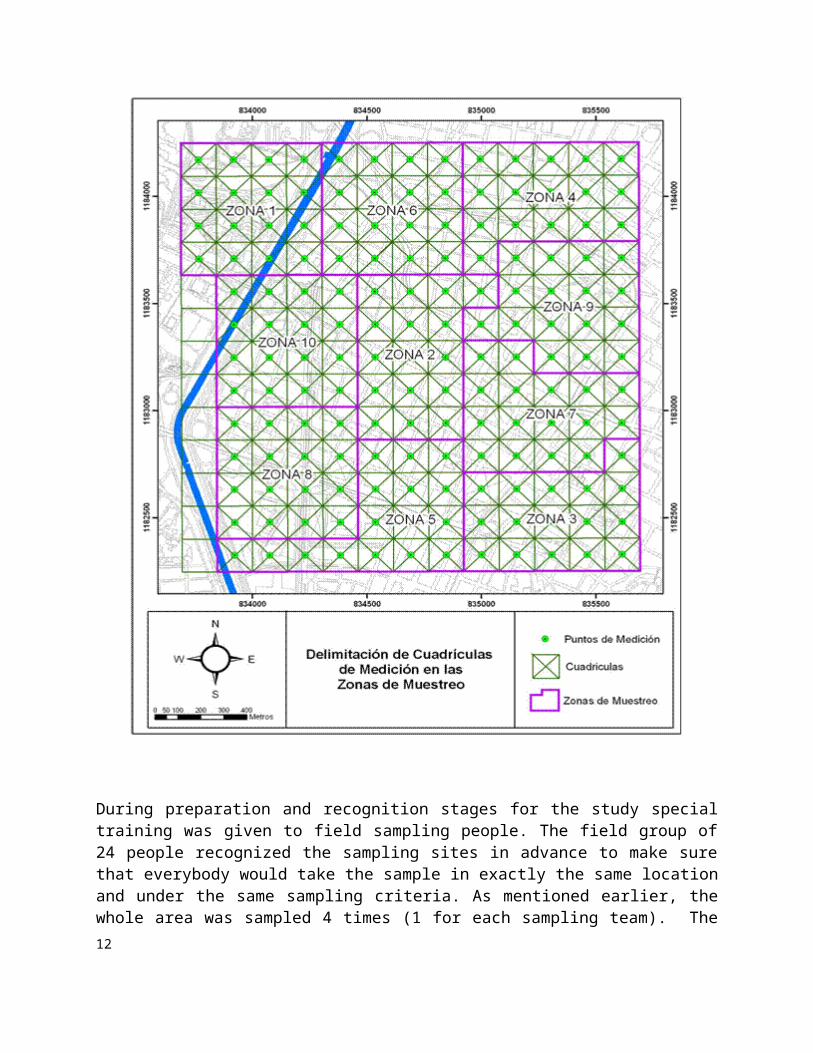
A second division was performed on the study area, small squares of 154 m by side are obtained, 16 for each zone as shown in Figure 3.
The central point of each small square was selected to take measurements according to requirements of the geo-statistical package. A sampling population meaningful for this study was selected. The experimental design considered taking 32000 reading for noise and carbon monoxide pollution levels respectively. This information was used to infer trends and to infer on total population.
Table 1. Land Use Weighting for Each Zone
Zones Land Use (as defined in text) in %R C I M V
Zone 1. Carlos E. Restrepo and Universidad Nacional 40 5 15 0 40Zone 2. Sector of la Iglesia Veracruz 5 60 10 10 15Zone 3. Sector of Niquitao 50 20 10 10 10Zone 4. Sector of Prado Centro 45 20 15 0 20Zone 5. Metro Station San Antonio 5 40 35 0 20Zone 6. Sector of the Plaza Minorista 15 50 10 0 25Zone 7. Sector La Playa and Avenida Oriental 10 50 25 0 15Zone 8. La Alpujarra and Barrio Triste 0 30 40 10 15
5
Zone 9. Parque Bolivar and Villanueva 15 30 35 0 20Zone 10. Sector of San Benito and El Hueco 15 30 25 5 25
Figure 2. Zones Delimitation
Data was gathered during ten consecutive days starting on July 23rd, 2004 and ending on August 1st, 2004. Data was taken during the 24-hour periods and included weekends. For each sampling unit or site during one hour a pair of students took 50 minute by minute readings simultaneously for noise levels and carbon monoxide levels were recorded in data forms. Unusual situations (noisy activities or other happenings affecting pollution levels) were also recorded. The 6
sampling periods were taken of 50 minutes, leaving 10 minutes of spare time to move from location to location. There was a sampling break time after sampling four locations; this time was used for calibration of instruments, batteries check up, data sheets hand in, and sampling people change. The whole zone (16 locations) was covered fully during the sampling periods during the day following a route selected randomly. Measurements were taken in four sampling periods (4 hours each) thus: 05:00-09:00, 11:00-15:00, 17:00-21:00, 23:00-03:00 and there were 4 teams operating the instrumentation simultaneously: Group A, group B, group C and group D.
Figure 3. Subdivision of the Study Area into 160 Small Sampling Squares
7
During preparation and recognition stages for the study special training was given to field sampling people. The field group of 24 people recognized the sampling sites in advance to make sure that everybody would take the sample in exactly the same location and under the same sampling criteria. As mentioned earlier, the whole area was sampled 4 times (1 for each sampling team). The sampling team has 8 people ascribed, but at a given moment only 2 have to be on the field.
NOISE AND CARBON MONOXIDE RESULTS DOWNTOWN MEDELLÍNFigure 4 presents noise results distributed by days. Noise and CO (Carbon Monoxide) 95% confidence intervals are given as well as pollutant averages. Sundays (July 25 and August 1) present lowest values (67.6 and 67.7 dBA). Except highest values for Fridays (71.8 DBA), weekdays including Saturdays were very similar for noise (68.9 to 70.9 dBA). As can be seen in the figure Friday’s noise values are more than 4 dBA above Sunday’s values. Sunday’s CO values are very low (1.2 and 1.6 ppm), and the highest value was 5.1 on a weekday (Wednesday). The averages range for other weekdays including Saturday goes 2.4 to 4.6 ppm. So looking at the day averages we may find that the noise pollution is a more serious problem that the CO levels. But there are some areas where the pollution risk for continuous CO exposure may be too high.
Figure 4. Day-by-Day distribution of Data for Noise and CO
01/0
8/04
23/0
7/04
24/0
7/04
25/0
7/04
26/0
7/04
27/0
7/04
28/0
7/04
29/0
7/04
30/0
7/04
31/0
7/04
Medias e Intervalos de Confianza al 95%
FECHA
0
1
2
3
4
5
6
MED
IA_C
O
Figure 5 summarizes noise and CO results distributed by zone. Zone lowest overall ten days noise averages (66.8 dBA) are recorded for the residential and institutional zone 1. Colombia daily noise standard of 65 dBA is not met there (even worse if take into account the nigh time standard of 55 dBA.) Zone highest overall ten days noise averages (71.6 dBA) are found in zone 3, close by El Palo and San Juan with very high traffic flow and high buildings that may magnify the canyon effect. Five of the ten zones present 70.2 or more above Colombian national standard for noise (70 for daytime and 60 dBA for nighttime) if downtown is classified as a business district. The other four zones are very close to this daytime standard with values ranging from 68.0 to 69.7 dBA. Considering the mixture of land usage and that there is residential areas all over the study zone and that noise standards should be stricter in that case there is not a zone meeting national standards. Zone lowest overall ten days CO averages (2.0 ppm) are recorded for
8
zones 5 and 8, around the San Antonio Metro Station and the City Administrative Center a very congested business district, with low traffic. Zones 10 and 4 are very close with 2.1 and 2.2 ppm respectively. Zone highest overall ten days CO averages (6.0 ppm) are found in the same zone 3 with highest noise levels. This value is 2.3 ppm larger that the values of the second highest zone 2 (3.7 ppm) and very close to values for zone 6 (3.6 ppm). Zones 3, 2 and 6 have very high and congested traffic flows. Remaining zones (1, 9 and 7) present values that range from 3.0 to 3.3 ppm. Five of the ten zones present values above 70.2 above Colombian national standard for noise (70 dBA for daytime and 60 dBA for nighttime) if downtown is classified as a business district. It makes sense that those zones with very heavy traffic and congestion present higher CO levels.
Figure 5. Noise Levels by Zones in Downtown Medellín City
Z01 Z02 Z03 Z04 Z05 Z06 Z07 Z08 Z09 Z10
Medias e Intervalos de Confianza al 95%
ZONA
1,8
2,8
3,8
4,8
5,8
6,8
MED
IA_C
O
Figure 6 shows noise and CO 24hr averages for every sampling unit (160 sites, about 200 readings, distributed evenly in four sampling periods with 50 readings each). It is very interesting to find out that in a small scale noise dispersion was very large for every zone. Except for some quieter blocks in zone 1 the whole area seems to have very comparable problems in noise. A very similar pattern for average values is observed for CO pollution levels in whole area, but it can be highlighted some sampling blocks with higher levels in almost every study zone, mainly in zones 3, 9 and 1. More detailed studies have to be conducted in those areas where the 24 hr averages show indication of no compliance with Colombian CO standard (The maximum 1 hour averages is 43.7 ppm and the 8 hour standard is 13.1 ppm). As noticed in those figures shown above downtown Medellin is a very noisy site, but also there are some areas with plenty of problems with CO pollution.
Figure 6. Noise and CO Levels by Sampling Squares Units
9
Z01-
1Z0
1-10
Z01-
11Z0
1-12
Z01-
13Z0
1-14
Z01-
15Z0
1-16
Z01-
2Z0
1-3
Z01-
4Z0
1-5
Z01-
6Z0
1-7
Z01-
8Z0
1-9
Z02-
1Z0
2-10
Z02-
11Z0
2-12
Z02-
13Z0
2-14
Z02-
15Z0
2-16
Z02-
2Z0
2-3
Z02-
4Z0
2-5
Z02-
6Z0
2-7
Z02-
8Z0
2-9
Z03-
1Z0
3-10
Z03-
11Z0
3-12
Z03-
13Z0
3-14
Z03-
15Z0
3-16
Z03-
2Z0
3-3
Z03-
4Z0
3-5
Z03-
6Z0
3-7
Z03-
8Z0
3-9
Z04-
1Z0
4-10
Z04-
11Z0
4-12
Z04-
13Z0
4-14
Z04-
15Z0
4-16
Z04-
2Z0
4-3
Z04-
4Z0
4-5
Z04-
6Z0
4-7
Z04-
8Z0
4-9
Z05-
1Z0
5-10
Z05-
11Z0
5-12
Z05-
13Z0
5-14
Z05-
15Z0
5-16
Z05-
2Z0
5-3
Z05-
4Z0
5-5
Z05-
6Z0
5-7
Z05-
8Z0
5-9
Z06-
1Z0
6-10
Z06-
11Z0
6-12
Z06-
13Z0
6-14
Z06-
15Z0
6-16
Z06-
2Z0
6-3
Z06-
4Z0
6-5
Z06-
6Z0
6-7
Z06-
8Z0
6-9
Z07-
1Z0
7-10
Z07-
11Z0
7-12
Z07-
13Z0
7-14
Z07-
15Z0
7-16
Z07-
2Z0
7-3
Z07-
4Z0
7-5
Z07-
6Z0
7-7
Z07-
8Z0
7-9
Z08-
1Z0
8-10
Z08-
11Z0
8-12
Z08-
13Z0
8-14
Z08-
15Z0
8-16
Z08-
2Z0
8-3
Z08-
4Z0
8-5
Z08-
6Z0
8-7
Z08-
8Z0
8-9
Z09-
1Z0
9-10
Z09-
11Z0
9-12
Z09-
13Z0
9-14
Z09-
15Z0
9-16
Z09-
2Z0
9-3
Z09-
4Z0
9-5
Z09-
6Z0
9-7
Z09-
8Z0
9-9
Z10-
1Z1
0-10
Z10-
11Z1
0-12
Z10-
13Z1
0-14
Z10-
15Z1
0-16
Z10-
2Z1
0-3
Z10-
4Z1
0-5
Z10-
6Z1
0-7
Z10-
8Z1
0-9
Medias e Intervalos de Confianza al 95%
ZONA_CUADRICULA
52
57
62
67
72
77
82R
UID
O
Figure 7 shows a 10-dBA difference between night and daytime noise averages. The highest value found was at noon from 11:00 to 15:00 and the lowest values are given from 23:00 to 03:00. There is a statistical difference among all sampling periods, but it is relevant to show that daytime readings are quite higher compared with nighttime noise levels. It is also interesting to find out that CO levels follow very much the theory. The nighttime overall average for 7332 readings was 0.4 ppm, while the minimum daytime value was 3.6 ppm at noon time (high mixing conditions) and the highest value (4.6 ppm) was found for the morning period (poorest mixing conditions). The two graphs in Figure 7 show clearly a correlation of results for noise levels and CO pollution level for day and night measurements.
Figure 7. Noise and CO Levels by Sampling Periods
11:00-15:00 17:00-21:00 23:00-03:00 5:00-9:00
Medias e Intervalos de confianza al 95%
FRANJA_HORARIA
61
63
65
67
69
71
73
RU
IDO
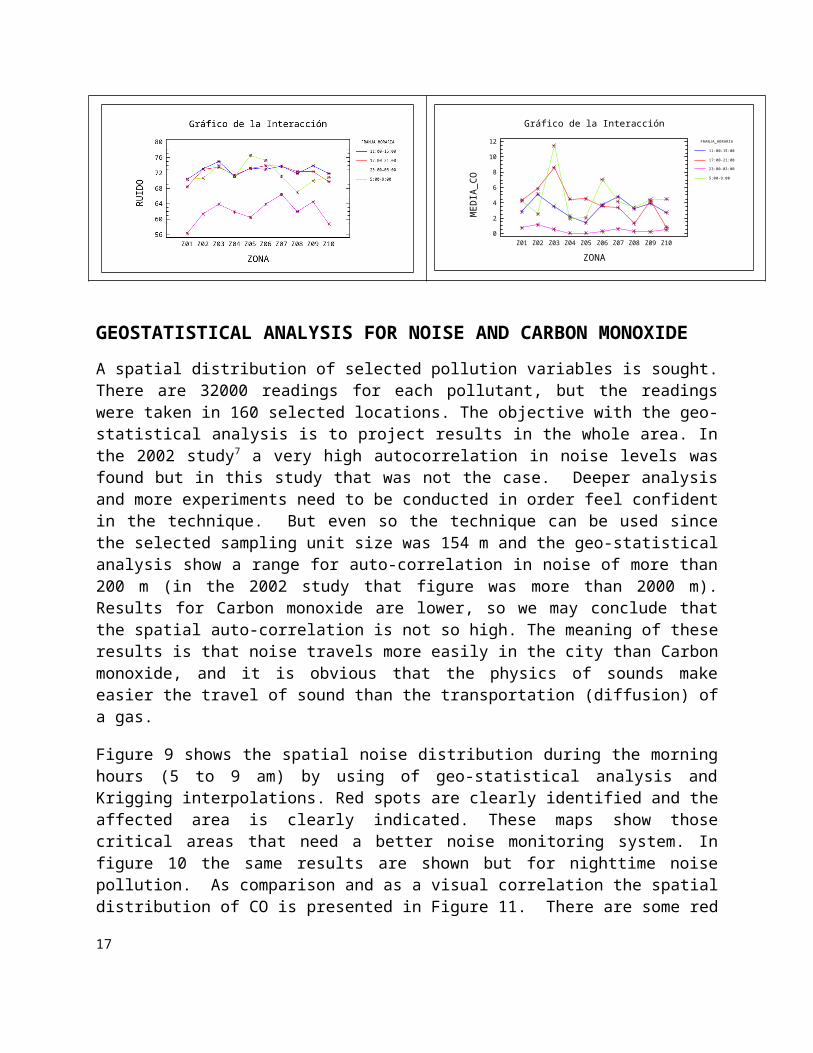
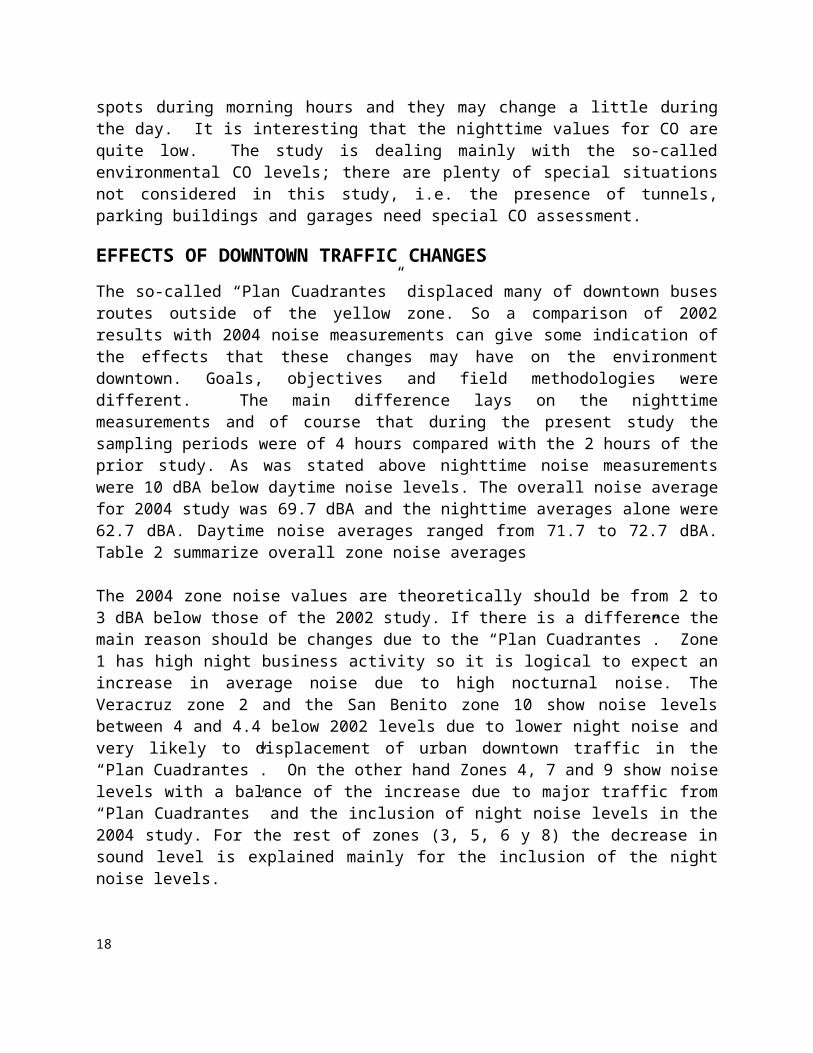
Figure 8 shows a detailed interaction between Location and Sampling Period. In general nighttime results for noise and CO levels are below the daytime recorded values. The first part of the figure shows a more steady state noise situation in the whole are, while the situation for CO has more variation, being noticeable the peak values in Zones 3 and 6 from 5 to 9 am. It is also interesting that in general noise results agree quite well with those reported in 2002 in daytime7.
Figure 8. Noise and CO Levels by Sampling Periods and Locations
10
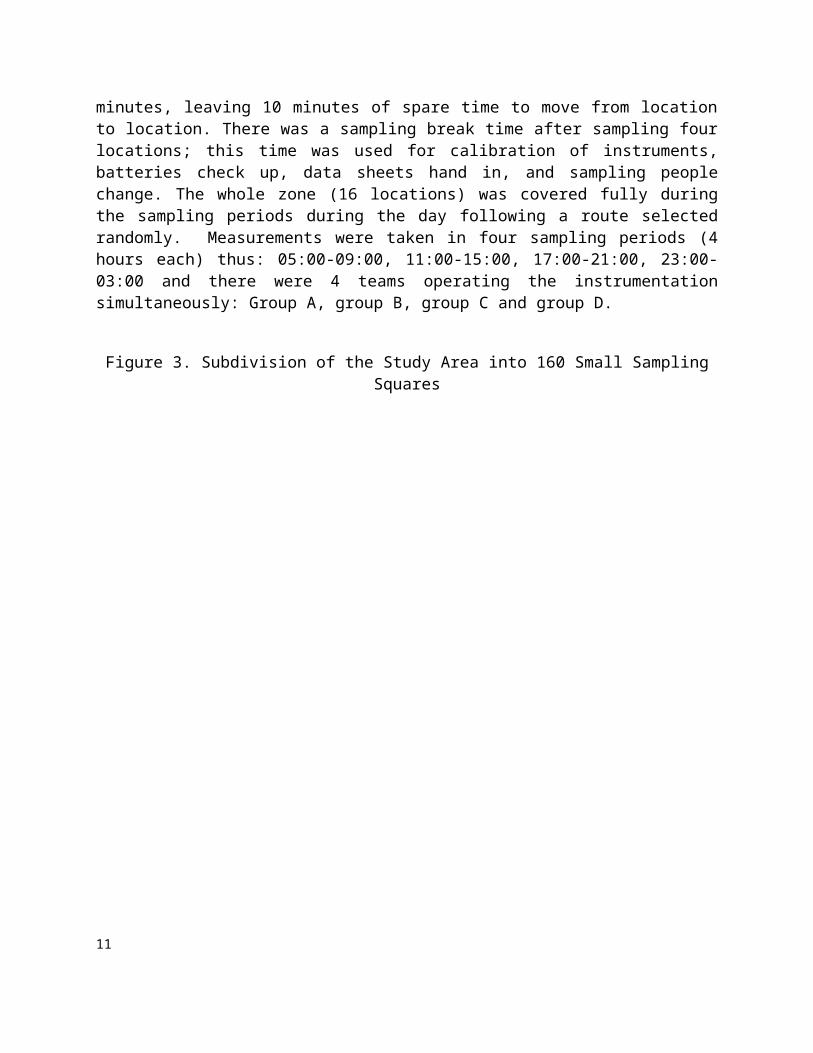
Gráfico de la Interacción
ZONA
0
2
4
6
8
10
12
MED
IA_C
O
Z01 Z02 Z03 Z04 Z05 Z06 Z07 Z08 Z09 Z10
FRANJA_HORARIA
11:00-15:00
17:00-21:00
23:00-03:00
5:00-9:00
GEOSTATISTICAL ANALYSIS FOR NOISE AND CARBON MONOXIDEA spatial distribution of selected pollution variables is sought. There are 32000 readings for each pollutant, but the readings were taken in 160 selected locations. The objective with the geo-statistical analysis is to project results in the whole area. In the 2002 study7 a very high autocorrelation in noise levels was found but in this study that was not the case. Deeper analysis and more experiments need to be conducted in order feel confident in the technique. But even so the technique can be used since the selected sampling unit size was 154 m and the geo-statistical analysis show a range for auto-correlation in noise of more than 200 m (in the 2002 study that figure was more than 2000 m). Results for Carbon monoxide are lower, so we may conclude that the spatial auto-correlation is not so high. The meaning of these results is that noise travels more easily in the city than Carbon monoxide, and it is obvious that the physics of sounds make easier the travel of sound than the transportation (diffusion) of a gas.
Figure 9 shows the spatial noise distribution during the morning hours (5 to 9 am) by using of geo-statistical analysis and Krigging interpolations. Red spots are clearly identified and the affected area is clearly indicated. These maps show those critical areas that need a better noise monitoring system. In figure 10 the same results are shown but for nighttime noise pollution. As comparison and as a visual correlation the spatial distribution of CO is presented in Figure 11. There are some red spots during morning hours and they may change a little during the day. It is interesting that the nighttime values for CO are quite low. The study is dealing mainly with the so-called environmental CO levels; there are plenty of special situations not considered in this study, i.e. the presence of tunnels, parking buildings and garages need special CO assessment.
EFFECTS OF DOWNTOWN TRAFFIC CHANGESThe so-called “Plan Cuadrantes” displaced many of downtown buses routes outside of the yellow zone. So a comparison of 2002 results with 2004 noise measurements can give some indication of the effects that these changes may have on the environment downtown. Goals, objectives and field methodologies were different. The main difference lays on the nighttime measurements and of course that during the present study the sampling periods were of 4 hours compared with the 2 hours of the prior study. As was stated above nighttime noise measurements were 10 dBA below daytime noise levels. The overall noise average for 2004 study was 69.7 dBA and the
11
nighttime averages alone were 62.7 dBA. Daytime noise averages ranged from 71.7 to 72.7 dBA. Table 2 summarize overall zone noise averages
The 2004 zone noise values are theoretically should be from 2 to 3 dBA below those of the 2002 study. If there is a difference the main reason should be changes due to the “Plan Cuadrantes”. Zone 1 has high night business activity so it is logical to expect an increase in average noise due to high nocturnal noise. The Veracruz zone 2 and the San Benito zone 10 show noise levels between 4 and 4.4 below 2002 levels due to lower night noise and very likely to displacement of urban downtown traffic in the “Plan Cuadrantes”. On the other hand Zones 4, 7 and 9 show noise levels with a balance of the increase due to major traffic from “Plan Cuadrantes” and the inclusion of night noise levels in the 2004 study. For the rest of zones (3, 5, 6 y 8) the decrease in sound level is explained mainly for the inclusion of the night noise levels.
12
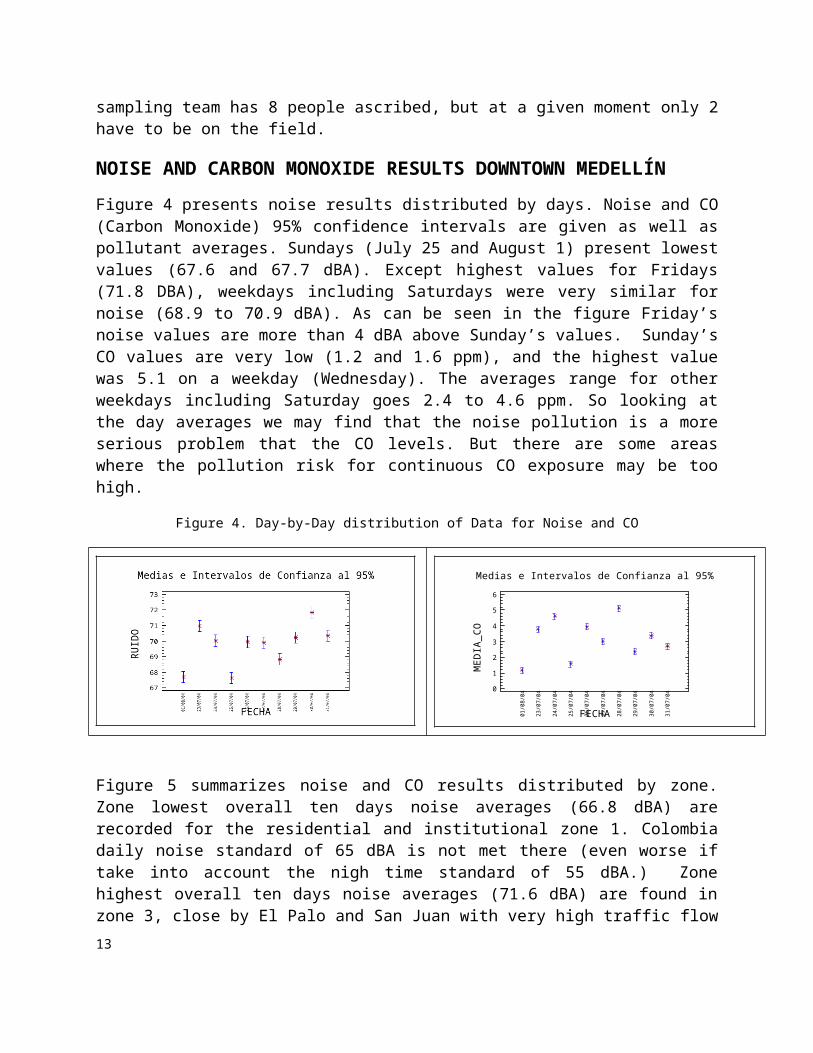
Figure 9. Spatial Noise Distribution During the Morning Hours (5 to 9 AM)
13
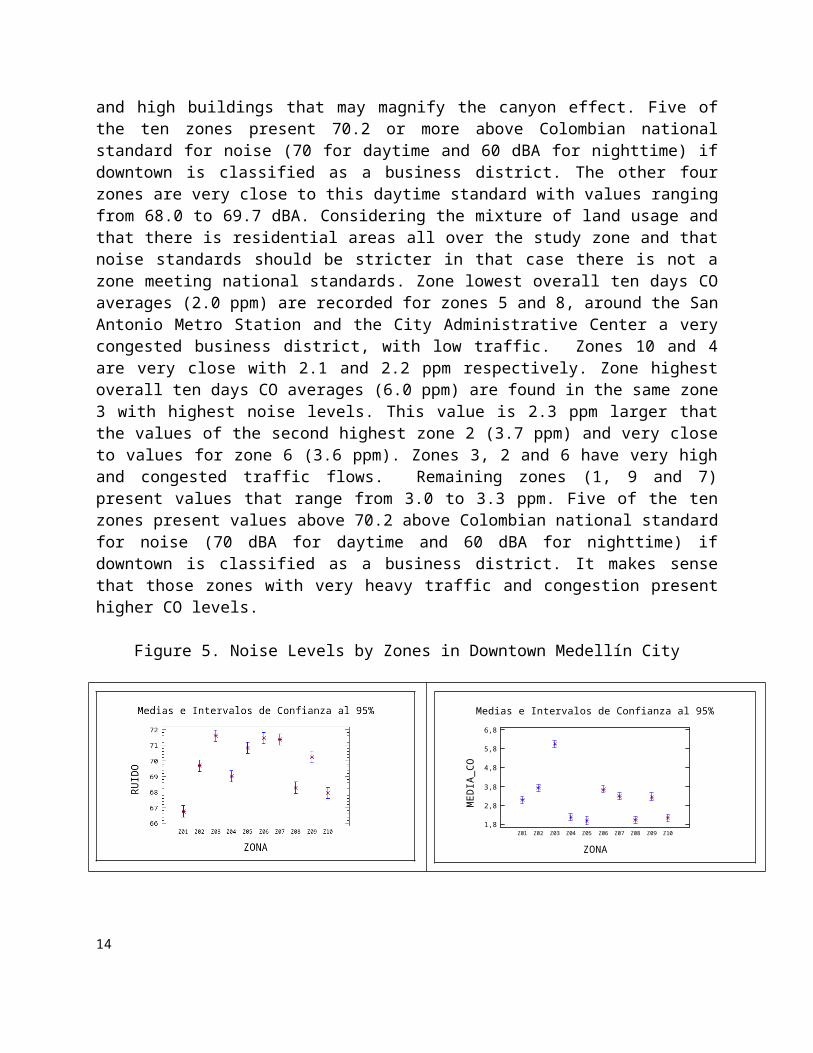
Figure 10. Spatial Noise Distribution During Nighttime (11 PM to 3 AM)
14
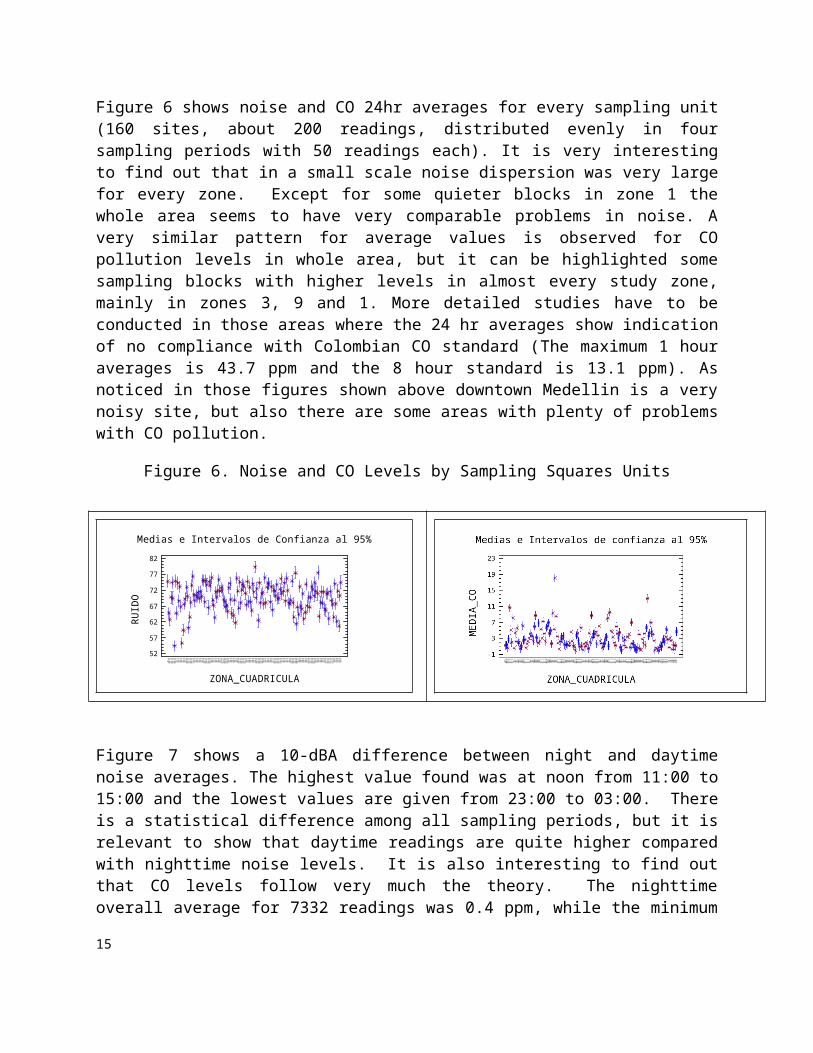
Figure 11. Spatial CO Distribution During the Morning Hours (5 to 9 AM)
15
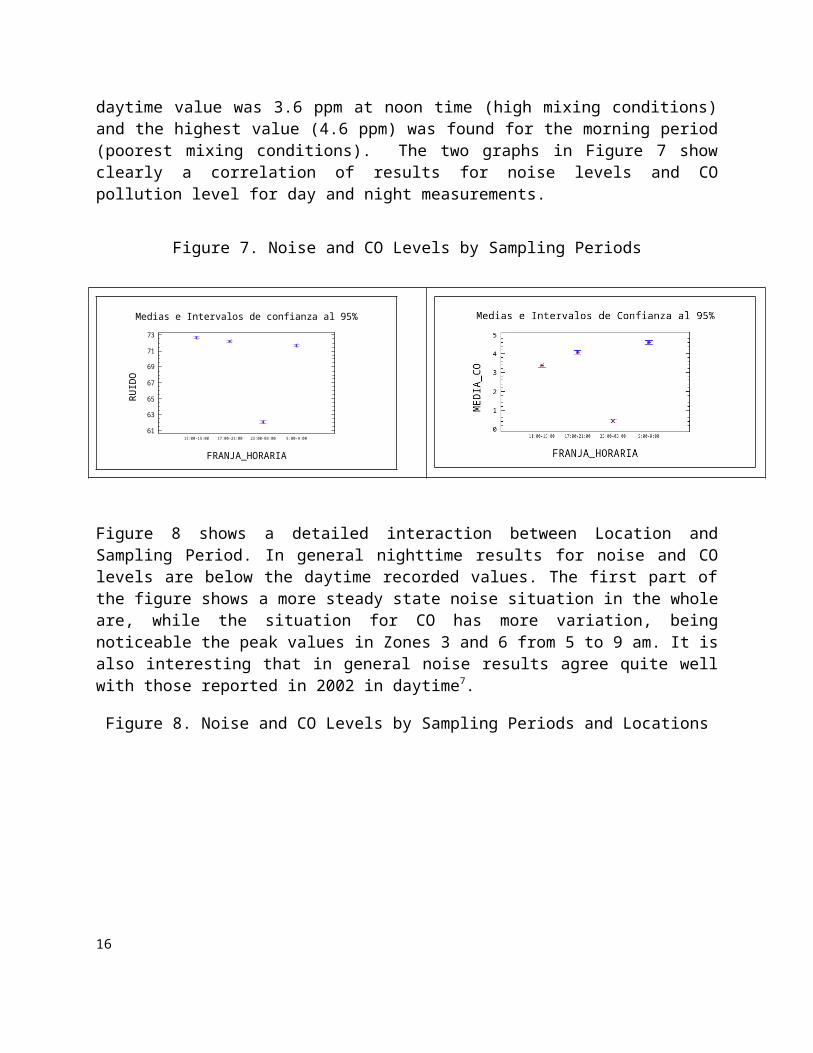
Table 2. Zone Noise Levels and Effect of “Plan Cuadrantes”
Zones 2004 2002 DifferenceZone 1. Carlos E. Restrepo and Universidad Nacional
66,8 64,7 +2,1
Zone 2. Sector of la Iglesia Veracruz 69,7 73,7 -4,0Zone 3. Sector of Niquitao 71,6 74,1 -2,5Zone 4. Sector of Prado Centro 69,7 70,5 -0,8Zone 5. Metro Station San Antonio 70,8 72,5 -1,7Zone 6. Sector of the Plaza Minorista 71,5 73,5 -2,0Zone 7. Sector La Playa and Avenida Oriental 71,4 72,8 -1,4Zone 8. La Alpujarra and Barrio Triste 68,3 70,9 -2,6Zone 9. Parque Bolivar and Villanueva 70,2 70,8 -0,6Zone 10. Sector of San Benito and El Hueco 68,0 72,4 -4,4Overall Areas Averages 69.7 71.6 -1.9
CONCLUSIONS AND RECOMENDATIONS
1. Downtown Medellín has a strong mixture of business, health care, education, industrial and residential activities that make difficult and confusing the application of noise national regulations. Results of present study show that the city is not complying with national standards for business districts, the main land usage for the study area. Special care has to be taken in Zones 3 and 6 for the high daytime noise levels and Zone 7.
2. Carbon monoxide results identify the critical zones 3 and 6. Zone 3 is very critical since it was found very close to Colombian standards. A close relationship between high noise and CO levels and heavy traffic has been found.
3. Geo-statistics can be used as an analytical tool to extrapolate results to areas that cannot be surveyed due to limitation on sampling resources.
4. Downtown Medellín is in no compliance with national noise standards, but with very few exceptions is meeting national standard for CO. The only site that does not meet consistently noise and CO standard is Niquitao (Zone3) where the city has big plans for residential developments.
5. A comparison for 2002 and 2004 studies show that the “Plan Cuadrantes” increased noise levels outside downtown following the pattern of buses routes displacement.
6. Environmental and city authorities must include a long-term noise reduction program in their agenda to obtain acceptable noise levels in downtown. Regulations should be enacted regarding motorcycles and cars noise controls, buildings and windows code establishment and personal protection.
7. The city has to study and understand in a better way the noise and carbon monoxide problem 16
in downtown. More detailed studies need to be conducted to assess impact of traffic changes in environmental quality. Troublesome sites need to be included in Redaire network to assess environmental impact of CO pollution.
8. To generate a culture on environmental noise and carbon monoxide problems, what are their health effects and the mechanisms to control them?
9. To regulate and control noise and CO causing activities in the downtown area.
10. To evaluate the mass transportation system to make it more efficient and less harmful to the environment. To promote the use of cleaner engines and fuels.
ACKNOWLEDGMENTS
The Medellín local government: Environment Secretary provided funding, Security from the Government Secretary, Planning Office provided digital maps, and the transportation Secretary facilitated information on traffic flow.
During the sampling we count with the support of students and staff from different universities (National, Antioquia, Politécnico, Bolivariana and Medellín). SURATEP supported us with measurement equipment for backup. The Occupational Safety Laboratory under leadership Rigoberto Quinchía gave us invaluable support.
Redaire and their technical group as well as the local environmental authority Area Metropolitana were always very supportive for the development of this project.
REFERENCES
1. ACEVEDO, J.F.; YEPES, C. y POSADA, E. El Ruido y su Relación con el tráfico en el Centro de Medellín en Contaminación Ambiental, No. 4, CIDI, UPB, Medellín, 1978. pp. 26-34.
2. ACEVEDO, J. El Ruido y su Relación con el Tráfico en el Centro de Medellín. Universidad Pontificia Bolivariana. CIDI, 1978.
3. ARDILA, M., ZAPATA, A. Diagnóstico de la Contaminación por Ruido en la Ciudad de Medellín. Universidad Pontificia Bolivariana. Facultad de Ingeniería Mecánica, 1994. Tesis de Pregrado
4. ARISTIZÁBAL, M. CEBALLOS, E., JARAMILLO, R. Mediciones de Ruido en el Tráfico Automotor. Universidad Pontificia Bolivariana. Facultad de Ingeniería Mecánica, 1980.
5. BEDOYA, Julian y ORREGO, Ramiro. Contaminación del Aire por Tráfico Automotor en el Centro de Medellín. DYNA, No . 103, Medellín septiembre, 1984.
6. CORREA, A BEDOYA, J., GALLEGO, L.M. and TORO, E.. Ruido Ambiental en el Centro de Medellín 2002. Informe de Proyecto de Investigación. Universidad Nacional de
17
Colombia. DIME. March, 2003.
7. BEDOYA, J., CORREA, A., MANOTAS, E., and GALLEGO, L. Community Noise in Medellín Colombia: Airport Surroundings and Downtown Paper # 69259 in Proceedings 96 Annual Conference and Exhibition of the Air and Waste Management Association. San Diego, California. 22-27 June, 2003. ISBN 0-923204-54-7
8. LABORATORIO DE INVESTIGACIÓN DE CARRETERAS. Parte de Servicios Públicos y Desarrollo Nacional vol. 27 no 1-9, España 1980.
9. MONTGOMERY, Douglas C. Diseño y Análisis de Experimentos. Grupo Editorial Ibero América, 1991.
KEY WORDS
Urban Noise Levels in Medellin, Carbon Monoxide Downtown Medellín, Geo-statistics, Isophones, Noise Sampling Methodology
18