Embed Size (px)
Citation preview

HAL Id: hal-02432461https://hal-univ-rennes1.archives-ouvertes.fr/hal-02432461
Submitted on 7 Jul 2020
HAL is a multi-disciplinary open accessarchive for the deposit and dissemination of sci-entific research documents, whether they are pub-lished or not. The documents may come fromteaching and research institutions in France orabroad, or from public or private research centers.
L’archive ouverte pluridisciplinaire HAL, estdestinée au dépôt et à la diffusion de documentsscientifiques de niveau recherche, publiés ou non,émanant des établissements d’enseignement et derecherche français ou étrangers, des laboratoirespublics ou privés.
Distributed under a Creative Commons Attribution| 4.0 International License
Analysis of Hybrid Broadcast/Broadband NetworksWith Multiple Broadcasting Stations
Ahmad Shokair, Matthieu Crussière, Jean-Francois Helard, Youssef Nasser,Oussama Bazzi
To cite this version:Ahmad Shokair, Matthieu Crussière, Jean-Francois Helard, Youssef Nasser, Oussama Bazzi. Analysisof Hybrid Broadcast/Broadband Networks With Multiple Broadcasting Stations. IEEE Access, IEEE,2019, 7, pp.141226-141240. �10.1109/ACCESS.2019.2942139�. �hal-02432461�
Received April 28, 2019, accepted September 5, 2019, date of publication September 18, 2019, date of current version October 9, 2019.
Digital Object Identifier 10.1109/ACCESS.2019.2942139
Analysis of Hybrid Broadcast/BroadbandNetworks With Multiple Broadcasting StationsAHMAD SHOKAIR 1,3, MATTHIEU CRUSSIÈRE 1, JEAN-FRANCOIS HÉLARD 1,YOUSSEF NASSER2, AND OUSSAMA BAZZI31INSA -Rennes, IETR, 35700 Rennes, France2ECE Department, American University of Beirut, Beirut 1107, Lebanon3Department of Physics and Electronics, Faculty of Science 1, Lebanese University, Hadath 1106, Lebanon
Corresponding author: Ahmad Shokair ([email protected])
This work was supported by the French state granted to the Convergence TV project through the 20th FUI (transverse inter-ministryfunding) program.
ABSTRACT Hybrid broadcast/broadband network (HBBN) presents a potential solution to mitigate theincreasing demand formobile TV. A proper HBBNdeployment alleviates the limitations that each standalonenetwork faces, thereby enhancing the global network coverage and efficiency. In this paper, we propose toaddress the question of performance improvement expected from such HBBN by means of an analyticalframework based on stochastic geometry modeling. To this end, we introduce a generic model of the HBBNwhere multiple broadcast transmitters and a broadband network are deployed in the same area, jointlyoffering linear services, one of the mobile TV services. Two different approaches derived from stochasticgeometry are applied and compared through the analysis of what is commonly referred to as a Point HoleProcess (PHP): Original Poisson Point Process (PPP), and reduced PPP. Both approaches are thoroughlyanalyzed to give better insights into broadcast/broadband coexistence while taking into account the inter-cellinterference of both networks. Exact and simplified expressions for the key performance metrics are derivedsuch as the probability of coverage and ergodic capacity. Those expressions are then used to numericallymaximize the spectral and power efficiency of the HBBN regarding the broadcast coverage radius andtransmitters’ density. The results show that for a wide range of user density, the HBBN introduces gaincompared to either BB or BC networks. To the best of the authors’ knowledge, this paper presents the firstwork dealing with the optimization of HBBN based on such a generic model and taking inter-cell and inter-network interference into consideration.
INDEX TERMS Access network cooperation, DVB-T2, hybrid networks, LTE, mobile TV, networkplanning, stochastic geometry.
I. INTRODUCTIONThe demand for mobile TV has been expanding during thepast few years, following the increasing availability of smart-phones and tablets [1]. From the other side, this growth in theusage of such devices and services is leading to an excessiveload on the broadband (BB) spectral resource thus creatingthe so-called spectrum crisis. One sector of mobile TV is lin-ear services, where the transmitter fully controls the stream.Even though the non linear services (YouTube, Netflix. . . )are growing fast, linear services remain a crucial part ofthe experience, especially for live data, like breaking news,
The associate editor coordinating the review of this manuscript and
approving it for publication was Jesús Hamilton Ortiz .
sports events, musical concerts. . .While the broadcast (BC)networks present a good solution to deliver these services,their high power consumption reduces there efficiency espe-cially if the number of users drops. A hybrid approach hasrecently emerged as a possible solution to meet the demandfor such resource-hungry TV services. The aim of this paperis to investigate in which extend such hybrid approach canbring any improvement in the service delivery efficiencyby setting up a generic broadcast/broadband network modelbased on stochastic geometry and upon which key perfor-mance metrics are derived and analyzed. In that respect,we first present the state-of-the-art solutions for the deliv-ery of linear services followed by the available cooperationhybrid approaches.
141226 This work is licensed under a Creative Commons Attribution 4.0 License. For more information, see http://creativecommons.org/licenses/by/4.0/ VOLUME 7, 2019

A. Shokair et al.: Analysis of HBBNs With Multiple Broadcasting Stations
A. LINEAR MOBILE TV SERVICEThe mobile TV market recorded a 7.69 billion US dollarsrevenue in 2015 and is expected to reach 17.02 billion USdollars by 2024 [1], [2]. Practically, so-called linear serviceis a one type ofmobile TVwhichmay be delivered to amobileterminal by both BC and BB networks.
One of the most known BC solutions today is providedby the Digital Video Broadcast (DVB) project that includesmany standards, namely with the 2nd generation of terrestrialdigital BC standard (DVB-T2), designed to serve both fixedand mobile users [3]. More recently, the Advanced Televi-sion System Committee released the specifications of its 3rdgeneration standard (ATSC-3.0), also targeting fixed as wellas mobile devices [4]. With their high-power transmissiontowers andmutual spectrum usage among users, BC networksare very efficient in serving a large number of endpoints.Nonetheless, such benefits are partly scaled down in mobilityscenarios in an environment where the number of users isvariable. A reduction in the number of interested users willmake the BC loose its primary advantage, and the cost ofhigh power consumed is not rewarded with high throughputanymore. [5].
BB networks can also deliver mobile TV, but using adifferent strategy compared to BC networks. BB networkscovers large service areas divided into relatively small cellswith relatively low transmission power. In each cell, servicedelivery is conventionally carried out using the Unicast (UC)mode inwhich the spectrum resource is shared and distributedto users [6]. With unicast, BB networks are very efficient toindividualize the service delivery but may suffer from over-load issues when a large number of users are demanding forhigh bandwidth services [7]. Alternatively multicast capabil-ities may also be exploited to benefit from a mutual resourceexploitation through the Evolved Multimedia BroadcastMulticast Services (eMBMS) that was embedded in the LongTerm Evolution (LTE) standard [8], [9]. However, this lattermode can only be deployed within a limited number ofnetworks around the world. In such mode, the network willreserve certain number of resource blocks for the sharedtransmission, reducing the available spectrum for other users.
B. HYBRID NETWORKS AND RELATED WORKSThe limitations discussed above of both conventional BC andBB networks drew attention towards a hybrid solution wherea BB network and a BC network collaborate to deliver linearservices. This kind of hybrid network could be seen as anoffload of the data traffic from the limited BB network tothe BC network where the spectral resources are mutualized.It can also be considered as an extension of the coverage rangeof mobile TV BC with the aid of the widely deployed BBnetwork.
The Hybrid Broadcast Broadband Network (HBBN)approach has recently driven numerous studies in the liter-ature. The importance of the idea and the possible challengesand opportunities were discussed in [5], [10], [11]. An HBBN
can take different forms, like stream sharing networks whereBB and BC share the communication chain while each per-forms certain jobs, and user sharing networks where BB andBC serve different subsets of users.
Stream sharing hybrid networks were studied in the litera-ture from different perspectives, like load switching in [12],push-based content delivery in [13], and 3D media deliveryand its business model in [14]. Moreover, a unified physi-cal layer was discussed in [15] and a Cloud Radio AccessNetwork (C-RAN) based cooperative architecture was intro-duced in [16]. However, this type of hybrid networks requiresdeep modifications in at least one of the layers of the servingnetworks.
Hence, our interest in this paper is more focused on usersharing networks. A first stand-alone DVB-NGH and LTEmodel was presented in [17]. The authors in [18] deriveda theoretical analysis of the coverage of hybrid BC/UCnetworks and concluded that an optimal point of operationleading to maximum HBBN capacity could be found. Com-plementary to that, a closed-form expression for the ergodiccapacity of such HBBN was derived in [19] in the case ofnon-cooperative interfering coexistence between the BC andUC components. Following this non-cooperative strategy,we recently introduced a hybrid model with a single BCtransmitter covering the central part of a service area, and theUC base stations (BSs) covering the rest of that area [20].Therein, the average probability of coverage, the ergodiccapacity achieved by such network was analytically derived.The obtained results are however limited to the case of asingle BC station. This paper aims at providing much moregeneric results on HBBN performance by introducing anddealing with a generic HBBN model made of multiple BCand multiple BB stations.
C. IMPORTANCE OF STOCHASTIC GEOMETRY MODELINGFrom all these works, it turns out that the evaluation of thepotential gains expected from such HBBN requires a thor-ough analysis based on realistic network models.
Stochastic geometry has provided a realistic description ofthe cellular network compared to a grid model [21], [22].In such an approach, a Poisson Point Process (PPP) is usedto model the positions of the BSs in the network. Stochasticgeometry provides suitable mathematical tools to analyzethe network’s performance. The network is described bya single parameter that represents the density of the BSs.Several studies have since then been conducted using suchapproach [23]. The accuracy of the model was compared withthe real network UK case study in [24]. It was shown thatthe PPP model, and even if it gives slightly lower coveragevalues than the real implementation, is still more accurateand tractable than conventional grid model [25]. Stochasticgeometry has also been used in the context of broadcastinglike in [26]. Despite the importance of this analysis, the hybridexistence still needs a thorough investigation mainly in amulti-cell environment. By averaging over the whole area,
VOLUME 7, 2019 141227

A. Shokair et al.: Analysis of HBBNs With Multiple Broadcasting Stations
stochastic geometry can obviously describe the mobile natureof users.
D. CONTRIBUTIONS AND ORGANIZATIONIn this paper, a user sharing HBBN with multiple BroadcastTransmitters (BCTs) is proposed and analyzed using stochas-tic geometry. It is assumed that the BB component of theHBBN implements UC delivery mode. Multicast is disre-garded in this work since it inherits lots of the drawbacksof BC, and since standards like eMBMS are not widelydeployed. Moreover, it was shown in a previous work thathigh coverage could be achieved with UC if a proper resourceallocation is used [6].
Unlike previous works that discuss heterogeneous andmulti-tier networks (such as in cellular), this paper focuseson the nature of the broadcast service. Indeed, contrary toother services, BC is characterized by the pre-fixed rateswhile the design is based on the worst case user service.The importance of our work resides in the consideration ofthe Inter-Cell Interference (ICI) in the network optimizationas it represents a major factor affecting the quality of ser-vice of such hybrid network but was neglected in previousworks such as [7], [18], [27]. Moreover, this work gives greatinsights and conclusions of this hybrid existence model as:(i) it considers the coexistence between the two services overthe same frequency band causing mutual interference, (ii) itsimplifies the user association to either network (BC or BB)to have much simpler expressions, and (iii) takes the nature ofthe service into account when calculating the system rate andefficiency. To the best of the authors’ knowledge, this is thefirst contribution of its kind in which a realistic model withinterference consideration both between cells and betweennetworks is adopted using stochastic geometry. The maincontributions of this paper could be summarized as follows:• Proposition of a user sharing HBBN model where theBC and the BB networks share the same band.
• Inclusion and analysis of ICI as a major factor in thedesign of the HBBN. Here, ICI of both networks isconsidered. The interference due to coexistence betweenthe two networks is also studied.
• Derivations of the novel analytical expressions of theaverage probability of coverage for UC, BC, and anyuser in the service area, as well as the average normal-ized capacity for those cases, using stochastic geometrytools for modeling and analysis, with two approaches forsimplification: normal and reduced PPP.
• Optimization of theHBBNbymaximizing selected eval-uation metrics like the probability of coverage, spectralefficiency, and power efficiency, in terms of the maindesign parameters such as the density of BCT and thesize of the BC zone represented by the BC radius.
The rest of this paper is organized as follows. Section IIdescribes the network architecture and provides the derivationof some important probability distribution functions (PDF).Sections III and IV include the derivation of the average cov-erage probability and its respective upper and lower bounds.
Average user capacity, system capacity, and power efficiencyare analyzed in V. In section VI, numerical simulations areconducted. Then, a set of parameters is optimized aiming atmaximizing the coverage and rate. Finally, section VII drawsthe conclusions of the paper.
II. MODEL DESCRIPTIONIn this section, the proposed model of the hybrid network isfirst presented and then followed by themain derivations usedin the next sections. For simplicity, the used annotations aresummarized in Table 1.
TABLE 1. Used symbols.
A. SYSTEM DESCRIPTIONThis work considers the delivery of TV linear services to anaverage of M users, distributed uniformly over the servicearea according to a PPP 9 with density λU . The users areserved by one of the two networks:• Broadband UC network: it consists of number of BSsuniformly distributed over the service area according toa PPP 8 with density λBS . The BSs are transmittingOrthogonal Frequency-Division Multiplexing (OFDM)data with isotropic power PL .
• Broadcast network: it consists of an average of K BCTs,uniformly distributed over the service area with anotherPPP 4 with a density λBC , which is much smallerthan λBS . The BCTs are broadcasting OFDM data withisotropic powerPD, wherePD > PL . Normally, BCT arenot modeled by random processes, since their positionsare often well planed, but future networks -as the modelpresented herein- can be more dense, and therefore aPPP may accurately describe the network deployment,while bringing in the advantage of making the analysistractable.
141228 VOLUME 7, 2019

A. Shokair et al.: Analysis of HBBNs With Multiple Broadcasting Stations
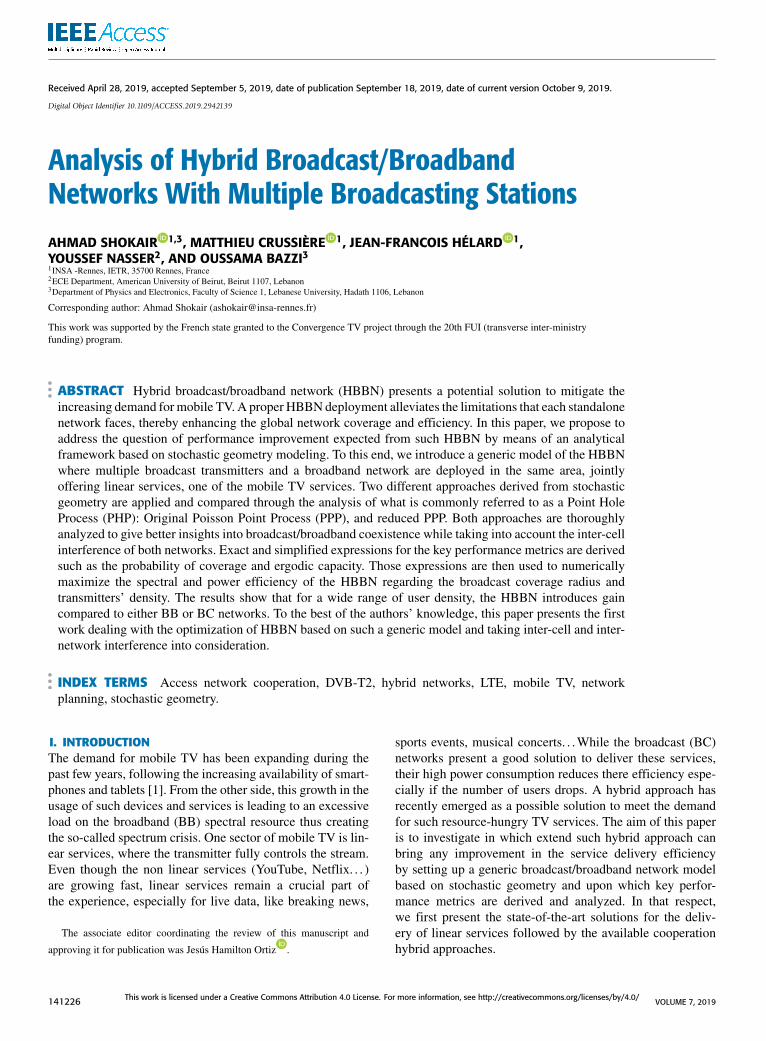
An example of the service area is shown in Fig. 1. Thecoverage area for the BCT is larger than that of the BSsdue to a larger transmitted power. To simplify the analysisprocedure, it is assumed that a BCT has a circular coveragearea centered at the BCT and with radius rb. Any user withinany of the BC areas is served by the nearest BCT. The usersthat are not covered by any of the BC areas are served by thenearest BS.
FIGURE 1. An example of a service area, with λBC = λBS/200 and withrb = 10 km. The discs are the BC zones (with BCTs in the middle), and theboxes with Voronoi tessellation are UC cells, with BS in the middle ofeach (distances are in km).
In this work, it is assumed that the BCTs operate at fre-quency fD. The UC BSs outside the BC covered areas alsooperate at the same frequency fD, while the UC BSs locatedwithin any of the BC areas operate at frequency fL . Those BSsare not transmitting linear services and will have no role inour model, and they will not cause any interference to otherparts of the system. Even though such coexistence betweentwo networks is not currently implemented, such deploymentmay be a solution for a better usage of the spectrum. TheTV white space or the unlicensed bands can be the domainwhere such coexistence can take place. On the other side,since all the BSs (outside of the BCTs’ areas) and all theBCTs operate at the same frequency, a mutual interferencewill be created between the two networks that have to bequantified and evaluated. In fact, one of the key technologicalbottlenecks in this work is to optimize the service area of theBCTs, among others. Within this context, 4 types of signalshave to be considered:
• Interference to BC users:
– from UC BSs (UC/BC called hereafter IU/B): BCusers within the coverage area of the BCT stillreceive a certain amount of power from all theoutside BS operating at the same frequency. Thisinterference will be especially significant for theBC edge users.
– Power from other BCTs (BC/BC named F): Inthis paper, we use the Single Frequency Network(SFN) configuration to minimize the utilization of
the spectrum despite the need to synchronize all theBCTs (out of the scope of this paper). The receivedpower is partially useful and will be added to thereceived signal. This will be detailed later.
• Interference to UC users:– Interference from other UC BSs (UC/UC namedIU/U ), or ICI: this type of interference is the mostsevere since the interfering BSs are relatively closeto the users.
– Interference from BCTs (BC/UC IB/U ): the BCpower leaked to the surrounding UC users, espe-cially those who are close to the BC zones, is seenas interference signal since BCTs and BSs are notsynchronized.
B. SINR DEFINITIONThe Signal to Interference and Noise Ratio (SINR) is calcu-lated for each system. For a typical BC user, we define theSINR as follows:
Sbc =PDgr
−βv + γF
Pn + IU/B(1)
where PD represents the transmitted power by the BCT,g is a random variable that represents the random behav-ior of the BC channel and has an exponential distribution,i.e. g ∼ exp(τ ) with τ being the rate of the distribution,rv represents the distance between the user and the servingBCT, β is the path loss exponent for BC transmission, γ is aweighting factor for the usefulness of the received BC powerand it will be discussed later, and Pn is the noise power. IU/Bis defined as follows:
IU/B =∑n∈N
PLhnr−αsn (2)
whereN is the set of all UC BSs, rsn is the distance betweenthe user and the nth interfering UC BS, h is a random variablethat represents the random behavior of the UC channel andhas an exponential distribution, i.e. h ∼ exp(µ), and here hnrefers to the channel between the user and the nth interferingBS. α is the path loss exponent for UC transmission.
On the other hand, F is the summation of all receivedsignals from other BCTs. According to [28], due to multiplereceived signals with different arrival times from SFN trans-mitters, the received signal from a transmitter falls under oneof the following cases:• The received signal delay vs the transmission time is lessthan the guard interval. In this case, all received poweris useful.
• The delay is larger than the guard interval butsmaller than the total symbol time (symbol time+guardinterval): portion of the power is useful and the other isinterference.
• The delay is larger than the total symbol duration, andthus all the received power is seen as interference.
The third case happens when the distance between the SFNtransmitter and receiver is very large. Hence, the received
VOLUME 7, 2019 141229

A. Shokair et al.: Analysis of HBBNs With Multiple Broadcasting Stations
power is very small, so it will not be included in our SINRexpression. Even though it is well known that the non-usefulpower is counted as interference, but due to the small effect ofsuch interference compared to other interference sources, it isneglected in the SINR definition we have introduced in (1)for simplification. The first two cases are approximated andmodeled by aweighting factor 0 ≤ γ ≤ 1 of the total receivedpower F as an approximation to simplify the analysis. Thelatter is defined as:
F =∑k∈K\i
PDhkrt−βk (3)
where K\i is the set of all BCT, excluding the serving BCT.rt k hk is the distance and channel from the BC user to thek th BCT respectively.
For a typical UC user, the SINR is given by:
Suc =PLhr
−αl
Pn + IU/U + IB/U(4)
where rl is the distance between the user and the serving BS,and IU/U is the total interference received by a UC user fromthe interfering BS, given by:
IU/U =∑n∈N \j
PLhnrq−αn (5)
whereN \j is the set of all UC BSs excluding the serving BS,rqn is the distance between the user and the nth interferingUC BS. In addition, IB/U is defined by:
IB/U =∑k∈K
PDhkrd−βk (6)
where rdk is the distance from the k th BCT. One can noticethat the SINR models for both BC and UC look similar, butdifferences exist in themagnitude of the interference, pathlossexponent and transmitted power.
C. PROBABILITY DISTRIBUTION OF THE LINK DISTANCETwo essential Probability Density Functions (PDFs) must becalculated: (i) the PDF of rv, the distance between a BC userand the serving BCT, and (ii) the PDF of rl , the distancebetween a UC user and its serving BS.
The distribution of rv needs more effort to be obtained soit will be discussed first. The related PDF is stated in thefollowing Lemma.Lemma 1: Considering a HBBN with multiple BCTs each
having a circular coverage area with radius rb, the PDF ofthe distance rv between a typical BC user and its servingBCT is:
frv (rv) =2πλBCrv exp(−λBCπr2v )
1− exp(−λBCπr2b )(7)
Proof:
P[(rv > Rv) | BC user] =P[(rv > Rv) ∩ BC user]
PBC(8)
The probability of a user to be within a BCT area, i.e. BCuser, is to have a BCT with a distance smaller than rb away.It is given by the complementary of the void probability ofthe BC PPP:
PBC = 1− exp(−λBCπr2b ) (9)
Now, the probability of a user to be a BC user and withdistance rv > Rv is the probability that there is no BCT closerto that user than Rv, and that there is at least one BCT inthe strip between the circle of radius Rv and the circle withradius rb. This probability is given by:
P[(rv > Rv) ∩ BC]
= exp(−λBCπR2v)(1− exp(−λBCπ (r2b − R2v)))
= exp(−λBCπR2v) exp(−λBCπr2b ) (10)
substituting (9) and (10) in (8) gives the CCDF of rv, anddifferentiating it will give the PDF stated in (7).
On the other hand, the PDF of rl has been discussedin several previous works addressing stochastic geometrybased network models. Starting from the fact that the null-probability of a PPP in R2 in an area A is exp(−λA), the PDFof rl is given by [21]:
frl (rl) = 2πrlλBS exp(−λBSπr2l ) (11)
III. PROBABILITY OF COVERAGEThe probability of coverage is defined as the probabilityof a user having SINR that exceeds a certain threshold T .However, since the structure of the network is complicated,some approximations can be used to reduce the complexityof the derived formula. In fact, both UC BSs and BCTs aredistributed according to a PPP, and the (UC/UC) interferenceis generated by the whole UC PPP except the gaps generatedby BC areas in the interference points. For that reason, the UCnetwork can be seen as a Poisson Hole Process (PHP) [29].Analyzing PHP can be done with different approaches. Oneapproach is to consider the PHP as a new PPP with reduceddensity [21]. Another approach is to ignore the holes com-pletely, leading to a lower bound for the probability of cover-age by overestimating the interference [30]. In this section,the derivation for the general probability of coverage forBC and UC users is detailed. The general expressions ofthe Laplace Transform (LT) of the interference are alsocalculated.
A. GENERAL EXPRESSIONS FOR THE PROBABILITYOF COVERAGELet us first derive the probability of coverage Pc/BC for BCusers. It is defined as the average probability that the SINRfor a BC user Sbc is greater than a certain threshold Tbc. It canbe expressed in the following lemma.
141230 VOLUME 7, 2019

A. Shokair et al.: Analysis of HBBNs With Multiple Broadcasting Stations
Lemma 2: The average probability of coverage Pc/BC forBC users is given by:
Pc/BC =2πλBC
1− exp(−λBCπr2b )
rb∫0
rv exp(−πλBCr2v )
exp(−τTbcr
βv Pn
PD
)LIU/B
(τTbcrβvPD
)LF(−τγ rβVPD
)drv
(12)
where Tbc is the SINR threshold for acceptable coverage inBC, and L·
(·)denotes the LT operator.
Proof: See Appendix AThe derived expression in Lemma 2 averages the probabil-
ity of coverage over two random components of the SINR: therandom channel, and the random relative position of the user,i.e. the random distances to BSs and BCTs. Therein we arefollowing the conventional approach found in literature [25].The first LT corresponds to the interference power from UCBSs on the BC users, and the second LT corresponds to thereceived power from other BCTs. Expressions for both LTsare derived in the coming sections.
For UC users, the probability of coverage Pc/UC has asimilar definition as that of BC users, but using a dedicatedthreshold Tuc. This leads to the following Lemma 3.Lemma 3: The average probability of coverage Pc/UC of a
UC user is as follows:
Pc/UC = 2πλBS
∞∫0
rl exp(−πλBSr2l ) exp(−µTucrαl Pn
PL
)×LIU/U
(−µTucrαl
PL
)LIB/U
(−µTucrαl
PL
)drl (13)
where Tuc is the SINR threshold for sufficient signal receptionquality in UC.
Proof: Same steps as for BC users.Also for UC users, the probability of coverage is averaged
over the random channel effect and the relative position ofthe users. The first LT corresponds to the interference powertransmitted by the interfering UC BSs, while the second LTcorresponds to the interference conducted by all the BCTs.Even though the two expressions for the probability of cov-erage for BC and UC users are not in closed forms, theintegration is fairly straightforward since most of the LTexpressions are in well tabulated special functions.
Finally, for a general user randomly positioned in the ser-vice area, the probability of coverage Pc can be seen as thelinear combination between probabilities Pc/BC and Pc/UCpreviously calculated. This result is stated in Corollary 1.Corollary 1: The probability of coverage for a general
user randomly located in the service area is as follows:
Pc = (1−exp(−λBCπr2b ))Pc/BC+exp(−λBCπr2b )Pc/UC (14)
Proof: The total probability of coverage for a given useris given by:
Pc = PBCPc/BC + PUCPc/UC (15)
where PBC is the probability that a user is within a broadcastdomain, and PUC is the probability that a user is not inany BC domain. PBC is as shown in (9), and PUC is itscomplementary. Substituting both in (15) gives (14).
B. GENERAL EXPRESSIONS OF THE LT OF THEINTERFERENCEAs it can be seen from (12) and (13), the main terms to be con-sidered are the four LTs of the interference. The complexity ofthose terms determines the complexity of the overall coverageprobability. A general term can be found for several cases ofthe LT and stated in Theorem 1.Theorem 1: The general expression for an interference
sourced from a homogeneous PPP � of density λ, startingfrom a distance d from the user, where the interference isgiven by:
I =∑
Plr−δ (16)
and where P is the transmission power, l is the channel withexponential distribution of rate ρ, r represents the distance,and δ denotes the path loss exponent, is given by:
LI (s)=exp(−2πλd2−δsPρ(δ−2) 2F1
(1, 1−
2δ; 2−
2δ;−sPρdδ
))(17)
where 2F1(.) is the Gaussian hyper-geometric function.Proof:
LI (s) = E�,l[exp(−sI )]= E�,l
[exp
(− s
∑n∈N
Plnr−δn)]
= E�,l[ ∏n∈N
exp(−sPlnr−δn )]
(a)= E�
[ ∏n∈N
El[exp(−sPlnr−δn )]]
= E�[ ∏n∈N
1
1+ sPρrδ
](b)= exp
(− λ
∫R2
1
1+ ρrδsP
)
(c)= exp
(−2πλδ
∞∫dδ
x2δ−1
1+ ρsPx
dx)
(18)
where (a) follows the independence of the point distributionand the channel effect, and (b) follows Campbell’s theorem ofthe product over a PPP [21]. The integral in (b) is applied onthe whole 2-D plane starting at a distance d from the servingpoint. This results in (c) where the coordinates are switched topolar system, and by substituting x = rδ . Now using equation3.194 from [31] that states that:∞∫w
xu−1
(1+βx)vdx=
wu−v
βv(v−u) 2F1(v, v−u; v−u+1;−
1βw
)(19)
to solve the integral, LI (s) is reduced into (17)
VOLUME 7, 2019 141231

A. Shokair et al.: Analysis of HBBNs With Multiple Broadcasting Stations
The result expression introduced in Theorem 1 is fairlysimple, and includes a single tabulated special function thatcan be quickly evaluated numerically. The problem turns outthen to derive the expressions of the LTs of the interferenceand added power of the HBBN as detailed below.
C. EVALUATION OF THE LTS OF THE BC SIGNALSThe target here is to give the LTs of the BC signals, i.e. F andIB/U as they are easily deduced from Theorem 1. The LT of Fon a BC user is independent from the BB network, and thus isindependent from the BS density. It is given by the followingcorollary.Corollary 2: The LT of the additional received BC power
by BC users can be expressed as:
LF(−τγ rβvPD
)= exp
(2πλBCγ r2vβ − 2 2F1
(1, 1−
2β; 2−
2β; γ))
(20)
Proof: Since the received power is due to the BCTdistribution, and knowing that the nearest source is rv away,the general formula introduced in Theorem 1 can be used.Starting from the definition of the added power in (1), and
substituting s = −τγ rβv
PD, the expression in (20) is obtained.
The problem turns out to find the LT of BCT interferenceon UC users, i.e. IB/U . It is given by the following corollary.Corollary 3: The LT of the interference originated by the
BCT on a UC user is expressed as:
LIB/U(µTucrαl
PL
)= exp
(−
2πλBCµPDTucr2−βb rαl
τPL(β − 2) 2F1(1, 1−
2β; 2−
2β;−
PDµrαl Tuc
PLτ rβb
))(21)
Proof: The interference is originated by a PPPmodelingof the BCTs, and since the user is served by UC, then thenearest interference source is at least beyond the distance rb,then the expression derived in (17) also applies here. By usingthe interference definition in (6), and with substitutings =
µTucrαlPL
, the expression in (21) is obtained.
IV. SIMPLIFIED EXPRESSIONS OF THE PROBABILITYOF COVERAGEThe expressions of the LTs given in (20) and (21) are easilyhandled. However, this is not the case for BS interferencesignals IU/B and IU/U in (12) and (13), which makes theprobability of coverage expression harder to evaluate. To sim-plify the problem,we adopt two different approaches for theseinterference terms, detailed next.
A. APPROACH 1: EVALUATION OF THE LTS OF THE BSINTERFERENCE USING A REDUCED PPPAs mentioned earlier, the PPP of the UC network with den-sity λBS can be seen as a PHP due to the void areas createdby the BC zones. In this approach, the PHP is approximated
by a new PPP with a reduced density λ′BS (approximation 1).It gives an underestimate for the interference, since in thenew reduced-density area all the interfering BSs are fartheron average. Hence, the probability of coverage will be over-estimated (upper-bound). The new density λ′BS is given by:
λ′BS = λBSe−λHπr2b (22)
A complete derivation of this can be found in III-B in [29].Let us first start with the case of the UC BS interference on
BC users, i.e. IU/B. Since the distance from the nearest inter-fering BS is not fixed, and since the density of the interferencesources is not constant in the area around the user becauseof the random relative position of the user, the derived finalexpression in (17) can’t be used. However, a similar approachfor the derivation can be made and yields the following resultof Lemma 4.Lemma 4: Assuming a reduced density PPP model for the
UC network of a HBBN with multiple BC stations, the LT ofinterference of UC BSs on BC users is as follows:
LuIU/B(τTbcrβv
PD
)= exp
(λ′BS
rb+rv∫rb−rv
2rscos−1(r2s −r
2v−r
2b
2rsrv
)1+ µPDrαs
τPLTbc
drs
)
exp(−2πλ′BSτPLTbc(rb−rv)
2−α
µPD(α−2)
2F1(1, 1−
2α; 2−
2α;−PLτTbc
PDµ(rb−rv)α
))(23)
The superscript u stands for upper-bound.Proof: See Appendix B
The derivation is done by calculating the interference pro-duced by the entire service area, then subtracting the inter-ference from the BC zone (as it does not cause interference),hence the additional exponential term in the expression.
Now we focus on the LT of UC BS interference on UCusers, i.e. IU/U .Corollary 4: Starting from approximation 1, the LT of the
interference of UC BS transmission on the UC users is givenby:
LuIU/U(µTucrαl
PL
)= exp
(−
2πλ′BSr2l Tuc
α − 2 2F1(1, 1−
2α; 2−
2α;−Tuc
))(24)
Proof: Due to PPP modeling and since the nearestinterference source is at least at distance rl (the servingdistance), Theorem 1 applies. Starting from the definition ofthe interference stated in (5), and setting s =
µTucrαlPL
, theexpression in (24) is obtained.
B. APPROACH 2: EVALUATION OF THE LTS OF THE BSINTERFERENCE BY IGNORING GAPSIn this approach, the gaps (areas) of the BB interfer-ence sources are completely ignored, i.e. the interferers are
141232 VOLUME 7, 2019

A. Shokair et al.: Analysis of HBBNs With Multiple Broadcasting Stations
considered to be in the whole plane (approximation 2). Thiswill overestimate the interference, and thus give a lowerbound for the probability of coverage for BC, UC, and generalusers. Here, the analytical derivations are the same as withapproach one, but with one minor change: the density of theoriginal PPP is used instead of the modified density, i.e. λBSinstead of λ′BS .Corollary 5: Based on the second approach, the LT of the
interference sourced by the BB network on a BC user isexpressed as:
LlIU/B(τTbcrβv
PD
)= exp
(λBS
rb+rv∫rb−rv
2rscos−1(r2s −r
2v−r
2b
2rsrv
)1+ µPDrαs
τPLTbc
drs
)
exp(−2πλBSτPLTbc(rb−rv)2−α
µPD(α−2)
2F1(1, 1−
2α; 2−
2α;−PLτTbc
PDµ(rb−rv)α
))(25)
The superscript l stands for lower-bound.The same applies for IU/U by changing λ′BS to λBS :Corollary 6: Starting from the second approximation by
ignoring the gaps in the BB network, the LT of the inter-cellinterference of UC BSs on a UC user is as follows:
LlIU/U(µTucrαl
PL
)= exp
(2πλBSr2l Tuc
α−2 2F1(1, 1−
2α; 2−
2α;−Tuc
))(26)
C. EVALUATION OF THE UPPER AND LOWER BOUNDSOF THE COVERAGE PROBABILITYAs mentioned earlier, the expressions of the probability ofcoverage for BC and UC users in (12) and (13) respectivelyare too complicated if the LT terms are to be evaluatedexactly. However, the two approximations allow less complexexpressions, that correspond to a lower and upper bounds ofthe interference terms.Theorem 2: The upper bound of the probability of cover-
age for the BC user is given by:
Puc/BC =2πλBC
1− exp(−λBCπr2b )
rb∫0
rv exp(−πλBCr2v )
exp(−τTbcr
βv Pn
PD
)LuIU/B
(τTbcrβvPD
)LF(−τγ rβVPD
)drv
(27)
and the upper bound of the probability of coverage for UCusers is given by:
Puc/UC = 2πλBS
∞∫0
rl exp(−πλBSr2l ) exp(−µTucrαl Pn
PL
)×LuIU/U
(−µTucrαl
PL
)LIB/U
(−µTucrαl
PL
)drl (28)
Proof: In the first approximation, the PHP is approxi-mated by a PPP with a reduced density. The reduction in den-sity means that the point process will be stretched, interferingpoints will be further away from the user in all directions.Assuming the actual interference to be:
Iactual =NBS∑n=1
Plnr−δa,n (29)
where ra,n is the actual distance from the nth interferer, andthe calculated interference to be:
I calc =NBS∑n=1
Plnr−δc,n (30)
where rc,n is the calculated distance from the nth interferer,and since in both cases the size of the sum and the trans-mission power is the same, and the channel is similar withthe same distribution and rate, the only difference lies inthe distance. Because of the approximation by changing thedensity and the expansion of the PPP, the calculated distancewill on average be higher than the actual one:
rc > ra H⇒ I calc < Iactual H⇒ LuIU/U (s) > LIU/U (s)
and since the rest of the terms in the coverage probabilityexpressions are the same, then Puc/UC provides an upper limitfor the coverage probability.Theorem 3: The lower bound of the probability of cover-
age for the BC user can be written as:
Plc/BC =2πλBC
1− exp(−λBCπr2b )
rb∫0
rv exp(−πλBCr2v )
exp(−τTbcr
βv Pn
PD
)LlIU/B
(τTbcrβvPD
)LF(−τγ rβVPD
)drv
(31)
and the lower bound of the probability of coverage for UCusers can be expressed:
Plc/UC = 2πλBS
∞∫0
rl exp(−πλBSr2l ) exp(−µTucrαl Pn
PL
)×LlIU/U
(−µTucrαl
PL
)LIB/U
(−µTucrαl
PL
)drl (32)
Proof: In this approximation, the gaps are ignored. Thisleads to count more BSs as interfering sources than the actualnumber. Denote the actual interference by:
Iactual =N actualBS∑n=1
Plnr−δn (33)
and denote the calculated interference in this approximationby:
I calc =N calcBS∑n=1
Plnr−δn (34)
VOLUME 7, 2019 141233

A. Shokair et al.: Analysis of HBBNs With Multiple Broadcasting Stations
Since the terms in the sum are always positive, the value ofthe sum depends on its size. Also because N calc
BS > N actualBS ,
then I calc > Iactual , and consequently:
LlIU/U < LIU/U (35)
creating a lower bound for the coverage.
V. CAPACITYIn this section, we consider the capacity, or the maximumachievable rate. The maximum spectral efficiency is firstlyderived. Then, the average capacity of the hybrid network isconsidered, followed by system capacity and a power effi-ciency metric.
A. ERGODIC CAPACITY FOR BC, UC, AND GENERAL USERSThe normalized user capacity is related only to the SINR ofthe received signal. For BC users, it is given by the followinglemma.Lemma 5: The ergodic capacity of a BC user is given by:
CBC
=2πλBC
1−exp(−λBCπr2b )
rb∫0
rv exp(−λBCπr2v )
∞∫0
exp(−τurβVPn
PD
)
×LIU/B(τurβVPD
)LF(τγ rβVPD
) 1ln(2)(u+ 1)
dudrv (36)
Proof: See Appendix C.The LT terms in (36) are the same as in (12), hence they
are used in the derivations.Similarly, the ergodic capacity for UC users can be
calculated.Lemma 6: The ergodic capacity for a UC user is given by:
CUC = 2πλBS
∞∫0
rl exp(−λBSπr2l )
∞∫0
exp(−µurαl Pn
PL
)× LIU/U
(µurαlPL
)LIB/U
(µurαlPL
) 1ln(2)(u+ 1)
dudrv (37)
Proof: Similar steps to that of the BC capacity arefollowed.The form of (37) is close to that of the probability of cover-
age for UC users presented in (13), but with one more averag-ing level. The LT therein can be evaluated using (24) and (21)with a simple change of parameters.
For a general user, the capacity is the combination betweenthe two capacities, given by:
C = PBCCBC + PUCCUC (38)
B. AVERAGE SYSTEM CAPACITY AND POWER EFFICIENCY1) TOTAL SYSTEM CAPACITYThe derivations above are given for the average spectral effi-ciency. However, it is useful to calculate the average systemcapacity, or the total capacity achieved by all the users in the
service area. The system capacity is the sum of capacities ofthe two networks, and it could be defined as following:
Csys= CT
BC + CTUC (39)
where CTBC is the total capacity of the BC network and CT
UCis the total capacity of the UC network.Corollary 7: Following the definition in (39), the system
capacity of a hybrid network with multiple BCTs is given by:
Csys= A exp(−λBCπr2b )CUCλBSN
RBBRB
+λUA(1− exp(−λBCπr2b ))Pc,iCreq (40)
where A is the service area, NRB is the total number ofresource blocks available for a cell BS, and BRB is the band-width of a single resource block.
Proof: The capacity of the UC network is the sum ofthe UC users’ capacities, or the product of the average usercapacity and the number of users:
CTUC = MUCCUCBuser
= λUAPUCCUCNRB/userBRB
= λUA exp(−λBCπr2b )CUCλBS
λUNRBBRB (41)
where Buser is the bandwidth allocated to a user, andNRB/user
=λBSλUNRB is the average number of resource
blocks allocated to a user following a uniform allocation forresources. The second step follows the uniform distribution ofusers, and the final step follows the assumption of a uniformallocation of resource and substituting the UC probability byits expression. As for the total capacity of the BC network, itsderivation is done differently. Indeed, as the BCT is broad-casting with a predetermined data rate, the total capacity isthe number of connected users multiplied by the predefinedrate, which is in this case, the minimum required capacity fora user to be connected (Creq):
CTBC = NBC
U Creq
= λUAPBCPc/BCCreq
= λUA(1− exp(−λBCπr2b ))Pc/BCCreq (42)
Adding the two expressions completes the proof.Note that the the total UC capacity is independent of user
density, since the available resources in a cell will be allocatedfor whatever the number of users would be in that cell. ForBC, however, the total capacity depends on the user density,and it is independent of the average user capacity.
2) POWER EFFICIENCYThe power efficiency of the system, or the normalized systemcapacity is defined as the ratio between the system capacityand the total transmitted power, and is defined as following:
ηP :=Csys∑
PD +∑PL
=λUPBCPc/BCCreq
+ PUCCUCλBSNRBBRB
λBCPD + λ′BSPL(43)
141234 VOLUME 7, 2019

A. Shokair et al.: Analysis of HBBNs With Multiple Broadcasting Stations
This metric includes all the important design parameters: theBC radius rb which is embedded in PUC , PBC , Pc/BC , andPc/UC , the BCT density λBC , the BS modified density λ′BS ,the transmission powers PD and PL and also depends on thedensity of the users in the service area λU . In fact, it willbe extremely complicated to calculate the optimal operationpoint directly from this formula. Instead, numerical evalua-tion of the above equation will be given later for differentworking conditions.
VI. SIMULATION RESULTSIn this section, numerical evaluations are drawn for a varietyof system conditions. The results are divided into three mainparts: (1) verification of the derived formulas and approxima-tions by Monte-Carlo (MC) simulations, (2) optimization ofthe hybrid network in terms of BC radius rb and density ofBCT λBC .
A. SIMULATION SETTINGThe service area is selected to be a square area of side equal to100 km, with variable BC radius and BC density. Through-out this section, γ is set to 0.8. This value was concludedfrom simulations based on the model presented in [28] forDVB-T2 in 8 MHz bandwidth and 8K mode (often usedfor mobile reception) reported in [32]. Default simulationsettings are summarized in TABLE 2. These settings willresult in a similar deployment as the example in Fig. 1.
TABLE 2. Simulation parameters.
B. ANALYTICAL SOLUTIONS AND SIMULATION RESULTSTherein, the expressions derived in sections III, IV and Vare compared to the MC simulation results. Fig 2 shows thatthe derived formulas for the probability of coverage matchperfectly with the simulation results whatever the threshold T
is, except for very low thresholds for BC users. These limi-tations were explained through the derivation of the coverageprobability in Appendix A. Furthermore, it can be seen thatapproximation 1 (from expressions (27) and (28)) representsan upper bound while approximation 2 (from expressions(31) and (32)) represents a lower bound for the actual cov-erage as expected in section III. Both approximations havegood accuracy, with an advantage to the lower bound, whichalmost overlaps the MC simulation results. Here, we omitother cross-checks due to space limitations.
C. OPTIMIZATION OF THE HYBRID NETWORKIn this part, we aim at finding an optimal point of operationfor the hybrid network in terms of key design parameters:BC radius rb, and BCT density λBC . The metrics used forevaluation are the probability of coverage, the spectral effi-ciency, and the network power efficiency. Since the derivedexpressions are proved to be accurate (lower bounds in par-ticular), they will be exclusively used for the rest of thepaper.
1) OPTIMIZATION OF COVERAGEMaximizing the probability of coverage is a key design goal.Fig. 3 shows the average probability of coverage as a functionof the BC radius rb with three different values of user density.The figure shows that an optimal point where the coverageis maximized does exist. In a UC network, higher user den-sity means lower average allocated bandwidth for each user,which will reduce the number of covered users. Then, morecontribution is needed from the BC side, which results in ahigher optimal rb.Fig. 4 shows that increasing the density of BCT enhances
the coverage except the case with very low user density,as expected. The higher the number of BCT, the more usersare connected to the BC, and because of the relativelyhigher coverage of the BC, the higher the coverage will be.Moreover, it can be noticed that the rate of growth for thecoverage probability increases with the user density of thenetwork. As expected, for low user density, the BB networkcan handle the service alone, and any additional BCT densitywill not affect the coverage.
FIGURE 2. Pc for BC, UC and general users for rb = 10 km, γ = 0.8 and λBC = λBS/200.
VOLUME 7, 2019 141235

A. Shokair et al.: Analysis of HBBNs With Multiple Broadcasting Stations
FIGURE 3. Probability of coverage versus the BC radius.
FIGURE 4. Probability of coverage versus the density of BCT.
2) OPTIMIZATION OF SPECTRAL EFFICIENCYSpectral efficiency gives an indication on the capability of thesystem to properly use spectral resources. With the limitedavailable band in the BB network, it is important to optimizethe spectral efficiency of the hybrid network.
Fig. 5 provides the optimum BC radius that maximizesthe average spectral efficiency of the users. Note that the
FIGURE 5. Spectral efficiency versus the BC radius.
normalized capacity is independent of the SINR thresholdand consequently from user density. Results in Fig. 5 indicatethat adding the BC component to a BB network increasesthe spectral efficiency, especially for users that are withinan optimum radius of the BCT (note that rb = 0 corre-sponds to BB network). However, after a certain point of theBCT radius, the edge users whose number increases with theradius rb become far from the BCT, and consequently getlower capacity.
For the same BC radius, the effect of BCT density on thespectral efficiency is studied next. Note that the total BCpower is maintained, so the transmission power of a singleBCT decreases as we increase the BCT density. It can beseen from Fig. 6 that increasing the number of BCTs degradesthe BC spectral efficiency. Even though increasing the BCTdensity will reduce the interference from the UC BSs andenhance the received power for BC users, the reduction intransmission power for each BCT appears to be a domi-nant factor, therefore reducing the global spectral efficiency.The results show that the best capacity-wise performance isachieved when the density of the BCT is low, in contraryto that of the BB BSs. This indicates that scale diversity ofthe hybrid approach (combination of the dense and sparsenetworks) is a key factor in the design.
FIGURE 6. Spectral efficiency versus the density of BCT.
3) OPTIMIZATION OF POWER EFFICIENCYMaximum coverage can theoretically be achieved by cover-ing the whole service area by a large number of BCTs withsmall BC radius. However, such a solution requires a hugeamount of energy, and thus is not feasible. The power effi-ciency defined in (43) is a suitable metric to assess achievablesystem capacity taking power consumption into considera-tion. Fig. 7 illustrates the variation of power efficiency as afunction of BC radius for two values of BCT density, andfor low and high user density. In a service area with lowuser density, as shown in Fig. 7a with an average of 1 userper BS (requesting mobile TV service), increasing the BCradius enhances the power efficiency of the network until theoptimal radius is reached.Beyond this point, expanding the
141236 VOLUME 7, 2019

A. Shokair et al.: Analysis of HBBNs With Multiple Broadcasting Stations
FIGURE 7. Power efficiency of a service area with γ = 0.8 and fordifferent loading scenarios.
BC zone will add more edge BC users, without introducingany gain in coverage and capacity, which reduces the powerefficiency. In contrary, Fig. 7b shows that for a service areawith high user density, higher rb will always produce greaterefficiency, due to the overload on the BB network. Expandingthe BC contribution in a user-dense area by rising rb will
FIGURE 8. Power efficiency of a service area versus BCT density.
take out power consuming UC BSs, and serve more usersby including them in the BC network, and consequentlyincreases the efficiency.
Results in Fig. 8 reveal that rising the BCT density affectsthe power efficiency differently depending on the user den-sity. For low user density (like the curve of 0.5 users/BS),where BB can manage to deliver enough bandwidth to theusers, increasing the number of BCTs will add a huge amountof power load without having a significant added value tothe coverage and capacity. When the area is dense (like inthe curves of 15 and 20 users/BS), adding more BCT willoffload the users to the BC network, and take out the BSsbecause of their excessive power consumption. Consequently,this increases the power efficiency.
VII. CONCLUSIONThe demand formobile TV services is expected to be growingduring the next few years while the conventional approachessuffer from several limitations. In this paper, we introducedand evaluated a novel stochastic geometry-based approachfor a hybrid BB/BC network, with multiple BCTs distributedover the service area. Therein, two approximations for theobtained PHP were used to simplify the analysis (the originaland the modified PPPs) in order to derive the analyticalexpressions of both the probability of coverage and thespectral efficiency of the users. Moreover, suitable approx-imations have been derived and verified through extensiveMC results. The derived expressions were then used tonumerically optimize the hybrid network performance interms of coverage, spectral efficiency, and power efficiency,as a function of the key design parameters, that is theBC radius and the BCT density. Results showed that thehybrid approach brings in the best performance excludingthe extreme cases of a very low and very high number ofusers. Hereby, it was proved that optimal operating pointsexist, which are governed by the BC radius and BCT density.This work presented a first of its kind in optimizing such ahybrid solution from different perspectives using stochasticgeometry while taking both ICI and inter-network interfer-ence into consideration.
APPENDIX APROOF OF LEMMA 2For BC network, the probability of coverage is the averageprobability that the SINR for a BC user Sbc is greater than acertain threshold Tbc. It can be derived as follows:
Pc/BC = Erv[P(Sbc > Tbc | rv)
](44)
= Erv[P[PDgr
−βV +γF
Pn+IU/B> Tbc | rv]
]= Erv
[P[g >
TbcrβV
PD(Pn+IU/B−
γFTbc
) | rv]]
=
rb∫0
P[g>Tbcr
βV
PD(Pn+IU/B−
γFTbc
) | rv]frv (rv)drv (45)
VOLUME 7, 2019 141237

A. Shokair et al.: Analysis of HBBNs With Multiple Broadcasting Stations
But
P[g >Tbcr
βV
PD(Pn+IU/B−
γFTbc
) | rv] (46)
(a)= EF,IU/B
[exp
(−τTbcrβvPD
(Pn+IU/B−γFTbc
))]
(b)= exp
(−τTbcrβv PnPD
)EIU/B
[exp
(−τTbcrβvPD
Ii)]
×EF[exp
(τγ rβvPD
F)]
(c)=exp
(−τTbcr
βv Pn
PD
)LIU/B
(τTbcrβvPD
)LF(−τγ rβvPD
)(47)
where L·(·)denotes the LT. (a) is valid if and only if
(Pn + IU/B −γFTbc
) > 0 and it follows the exponential distri-bution of the random variable g. In fact, (a) will lose someaccuracy when the power from other BCTs is higher thanthe sum of the noise power and the (UC/UC) interference,and this will happen only when the BCTs are very closeto each other, which is not the case in practice. (b) followsthe independence between the interference and the usefulpower, and (c) follows the definition of the LT:Lf (s)E[e−sX ].Substituting in (44), and replacing frv (rv) by its value providesthe final expression.
APPENDIX BPROOF OF LEMMA 4Let s1=
τTbcrβv
PD. The first LT can be evaluated as following:
LIU/B (s1) = E8,h[exp(−s1IU/B)] (48)
= E8,h[exp(−s1∑n∈N
PLhnrs−αn )]
= E8,h[∏n∈N
exp(−s1 PLhnrs−αn )] (49)
(a)= Eφ
[ ∏n∈N
Eh[exp(−s1 PLhnrs−αn )]]
= Eφ[ ∏n∈N
1
1+ s1 PLµrαs
](50)
(b)= exp
(−λ′BS
∫R2\G
1
1+ µrαss1PL
)(51)
where (a) follows the independence of the PPP and the chan-nel, and (b) follows Campbell’s theorem of the product overa PPP. The integral in (b) is applied on the whole 2-D planeexcluding the gap created by the absence of any interfererinside the BC zone. The result will then be:
LIU/B (s1) = exp(− λ′BS
∞∫rb−rv
2πrs
1+ µrαss1PL
drs
+λ′BS
rb+rv∫rb−rv
2rscos−1(r2s −r
2v−r
2b
2rsrv
)1+ µrαs
s1PL
drs
)(52)
Substituting s1 by its value, and applying (19) on the first termgives the final expression as in (23).
APPENDIX CPROOF OF LEMMA 5starting from the definition of the user capacity, the averagecapacity of a BC user can be derived as follows:
Ci= E[log2(1+Sbc)]
= E8,g[log2
(1+
PDgr−βV +γF
Pn+IU/B
)]=
rb∫0
frv (rv)E[log2(1+
PDgr−βV +γF
Pn+IU/B) | rv
]drv
(a)=
rb∫0
frv (rv)
∞∫0
P[log2(1+
PDgr−βV +γF
Pn+IU/B) > t | rv
]dtdrv
=
rb∫0
frv (rv)
∞∫0
P[g>
(2t−1)rβVPD
(Pn+IU/B−γF
2t − 1) | rv
]dtdrv
=
rb∫0
frv (rv)
∞∫0
EIU/B,F[exp
(−τ (2t−1)rβv
PD(Pn+IU/B−
γF2t−1
))]dtdrv
where (a) follows from E[X ]=∞∫0P(X > x
)dx. Now by
substituting frv (rv) by its expression, and substituting 2t − 1by u, the ergodic capacity for BC users will be as in (36).
ACKNOWLEDGMENTThis work has received a French state support granted to theConvergence TV project through the 20th FUI (transverseinter-ministry funding) program. The authors would also liketo thank the ‘‘Image & Réseaux’’ and ‘‘Cap Digital’’ Frenchbusiness clusters for their support of this work.
REFERENCES[1] Mobile TV Market (Service-Free to Air Service and Pay TV Service)—
Global Industry Analysis, Size, Share, Growth, Trends and Forecast2016–2024, Transparency Market Res., New York, NY, USA, 2016.
[2] C.-H.Wong, G.W.-H. Tan, T.-S. Hew, andK.-B. Ooi, ‘‘Canmobile TV be anew revolution in the television industry?’’ Comput. Hum. Behav., vol. 55,pp. 764–776, Feb. 2016.
[3] M. El-Hajjar and L. Hanzo, ‘‘A survey of digital television broadcasttransmission techniques,’’ IEEE Commun. Surveys Tuts., vol. 15, no. 4,pp. 1924–1949, Apr. 2013.
[4] L. Fay, L. Michael, D. Gómez-Barquero, N. Ammar, and M. W. Caldwell,‘‘An overview of the ATSC 3.0 physical layer specification,’’ IEEE Trans.Broadcast., vol. 62, no. 1, pp. 159–171, Mar. 2016.
[5] H.Voigt, ‘‘Hybridmedia and tv delivery usingmobile broadband combinedwith terrestrial/satellite tv,’’ in Proc. 15th Electron. Conf. Biennial Baltic,2016, pp. 1–10.
[6] A. Shokair, Y. Nasser, O. Bazzi, J.-F. Hélard, and M. Crussière, ‘‘Nearoptimal linear-service oriented resource allocation strategy for LTE net-works,’’ in Proc. 9th Int. Congr. Ultra Mod. Telecommun. Control Syst.Workshops (ICUMT), Nov. 2017, pp. 73–78.
[7] P.-A. Fam,M. Crussière, J.-F. Hélard, P. Brétillon, and S. Paquelet, ‘‘Globalthroughput maximization of a hybrid unicast-broadcast network for linearservices,’’ inProc. Int. Symp.Wireless Commun. Syst. (ISWCS), Aug. 2015,pp. 146–150.
141238 VOLUME 7, 2019

A. Shokair et al.: Analysis of HBBNs With Multiple Broadcasting Stations
[8] D. Lecompte and F. Gabin, ‘‘Evolved multimedia broadcast/multicast ser-vice (eMBMS) in LTE-advanced: Overview and Rel-11 enhancements,’’IEEE Commun. Mag., vol. 50, no. 11, pp. 68–74, Nov. 2012.
[9] L. Christodoulou, O. Abdul-Hameed, and A. M. Kondoz, ‘‘Toward anLTE hybrid unicast broadcast content delivery framework,’’ IEEE Trans.Broadcast., vol. 63, no. 4, pp. 656–672, Dec. 2017.
[10] J. Calabuig, J. F. Monserrat, and D. Gómez-Barquero, ‘‘5th generationmobile networks: A new opportunity for the convergence of mobilebroadband and broadcast services,’’ IEEE Commun. Mag., vol. 53, no. 2,pp. 198–205, Feb. 2015.
[11] C. Singhal and S. De, ‘‘Energy-efficient and QoE-aware TV broadcast innext-generation heterogeneous networks,’’ IEEE Commun. Mag., vol. 54,no. 12, pp. 142–150, Dec. 2016.
[12] P. Unger and T. Kürner, ‘‘Modeling and performance analyses of hybridcellular and broadcasting networks,’’ Int. J. Digit. Multimedia Broadcast.,vol. 2009, Nov. 2009, Art. no. 329073.
[13] K. Wang, Z. Chen, and H. Liu, ‘‘Push-based wireless converged networksfor massive multimedia content delivery,’’ IEEE Trans. Wireless Commun.,vol. 13, no. 5, pp. 2894–2905, May 2014.
[14] A. Lykourgiotis, K. Birkos, T. Dagiuklas, E. Ekmekcioglu, S. Dogan,Y. Yildiz, I. Politis, G. O. Tanik, B. Demirtas, A. M. Kondoz, andS. Kotsopoulos, ‘‘Hybrid broadcast and broadband networks convergencefor immersive TV applications,’’ IEEE Wireless Commun., vol. 21, no. 3,pp. 62–69, Jun. 2014.
[15] M. Crussière, C. Douillard, C. Gallard, M. Le Bot, B. Ros, A. Bouttier,and A. Untersee, ‘‘A unified broadcast layer for horizon 2020 delivery ofmultimedia services,’’ IEEE Trans. Broadcast., vol. 60, no. 2, pp. 193–207,Jun. 2014.
[16] Y. Wang, D. He, L. Ding, W. Zhang, W. Li, Y. Wu, N. Liu, and Y. Wang,‘‘Media transmission by cooperation of cellular network and broadcast-ing network,’’ IEEE Trans. Broadcast., vol. 63, no. 3, pp. 571–576,Sep. 2017.
[17] A. A. Razzac, S. E. Elayoubi, T. Chahed, and B. El Hassan, ‘‘Planning ofmobile TV service in standalone and cooperative DVB-NGH AND LTEnetworks,’’ in Proc. 11th Int. Symp. Workshops Modeling Optim. Mobile,Ad Hoc Wireless Netw. (WiOpt), May 2013, pp. 609–614.
[18] P. A. Fam, S. Paquelet, M. Crussière, J.-F. Hélard, and P. Brétillon, ‘‘Ana-lytical derivation and optimization of a hybrid unicast-broadcast networkfor linear services,’’ IEEE Trans. Broadcast., vol. 62, no. 4, pp. 890–902,Dec. 2016.
[19] H. Bawab, P. Mary, J.-F. Hélard, Y. Nasser, and O. Bazzi, ‘‘Globalergodic capacity closed-form expression of coexisting DVB-LTE-like sys-tems,’’ in Proc. IEEE 79th Veh. Technol. Conf. (VTC Spring), May 2014,pp. 1–5.
[20] A. Shokair, Y. Nasser,M. Crussière, J.-F. Hélard, andO. Bazzi, ‘‘Analyticalstudy of the probability of coverage in hybrid broadcast-unicast networks,’’in Proc. IEEE 29th Annu. Int. Symp. Personal, Indoor Mobile RadioCommun. (PIMRC), Sep. 2018, pp. 1–6.
[21] M. Haenggi, Stochastic Geometry for Wireless Networks. Cambridge,U.K.: Cambridge Univ. Press, 2012.
[22] M. Haenggi, J. G. Andrews, F. Baccelli, O. Dousse, and M. Franceschetti,‘‘Stochastic geometry and random graphs for the analysis and designof wireless networks,’’ IEEE J. Sel. Areas Commun., vol. 27, no. 7,pp. 1029–1046, Sep. 2012.
[23] I. Kaj, ‘‘Aspects of wireless network modeling based on Poissonpoint processes,’’ in Proc. Fields Inst. Workshop Appl. Probab., 2006,pp. 1–18.
[24] W. Lu and M. Di Renzo, ‘‘Stochastic geometry modeling of cellularnetworks: Analysis, simulation and experimental validation,’’ in Proc. 18thACM Int. Conf. Modeling, Anal. Simulation Wireless Mobile Syst., 2015,pp. 179–188.
[25] J. G. Andrews, F. Baccelli, and R. K. Ganti, ‘‘A tractable approach tocoverage and rate in cellular networks,’’ IEEE Trans. Commun., vol. 59,no. 11, pp. 3122–3134, Nov. 2011.
[26] T. Kwon and H. Lee, ‘‘Broadcast range performances for random access-based wireless mutual broadcast,’’ IEEE Commun. Lett., vol. 22, no. 10,pp. 2108–2111, Oct. 2018.
[27] P.-A. Fam, S. Paquelet, M. Crussière, J.-F. Hélard, and P. Brétillon,‘‘Optimal capacity of hybrid unicast-broadcast networks for mobile TVservices,’’ in Proc. IEEE Int. Symp. Broadband Multimedia Syst. Broad-cast. (BMSB), Jun. 2016, pp. 1–5.
[28] A. Ligeti, ‘‘Coverage probability estimation in single frequency networksin presence of correlated useful and interfering components,’’ in Proc.Gateway 21st Century Commun. Village. (VTC-Fall) IEEE VTS 50th Veh.Technol. Conf., vol. 4, Sep. 1999, pp. 2408–2412.
[29] Z. Yazdanshenasan, H. S. Dhillon, M. Afshang, and P. H. J. Chong,‘‘Poisson hole process: Theory and applications to wireless networks,’’IEEE Trans. Wireless Commun., vol. 15, no. 11, pp. 7531–7546,Nov. 2016.
[30] C.-H. Lee and M. Haenggi, ‘‘Interference and outage in Poisson cognitivenetworks,’’ IEEE Trans. Wireless Commun., vol. 11, no. 4, pp. 1392–1401,Apr. 2012.
[31] I. M. Ryzhik and I. S. Gradshteyn, Table of Integrals, Series, and Products.New York, NY, USA: Academic, 1965.
[32] Frequency and Network Planning Aspects of DVB-T2, EBU.UER, ITU,Geneva, Switzerland.
AHMAD SHOKAIR received the B.E. degree incommunication and electronics engineering fromBeirut Arab University (BAU), in 2013, and themaster’s degree in communication and signalprocessing from Lebanese University, Lebanon,in 2016. He is currently pursuing the Ph.D. degreein communication and networks with the Institutefor Electronics and Telecommunications (IETR),National Institute of Applied Sciences (INSA),Rennes, France, in collaboration with Lebanese
University. His current research interests include mobile communicationtechnologies, signal processing, and machine learning. He is currentlyinvolved in a project that includes cooperative wireless networks like broad-cast/broadband hybridization.
MATTHIEU CRUSSIÈRE received the M.Sc. andPh.D. degrees in electrical engineering from theNational Institute of Applied Sciences (INSA),Rennes, France, in 2002 and 2005, respectively.In 2005, he joined the Department of Telecom-munications and Electronic Engineering, INSA,as an Associate Professor and since 2005, he hasbeenwith the Digital Communication Department,Electronics and Telecommunications Institute ofRennes (IETR). He is currently the Head of the
SYSCOM Team, IETR. His current research interests include digital com-munications and signal processing techniques. His first works were focusedon the optimization of high-bit rate power line communications using hybridmulticarrier and spread-spectrum waveforms. Then, he developed an exper-tise in adaptive resource allocation, optimization algorithms, and systemdesign for multicarrier and multiantenna systems. During the last year, heapplied his research results to the optimization of broadcast, broadband, andhybrid networks. In 2014, he started scientific collaborations as an AssociateResearcher with the Institute of Research and Technology (IRT) B-COMin Rennes on large-scale antenna systems. He is the author or coauthor ofmore than 110 technical articles in international conferences and journals. Hehas been involved in several European and French national research projectsin the field of powerline communications, broadcasting systems, and ultrawideband and mobile radio communications.
VOLUME 7, 2019 141239

A. Shokair et al.: Analysis of HBBNs With Multiple Broadcasting Stations
JEAN-FRANCOIS HÉLARD received theDipl.-Ing. and Ph.D. degrees in electronics andsignal processing from the National Institute ofApplied Sciences (INSA) in Rennes, in 1981 and1992, respectively. From 1982 to 1997, he was aResearch Engineer and then the Head of ChannelCoding for the Digital Broadcasting ResearchGroup, France Telecom Research Center (OrangeLabs), Rennes. In 1997, he joined INSA Rennes,which is one of the Grandes Ecoles in France,
where he is currently a Full Professor, Classe Exceptionelle, which is thehighest rank. He was the Director of the Research of INSA Rennes duringthree years, from 2010 to 2013. During eight years, he was also the DeputyDirector of the Rennes Institute for Electronics and Telecommunications(IETR, UMR CNRS 6164), which is an academic research laboratoryof 400 people, created in 2002, in association with the CNRS. His currentresearch interests include signal processing techniques for digital communi-cations, such as space–time and channel coding, multicarrier modulation,and multiuser communications and cross-layer techniques. He involvedin several European and national research projects in the fields of digitalvideo terrestrial broadcasting, mobile radio communications and cellularnetworks, power-line and ultra-wide-band communications, cooperativecommunications, and relaying techniques. He is the author and coauthorof more than 300 technical articles in international scientific journals andconferences, and holds 15 European patents.
YOUSSEF NASSER received the Ph.D. degreefrom the National Polytechnic Institute ofGrenoble, in 2006, and the HDR degree, in 2015.In 2003, he joined the Laboratory of Electronicsand Information Technologies, Grenoble, wherehe involved in B3G and 4G systems. In 2007,he was a Research Engineer with INSA-Rennesand then joined the American University of Beirut(AUB), in 2010. His current research interestsinclude signal processing on communications sys-
tems, 5G and 4G systems, and massive MIMO and localization. He hasorganized several international conferences and had been involved in theorganization committees of IEEE flagship conferences (ICC, PIMRC, andSPAWC). He has proposed and has been involved in several research EUprojects. He published more than 120 articles in top-tier journals andconferences.
OUSSAMA BAZZI received the B.E. degree inelectrical engineering from the American Univer-sity of Beirut (AUB), in 1987, and the master’s andPh.D. degrees in electronics from the Universityof Valenciennes and Hainaut Cambresis (UVHC),France, in 1988 and 1992, respectively. He joinedLebanese University, in 1996, where he is cur-rently a Full Professor. He is currently the Head ofthe Research Group Telecoms, Signal Processingand Images (TSPI), Faculty of Sciences, Lebanese
University. His current research interests include signal processing and wire-less and mobile radio communications. His current research projects includeradio resource management, hybrid broadcast techniques, cooperative com-munication techniques, and cognitive radio networks.
141240 VOLUME 7, 2019