Embed Size (px)
Citation preview

January 2021
Analysis of hospital activity and costs following allogeneic stem cell transplantation in England
Confidential – All Rights Reserved 1Analysis of hospital activity, costs and income following allogeneic stem cell transplantation in England |
DisclaimerThis report has been prepared by Ernst & Young LLP in accordance with an engagement agreement for professional services with Anthony Nolan and funded by Anthony Nolan.
Ernst & Young LLP’s obligations to Anthony Nolan are governed by that engagement agreement. This disclaimer applies to all other parties (including Anthony Nolan affiliates and advisors).
Anthony Nolan is a registered charity no 803716/SC038827. Ernst & Young LLP is a limited liability partnership registered in England and Wales with registered number OC300001.
This report has been prepared for general informational purposes only and is not intended to be relied upon as accounting, tax, or other professional advice. Refer to your advisors for specific advice.
Ernst & Young LLP accepts no responsibility to update this report in light of subsequent events or for any other reason.
This report does not constitute a recommendation or endorsement by Ernst & Young LLP to invest in, sell, or otherwise use any of the products referred to in it.
To the fullest extent permitted by law, Ernst & Young LLP and its members, employees and agents do not accept or assume any responsibility or liability in respect of this report, or decisions based on it, to any reader of the report. Should such readers choose to rely on this report, then they do so at their own risk.
Ernst & Young LLP reserves all rights related to the report.

Confidential – All Rights Reserved 2Analysis of hospital activity, costs and income following allogeneic stem cell transplantation in England |
ContentsPage
Executive summary 03
Introduction 04
Approach 06
Findings: the transplant spell 08
Findings: hospital activity 09
Findings: costs 11
Conclusion and recommendations 12
References and technical notes 13
Confidential – All Rights Reserved 3Analysis of hospital activity, costs and income following allogeneic stem cell transplantation in England |
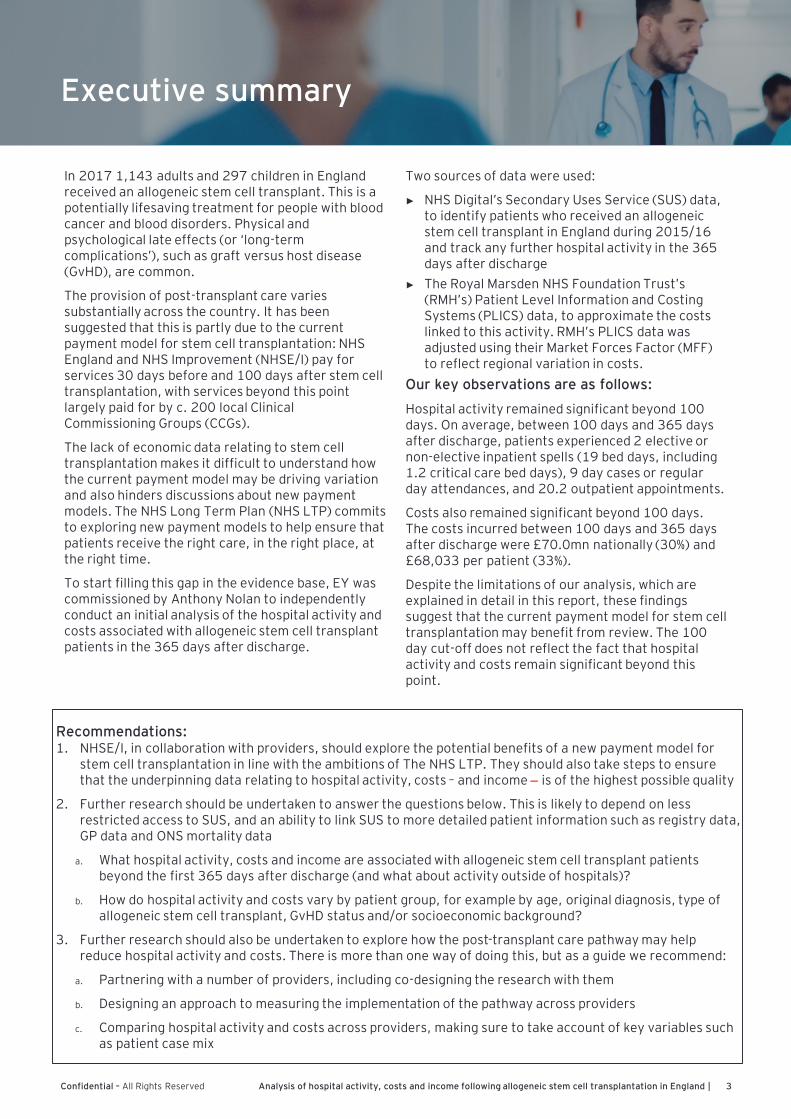
In 2017 1,143 adults and 297 children in England received an allogeneic stem cell transplant. This is a potentially lifesaving treatment for people with blood cancer and blood disorders. Physical and psychological late effects (or ‘long-term complications’), such as graft versus host disease (GvHD), are common.
The provision of post-transplant care varies substantially across the country. It has been suggested that this is partly due to the current payment model for stem cell transplantation: NHS England and NHS Improvement (NHSE/I) pay for services 30 days before and 100 days after stem cell transplantation, with services beyond this point largely paid for by c. 200 local Clinical Commissioning Groups (CCGs).
The lack of economic data relating to stem cell transplantation makes it difficult to understand how the current payment model may be driving variation and also hinders discussions about new payment models. The NHS Long Term Plan (NHS LTP) commits to exploring new payment models to help ensure that patients receive the right care, in the right place, at the right time.
To start filling this gap in the evidence base, EY was commissioned by Anthony Nolan to independently conduct an initial analysis of the hospital activity and costs associated with allogeneic stem cell transplant patients in the 365 days after discharge.
Two sources of data were used:
► NHS Digital’s Secondary Uses Service (SUS) data, to identify patients who received an allogeneic stem cell transplant in England during 2015/16 and track any further hospital activity in the 365 days after discharge
► The Royal Marsden NHS Foundation Trust’s (RMH’s) Patient Level Information and Costing Systems (PLICS) data, to approximate the costs linked to this activity. RMH’s PLICS data was adjusted using their Market Forces Factor (MFF) to reflect regional variation in costs.
Our key observations are as follows:
Hospital activity remained significant beyond 100 days. On average, between 100 days and 365 days after discharge, patients experienced 2 elective or non-elective inpatient spells (19 bed days, including 1.2 critical care bed days), 9 day cases or regular day attendances, and 20.2 outpatient appointments.
Costs also remained significant beyond 100 days. The costs incurred between 100 days and 365 days after discharge were £70.0mn nationally (30%) and £68,033 per patient (33%).
Despite the limitations of our analysis, which are explained in detail in this report, these findings suggest that the current payment model for stem cell transplantation may benefit from review. The 100 day cut-off does not reflect the fact that hospital activity and costs remain significant beyond this point.
Executive summary
Recommendations:1. NHSE/I, in collaboration with providers, should explore the potential benefits of a new payment model for
stem cell transplantation in line with the ambitions of The NHS LTP. They should also take steps to ensure that the underpinning data relating to hospital activity, costs – and income – is of the highest possible quality
2. Further research should be undertaken to answer the questions below. This is likely to depend on less restricted access to SUS, and an ability to link SUS to more detailed patient information such as registry data, GP data and ONS mortality data
a. What hospital activity, costs and income are associated with allogeneic stem cell transplant patients beyond the first 365 days after discharge (and what about activity outside of hospitals)?
b. How do hospital activity and costs vary by patient group, for example by age, original diagnosis, type of allogeneic stem cell transplant, GvHD status and/or socioeconomic background?
3. Further research should also be undertaken to explore how the post-transplant care pathway may help reduce hospital activity and costs. There is more than one way of doing this, but as a guide we recommend:
a. Partnering with a number of providers, including co-designing the research with them
b. Designing an approach to measuring the implementation of the pathway across providers
c. Comparing hospital activity and costs across providers, making sure to take account of key variables such as patient case mix

Confidential – All Rights Reserved 4Analysis of hospital activity, costs and income following allogeneic stem cell transplantation in England |
There are over 100 different types of blood cancer, the three main groups being leukaemia, lymphoma and myeloma [2]. It is the fifth most common cancer and the third biggest cancer killer; nearly 35,000 people are diagnosed with blood cancer and nearly 13,000 lives are lost to blood cancer every year in England. Survival rates vary by type, but have generally been improving over time [3].
Introduction
What are blood cancers and blood disorders?
0%
10%
20%
30%
40%
50%
60%
70%
80%
90%
100%
1971–72 1980–81 1990–91 2000–01 2005–06 2010–11 (prediction)
One year survival by blood cancer type over time [3]
Hodgkin's disease Leukaemia Multiple myeloma Non-Hodgkin lymphoma
Blood disorders are a group of non-cancerous conditions, the most common of which are Myelodysplastic Syndromes (MDS); approximately 2,400 people are diagnosed with MDS every year in England. Other blood disorders include aplastic anaemia, sickle cell disease, autoimmune diseases and thalassaemia. Some blood disorders, like MDS, can develop into blood cancer.
An allogeneic stem cell transplant is a potentially lifesaving treatment for people with blood cancer and blood disorders, which works by replacing damaged blood cells with healthy ones.
In an allogeneic stem cell transplant, the stem cells come from a donor (either a sibling donor, matched unrelated donor, cord blood donor or haploidentical donor). This is in contrast to an autologous stem cell transplant, where the patient’s own stem cells are collected and returned to them [4].
Every year in England, approximately 1,100 adults and 300 children receive an allogeneic stem cell transplant. The total number is increasing at an average rate of 5% year-on-year. Adults most commonly receive an allogeneic stem cell transplant to treat blood cancer, whereas children most commonly receive an allogeneic stem cell transplant to treat a blood disorder.
What is an allogeneic stem cell transplant?
Physical and psychological late effects (or ‘long-term complications’) are common after an allogeneic stem cell transplant. A major cause of morbidity and mortality is graft versus host disease (GvHD), where the donor’s cells attack the patient’s cells because it sees them as ‘different’. GvHD affects approximately 30% to 40% of patients and can occur years after treatment [5].
The importance of long-term follow-up to prevent, manage and treat late effects is internationally recognised. Despite this, evidence shows that there is substantial variation in the provision of post-transplant care across the country, leading to inequitable access to treatment, care and support.
One driver of variation is the lack of a minimum standard for post-transplant care. The charity Anthony Nolan and an Expert Steering Group consisting of leading healthcare professionals, local NHS representatives and patients sought to address this by publishing ‘A pathway for post-transplant care’ in May 2019. The pathway describes the services and support packages that are central to patients’ recovery.
What drives variation in the provision of post-transplant care?
Confidential – All Rights Reserved 5Analysis of hospital activity, costs and income following allogeneic stem cell transplantation in England |
There is very little economic data relating to stem cell transplantation in the public domain. This makes it difficult to understand how the current payment model may be contributing to variation in the provision of post-transplant care across the country.
It also hinders discussions about new payment models that could, potentially, facilitate improvements in post-transplant care. The NHS Long Term Plan 6 (NHS LTP) makes a general commitment to exploring new payment models to help ensure that patients receive the right care, in the right place, at the right time. There is a focus on moving away from activity-based payments to population-based payments, where providers receive a fixed amount of money based on the number of patients in a given population.
To start filling this gap in the evidence base, EY was commissioned by Anthony Nolan to independently conduct an initial analysis of the hospital activity and costs associated with allogeneic stem cell transplant patients in the 365 days after discharge. This report presents our findings and highlights areas where more research is needed.
Introduction (cont’d)
What is the purpose of this report?
It has also been suggested, in discussions with healthcare professionals, that another driver of variation is the current payment model for (allogeneic and autologous) stem cell transplantation:
► The stem cell transplant itself, plus services 30 days before and 100 days after, are paid for by NHS England and NHS Improvement (NHSE/I) as part of their specialised commissioning responsibilities.
► Services beyond this point are largely paid for by c. 200 local Clinical Commissioning Groups (CCGs). The one exception is Extracorporeal Photopheresis (ECP), which is a treatment for GvHD of the skin. This continues to be paid for by NHSE/I.
This is an example of an activity-based payment model, where providers receive a fixed amount of money for each ‘unit’ of activity they undertake.
Confidential – All Rights Reserved 6Analysis of hospital activity, costs and income following allogeneic stem cell transplantation in England |
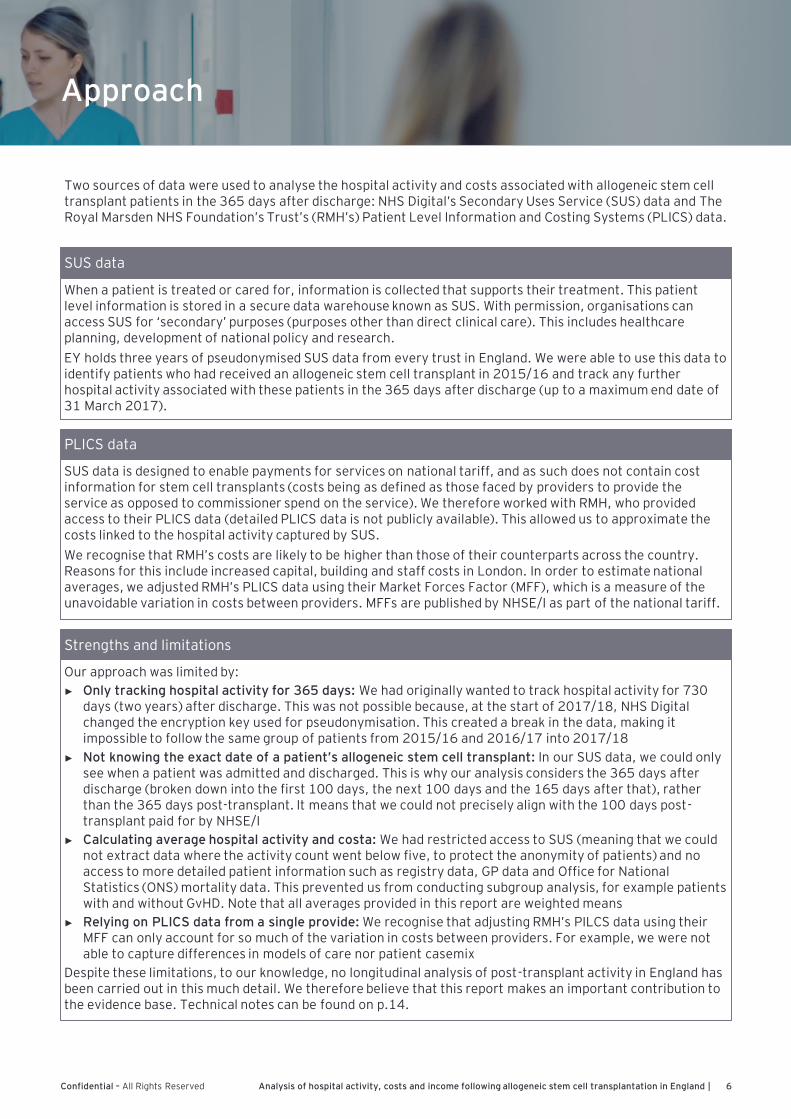
When a patient is treated or cared for, information is collected that supports their treatment. This patient level information is stored in a secure data warehouse known as SUS. With permission, organisations can access SUS for ‘secondary’ purposes (purposes other than direct clinical care). This includes healthcare planning, development of national policy and research.
EY holds three years of pseudonymised SUS data from every trust in England. We were able to use this data to identify patients who had received an allogeneic stem cell transplant in 2015/16 and track any further hospital activity associated with these patients in the 365 days after discharge (up to a maximum end date of 31 March 2017).
Approach
SUS data
Two sources of data were used to analyse the hospital activity and costs associated with allogeneic stem cell transplant patients in the 365 days after discharge: NHS Digital’s Secondary Uses Service (SUS) data and The Royal Marsden NHS Foundation’s Trust’s (RMH’s) Patient Level Information and Costing Systems (PLICS) data.
SUS data is designed to enable payments for services on national tariff, and as such does not contain cost information for stem cell transplants (costs being as defined as those faced by providers to provide the service as opposed to commissioner spend on the service). We therefore worked with RMH, who provided access to their PLICS data (detailed PLICS data is not publicly available). This allowed us to approximate the costs linked to the hospital activity captured by SUS.
We recognise that RMH’s costs are likely to be higher than those of their counterparts across the country. Reasons for this include increased capital, building and staff costs in London. In order to estimate national averages, we adjusted RMH’s PLICS data using their Market Forces Factor (MFF), which is a measure of the unavoidable variation in costs between providers. MFFs are published by NHSE/I as part of the national tariff.
PLICS data
Our approach was limited by:
► Only tracking hospital activity for 365 days: We had originally wanted to track hospital activity for 730 days (two years) after discharge. This was not possible because, at the start of 2017/18, NHS Digital changed the encryption key used for pseudonymisation. This created a break in the data, making it impossible to follow the same group of patients from 2015/16 and 2016/17 into 2017/18
► Not knowing the exact date of a patient’s allogeneic stem cell transplant: In our SUS data, we could only see when a patient was admitted and discharged. This is why our analysis considers the 365 days after discharge (broken down into the first 100 days, the next 100 days and the 165 days after that), rather than the 365 days post-transplant. It means that we could not precisely align with the 100 days post-transplant paid for by NHSE/I
► Calculating average hospital activity and costa: We had restricted access to SUS (meaning that we could not extract data where the activity count went below five, to protect the anonymity of patients) and no access to more detailed patient information such as registry data, GP data and Office for National Statistics (ONS) mortality data. This prevented us from conducting subgroup analysis, for example patients with and without GvHD. Note that all averages provided in this report are weighted means
► Relying on PLICS data from a single provide: We recognise that adjusting RMH’s PILCS data using their MFF can only account for so much of the variation in costs between providers. For example, we were not able to capture differences in models of care nor patient casemix
Despite these limitations, to our knowledge, no longitudinal analysis of post-transplant activity in England has been carried out in this much detail. We therefore believe that this report makes an important contribution to the evidence base. Technical notes can be found on p.14.
Strengths and limitations

Confidential – All Rights Reserved 7Analysis of hospital activity, costs and income following allogeneic stem cell transplantation in England |
Step 1: Within national SUS dataset identify all patients who had an allogeneic stem cell transplant in financial year 2015/16 (defined by dominant procedure OPCS codes). Apply data filtering a cleaning to refine cohort of patients, e.g., exclude any duplicate data, convert episodes to spells, etc.
Approach (cont’d)
Step-by-step overview
Step 2: Segment the cohort to enable analysis. e.g., split by age group, centre of treatment, procedure code.
Step 3: Identify all hospital activity (by activity type, including inpatient, outpatient, day case, A&E and regular day attender) related to this same cohort of patients in the 365 days subsequent to their own original stem cell transplant spell, including activity which a) was undertaken at the same hospital where the transplant took place and b) was undertaken at another hospital.
Step 4: Cost the activity based upon a benchmarked cost per activity type (supplied by the RMH as an extract of their patient level costing and information system (PLICS) data). Arrive at an average profile of activity and costs for the pathway. Correct for the expected higher costs in London using Market Forces Factor.
a b
£

Confidential – All Rights Reserved 8Analysis of hospital activity, costs and income following allogeneic stem cell transplantation in England |
We identified 1,190 patients who received an allogeneic stem cell transplant in 2015/16, 60 of whom were treated at RMH. This varies from figures published by the BSBMTCT, who quote 1,440 transplants for 2017 [ref]. This difference is likely driven by use of different data sources, SUS including only patients treated for and by the NHS (not private patients) and our analysis focusing on first transplants.
The ‘transplant spell’ describes the period from admission to discharge. We found that patients had an average length of stay of 33 days, with younger patients having the longest length of stay. This is important because, as already highlighted, our analysis considers the 365 days after discharge rather than the 365 days post-transplants. It means that 100 days after discharge is roughly equivalent to 133 days post-transplant (and so on).
Findings: the transplant spell
Age Transplants (spells) Average length of stay (ALOS)
65+ 160 28.25
Adult (18-65) 899 30.63
Children 131 57.06
All ages 1190 33.22
While not a focus of this report, it is also worth noting that allogeneic and autologous stem cell transplants are very different treatments and, as a result, incur very different costs. For example, allogeneic stem cell transplants involve the work of finding a suitable donor (potentially from abroad) and are more likely to lead to late effects requiring additional management. However, in both cases, it is direct costs such as medical and nursing staff that are most significant. Overhead costs include back office support, building and utilities.
Transplant type Direct costs Overhead costs Total costs
Allogeneic
Adult 60,759 12,716 73,476
Children 93,122 20,608 113,730
Autologous
Adult 11,730 4,899 16,629
Children 30,733 11,514 42,247

Confidential – All Rights Reserved 9Analysis of hospital activity, costs and income following allogeneic stem cell transplantation in England |
Findings: hospital activity
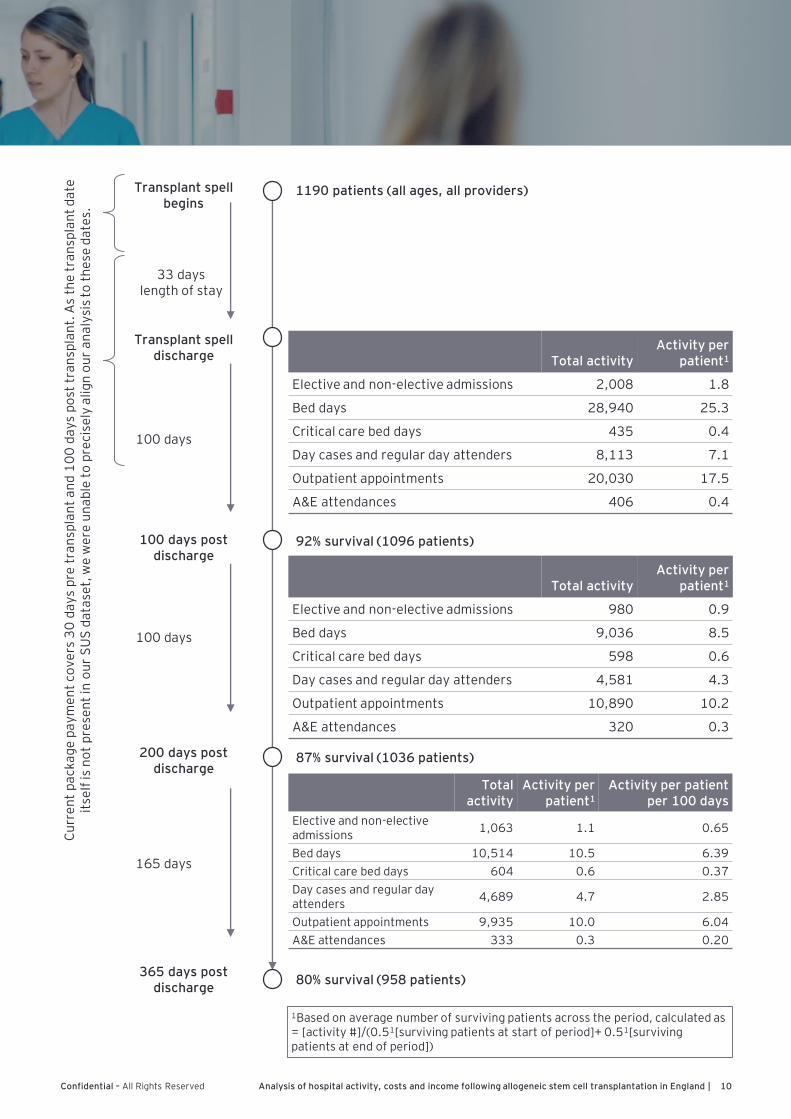
Using SUS data, we tracked survival and hospital activity for all 1,190 allogeneic stem cell transplant patients in the 365 days after discharge. This included activity beyond the hospital where they were originally treated. We found that, on average, a patient surviving the full 365 days after discharge experienced:
4 elective or non-electiveinpatient spells in hospital
44 bed days as an inpatient (in addition to 33 days for the
transplant spell itself)2 days in critical care
16 day cases or regular day attendances (including
chemotherapy)38 outpatient appointments
The diagram overleaf goes into more detail, showing survival and hospital activity at 100 days, 200 days and 365 days after discharge. A key observation is that, while hospital activity generally declined over time, it remained significant beyond 100 days with patients experiencing:
► 2 elective or non-elective inpatient spells (19 bed days, including 1.2 critical care bed days)
► 9 day cases or regular day attendances
► 20.2 outpatient appointments
While we were unable to conduct subgroup analysis, it is fair to assume that hospital activity will vary depending on a wide range of factors including the patient’s age, their original diagnosis and the severity of any late effects such as GvHD. It has previously been shown that patients with GvHD experience a higher number of inpatient spells than patients without GvHD.
We are also unable to say how much hospital activity was avoidable. This is a topical issue; for example, the NHS LTP 6 commits to fundamentally redesigning outpatient services so that, over the next five years, patients will be able to avoid up to one-third of face-to-face outpatient appointments (equivalent to 30mn outpatient appointments every year).
Confidential – All Rights Reserved 10Analysis of hospital activity, costs and income following allogeneic stem cell transplantation in England |
Transplant spell begins
Transplant spell discharge
100 days post discharge
200 days post discharge
365 days post discharge
33 days length of stay
100 days
100 days
165 days
1190 patients (all ages, all providers)
92% survival (1096 patients)
87% survival (1036 patients)
80% survival (958 patients)
Total activityActivity per
patient1
Elective and non-elective admissions 2,008 1.8
Bed days 28,940 25.3
Critical care bed days 435 0.4
Day cases and regular day attenders 8,113 7.1
Outpatient appointments 20,030 17.5
A&E attendances 406 0.4
Total activityActivity per
patient1
Elective and non-elective admissions 980 0.9
Bed days 9,036 8.5
Critical care bed days 598 0.6
Day cases and regular day attenders 4,581 4.3
Outpatient appointments 10,890 10.2
A&E attendances 320 0.3
Total activity
Activity per patient1
Activity per patient per 100 days
Elective and non-elective admissions
1,063 1.1 0.65
Bed days 10,514 10.5 6.39
Critical care bed days 604 0.6 0.37
Day cases and regular day attenders
4,689 4.7 2.85
Outpatient appointments 9,935 10.0 6.04
A&E attendances 333 0.3 0.20
1Based on average number of surviving patients across the period, calculated as = [activity #]/(0.51[surviving patients at start of period]+ 0.51[surviving patients at end of period])
Cu
rre
nt
pa
cka
ge
pa
ym
en
t co
ve
rs 3
0 d
ay
s p
re t
ran
spla
nt
an
d 1
00
da
ys
po
st t
ran
spla
nt.
As
the
tra
nsp
lan
t d
ate
it
self
is n
ot
pre
sen
t in
ou
r S
US
da
tase
t, w
e w
ere
un
ab
le t
o p
reci
sely
ali
gn
ou
r a
na
lysi
s to
th
ese
da
tes.

Confidential – All Rights Reserved 11Analysis of hospital activity, costs and income following allogeneic stem cell transplantation in England |
By combining SUS data with RMH’s PLICS data, adjusted using their MFF, we were able to estimate the costs associated with the initial transplant spell plus the 365 days after discharge.
The diagram below shows that, nationally:
► Initial transplant spell cost £97.8mn (42%)
► 100 days after discharge cost £64.9mn (28%)
► 100 days to 200 days after discharge cost £34.2mn (15%)
► 200 days to 365 days after discharge cost £35.9mn (15%)
A similar breakdown of costs was seen for a patient surviving the full 365 days after discharge:
► Initial transplant spell cost £82,197 (40%)
► 100 days after discharge cost £56,738 (27%)
► 100 days to 200 days after discharge cost £32,070 (15%)
► 200 days to 365 days after discharge cost £35,963 (17%)
As with hospital activity, while costs generally declined over time, they remained significant beyond 100 days; approximately one-third of the total cost was incurred between 100 days and 365 days after discharge.
Findings: costs
100-200 days post transplant spell discharge
Total Per patient
Total cost 34,186,226 32,070
% pathway cost 15% 15%
200-365 days post transplant spell discharge
Total Per patient Per patient
per 100 days
Cost 35,854,918 35,963 21,796
% pathway cost 15% 17%
► Transplant spell begins
► Transplant spell discharge
► 100 days post discharge
► 200 days post discharge
► 365 days post dischargeTotal pathway cost and income
Total Per patient
Total cost 232,706,617 206,967
Total Per patient
Cost of initial transplant spell
Total cost 97,815,123 82,197
% of total cost 42% 40% Transplant spell costs also included in these figures
Initial transplant spell + 0-100 days post transplant
Total Per patient
Cost 162,665,473 138,935
% pathway cost 70% 67%

Confidential – All Rights Reserved 12Analysis of hospital activity, costs and income following allogeneic stem cell transplantation in England |
Conclusions and recommendations
This report presents an initial analysis of the hospital activity and costs associated with allogeneic stem cell transplant patients in the 365 days after discharge. We have demonstrated that much can be achieved using SUS data and PLICS data, and hope that our approach is of as much interest as our key observations.
Our key observations are that:► Hospital activity remained significant beyond 100 days. On average, between 100 days and 365 days after
discharge, patients experienced 2 elective or non-elective inpatient spells (19 bed days, including 1.2 critical care bed days), 9 day cases or regular day attendances, and 20.2 outpatient appointments.
► Costs also remained significant beyond 100 days. The costs incurred between 100 days and 365 days after discharge were £70.0mn nationally (30%) and £68,033 per patient (33%).
Despite the limitations of our analysis, these findings suggest that the current payment model for stem cell transplantation may benefit from review. The 100 day cut-off does not reflect the fact that hospital activity and costs remain significant beyond this point.
Recommendations:1. NHSE/I, in collaboration with providers, should explore the potential benefits of a new payment model
for stem cell transplantation in line with the ambitions of The NHS LTP. They should also take steps to ensure that the underpinning data relating to hospital activity, costs – and income – is of the highest possible quality
2. Further research should be undertaken to answer the questions below. This is likely to depend on less restricted access to SUS, and an ability to link SUS to more detailed patient information such as registry data, GP data and ONS mortality data
a. What hospital activity, costs and income are associated with allogeneic stem cell transplant patients beyond the first 365 days after discharge (and what about activity outside of hospitals)?
b. How do hospital activity and costs vary by patient group, for example by age, original diagnosis, type of allogeneic stem cell transplant, GvHD status and/or socioeconomic background?
3. Further research should also be undertaken to explore how the post-transplant care pathway may help reduce hospital activity and costs. There is more than one way of doing this, but as a guide we recommend:
a. Partnering with a number of providers, including co-designing the research with them
b. Designing an approach to measuring the implementation of the pathway across providers
c. Comparing hospital activity and costs across providers, making sure to take account of key variables such as patient case mix

Confidential – All Rights Reserved 13Analysis of hospital activity, costs and income following allogeneic stem cell transplantation in England |
References and technical notes
References1. British Society of Blood and Marrow Transplantation and Cellular Therapy, document held
on file by Anthony Nolan
2. https://www.anthonynolan.org/patients-and-families/blood-cancers-and-blood-disorders/what-blood-cancer
3. https://www.thelancet.com/journals/lancet/article/PIIS0140-6736(14)61396-9/fulltext#tbl2
4. https://www.cancercenter.com/treatment-options/hematologic-oncology/allogenic-stem-cell-transplant
5. Dignan FL et al, https://www.ncbi.nlm.nih.gov/pubmed/23278853
6. NHS Long term plan, https://www.longtermplan.nhs.uk/
Technical notesa. Market Forces Factor (MFF): the MFF is an index, calculated by NHSE/I as part of the national tariff, which
allows a provider’s location-specific costs to be compared with every other organisation. It has a minimum value of 1.00. For our analysis of costs, we adjusted RMH’s PLICS data using their MFF. RMH’s MFF is 1.20 and the simple mean MFF across all providers is 1.08. We therefore multiplied RMH’s costs by 1.08/1.20 = 0.90 to estimate national averages. More information on the MFF can be found in NHSE/I’s national tariff workbook: improvement.nhs.uk/resources/national-tariff/#h2-annexes
b. Types of hospital activity: elective inpatient spells are planned activities for which patients stay in hospital for one or more nights. Non-elective inpatient spells are unplanned activities for which patients stay in hospital for one or more nights. We have grouped together day cases and regular day attendances; these are both planned activities for which a patient is officially admitted to hospital, but does not stay overnight
c. Costs: costs have been calculated by subdividing hospital activity into categories (transplant spell, other elective and non-elective admissions, day cases and regular day attendances, and outpatient appointments) and then using adjusted RMH PLICS data to identify the corresponding costs for each ‘unit’ of activity. For example:
Total transplant spell costs = number of transplant spells x average transplant spell cost (as per adjusted RMH PLICS data)
Confidential – All Rights Reserved 14Analysis of hospital activity, costs and income following allogeneic stem cell transplantation in England |
Notes
EY | Assurance | Tax | Transactions | Advisory
About EY
EY is a global leader in assurance, tax, transaction and advisory services. The insights and quality services we deliver help build trust and confidence in the capital markets and in economies the world over. We develop outstanding leaders who team to deliver on our promises to all of our stakeholders. In so doing, we play a critical role in building a better working world for our people, for our clients and for our communities.
EY refers to the global organization, and may refer to one or more, of the member firms of Ernst & Young Global Limited, each of which is a separate legal entity. Ernst & Young Global Limited, a UK company limited by guarantee, does not provide services to clients. Information about how EY collects and uses personal data and a description of the rights individuals have under data protection legislation are available via ey.com/privacy. For more information about our organization, please visit ey.com.
Ernst & Young LLP
The UK firm Ernst & Young LLP is a limited liability partnership registered in England and Wales with
registered number OC300001 and is a member firm of Ernst & Young Global Limited.
Ernst & Young LLP, 1 More London Place, London, SE1 2AF.
© 2020 Ernst & Young LLP. Published in the UK.
All Rights Reserved.
EY-000120710-01 (UK) 05/20. CSG London.
ED None
In line with EY’s commitment to minimise its impact on the environment, this document has been printed on paper with a high recycled content.
Information in this publication is intended to provide only a general outline of the subjects covered. It should neither be regarded as comprehensive nor sufficient for making decisions, nor should it be used in place of professional advice. Ernst & Young LLP accepts no responsibility for any loss arising from any action taken or not taken by anyone using this material.
ey.com/uk