Embed Size (px)
Citation preview
Analysis of HDFS Under HBase A Facebook Messages Case Study
Tyler Harter, Dhruba Borthakur*, Siying Dong*, Amitanand Aiyer*, Liyin Tang*, Andrea C. Arpaci-Dusseau, Remzi H. Arpaci-Dusseau
University of Wisconsin-Madison *Facebook Inc.
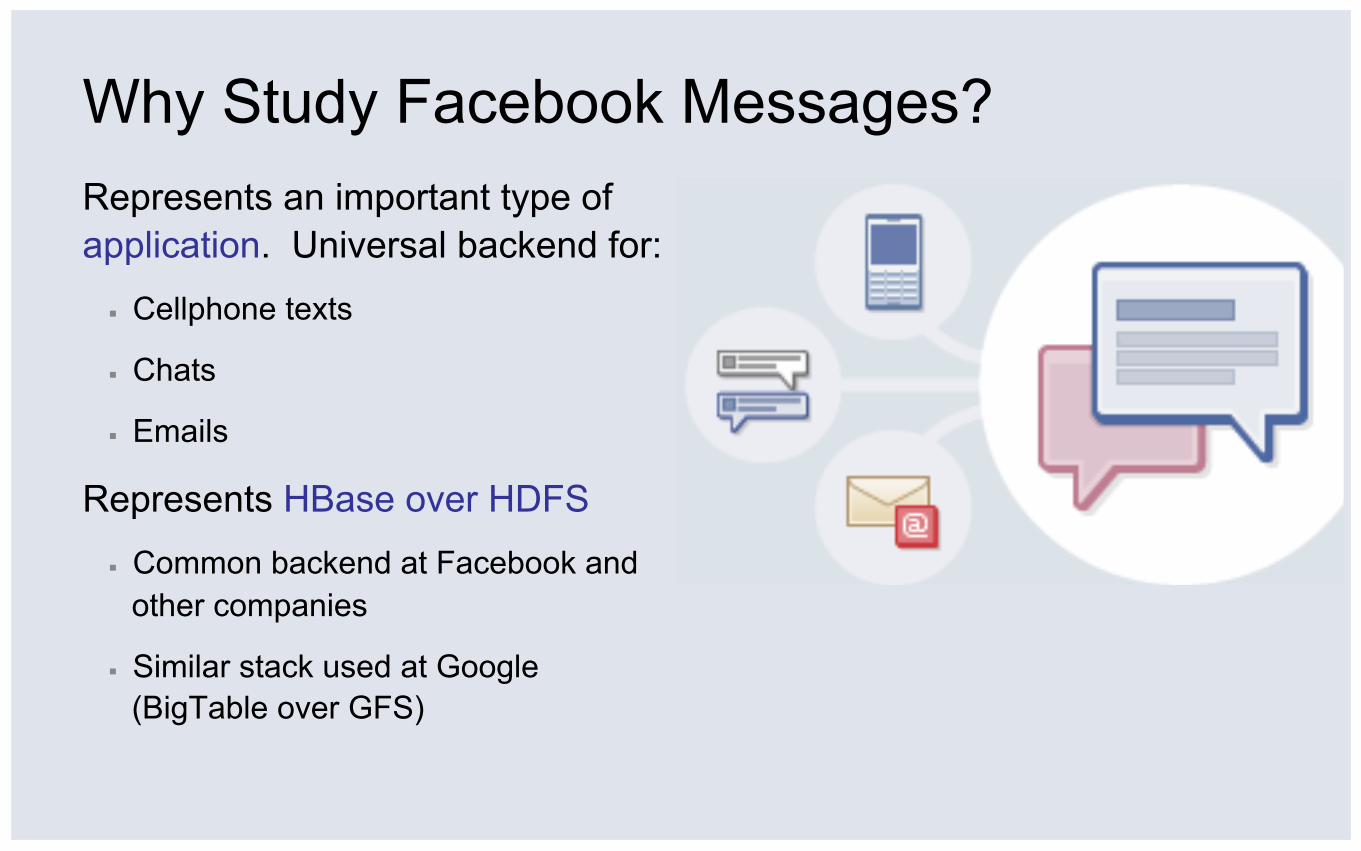
Why Study Facebook Messages? Represents an important type of application. Universal backend for:
▪ Cellphone texts
▪ Chats
▪ Emails
Why Study Facebook Messages? Represents an important type of application. Universal backend for:
▪ Cellphone texts
▪ Chats
▪ Emails
Why Study Facebook Messages? Represents an important type of application. Universal backend for:
▪ Cellphone texts
▪ Chats
▪ Emails
Why Study Facebook Messages? Represents an important type of application. Universal backend for:
▪ Cellphone texts
▪ Chats
▪ Emails
Why Study Facebook Messages? Represents an important type of application. Universal backend for:
▪ Cellphone texts
▪ Chats
▪ Emails
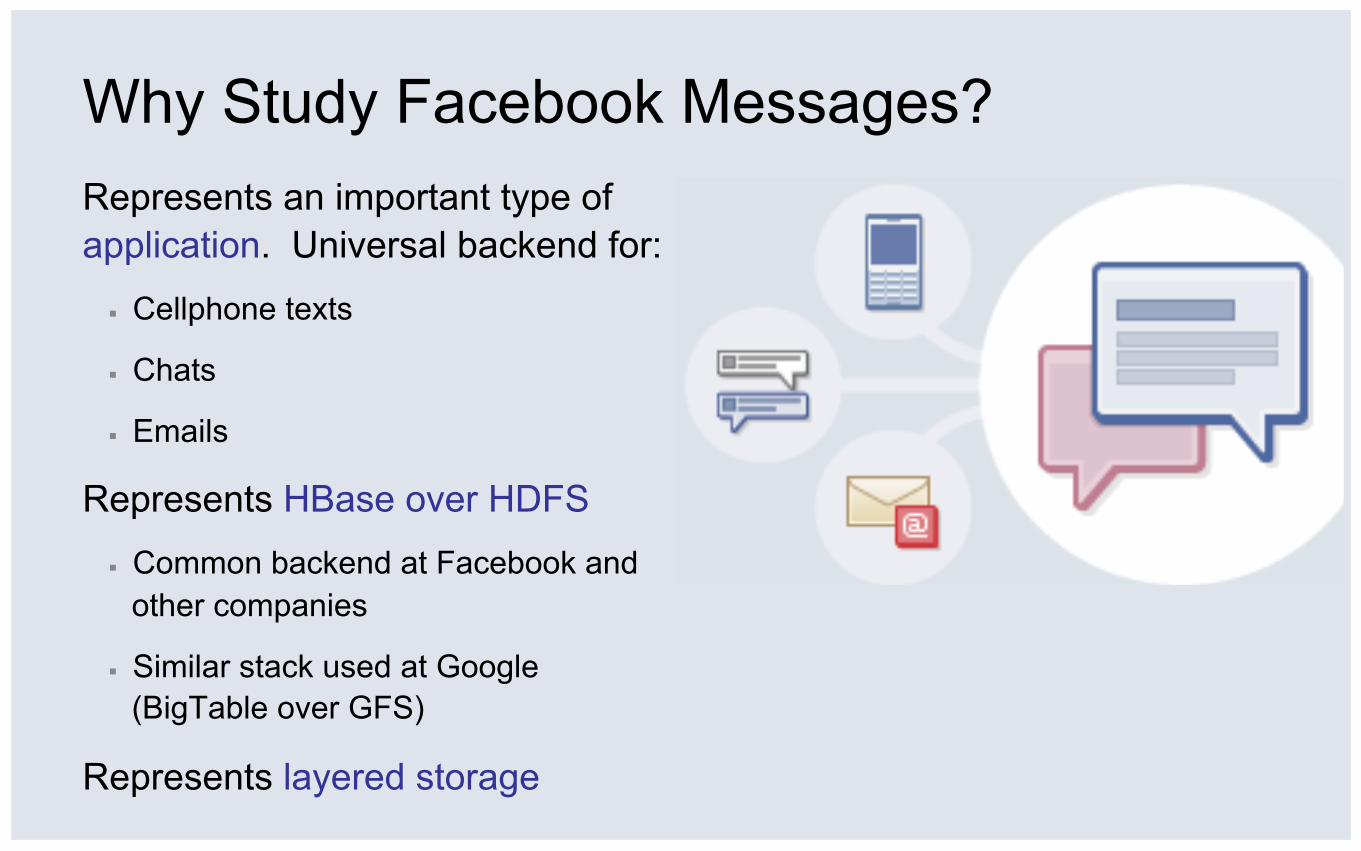
Represents HBase over HDFS
▪ Common backend at Facebook and other companies
▪ Similar stack used at Google (BigTable over GFS)
Why Study Facebook Messages? Represents an important type of application. Universal backend for:
▪ Cellphone texts
▪ Chats
▪ Emails
Represents HBase over HDFS
▪ Common backend at Facebook and other companies
▪ Similar stack used at Google (BigTable over GFS)
Represents layered storage
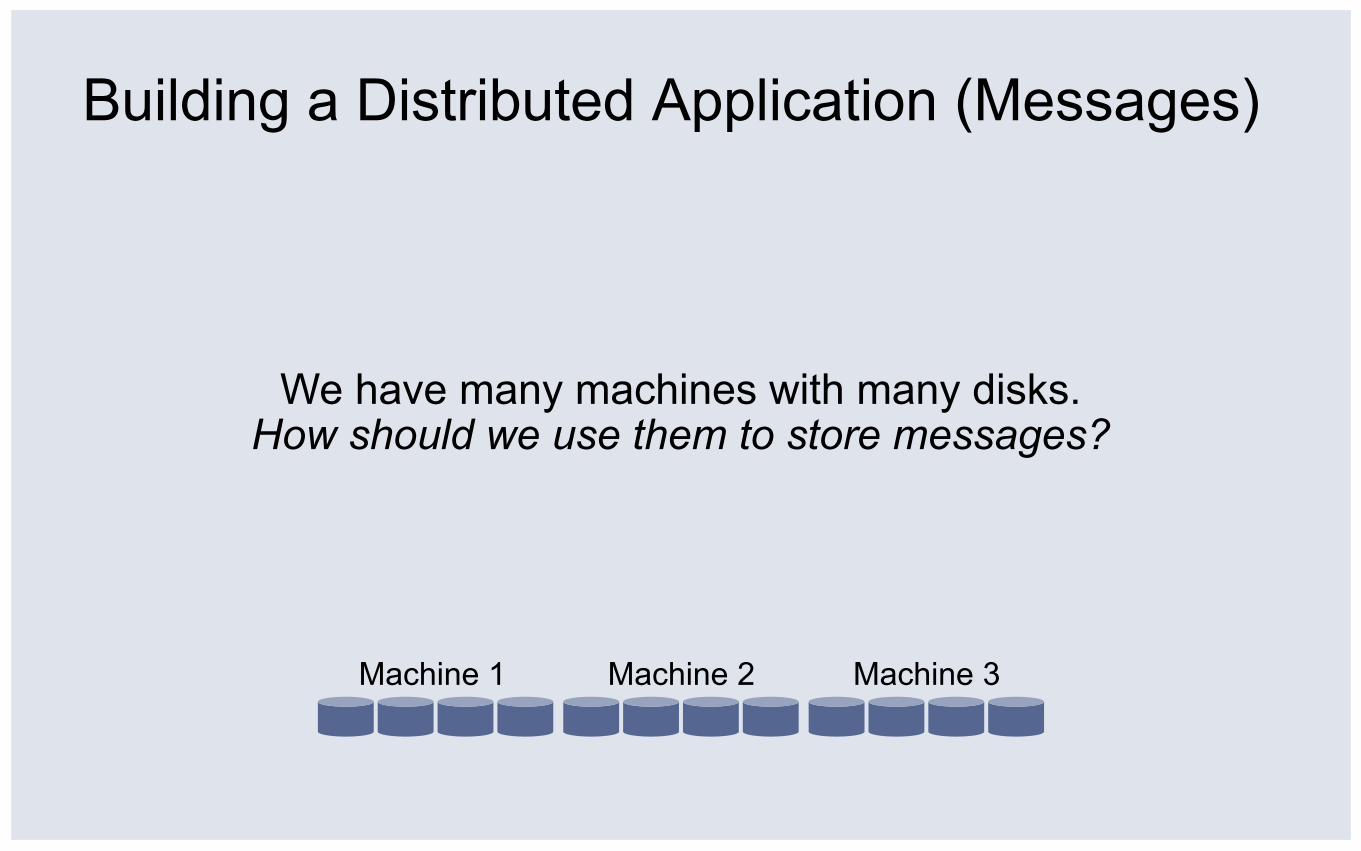
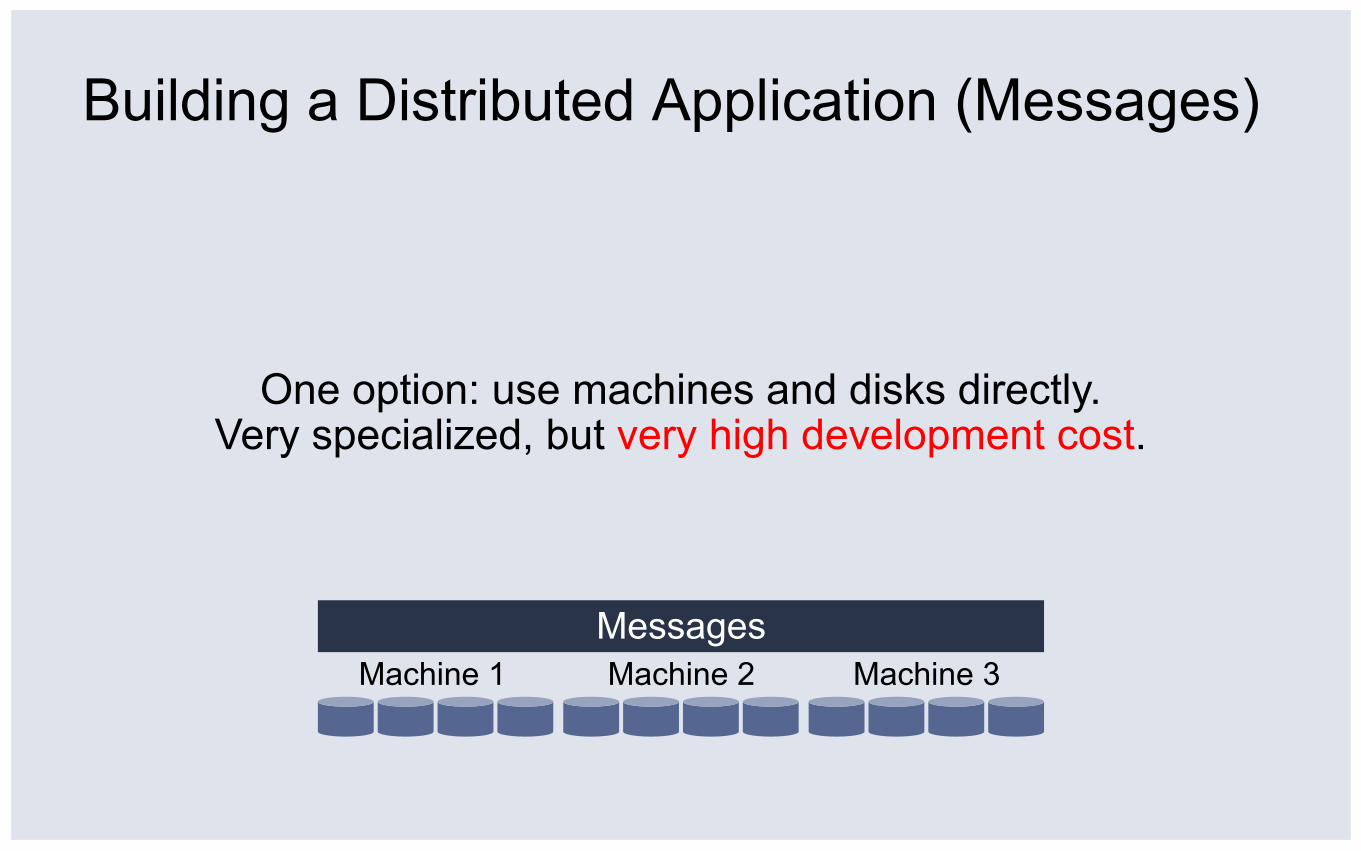
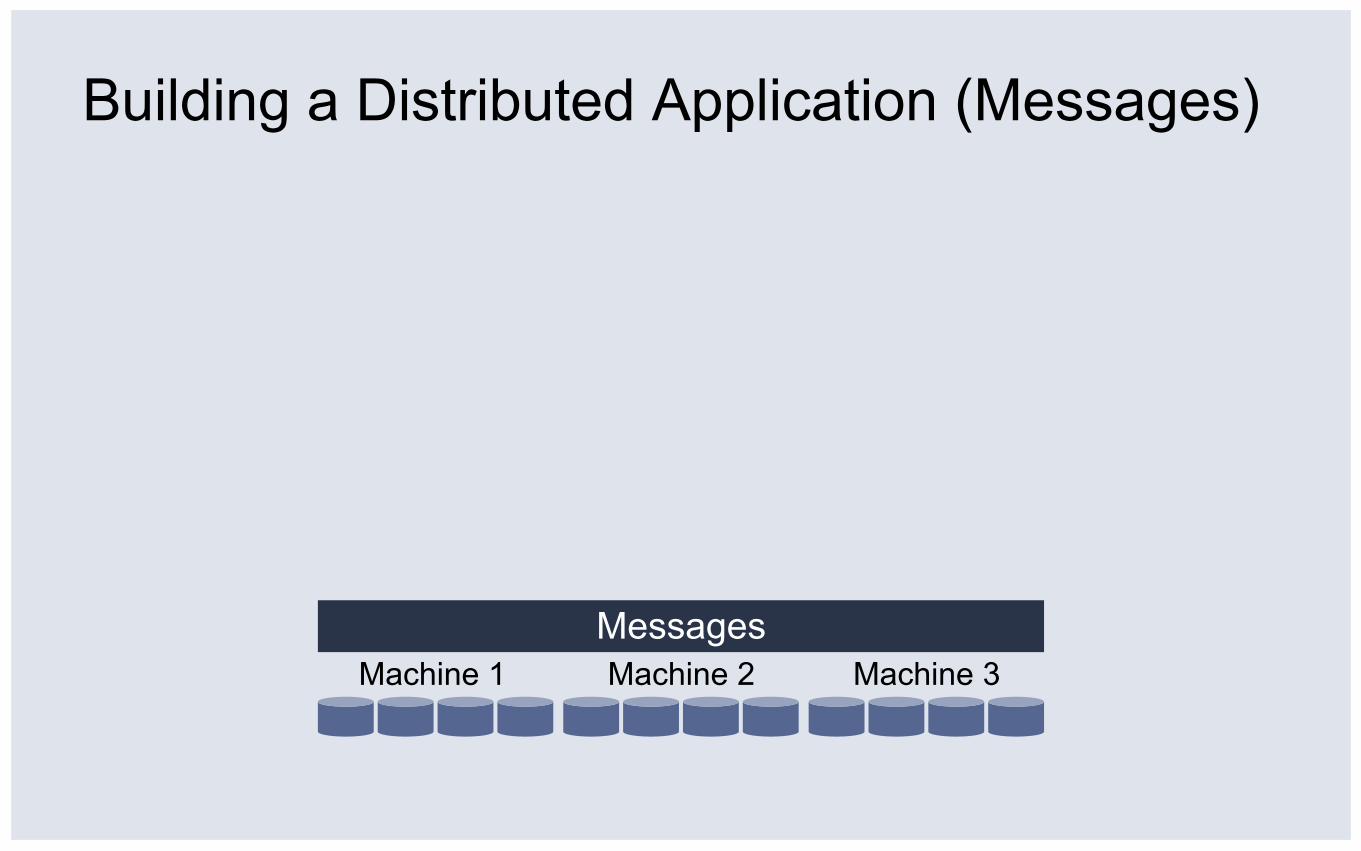
Building a Distributed Application (Messages)
We have many machines with many disks. How should we use them to store messages?
Machine 1 Machine 3 Machine 2
Building a Distributed Application (Messages)
Messages
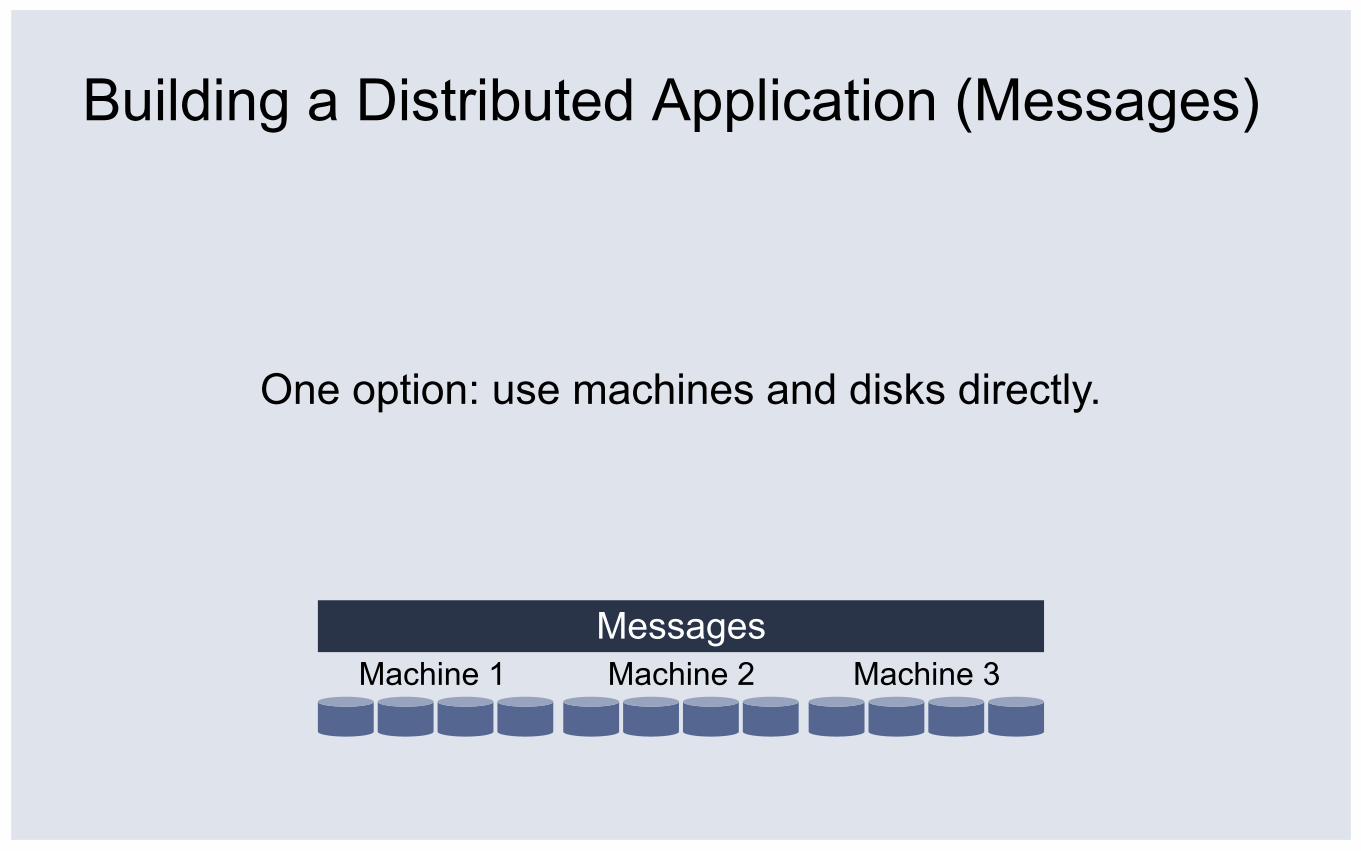
One option: use machines and disks directly.
Machine 1 Machine 3 Machine 2
Building a Distributed Application (Messages)
One option: use machines and disks directly. Very specialized, but very high development cost.
Messages Machine 1 Machine 3 Machine 2
Building a Distributed Application (Messages)
Messages Machine 1 Machine 3 Machine 2
Building a Distributed Application (Messages)
HBase Messages
Machine 1 Machine 3 Machine 2
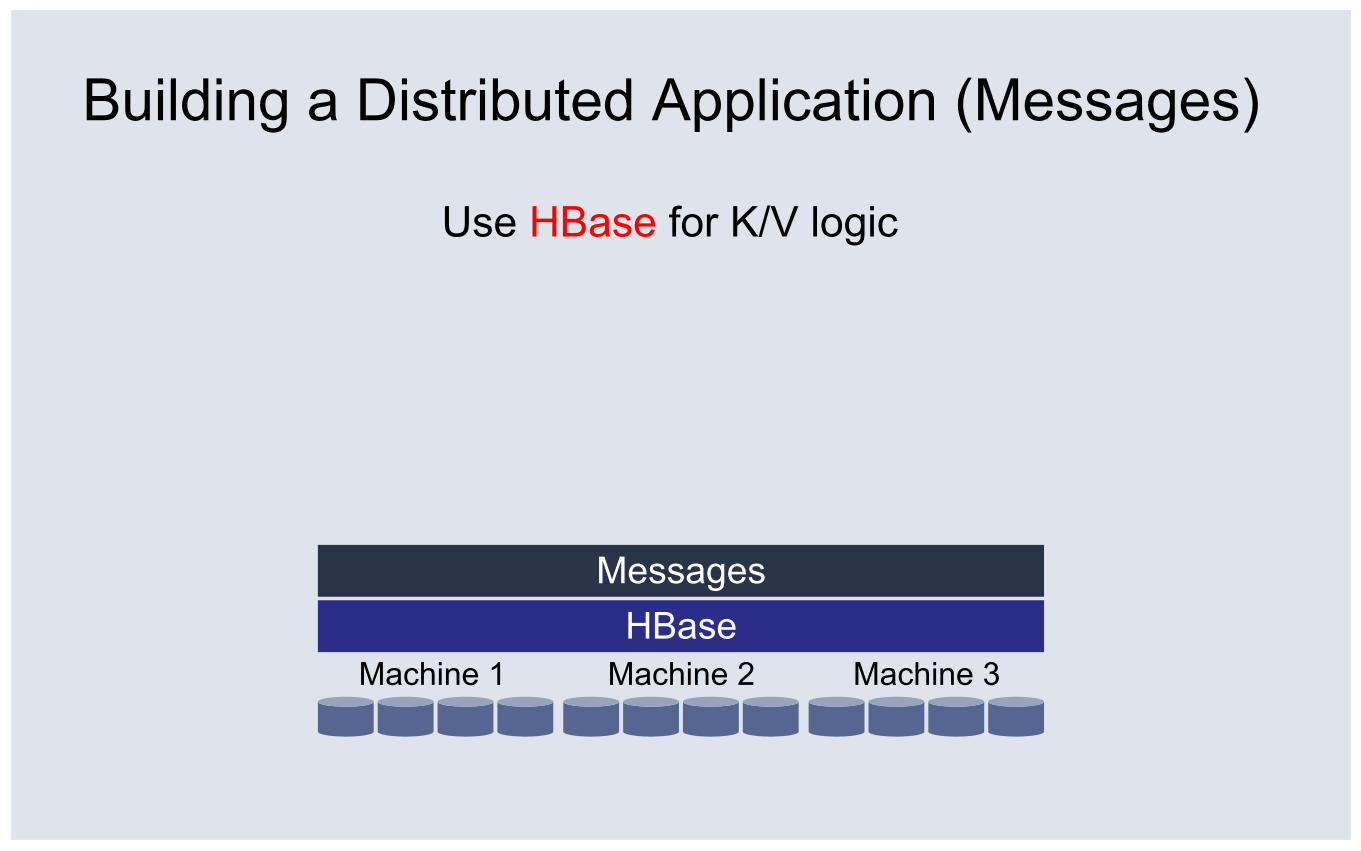
Use HBase for K/V logic
Worker Hadoop File System
Messages HBase
Worker Worker Machine 1 Machine 3 Machine 2
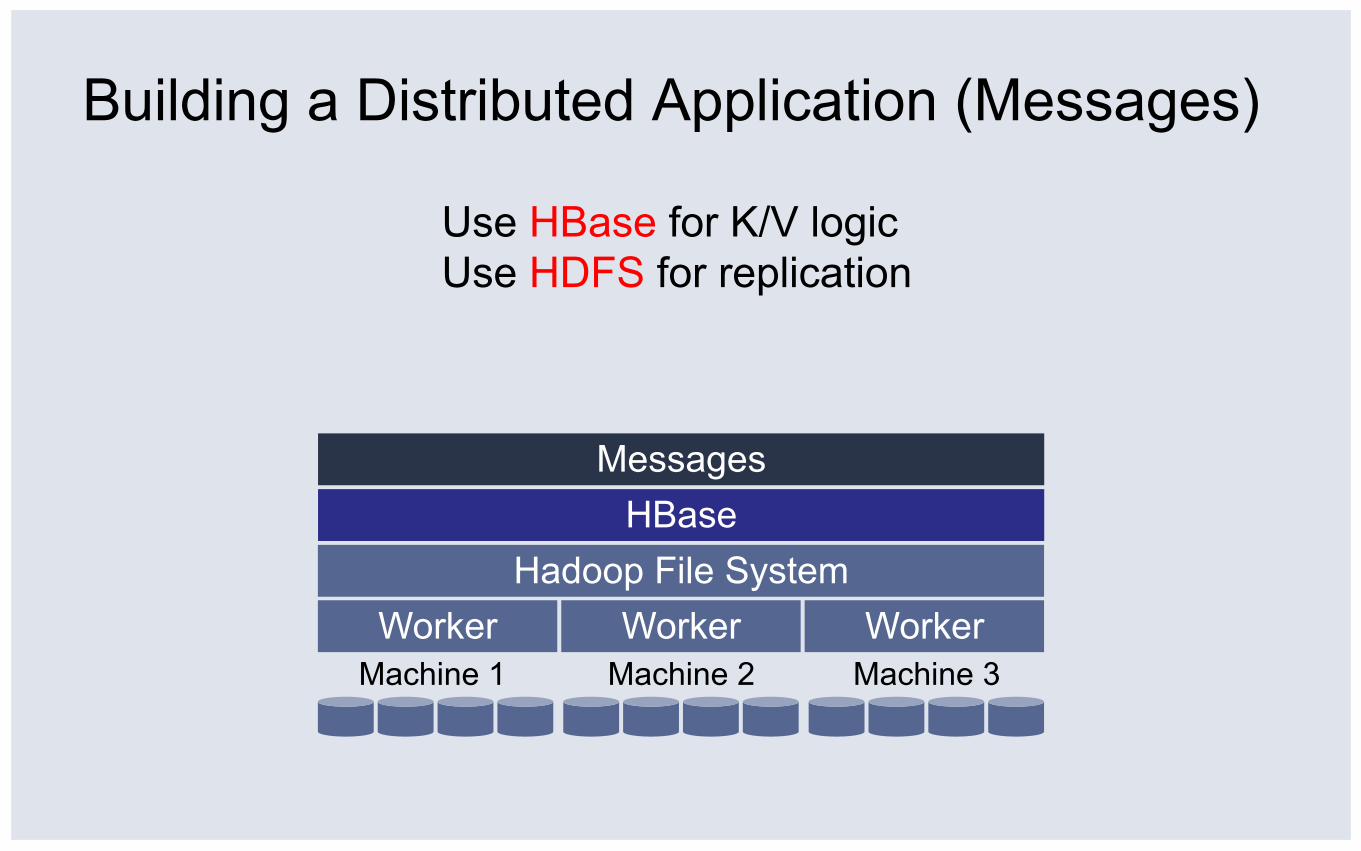
Use HBase for K/V logic Use HDFS for replication
Building a Distributed Application (Messages)
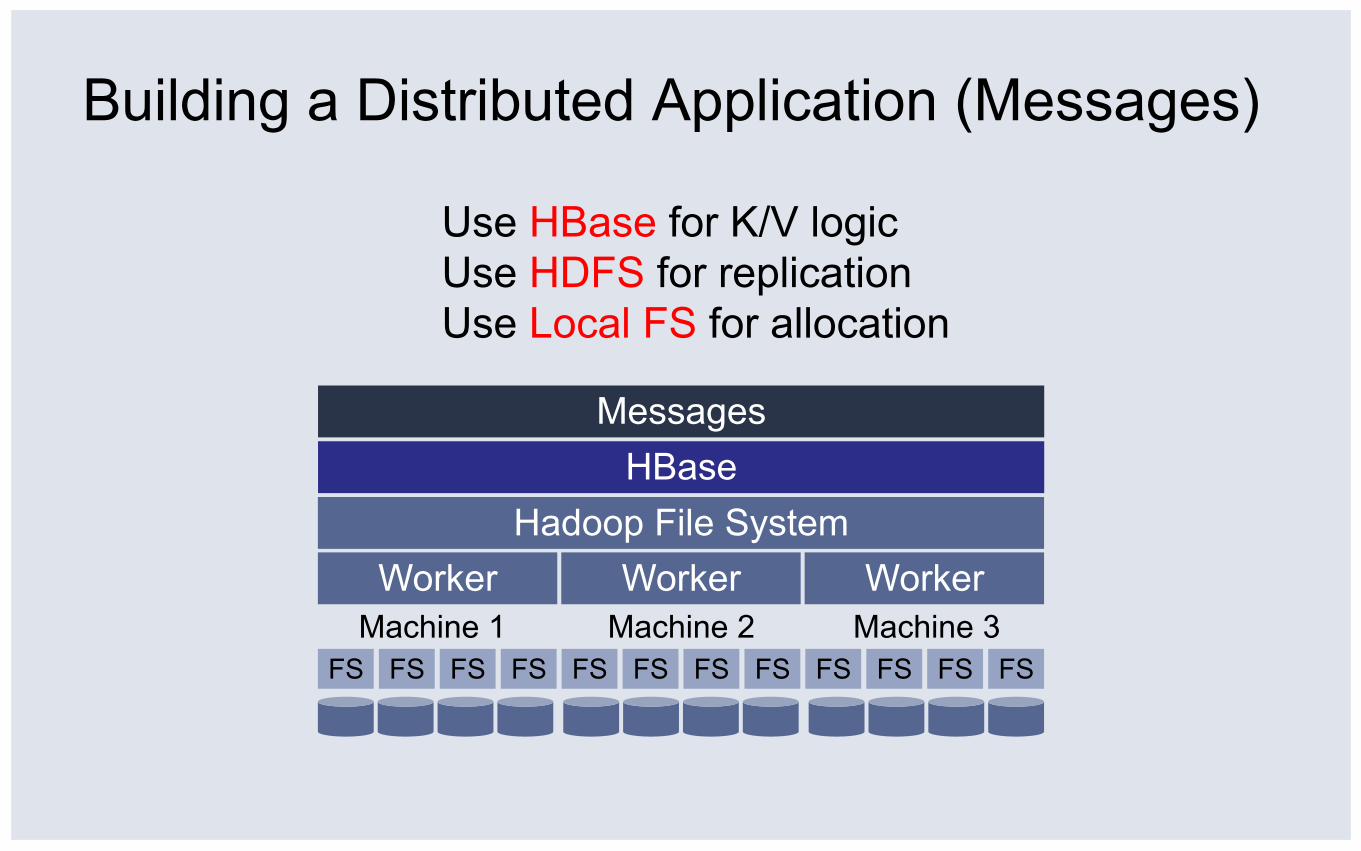
Worker Hadoop File System
Messages HBase
Worker Worker Machine 1 Machine 3 Machine 2
Building a Distributed Application (Messages)
FS FS FS FS FS FS FS FS FS FS FS FS
Use HBase for K/V logic Use HDFS for replication Use Local FS for allocation
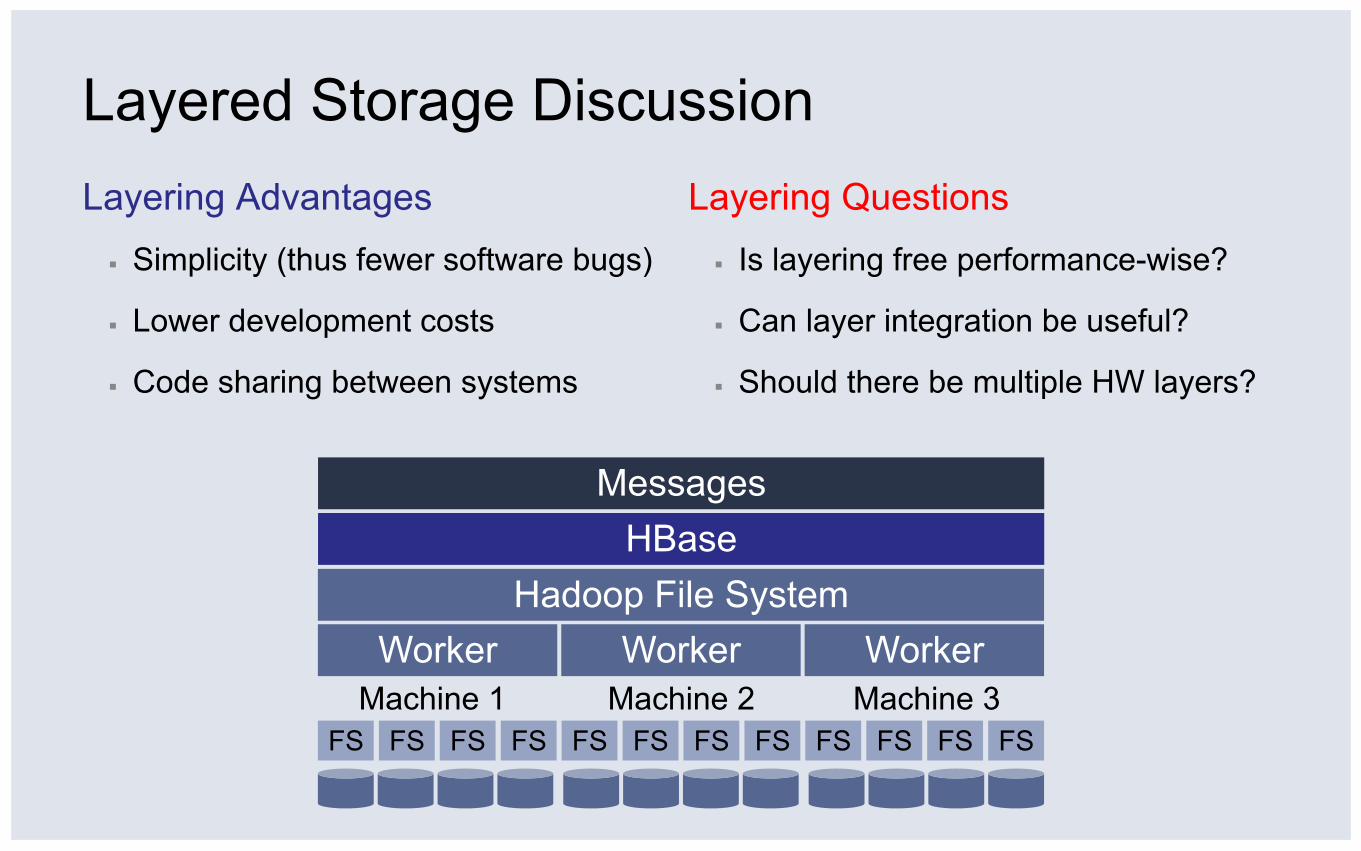
Layered Storage Discussion Layering Questions ▪ Is layering free performance-wise?
▪ Can layer integration be useful?
▪ Should there be multiple HW layers?
Layering Advantages ▪ Simplicity (thus fewer software bugs)
▪ Lower development costs
▪ Code sharing between systems
Worker Hadoop File System
Messages HBase
Worker Worker Machine 1 Machine 3 Machine 2
FS FS FS FS FS FS FS FS FS FS FS FS
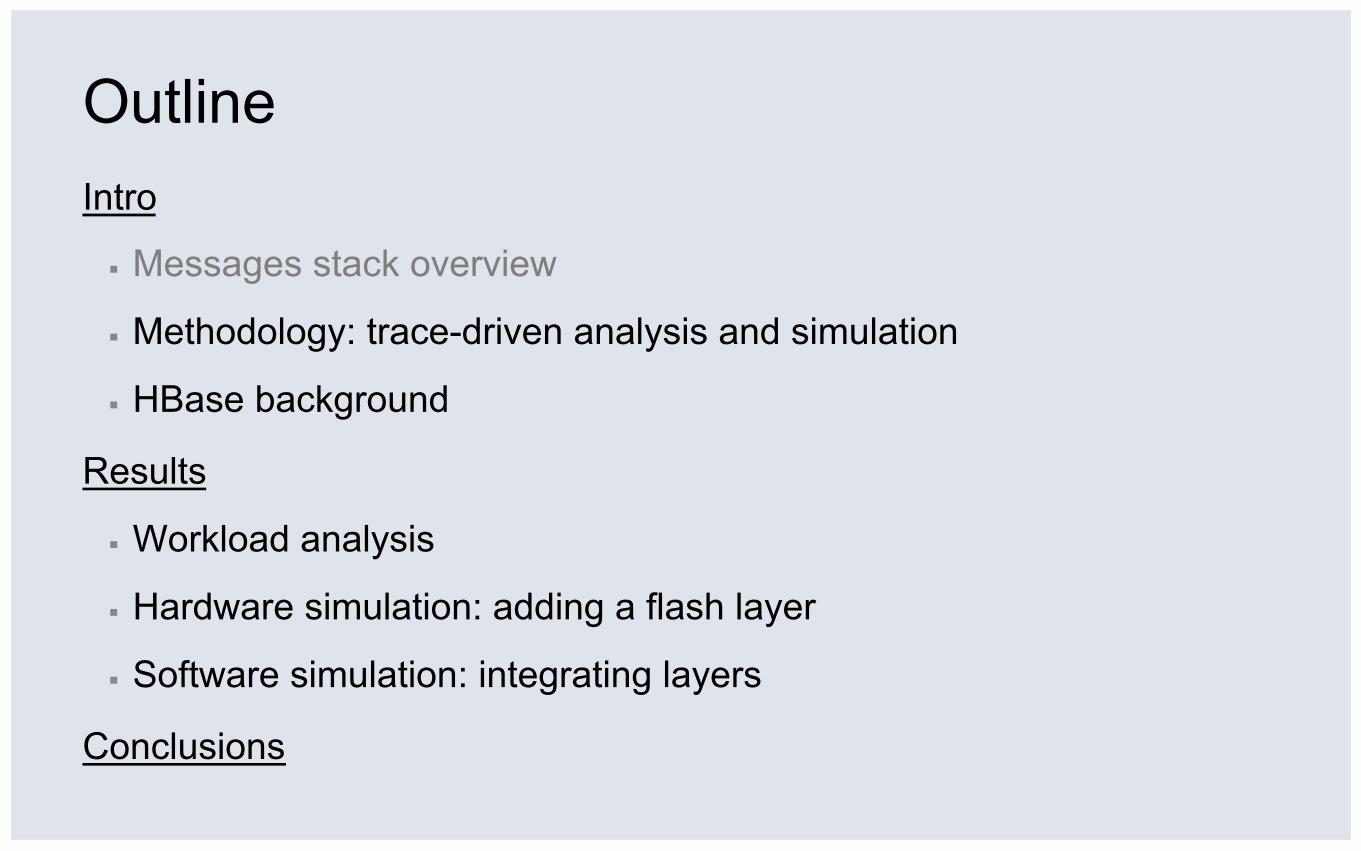
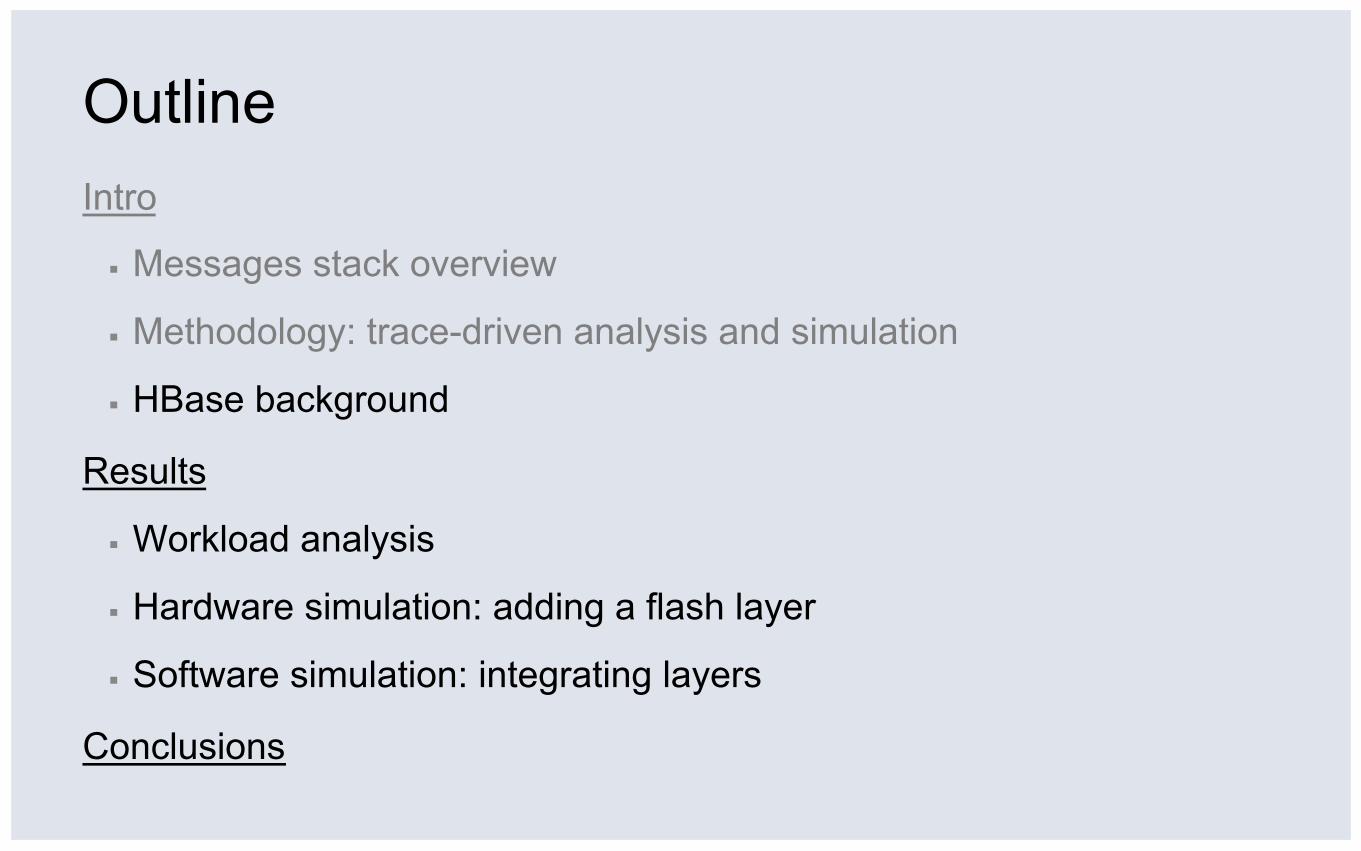
Outline Intro
▪ Messages stack overview
▪ Methodology: trace-driven analysis and simulation
▪ HBase background
Results
▪ Workload analysis
▪ Hardware simulation: adding a flash layer
▪ Software simulation: integrating layers
Conclusions
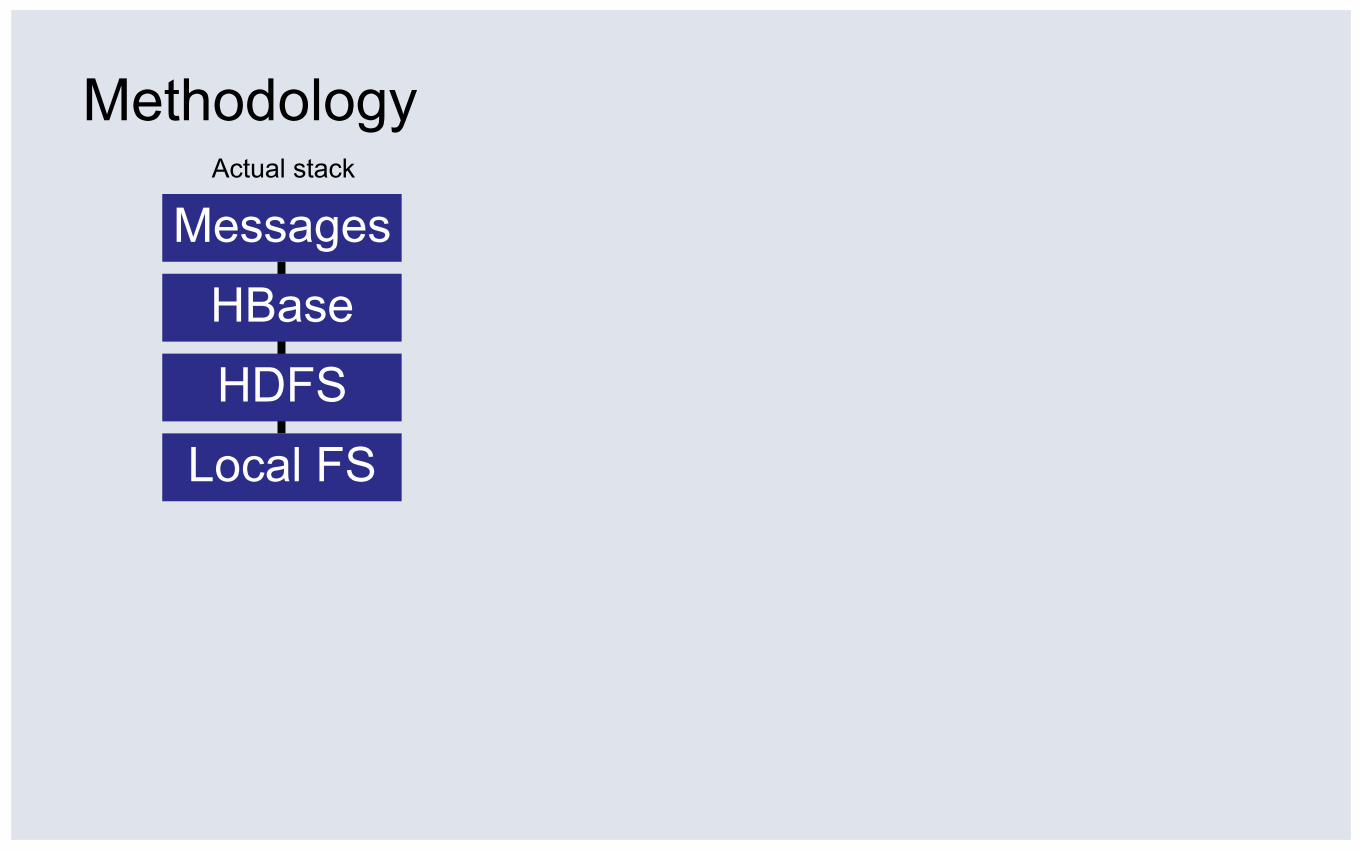
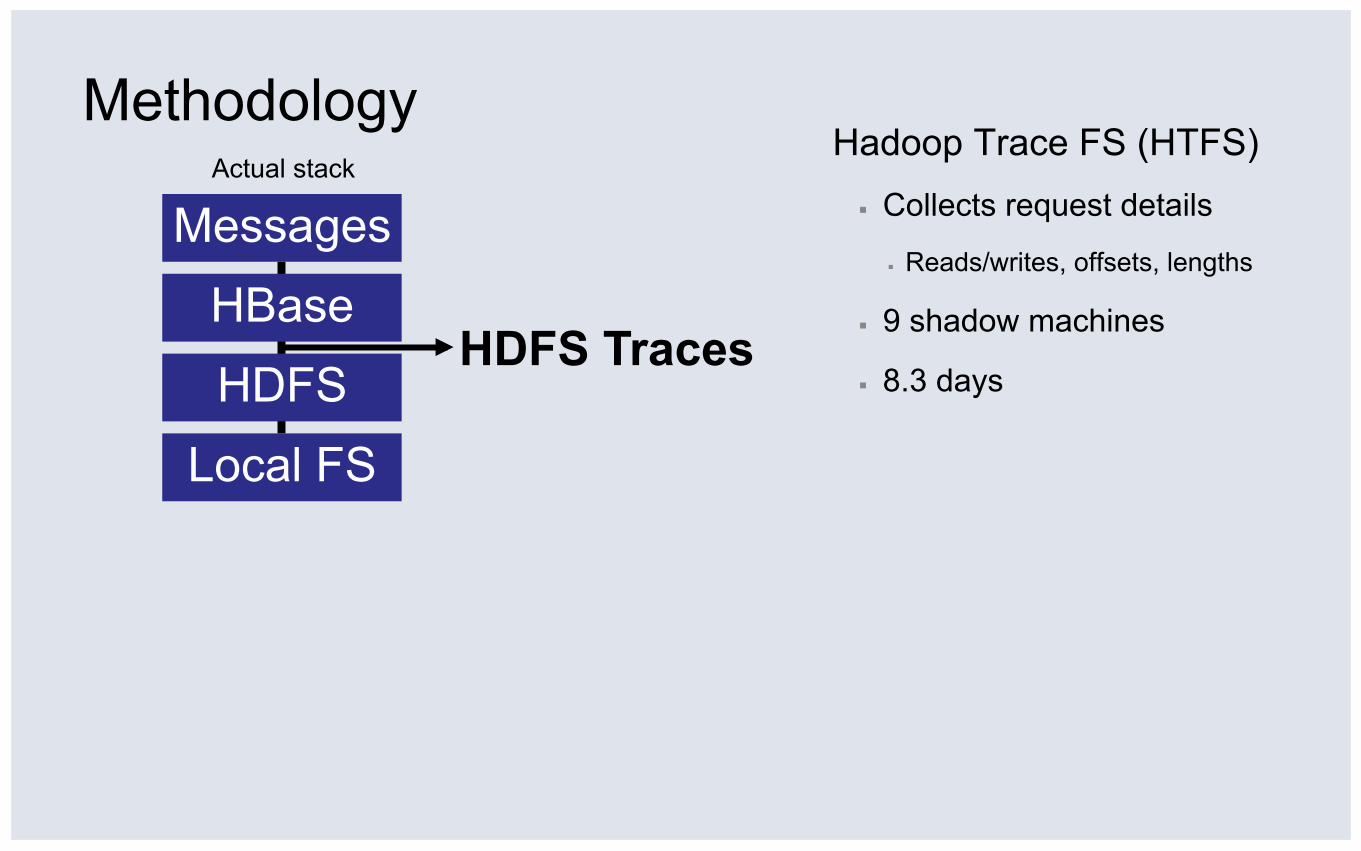
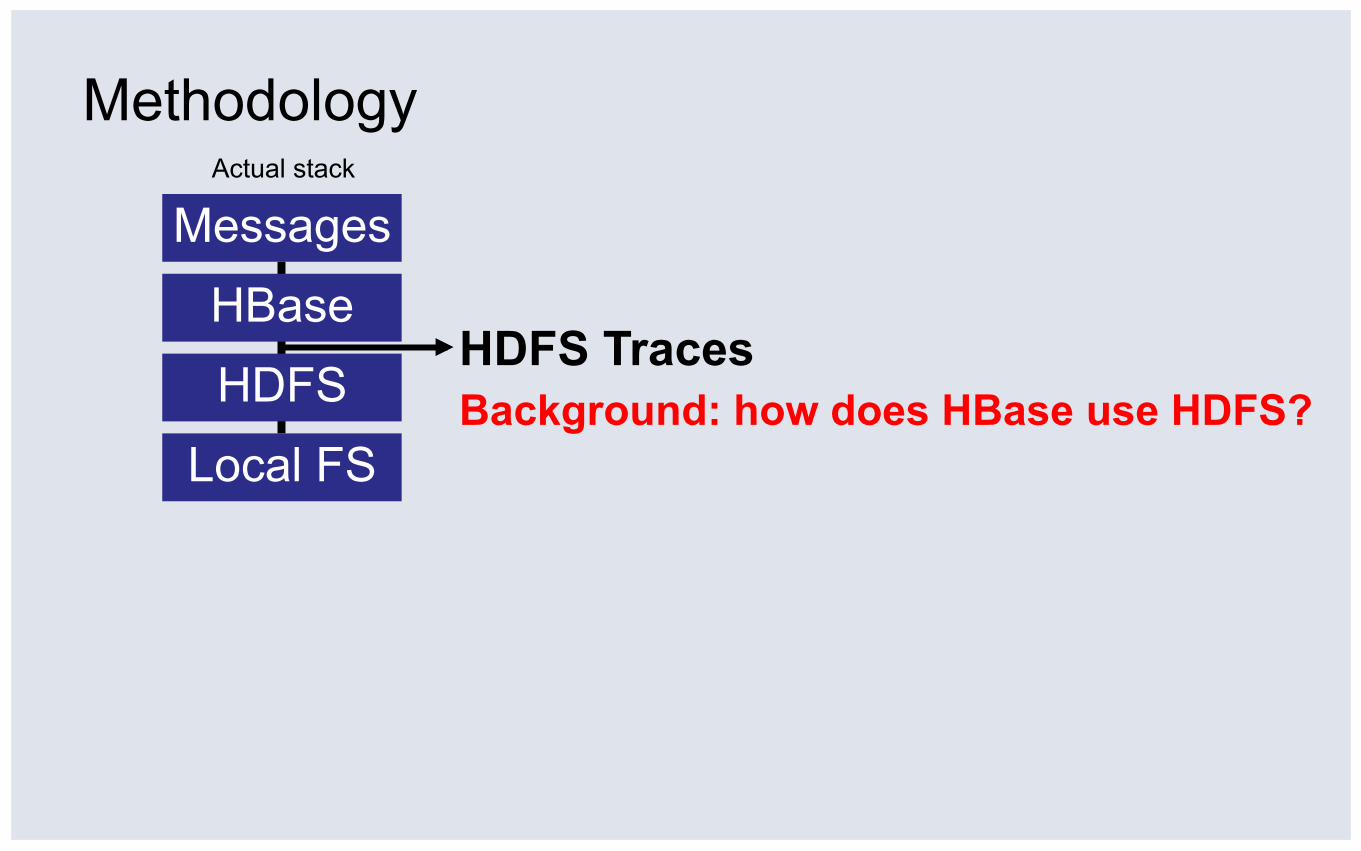
Methodology
Messages
HBase
HDFS
Local FS
Actual stack
Methodology
Messages
HBase
HDFS
Local FS
HDFS Traces
Hadoop Trace FS (HTFS) ▪ Collects request details
▪ Reads/writes, offsets, lengths
▪ 9 shadow machines
▪ 8.3 days
Actual stack
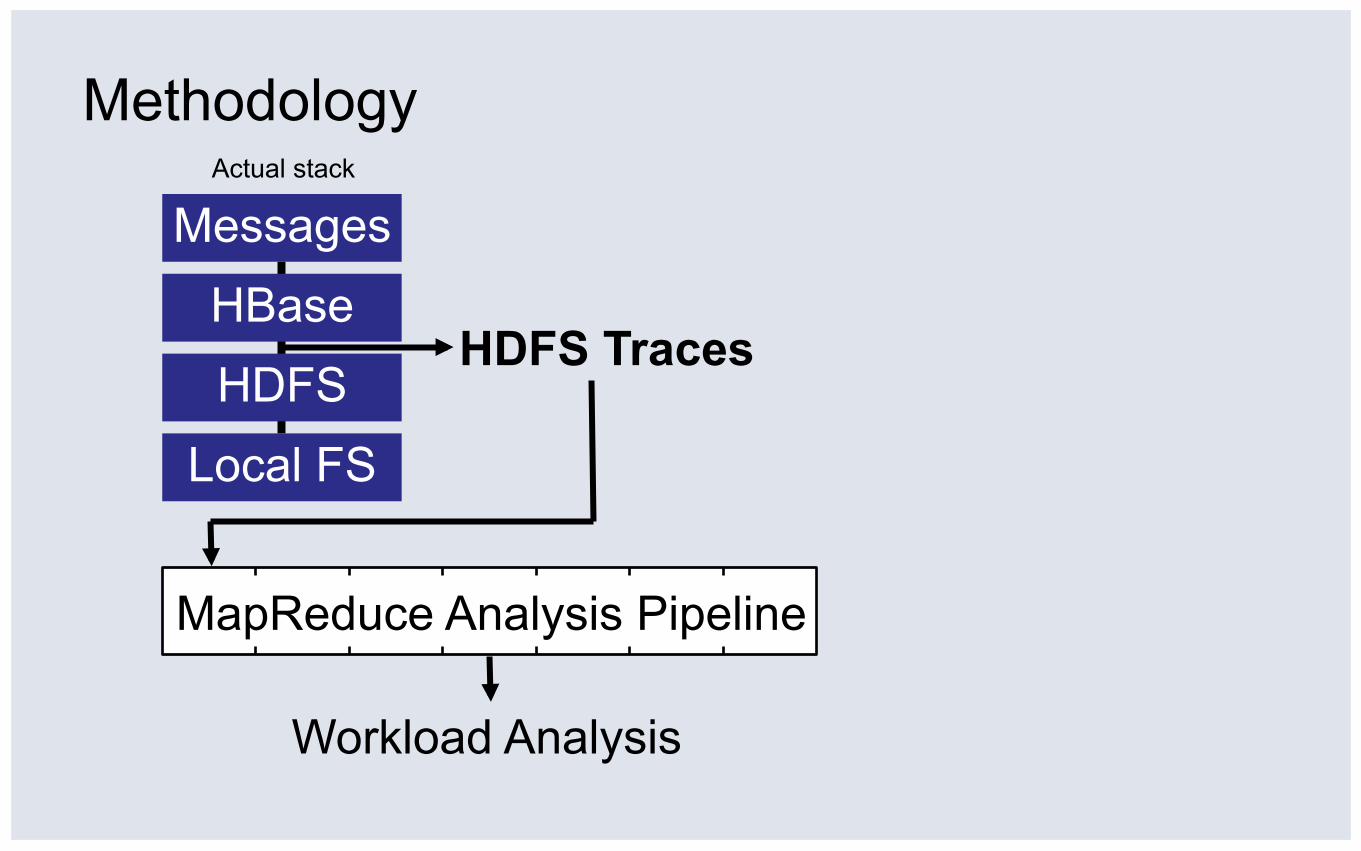
Methodology
Messages
HBase
HDFS
Local FS
HDFS Traces
MapReduce Analysis Pipeline
Workload Analysis
Actual stack
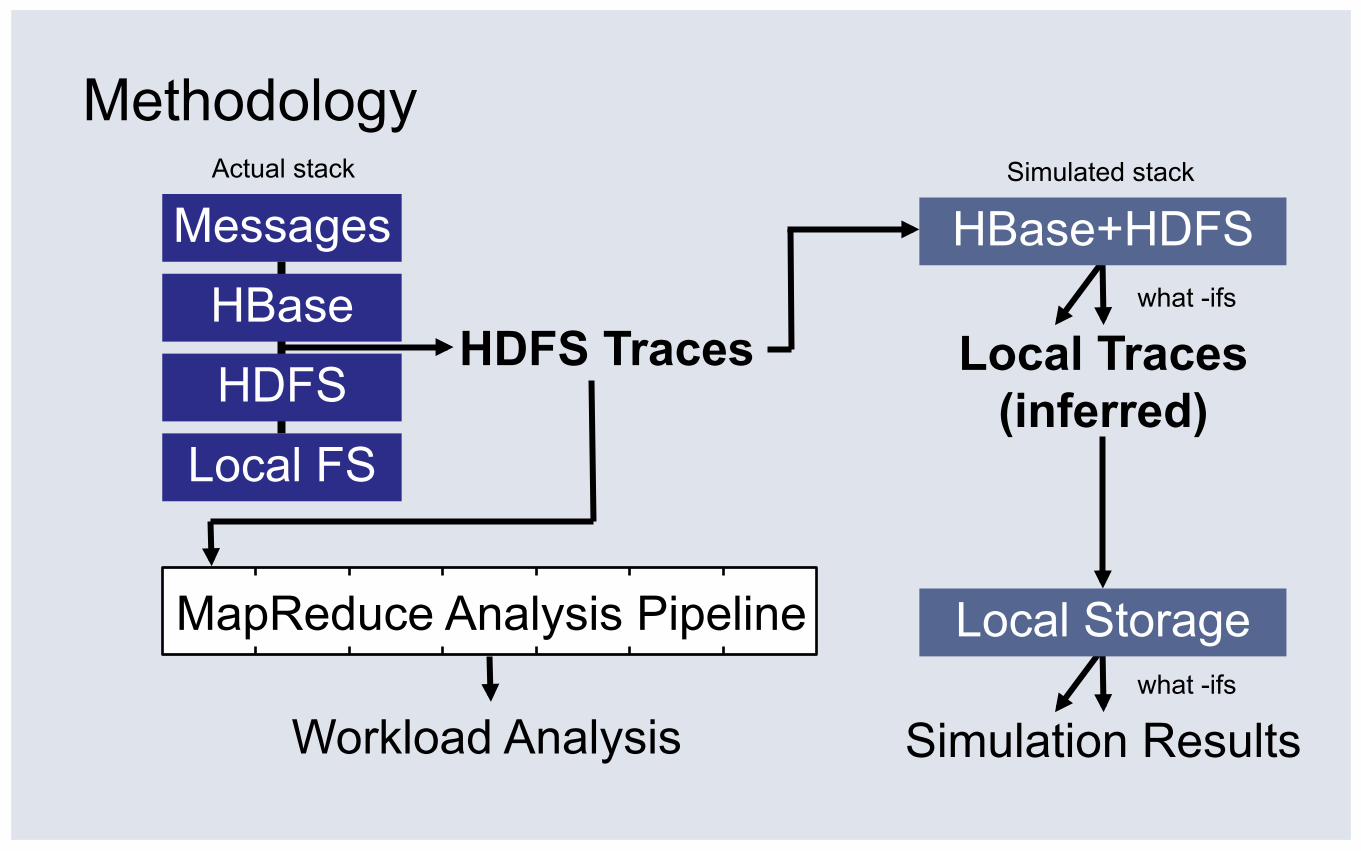
Methodology
Messages
HBase
HDFS
Local FS
HDFS Traces
MapReduce Analysis Pipeline
Workload Analysis
HBase+HDFS Actual stack Simulated stack
Local Traces (inferred)
what -ifs
Local Storage what -ifs
Simulation Results
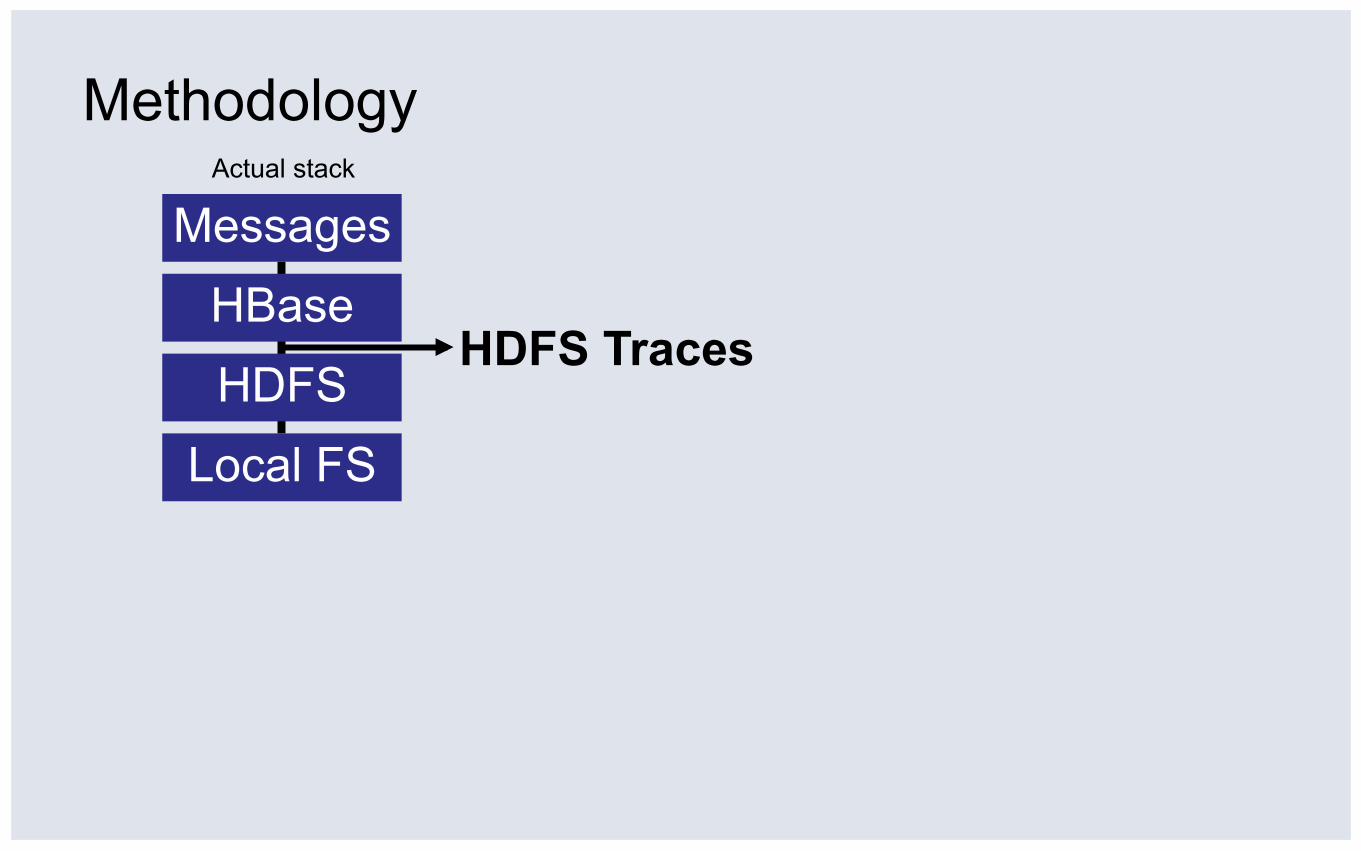
Methodology
Messages
HBase
HDFS
Local FS
HDFS Traces
Actual stack
Methodology
Messages
HBase
HDFS
Local FS Background: how does HBase use HDFS?
Actual stack
HDFS Traces
Outline Intro
▪ Messages stack overview
▪ Methodology: trace-driven analysis and simulation
▪ HBase background
Results
▪ Workload analysis
▪ Hardware simulation: adding a flash layer
▪ Software simulation: integrating layers
Conclusions
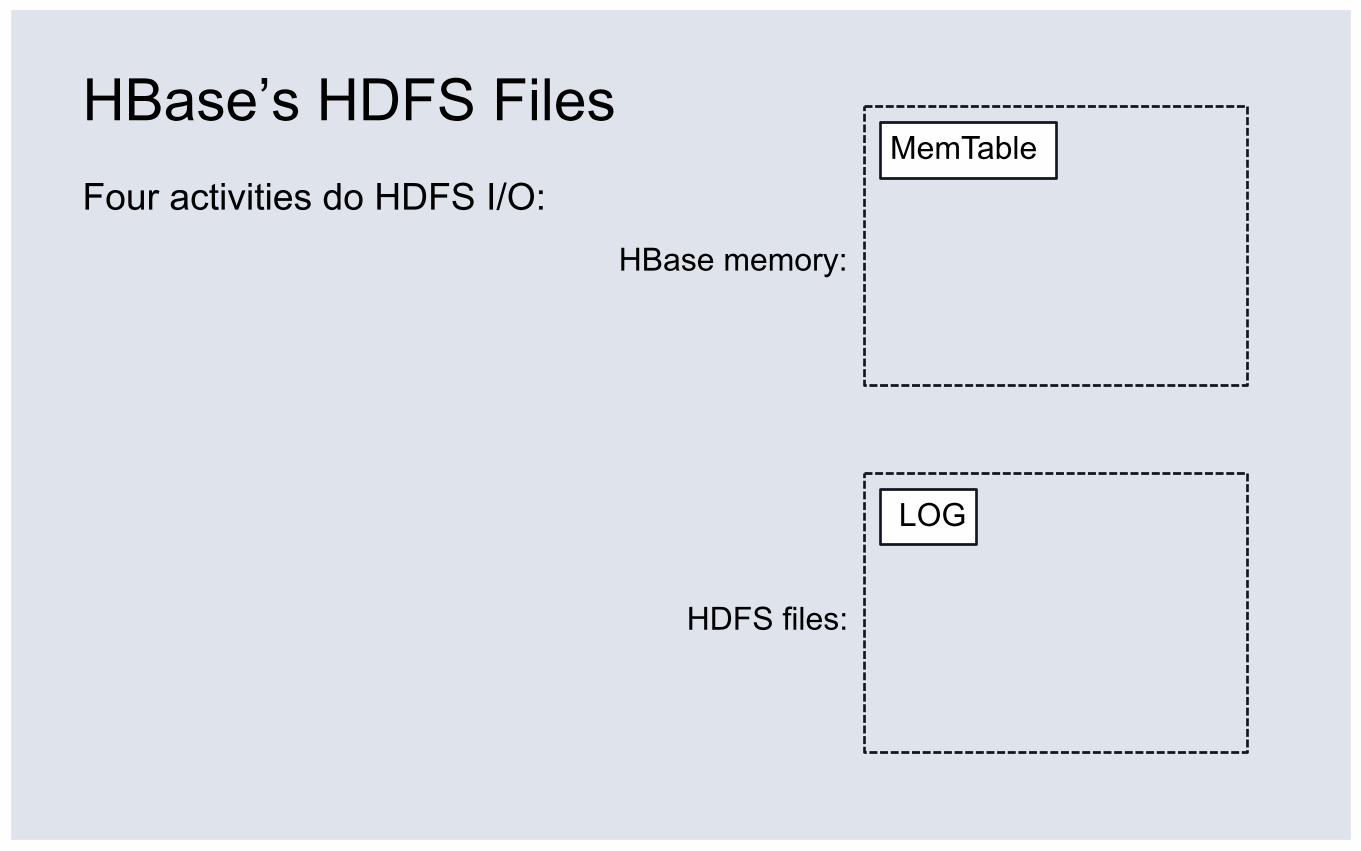
HBase’s HDFS Files Four activities do HDFS I/O:
HDFS files:
HBase memory:
MemTable
LOG
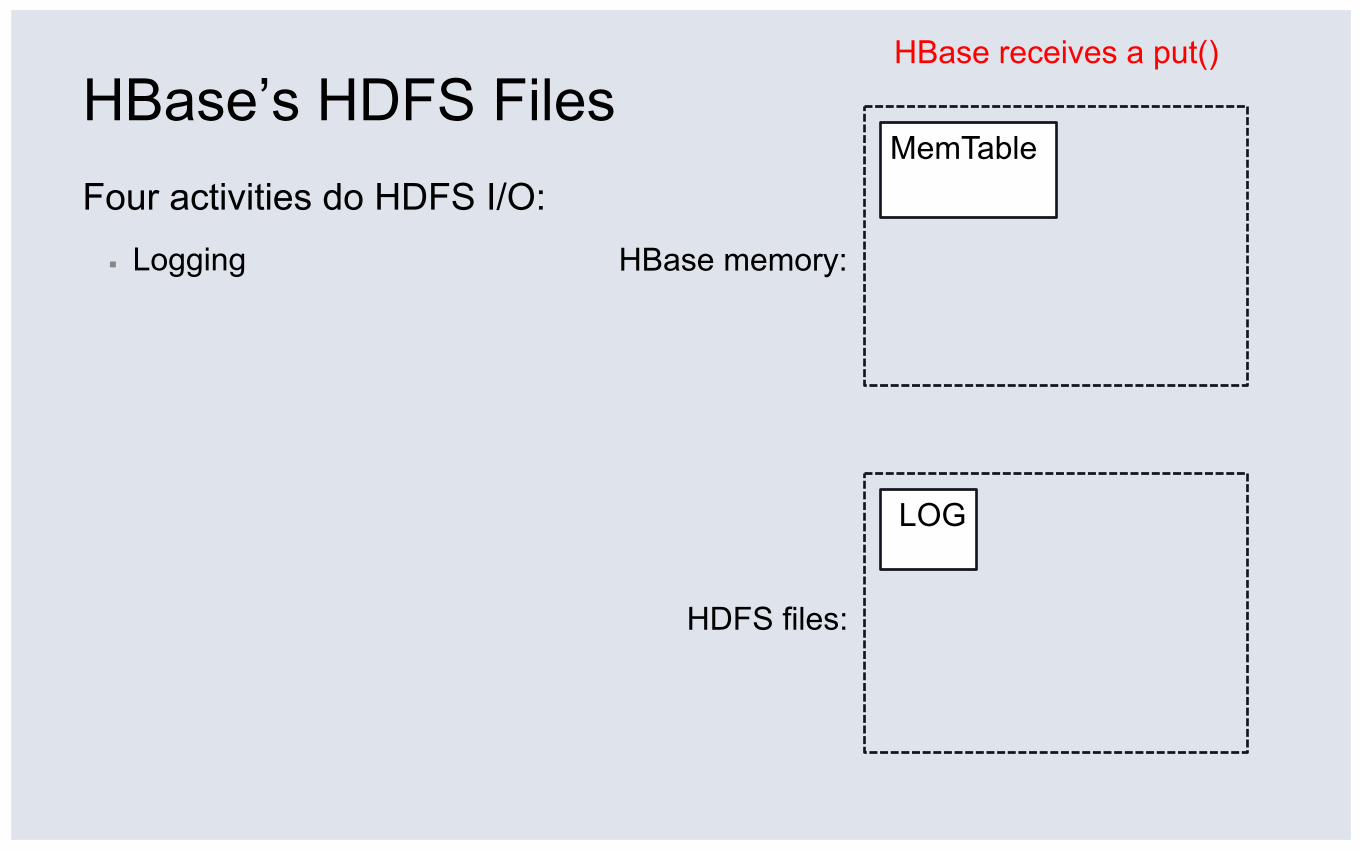
Four activities do HDFS I/O: ▪ Logging
HDFS files:
HBase memory:
MemTable
HBase receives a put()
LOG
HBase’s HDFS Files
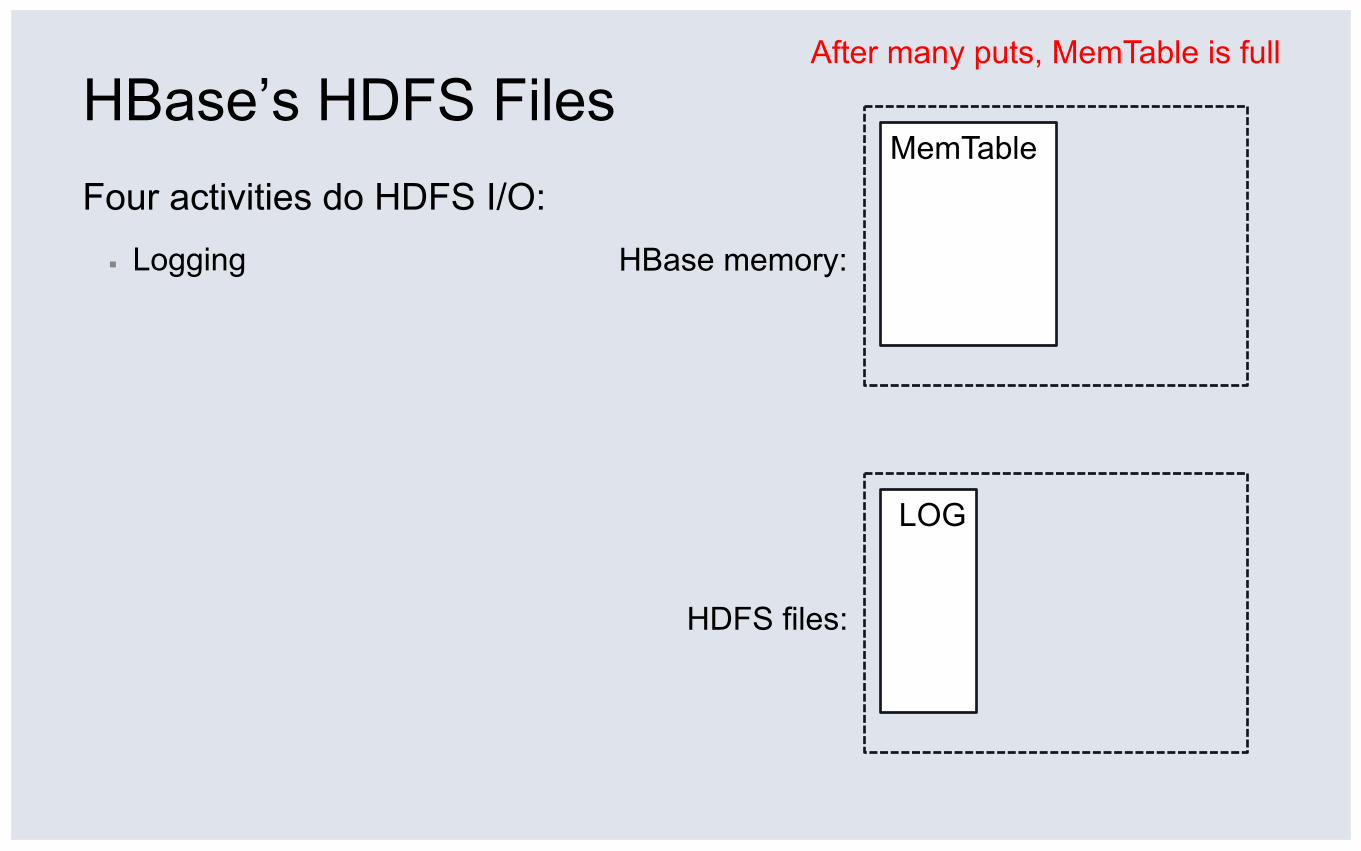
HBase’s HDFS Files Four activities do HDFS I/O: ▪ Logging
HDFS files:
HBase memory:
MemTable
After many puts, MemTable is full
LOG
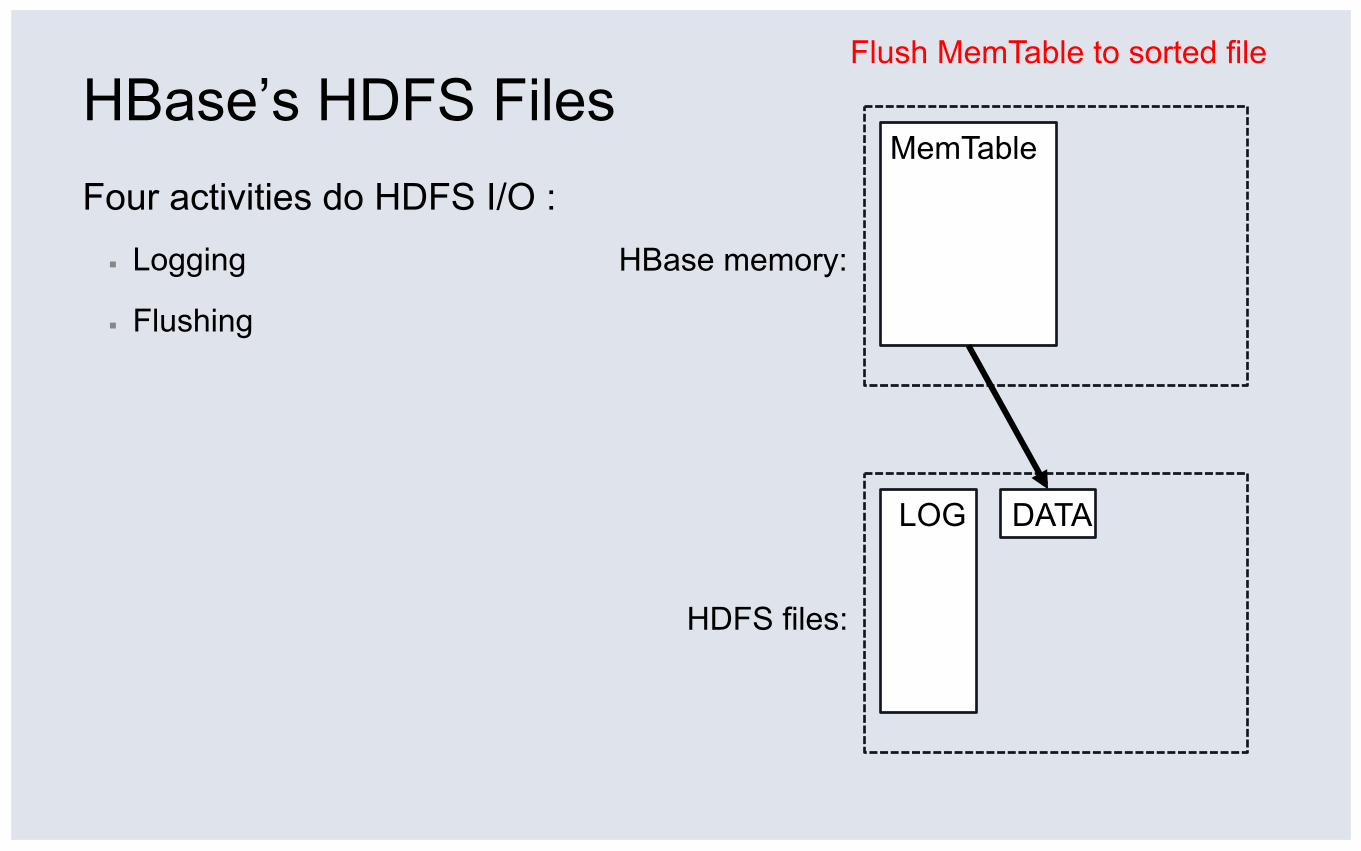
HBase’s HDFS Files Four activities do HDFS I/O : ▪ Logging
▪ Flushing
HDFS files:
HBase memory:
MemTable
Flush MemTable to sorted file
DATA LOG
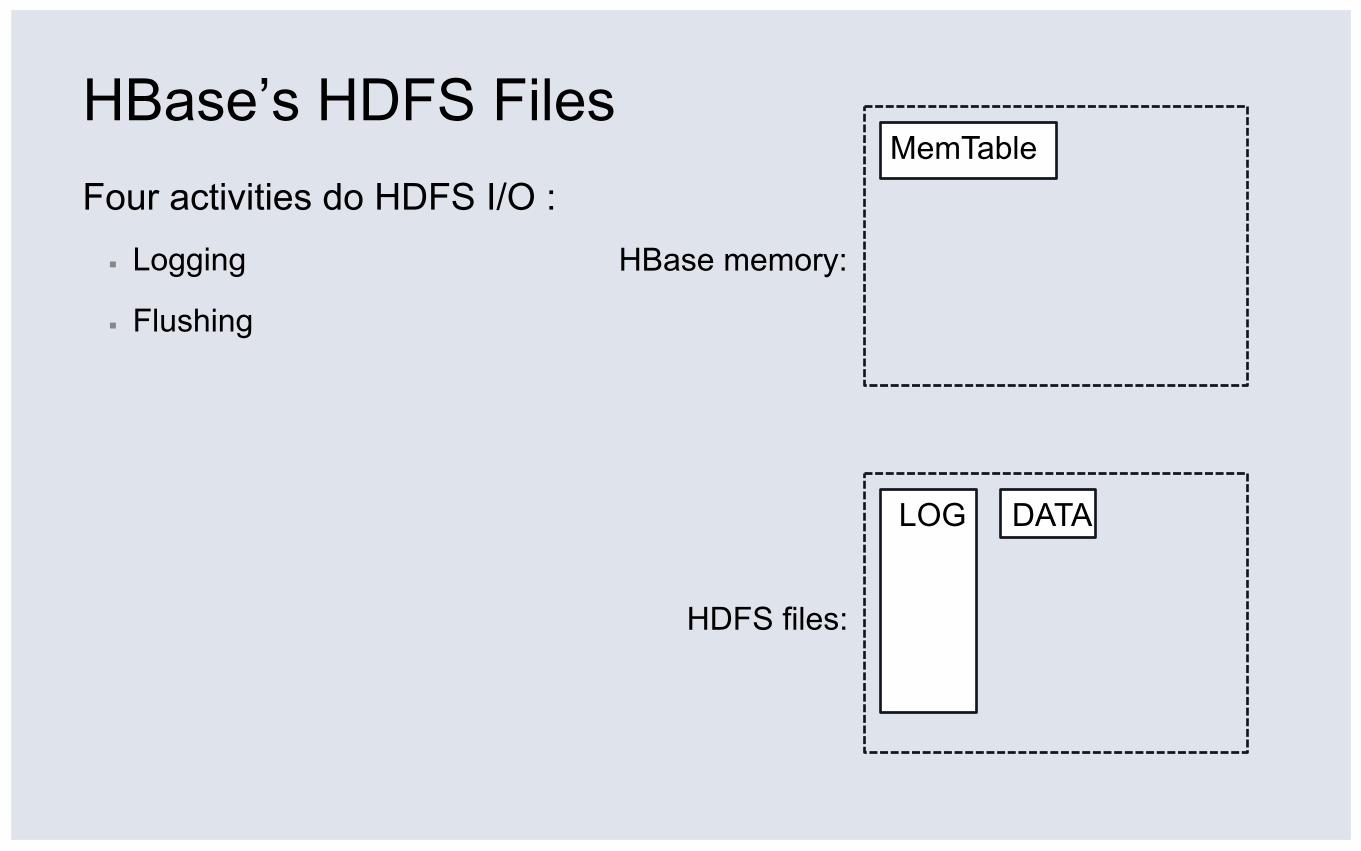
HBase’s HDFS Files Four activities do HDFS I/O : ▪ Logging
▪ Flushing
HDFS files:
HBase memory:
MemTable
DATA LOG
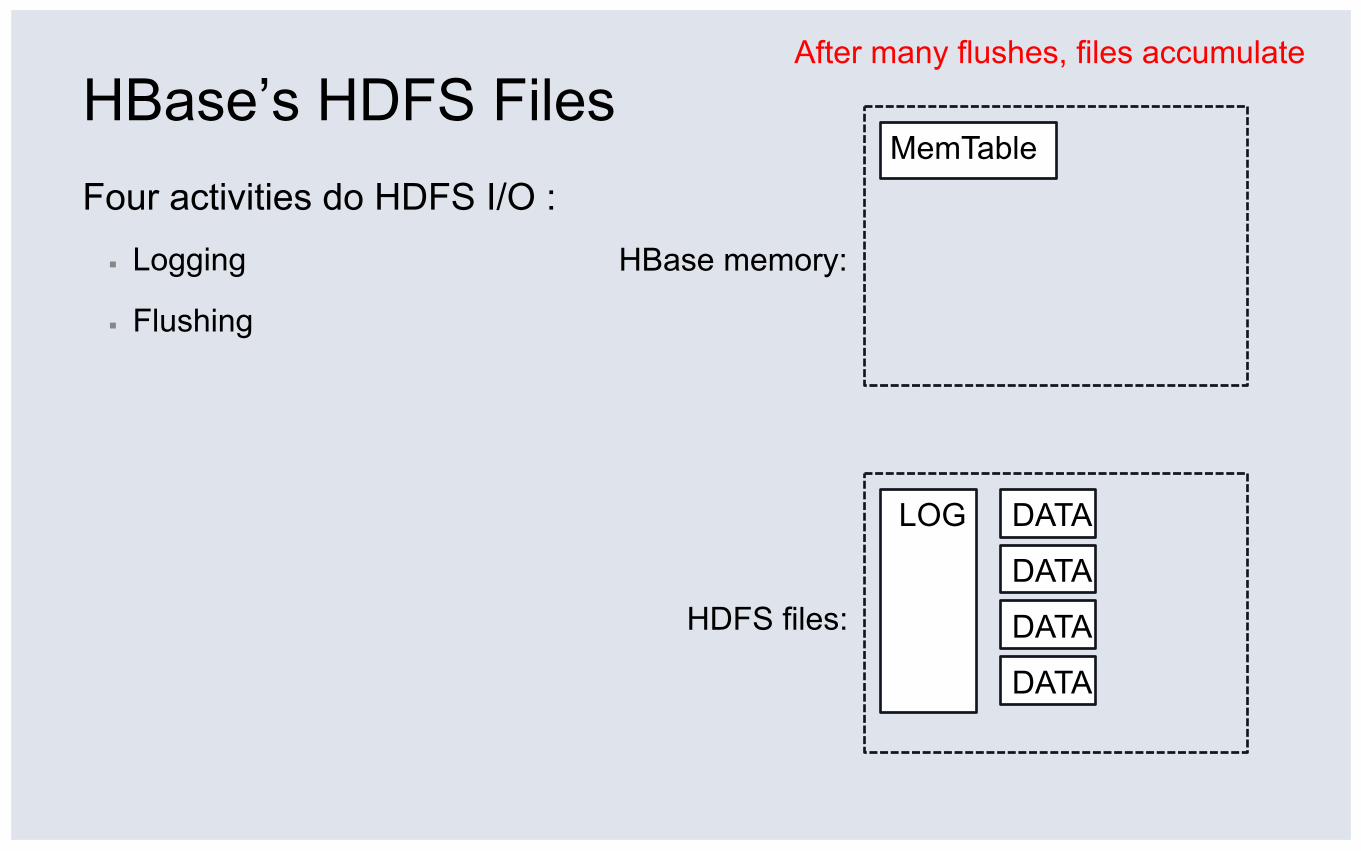
HBase’s HDFS Files Four activities do HDFS I/O : ▪ Logging
▪ Flushing
HDFS files:
HBase memory:
After many flushes, files accumulate
MemTable
DATA
DATA
DATA
DATA
LOG
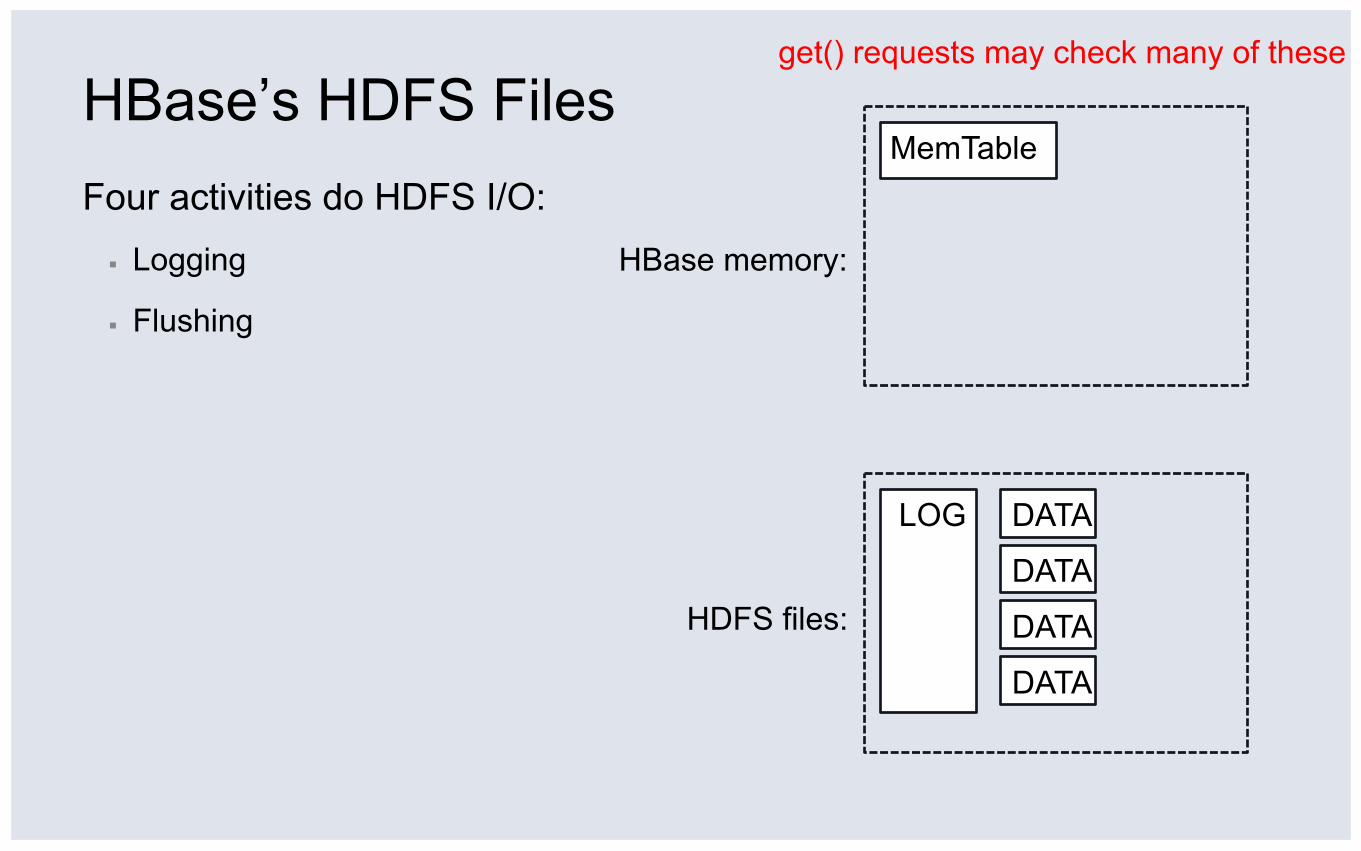
HBase’s HDFS Files Four activities do HDFS I/O: ▪ Logging
▪ Flushing
HDFS files:
HBase memory:
get() requests may check many of these
MemTable
DATA
DATA
DATA
DATA
LOG
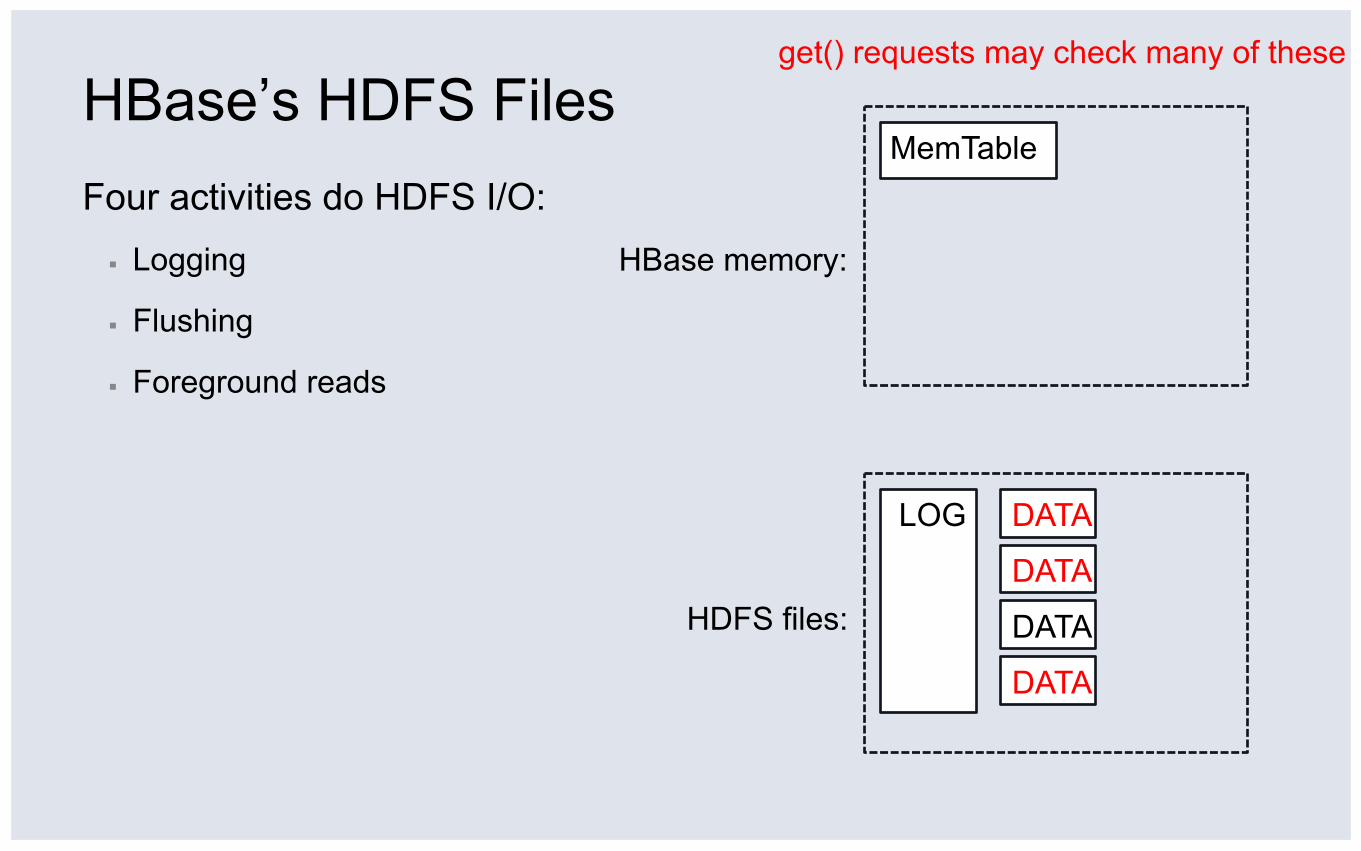
HBase’s HDFS Files Four activities do HDFS I/O: ▪ Logging
▪ Flushing
▪ Foreground reads
HDFS files:
HBase memory:
get() requests may check many of these
MemTable
DATA
DATA
DATA
DATA
LOG
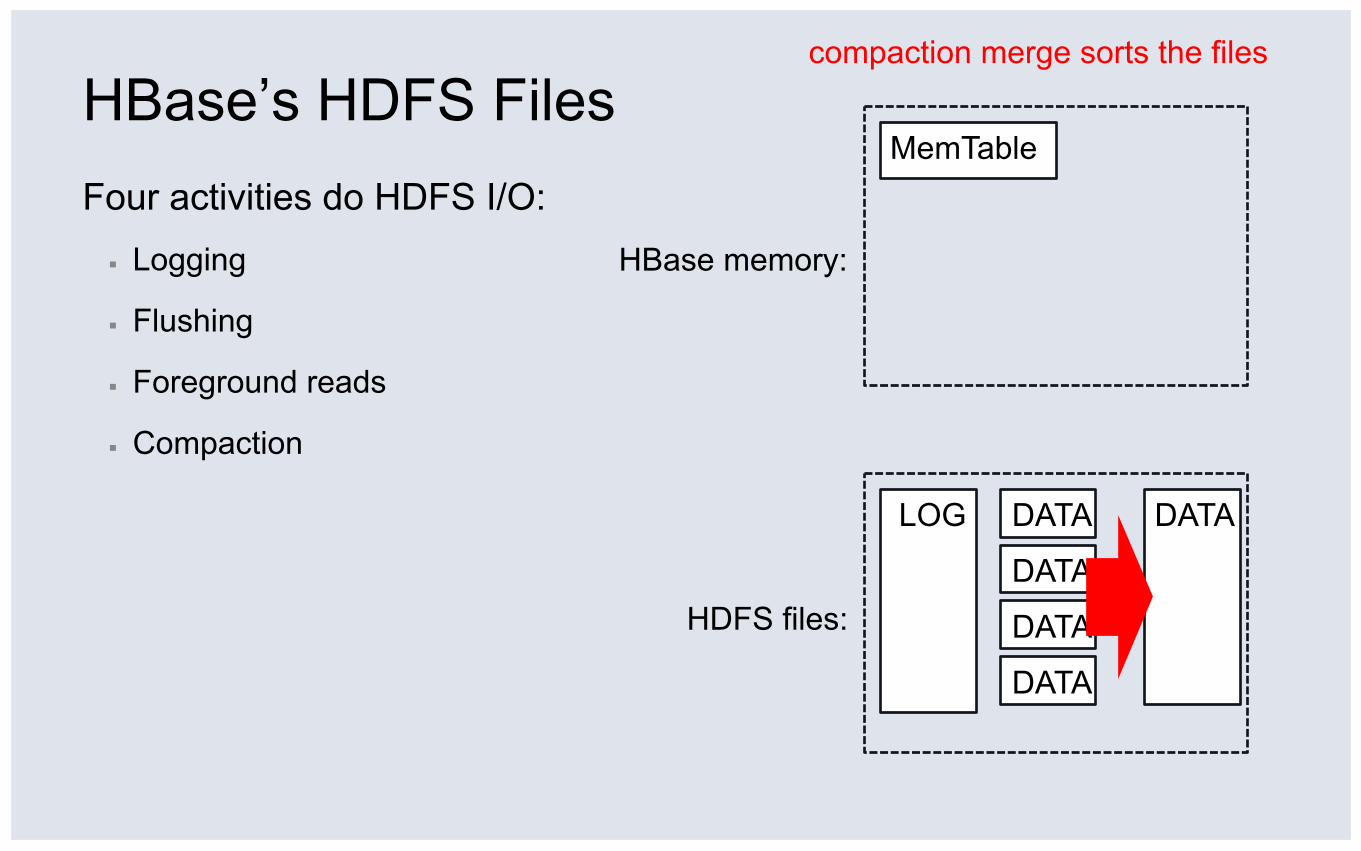
HBase’s HDFS Files Four activities do HDFS I/O: ▪ Logging
▪ Flushing
▪ Foreground reads
▪ Compaction
HDFS files:
HBase memory:
LOG
compaction merge sorts the files
MemTable
DATA
DATA
DATA
DATA
DATA
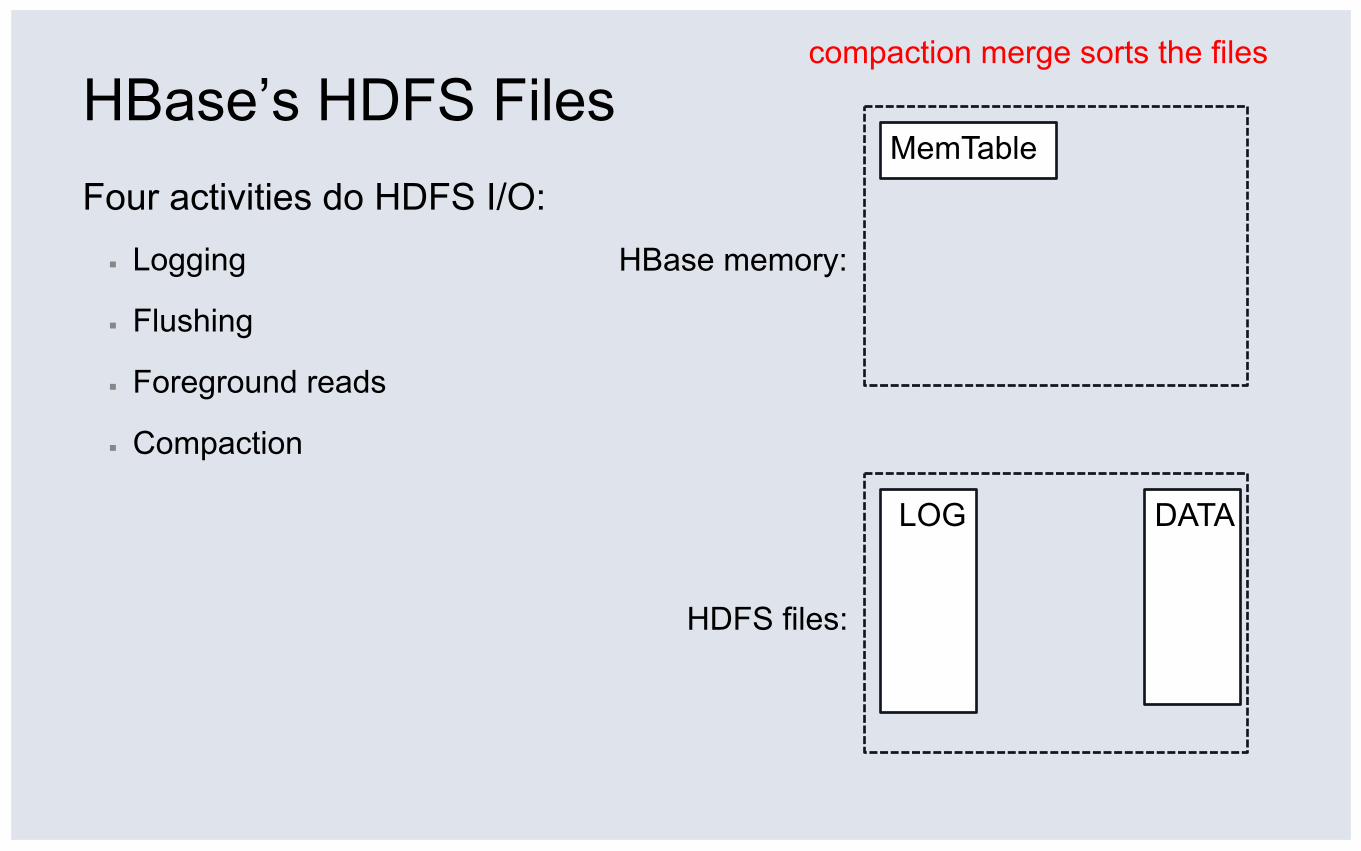
HBase’s HDFS Files Four activities do HDFS I/O: ▪ Logging
▪ Flushing
▪ Foreground reads
▪ Compaction
HDFS files:
HBase memory:
compaction merge sorts the files
MemTable
DATA LOG
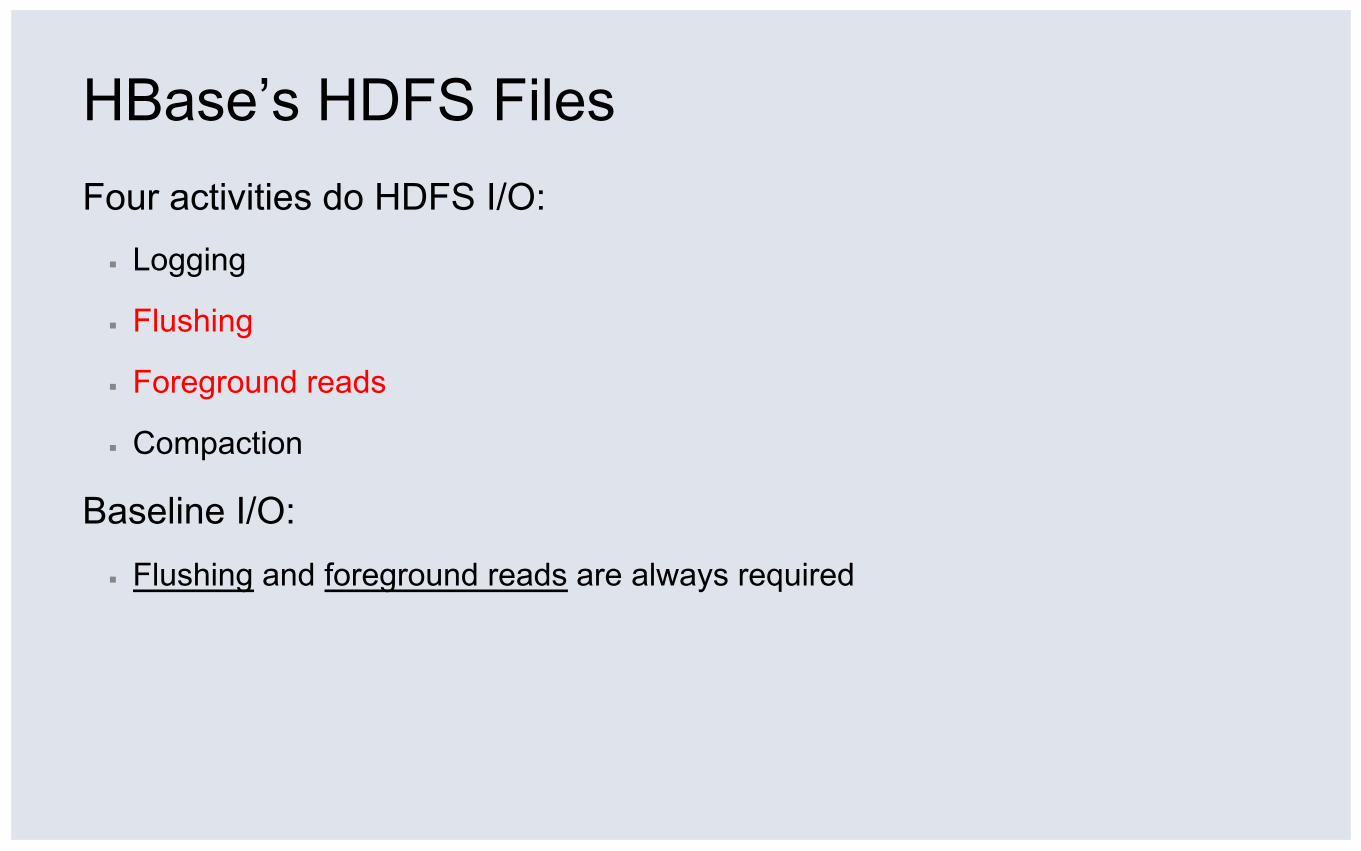
HBase’s HDFS Files Four activities do HDFS I/O: ▪ Logging
▪ Flushing
▪ Foreground reads
▪ Compaction
Baseline I/O:
▪ Flushing and foreground reads are always required
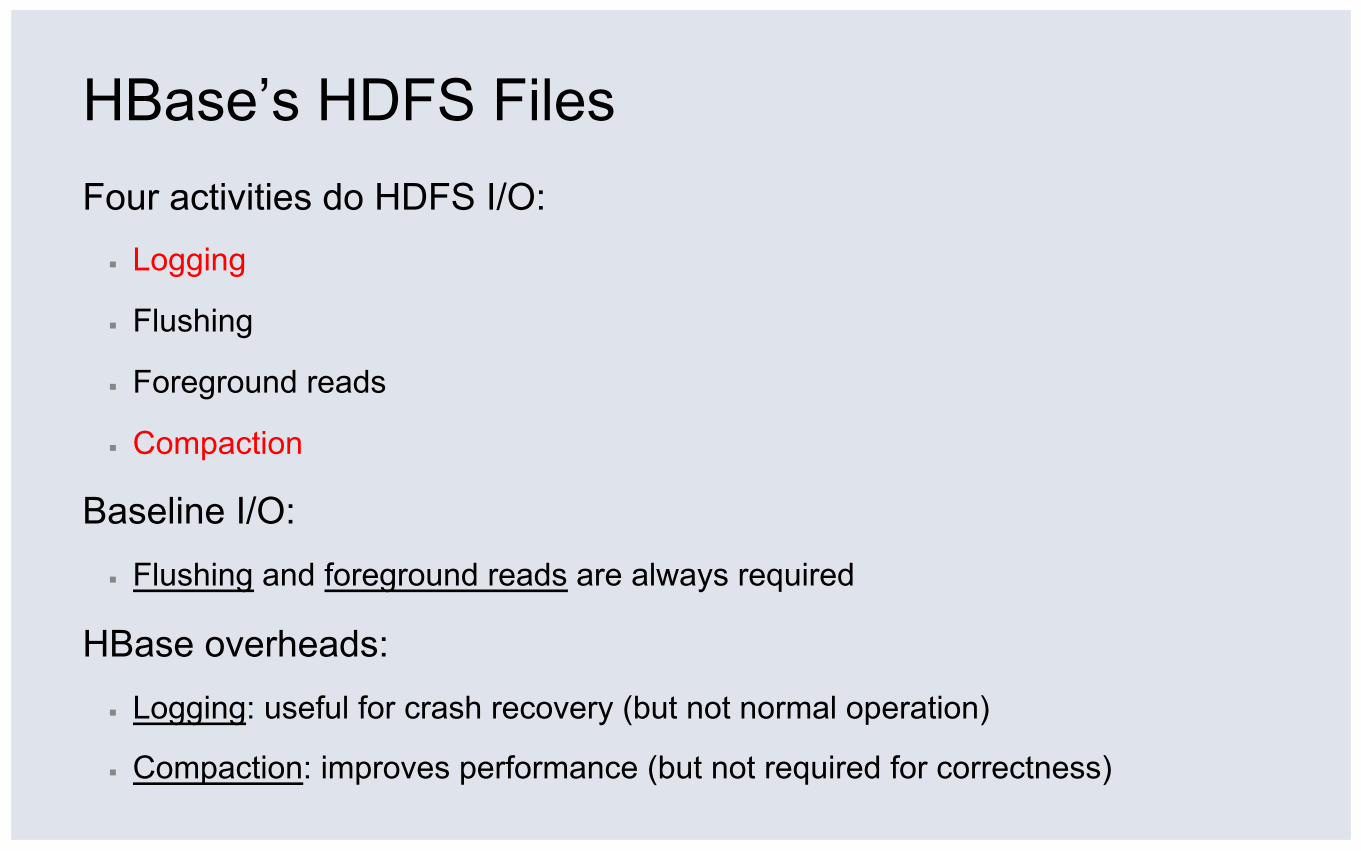
HBase’s HDFS Files Four activities do HDFS I/O: ▪ Logging
▪ Flushing
▪ Foreground reads
▪ Compaction
Baseline I/O:
▪ Flushing and foreground reads are always required
HBase overheads:
▪ Logging: useful for crash recovery (but not normal operation)
▪ Compaction: improves performance (but not required for correctness)
Outline Intro
▪ Messages stack overview
▪ Methodology: trace-driven analysis and simulation
▪ HBase background
Results
▪ Workload analysis
▪ Hardware simulation: adding a flash layer
▪ Software simulation: integrating layers
Conclusions
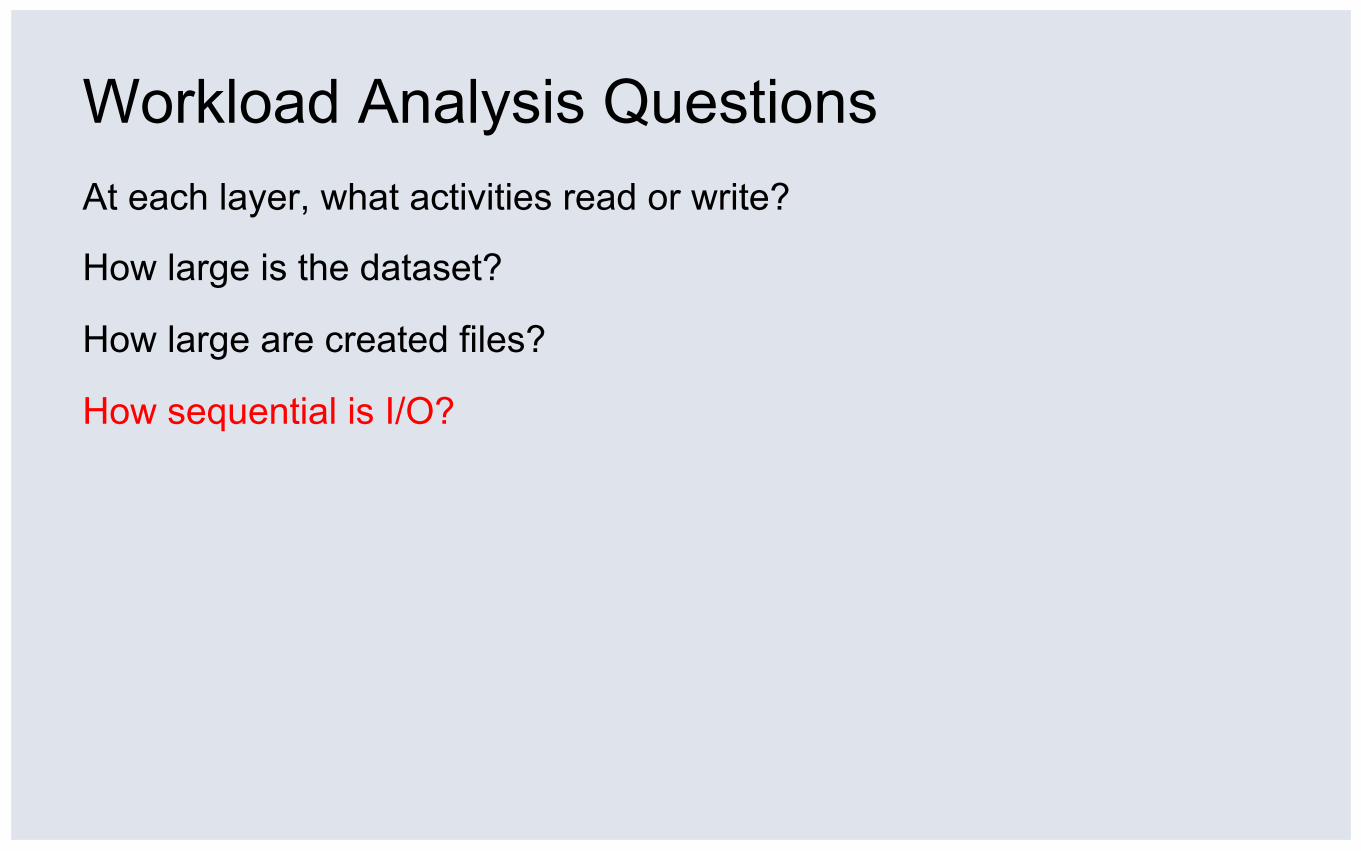
Workload Analysis Questions At each layer, what activities read or write?
How large is the dataset?
How large are created files?
How sequential is I/O?
Workload Analysis Questions At each layer, what activities read or write?
How large is the dataset?
How large are created files?
How sequential is I/O?
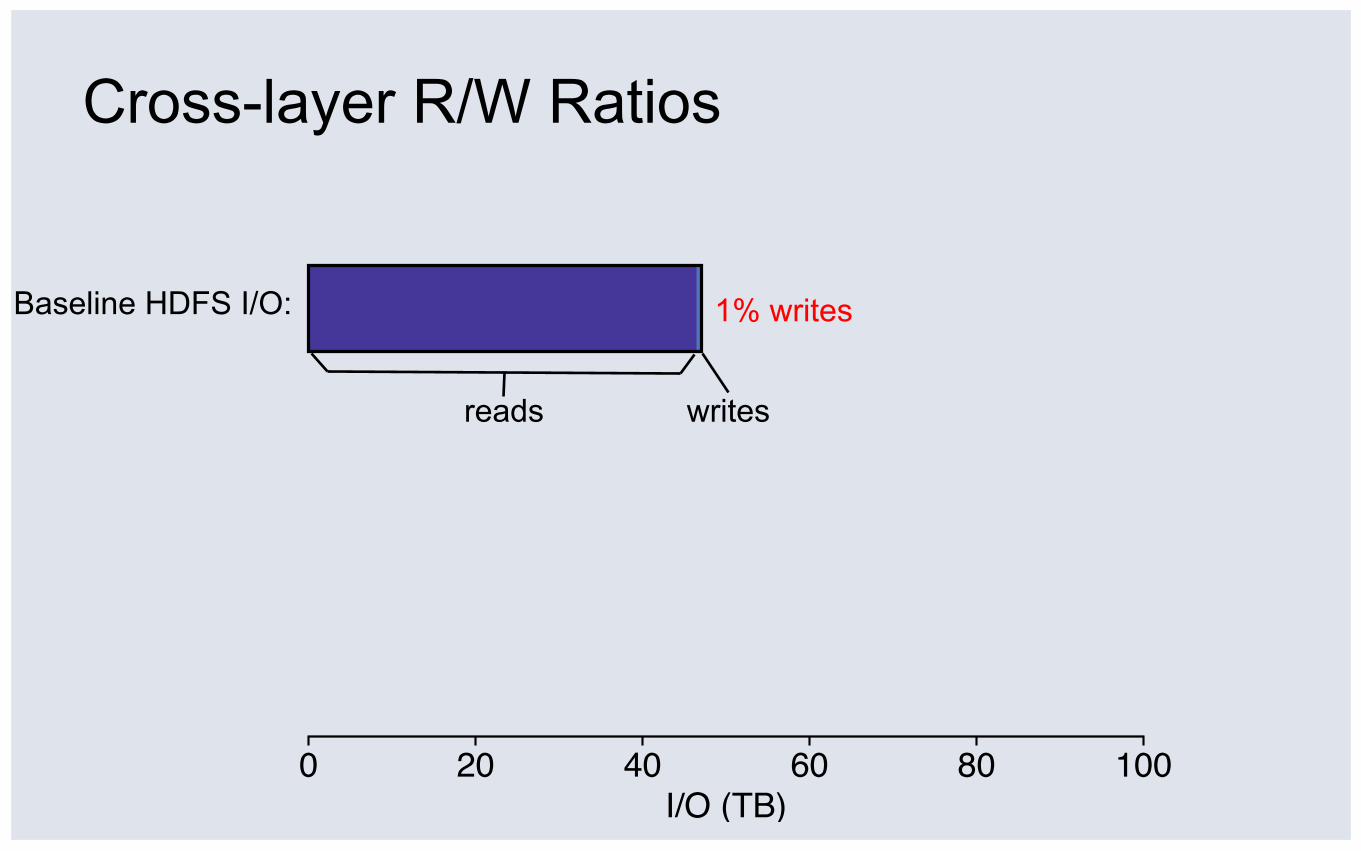
Baseline HDFS I/O:
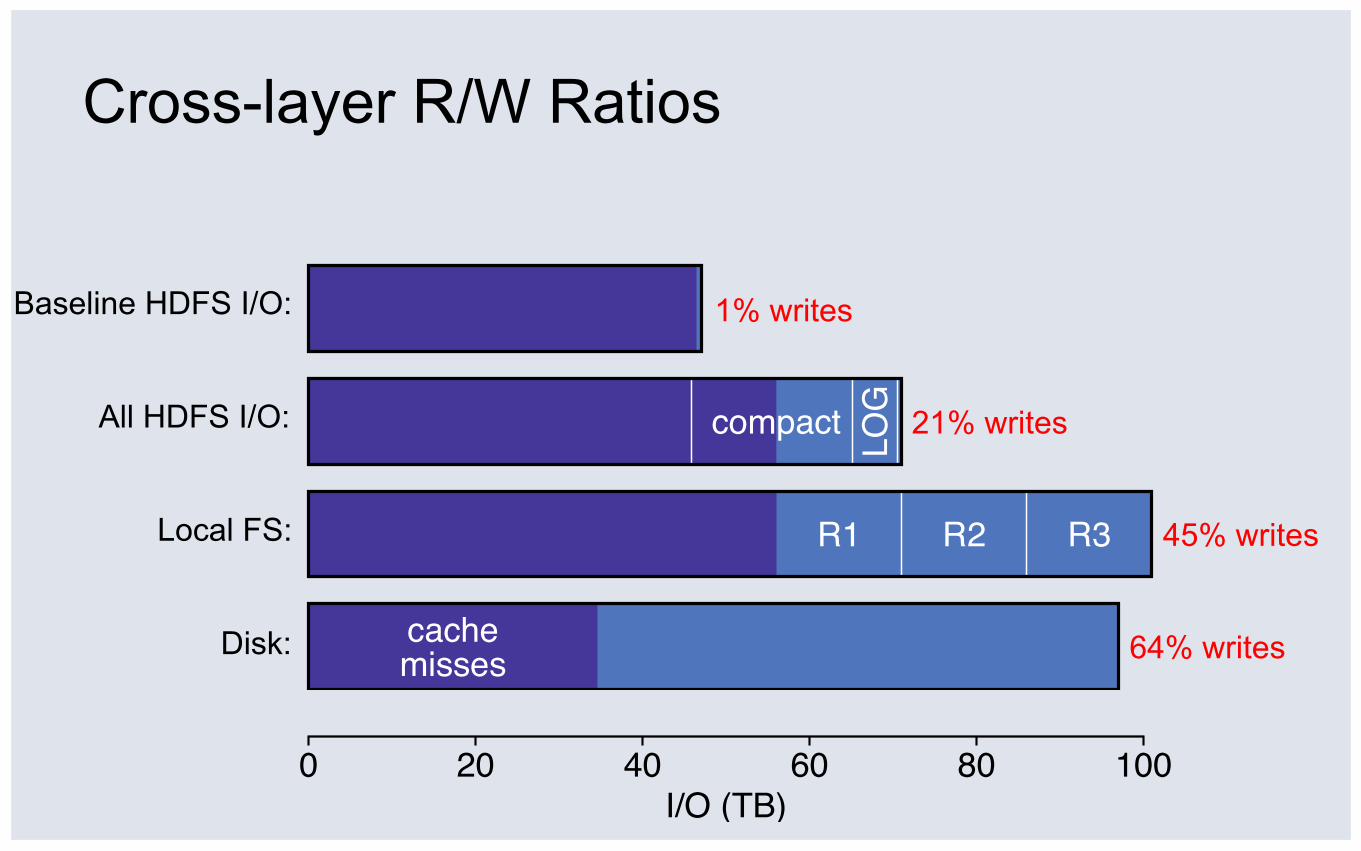
Cross-layer R/W Ratios
0 20 40 60 80 100I/O (TB)
cachemisses
1% writes
reads writes
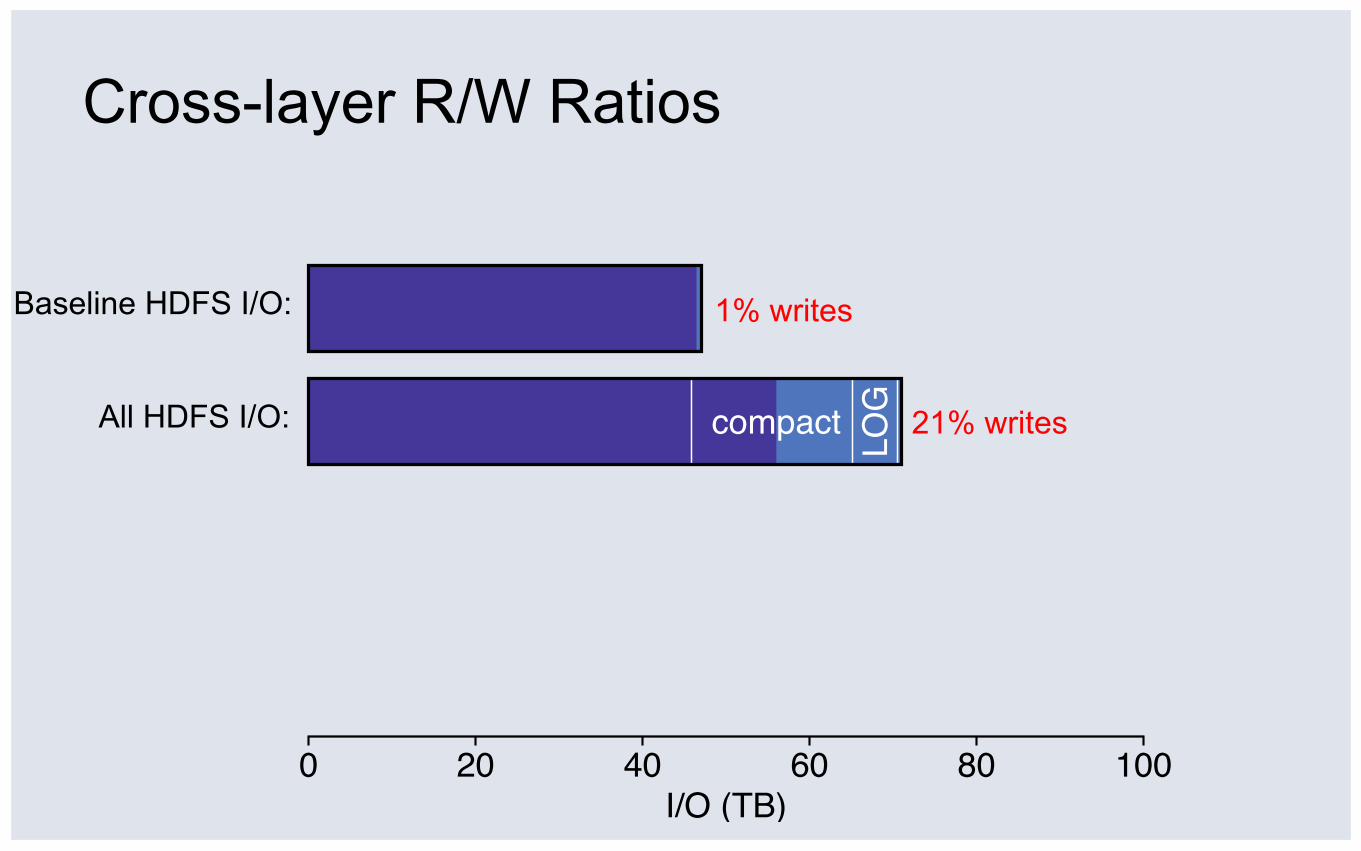
Baseline HDFS I/O:
Cross-layer R/W Ratios
compact LOG
0 20 40 60 80 100I/O (TB)
cachemisses
All HDFS I/O:
1% writes
21% writes
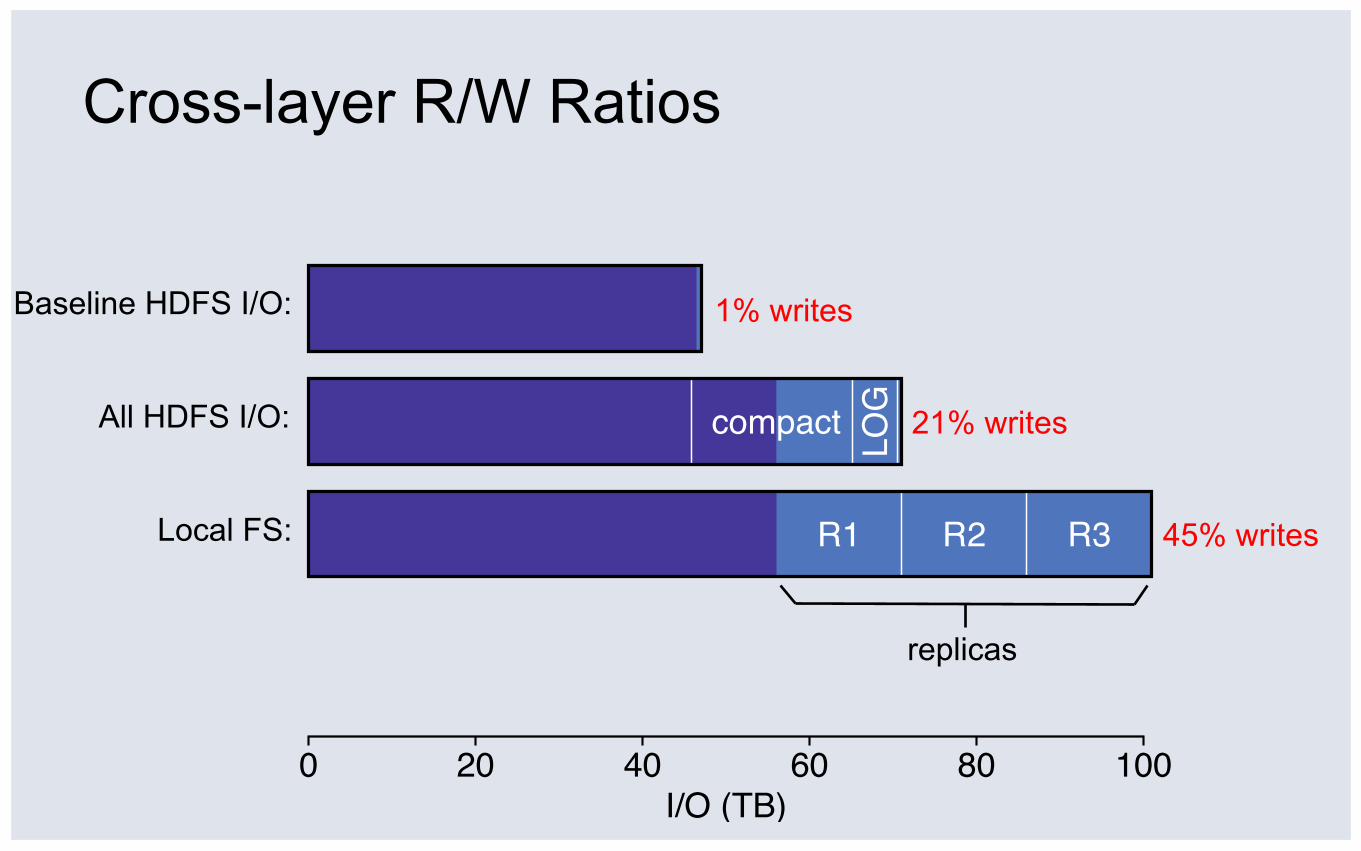
Baseline HDFS I/O:
Cross-layer R/W Ratios
compact LOG
R1 R2 R3
0 20 40 60 80 100I/O (TB)
cachemisses
All HDFS I/O:
Local FS:
1% writes
21% writes
45% writes
replicas
Baseline HDFS I/O:
Cross-layer R/W Ratios
compact LOG
R1 R2 R3
0 20 40 60 80 100I/O (TB)
cachemisses
0 20 40 60 80 100I/O (TB)
cachemisses
All HDFS I/O:
Local FS:
Disk:
1% writes
64% writes
21% writes
45% writes
Workload Analysis Conclusions ① Layers amplify writes: 1% => 64%
u Logging, compaction, and replication increase writes
u Caching decreases reads
Workload Analysis Questions At each layer, what activities read or write?
How large is the dataset?
How large are created files?
How sequential is I/O?
LOGcompact
0 20 40Footprint (TB)
R1 R2 R3
Baseline HDFS I/O:
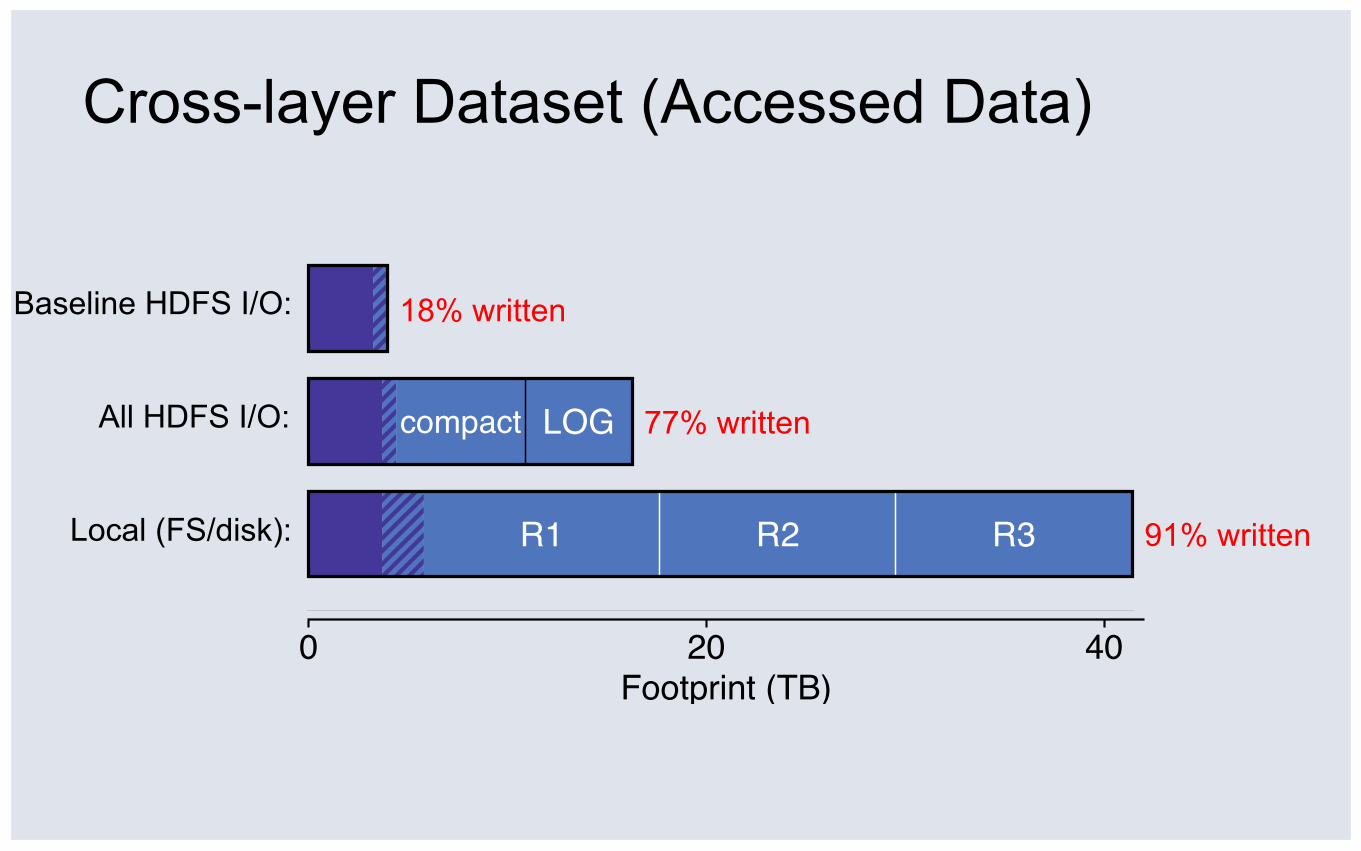
Cross-layer Dataset (Accessed Data)
All HDFS I/O:
Local (FS/disk):
18% written
77% written
91% written
0 20 40Footprint (TB)
R1 R2 R3
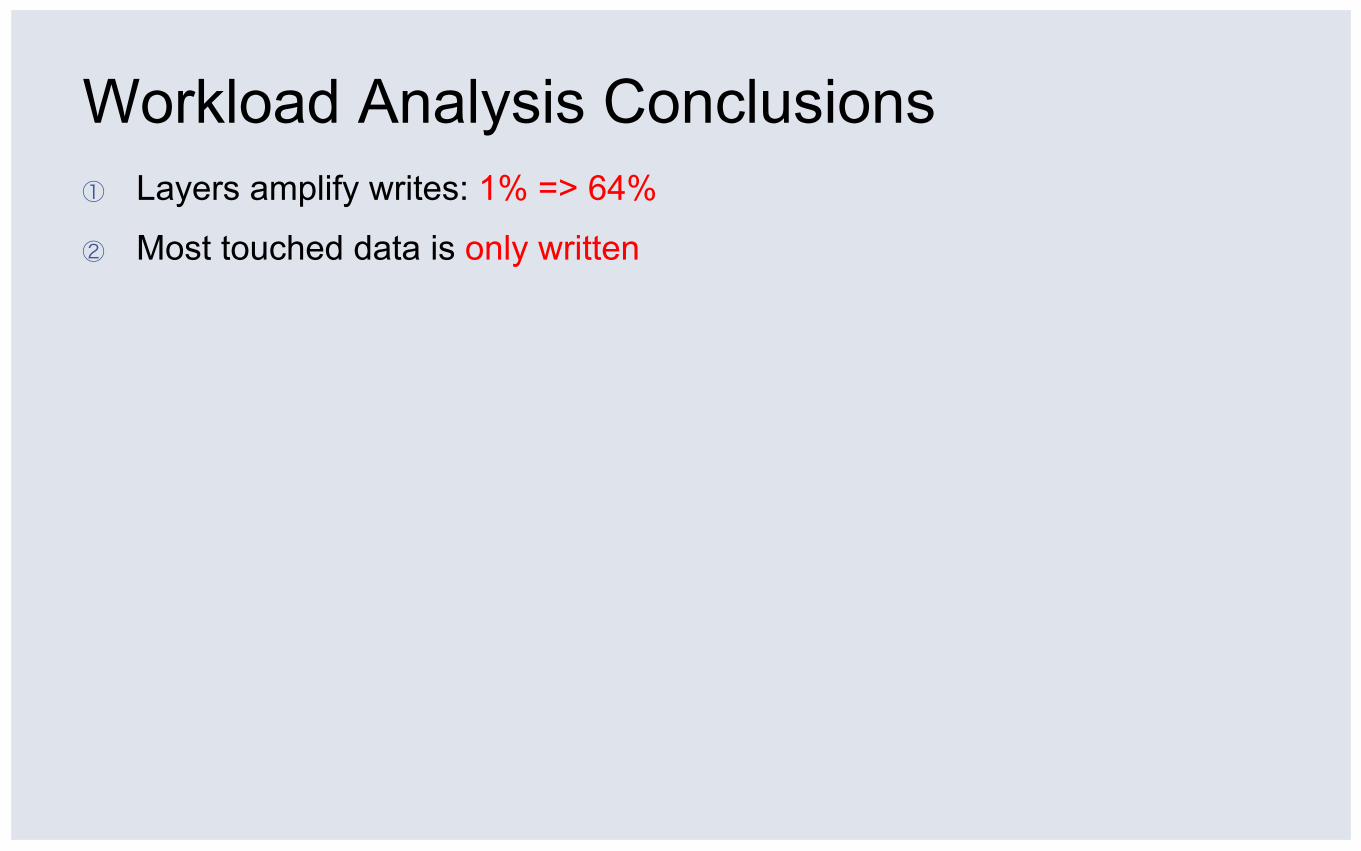
Workload Analysis Conclusions ① Layers amplify writes: 1% => 64%
② Most touched data is only written
LOGcompact
0 20 40Footprint (TB)
R1 R2 R3
Baseline HDFS I/O:
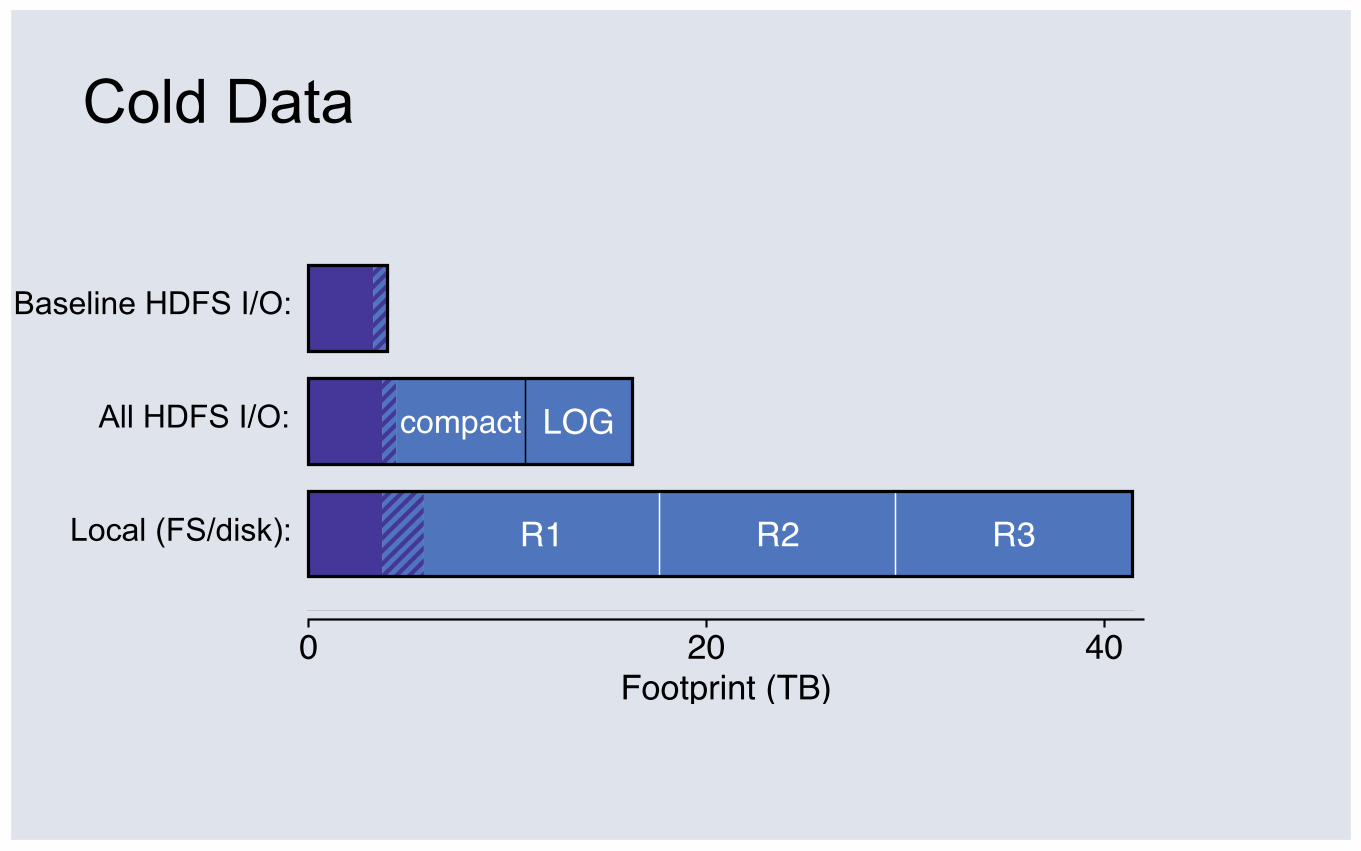
Cold Data
All HDFS I/O:
Local (FS/disk):
0 20 40Footprint (TB)
R1 R2 R3
0 20 40Footprint (TB)
R1 R2 R3
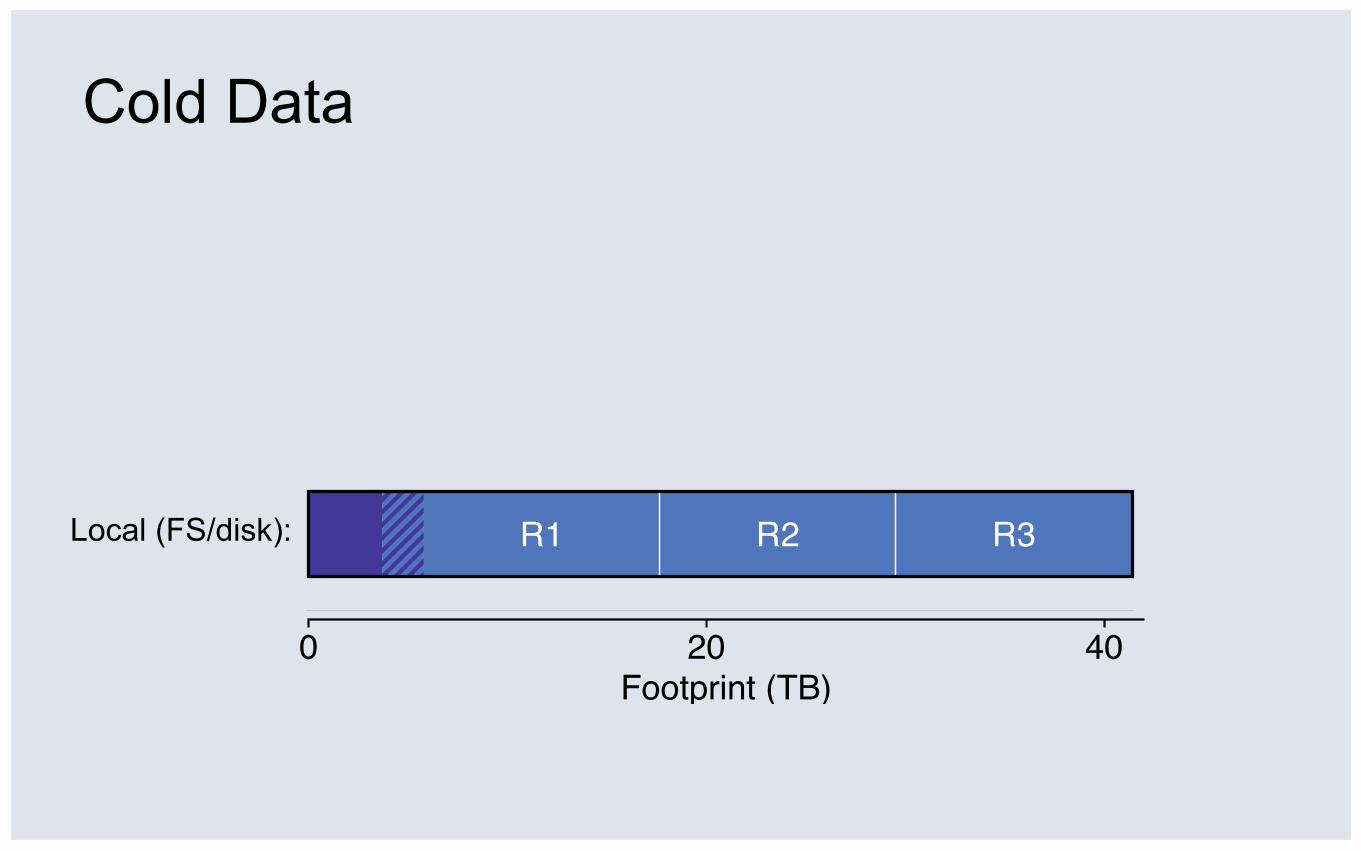
Cold Data
Local (FS/disk):
0 20 40Footprint (TB)
R1 R2 R3
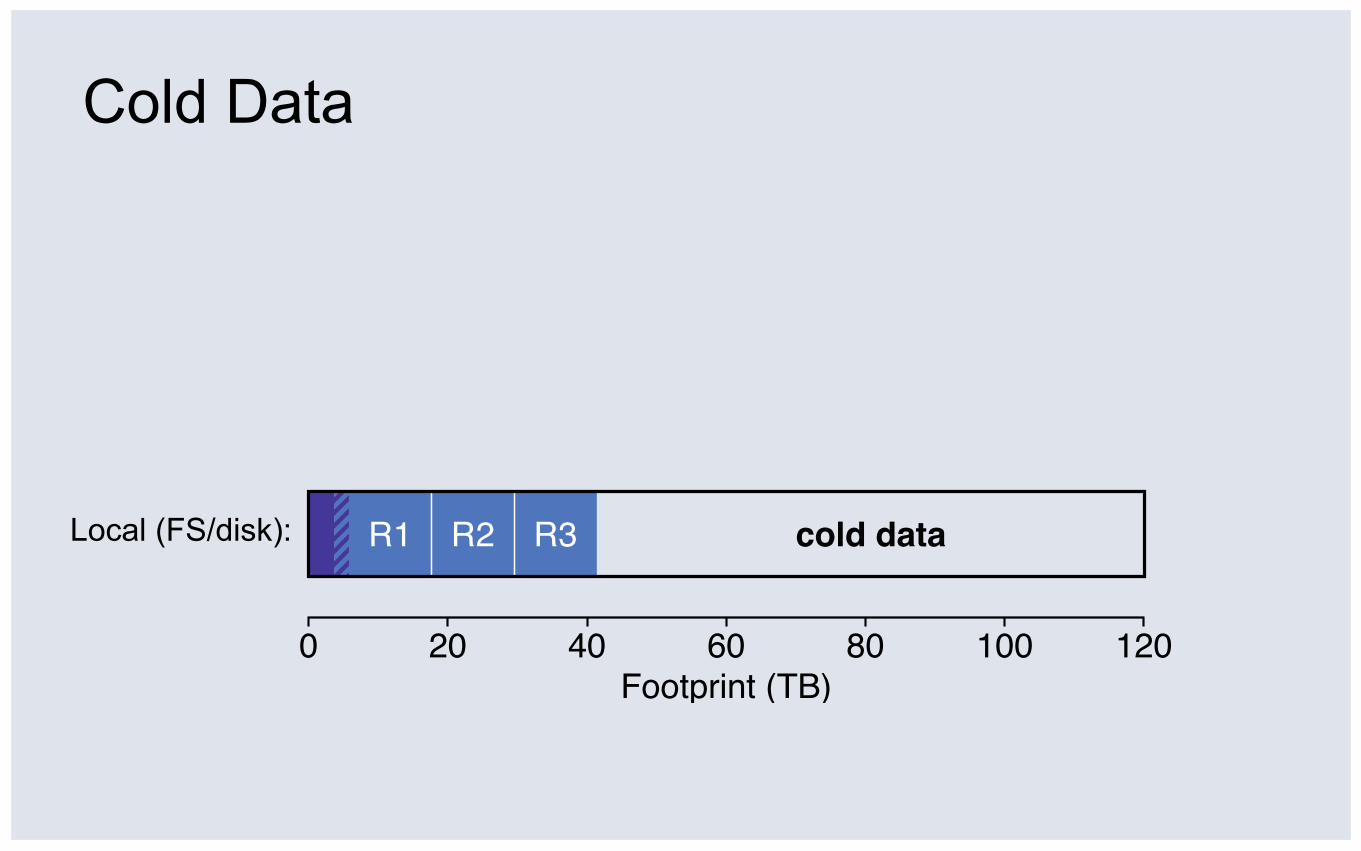
Cold Data
Local (FS/disk):
0 20 40 60 80 100 120Footprint (TB)
R1 R2 R3 cold data
0 20 40 60 80 100 120Footprint (TB)
R1 R2 R3 cold data
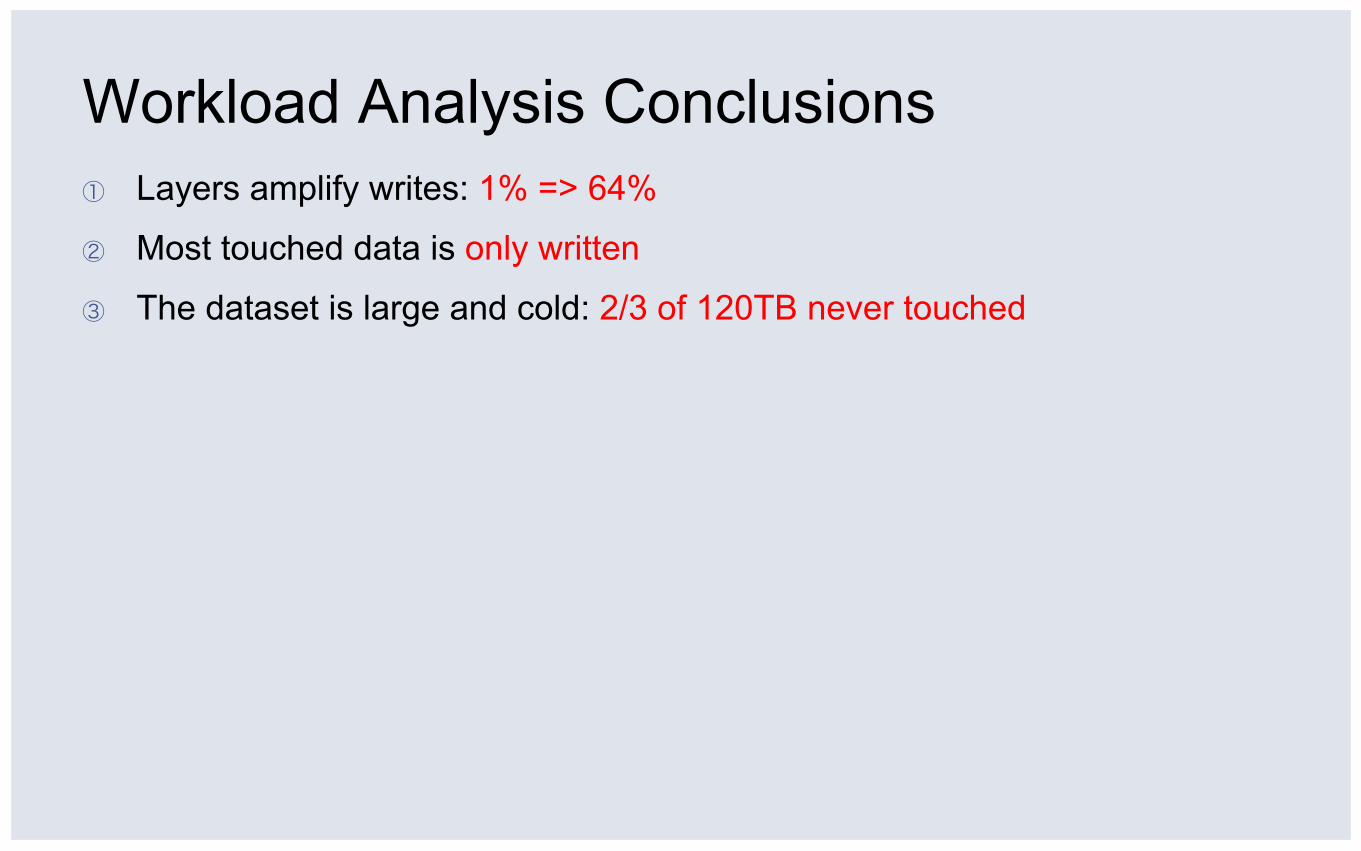
Workload Analysis Conclusions ① Layers amplify writes: 1% => 64%
② Most touched data is only written
③ The dataset is large and cold: 2/3 of 120TB never touched
Workload Analysis Questions At each layer, what activities read or write?
How large is the dataset?
How large are created files?
How sequential is I/O?
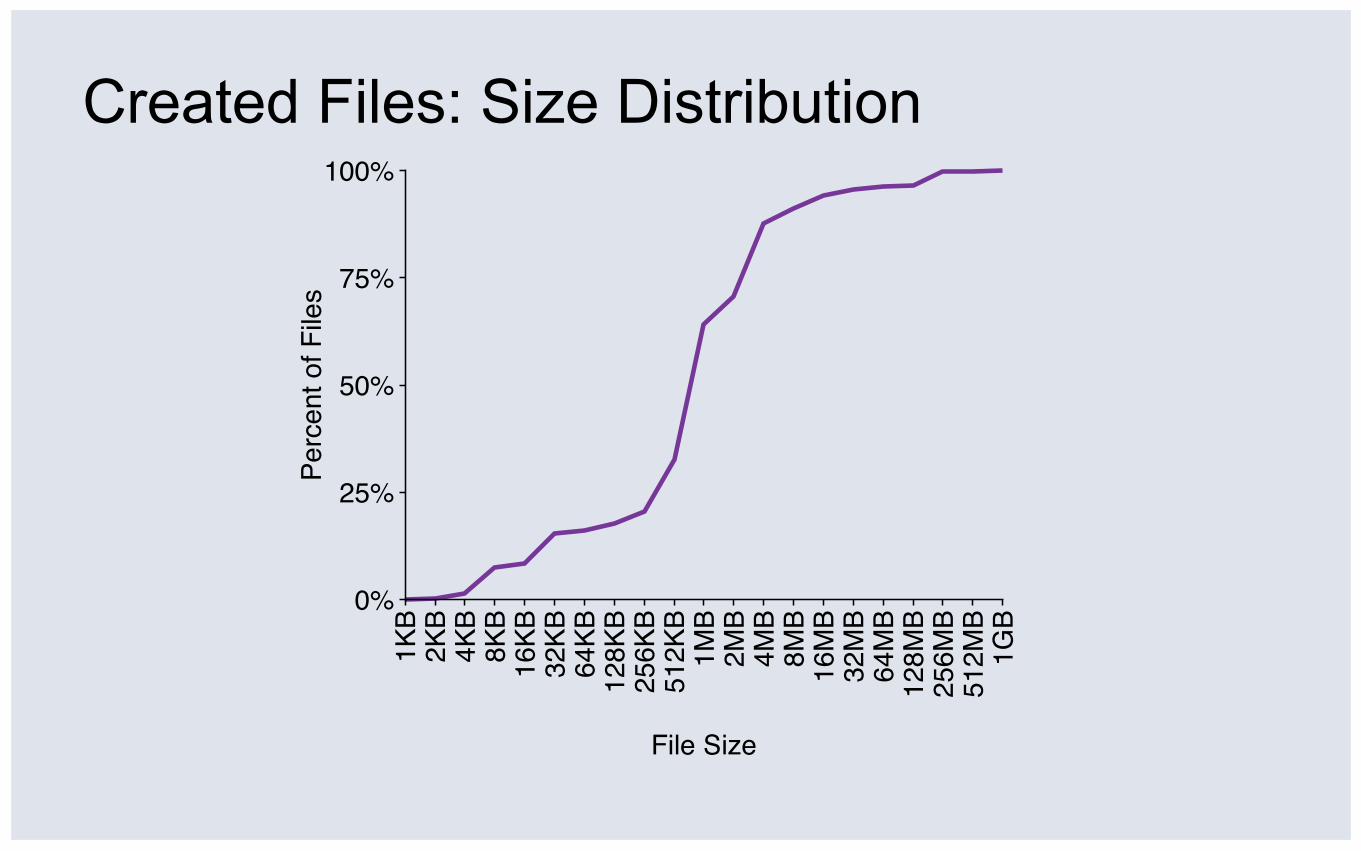
Created Files: Size Distribution
1KB
2KB
4KB
8KB
16KB
32KB
64KB
128K
B25
6KB
512K
B1M
B2M
B4M
B8M
B16
MB
32M
B64
MB
128M
B25
6MB
512M
B1G
B0%
25%
50%
75%
100%
File Size
Perc
ent o
f File
s
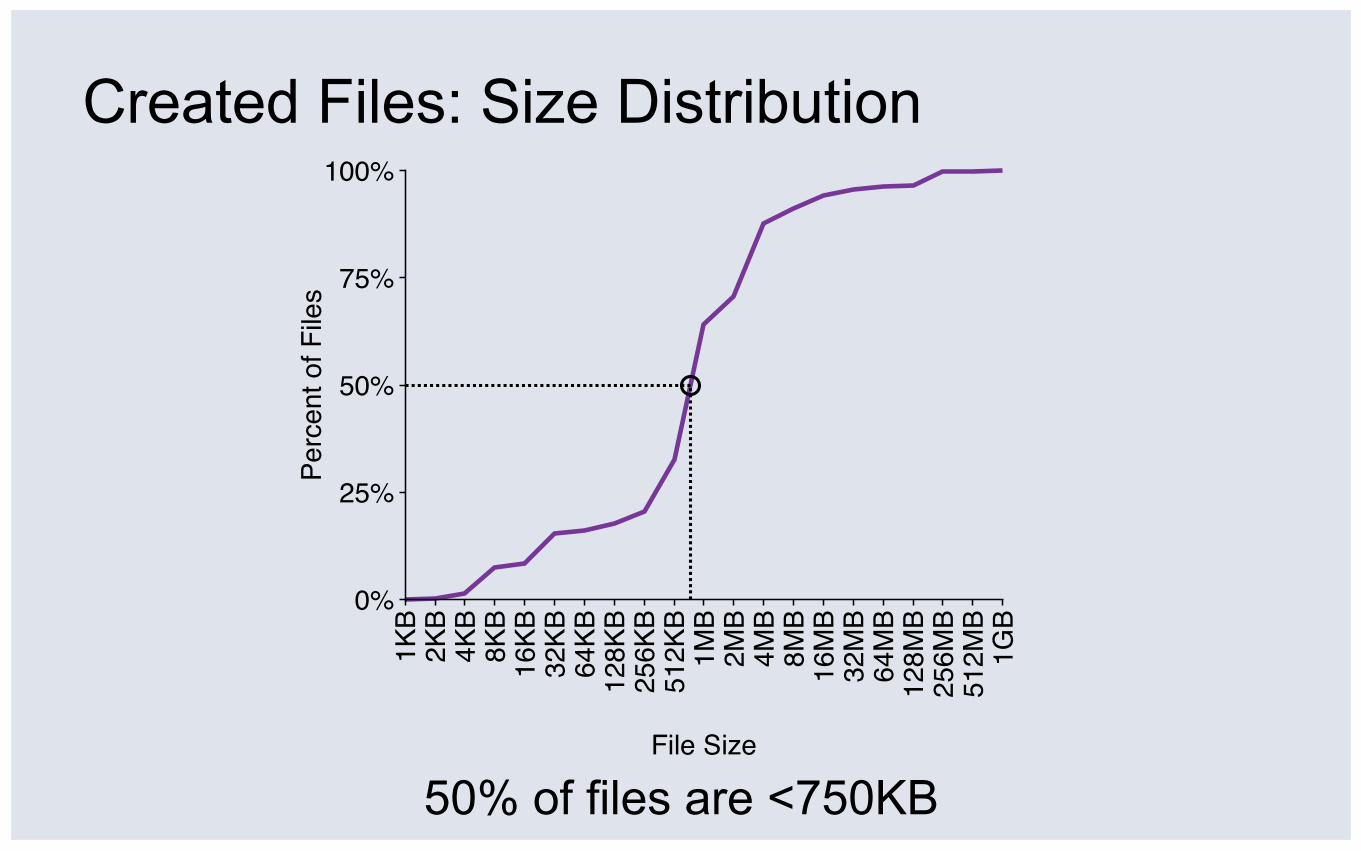
Created Files: Size Distribution
50% of files are <750KB
1KB
2KB
4KB
8KB
16KB
32KB
64KB
128K
B25
6KB
512K
B1M
B2M
B4M
B8M
B16
MB
32M
B64
MB
128M
B25
6MB
512M
B1G
B0%
25%
50%
75%
100%
File Size
Perc
ent o
f File
s

Created Files: Size Distribution
90% of files are <6.3MB
1KB
2KB
4KB
8KB
16KB
32KB
64KB
128K
B25
6KB
512K
B1M
B2M
B4M
B8M
B16
MB
32M
B64
MB
128M
B25
6MB
512M
B1G
B0%
25%
50%
75%
100%
File Size
Perc
ent o
f File
s
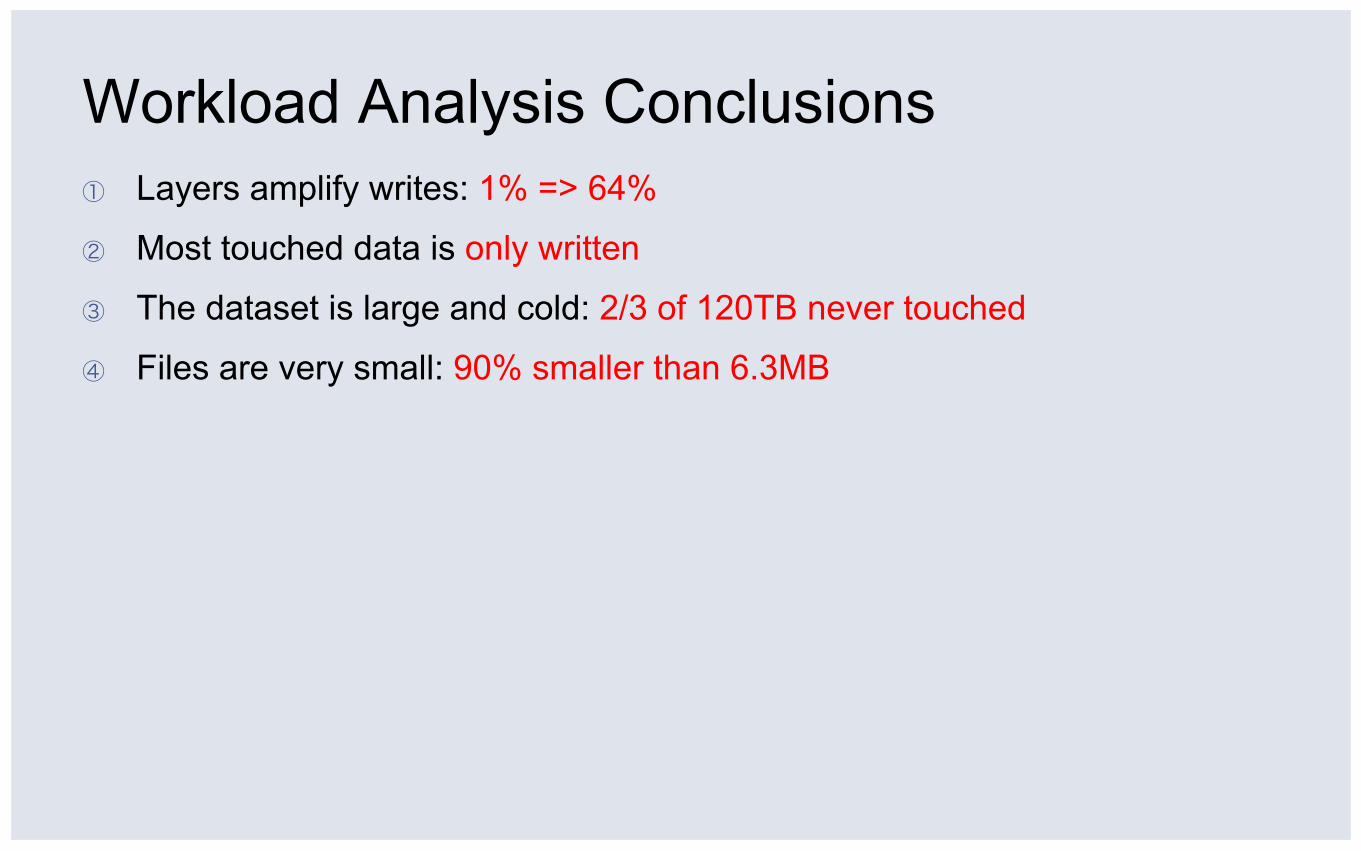
Workload Analysis Conclusions ① Layers amplify writes: 1% => 64%
② Most touched data is only written
③ The dataset is large and cold: 2/3 of 120TB never touched
④ Files are very small: 90% smaller than 6.3MB
Workload Analysis Questions At each layer, what activities read or write?
How large is the dataset?
How large are created files?
How sequential is I/O?
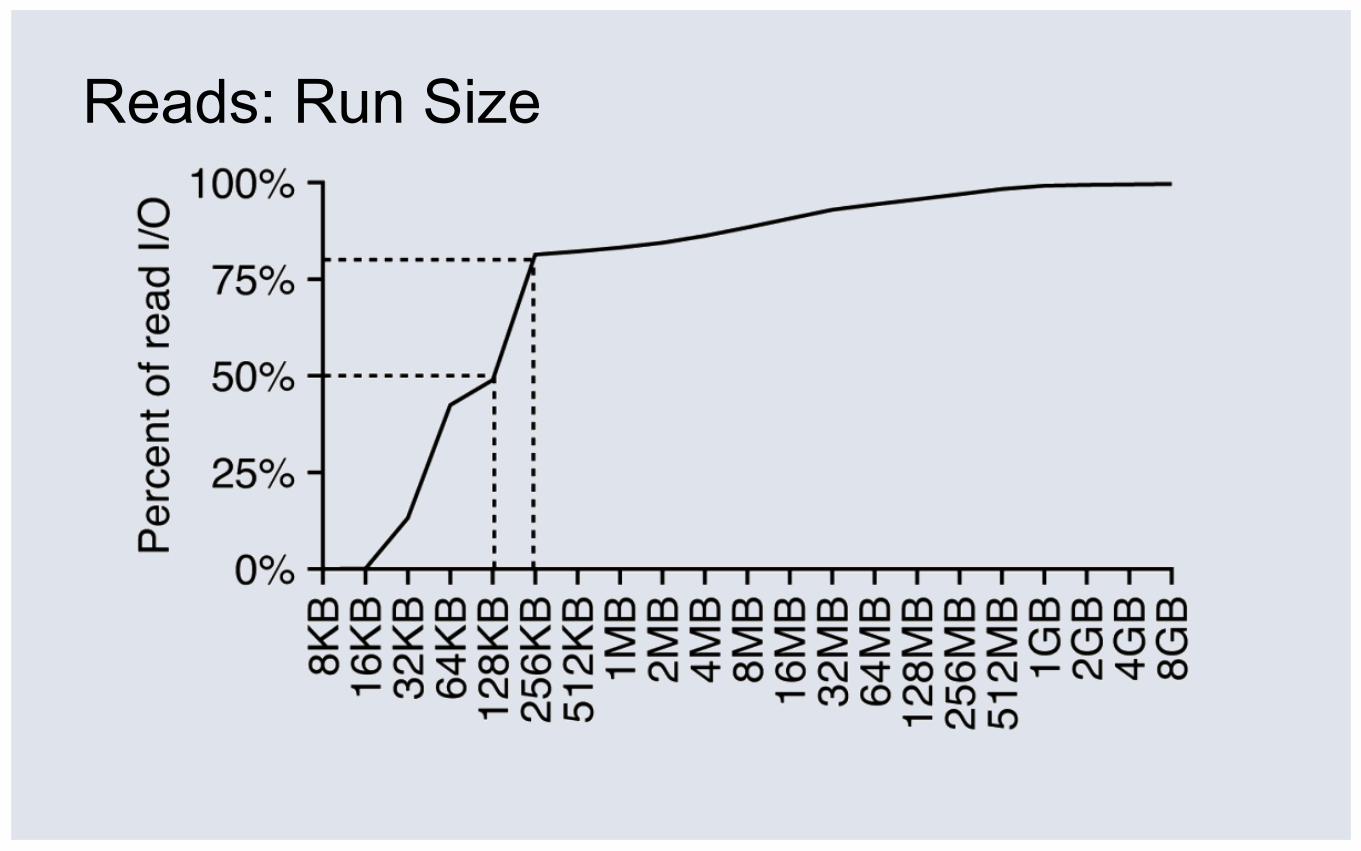
Reads: Run Size
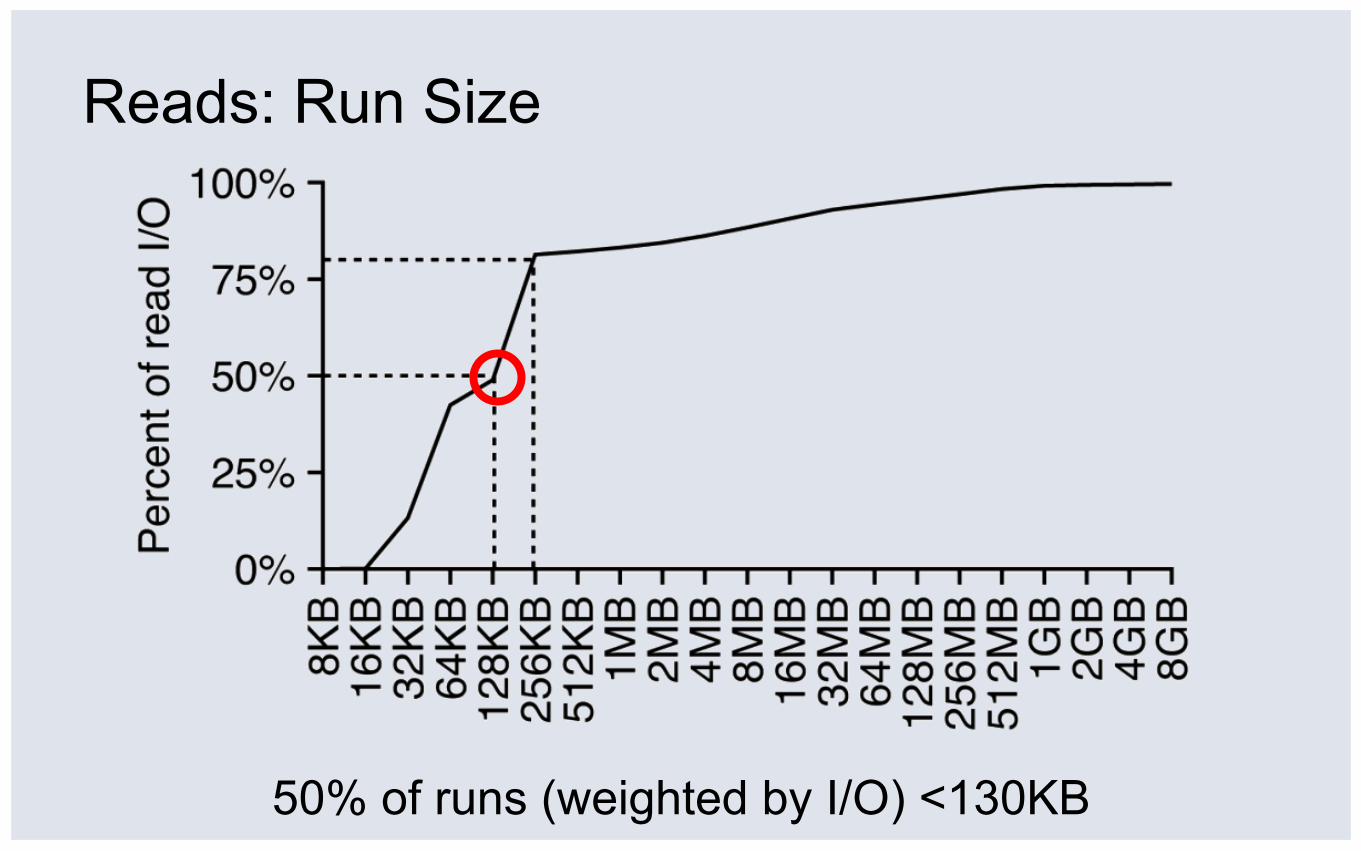
Reads: Run Size
50% of runs (weighted by I/O) <130KB
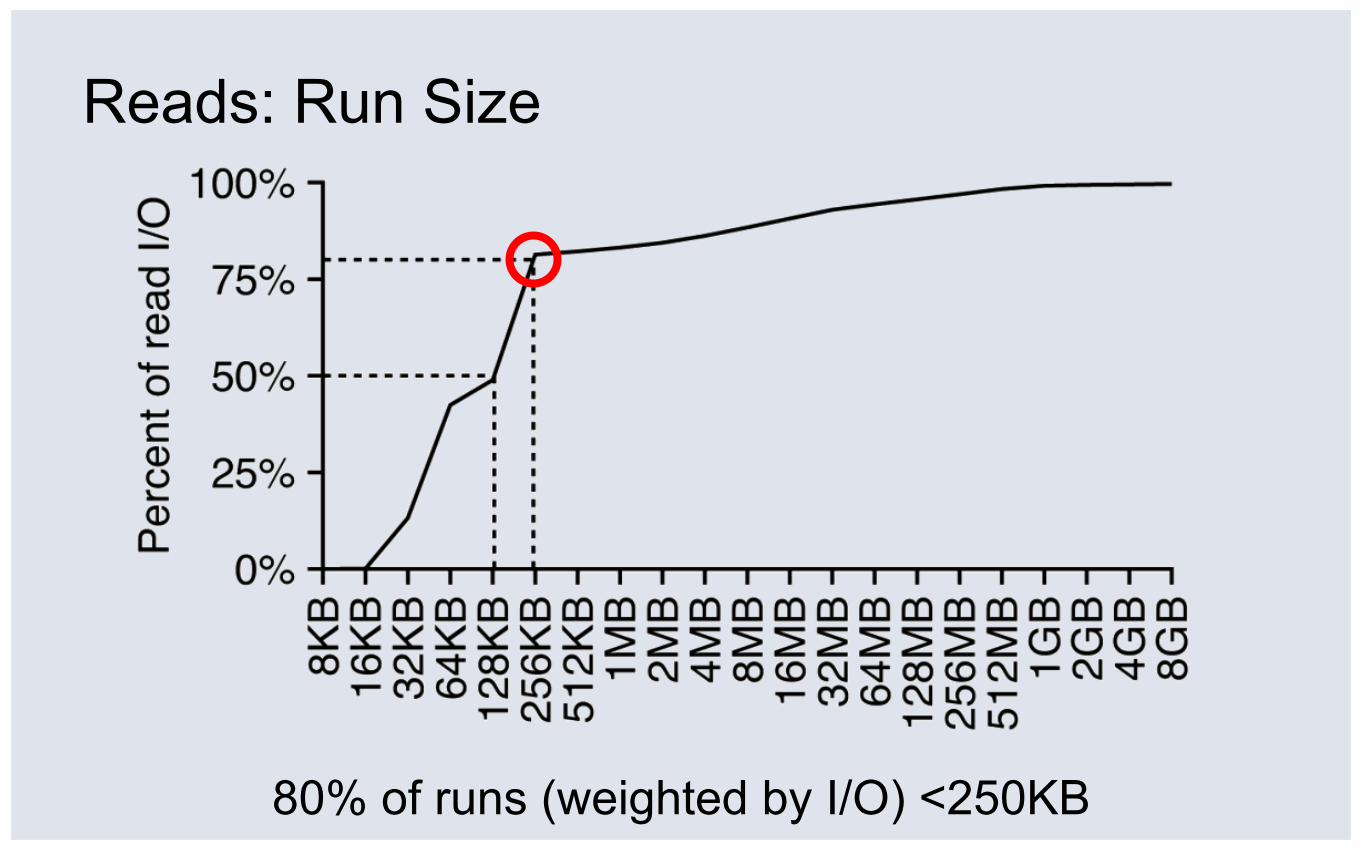
Reads: Run Size
80% of runs (weighted by I/O) <250KB
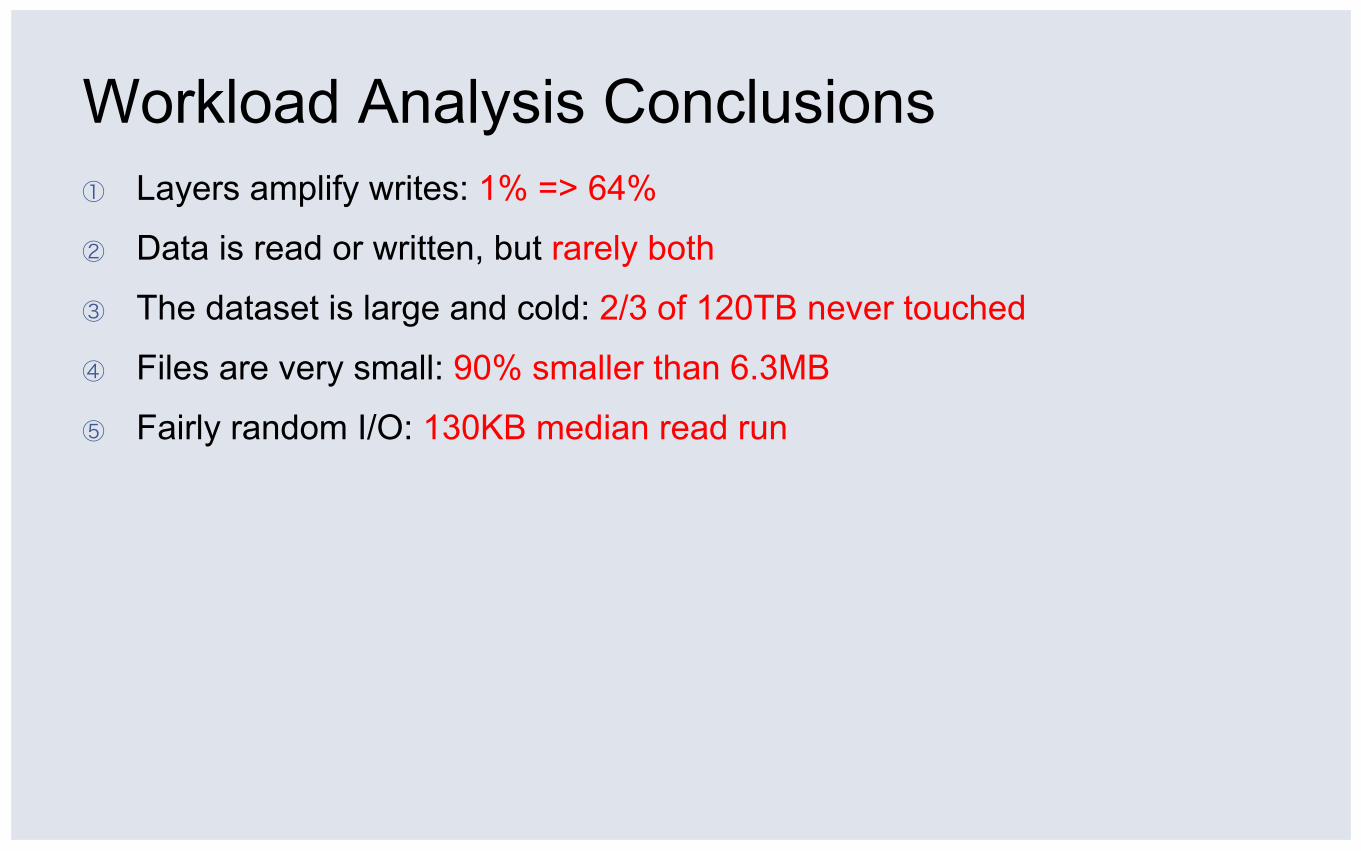
Workload Analysis Conclusions ① Layers amplify writes: 1% => 64%
② Data is read or written, but rarely both
③ The dataset is large and cold: 2/3 of 120TB never touched
④ Files are very small: 90% smaller than 6.3MB
⑤ Fairly random I/O: 130KB median read run
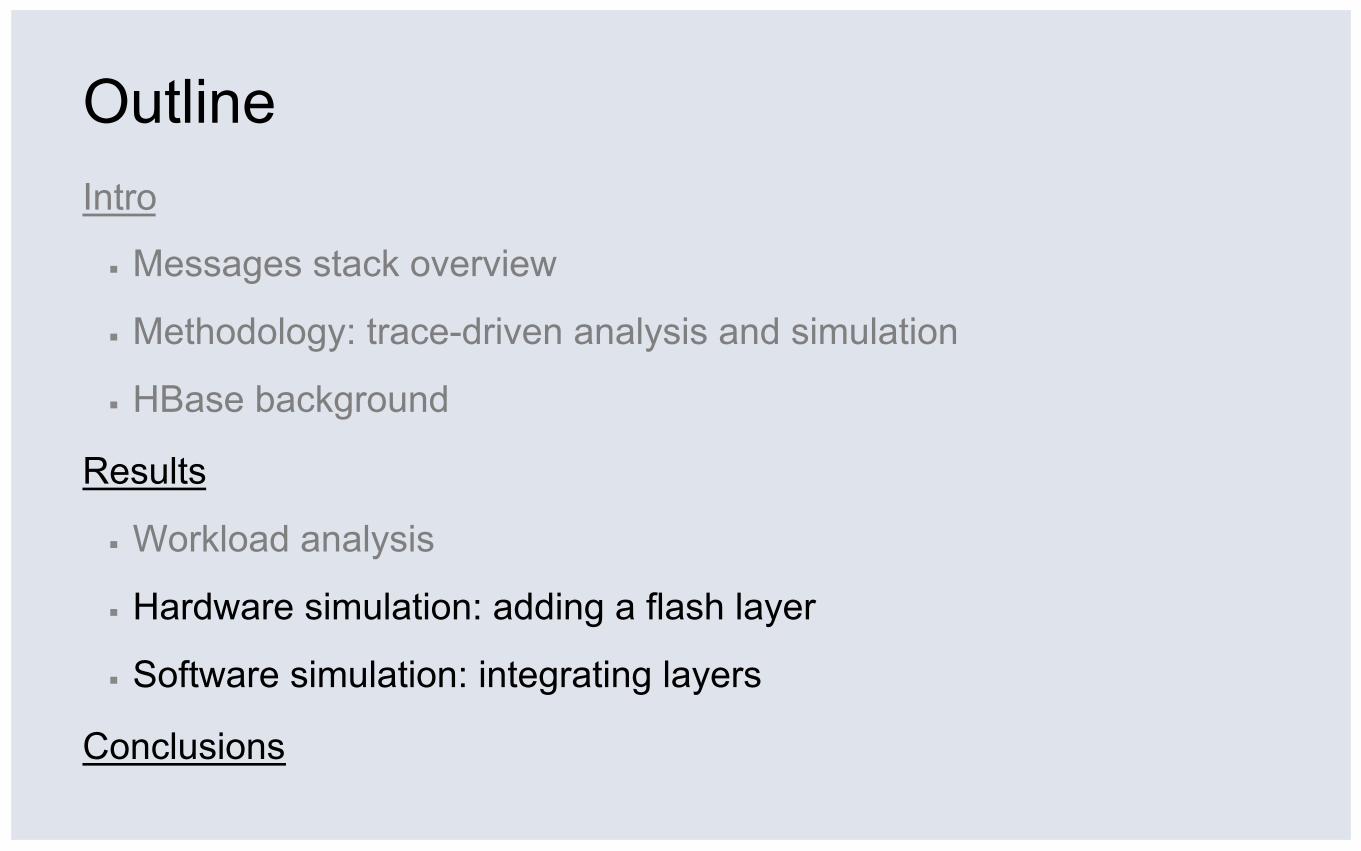
Outline Intro
▪ Messages stack overview
▪ Methodology: trace-driven analysis and simulation
▪ HBase background
Results
▪ Workload analysis
▪ Hardware simulation: adding a flash layer
▪ Software simulation: integrating layers
Conclusions
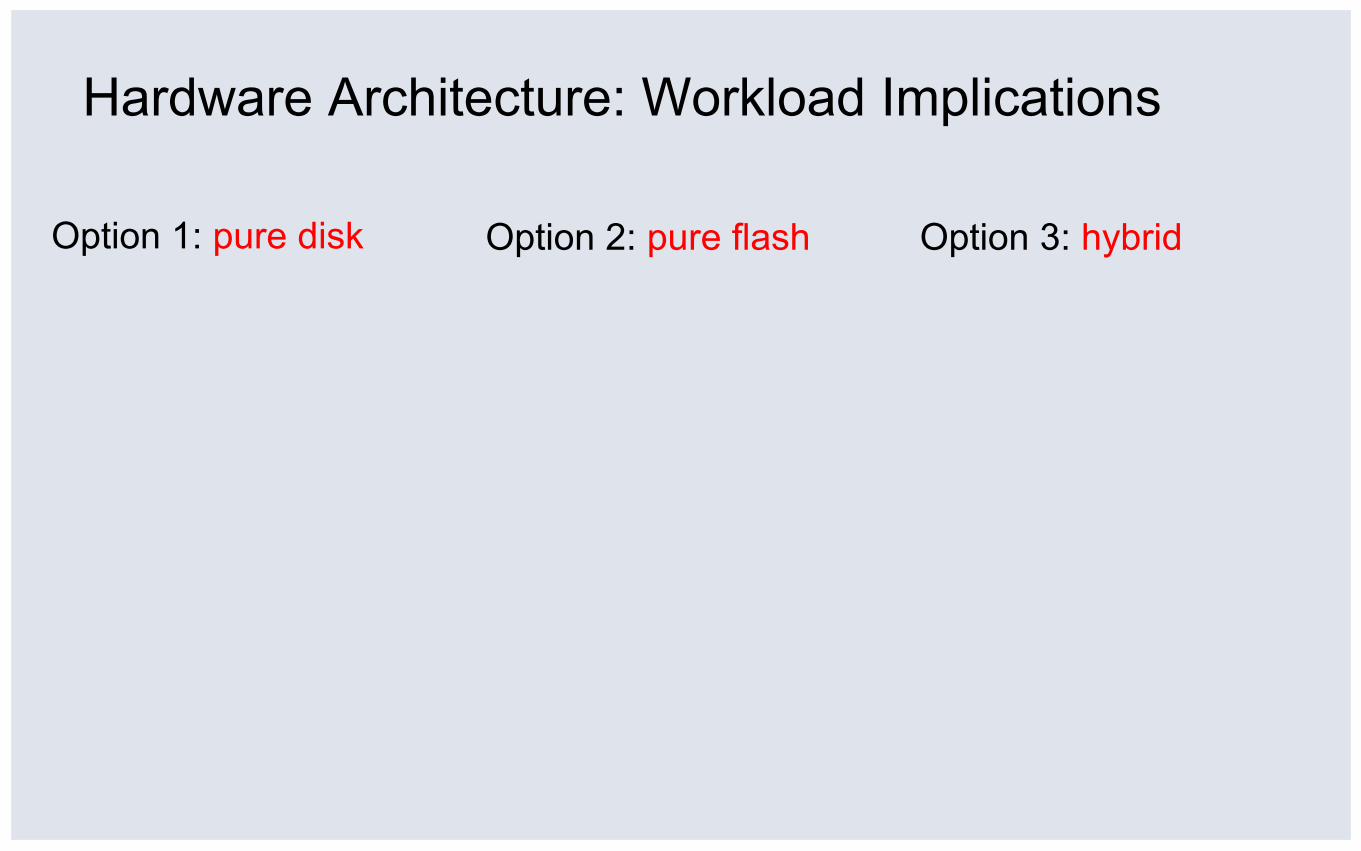
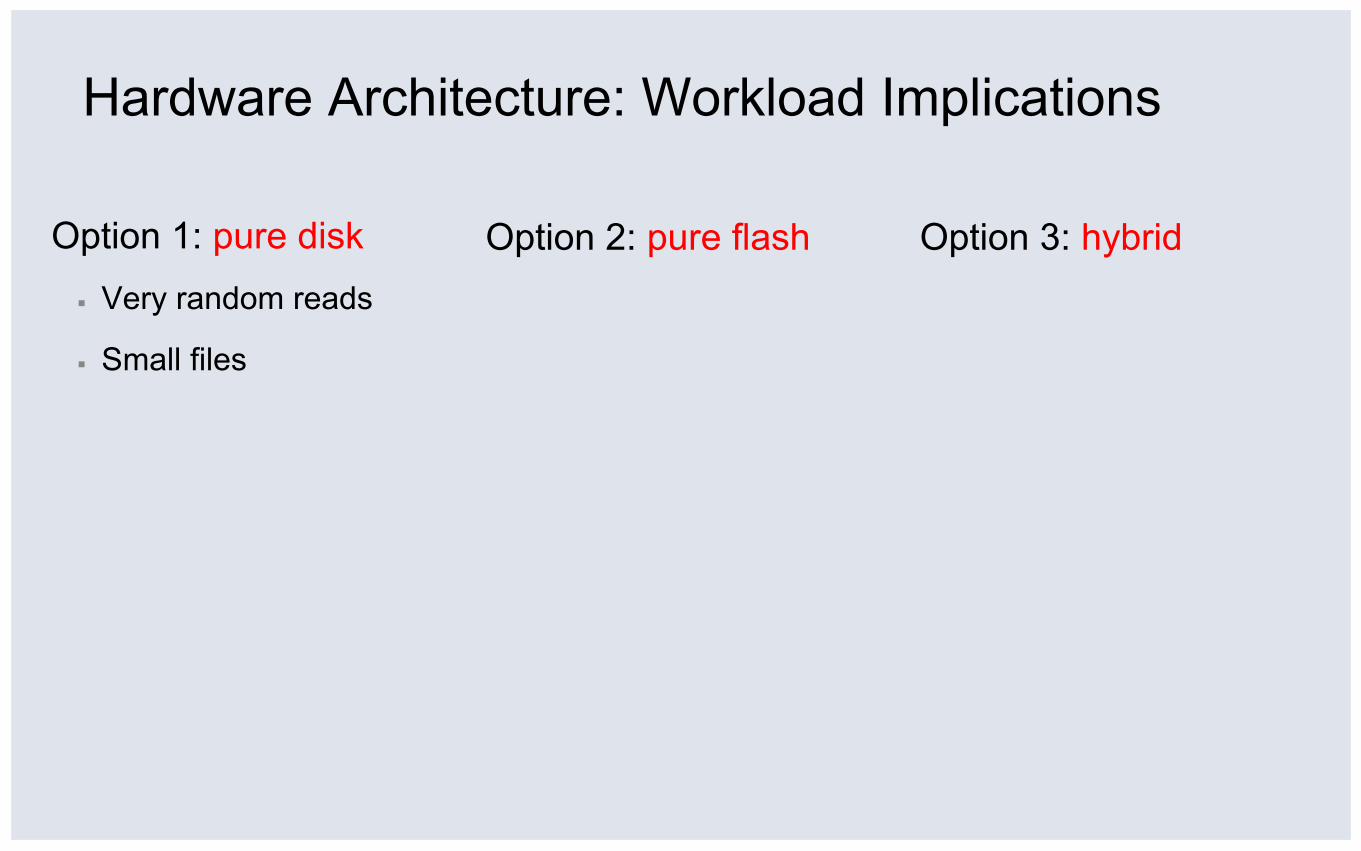
Hardware Architecture: Workload Implications
Option 1: pure disk Option 2: pure flash Option 3: hybrid
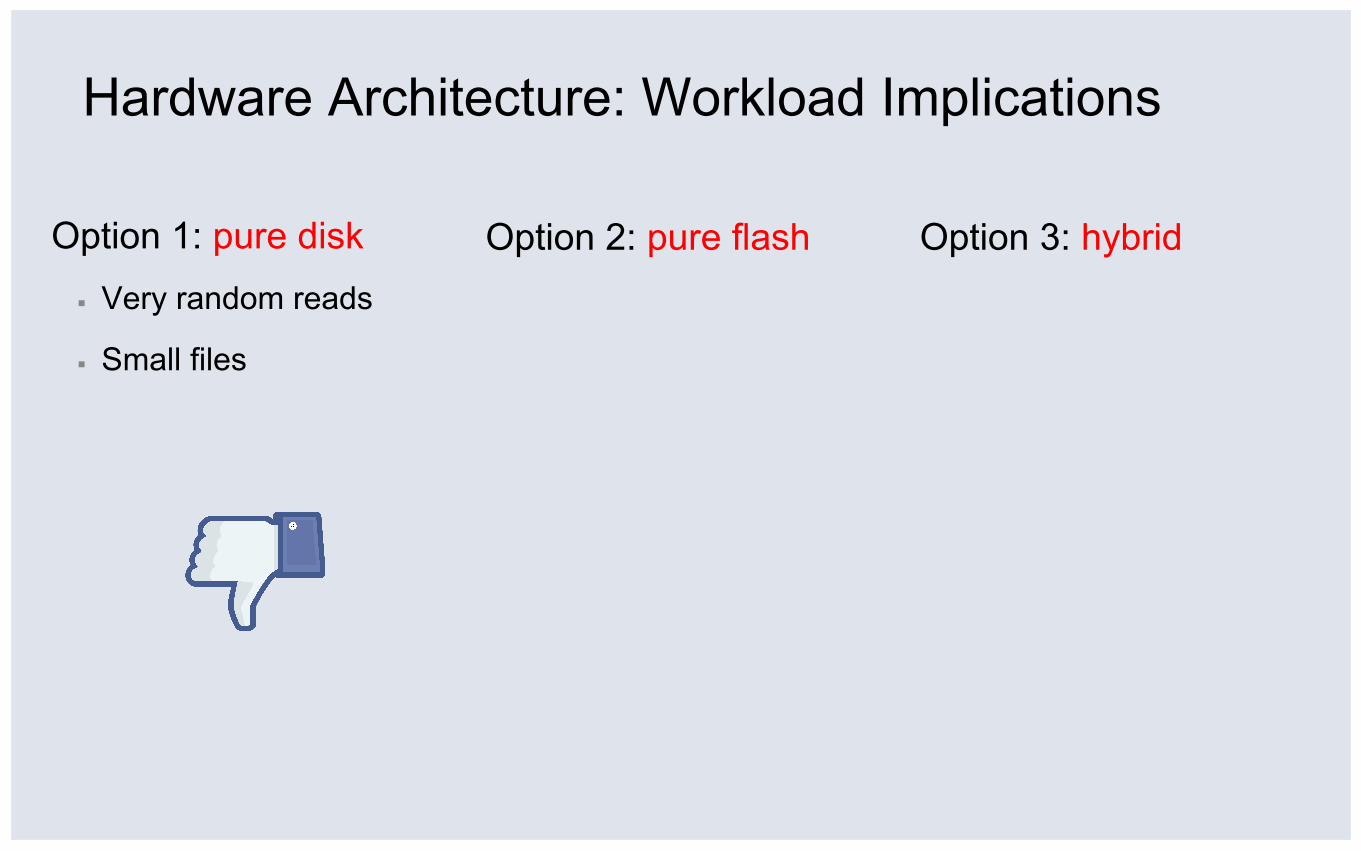
Hardware Architecture: Workload Implications
Option 1: pure disk ▪ Very random reads
▪ Small files
Option 2: pure flash Option 3: hybrid
Hardware Architecture: Workload Implications
Option 1: pure disk ▪ Very random reads
▪ Small files
Option 2: pure flash Option 3: hybrid
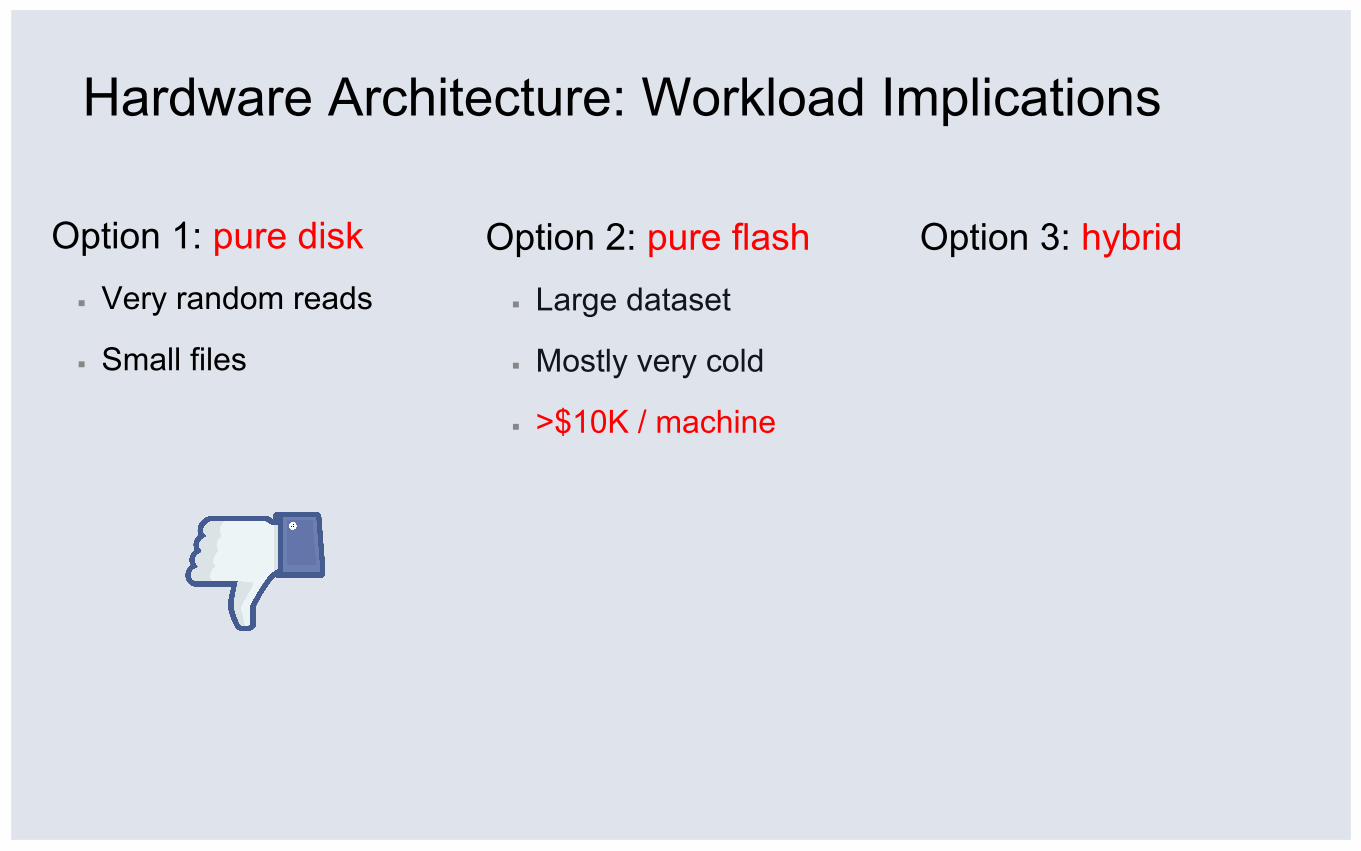
Hardware Architecture: Workload Implications
Option 1: pure disk ▪ Very random reads
▪ Small files
Option 2: pure flash ▪ Large dataset
▪ Mostly very cold
▪ >$10K / machine
Option 3: hybrid
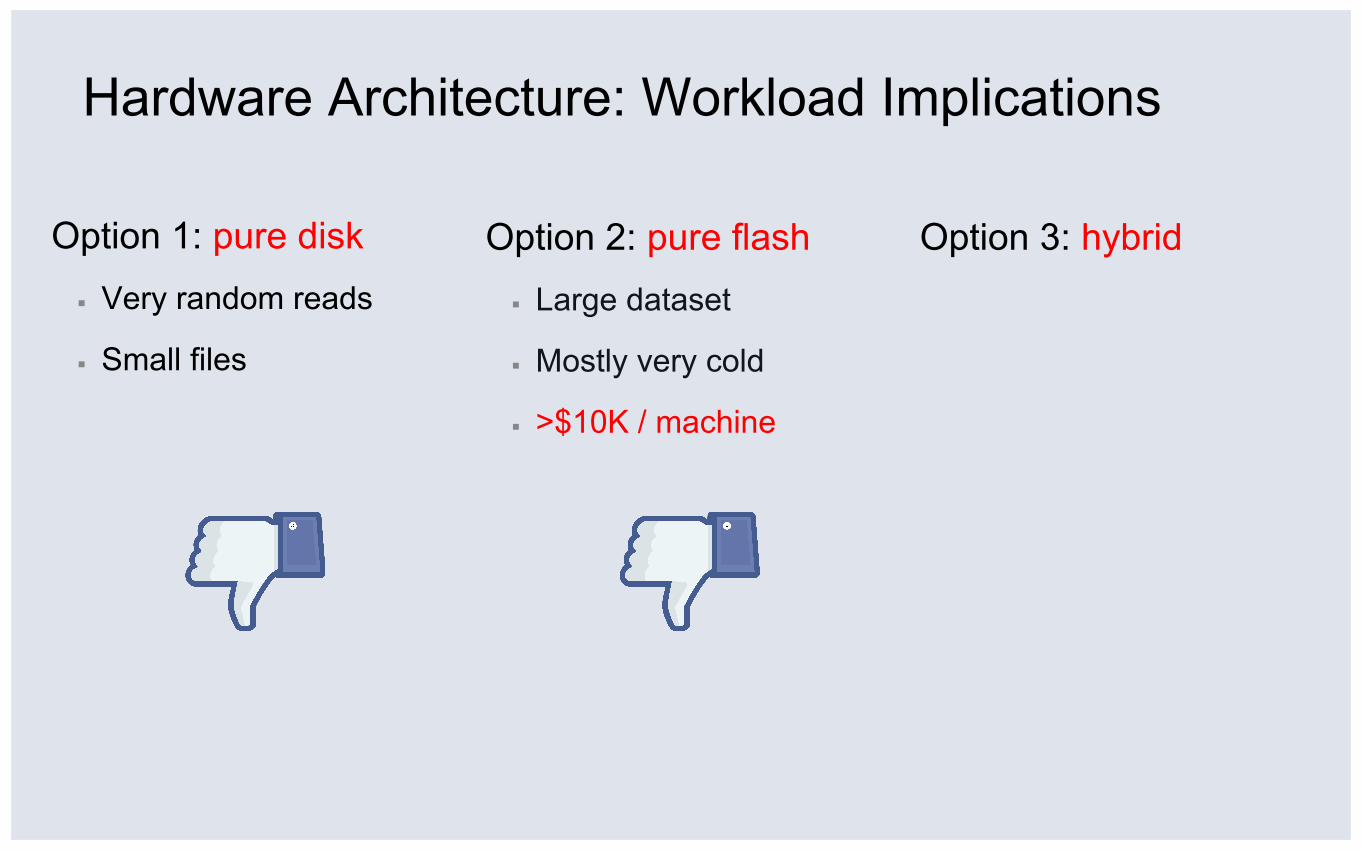
Hardware Architecture: Workload Implications
Option 1: pure disk ▪ Very random reads
▪ Small files
Option 2: pure flash ▪ Large dataset
▪ Mostly very cold
▪ >$10K / machine
Option 3: hybrid
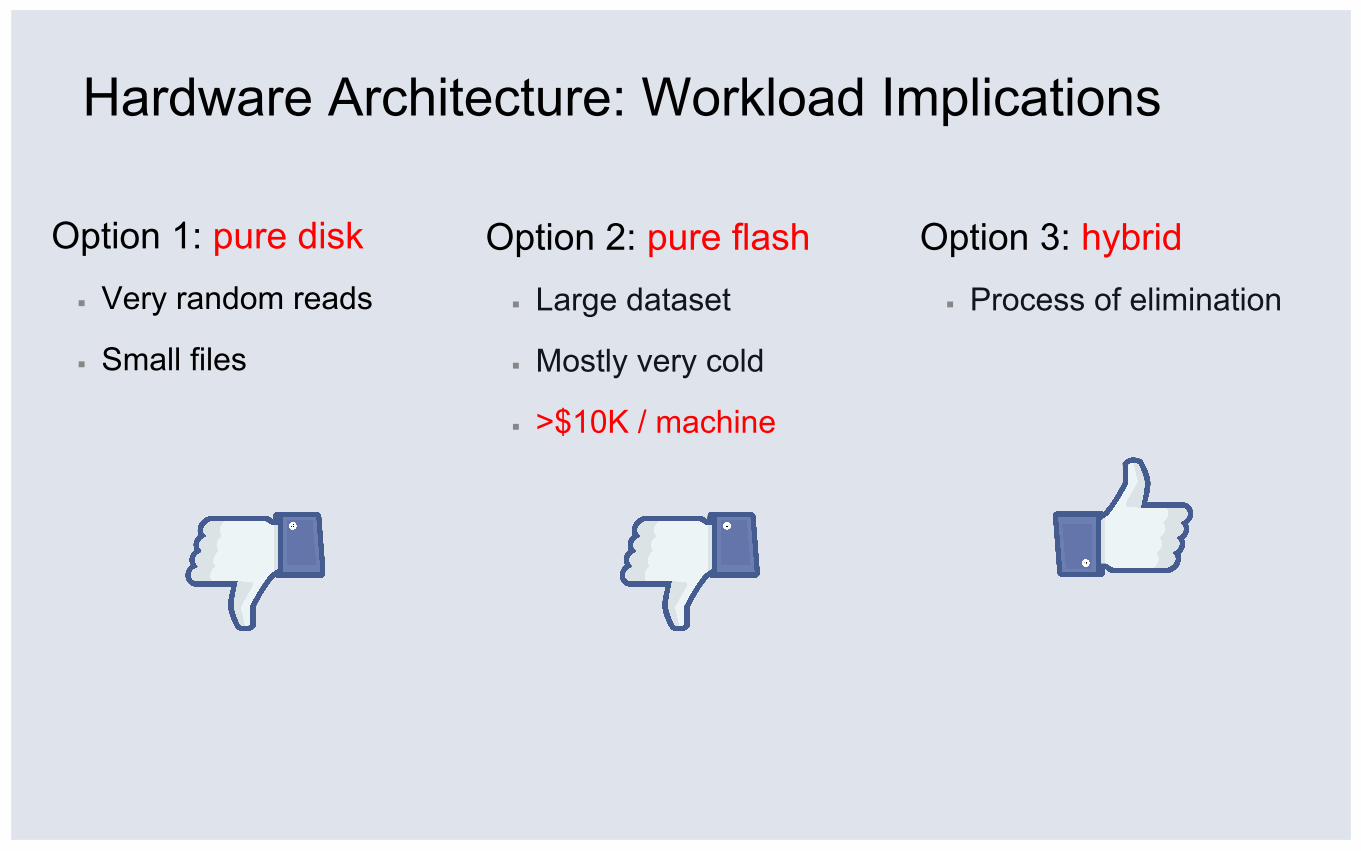
Hardware Architecture: Workload Implications
Option 1: pure disk ▪ Very random reads
▪ Small files
Option 2: pure flash ▪ Large dataset
▪ Mostly very cold
▪ >$10K / machine
Option 3: hybrid ▪ Process of elimination

Evaluate cost and performance of 36 hardware combinations (3x3x4) ▪ Disks: 10, 15, or 20 ▪ RAM (cache): 10, 30, or 100GB ▪ Flash (cache): 0, 60, 120, or 240GB
Assumptions:
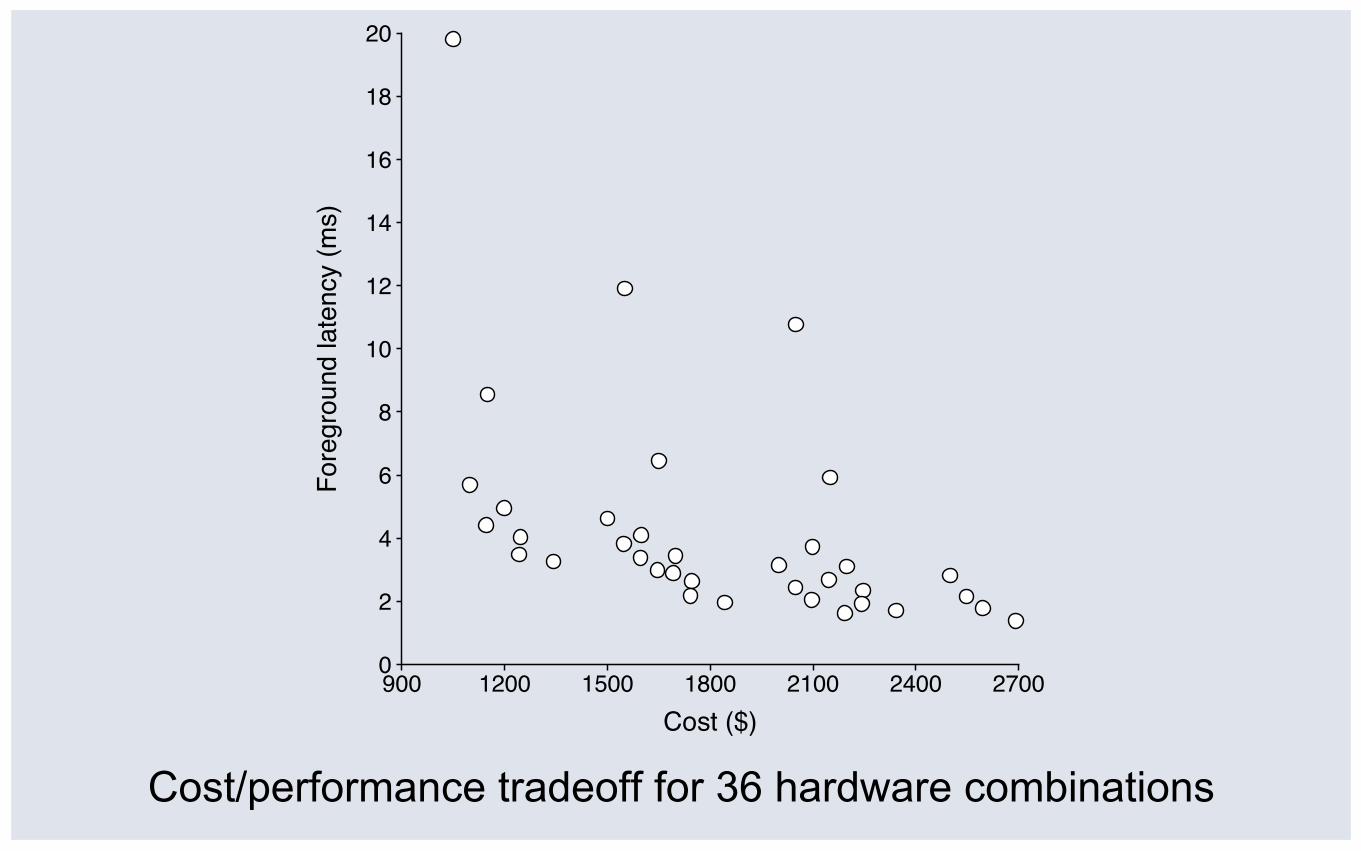
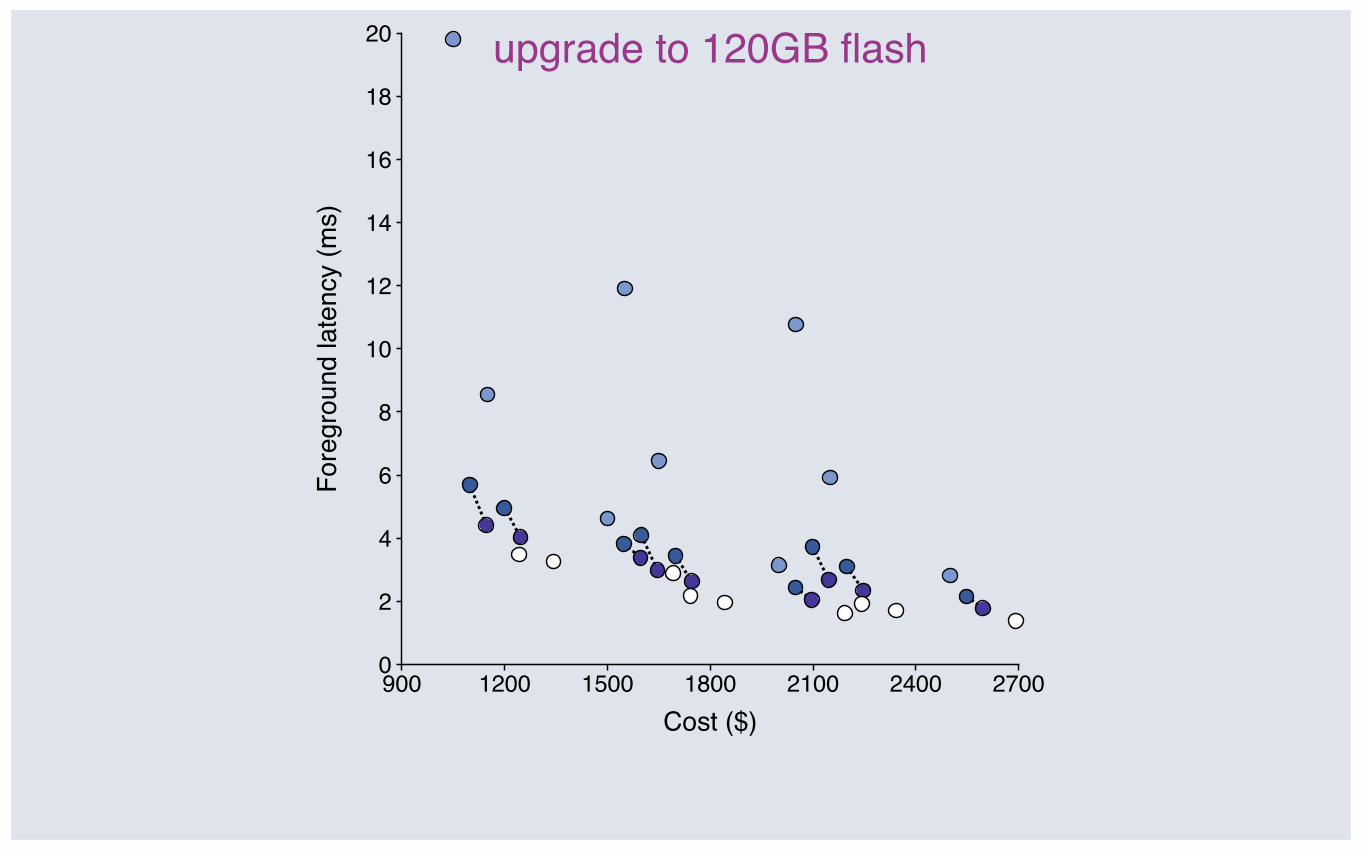
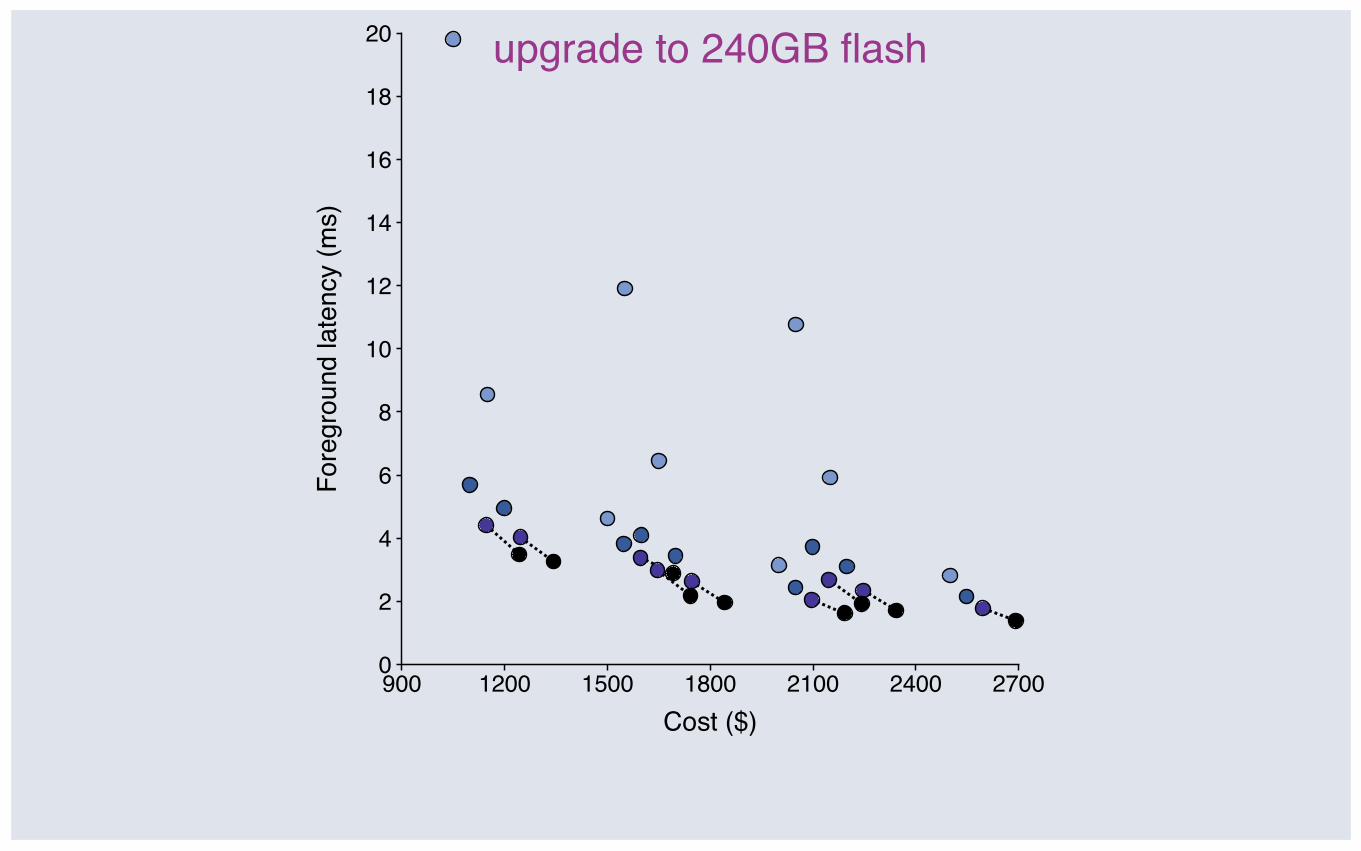
Hardware Architecture: Simulation Results
Hardware Cost Performance HDD $100/disk 10ms seek, 100MB/s RAM $5/GB zero latency Flash $0.8/GB 0.5ms
900 1200 1500 1800 2100 2400 27000
2
4
6
8
10
12
14
16
18
20
Cost ($)
Fore
grou
nd la
tenc
y (m
s)
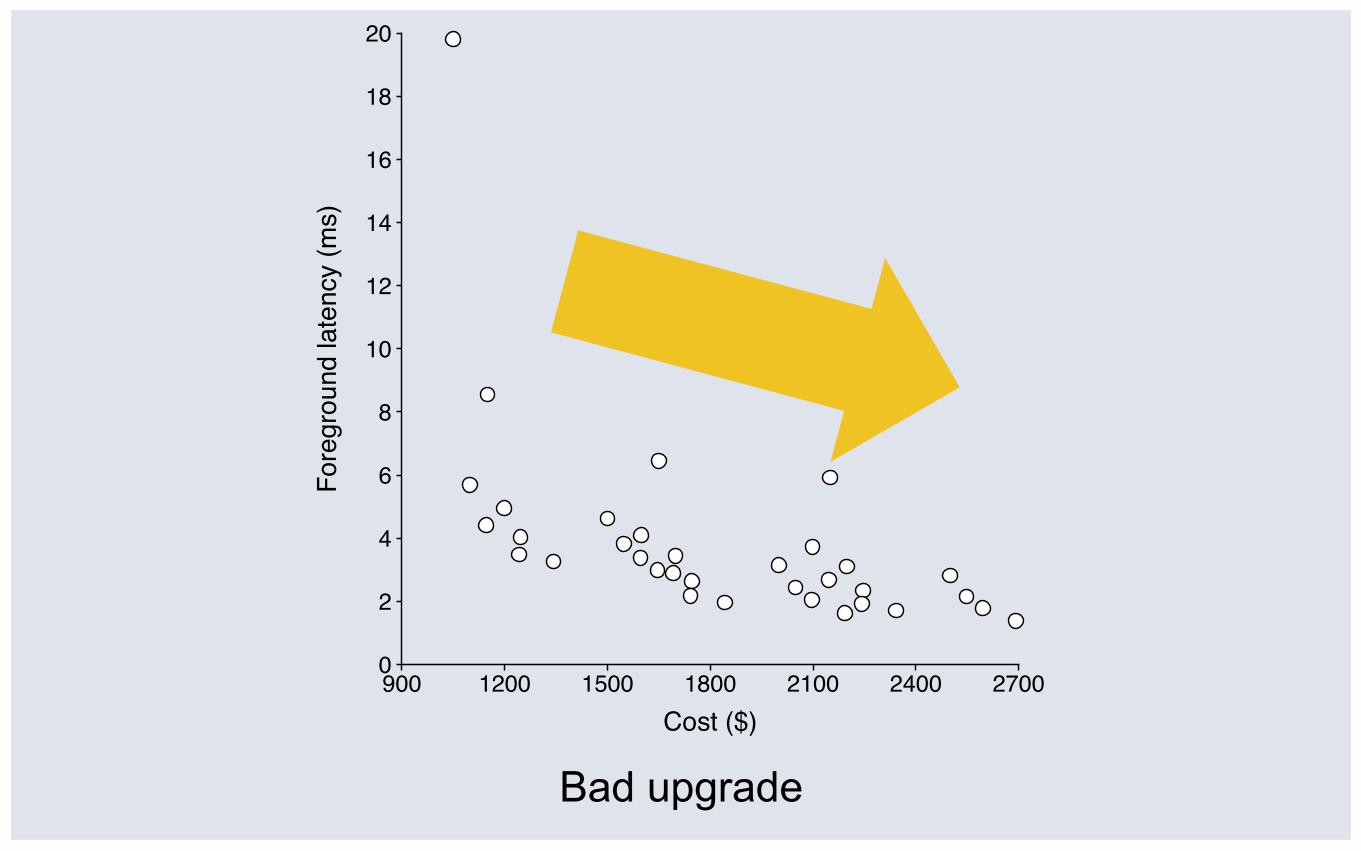
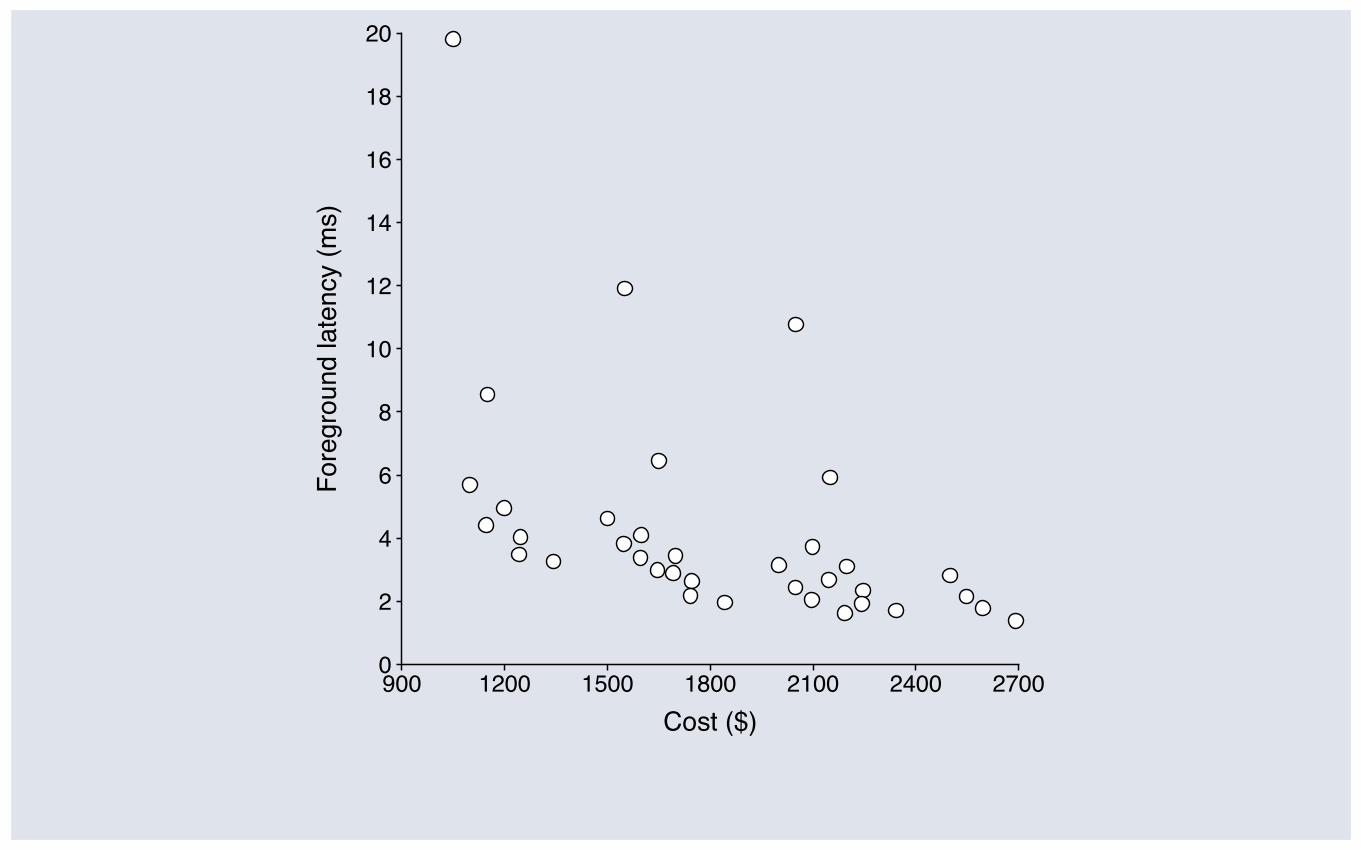
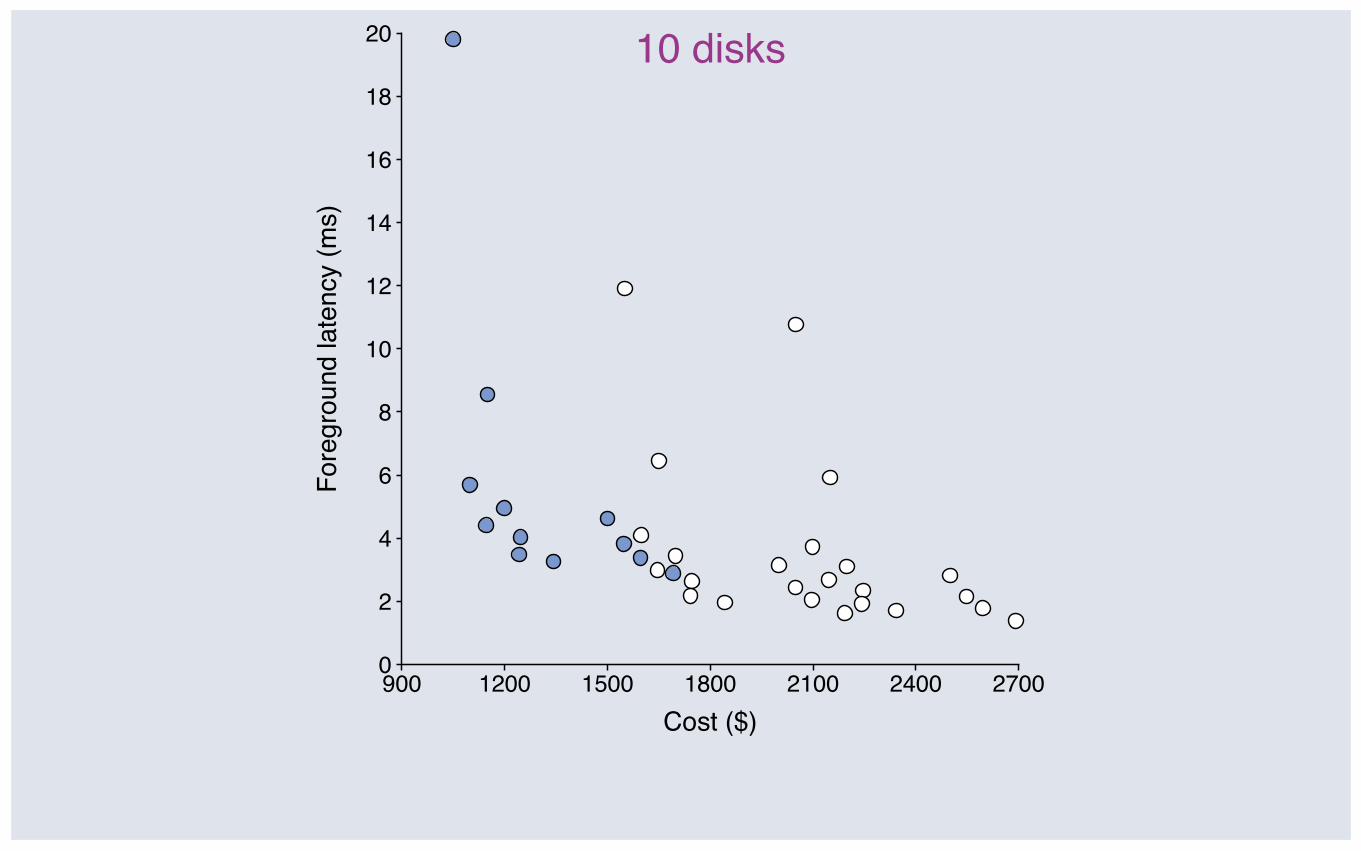
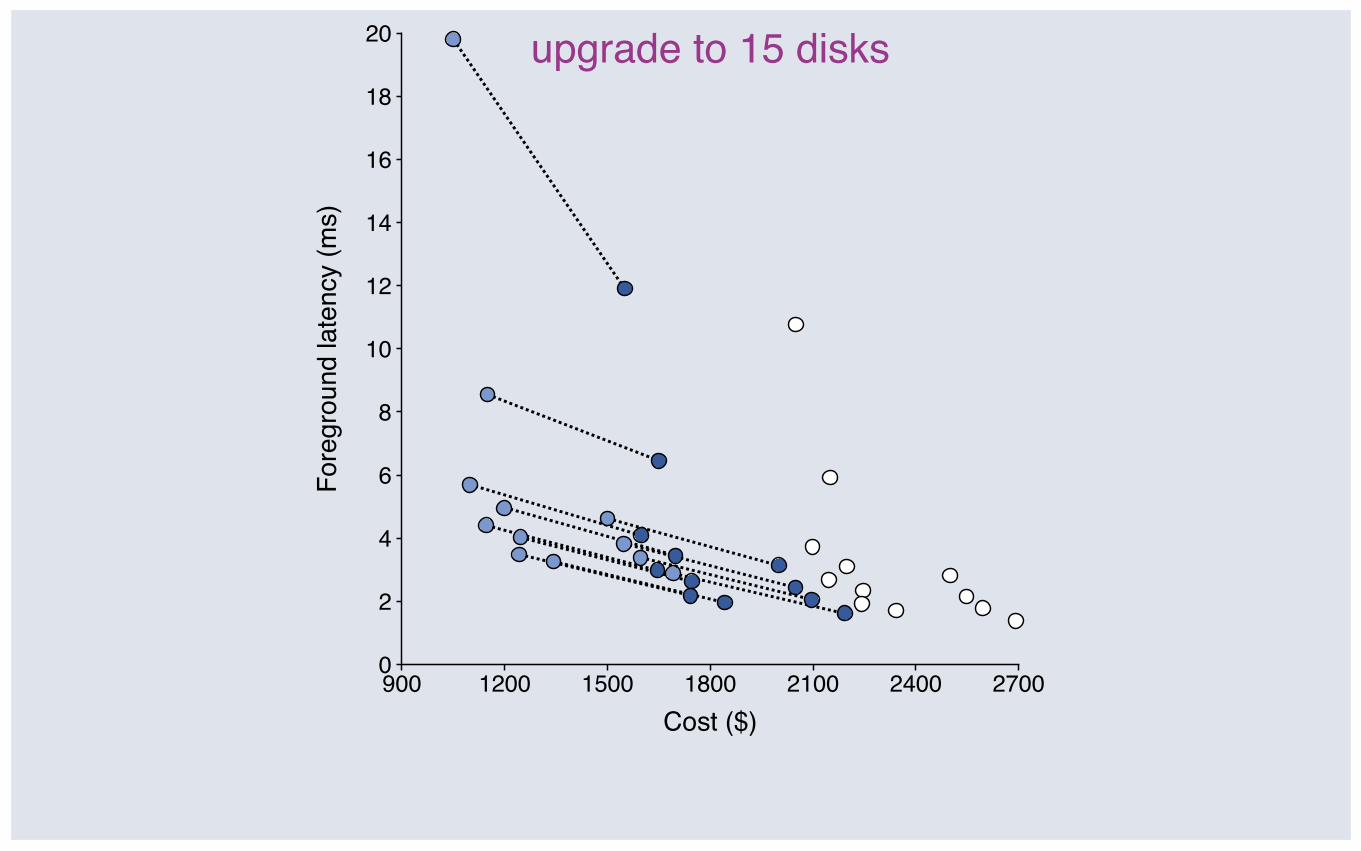
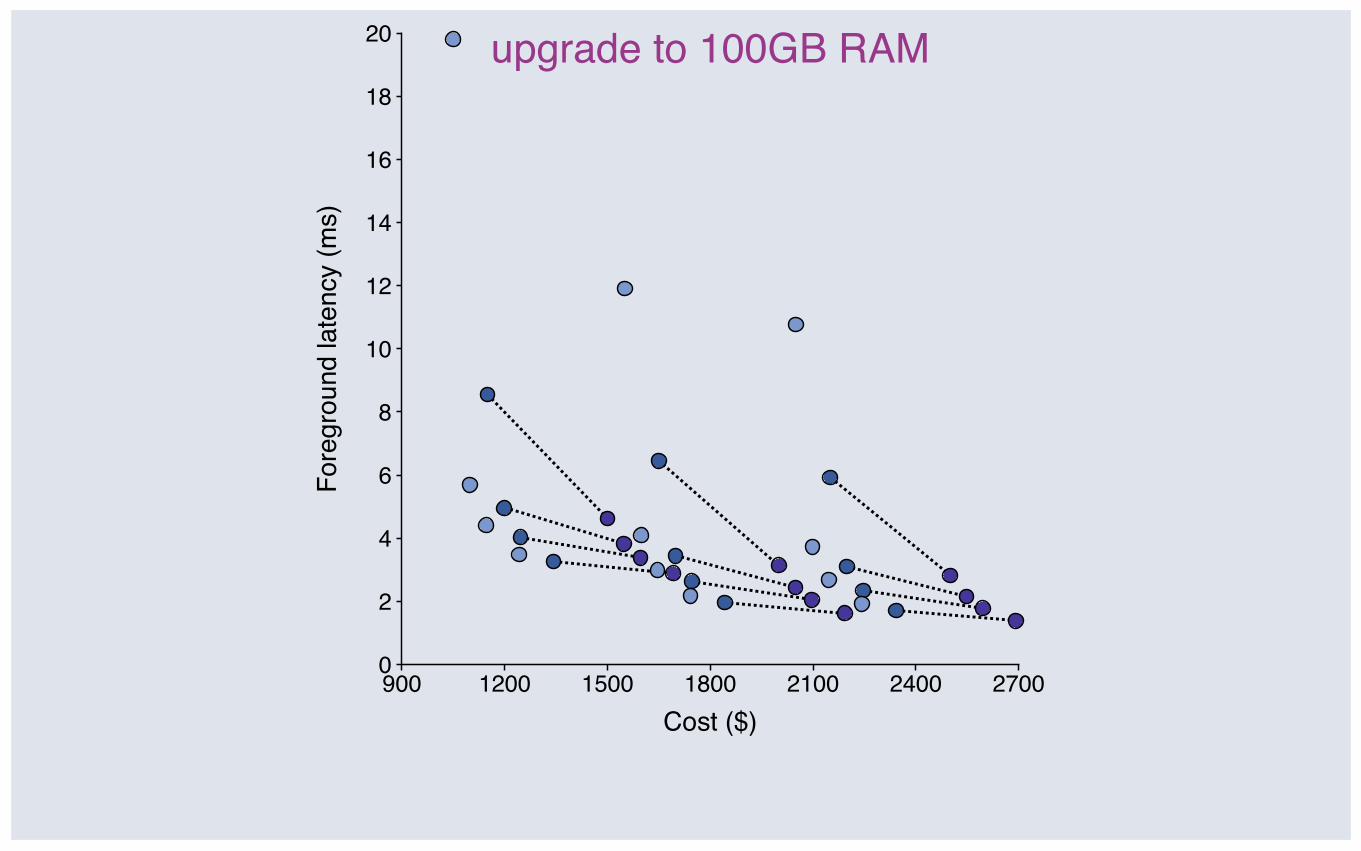
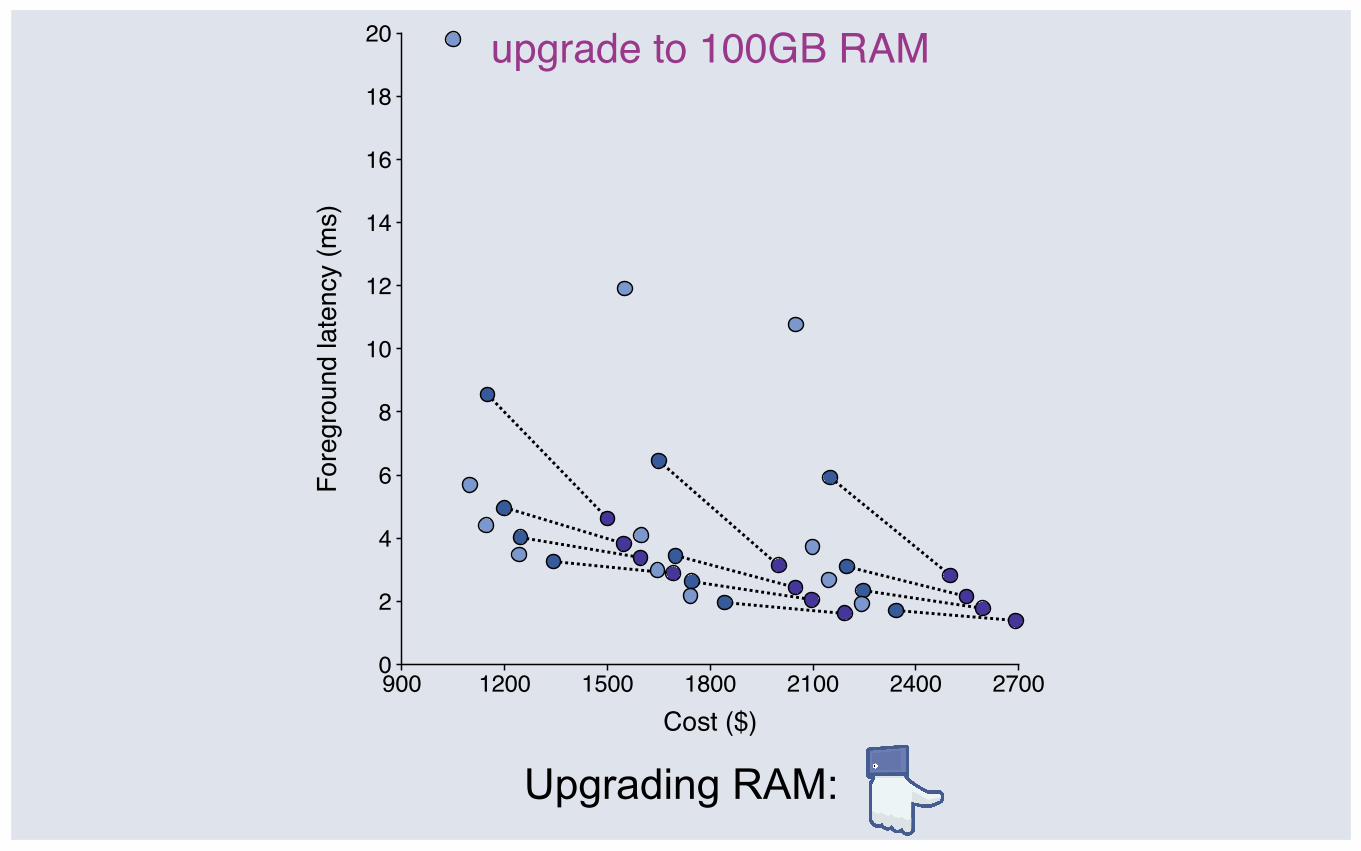
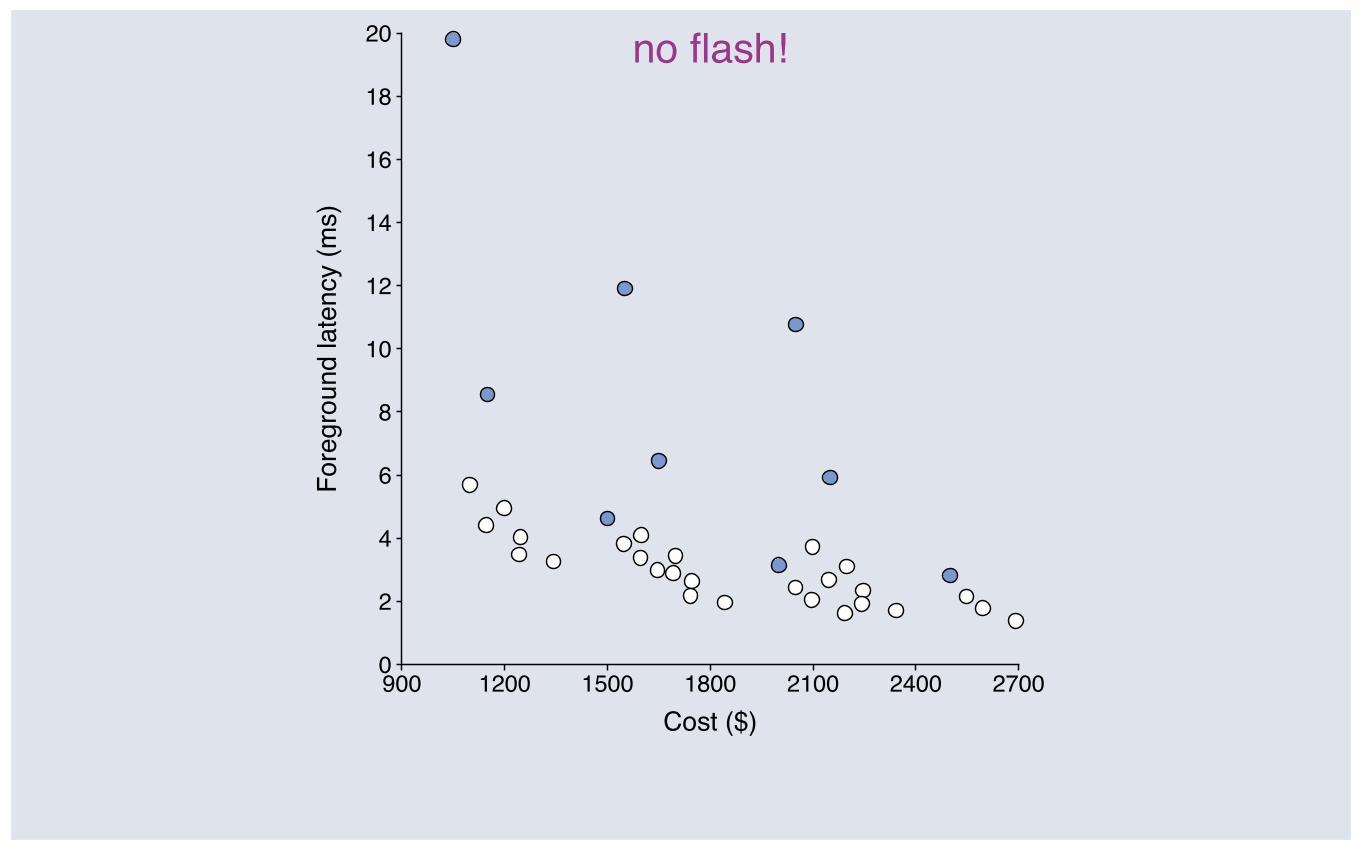
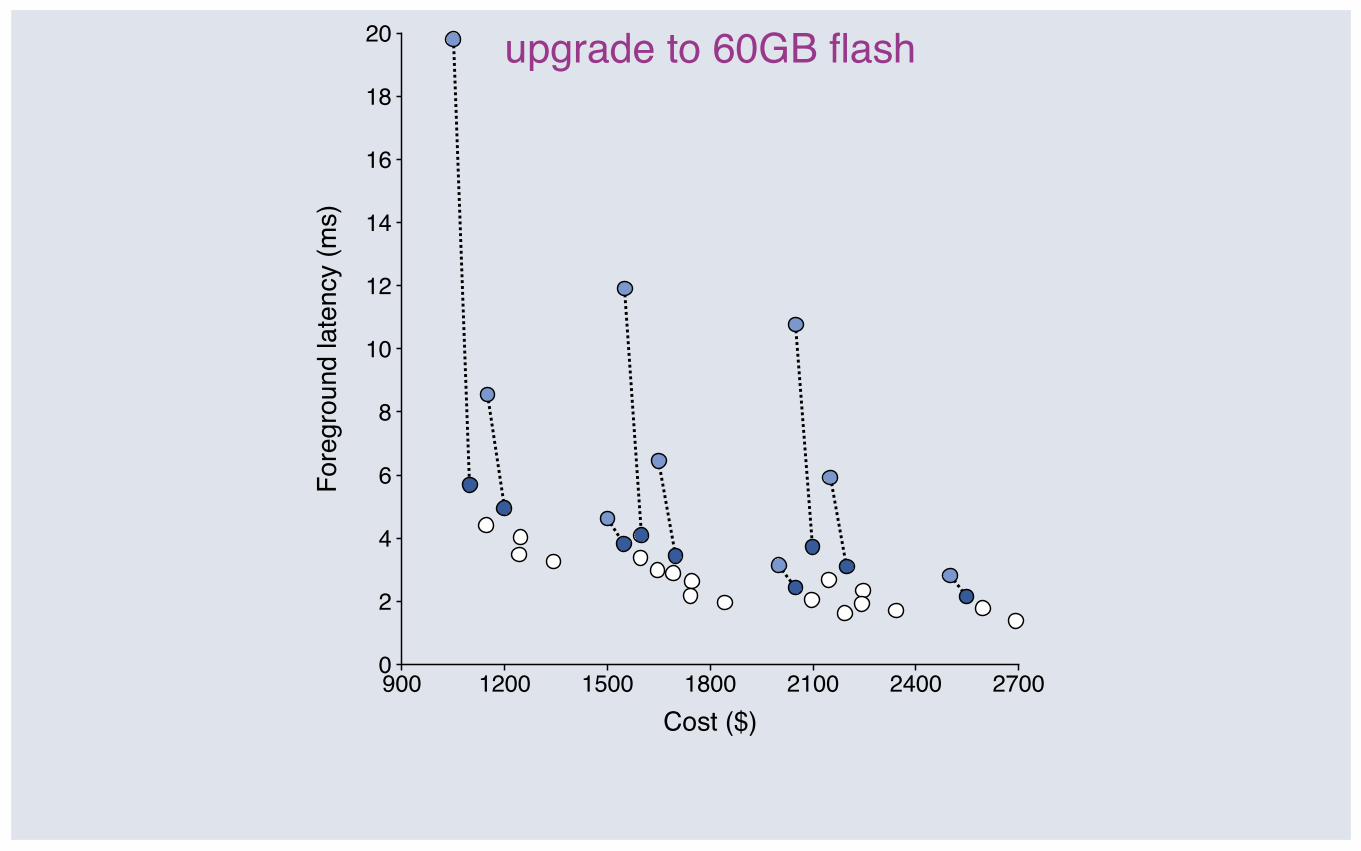
Cost/performance tradeoff for 36 hardware combinations
900 1200 1500 1800 2100 2400 27000
2
4
6
8
10
12
14
16
18
20
Cost ($)
Fore
grou
nd la
tenc
y (m
s)
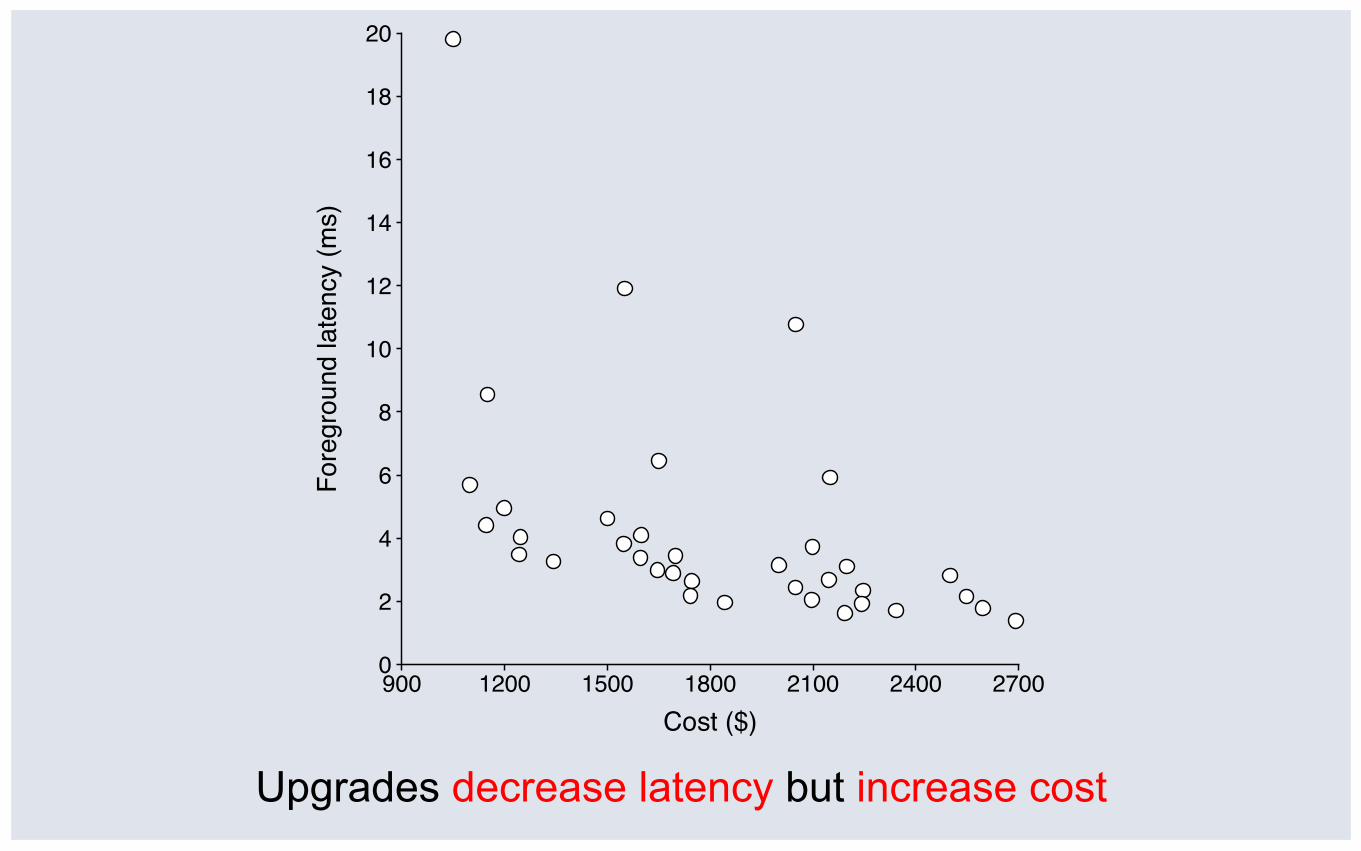
Upgrades decrease latency but increase cost
900 1200 1500 1800 2100 2400 27000
2
4
6
8
10
12
14
16
18
20
Cost ($)
Fore
grou
nd la
tenc
y (m
s)
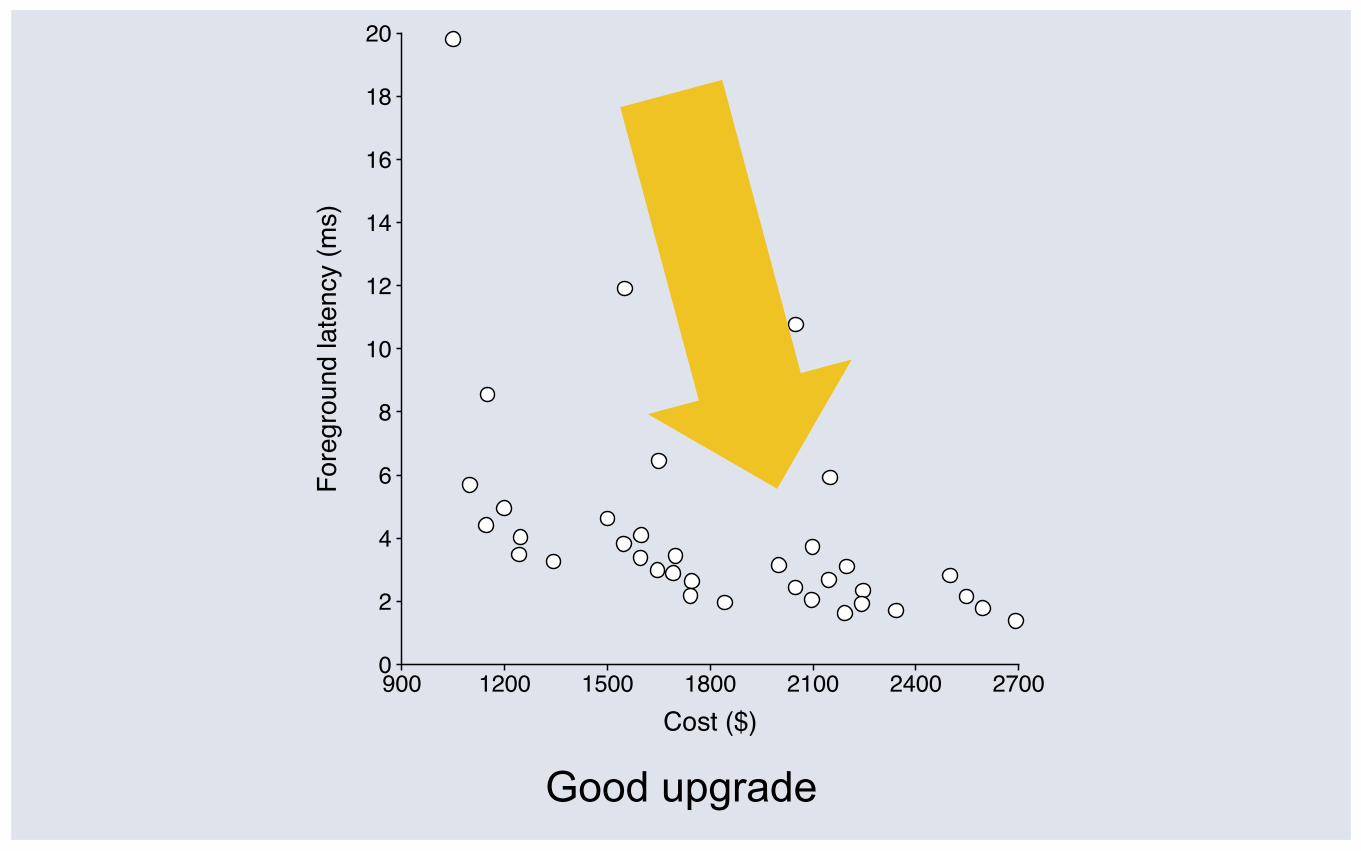
Good upgrade
900 1200 1500 1800 2100 2400 27000
2
4
6
8
10
12
14
16
18
20
Cost ($)
Fore
grou
nd la
tenc
y (m
s)
Bad upgrade
900 1200 1500 1800 2100 2400 27000
2
4
6
8
10
12
14
16
18
20
Cost ($)
Fore
grou
nd la
tenc
y (m
s)
900 1200 1500 1800 2100 2400 27000
2
4
6
8
10
12
14
16
18
20
Cost ($)
Fore
grou
nd la
tenc
y (m
s)
10 disks
900 1200 1500 1800 2100 2400 27000
2
4
6
8
10
12
14
16
18
20
Cost ($)
Fore
grou
nd la
tenc
y (m
s)
upgrade to 15 disks
900 1200 1500 1800 2100 2400 27000
2
4
6
8
10
12
14
16
18
20
Cost ($)
Fore
grou
nd la
tenc
y (m
s)
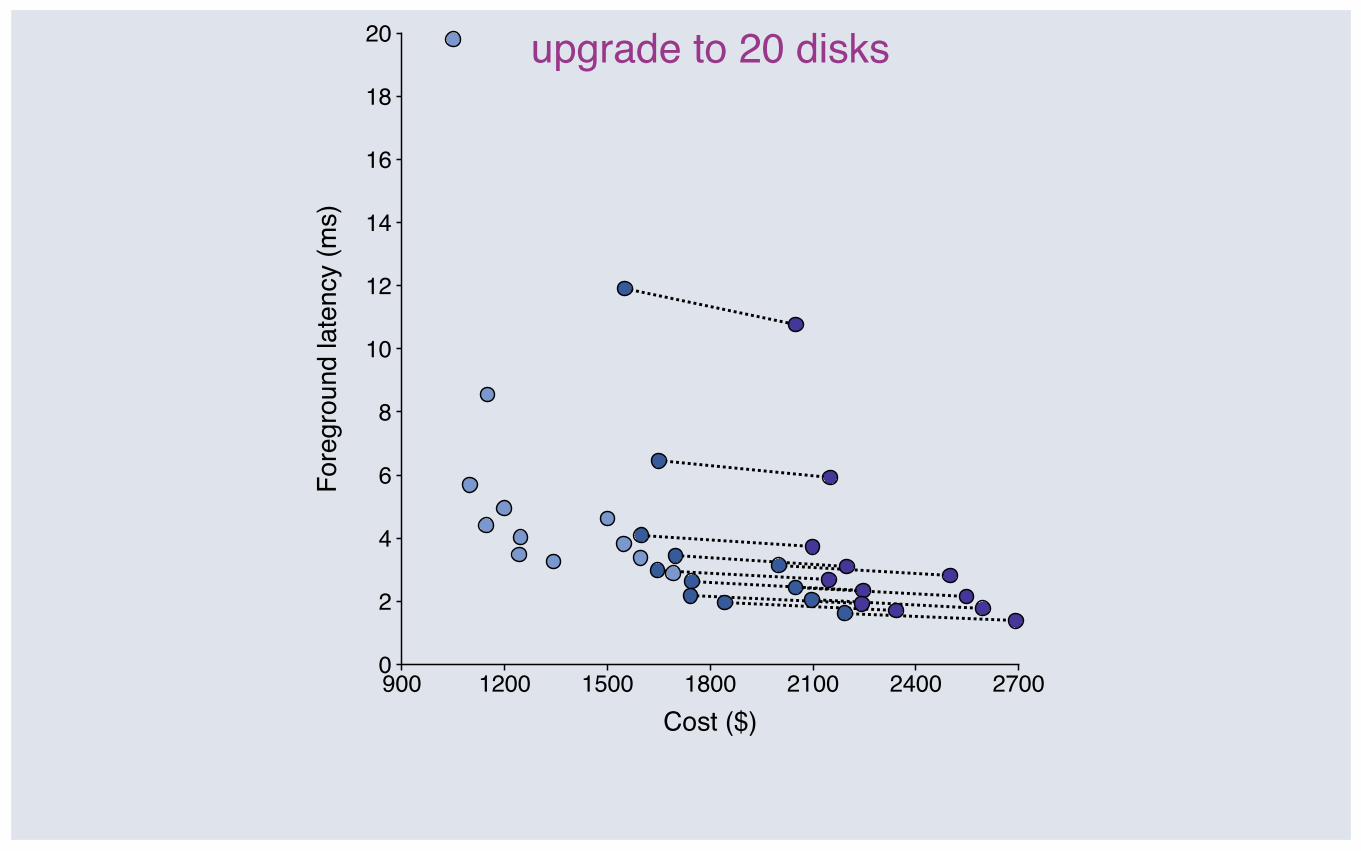
upgrade to 20 disks
900 1200 1500 1800 2100 2400 27000
2
4
6
8
10
12
14
16
18
20
Cost ($)
Fore
grou
nd la
tenc
y (m
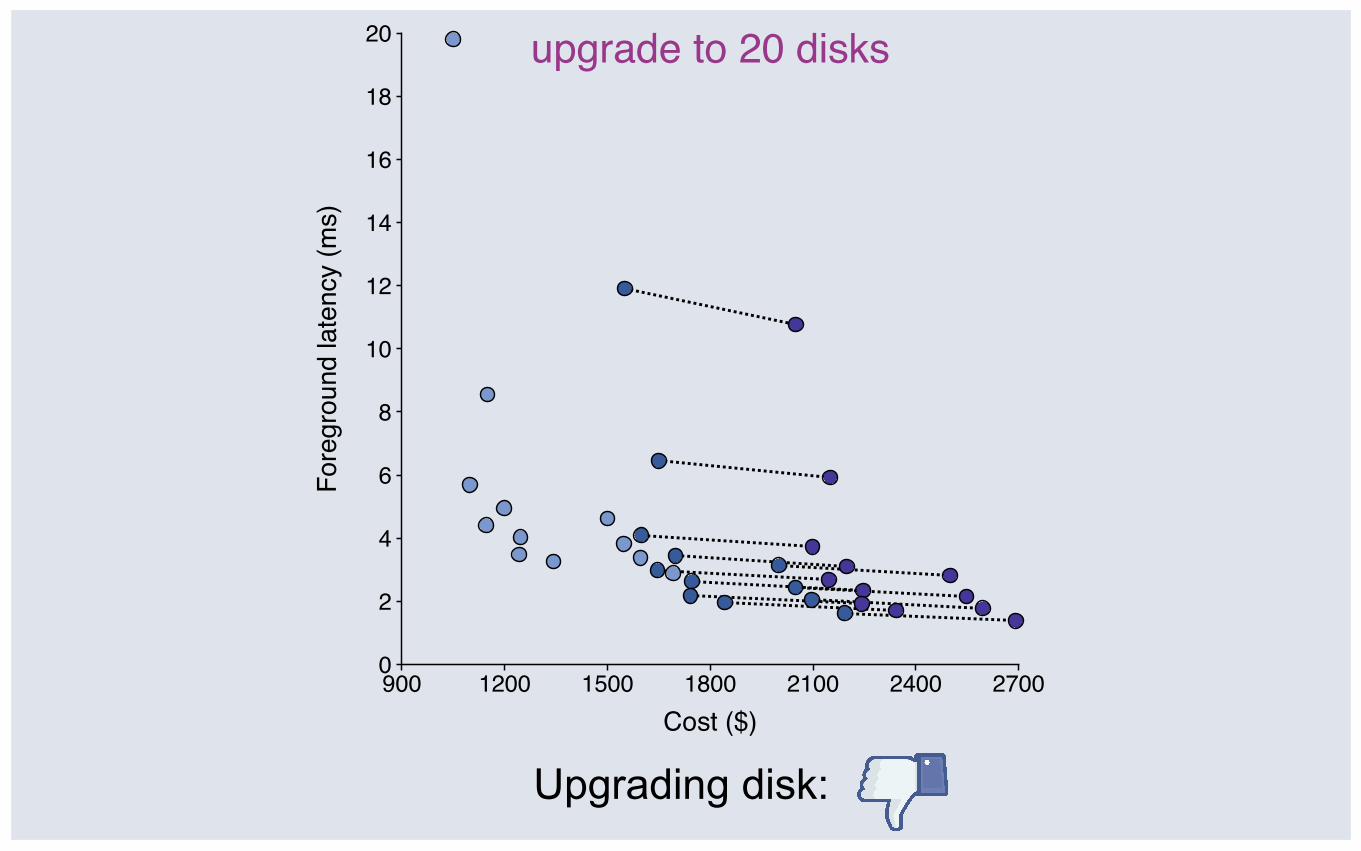
s)
upgrade to 20 disks
Upgrading disk:

900 1200 1500 1800 2100 2400 27000
2
4
6
8
10
12
14
16
18
20
Cost ($)
Fore
grou
nd la
tenc
y (m
s)
900 1200 1500 1800 2100 2400 27000
2
4
6
8
10
12
14
16
18
20
Cost ($)
Fore
grou
nd la
tenc
y (m
s)
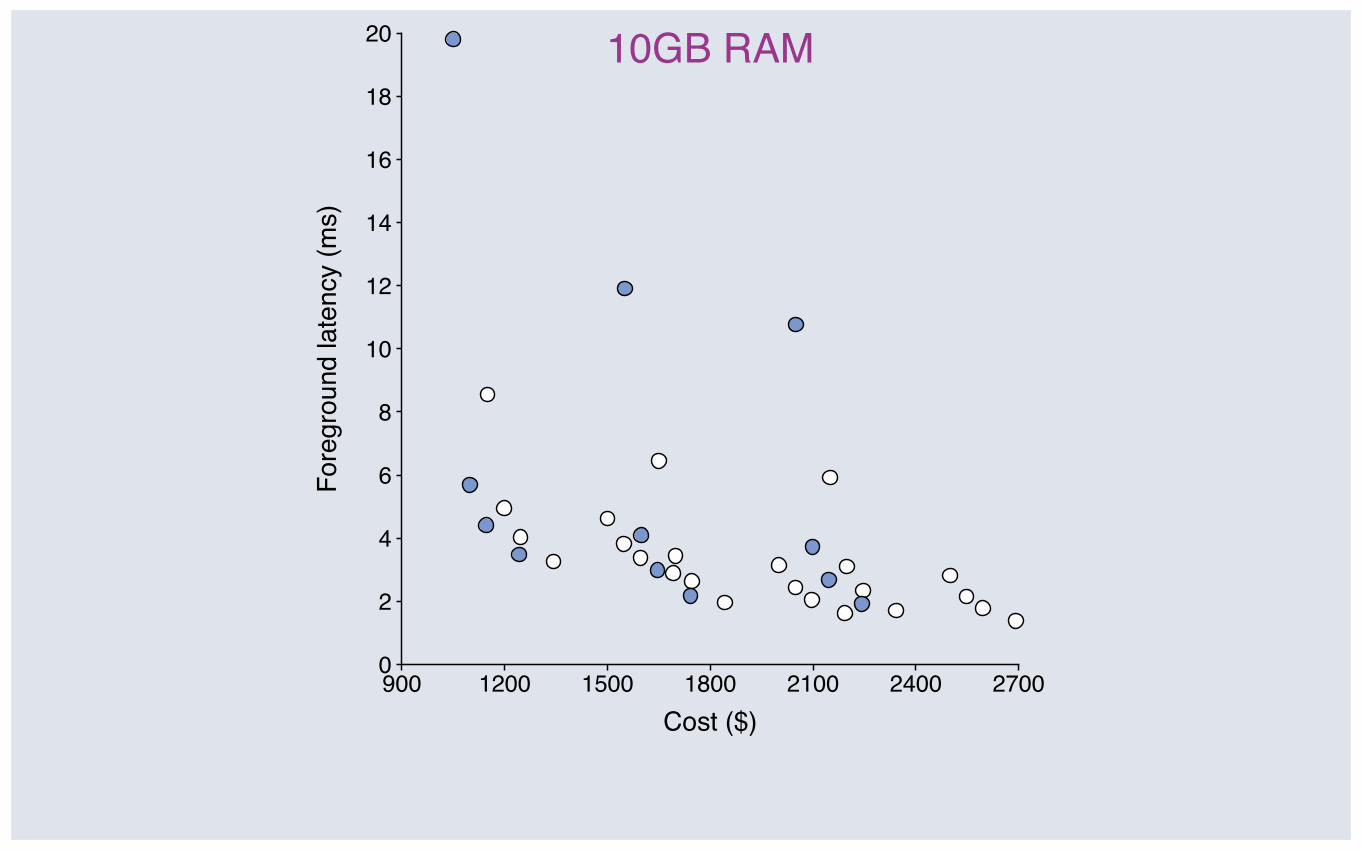
10GB RAM
900 1200 1500 1800 2100 2400 27000
2
4
6
8
10
12
14
16
18
20
Cost ($)
Fore
grou
nd la
tenc
y (m
s)
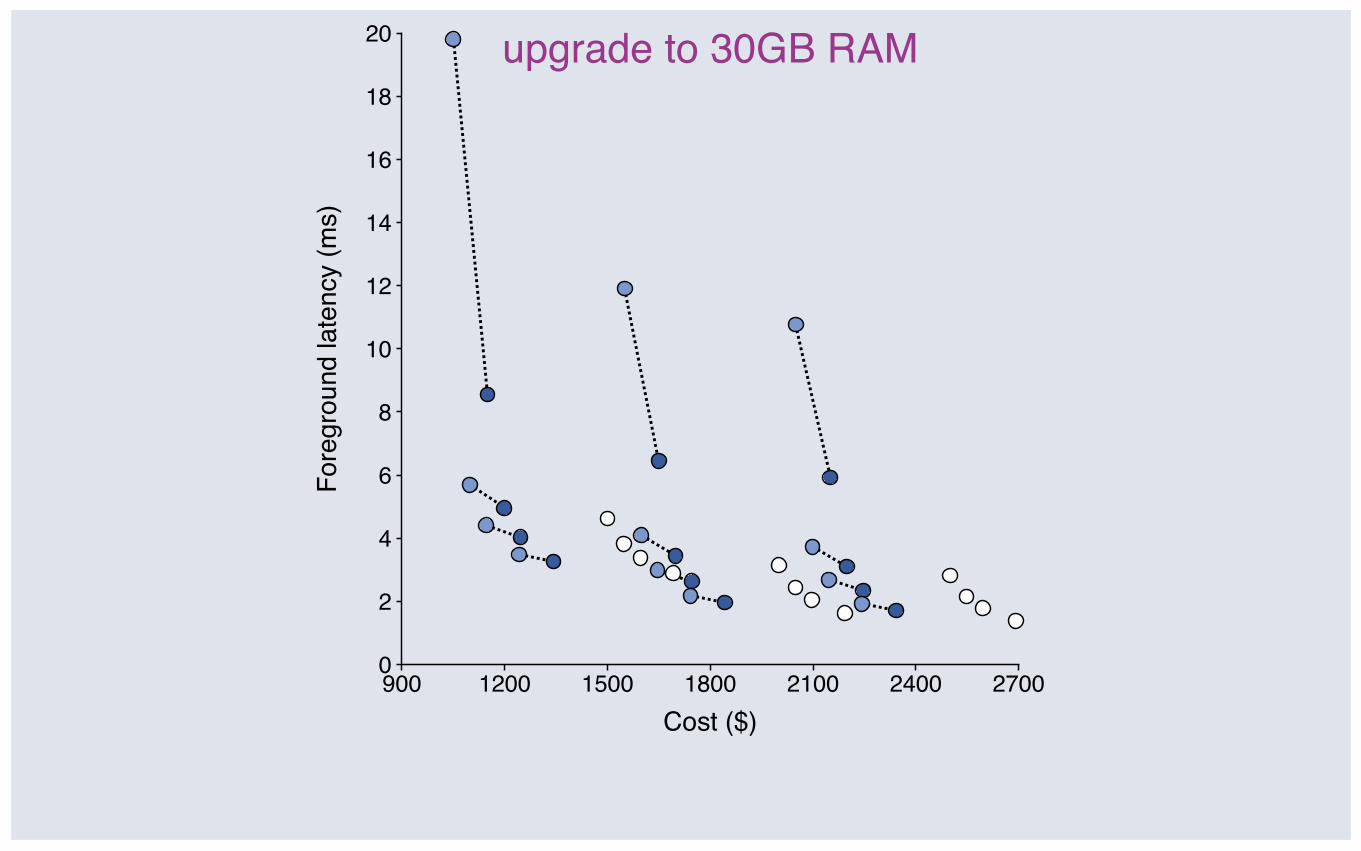
upgrade to 30GB RAM
900 1200 1500 1800 2100 2400 27000
2
4
6
8
10
12
14
16
18
20
Cost ($)
Fore
grou
nd la
tenc
y (m
s)
upgrade to 100GB RAM
900 1200 1500 1800 2100 2400 27000
2
4
6
8
10
12
14
16
18
20
Cost ($)
Fore
grou
nd la
tenc
y (m
s)
upgrade to 100GB RAM
Upgrading RAM:

900 1200 1500 1800 2100 2400 27000
2
4
6
8
10
12
14
16
18
20
Cost ($)
Fore
grou
nd la
tenc
y (m
s)
900 1200 1500 1800 2100 2400 27000
2
4
6
8
10
12
14
16
18
20
Cost ($)
Fore
grou
nd la
tenc
y (m
s)
no flash!
900 1200 1500 1800 2100 2400 27000
2
4
6
8
10
12
14
16
18
20
Cost ($)
Fore
grou
nd la
tenc
y (m
s)
upgrade to 60GB flash
900 1200 1500 1800 2100 2400 27000
2
4
6
8
10
12
14
16
18
20
Cost ($)
Fore
grou
nd la
tenc
y (m
s)
upgrade to 120GB flash
900 1200 1500 1800 2100 2400 27000
2
4
6
8
10
12
14
16
18
20
Cost ($)
Fore
grou
nd la
tenc
y (m
s)
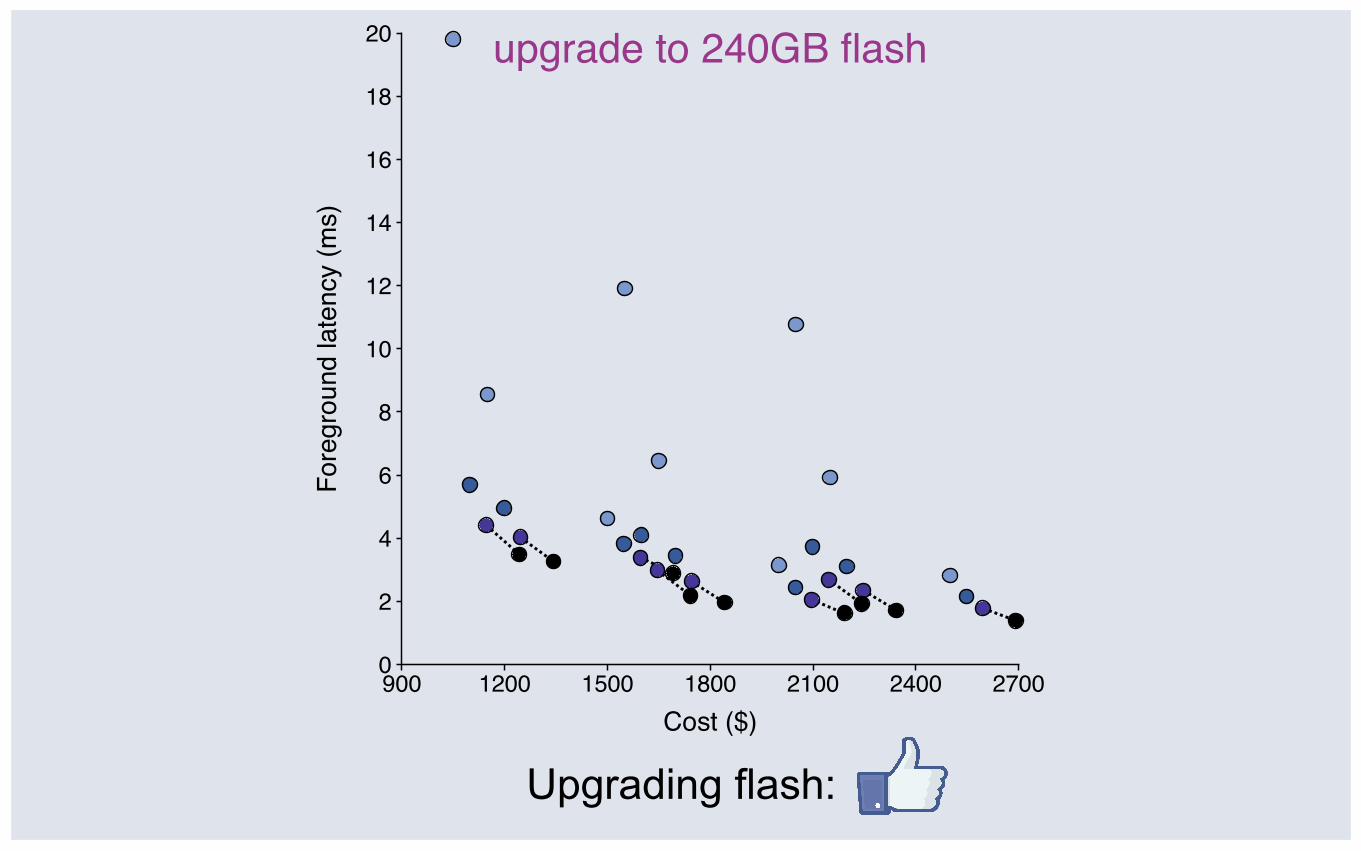
upgrade to 240GB flash
900 1200 1500 1800 2100 2400 27000
2
4
6
8
10
12
14
16
18
20
Cost ($)
Fore
grou
nd la
tenc
y (m
s)
upgrade to 240GB flash
Upgrading flash:
Outline Intro
▪ Messages stack overview
▪ Methodology: trace-driven analysis and simulation
▪ HBase background
Results
▪ Workload analysis
▪ Hardware simulation: adding a flash layer
▪ Software simulation: integrating layers
Conclusions
Software Architecture: Workload Implications
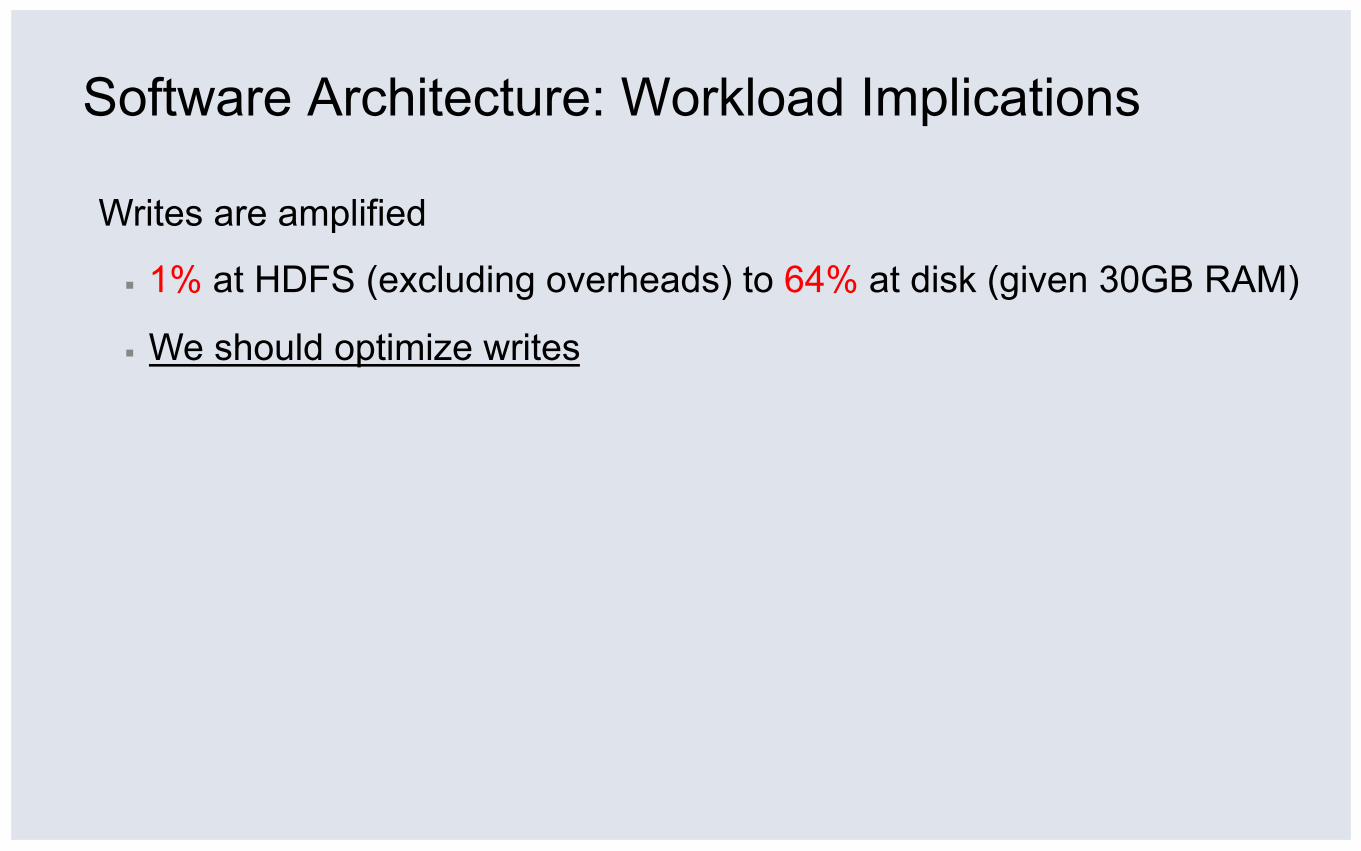
Writes are amplified
▪ 1% at HDFS (excluding overheads) to 64% at disk (given 30GB RAM)
▪ We should optimize writes
Software Architecture: Workload Implications
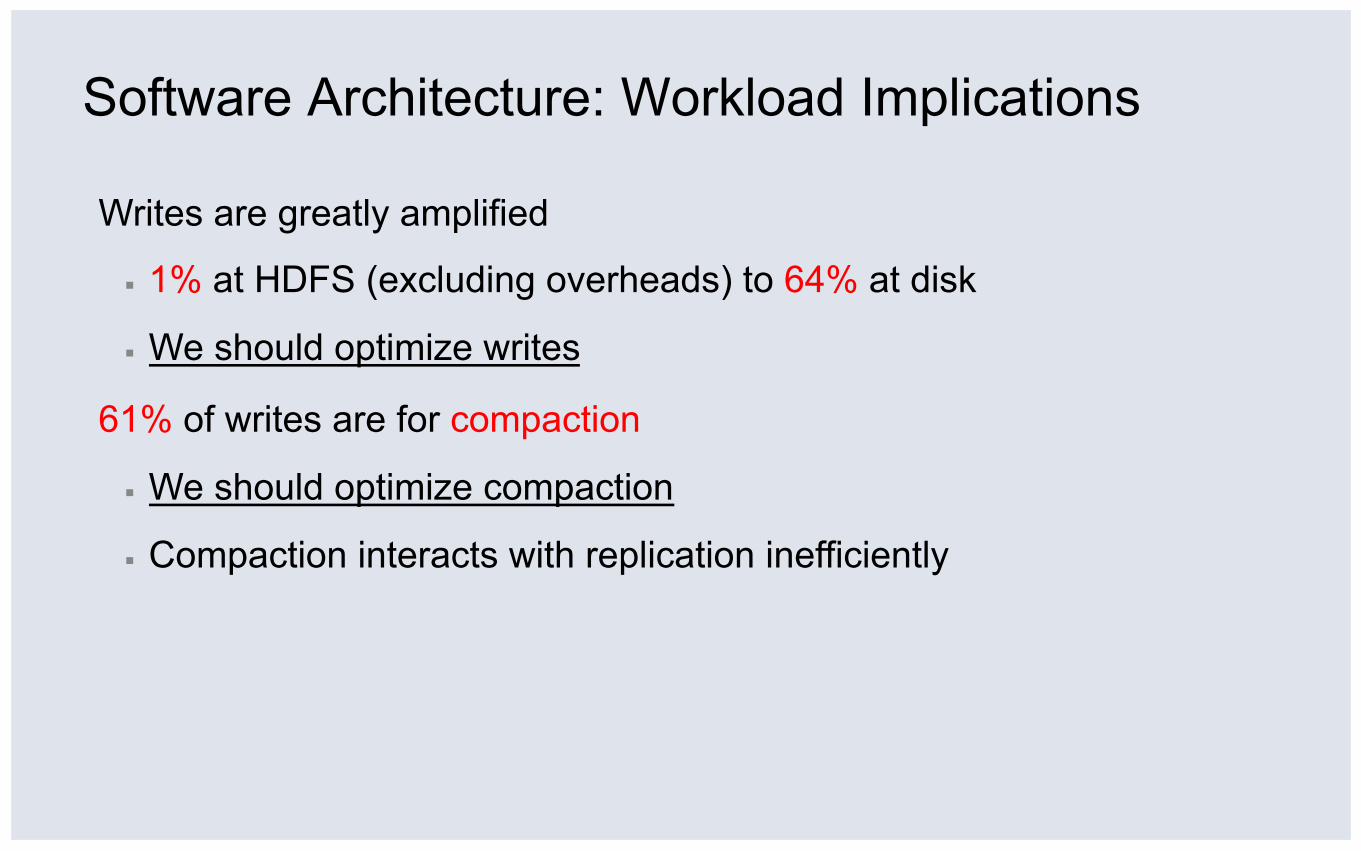
Writes are greatly amplified
▪ 1% at HDFS (excluding overheads) to 64% at disk
▪ We should optimize writes
61% of writes are for compaction
▪ We should optimize compaction
▪ Compaction interacts with replication inefficiently
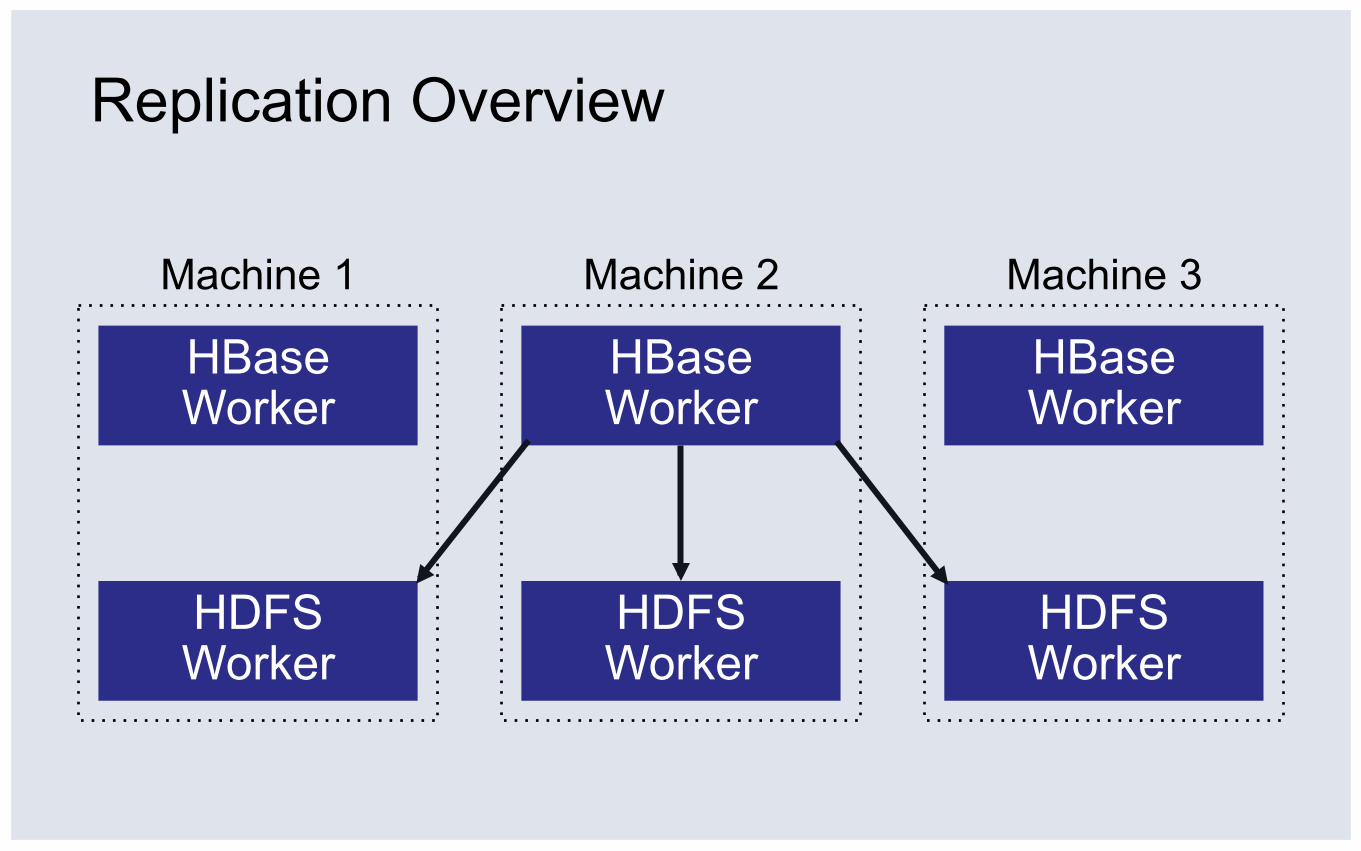
Replication Overview
HBase Worker
HDFS Worker
Machine 2
HBase Worker
HDFS Worker
Machine 1
HBase Worker
HDFS Worker
Machine 3
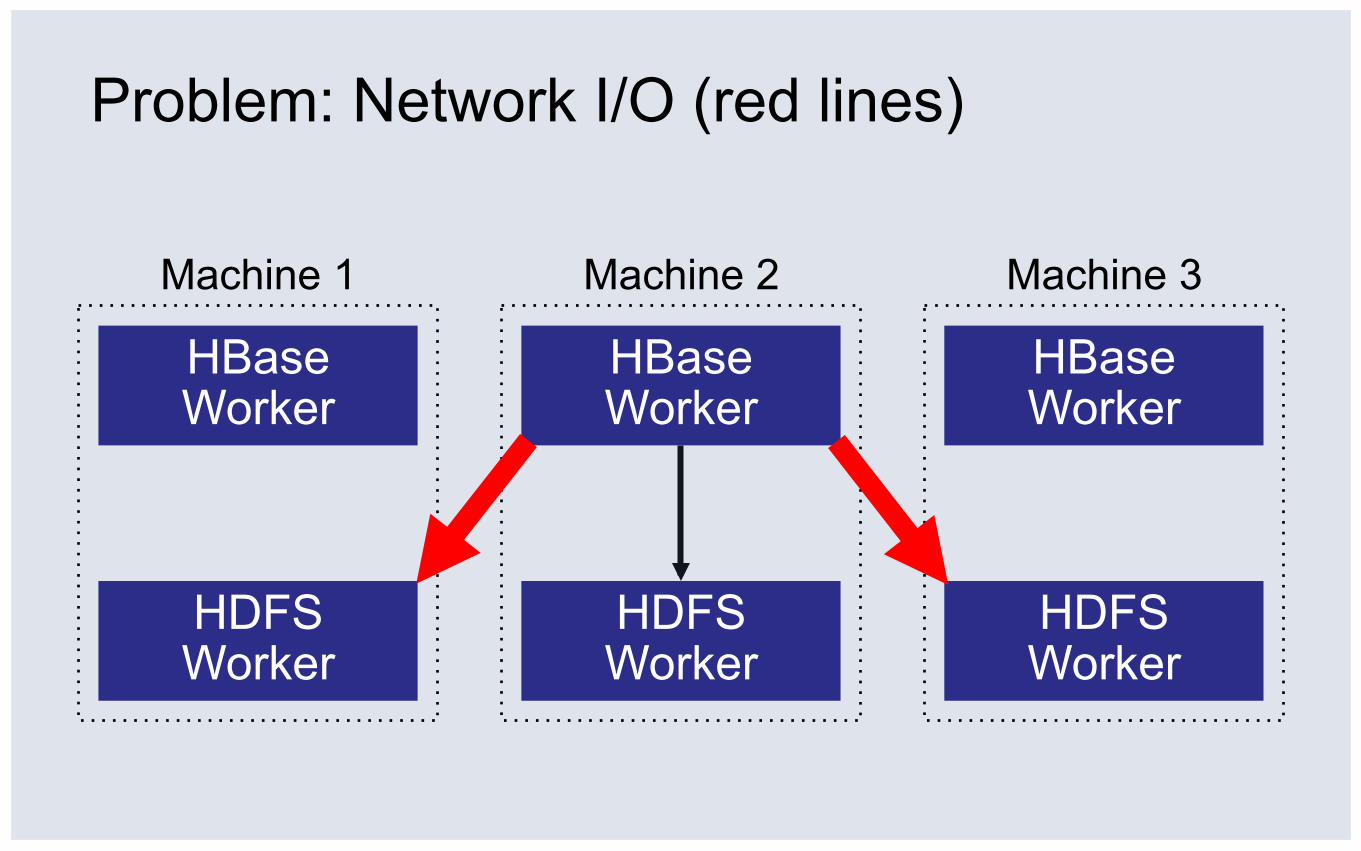
Problem: Network I/O (red lines)
HBase Worker
HDFS Worker
Machine 2
HBase Worker
HDFS Worker
Machine 1
HBase Worker
HDFS Worker
Machine 3
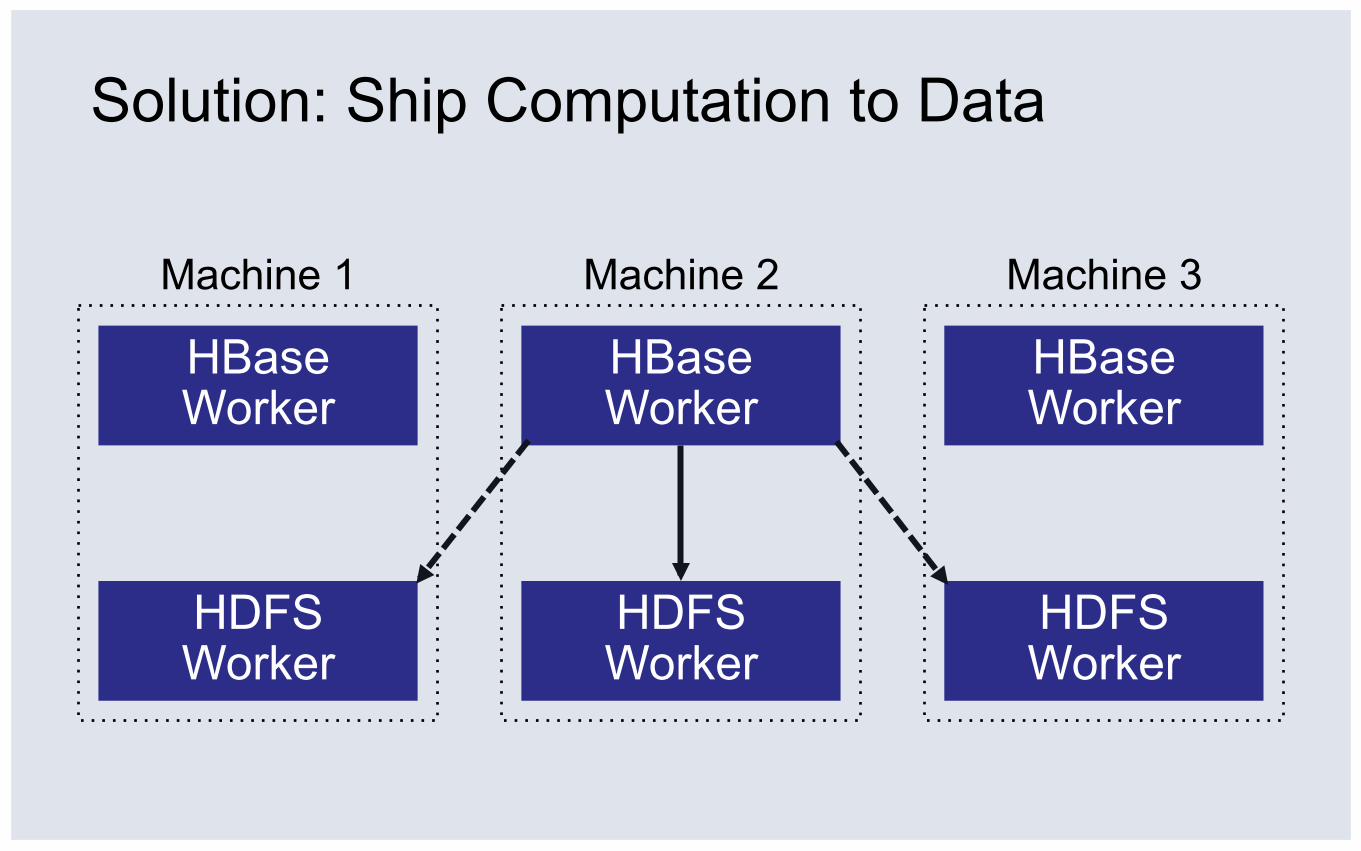
Solution: Ship Computation to Data
HBase Worker
HDFS Worker
Machine 2
HBase Worker
HDFS Worker
Machine 1
HBase Worker
HDFS Worker
Machine 3
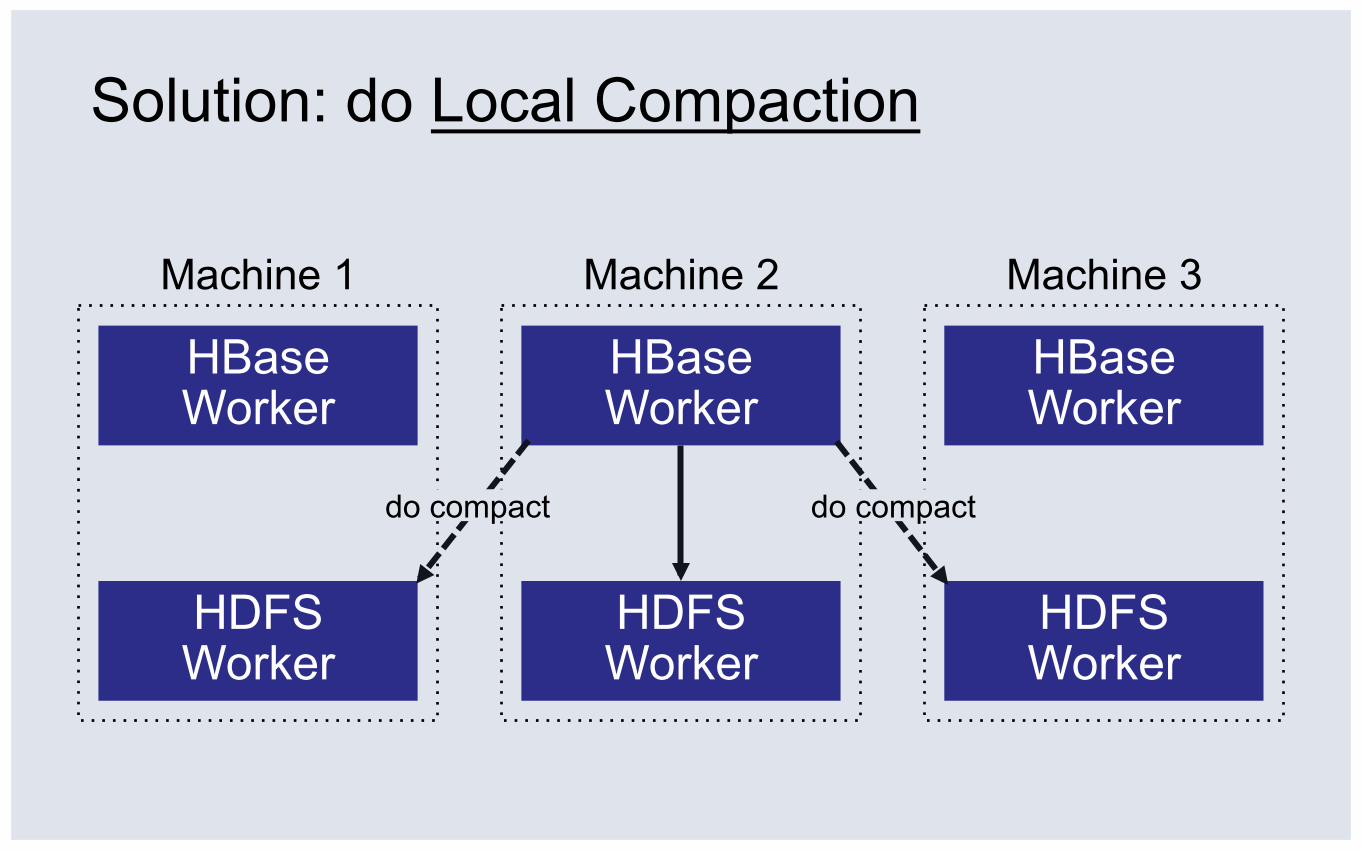
Solution: do Local Compaction
HBase Worker
HDFS Worker
Machine 2
HBase Worker
HDFS Worker
Machine 1
HBase Worker
HDFS Worker
Machine 3
do compact do compact
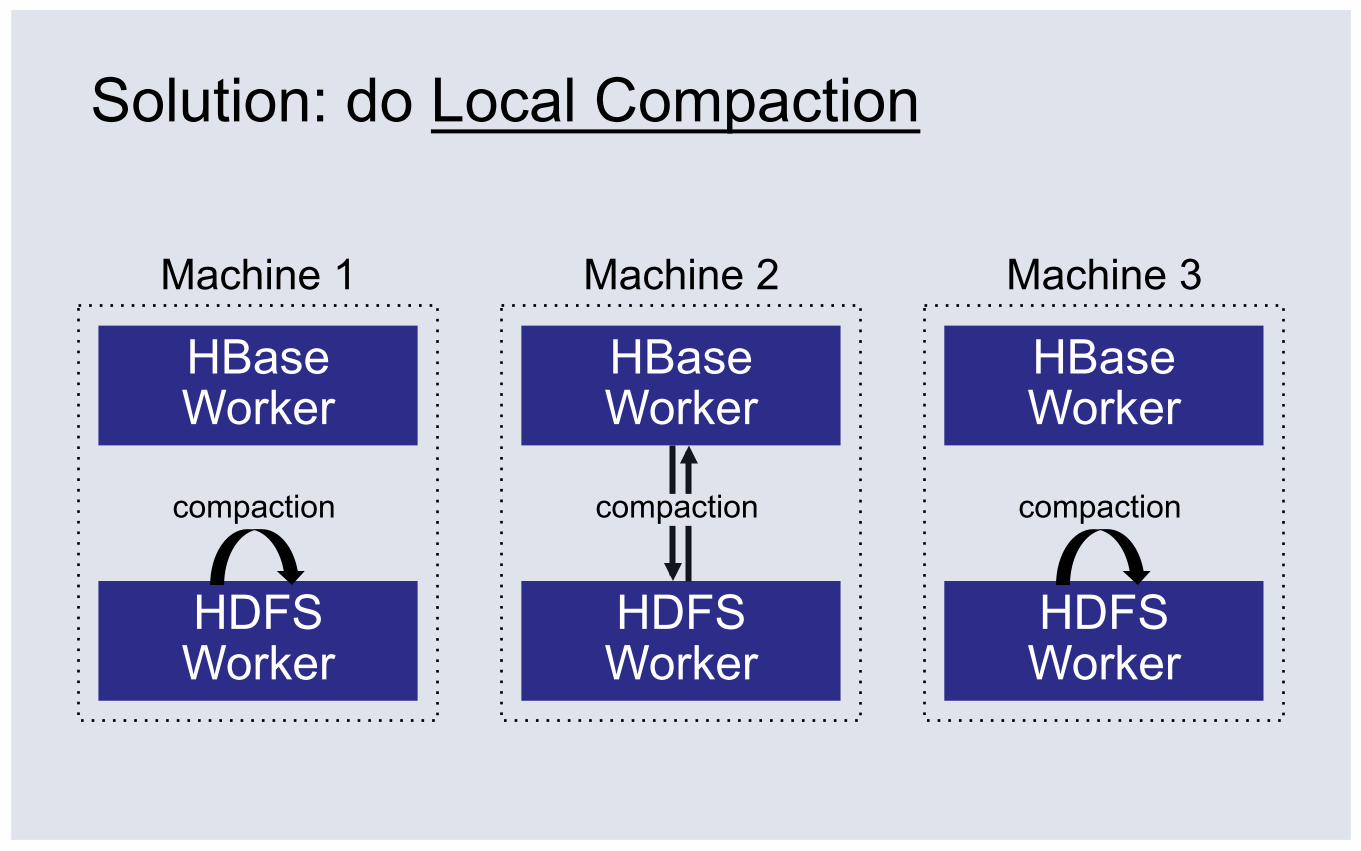
Solution: do Local Compaction
HBase Worker
HDFS Worker
Machine 2
HBase Worker
HDFS Worker
Machine 1
HBase Worker
HDFS Worker
Machine 3
compaction compaction compaction
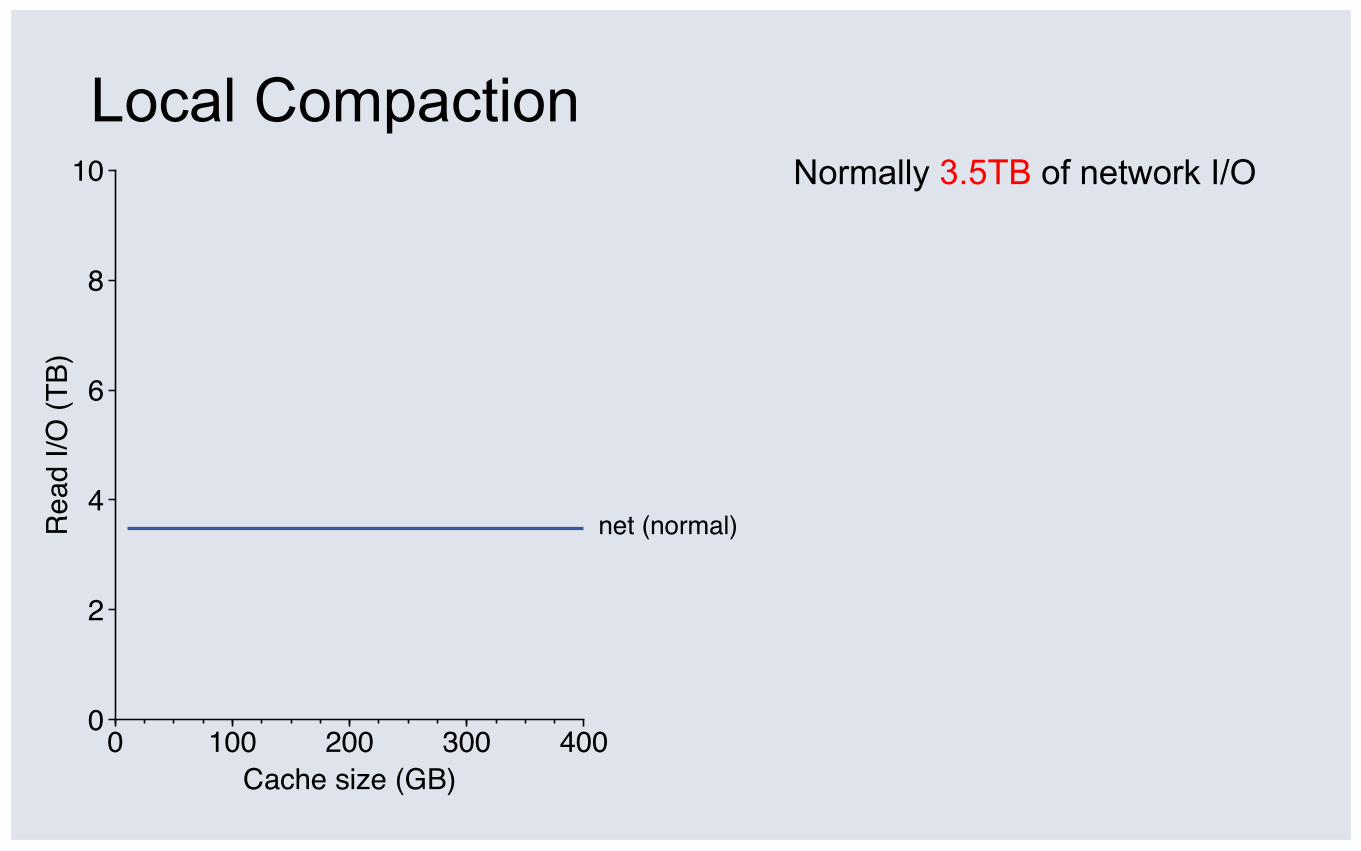
Local Compaction R
ead
I/O (T
B)
0 100 200 300 4000
2
4
6
8
10
Cache size (GB)
net (normal)
Normally 3.5TB of network I/O
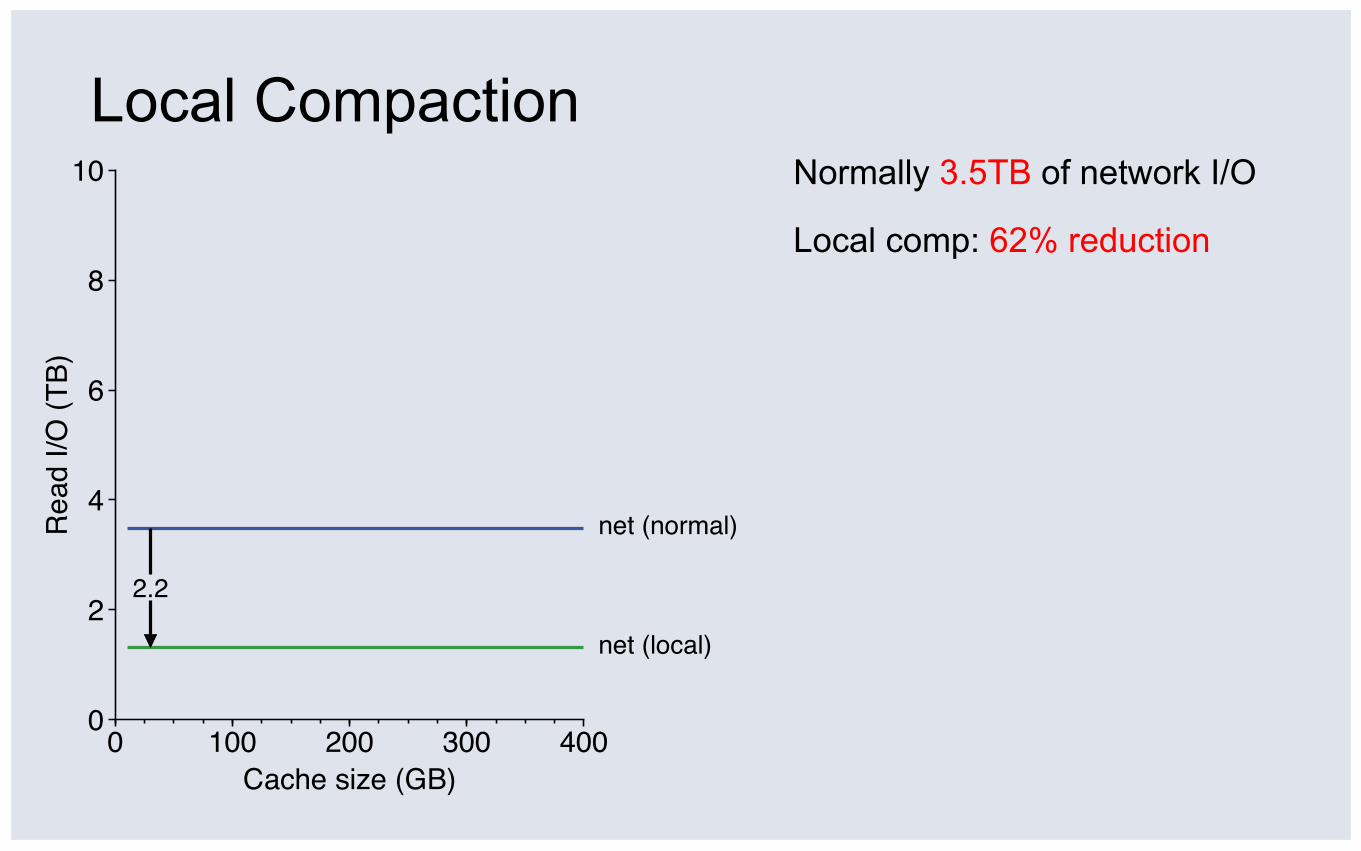
Local Compaction Normally 3.5TB of network I/O
Local comp: 62% reduction
Rea
d I/O
(TB)
0 100 200 300 4000
2
4
6
8
10
Cache size (GB)
net (normal)
net (local)
2.2
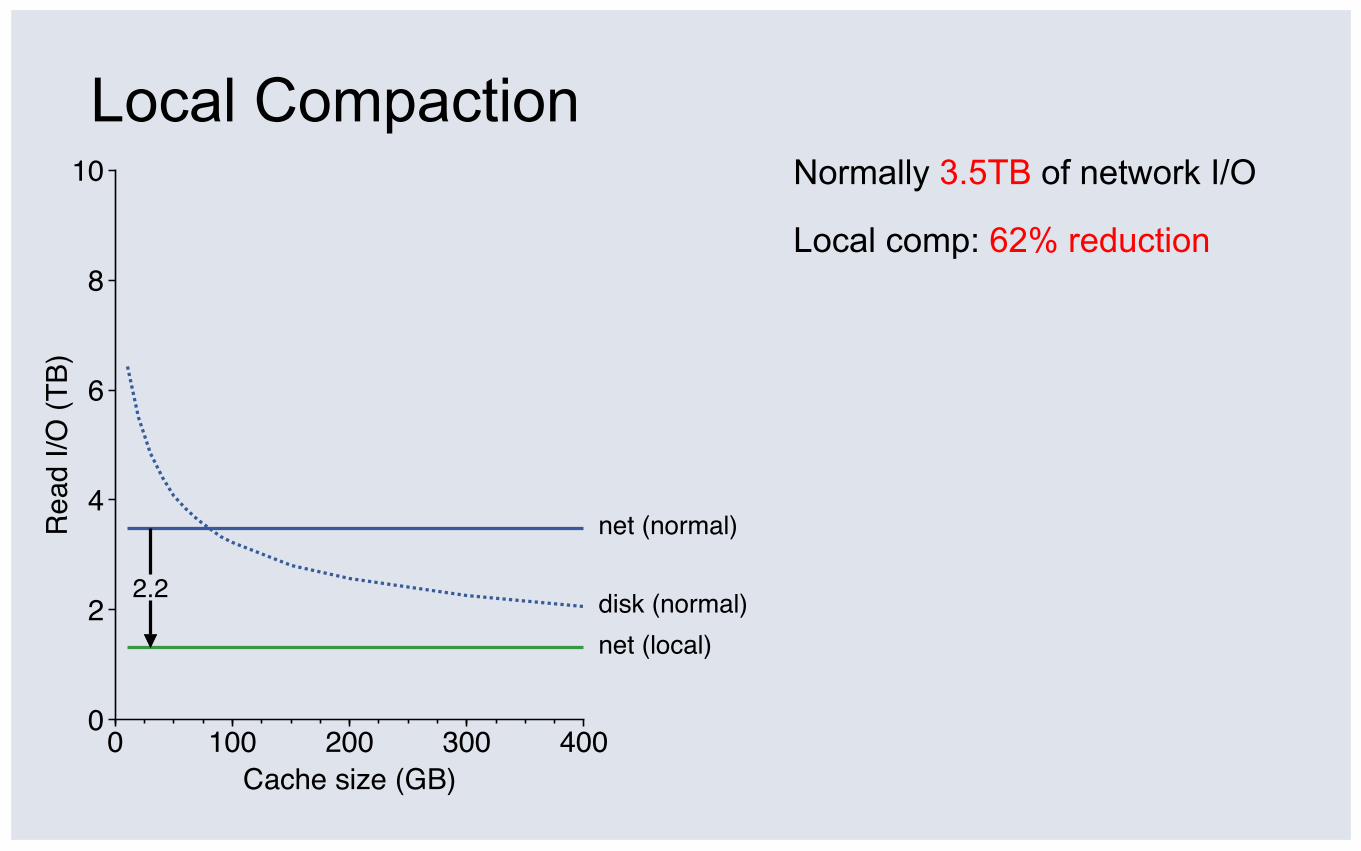
Local Compaction Normally 3.5TB of network I/O
Local comp: 62% reduction
Rea
d I/O
(TB)
0 100 200 300 4000
2
4
6
8
10
Cache size (GB)
net (normal)
net (local)disk (normal)2.2
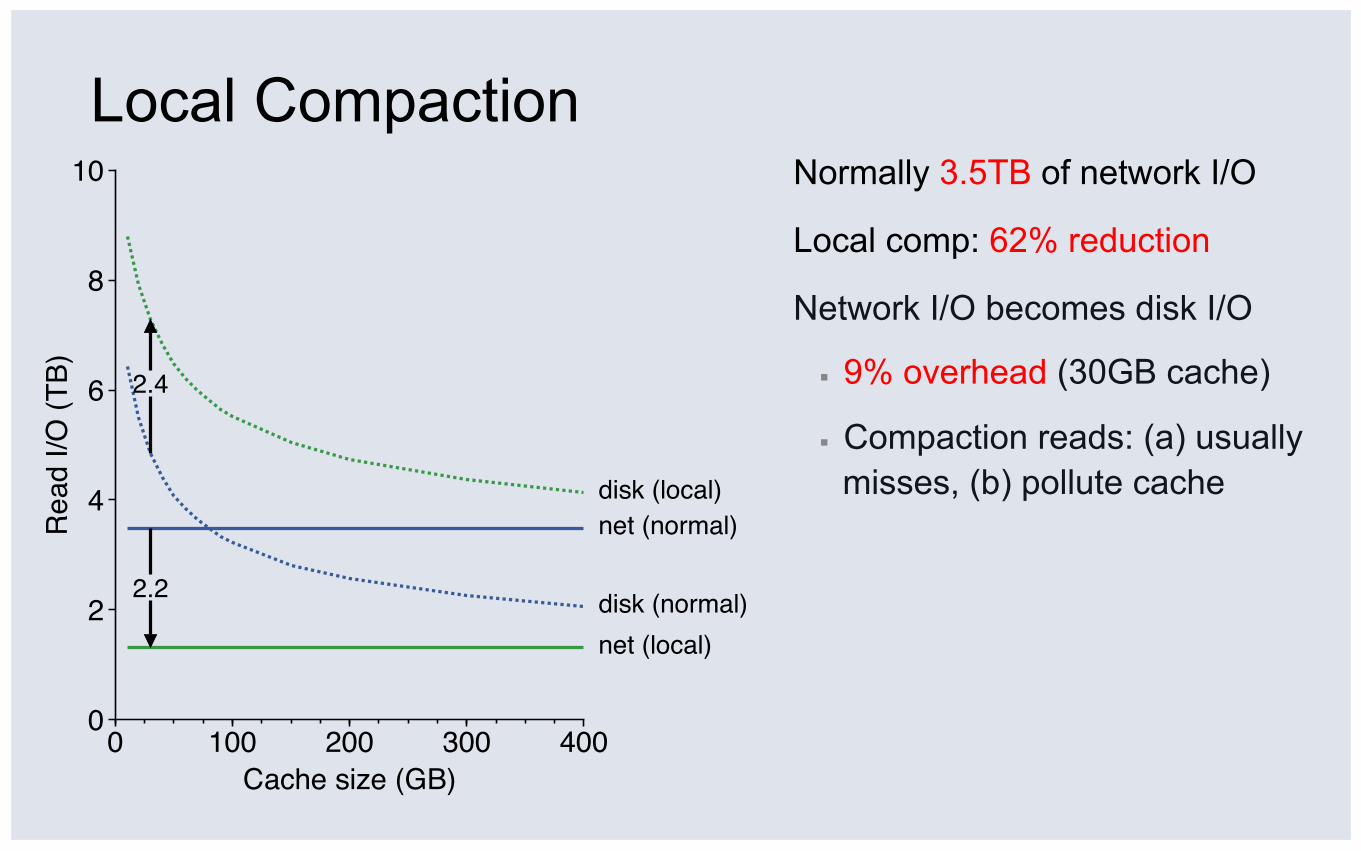
Local Compaction Normally 3.5TB of network I/O
Local comp: 62% reduction
Network I/O becomes disk I/O
▪ 9% overhead (30GB cache)
▪ Compaction reads: (a) usually misses, (b) pollute cache
Rea
d I/O
(TB)
0 100 200 300 4000
2
4
6
8
10
Cache size (GB)
net (normal)
net (local)disk (normal)
disk (local)
2.4
2.2
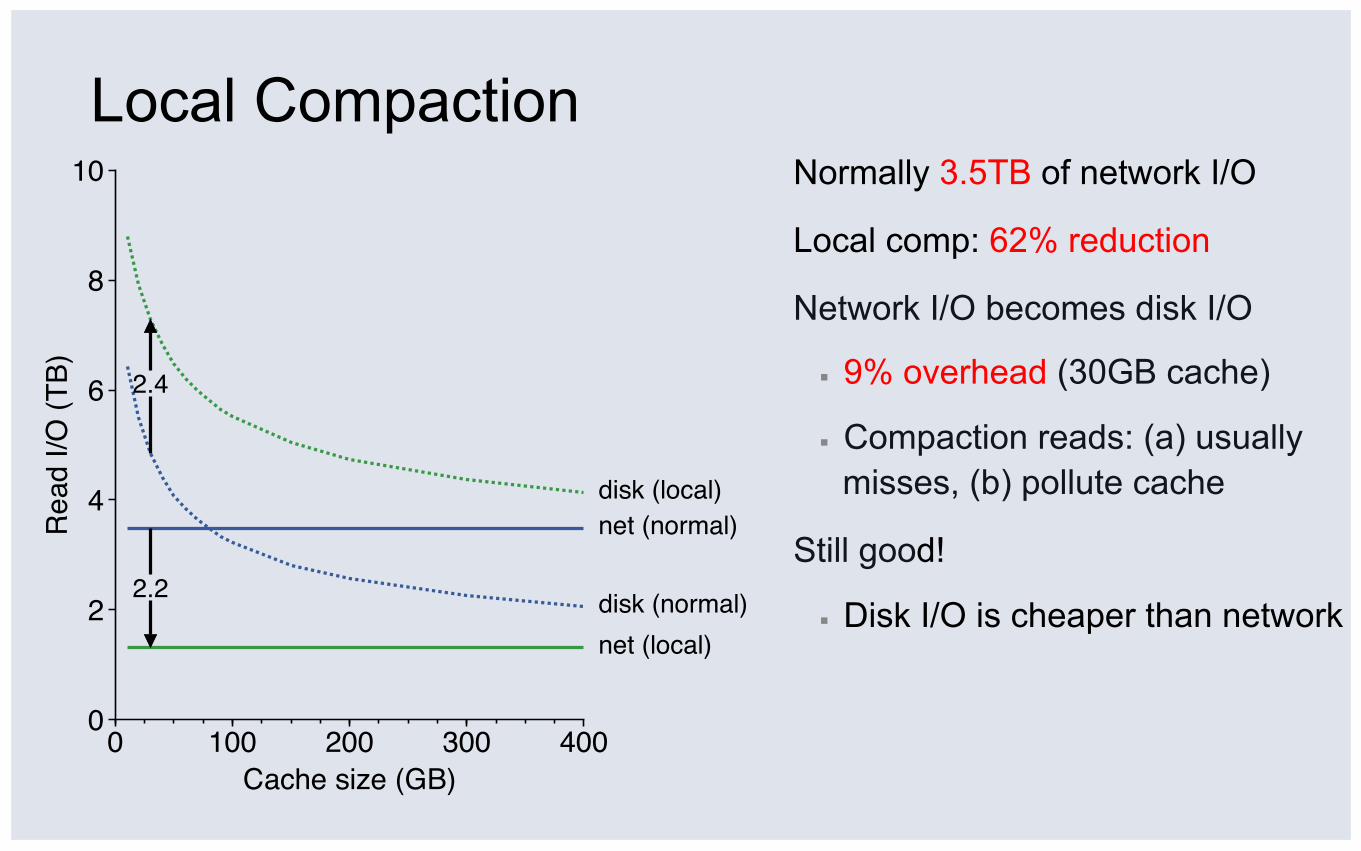
Local Compaction Normally 3.5TB of network I/O
Local comp: 62% reduction
Network I/O becomes disk I/O
▪ 9% overhead (30GB cache)
▪ Compaction reads: (a) usually misses, (b) pollute cache
Still good!
▪ Disk I/O is cheaper than network
Rea
d I/O
(TB)
0 100 200 300 4000
2
4
6
8
10
Cache size (GB)
net (normal)
net (local)disk (normal)
disk (local)
2.4
2.2
Outline Intro
▪ Messages stack overview
▪ Methodology: trace-driven analysis and simulation
▪ HBase background
Results
▪ Workload analysis
▪ Hardware simulation: adding a flash layer
▪ Software simulation: integrating layers
Conclusions
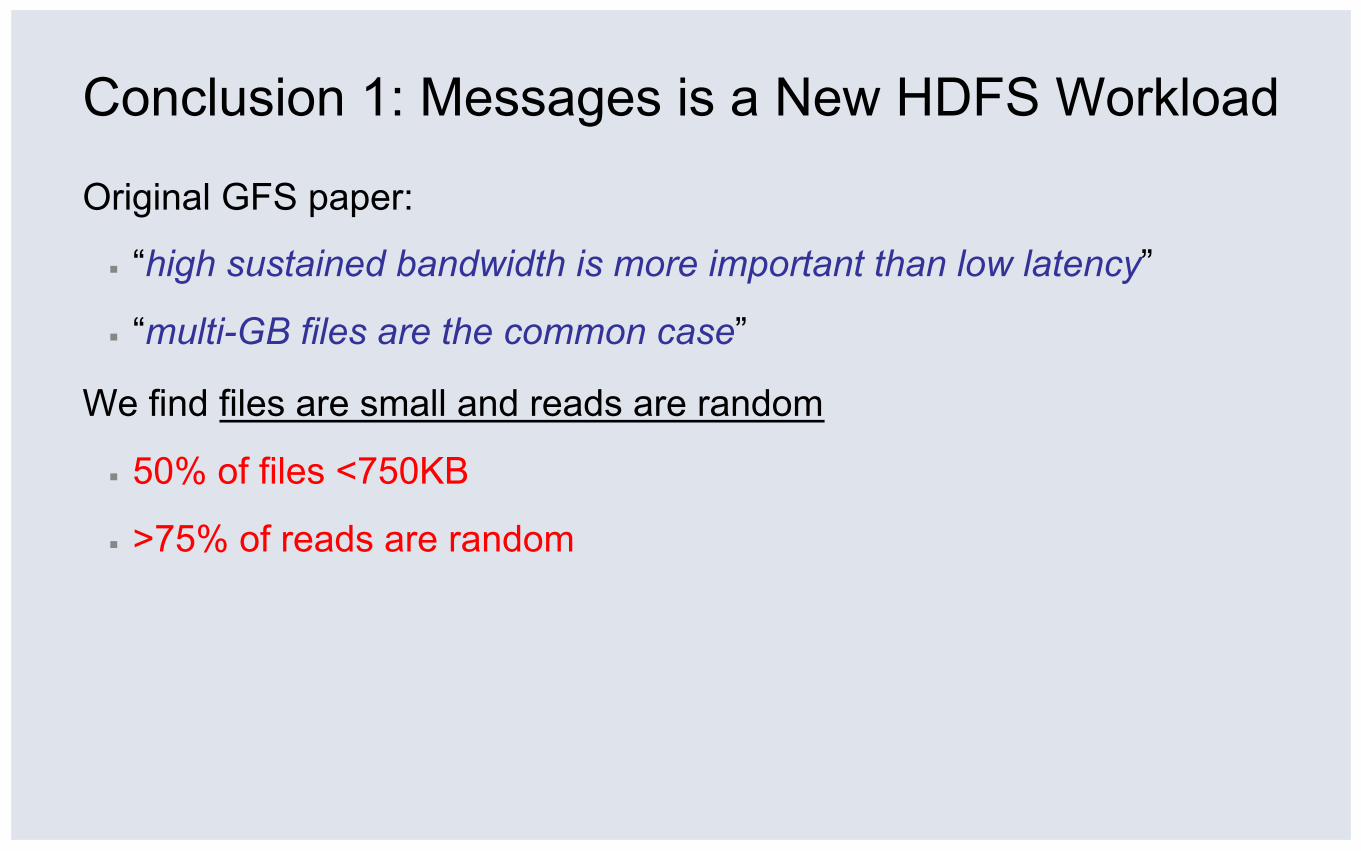
Conclusion 1: Messages is a New HDFS Workload
Original GFS paper:
▪ “high sustained bandwidth is more important than low latency”
▪ “multi-GB files are the common case”
We find files are small and reads are random
▪ 50% of files <750KB
▪ >75% of reads are random
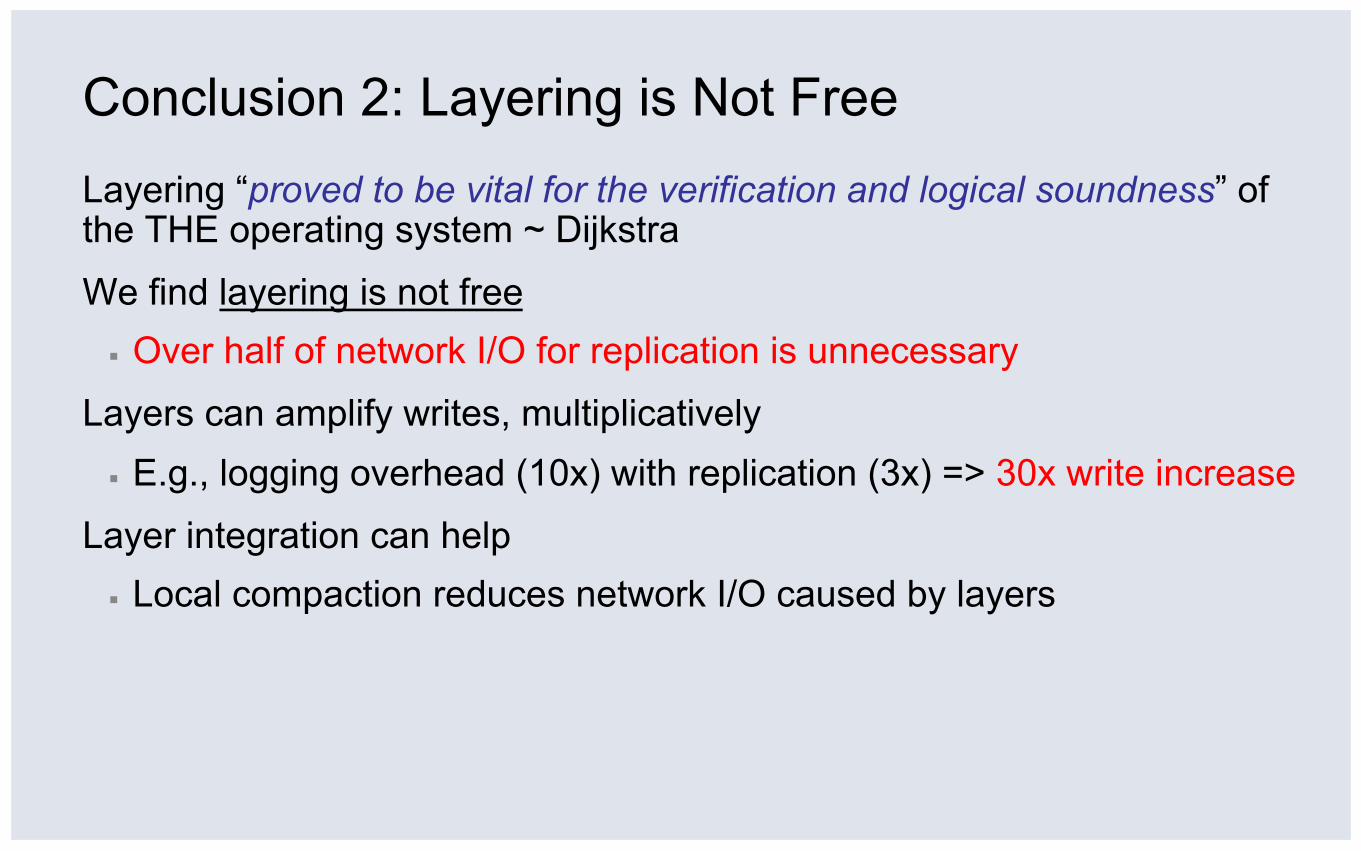
Conclusion 2: Layering is Not Free Layering “proved to be vital for the verification and logical soundness” of the THE operating system ~ Dijkstra
We find layering is not free ▪ Over half of network I/O for replication is unnecessary
Layers can amplify writes, multiplicatively ▪ E.g., logging overhead (10x) with replication (3x) => 30x write increase
Layer integration can help ▪ Local compaction reduces network I/O caused by layers
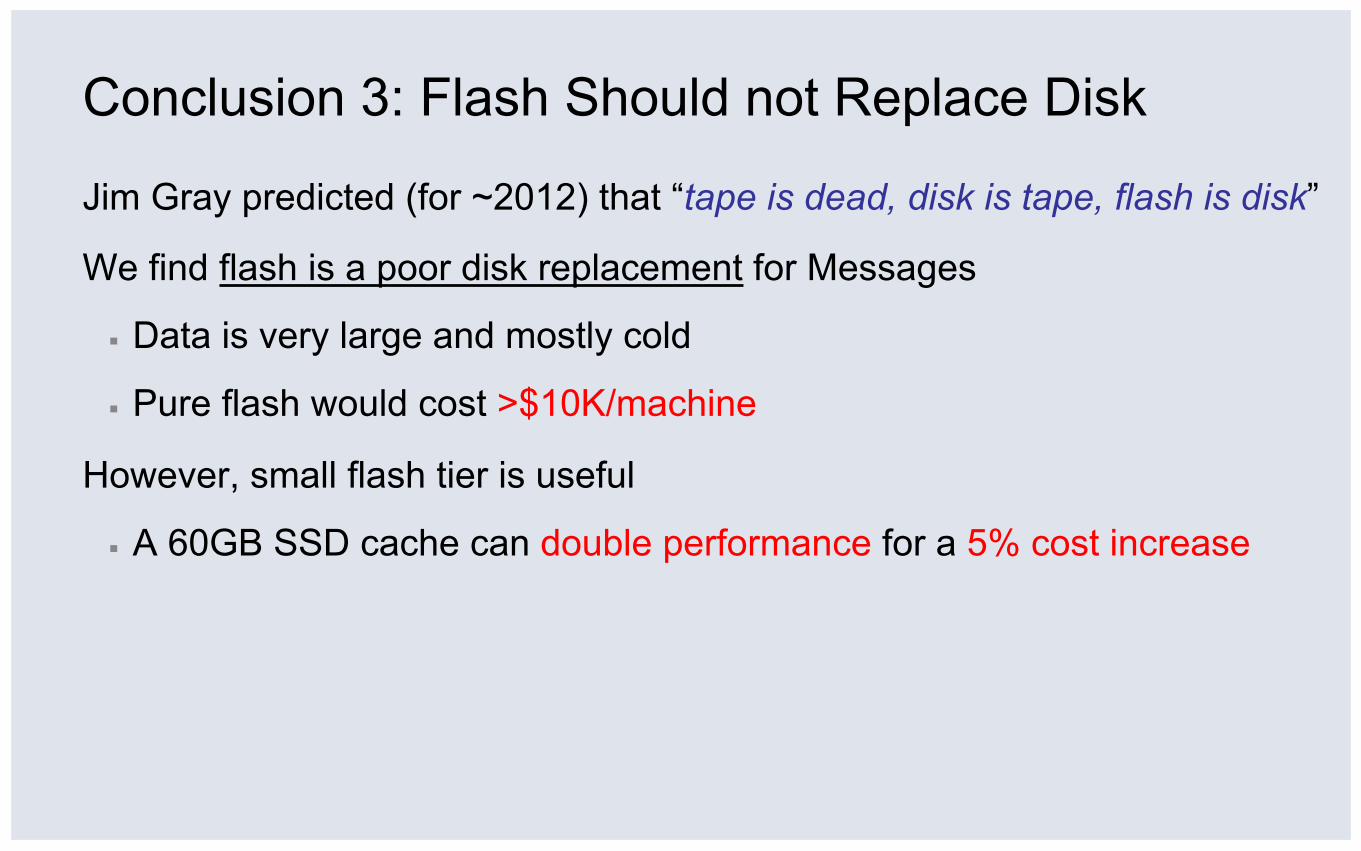
Conclusion 3: Flash Should not Replace Disk
Jim Gray predicted (for ~2012) that “tape is dead, disk is tape, flash is disk”
We find flash is a poor disk replacement for Messages
▪ Data is very large and mostly cold
▪ Pure flash would cost >$10K/machine
However, small flash tier is useful
▪ A 60GB SSD cache can double performance for a 5% cost increase

Thank you! Any questions? University of Wisconsin-Madison Facebook Inc.