Embed Size (px)
Citation preview
i | P a g e
Project Number: CXP0802
IQP Division: 44
Analysis of Green Building Water Infrastructure Technologies at the EPA NCER
An Interactive Qualifying Project Report Submitted to the Faculty of
WORCESTER POLYTECHNIC INSTITUTE In partial fulfillment of the requirement for the
Degree of Bachelor of Science
By Adam Brooks
Manh-Hung V. Le Brian Robie
Fidelis Wambui
Submitted on:
December 19, 2008
Approved: Professor Creighton Peet, Lead Advisor Professor Kaveh Pahlavan, Co-Advisor
ii | P a g e
Abstract The National Center for Environmental Research (NCER) funds extramural research for the
Environmental Protection Agency. Our goal was to provide future research recommendations concerning green building and more specifically water infrastructure. Categorizing NCER’s past projects and research, interviewing with principal investigators, and meeting with employees of various EPA offices have allowed us to identify existing research gaps. NCER’s future solicitations should consider water reuse, green roofs, and improving cooling towers. NCER should also focus on ways to improve social acceptance of green building, thus advancing implementation of green technologies, devices, and practices.
iii | P a g e
Acknowledgements We would like to thank the following individuals and organizations for their support and
effort that contributed to our project’s success. We would foremost like to thank the National
Center of Environmental Research (NCER) for sponsoring our project. We would like to thank our
liaisons, Dr. Diana Bauer and Mrs. April Richards for their continuous guidance and support.
Without their help, our project would not have been a success. We would like to thank Dr. William
Sanders, Mr. James Gantry, Mrs. Cynthia Nolt-Helms, and Mrs. Angela D. Page for helping us with
NCER’s program information. We would like to thank Ms. Abby Hall, Mr. Jamal Kadri, Ms. Alison
Kinn, Mr. Ken Sandler, Dr. Audrey Levine, and Ms. Stephanie Tanner for taking their time to share
their knowledge with us.
We would like to thank all of the project investigators from the various institutions that
conducted interviews with us.
We would like to dearly thank Professor Creighton Peet and Professor Kaveh Pahlavan for
their continuous support and guidance. Their input was invaluable towards our project’s success.
Thank you again for all of your support.
Adam Brooks
Manh-Hung Le
Brian Robie
Fidelis Wambui
iv | P a g e
Authorship Page
Executive Summary .............................................................................................................. All
1 Introduction ..................................................................................................................... All
2 Background ........................................................................................................................... .
2.1 Green Building ................................................................................................. Brian, Fidelis
2.2 Water and Wastewater Infrastructure .................................................................... Hung
2.3 Stormwater Infrastructure ............................................................................ Adam, Hung
2.4 Social Acceptance and Adoption of Green Building ............................ Fidelis, Brian
2.5 Conclusion .............................................................................................................................. All
3 Methodology .................................................................................................................... All
4 Results and Analysis .......................................................................................................... ..
4.1 NCER Green Building Funded Research .................................................... Adam, Hung
4.2 External NCER Research .................................................................. Hung, Fidelis, Brian
4.3 Wide Scale Sustainability Implementation ............................................. Adam, Hung
4.4 Budget and Regulations Analysis ............................................................... Hung, Fidelis
5 Conclusions and Recommendations ............................................................................. .
5.1 Conclusion .............................................................................................................................. All
5.2 Recommendations for areas of research .................................................. Adam, Hung
5.3 Recommendations for NCER’s programs ................................................................ Hung
References ............................................................................................................................... All
Appendices ................................................................................................................................... .
Appendix A: Sponsor Description .............................................................................................. All
Appendix B: NCER Grant Programs ..................................................................................... Adam
Appendix C - WPI East Hall Green Dormitory Interview ................................................... All
Appendix D – NCER Green Building Research List ............................................ Adam, Hung
Appendix E – NCER Principle Investigators Interview ....................................................... All
Appendix F – EPA Offices Interviews ........................................................................................ All
Appendix G - Regulatory for the NCER ..................................................................................... All
While there is a primary author for every section, each group member contributed to the
editing and revision of each section.
v | P a g e
Commonly Used Acronyms and Abbreviations CNS – Collaborative science and technology Network for Sustainability
CSO – Combined Sewer Overflow
CWA – Clean Water Act
DOE – Department of Energy
EPA – Environmental Protection Agency
LEED – Leadership in Energy and Environmental Design
NCER – National Center for Environmental Research
NSF – National Science Foundation
P3 – People, Prosperity, Planet
PI – Principal Investigator
SBIR – Small Business Innovation Research
SDWA – Safe Drinking Water Act
STAR – Science To Achieve Results
TSE – Technology for Sustainable Environment
USGBC – United States Green Building Council

vi | P a g e
Table of Contents
Title ................................................................................................................................................. i
Abstract ....................................................................................................................................... ii
Acknowledgements ................................................................................................................ iii
Authorship Page ...................................................................................................................... iv
Commonly Used Acronyms and Abbreviations .............................................................. v
Table of Contents ..................................................................................................................... vi
Table of Figures ....................................................................................................................... ix
Table of Tables ......................................................................................................................... xi
Executive Summary ............................................................................................................... xii
1 Introduction ........................................................................................................................ 1
2 Background ......................................................................................................................... 3
2.1 Green Building ......................................................................................................................... 4
2.1.1 LEED Rating System ....................................................................................................................... 4
2.1.2 Benefits and Costs of Green Building ...................................................................................... 7
2.2 Water and Wastewater Infrastructure ............................................................................ 9
2.2.1 Water supply cycle .......................................................................................................................... 9
2.2.2 Wastewater infrastructure systems ...................................................................................... 11
2.2.3 Building’s impact on water infrastructure systems ........................................................ 13
2.2.4 Wastewater ...................................................................................................................................... 14
2.2.5 Water Efficiency ............................................................................................................................. 17
2.3 Stormwater Infrastructure ............................................................................................... 18
2.3.1 Green Roof ........................................................................................................................................ 19
2.3.2 Other Stormwater Management Methods .......................................................................... 21
2.3.3 Stormwater Materials .................................................................................................................. 22
2.4 Social Acceptance and Adoption of Green Building ................................................. 23
2.5 Conclusion .............................................................................................................................. 27
3 Methodology ..................................................................................................................... 28
3.1 NCER’s green building research ...................................................................................... 29
3.2 External NCER’s green building research .................................................................... 31
3.2.1 Other EPA Offices’ green building research ....................................................................... 32
3.2.2 Other organizations’ green building research ................................................................... 33
3.3 Identify Research Gaps ...................................................................................................... 34
3.3.1 Interpreting Past Research ....................................................................................................... 34
3.3.2 NCER Interviews ............................................................................................................................ 35
3.4 Determine focus areas ....................................................................................................... 35
vii | P a g e
4 Results and Analysis ....................................................................................................... 37
4.1 NCER Green Building Funded Research ....................................................................... 37
4.1.1 Green Building Research Trends ............................................................................................ 43
4.1.2 Categorical Analysis ..................................................................................................................... 47
4.1.3 Project Investigator Interviews ............................................................................................... 56
4.2 External NCER Research .................................................................................................... 61
4.2.1 Stormwater ...................................................................................................................................... 62
4.2.2 Water .................................................................................................................................................. 64
4.2.3 LEED’s Gaps and Post Occupancy Monitoring ................................................................... 66
4.3 Wide Scale Sustainability Implementation ................................................................ 67
4.3.1 Sustainability in Portland .......................................................................................................... 68
4.3.2 Orange County’s Water Management ................................................................................... 70
4.3.3 Implementing Into Other Cities ............................................................................................... 72
4.4 Budget and Regulations Analysis ................................................................................... 72
4.4.1 Budget ................................................................................................................................................ 72
4.4.2 Regulations ...................................................................................................................................... 73
4.4.3 Regulations ...................................................................................................................................... 74
5 Conclusions and Recommendations ......................................................................... 76
5.1 Recommendations for areas of research ..................................................................... 77
5.1.1 Water reuse ..................................................................................................................................... 77
5.1.2 Water infrastructure .................................................................................................................... 79
5.1.3 Stormwater ...................................................................................................................................... 80
5.1.4 Residential Market ........................................................................................................................ 81
5.2 Recommendations for NCER’s programs ..................................................................... 81
5.2.1 Small Business Innovative Research Program .................................................................. 82
5.2.2 People, Planet, and Prosperity Program .............................................................................. 82
5.2.3 Collaborative Science and Technology Network for Sustainability ......................... 83
References ................................................................................................................................ 84
Appendices ............................................................................................................................... 87
Appendix A: Sponsor Description .............................................................................................. 87
The Environmental Protection Agency ............................................................................................... 87
The National Center of Environment ................................................................................................... 92
Appendix B: NCER Grant Programs ........................................................................................... 93
Small Business Innovative Research Program ................................................................................. 93
Collaborative Science and Technology Network for Sustainability Program ..................... 93
People, Prosperity and Planet Program .............................................................................................. 93
Appendix C - WPI East Hall Green Dormitory Interview ................................................... 96
Architect Lynne Deninger ......................................................................................................................... 96
Professor Paul P. Mathisen ....................................................................................................................... 98
Appendix D – NCER Green Building Research List ............................................................. 100
Appendix E – NCER Principle Investigators Interview ..................................................... 107
Principle Investigator Interview Protocol Form .......................................................................... 107
viii | P a g e
P3 - High Albedo and Environment-Friendly Concrete ............................................................. 109
P3 - Optimizing Green Roof Technologies in the Midwest ....................................................... 111
P3 - Permeable Parking .......................................................................................................................... 113
P3 - EVALUATING ecoMOD ................................................................................................................... 115
P3 – The DELTA Smart House .............................................................................................................. 117
P3 - Place-Based Green Building ......................................................................................................... 119
SBIR - An Integrated Ecoroof Energy Analysis Model ............................................................... 121
CNS - Smart growth planning to minimize degradation of water quality ......................... 123
CNS - Multi-Objective Decision Model for Urban Water Use ................................................... 125
Appendix F – EPA Offices Interviews ...................................................................................... 129
Office of Wetlands, Oceans and Watersheds .................................................................................. 129
NCER Director - Dr. William Sanders ................................................................................................ 131
U.S. EPA, Office of Pollution Prevention and Toxics.................................................................... 133
U.S. EPA, Green Building Workgroup ................................................................................................ 133
U.S. Drinking Water Research Program ........................................................................................... 134
WaterSense .................................................................................................................................................. 138
Appendix G - Regulatory for the NCER ................................................................................... 140
ix | P a g e
Table of Figures Figure 2-1: Number of LEED Certified Buildings Increasing Trend ................................................................... 7
Figure 2-2: Water supply cycle of current potable water system in the U.S. ................................................ 10
Figure 2-3: Budget needs for wastewater facilities by percent of total budget........................................... 13
Figure 2-4: Typical daily water use per capita .......................................................................................................... 15
Figure 2-5: Residential grey water recycling model ............................................................................................... 17
Figure 2-6: Stormwater runoff model ........................................................................................................................... 19
Figure 2-7: An example of green roof ............................................................................................................................ 20
Figure 2-8: Trend of Green Roof ...................................................................................................................................... 21
Figure 2-9: Rain barrel ........................................................................................................................................................ 22
Figure 2-10: Vegetation to manage stormwater ...................................................................................................... 22
Figure 2-11: Pervious pavement ..................................................................................................................................... 23
Figure 2-12: Number of Commercial LEED Certified Buildings ......................................................................... 26
Figure 2-13: Number of blue-collar buildings built ................................................................................................ 27
Figure 4-1: NCER’s green building funding by different program since 1995 ............................................. 41
Figure 4-2: NCER’s green building funding since 1995 ......................................................................................... 42
Figure 4-3: NCER’s green building funding since 1995 by dollar ...................................................................... 44
Figure 4-4: NCER’s green building funding since 1995 by number of projects ........................................... 46
Figure 4-5: NCER’s green building funding in scale dimension ......................................................................... 51
Figure 4-6: NCER green building funding in media dimension .......................................................................... 52
Figure 4-7: NCER green building funding in Approach dimension................................................................... 54
Figure 4-8: EPA Green Building Research Funding by Topic from 2002 to 2006 ...................................... 55
Figure 4-9: Stormwater Funding among NCER and NSF from 2002 to 2006 ............................................... 63
Figure 4-10: Water Efficiency Funding among NCER, EPA, and NSF from 2002 to 2006 ....................... 65
Figure 4-11: The distribution of wastewater reuse treatment plants in the U.S ........................................ 71
Figure 4-12: NCER Extramural Budget since 1999 ................................................................................................. 73

x | P a g e
Figure A-1: EPA Regional Office Map ............................................................................................................................ 88
Figure A-2: EPA Organization’s structure ................................................................................................................... 89
xi | P a g e
Table of Tables Table 2-1: Detailed LEED Points for New Construction .......................................................................................... 5
Table 2-2: Typical Domestic Daily per Capita Water Use ..................................................................................... 14
Table 3-1: Detailed categories used to classify NCER’s project .......................................................................... 30
Table 4-1: Total green building funding since 1995 by NCER grant programs ........................................... 39
Table 4-2: Detailed categories used to classify project .......................................................................................... 48
Table 4-3: Interview Matrix .............................................................................................................................................. 57
Table 4-4: Interviewees outside of the NCER ............................................................................................................ 62
Table 4-5: Number of States with Regulations or Guidelines for each type of reuse application ........ 74
xii | P a g e
Executive Summary Building construction and operation threaten the environment in ways varying from
releasing carbon dioxide to polluting water sources. In the United States, buildings consume 12% of
the total available fresh water, 30% of the materials, and 70% of the electricity produced (US EPA,
2004). Aging water and wastewater infrastructure systems are overloaded from the increasing
population and incessant construction throughout the United States (Grigg, 2003). Green building
practices such as green roofs and water reuse can reduce these impacts and improve efficiency
significantly. In the United States, the Environmental Protection Agency (EPA) has begun studying
green technology as a potential solution for reducing the negative impacts of buildings. The EPA has
a very broad scope of environmental research ranging from water and air pollution to larger
infrastructural impacts. Within green technologies consideration is given to energy, materials,
construction, and more related to our study, water and wastewater infrastructure. From 2003 to
2007, less than 2% of the EPA’s total research funding went to green building research, with most
of it being extramurally distributed through grants (USGBC, 2008a). Of the 2% devoted to green
building research, only 11% was used for water and storm water research. Considering the current
environmental issues and the benefits of green buildings, this level of research on green water
technologies is insufficient.
The goal of this project was to provide recommendations to the EPA’s National Center for
Environmental Research (NCER) regarding potential future research areas with a focus on the
impacts of green building on water and wastewater infrastructure. To achieve our goal we
developed a series of 4 objectives to fulfill:
Identify past and current green building research areas sponsored by NCER.
Identify past and current green building research sponsored by other EPA offices and other
organizations.
xiii | P a g e
Analyze technology and information gaps in green building research with a focus on water
infrastructure
Determine NCER’s budgetary and regulatory constraints to recommend suitable future research
priorities.
In order to determine the current direction of NCER’s research, we identified 95 green
building related projects from the 5547 projects in NCER’s archive and categorized them. Our
categories were based on the following three dimensions: Scale, Media, and Approach. An analysis of
the Scale dimension, which refers to the size of a project, showed that the residential area has been
significantly overlooked while emphasis has instead been placed on regional scale projects. The
Media dimension encompasses categories that refer to the different green building research areas
such as wastewater and stormwater. From Media we have identified that water reuse and green
roofs have not received sufficient funding. An analysis of the Approach dimension, which describes
the means of a project, illustrated a need for more social and metrics research. The 95 projects were
funded in three main NCER programs: CNS, P3 and SBIR. Among these projects, CNS had the most
funding while P3 had the largest number of projects. Our analysis of these programs showed a
projected decrease in funding for future green building research. Overall, the level of green building
research at NCER is deficient, especially in areas of water and wastewater infrastructure and more
specifically water reuse and green roof technologies.
To further analyze NCER’s research, we interviewed 11 principle investigators of 10
projects from our list of 95 green building related projects. These 10 projects covered a range of
green building topics, from stormwater management to social acceptance. From these interviews,
we determined that there is a need to better understand the impacts of green building to the larger
infrastructures. Also, water reuse is facing challenges from regulators and the general public.
Another key issue is the adaptation of green roof technologies to the different climatic regions
xiv | P a g e
within the U.S. Together these expert opinions gave more support to our identified gaps of water
reuse, green roofs, and social acceptance needs.
We also interviewed sources from other EPA offices and other organizations, including the
U.S. Green Building Council (USGBC). One conclusion we subscribe to is that there are many simple
stormwater practices that can be implemented, but once again the need for social acceptance and
education limit the technology from being adopted. Another issue identified is that the current
LEED rating system does not address post occupancy performance and water efficiency. The EPA
needs to cooperate with USGBC to jointly improve the LEED rating system to better address green
building performance. The exponential increase in the number of LEED buildings emphasizes this
need.
In order to make suitable final recommendations to NCER on future research priorities, we
considered their total budget and the regulations that affect them such as the Safe Drinking Water
Act. Unfortunately, the NCER budget has been decreasing over the past decade from approximately
$110 million in 1999 to approximately $65 million in 2008. Programs like CNS, which was
discontinued in 2007, have been negatively affected by this budget decrease resulting in an
insufficient budget for future green building research. In order to effectively research the key areas
of green building and water infrastructure NCER should allocate a sufficient budget and create a
new program to replace the void CNS once filled.
After garnering and analyzing our data from NCER’s archive, interviews with project
investigators, and employees of EPA and USGBC, we developed two sets of recommendations for
NCER. The first set of recommendations focuses on researching the gaps we have identified through
the completion of our objectives. Water reuse, stormwater management practices and water
infrastructure were identified as future focus areas for NCER. These areas include water reuse, both
regional and onsite, water infrastructure, storm water management and the residential market.
xv | P a g e
The second set of recommendations concern future focus areas for specific programs within
NCER. The P3 program is best suited for localized data collection, such as gathering green roof
climatic data. The SBIR program should focus on water reuse technology, which would ultimately
result in affordable products for consumers. Finally, the discontinued CNS program needs to be
replaced with another sustainable oriented program to continue implementing sustainable design
on a large scale. These recommendations will influence NCER’s future solicitations to better address
areas in need for green building research. They may also prove helpful in the formation of a green
building research strategy across the EPA.
Ultimately green building is an integration of many environmental technologies. While we
did consider all facets of green building research, our focus was on water infrastructure. We put our
primary concentration on technologies dealing with the management of stormwater and
wastewater and their resulting impacts on water infrastructure systems. Improving green building
technology and implementation would minimize buildings impacts on both the environment and
external infrastructures. With the limited budget available to NCER, our project sought to provide
research priorities to better focus on aspects of green building that have been previously
overlooked. Through our project, we hope these gaps will be better addressed through future NCER
solicitations.
1 | P a g e
1 Introduction
Pollution is increasing worldwide. Water supplies face a daily onslaught of hazardous
wastes. The atmosphere is a dumping ground for greenhouse gasses. Around the world the demand
for more energy is on the rise, while the primary source for energy, fossil fuels, is quickly being
consumed. Buildings are responsible for a large portion of energy and raw material consumption. In
the United States, buildings consume 12% of the potable water, 30% of the materials, 70% of the
electricity produced as well as account for 20% of the greenhouse gasses released and 45% of the
waste sent to landfills (US EPA, 2004).
However, recent events and discoveries have brought about a change. People are becoming
more aware of the costs of energy, both its monetary value and its environmental implications.
Government agencies are pushing newly developed green technologies, including recycling, reuse,
and efficiency to address these growing concerns. Green building, a recent trend to address the
negative effects of buildings, consists of the use of environmentally friendly materials, pollution
prevention through recycling, and an increase in energy efficiency.
The Environmental Protection Agency (EPA) has great influence on environmental
regulations and policies in the US. To address current issues effectively the EPA needs to focus on
areas of research that may have the biggest environmental impact. Over the past decade, one of the
federal government’s foci has been to continually improve the growing field of green building
technologies. Since 1995 the number of green projects sponsored by EPA’s National Center for
Environmental Research (NCER) has risen to 95, with a total funding of over $7 million. However,
this number is relatively small compared with other areas of NCER research. The EPA currently has
no designated budget or research solicitations in place for green building research. Therefore, past
green building related research was based exclusively upon individual interests and agendas.
Outside the EPA, other government agencies, including the Department of Energy and the National
2 | P a g e
Science Foundation, and organizations such as the U.S. Green Building Council have sponsored
research on technologies that are related to green building. Even with these advances in
technologies, green building market penetration and social acceptance remain low.
Although it has been generally known that green building is more environmentally friendly
than traditional building, there are still some unknown aspects. For example, there is little to no
information available regarding any potential negative impacts of green building such as fire hazard
or its overall impacts on different infrastructures such as water infrastructure. As a result the EPA
is planning to conduct more research regarding green building technologies but it has not yet
identified its foci. Being that the EPA does not have a green building research strategy, previous
research performed within the EPA has been scattered among different offices. These research
projects, especially those dealing with stormwater management and water recycling, often are not
wholly integrated with green building. Ultimately, these gaps in information are potential
challenges to the future development of green building technologies.
The purpose of our project is to provide the EPA with recommendations for future research
areas regarding green building technologies, specifically those relating to water and wastewater
infrastructure. Our first objective was to identify all the current and past research NCER has done
on green building technology. Next we identified past research on green building by other offices
within the EPA and by other organizations. We then analyzed the garnered research and identified
the gaps in research with a focus on water infrastructure but also considered other green building
aspects including energy and materials. We also considered the EPA’s budgetary and regulatory
constraints to carry out research in order to provide appropriate recommendations. The results of
fulfilling these objectives were a categorized list and analyzed statistics on NCER and other’s green
building research and recommendations for future foci in green building technologies and water
infrastructure.
3 | P a g e
2 Background
The purpose of this chapter is to provide background information on green building
technologies and issues, specifically those concerning water and wastewater management. This
chapter will also examine other aspects of green buildings relating to the environment including
energy consumption, material selection, and construction. Finally, this chapter will look at the social
acceptance and adoption of green building and green building technologies.
Building has been constructed long ago to provide a place for people to live in. We are
spending an average of 20 hours per day inside buildings (Royal Institute of British Architects,
2008). Buildings dramatically affect our emotions, our health, our productivity, and all our
everyday activities. If we are going to change the world, we have to start from the foundation of our
living and working activities. We have to change the way buildings affect us, so that future
generations can live in a healthier and better environment.
In the United States, buildings use 12% of the total available fresh water, 30% of the
materials, 70% of the electricity produced as well as create 20% of the greenhouse gasses released
and 45% of the waste sent to landfills (EPA, 2004). Building industries contributed over $1 trillion
per year, 13.4% of the U.S. GDP, and provided jobs for 1.7 million people in America (USGBC, 2007).
Recognizing the importance and impacts of buildings on human health and the
environment, countries around the world started to take action on changing the current building
into a new construction concept, which uses resources more efficiently and has less negative
environmental impacts, called green building. In 1990, The United Kingdom established Building
Research Establishment’s Environmental Assessment Method (BREEAM, 2008) in order to bring
sustainable design concepts into the domestic housing market. In 2003, Green Building Council
4 | P a g e
Australia (2008) launched “Green Star” to provide certificate for green building. In the United
States, the LEED started in 2000 to provide guidance and a common rating system for sustainable
building.
2.1 Green Building
Green building is a “high-performance property that considers and reduces its impact on
the environment and human health” (Yudelson, 2008, p. 13). It is designed to be one part of the
answer to the global issue of energy consumption and waste production by reducing energy and
water use as well as green house gas emissions. This can be achieved through every stage of
building from siting, design, material selection to the actual construction and operation of green
building. Green building requires increased planning and organization as the selection of materials
and operation systems may affect the building schedule and require further knowledge and
equipment on the part of the contractors. A sustainable green building must account for resources
and local climate factors and include low-impact materials as well as energy and water efficient
systems. The construction of green buildings reduces on-site waste by recycling and conserves
natural resources by using alternative materials. Green building achieves better operating
performance with better insulation, design, and energy efficiency. Green building efficient Heating,
Ventilation, and Air Conditioning (HVAC) systems provide better air and a healthier environment
for the people who live in one of these buildings.
In order to easily provide green information and guidance for people to go green, a common
rating system to measure and compare the performance of green building is necessary. The main
rating system that was developed in the US and is currently used widely is the LEED rating system.
2.1.1 LEED Rating System
The Leadership in Energy and Environmental Design (LEED) rating system, launched in the
year 2000 by the U.S Green Building Council (USGBC, 2008a), is a point-based system used to define
5 | P a g e
and rate performance of green buildings. Although it is a relatively new system, it has been adopted
by 18 states and 59 cities, along with some designers, architects and building owners.
There are currently 4 levels of certification: Certified, Silver, Gold and Platinum (USGBC,
2008b). Each level represents the degree of sustainability a building can achieve with Platinum is
the highest level. In LEED system, a building is rated on five key elements: Sustainable Sites, Water
Efficiency, Energy & Atmosphere, Material & Resources, Indoor Environmental Quality and
Innovation & Design Process. The better these elements are addressed in a building, the higher the
rating. The points given to each element are varied from the type of building such as commercial or
residential and also from the state of building such as existing renovation or new construction.
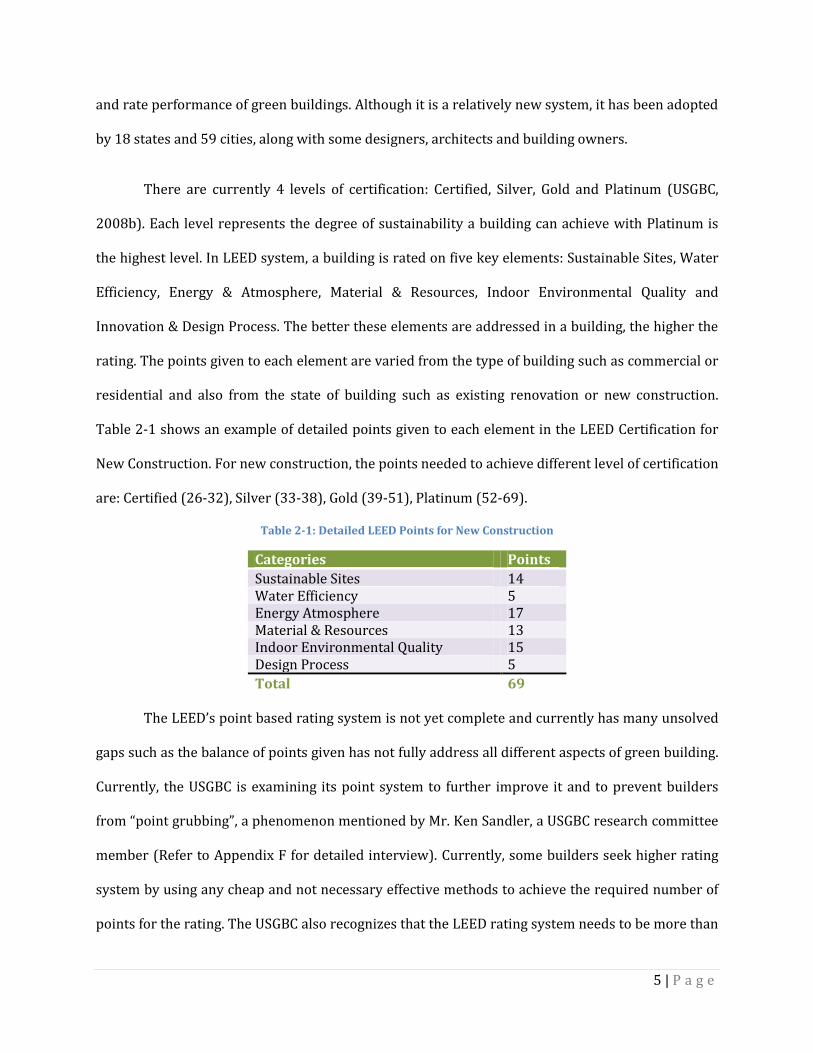
Table 2-1 shows an example of detailed points given to each element in the LEED Certification for
New Construction. For new construction, the points needed to achieve different level of certification
are: Certified (26-32), Silver (33-38), Gold (39-51), Platinum (52-69).
Table 2-1: Detailed LEED Points for New Construction
Categories Points
Sustainable Sites 14 Water Efficiency 5 Energy Atmosphere 17 Material & Resources 13 Indoor Environmental Quality 15 Design Process 5
Total 69 The LEED’s point based rating system is not yet complete and currently has many unsolved
gaps such as the balance of points given has not fully address all different aspects of green building.
Currently, the USGBC is examining its point system to further improve it and to prevent builders
from “point grubbing”, a phenomenon mentioned by Mr. Ken Sandler, a USGBC research committee
member (Refer to Appendix F for detailed interview). Currently, some builders seek higher rating
system by using any cheap and not necessary effective methods to achieve the required number of
points for the rating. The USGBC also recognizes that the LEED rating system needs to be more than
6 | P a g e
just site specific. The USGBC is preparing to update their rating system with climatic consideration
where the rating system points will be varied between different regions. These points will be
weighted on the feasibility of implementing the green technologies with different geographic and
climatic consideration.
Another new direction in the LEED rating system is its developing program called LEED
Neighborhood Development, better known as LEED-ND (USGBC, 2008b). This program is aimed
primarily towards new development in the residential market on a large scale. It promotes smart
growth, new urbanism, and green buildings. Currently the program is only in a pilot stage, but it is
expected to be adopted as a standard in late 2009.
Beginning in 2007, all new commercial buildings certified by the LEED are required to
reduce carbon emissions by 50% compared to current emissions level (USGBC, 2008a). The
reduction can be achieved by looking at all four categories that can lessen a building’ carbon
footprint: energy, water, transportation and materials. The USGBC also set two main goals to
significantly push green building forward. By the end of the year 2010, the US aims to achieve
100,000 LEED-certified buildings and 1 million LEED-certified homes. The USGBC is also working
with other groups such as the American Institute of Architects in order to reach these goals by
developing professional training and new evaluation software for the design and construction of
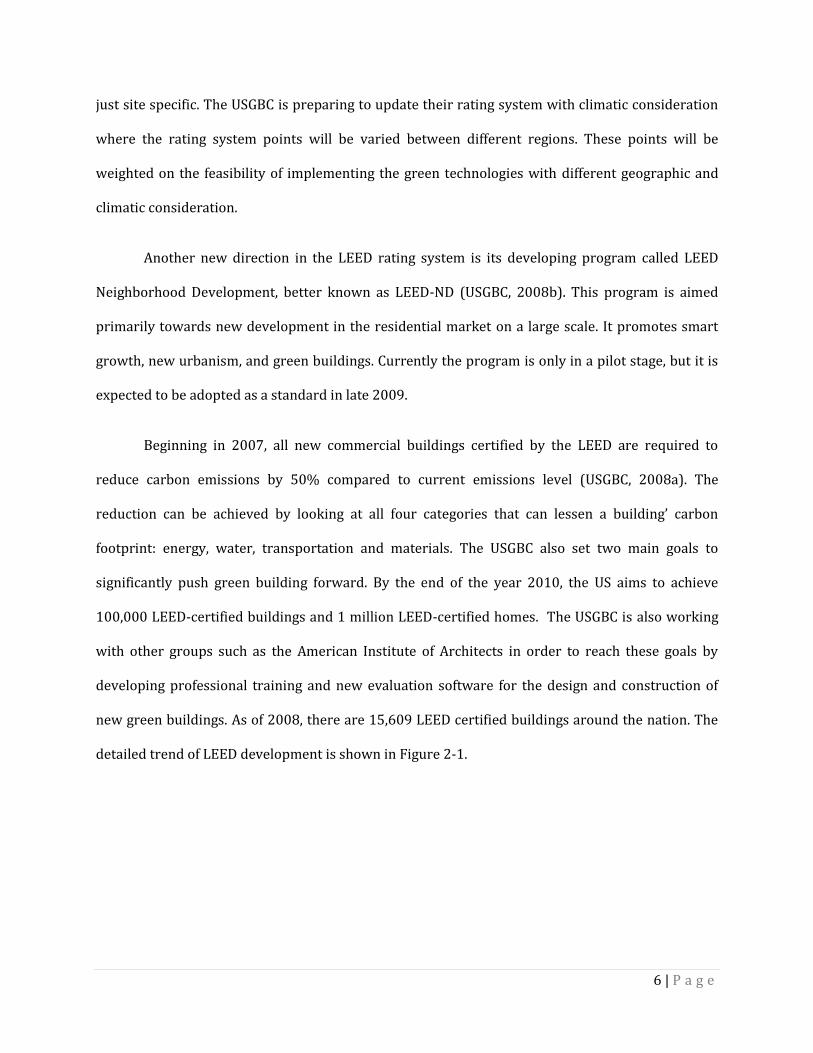
new green buildings. As of 2008, there are 15,609 LEED certified buildings around the nation. The
detailed trend of LEED development is shown in Figure 2-1.
7 | P a g e
Figure 2-1: Number of LEED Certified Buildings Increasing Trend (USGBC, 2008a)
Other than the LEED rating system, there are also other rating systems for green building
such as the Green Globes system, which was created by the Green Building Initiative nonprofit
group (Yudelson, 2008). The Green Globes system is a web-based system that has been adopted by
6 states thus far. Although it is virtually identical to the LEED system, addressing at least 85% of the
same concerns, the Green Globes system is much less popular now compared with the LEED.
2.1.2 Benefits and Costs of Green Building
Green commercial buildings experience numerous economic and productivity benefits
(Yudelson, 2008). Some of the economic benefits include reduced operating and maintenance costs,
increased building value, tax benefits and increased employee productivity. The operating and
maintenance costs are reduced thanks to the energy savings, which could be 25 to 40% more
efficient than traditional buildings. With these savings, the building’s value is greatly increased,
which can offer the owner a return rate of 20% or more. A LEED Gold certified building in California
is estimated to save approximately $500,000 a year in energy costs. The energy cost savings offered
by green buildings has prompted governments to start considering offering tax benefits such as tax
credits and property and sales tax abatements to promote people to start using green building.
2909
4858
8500
15,609
0
2000
4000
6000
8000
10000
12000
14000
16000
18000
2005 2006 2007 2008
Nu
mb
er
of
Bu
ildin
gs
Year
8 | P a g e
Green building also affects the productivity of employees in the building. For example, high-
performance lighting increases the productivity by approximately three percent.
There are many more benefits of green buildings such as health and public relations.
However, a lot of people believe that the cost of green buildings is still relatively high. While it is
true that green buildings often cost from 1% to 5% more than traditional buildings, the benefits
obtained can make up the difference (Yudelson, 2008). The lower operation cost could potentially
pay back for the cost of the building in a few years of the building cycle. A homeowner who uses
green technologies could also obtain similar benefits due to increased property value, water
conservations and energy savings, especially by reducing heating and cooling costs.
Considering the benefits a green building can offer, the cost of going green is worth the
investment. Because of people’s perception of green buildings as being expensive, one of the most
important research areas in green building is how to reduce costs (USGBC, 2008b). As mentioned in
previous section, green building typically costs from 1% to 5% more than traditional building. For
example, a $5 million project ends up costing $1 million more if LEED certification is sought. In
order to make the adoption of green building more mainstream, it is necessary to reduce the cost of
green building technologies. Many agencies including the U.S. EPA are starting to allocate funds for
research to make green building more affordable.
9 | P a g e
2.2 Water and Wastewater Infrastructure
Wastewater infrastructure and green buildings affect each other. Green building can reduce
negative impacts on water infrastructure by improving water efficiency using different sustainable
methods such as recycling water for flushing toilets. This section describes water supply
hydrological cycles, wastewater infrastructure, water reuse and stormwater management.
2.2.1 Water supply cycle
Water supply hydrological cycle addresses the impacts of buildings in the cycle of obtaining
potable water. Water is important for everyday human activities including drinking, cooking, and
cleaning. In the United States, buildings account for 13% of potable water consumption,
approximately 15 trillion gallons annually (USGBC, 2008a). According to the EPA (2004), if this
water usage trend is continued, many states will have fresh water shortages in 30 years. Once
water has been used, it is released back into the environment. Untreated water can pollute and
cause negative impacts on the environment and humans. Therefore, it is necessary to improve the
efficiency of water usage as well as to reduce the impact of wastewater on the environment. Every
day, water flows from natural sources to supply human activities and then is returned back to
rivers and seas. We call this cycle the “water supply cycle” to differentiate it from the ecological
water cycle, which describes water flow in nature. An illustration of the water supply cycle is shown
in the Figure 2-2. The chart was created using materials from the EPA website (2008).
10 | P a g e
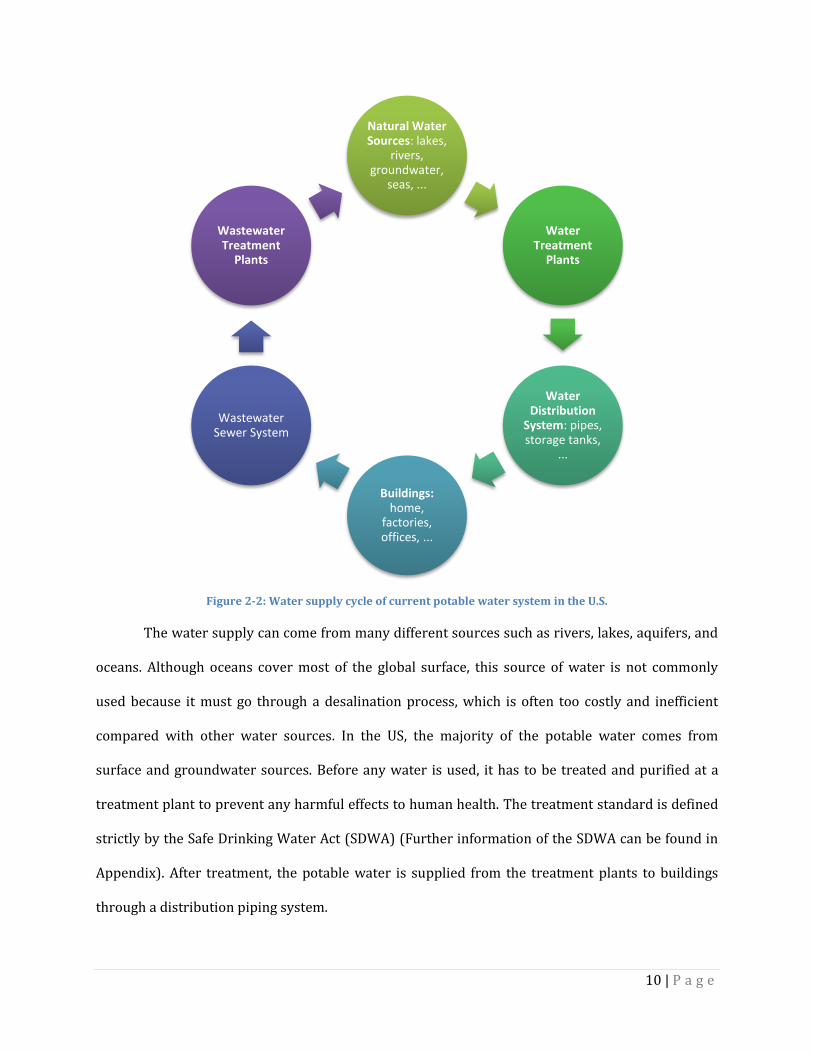
Figure 2-2: Water supply cycle of current potable water system in the U.S.
The water supply can come from many different sources such as rivers, lakes, aquifers, and
oceans. Although oceans cover most of the global surface, this source of water is not commonly
used because it must go through a desalination process, which is often too costly and inefficient
compared with other water sources. In the US, the majority of the potable water comes from
surface and groundwater sources. Before any water is used, it has to be treated and purified at a
treatment plant to prevent any harmful effects to human health. The treatment standard is defined
strictly by the Safe Drinking Water Act (SDWA) (Further information of the SDWA can be found in
Appendix). After treatment, the potable water is supplied from the treatment plants to buildings
through a distribution piping system.
Natural Water Sources: lakes,
rivers, groundwater,
seas, ...
Water Treatment
Plants
Water Distribution
System: pipes, storage tanks,
...
Buildings:home,
factories, offices, ...
Wastewater Sewer System
Wastewater Treatment
Plants

11 | P a g e
In the buildings, water is used in a variety of ways. There are two types of wastewater
generated from these uses: grey water and black water (Ludwig, 2006). The wastewater created by
activities such as cooking, cleaning, and washing is called grey water. Grey wastewater often
contains chemical substances and food wastes. It accounts for about 50-80% of wastewater
generated by households. The other type of wastewater is black water, which is water that was
used to flush toilets. Black water is often more contaminated and needs further treatment.
In addition to wastewater created by residential buildings, manufacturers produce a large
amount of wastewater. According to Billatos and Basaly (1997), the United States manufacturers
generated 6.5 billion tons of wastewater in 1986. This type of wastewater often contains of oil,
sludge, ash, and other waste products and is mostly generated by the cleaning process. The
wastewater from manufacturing processes needs special treatment depending on the industry (US
EPA, 1995). This wastewater treatment process is regulated by the EPA and controlled under strict
standards using best management practices.
The wastewater is transferred to wastewater treatment plants municipal sewer systems. At
the wastewater treatment plant, the water is treated to remove all toxins, wastes, and chemical
substances that can be harmful to the environment. After treatment, water can be returned to other
sources.
2.2.2 Wastewater infrastructure systems
Supply is only a piece of the water cycle; after potable water has been used it enters the
wastewater infrastructure system. The scale of wastewater treatment and discharge in a
community depends on its size. The wastewater treatment systems in the United States face a lot of
challenges, from the vast scale and large area of the country to the increasing population and
demand for better water quality.
12 | P a g e
Increasing population brings a need to continuously upgrade the current water
infrastructure system. According to a survey in 1995, the capacity of United States wastewater
treatment facilities was for 190 million people, which was only 73% of the total population (US
EPA, 1995). The rest of the wastewater was treated using septic systems. The EPA plans to expand
and increase the number facilities to meet all the needs of the population. Estimates from the EPA
show that an increase from 16,000 to 18,000 facilities by 2016 will be able to provide services for
90% of the population.
However, in order to build such a large number of treatment plants, there is a need for
significant financial support from the government. Development in a large country like this is a very
costly and difficult objective (Grigg, 2003). Since the current income of the water infrastructure
system is mainly from the water bills paid by customers every month. This amount is hardly
enough to cover the cost of operating and maintaining the facilities. Therefore, financial assistance
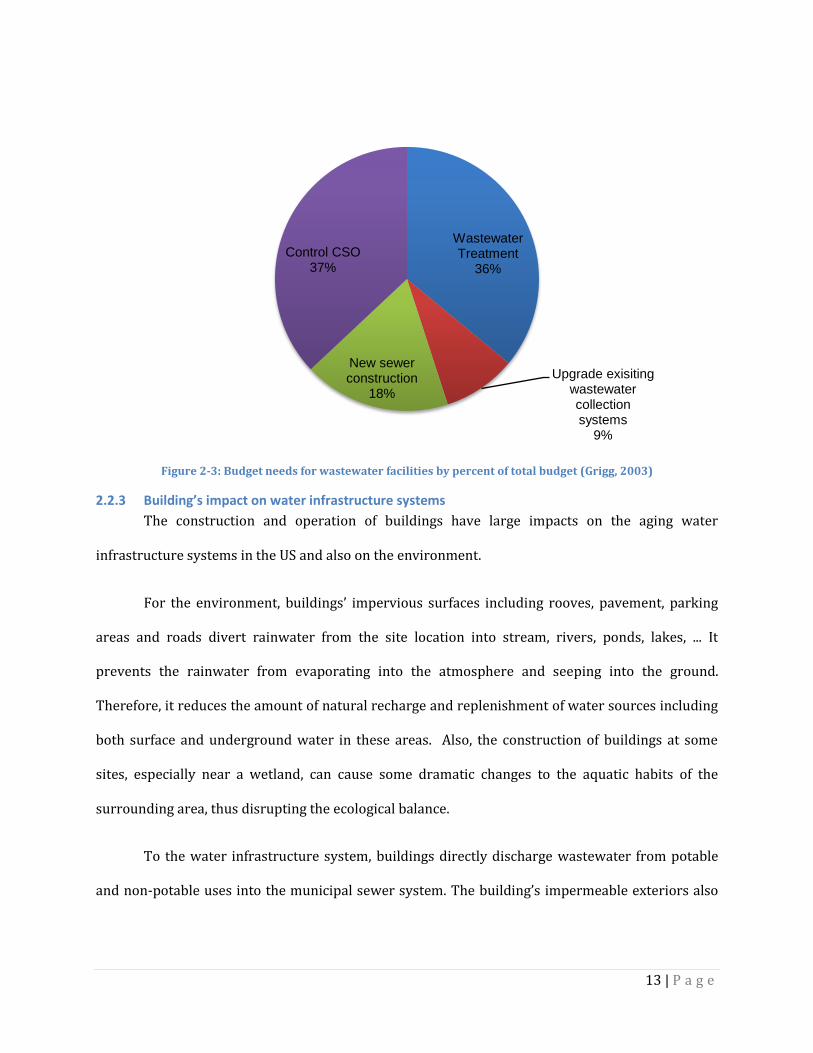
from the government would be necessary to cover these costs. From a survey of wastewater
facilities regarding funds required, the EPA has estimated that it would take 140 billion dollars to
replace and improve current systems in order to fill the gap. The details of this amount are
categorized as shown in Figure 2-3.
13 | P a g e
Figure 2-3: Budget needs for wastewater facilities by percent of total budget (Grigg, 2003)
2.2.3 Building’s impact on water infrastructure systems
The construction and operation of buildings have large impacts on the aging water
infrastructure systems in the US and also on the environment.
For the environment, buildings’ impervious surfaces including rooves, pavement, parking
areas and roads divert rainwater from the site location into stream, rivers, ponds, lakes, ... It
prevents the rainwater from evaporating into the atmosphere and seeping into the ground.
Therefore, it reduces the amount of natural recharge and replenishment of water sources including
both surface and underground water in these areas. Also, the construction of buildings at some
sites, especially near a wetland, can cause some dramatic changes to the aquatic habits of the
surrounding area, thus disrupting the ecological balance.
To the water infrastructure system, buildings directly discharge wastewater from potable
and non-potable uses into the municipal sewer system. The building’s impermeable exteriors also
Wastewater Treatment
36%
Upgrade exisiting wastewater collection systems
9%
New sewer construction
18%
Control CSO37%
14 | P a g e
cause stormwater runoff that largely contributes to land erosion and combined sewer overflow
(CSO) during peak rain fall periods.
Besides all its direct impacts, building operations also have many indirect impacts on the
water infrastructure systems. The water distribution system uses energy to deliver potable water
from water sources to building sites. In many regions where water sources and water treatment
plants are very far from the community areas, this delivery cost is very significant. Transferring and
treatment of wastewater from buildings also consumes a large amount of energy and money.
2.2.4 Wastewater
In the United States buildings account for 13% of the potable water used. This proportion is
higher than any other country (EPA Office of Water, 2008). The domestic use of water can go as
high as 165 gallons per building per day, which puts significant stress on the water infrastructure
system. There are two types of wastewater generated by activities at buildings: grey water and
black water. Black water is wastewater used from flushing the toilets while grey water is
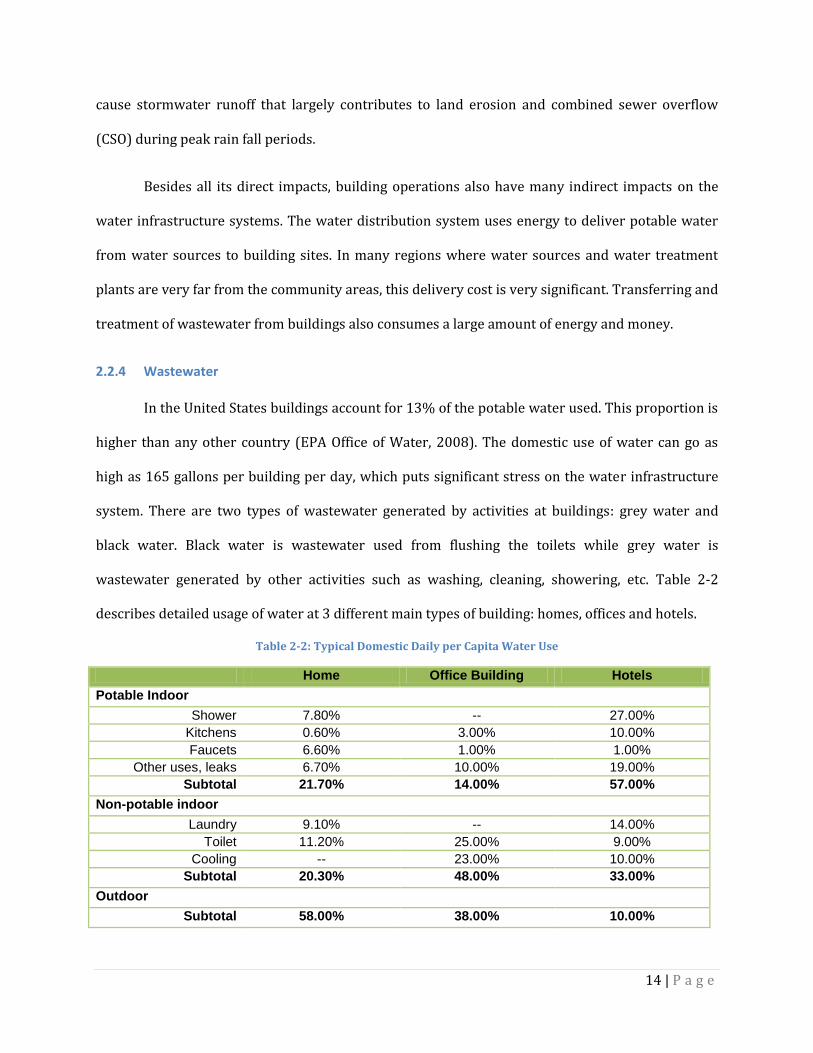
wastewater generated by other activities such as washing, cleaning, showering, etc. Table 2-2
describes detailed usage of water at 3 different main types of building: homes, offices and hotels.
Table 2-2: Typical Domestic Daily per Capita Water Use
Home Office Building Hotels
Potable Indoor
Shower 7.80% -- 27.00%
Kitchens 0.60% 3.00% 10.00%
Faucets 6.60% 1.00% 1.00%
Other uses, leaks 6.70% 10.00% 19.00%
Subtotal 21.70% 14.00% 57.00%
Non-potable indoor
Laundry 9.10% -- 14.00%
Toilet 11.20% 25.00% 9.00%
Cooling -- 23.00% 10.00%
Subtotal 20.30% 48.00% 33.00%
Outdoor
Subtotal 58.00% 38.00% 10.00%
15 | P a g e
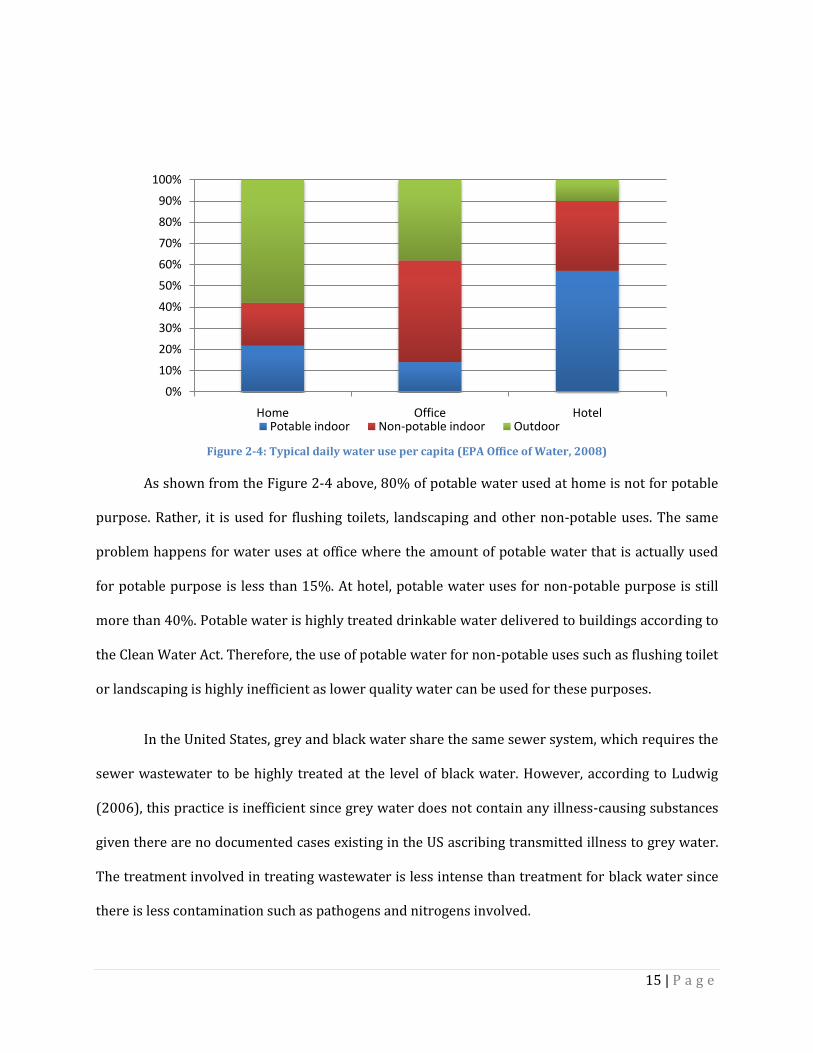
Figure 2-4: Typical daily water use per capita (EPA Office of Water, 2008)
As shown from the Figure 2-4 above, 80% of potable water used at home is not for potable
purpose. Rather, it is used for flushing toilets, landscaping and other non-potable uses. The same
problem happens for water uses at office where the amount of potable water that is actually used
for potable purpose is less than 15%. At hotel, potable water uses for non-potable purpose is still
more than 40%. Potable water is highly treated drinkable water delivered to buildings according to
the Clean Water Act. Therefore, the use of potable water for non-potable uses such as flushing toilet
or landscaping is highly inefficient as lower quality water can be used for these purposes.
In the United States, grey and black water share the same sewer system, which requires the
sewer wastewater to be highly treated at the level of black water. However, according to Ludwig
(2006), this practice is inefficient since grey water does not contain any illness-causing substances
given there are no documented cases existing in the US ascribing transmitted illness to grey water.
The treatment involved in treating wastewater is less intense than treatment for black water since
there is less contamination such as pathogens and nitrogens involved.
0%
10%
20%
30%
40%
50%
60%
70%
80%
90%
100%
Home Office HotelPotable indoor Non-potable indoor Outdoor
16 | P a g e
Grey water chemicals and wastes can be effectively absorbed and filtered by the soil and
trees (Ludwig, 2006). The top layer of soil is very efficient in purifying the grey water before it
reaches deeper layers, which can be even more effective than a treatment plant, thus protecting the
underground water and even surface water. Therefore, a wetland can be an effective filter layer. A
constructed wetland is an efficient way to reduce most of the wastes contained in grey and even
black water. Sidwell Friends Middle Sschool is a LEED Platinum certified facility which uses
wetland technology. Their wastewater recycling techniques allow them to achieve 93% water
efficiency. Their recycled grey water is of high enough quality to use for non-potable purposes in
the building such as flushing toilets and irrigation. Reducing the amount of grey water discharged
into in the municipal sewer systems also relieves the stress for the treatment facilities. Less waste
flow means the treatment plants treat more effectively and at a reduced expense.
However, more research should be performed on the reusability of grey water to prevent
any negative impacts on public health. The Uniform Plumbing Code (UPC) and International
Plumbing Code (IPC) set treatment standards for grey water reuse in water closets and irrigation.
They also require a labeling system to notify a user that the water is reclaimed. The current legal
system is very strict and costly on allowing grey water reuse, which often discourages people who
are trying to implement such a system. Rain water is another potential source for water reuse.
However, since there is no differentiation between rain water and grey water, they are
unnecessarily required to undergo the same treatment, hindering the reuse of rain water. The grey
water has to go through a filtration process before being used in irrigation or being recycled. A grey
water recycling model is shown in Figure 2-5.
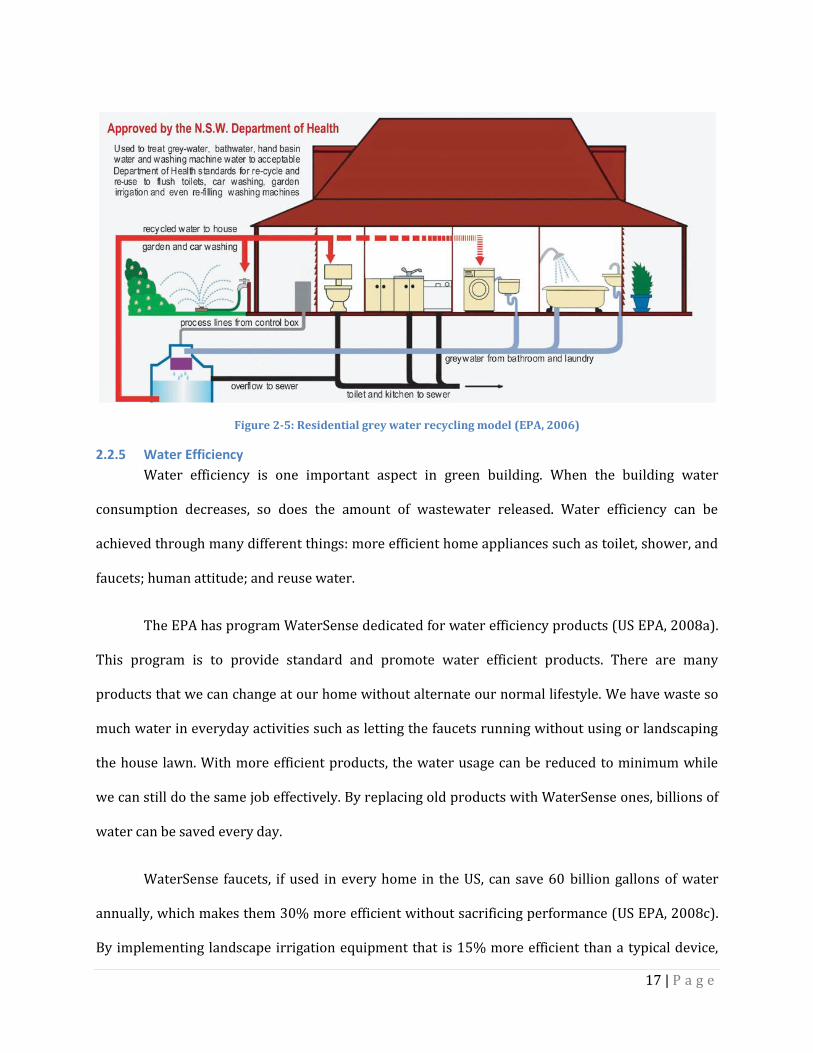
17 | P a g e
Figure 2-5: Residential grey water recycling model (EPA, 2006)
2.2.5 Water Efficiency
Water efficiency is one important aspect in green building. When the building water
consumption decreases, so does the amount of wastewater released. Water efficiency can be
achieved through many different things: more efficient home appliances such as toilet, shower, and
faucets; human attitude; and reuse water.
The EPA has program WaterSense dedicated for water efficiency products (US EPA, 2008a).
This program is to provide standard and promote water efficient products. There are many
products that we can change at our home without alternate our normal lifestyle. We have waste so
much water in everyday activities such as letting the faucets running without using or landscaping
the house lawn. With more efficient products, the water usage can be reduced to minimum while
we can still do the same job effectively. By replacing old products with WaterSense ones, billions of
water can be saved every day.
WaterSense faucets, if used in every home in the US, can save 60 billion gallons of water
annually, which makes them 30% more efficient without sacrificing performance (US EPA, 2008c).
By implementing landscape irrigation equipment that is 15% more efficient than a typical device,
18 | P a g e
1.5 billion gallons could be saved per day. If low-flow toilets and urinals were implemented
throughout the country two billion gallons of water per day could be saved across the country.
Society’s awareness of water efficiency must be improved if large scale reduction is desired.
Most of people know that we can save as much as 3,000 gallons per year just by turning off the
faucets while brushing our teeth. However, not all of us do. People awareness is an important factor
affecting water use efficiency. No matter how efficient the product is, it is still wasteful if the person
using it does not recognize the importance of water.
2.3 Stormwater Infrastructure
While grey and black water are necessary considerations for green building, another
essential aspect is stormwater management. Stormwater runoff has been a problem that
conventional building has paid less attention to. During precipitation, water runs from rooftops
onto lawns and/or streets. The water then carries along all the chemicals, pesticides, wastes, and
any other contaminants it comes across. The water ultimately flows into the municipal sewer
systems or into natural waterways (Coffman & Clar, 2003). This problem is often worse in urban
regions where most of the surface area is covered by impervious surfaces such as roads,
construction, and parkways. Figure 2-6 illustrates the stormwater problem and its potential
impacts. Once water is collected from a large area, it can potentially cause flooding. When the sewer
systems capacity is exceeded, which is called Combined Sewer Overflow (CSO), it typically causes
erosion to the lands outside of urban area. The overflow of sewers can release raw sewage to the
environment before it reaches the treatment plant. In the US, many cities have attempted to reduce
CSO by separating combined sewer pipes with stormwater pipes and expanding treatment and
storage capacity. In areas where more development occurs with impervious surfaces, larger size
piping system will also be required. However, these practices are very expensive and will take
decades to fully develop.
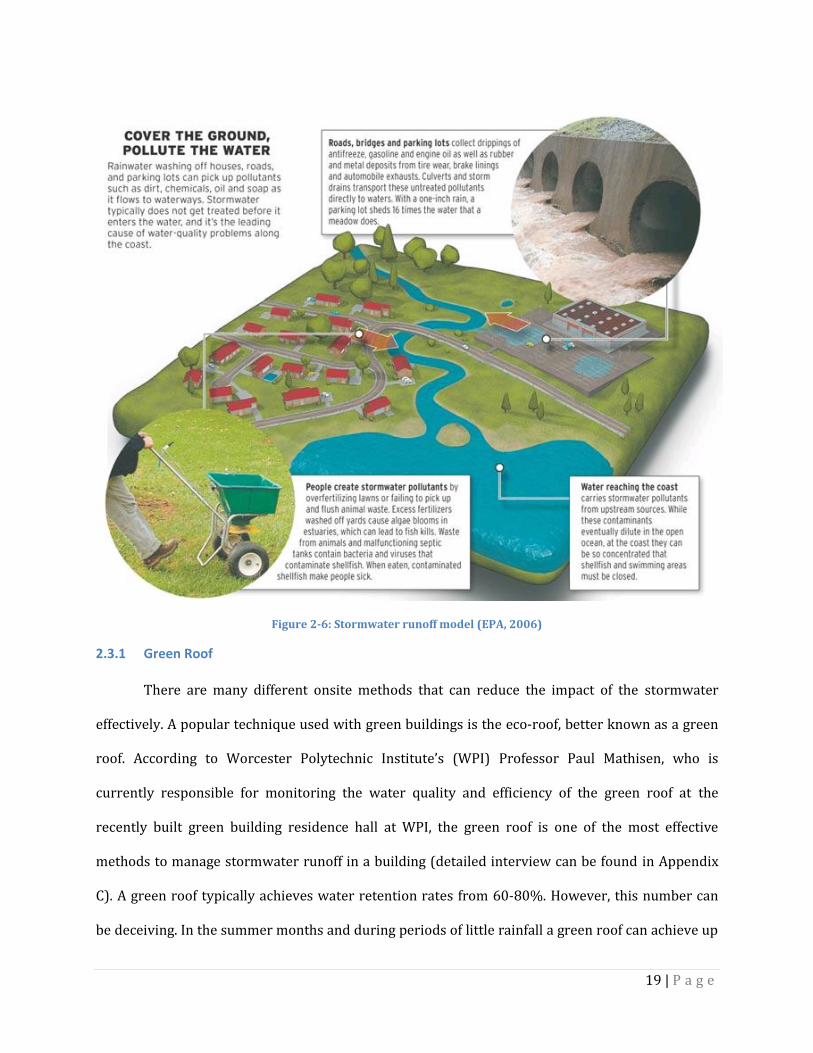
19 | P a g e
Figure 2-6: Stormwater runoff model (EPA, 2006)
2.3.1 Green Roof
There are many different onsite methods that can reduce the impact of the stormwater
effectively. A popular technique used with green buildings is the eco-roof, better known as a green
roof. According to Worcester Polytechnic Institute’s (WPI) Professor Paul Mathisen, who is
currently responsible for monitoring the water quality and efficiency of the green roof at the
recently built green building residence hall at WPI, the green roof is one of the most effective
methods to manage stormwater runoff in a building (detailed interview can be found in Appendix
C). A green roof typically achieves water retention rates from 60-80%. However, this number can
be deceiving. In the summer months and during periods of little rainfall a green roof can achieve up
20 | P a g e
to 100% water absorption. In periods of heavy rainfall a green roof cannot prevent stormwater
runoff but rather gradually releases the water later to prevent overflow in sewer systems. The
green roof also acts as a layer to filter some chemicals out of the water. It can naturalize the
radiation from the sun, thus making an effective insulation layer, which retains heat in the winter
and cools the building in the summer. This can lead to a large saving on energy costs.
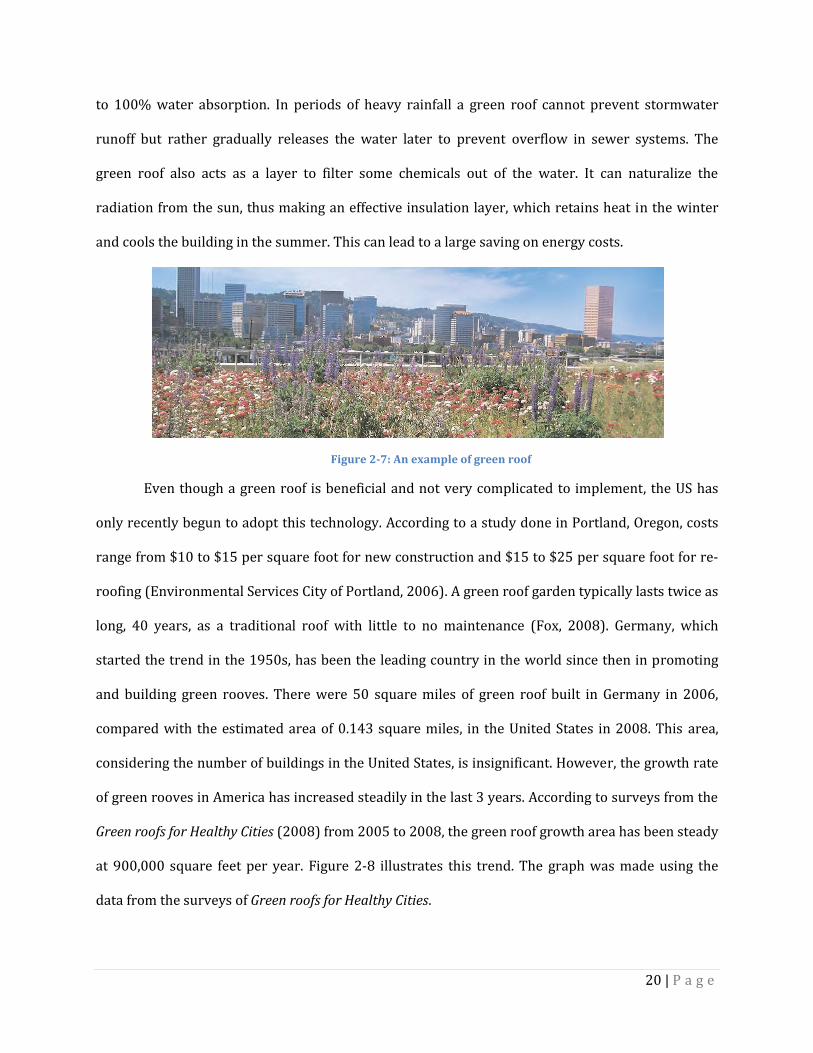
Figure 2-7: An example of green roof
Even though a green roof is beneficial and not very complicated to implement, the US has
only recently begun to adopt this technology. According to a study done in Portland, Oregon, costs
range from $10 to $15 per square foot for new construction and $15 to $25 per square foot for re-
roofing (Environmental Services City of Portland, 2006). A green roof garden typically lasts twice as
long, 40 years, as a traditional roof with little to no maintenance (Fox, 2008). Germany, which
started the trend in the 1950s, has been the leading country in the world since then in promoting
and building green rooves. There were 50 square miles of green roof built in Germany in 2006,
compared with the estimated area of 0.143 square miles, in the United States in 2008. This area,
considering the number of buildings in the United States, is insignificant. However, the growth rate
of green rooves in America has increased steadily in the last 3 years. According to surveys from the
Green roofs for Healthy Cities (2008) from 2005 to 2008, the green roof growth area has been steady
at 900,000 square feet per year. Figure 2-8 illustrates this trend. The graph was made using the
data from the surveys of Green roofs for Healthy Cities.
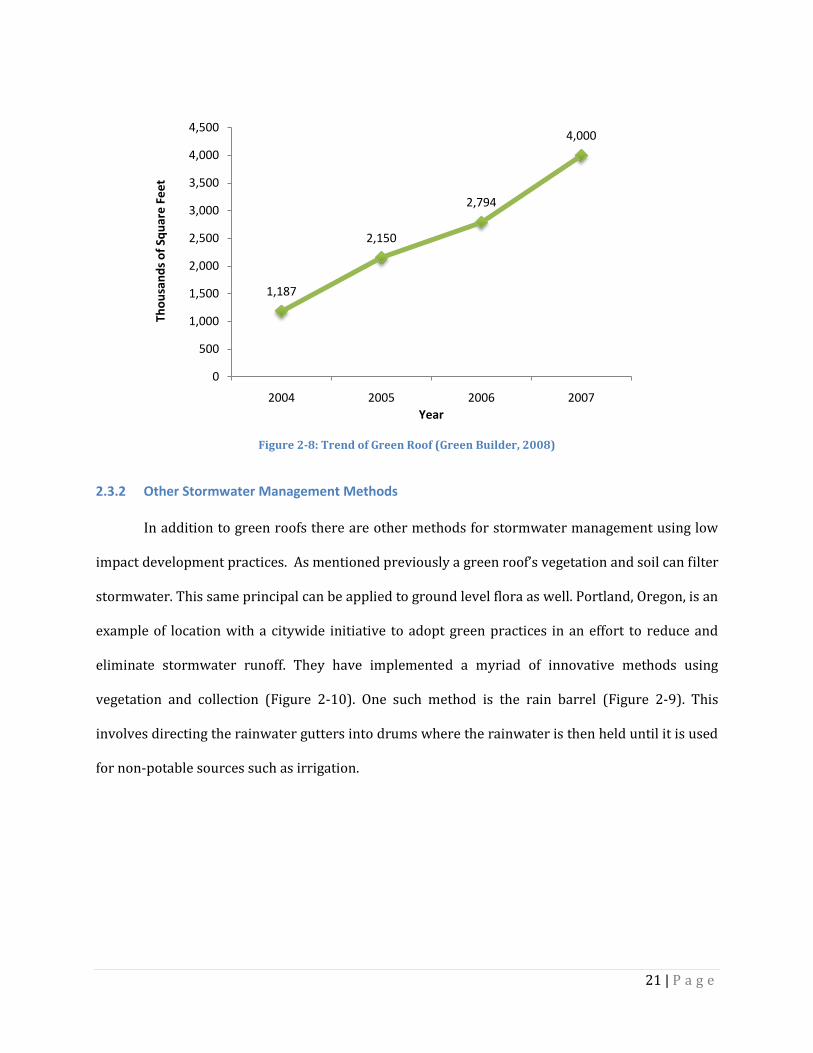
21 | P a g e
Figure 2-8: Trend of Green Roof (Green Builder, 2008)
2.3.2 Other Stormwater Management Methods
In addition to green roofs there are other methods for stormwater management using low
impact development practices. As mentioned previously a green roof’s vegetation and soil can filter
stormwater. This same principal can be applied to ground level flora as well. Portland, Oregon, is an
example of location with a citywide initiative to adopt green practices in an effort to reduce and
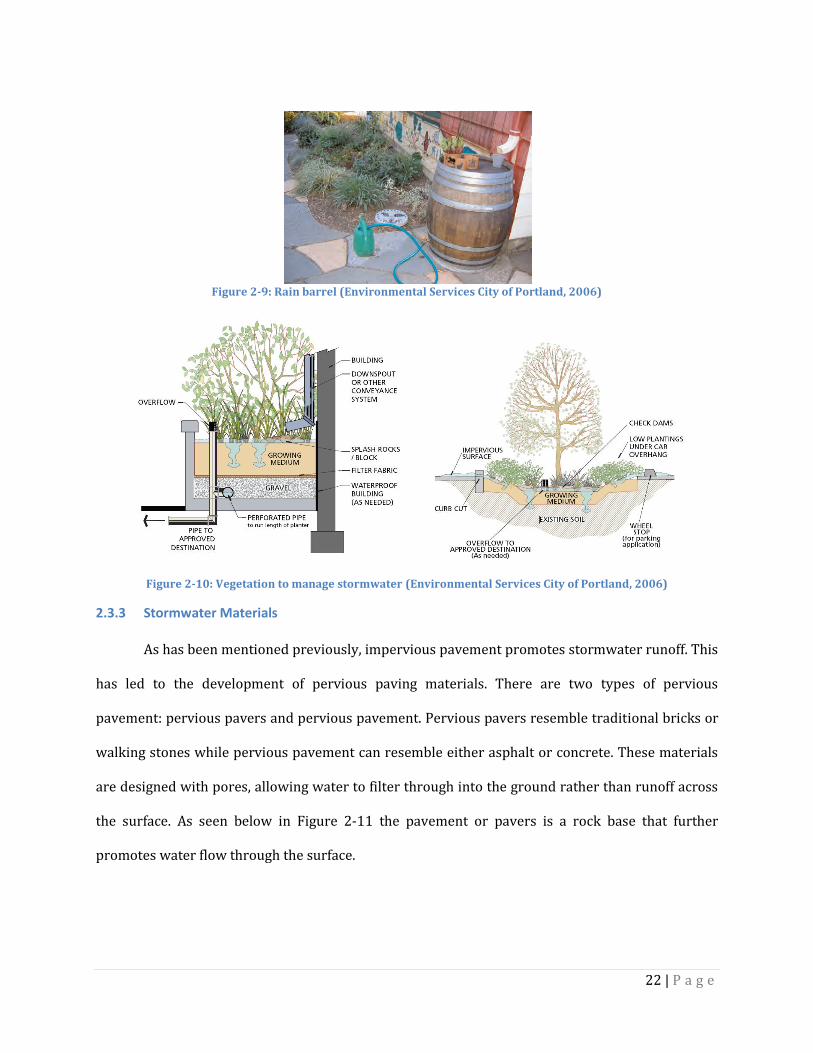
eliminate stormwater runoff. They have implemented a myriad of innovative methods using
vegetation and collection (Figure 2-10). One such method is the rain barrel (Figure 2-9). This
involves directing the rainwater gutters into drums where the rainwater is then held until it is used
for non-potable sources such as irrigation.
1,187
2,150
2,794
4,000
0
500
1,000
1,500
2,000
2,500
3,000
3,500
4,000
4,500
2004 2005 2006 2007
Tho
usa
nd
s o
f Sq
uar
e F
ee
t
Year
22 | P a g e
Figure 2-9: Rain barrel (Environmental Services City of Portland, 2006)
Figure 2-10: Vegetation to manage stormwater (Environmental Services City of Portland, 2006)
2.3.3 Stormwater Materials
As has been mentioned previously, impervious pavement promotes stormwater runoff. This
has led to the development of pervious paving materials. There are two types of pervious
pavement: pervious pavers and pervious pavement. Pervious pavers resemble traditional bricks or
walking stones while pervious pavement can resemble either asphalt or concrete. These materials
are designed with pores, allowing water to filter through into the ground rather than runoff across
the surface. As seen below in Figure 2-11 the pavement or pavers is a rock base that further
promotes water flow through the surface.
23 | P a g e
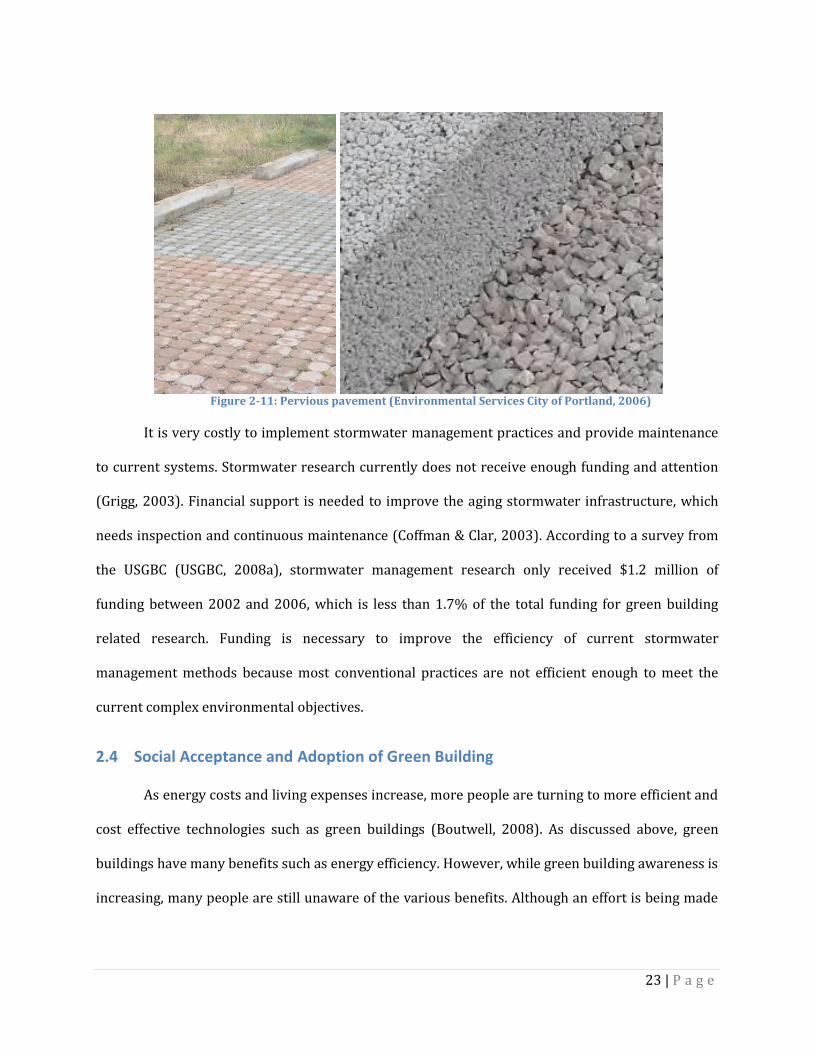
Figure 2-11: Pervious pavement (Environmental Services City of Portland, 2006)
It is very costly to implement stormwater management practices and provide maintenance
to current systems. Stormwater research currently does not receive enough funding and attention
(Grigg, 2003). Financial support is needed to improve the aging stormwater infrastructure, which
needs inspection and continuous maintenance (Coffman & Clar, 2003). According to a survey from
the USGBC (USGBC, 2008a), stormwater management research only received $1.2 million of
funding between 2002 and 2006, which is less than 1.7% of the total funding for green building
related research. Funding is necessary to improve the efficiency of current stormwater
management methods because most conventional practices are not efficient enough to meet the
current complex environmental objectives.
2.4 Social Acceptance and Adoption of Green Building
As energy costs and living expenses increase, more people are turning to more efficient and
cost effective technologies such as green buildings (Boutwell, 2008). As discussed above, green
buildings have many benefits such as energy efficiency. However, while green building awareness is
increasing, many people are still unaware of the various benefits. Although an effort is being made
24 | P a g e
to increase the knowledge and use of green building and sustainable technologies, the adoption of
these technologies in the building industry is still on a limited scale.
To determine the social acceptance of green buildings, it is best to determine the “three
dimensions of social acceptance … socio-political acceptance, community acceptance and market
acceptance” (Wüstenhagen, Wolsink, & Bürer, 2007). Socio-political acceptance can be measured by
polls and surveys to determine a general opinion of green buildings. The broad majority of people
support the idea of renewable and sustainable technologies such as green buildings. However,
while most people do support the idea of green buildings, they have been reluctant to adopt them.
There is a correlation between the slow pace of green technology adoption and community
acceptance (Wüstenhagen, Wolsink, & Bürer, 2007). Community acceptance of green buildings is
best showcased by the level of approval by residents, local authorities and other local stakeholders
in a community. In some cases, communities may be more socio-politically accepting of the idea of
using sustainable technologies until asked to implement the idea in their community. Other cases
show the reverse of this case in that communities are reluctant to accept sustainable technologies
until a time occurs to adopt them in their community such as converting a local community center
into a more environmentally friendly building. These cases are usually a result of lack of education
about green technologies, which has led people to believe that the technology is difficult to
implement or extremely expensive.
This lack of knowledge about green buildings is especially important to deal with if market
acceptance is to be achieved. Market acceptance calls for a demand for the technology by both
consumers and investors. While most of them are aware that green buildings have many benefits,
many do not have a full understanding of the actual benefits. In a recent survey conducted by the
Washington Department of Ecology (ECY, 2008), at least 22% of those interviewed were unaware
of an energy efficiency difference between green and non-green built homes, and 31% of those
25 | P a g e
interviewed were unaware of any water conservation benefits. However, the broad majority of
people support the idea of renewable and sustainable technologies such as those found in green
buildings. Many people also believe that the implementation of the technology is often difficult or
expensive (Wüstenhagen, Wolsink, & Bürer, 2007). Most of these technologies that have not made
mainstream advertisements, unlike EnergyStar products like dishwashers, are thought to be too
expensive to implement by the average person building a family home. Investors, on the other hand,
recognize that most green technologies are being marketed in the wrong way, which focuses not on
consumer need but rather the “greenness” of the technology.
To increase acceptance of green building technologies, different organizations and states,
such as Florida, are promoting green buildings in an effort to curtail energy and water costs
(Florida Solar Energy Center (FSEC), 2008). The FSEC has outlined a “Green Building Public
Awareness Campaign Plan” in order to bring awareness of the advantages of building better, more
environmentally friendly homes. This plan calls for surveys, media and community relations, web
site development and advertising. The surveys are used to determine how many people in Florida
know about the advantages of green homes. Media relations and advertising will be used to educate
people about green homes. As more states advocate environmentally friendly technologies, more
people will become aware of green building. This will lead to a bigger market for green building
technologies as well as more efficient homes.
The concept and benefits of green buildings is undisputable (Lockwood, 2008). Green
factories can be very beneficial as a result of their practices: “they use less energy and water, have
lower greenhouse gas emissions, and provide a healthier work environment than conventional
buildings” (p. 52). But in the United States, most of the green buildings constructed over the past
decade have been primarily white-collar workplaces, including office buildings, schools, and R&D

26 | P a g e
facilities. The adoption of green technologies in blue-collar workplaces, from warehouses to
distribution centers to factories, has lagged far behind.
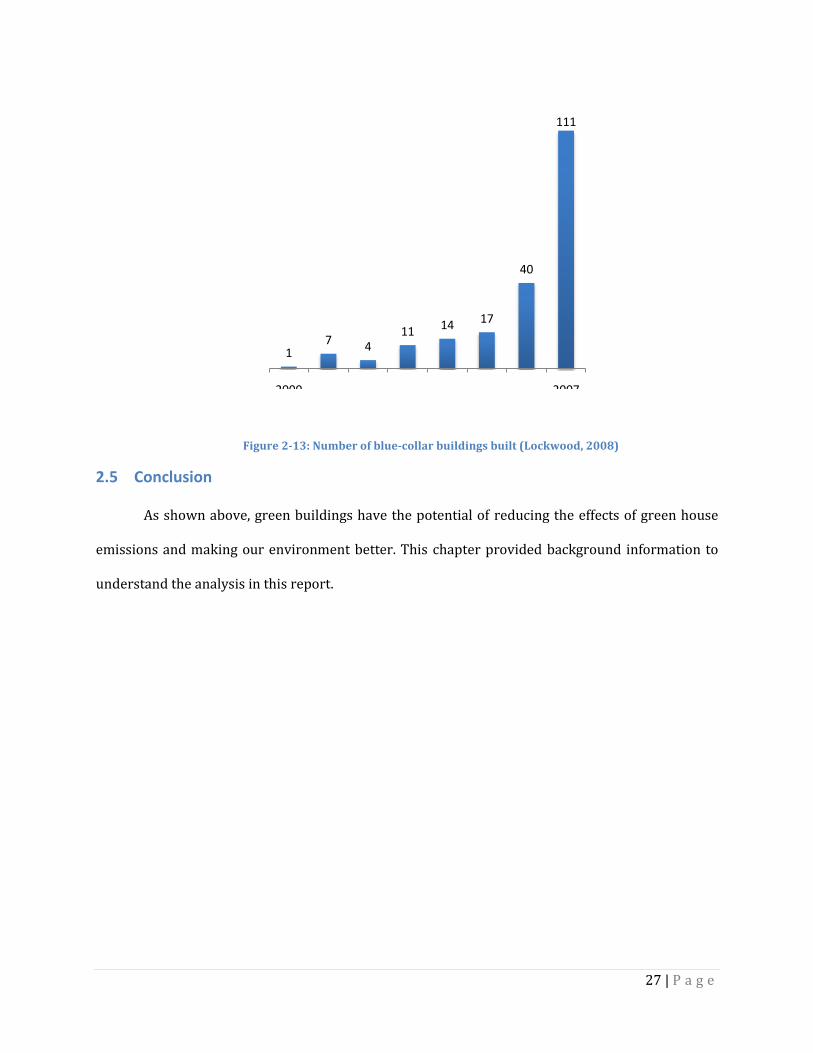
Although the number of green workplaces built in 2007 is still relatively small, the
trajectory has matched the rate of increase of white-collar buildings over the past eight years as
shown in Figure 2-12 (Lockwood, 2008). This trajectory increase was slow in 2000 but has
improved steadily through 2007. Only 46 white-collar green buildings registered for or received
LEED certification in 2000, when it first became available. The number has increased dramatically
from 1,632 buildings in 2006 to 5,417 in 2007, a 232% increase in one year. Similarly, the number
of blue-collar buildings in 2007 climbed to 111, a 178% increase (See Figure 2-13).
Figure 2-12: Number of Commercial LEED Certified Buildings (Lockwood, 2008)
46205 330
501796
14001632
5417
2000 2001 2002 2003 2004 2005 2006 2007
Nu
mb
er
of
Bu
ildin
gs
Year
27 | P a g e
Figure 2-13: Number of blue-collar buildings built (Lockwood, 2008)
2.5 Conclusion
As shown above, green buildings have the potential of reducing the effects of green house
emissions and making our environment better. This chapter provided background information to
understand the analysis in this report.
17 4
11 14 17
40
111
2000 2007
28 | P a g e
3 Methodology
The NCER is the lead provider of extramural research and development for the EPA. This
office is in charge of providing research funding to academic institutions, independent companies,
and organizations. Since there is not yet a designated strategy for green building research, the
NCER’s past research has been scattered and without focus. Green building research will be of great
value in the future as the EPA moves toward developing and promoting sustainability. Of the
various impacts that green building has on the environment, our project concentrated specifically
on the impacts that green building has on the water and wastewater infrastructure systems.
Our goal was to provide recommendations to NCER, specifically prioritizing areas and
technologies in need of future research. We focused primarily on wastewater treatment, water
recycling and stormwater management. We developed the following list of 4 objectives to achieve
our goal.
Identify and organize all current and past research sponsored by NCER related to green
buildings.
Identify current and past research sponsored by other offices within the EPA and by other
organizations on green building.
Analyze and identify the gaps in research and technologies with a focus on water infrastructure.
Determine the EPA’s budget and regulatory constraints to carry out research to provide
appropriate recommendations.
Significant research has been accomplished regarding green buildings and related technologies
from different agencies and organizations. Identifying these resources gave us an understanding of
the current direction of green building research. To have a complete view of water infrastructure
research we looked at projects from sources within and outside of the NCER.
29 | P a g e
When looking at sources from within the EPA, we faced several challenges when gathering
the information. As an agency, the EPA is set up in a matrix where each office does research in its
specific field, for example, the office of water is dedicated solely to water. Given that green building
is a new area of research there was no strategic goal or budget dedicated to green buildings.
Therefore each of the different offices within the EPA carries out research related to green building
that fit its specific mission. This creates research that does not typically focus on green buildings
per se, but instead addresses different technologies that could be implemented in green buildings.
Therefore, the research was scattered in different categories such as alternative energy, pollution
prevention, air quality, wastewater treatment, etc. Our first search for information came from
NCER’s archive, where our project was based. We then studied what other EPA offices as well as
other organizations had done.
3.1 NCER’s green building research
We began our search for past research with NCER’s electronic database system. Their
archive contains every funded project since 1995, which approximates to 5500 projects. These
projects fall under different NCER programs: Science To Achieve Research (STAR), Small Business
Innovation Research (SBIR), People, Prosperity and Planet (P3), Collaborative Science and
Technology Network for Sustainability (CNS), etc. To avoid ambiguity and confusion, we developed
a list of categories that provided a clear definition of what type of green building projects we were
searching for (Refer to Table 3-1 for a detailed categories list). In order to validate if a project fit
into our categories we looked at the Abstract of each project. If a report’s Abstract was inadequate
to determine then we went on to the Project Description.
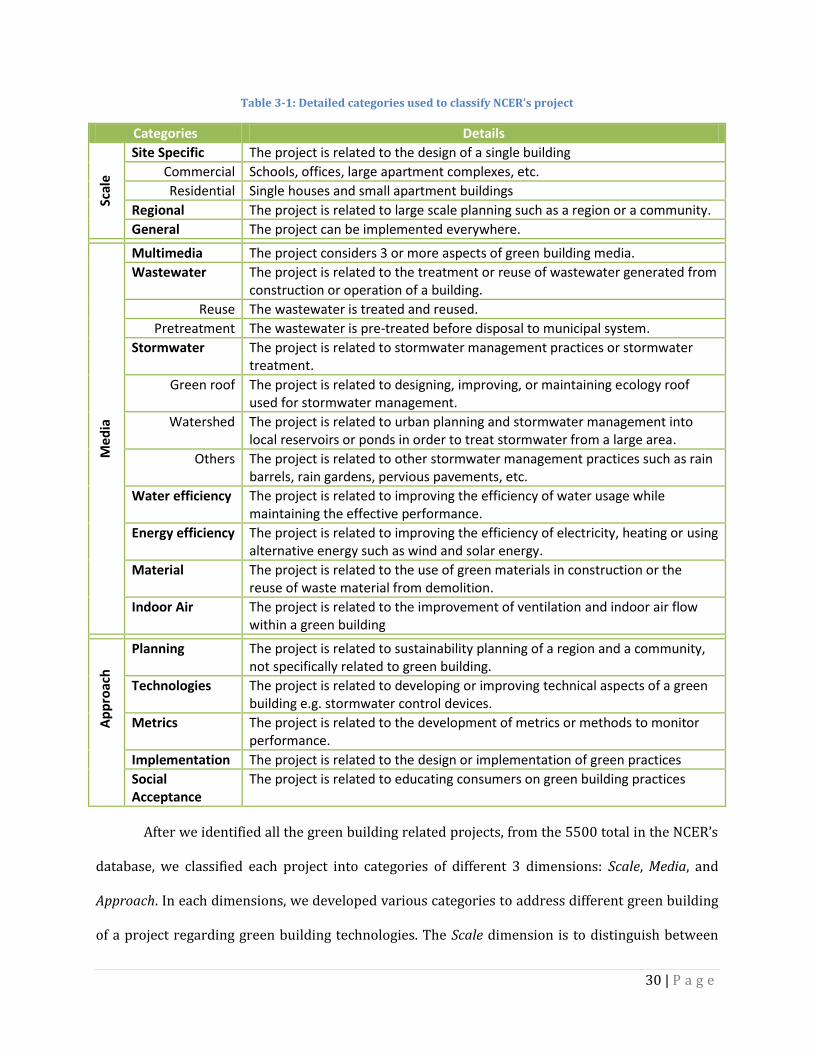
30 | P a g e
Table 3-1: Detailed categories used to classify NCER’s project
Categories Details
Scal
e
Site Specific The project is related to the design of a single building
Commercial Schools, offices, large apartment complexes, etc.
Residential Single houses and small apartment buildings
Regional The project is related to large scale planning such as a region or a community.
General The project can be implemented everywhere.
Me
dia
Multimedia The project considers 3 or more aspects of green building media.
Wastewater The project is related to the treatment or reuse of wastewater generated from construction or operation of a building.
Reuse The wastewater is treated and reused.
Pretreatment The wastewater is pre-treated before disposal to municipal system.
Stormwater The project is related to stormwater management practices or stormwater treatment.
Green roof The project is related to designing, improving, or maintaining ecology roof used for stormwater management.
Watershed The project is related to urban planning and stormwater management into local reservoirs or ponds in order to treat stormwater from a large area.
Others The project is related to other stormwater management practices such as rain barrels, rain gardens, pervious pavements, etc.
Water efficiency The project is related to improving the efficiency of water usage while maintaining the effective performance.
Energy efficiency The project is related to improving the efficiency of electricity, heating or using alternative energy such as wind and solar energy.
Material The project is related to the use of green materials in construction or the reuse of waste material from demolition.
Indoor Air The project is related to the improvement of ventilation and indoor air flow within a green building
Ap
pro
ach
Planning The project is related to sustainability planning of a region and a community, not specifically related to green building.
Technologies The project is related to developing or improving technical aspects of a green building e.g. stormwater control devices.
Metrics The project is related to the development of metrics or methods to monitor performance.
Implementation The project is related to the design or implementation of green practices
Social Acceptance
The project is related to educating consumers on green building practices
After we identified all the green building related projects, from the 5500 total in the NCER’s
database, we classified each project into categories of different 3 dimensions: Scale, Media, and
Approach. In each dimensions, we developed various categories to address different green building
of a project regarding green building technologies. The Scale dimension is to distinguish between
31 | P a g e
the sizes of implementation of a project. A project can aim at a Site Specific single building, a large
Regional building planning or just General technology. Within Site Specific, we also distinguished
between Residential and Commercial sectors in order to have better view on the type of location of
green building. The Media dimension includes all different types of green building research field
that a project can fall into: Stormwater, Wastewater, Energy Efficiency, etc. Since our project’s focus
is on water infrastructure, we developed further sub categories in two main areas of water
infrastructure: Stormwater and Wastewater. Details of each category can be found in Table 3-1.
With input from our liaisons, we chose several key projects related to green buildings or
associated technologies to further investigate. These projects were chosen from the three main
funding programs, CNS, SBIR and P3, because each program has a different strategic goal and aims
to support different types of research. We retrieved physical copies of these reports and analyzed
the technology researched. We then compared these technologies with our background research
and consulted with our liaisons about the feasibility of these technologies. We set up interviews
with the Principle Investigators (PI) by phone or email to further evaluate each project. We
developed a common interview protocol for these interviews with a script and standardized
questions (Refer to Appendix E). The information desired from the interviews was details of their
results and any lingering questions they had after the completion of the project. We always finished
by asking for input and opinion regarding research gaps of green building technologies.
3.2 External NCER’s green building research
While our project is based within NCER it was essential for us to consider green building
research completed by other offices within EPA and also other organizations. By looking broadly
we were able to identify if any of the gaps that exist in NCER’s research had been filled by other
sources.
32 | P a g e
3.2.1 Other EPA Offices’ green building research
Within the EPA, several other offices have also been working on developing or
implementing green building technologies. Therefore we gathered information from these offices
about their past and current projects to ensure our suggestions to NCER do not overlap with what is
already being done elsewhere within the EPA. We also held interviews with employees from each of
these offices to further clarify their purpose and gather their opinions regarding future research
areas. We also wanted to look at the progress of different green EPA programs, such as WaterSense.
The Office of Wetlands, Oceans, and Watersheds (OWOW) is in charge of stormwater
management technologies. OWOW focuses primarily on reducing stormwater runoff through the
implementation of simple green technologies, such as low impact development. We interviewed
two employees, Ms. Abby Hall and Mr. Jamal Kadri, in this office to get an update on their current
programs. Our objective of the interview with them was to gather their opinions on current
stormwater management technologies, including green roofs, rain gardens and other methods. We
also wanted to find out about their research budget and strategy for integrating these technologies
with green building development.
For current green building programs in the EPA, we interviewed Ms. Alison Kinn from the
Office of Pollution Prevention and Toxics (OPPT), and Mr. Ken Sandler from the Green Building
Workgroup. Besides being the chair for the U.S. EPA Green Building Work Group, Mr. Ken Sandler is
also a member of the Research Committee at the U.S. Green Building Council (USGBC), the
organization providing the LEED Certification for green building. These individuals are in charge of
providing a strategy for green building research, specifically evaluating a building’s impacts on the
environment and human health. From these interviews, we gathered ideas about the current
challenges facing green building and what future programs the Green Building Workgroup is
implementing.
33 | P a g e
We also interviewed Dr. Audrey Levine, the national director of the Drinking Water
Research Program of the Office of Research and Development (ORD). She provided significant input
on water infrastructure and how green building fits into the bigger picture. From this interview, we
learned EPA’s current direction on drinking water quality, water reuse, and water infrastructure.
Lastly, we interviewed with Ms. Stephanie Tanner of the WaterSense program, which is
within EPA’s Office of Water. This program focuses on the development and support of water
efficient products that can be implemented within commercial and residential buildings to decrease
their water usage. From this interview, we sought to identify any research needs for water
efficiency in building and the impacts of green building on the larger water infrastructure.
3.2.2 Other organizations’ green building research
Since the EPA’s research strategy is from a regulation perspective, we also gathered
feedback and opinions from other organizations to gain a broader perspective on green building
strategies.
The U.S. Green Building Council (USGBC) is the organization that provides LEED
certification for green buildings around the nation. We again interviewed with Mr. Ken Sandler of
the Research Committee at the USGBC to discuss their future strategy. The planned improvements
to the LEED rating system, as well as the current challenges facing green building research were our
desired topics. We inquired about any data or statistics regarding the 21,000 LEED green buildings
that the USGBC had certified. We also interviewed a Landscape Architect, Ms. Elizabeth Guthrie,
from the American Society of Landscape Architects (ASLA) to learn of the challenges faced with
designing green roofs, water retention and recycling systems.
We also visited several green buildings and green roofs to examine the technology
implemented and to identify potential post occupancy problems of green building. We went to
34 | P a g e
Sidwell Friends Middle School, a school in the DC area that received Platinum LEED certification for
their building. This was achieved as a result of the building’s 93% water efficiency with wastewater
recycling using a constructed wetland. At this site we concentrated on finding out if the buildings
performance was being maintained after certification. Another green building we visited is the
headquarter office of the USGBC, which also received Platinum LEED certification for their
efficiency and environmental friendly material usage. We visited the green roof at ASLA’s main
office, where we concentrated on discovering any challenges in maintaining the roof, the benefits
reaped, as well as any plans they had for implementing their green roof technology on a larger
scale.
3.3 Identify Research Gaps
After collecting sufficient information on all the existing research pertaining to green
building we began to visually organize it to allow for interpretation. All the aforementioned data
collected, as described in section 3.1, was used to create charts and graphs to facilitate
comparisons. We also conducted interviews with NCER employees, including Ms. Diana Bauer and
Ms. April Richards, to obtain their opinions and feedback on the gaps we had identified.
3.3.1 Interpreting Past Research
Using the categories outlined in Table 3-1, we were able to analyze the 95 projects using
different approaches. We looked at the funding trends by amount of dollars and in number of
projects of different grant program in NCER. The programs that we included are CNS, P3, SBIR, and
Fellowship. The rest of the projects that did not belong to any of these 4 programs were considered
Other. We also looked at the funding trends of green building research from 1995 to present. From
the trend we identified the programs that contributed most to green building research in order to
better address our final recommendation. We also were able to identify the trend of green building
research at NCER and project future research expectation. In order to identify research gaps, we
35 | P a g e
plotted chart in the 3 dimensions categories that we mentioned in section 3.1. From the categories
chart, we identified areas that had received insufficient funding. These data can be used by NCER in
the as a reference of how they funded in green building related technologies.
3.3.2 NCER Interviews
To ensure the accuracy of our findings, we interviewed NCER employees from different
programs. The purpose of these interviews was aimed at achieving agreement between their
perspective and our identified gaps. We performed content analysis on the interview transcripts to
identify the common gaps among the different interviewees. Using this analysis, we identified
which gaps were most critical. We talked with Dr. Diana Bauer, the director of CNS program at
NCER to discuss about the CNS projects. We also talked with Ms. April Richards about SBIR projects
and its direction toward green building. For P3, we spoke with Ms. Cynthia Nolt Helm to gain a
better understanding of the program.
Once we identified the gaps in research, we performed further background studies to
strengthen our understanding in these areas. We performed studies on topics including water reuse
and green roofs, which are technologies that we identified as receiving inadequate funding. We
focused on the amount of research performed on these technologies to determine whether it was
sufficient or required more attention. This helped us determine the impacts of each gap to have an
appropriate evaluation before giving our final recommendations.
3.4 Determine focus areas
After identifying the research gaps, we determined which ones were research priorities for
the EPA. We studied the mission statement and statutory regulations of NCER and the EPA, and the
green building strategies of the various offices to determine which areas would be most
appropriate for the EPA. We also studied the budgetary constraints of green building research and
36 | P a g e
considered the cost of future research. We formed a list of research priorities that will serve as
guidelines for the EPA in the future.
The main method for this objective was interviews. We interviewed employees within
NCER as well as other EPA offices to gather their feedback on our priorities list. We returned to
NCER director William Sanders. He provided feedback regarding the feasibility of the NCER
providing research according to our recommendations. We sought to gain further insight into the
constraints of the EPA regarding budget and human resources. We also interviewed Dr. Bauer and
Mr. Gentry again because they were drafting the green building research strategy for the EPA. The
interviews served to check if our recommendations fit in the mission and future direction of the
EPA.
Ultimately, our methods sought to form effective recommendations for the NCER and the
EPA. We aimed at maximizing research returns while considering their strategic goals regarding
green building technologies. We tried to reduce bias and provide recommendations that would
focus future research on improving green building technologies that would further reduce the
negative impacts on the environment and human health.
37 | P a g e
4 Results and Analysis
To accomplish our goal of providing NCER with the most beneficial research
recommendations, we utilized resources from both within and outside the agency to identify the
existing gaps. Our results were obtained by accomplishing the following objectives:
Identify and categorize all current and past research sponsored by NCER related to
green buildings.
Identify current and past green building research sponsored outside NCER, including
sources within and outside of EPA.
Identify the gaps in green building research and technologies with a focus on water
infrastructure.
Determine the EPA’s budget and regulatory constraints to carry out research and
provide appropriate recommendations.
By identifying and then categorizing 95 projects relevant to green building we discovered
NCER’s most prominent gaps in research are water reuse, water infrastructure, stormwater
management practices, and the residential market. With the input of principle investigators and
opinions from other offices within the EPA, we were further able to support our previously
identified gaps. From our analysis of outside sources we concluded that an essential component to
future research projects must be social acceptance. From our research studies and expert
interviews we identified the best course for future research to follow. Analysis of these future
research topics led us to develop two sets of recommendations for the NCER.
4.1 NCER Green Building Funded Research
We looked at each of the 5547 projects that the NCER has funded since 1995. After filtering
out all the projects that did not deal with green building or related technologies, we were left with
95 different projects. To further compare and analyze these projects, we divided them into a set of
38 | P a g e
categories addressing 3 different dimensions: scale, media, and approach. The list of categories can
be found in Table 4-1. A detailed categorized list of the projects can be found in Appendix F.
Since there is no designated green building strategic agenda at NCER, many of the 95
projects that we chose to analyze do not deal directly with green building. However we included
those projects if they focused on technologies that could potentially be implemented in a green
building. Therefore, for some projects, the choice of whether or not to include them was ambiguous.
The factor that influenced our decision was the level of practicality in implementing the research
result. For example, the SBIR project “Stormwater Flow Control Device” dealt with creating a tool to
measure and control the flow of stormwater. This project is explicitly related to water
infrastructure, but not necessarily to green building. However, we included these types of projects
in our green building project list because they could realistically become viable devices for use in
green buildings in the future. The deciding criterion was that the projects are relevant to green
building only if the method is currently used or being considered in the design of the building.
Otherwise, we considered the project in its current state to be too distant from green building to be
relevant.
The green building project list we chose has 95 projects, which made up less than 2% of the
total number of projects funded by NCER since 1995. The grants to all 95 green building projects
totaled $7.4 million, which is less than 1% of the NCER’s overall funding in all areas. This small
proportion of funded grants, both in term of dollars and number, are understandable because green
building is a relatively new topic with no overall strategic direction. The projects’ research areas
are diversely distributed among different grant programs sponsored by NCER, which include P3,
SBIR and CNS programs (for the detailed descriptions of each program, see to Appendix B).
We analyzed each program, P3, SBIR and CNS individually as each has its own goals and
grantees. We did not consider NCER’s other funded programs such as Fellowships, Technology for
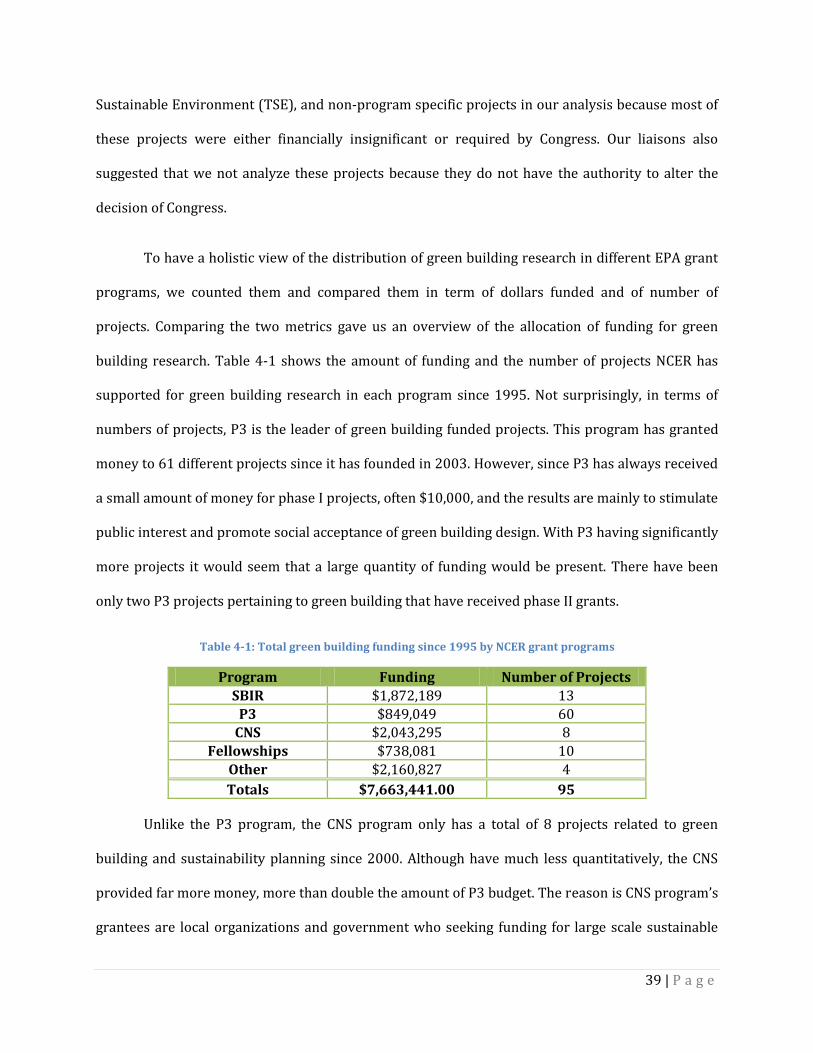
39 | P a g e
Sustainable Environment (TSE), and non‐program specific projects in our analysis because most of
these projects were either financially insignificant or required by Congress. Our liaisons also
suggested that we not analyze these projects because they do not have the authority to alter the
decision of Congress.
To have a holistic view of the distribution of green building research in different EPA grant
programs, we counted them and compared them in term of dollars funded and of number of
projects. Comparing the two metrics gave us an overview of the allocation of funding for green
building research. Table 4-1 shows the amount of funding and the number of projects NCER has
supported for green building research in each program since 1995. Not surprisingly, in terms of
numbers of projects, P3 is the leader of green building funded projects. This program has granted
money to 61 different projects since it has founded in 2003. However, since P3 has always received
a small amount of money for phase I projects, often $10,000, and the results are mainly to stimulate
public interest and promote social acceptance of green building design. With P3 having significantly
more projects it would seem that a large quantity of funding would be present. There have been
only two P3 projects pertaining to green building that have received phase II grants.
Table 4-1: Total green building funding since 1995 by NCER grant programs
Program Funding Number of Projects
SBIR $1,872,189 13
P3 $849,049 60 CNS $2,043,295 8
Fellowships $738,081 10
Other $2,160,827 4
Totals $7,663,441.00 95
Unlike the P3 program, the CNS program only has a total of 8 projects related to green
building and sustainability planning since 2000. Although have much less quantitatively, the CNS
provided far more money, more than double the amount of P3 budget. The reason is CNS program’s
grantees are local organizations and government who seeking funding for large scale sustainable

40 | P a g e
planning. These projects often are very costly due to the scalability of the data and methods. SBIR
had 13 related projects. SBIR concentrates mainly on the development of a product or a tool to help
sustainable design.
There were also 4 projects that were placed into the “Other” category, as shown in Table
4-1. These projects account for $2.1 million of research funding. However, included in this category
are federally mandated project. While these projects focus on relevant topics, we will not provide
the same level of depth of analysis for them. Neither NCER nor the EPA can change the research
direction or the size of the grants for any future projects. As our goal is to identify the future
directions of green building research, we only provide an overview analysis.
To further analyze the fiscal breakdown we graphed what percent of the total funding each
grant program encompasses. This breakdown further shows that the P3 program is the smallest in
terms of financial awards, making up approximately 11% of the total funding by NCER. The CNS and
SBIR programs are found to be similar in size in terms of the number of dollars. Figure 4-1 also
shows that the “Other” category is similar in size to both the CNS and SBIR.
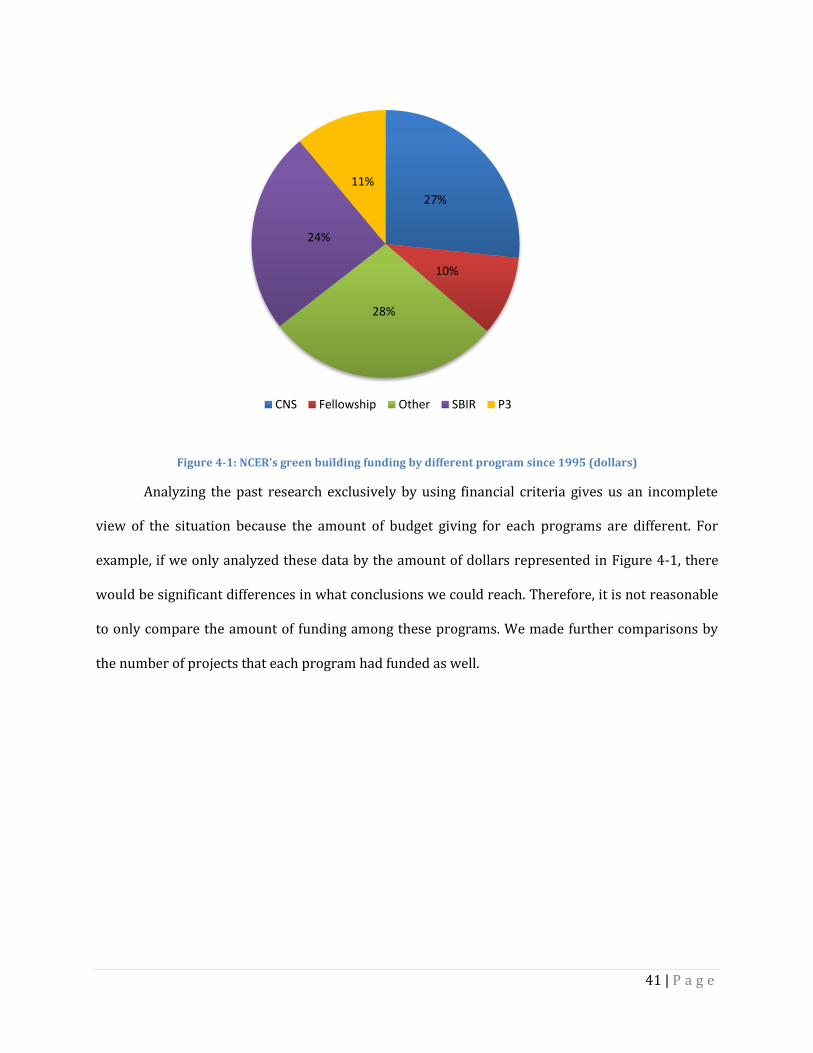
41 | P a g e
Figure 4-1: NCER’s green building funding by different program since 1995 (dollars)
Analyzing the past research exclusively by using financial criteria gives us an incomplete
view of the situation because the amount of budget giving for each programs are different. For
example, if we only analyzed these data by the amount of dollars represented in Figure 4-1, there
would be significant differences in what conclusions we could reach. Therefore, it is not reasonable
to only compare the amount of funding among these programs. We made further comparisons by
the number of projects that each program had funded as well.
27%
10%
28%
24%
11%
CNS Fellowship Other SBIR P3
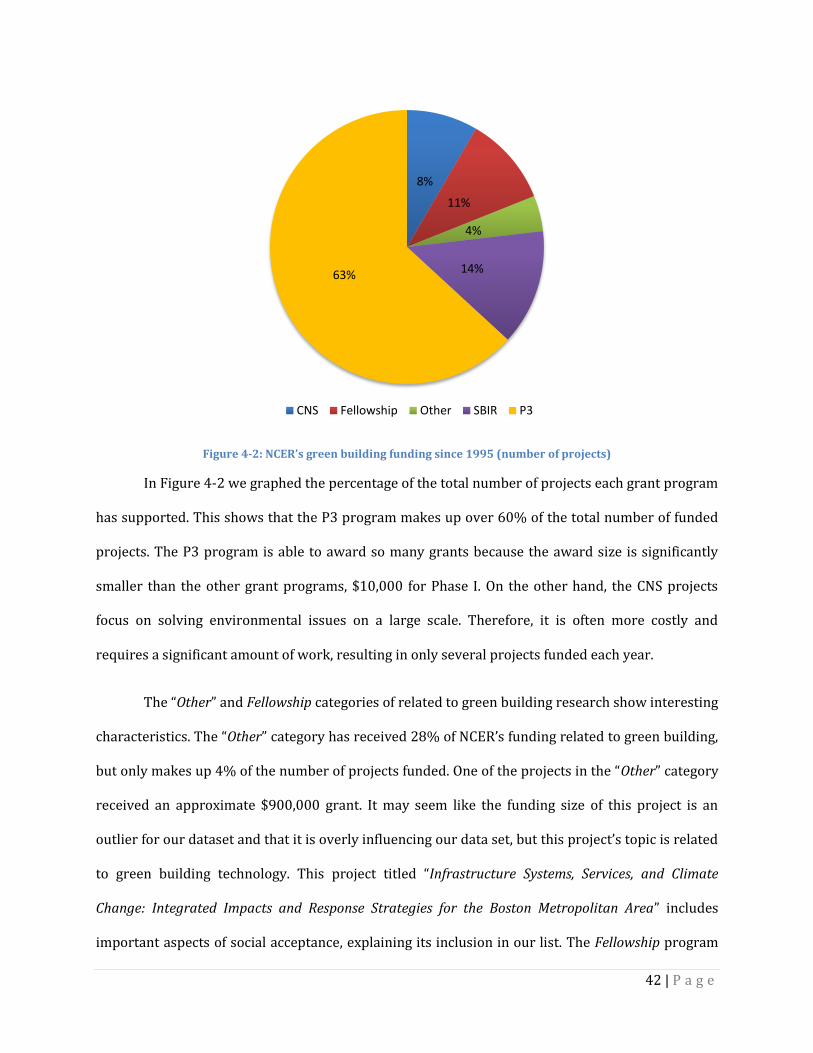
42 | P a g e
Figure 4-2: NCER’s green building funding since 1995 (number of projects)
In Figure 4-2 we graphed the percentage of the total number of projects each grant program
has supported. This shows that the P3 program makes up over 60% of the total number of funded
projects. The P3 program is able to award so many grants because the award size is significantly
smaller than the other grant programs, $10,000 for Phase I. On the other hand, the CNS projects
focus on solving environmental issues on a large scale. Therefore, it is often more costly and
requires a significant amount of work, resulting in only several projects funded each year.
The “Other” and Fellowship categories of related to green building research show interesting
characteristics. The “Other” category has received 28% of NCER’s funding related to green building,
but only makes up 4% of the number of projects funded. One of the projects in the “Other” category
received an approximate $900,000 grant. It may seem like the funding size of this project is an
outlier for our dataset and that it is overly influencing our data set, but this project’s topic is related
to green building technology. This project titled “Infrastructure Systems, Services, and Climate
Change: Integrated Impacts and Response Strategies for the Boston Metropolitan Area” includes
important aspects of social acceptance, explaining its inclusion in our list. The Fellowship program
8%
11%
4%
14%63%
CNS Fellowship Other SBIR P3
43 | P a g e
encompasses only 11% of the projects and 10% of the funding. These grants go towards graduated
students typically working on environmental research or sustainability.
When analyzing these data it is important to remember that each of these grant programs
typically award grants of a similar size every year. Therefore, it is essential not to draw conclusions
on which program has had more success with green building and related research solely by
considering these data.
4.1.1 Green Building Research Trends
The past research funded by NCER concerning green building and related technologies
began in 1995 with the reorganization of the Office of Research and Development (ORD). To
understand funding trends over time our list of 95 projects had to be organized by the year funded
and the program that received the funding. Once again we analyzed the data both by the number of
projects and the size of the awards.
Before we provide analysis of these research trends, it is important to note how the data
were interpreted. Many of the projects funded by NCER are sponsored for 2 to 3 years, particularly
in the SBIR and CNS programs. We wanted to know the value of how much yearly funding is
awarded by NCER towards green building research. Therefore Figure 4-3, which shows the funding
trends of each program over time, was developed by dividing a project’s total funding by the
number of years the project was carried out. To eliminate confusion for Figure 4-4, which shows
the number of projects sponsored per year, each project is counted only in the year it was first
funded. For example, if a two year project was awarded $100,000 in the year 2000 our chart would
show that the project was done in 2000, but the funding was distributed as $50,000 in both 2000
and 2001.
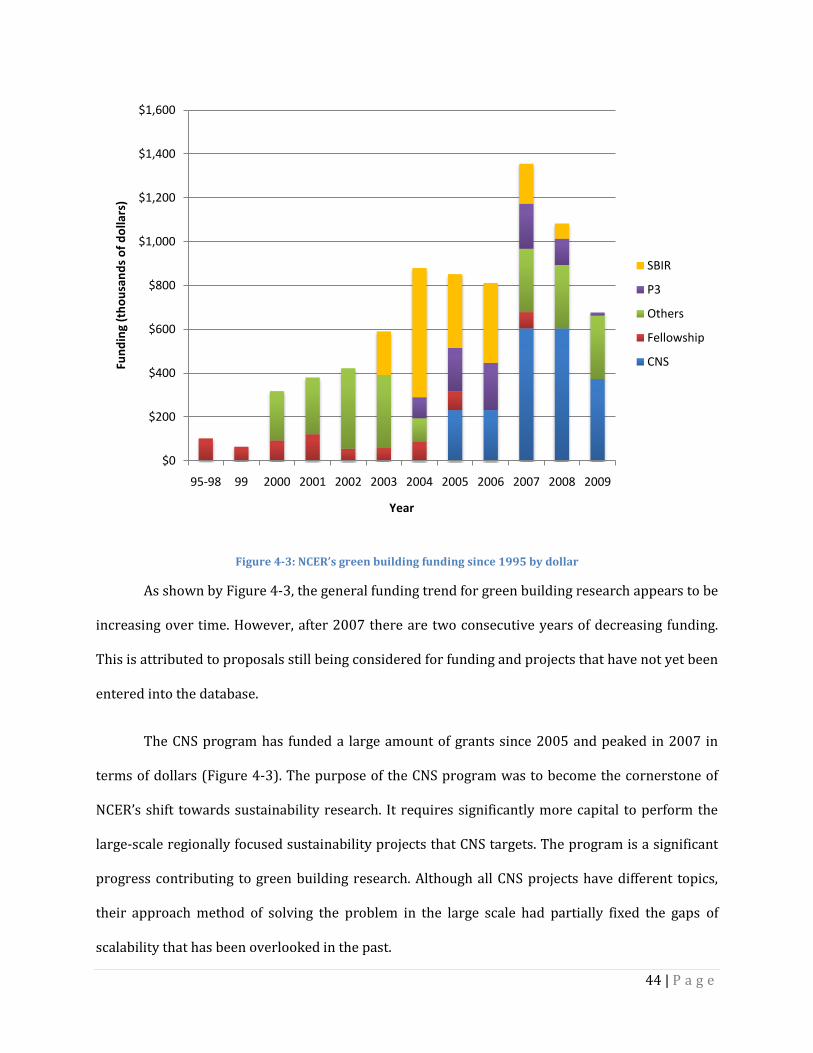
44 | P a g e
Figure 4-3: NCER’s green building funding since 1995 by dollar
As shown by Figure 4-3, the general funding trend for green building research appears to be
increasing over time. However, after 2007 there are two consecutive years of decreasing funding.
This is attributed to proposals still being considered for funding and projects that have not yet been
entered into the database.
The CNS program has funded a large amount of grants since 2005 and peaked in 2007 in
terms of dollars (Figure 4-3). The purpose of the CNS program was to become the cornerstone of
NCER’s shift towards sustainability research. It requires significantly more capital to perform the
large-scale regionally focused sustainability projects that CNS targets. The program is a significant
progress contributing to green building research. Although all CNS projects have different topics,
their approach method of solving the problem in the large scale had partially fixed the gaps of
scalability that has been overlooked in the past.
$0
$200
$400
$600
$800
$1,000
$1,200
$1,400
$1,600
95-98 99 2000 2001 2002 2003 2004 2005 2006 2007 2008 2009
Fun
din
g (t
ho
usa
nd
s o
f d
olla
rs)
Year
SBIR
P3
Others
Fellowship
CNS
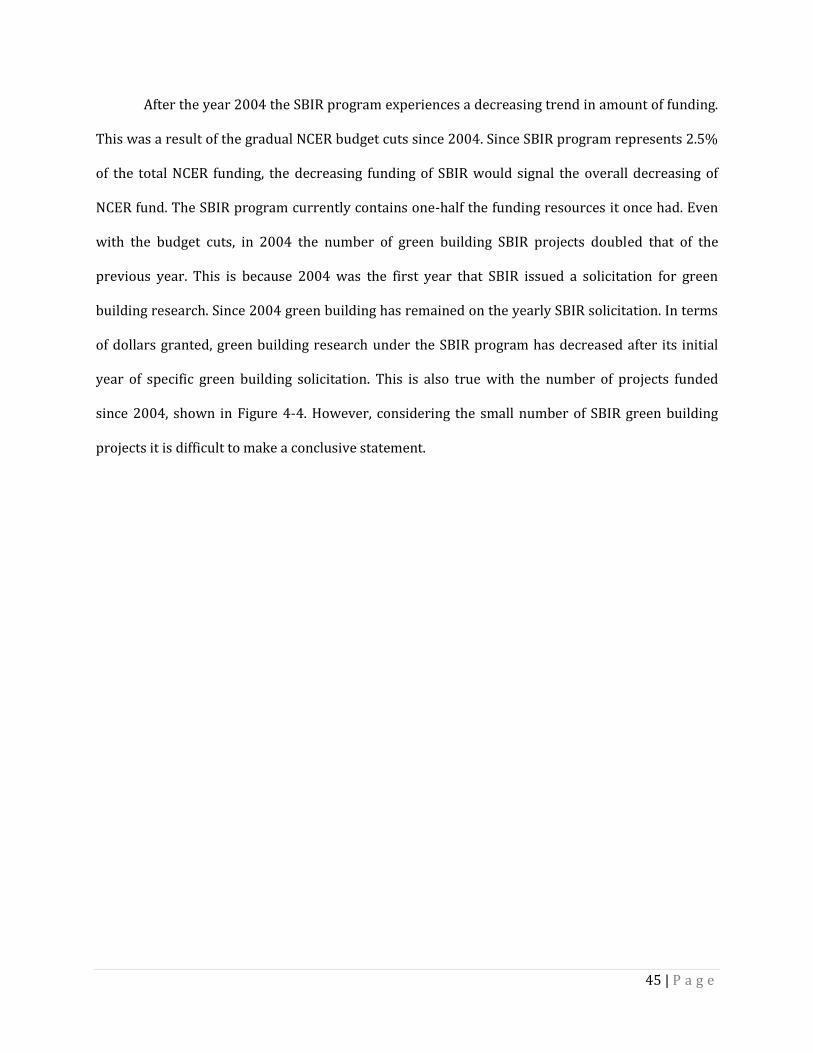
45 | P a g e
After the year 2004 the SBIR program experiences a decreasing trend in amount of funding.
This was a result of the gradual NCER budget cuts since 2004. Since SBIR program represents 2.5%
of the total NCER funding, the decreasing funding of SBIR would signal the overall decreasing of
NCER fund. The SBIR program currently contains one-half the funding resources it once had. Even
with the budget cuts, in 2004 the number of green building SBIR projects doubled that of the
previous year. This is because 2004 was the first year that SBIR issued a solicitation for green
building research. Since 2004 green building has remained on the yearly SBIR solicitation. In terms
of dollars granted, green building research under the SBIR program has decreased after its initial
year of specific green building solicitation. This is also true with the number of projects funded
since 2004, shown in Figure 4-4. However, considering the small number of SBIR green building
projects it is difficult to make a conclusive statement.
46 | P a g e
Figure 4-4: NCER’s green building funding since 1995 by number of projects
From 2003 to 2004, there is a sudden jump in the number of green building research
projects, which is clearly depicted in Figure 4-4. This is largely attributed to the start of the P3
program and the EPA beginning to encourage green building research. Since founding in 2004, the
P3 program consistently has had the most relevant projects, but conversely the smallest budget.
Between SBIR and CNS, the minimum grant is $70,000 dollars. Therefore, P3 can support a large
number of institutions and colleges. This gives P3 the advantage of being able to cover a wider
range of topics. Solicitations for the P3 program are far broader in scope than those of CNS or SBIR.
This opens the applicant field to far more researchers than the other programs. In addition, the
smaller grant size may be more feasible for many projects. On the other hand, the result quality and
credibility will not be as accurate as those with larger grant. For all projects, P3 comprises all
different aspects of green building including water efficiency, water reuse, stormwater
0
5
10
15
20
25
95-98 99 2000 2001 2002 2003 2004 2005 2006 2007 2008 2009
Nu
mb
er
of
Pro
ject
s
Year
SBIR
P3
Others
Fellowship
CNS
47 | P a g e
management, and social acceptance. However, the disadvantage of the P3 program is often the
scale. Due to the program being an undergraduate competition with comparatively small funding,
the depth and extent of research results are limited. We provide a more in-depth analysis of scale
can be found in the next section 4.1.2, the categorical analysis.
Although the P3 program contributes a large number of projects related to green building,
this number is relatively stagnant at an average of 10 projects and $200,000 per year. Each year,
there is one P3 project receiving Phase II award of $75,000, which explains why the amount
number $200,000 not corresponding with the average 10 projects. This shows that although there
was a shift of interest to green building in 2003 when the P3 program was created, the overall
interest remains the same. It is important to note that due to confidentiality we do not know the
number of green building project proposals submitted annually to P3, or to any other program at
NCER. The possibility exists that the number of green building project proposals is increasing, but
they do not receive funding.
It is also important to consider that green building is such a new research area. Therefore,
many of the NCER funding programs do not have a significant number of related projects. As we
mentioned earlier, green building research only receives less than 2% of total NCER funding. As a
result, we have a small data base of projects from which to draw our conclusions. Particularly with
the SBIR and CNS programs this could result in interpretations of data that are not actually
significant. Therefore, it is important to refrain from making final recommendations off just this
analysis alone.
4.1.2 Categorical Analysis
To further pinpoint the past and present areas of research that NCER has funded, we
analyzed the 95 projects based on their categories. This allowed us to make specific observations
about which areas of research, particularly water infrastructure, had previously been funded. Once
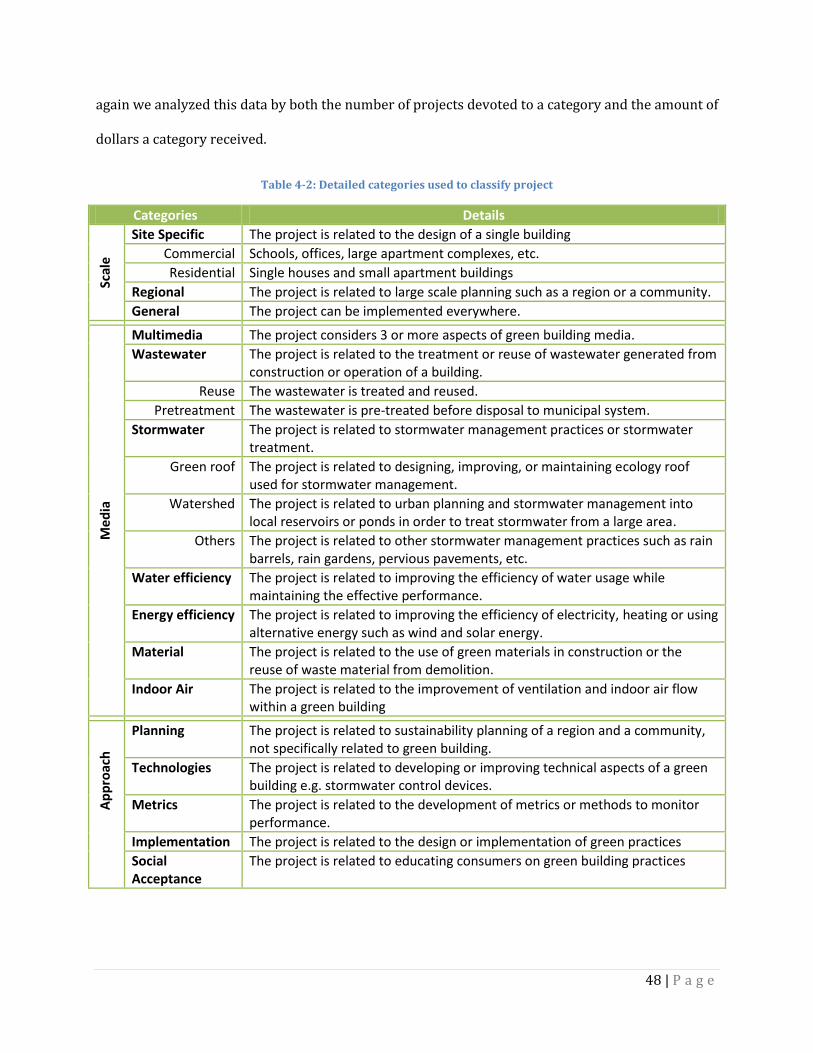
48 | P a g e
again we analyzed this data by both the number of projects devoted to a category and the amount of
dollars a category received.
Table 4-2: Detailed categories used to classify project
Categories Details
Scal
e
Site Specific The project is related to the design of a single building
Commercial Schools, offices, large apartment complexes, etc.
Residential Single houses and small apartment buildings
Regional The project is related to large scale planning such as a region or a community.
General The project can be implemented everywhere.
Me
dia
Multimedia The project considers 3 or more aspects of green building media.
Wastewater The project is related to the treatment or reuse of wastewater generated from construction or operation of a building.
Reuse The wastewater is treated and reused.
Pretreatment The wastewater is pre-treated before disposal to municipal system.
Stormwater The project is related to stormwater management practices or stormwater treatment.
Green roof The project is related to designing, improving, or maintaining ecology roof used for stormwater management.
Watershed The project is related to urban planning and stormwater management into local reservoirs or ponds in order to treat stormwater from a large area.
Others The project is related to other stormwater management practices such as rain barrels, rain gardens, pervious pavements, etc.
Water efficiency The project is related to improving the efficiency of water usage while maintaining the effective performance.
Energy efficiency The project is related to improving the efficiency of electricity, heating or using alternative energy such as wind and solar energy.
Material The project is related to the use of green materials in construction or the reuse of waste material from demolition.
Indoor Air The project is related to the improvement of ventilation and indoor air flow within a green building
Ap
pro
ach
Planning The project is related to sustainability planning of a region and a community, not specifically related to green building.
Technologies The project is related to developing or improving technical aspects of a green building e.g. stormwater control devices.
Metrics The project is related to the development of metrics or methods to monitor performance.
Implementation The project is related to the design or implementation of green practices
Social Acceptance
The project is related to educating consumers on green building practices
49 | P a g e
As was mentioned briefly in the previous section, our list of categories is based on three
dimensions. We designed our categories to allow every project to fit into each of the three
dimensions. This allowed us to draw comparisons between the projects. The first dimension is
Scale. Scale is simply a way to determine if a project was focused on a Specific Building or a Region.
It also allowed us to identify if the project dealt with either Residential or Commercial sectors. We
wanted to compare between residential and commercial green building research because the
technologies used are significantly different in terms of size, cost, and usability. Another category in
this dimension that we created is General. If a project is simply a technology that does not have a
limitation on size of implementation and can be used in different types of building then it will be
placed into this General category.
Our second dimension is Media. Media refers to the research field of green technology. Being
that the focus of our project is on water infrastructure, we created more detailed categories for
Wastewater and Stormwater. For Stormwater category, we elected to create common subcategories
including Green roofs, Watersheds, and Other Stormwater Methods. The subcategory Other
Stormwater Methods refers to such devices as rain gardens and rain barrels. Adding to our water
infrastructure focus, we also classified projects that fell into non-water related categories. These
categories include Energy, Indoor air, and Materials. We wanted to get a broad understanding of all
green building research areas NCER has funded. Since some projects deal with the construction of
an entire green building and may consider many, if not all, aspects of green technology, we placed
them into the Multimedia category.
The final dimension that a project must be placed into is Approach. Approach refers to how a
project contributes to the advancement of green building. This dimension is split into two
subdivisions. The categories Technologies, Performance metrics, and Planning are grouped together
in one subdivision, which means that every project must be placed into one of those three
50 | P a g e
categories. Technology projects deal specifically with the development of a green device that is
designed for, or could be used in, a green building. Performance metrics refers to projects that deal
with the development of methods to rate or evaluate buildings. The final category, Planning, refers
to projects devoted to planning of green communities or finding long term solutions to reduce
environmental impacts.
The other subdivision of the Approach dimension is used to categorize projects into either
Implementation or Social Acceptance. Projects that fall into the Implementation category have the
end goal of creating a tangible object, such as a green building or a measuring device. Contrary to
Implementation projects, Social Acceptance projects deal with improving the social acceptance of
green building such as projects that increase social awareness of ways to increase water and energy
efficiency.
After developing our categories and placing each project into the 3 dimensions we were
able to graph the data to have a visual representation of the past research. As expected, Site Specific
research has received less attention compared with Regional and General categories, which is
displayed in Figure 4-5. The large number of projects in Regional is due to the CNS program, which
explained the progressive direction of NCER toward large scale planning. This agrees with the EPA’s
ultimate goal of having the largest and widest effect possible on the environment. This goal
coincides with many of the projects dealing with making large scale influences. An example of this is
the CNS project “Mapping Regional Development for Smart Growth Planning to Minimize
Degradation of Water Quality and Enhance Green Infrastructure”. This project is just one example of
EPA promoting regional green development, which was a primary focus of the CNS program.
Further analysis of individual projects and programs will be discussed in more detail in the
following sections.
51 | P a g e
General research, which can be applied to any building, has also received significant
attention. This shows that past research of NCER has not focused on the climatic and regional
difference between areas in the US. We knew that technology such as green roof changes
significantly between areas, especially in the U.S. where there are many different complex weather
areas that needs more research to adapt current technologies into these regions.
The General and Regional categories combined show that many of the previous NCER
sponsored projects focus on large scale green building development. Although a large amount of
money has been put to sustainability design on a large scale, mostly from CNS programs, the
research focused on the sustainable design of public places such as parking lots and streets, there is
little research studying the combining impacts of buildings on the water infrastructures and the
environment. We know that one building can have significant impacts on water infrastructure. A
group of buildings have much bigger impacts which it often harder and more expensive to measure
and to control these impacts. This leaves Site Specific research needing more focus.
Figure 4-5: NCER’s green building funding in scale dimension
$0 $2,000 $4,000
Site Specific
Commercial
Residential
Regional
General
$1,363
$1,219
$145
$3,644
$2,372
Funding (in thousands dollars)
0 10 20 30 40
Site Specific
Commercial
Residential
Regional
General
26
17
9
30
39
Number of Projects
52 | P a g e
Figure 4-6: NCER green building funding in media dimension
One of the first observations of this data is the limited research devoted to Wastewater.
There are only 7 projects dealing with wastewater with a total funding of $758,000. This important
area of research encompasses both Reuse, and Pretreatment categories. As shown by Figure 4-6
Reuse is the subject of only 2 projects. To emphasize how limited the research in this area has been,
it is essential to note that Reuse includes both grey and black water. Of this limited research, NCER
has focused predominately on grey water, leaving black water with even less attention. The depth
of research and technology requirements needed to manage each of these types of water future
attention.
Water efficiency is an area that NCER has only given $85,000 towards 2 projects. At first
glance, this seems like an alarming statistic, due to expectations of significant funding. However, as
0 10 20 30
Multimedia
Wastewater
Reuse
Pretreatment
Stormwater
Greenroof
Watershed
Others
Water Efficiency
Energy Efficiency
Material
Indoor Air
18
7
2
5
27
6
4
17
2
20
11
2
Number of Projects
$0 $500 $1,000 $1,500 $2,000
Multimedia
Wastewater
Reuse
Pretreatment
Stormwater
Greenroof
Watershed
Others
Water Efficiency
Energy Efficiency
Material
Indoor Air
$1,653
$758
$330
$428
$1,695
$119
$401
$1,175
$85
$564
$1,111
$80
Funding (in thousands dollars)
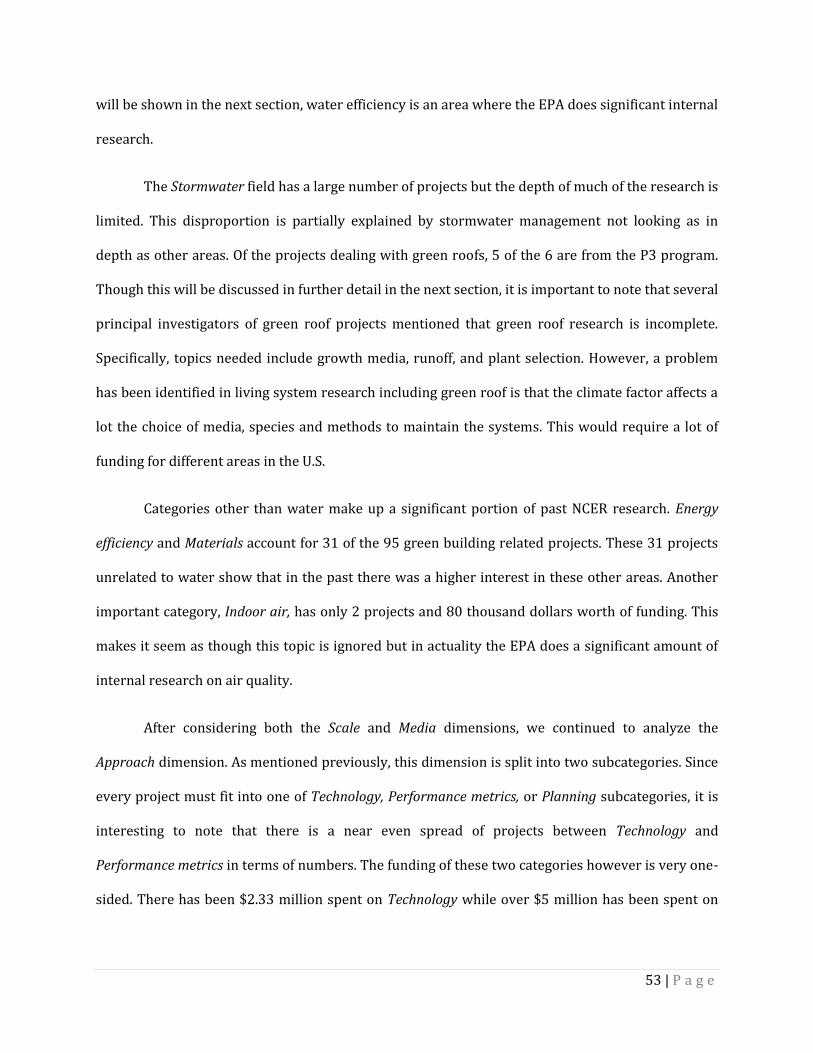
53 | P a g e
will be shown in the next section, water efficiency is an area where the EPA does significant internal
research.
The Stormwater field has a large number of projects but the depth of much of the research is
limited. This disproportion is partially explained by stormwater management not looking as in
depth as other areas. Of the projects dealing with green roofs, 5 of the 6 are from the P3 program.
Though this will be discussed in further detail in the next section, it is important to note that several
principal investigators of green roof projects mentioned that green roof research is incomplete.
Specifically, topics needed include growth media, runoff, and plant selection. However, a problem
has been identified in living system research including green roof is that the climate factor affects a
lot the choice of media, species and methods to maintain the systems. This would require a lot of
funding for different areas in the U.S.
Categories other than water make up a significant portion of past NCER research. Energy
efficiency and Materials account for 31 of the 95 green building related projects. These 31 projects
unrelated to water show that in the past there was a higher interest in these other areas. Another
important category, Indoor air, has only 2 projects and 80 thousand dollars worth of funding. This
makes it seem as though this topic is ignored but in actuality the EPA does a significant amount of
internal research on air quality.
After considering both the Scale and Media dimensions, we continued to analyze the
Approach dimension. As mentioned previously, this dimension is split into two subcategories. Since
every project must fit into one of Technology, Performance metrics, or Planning subcategories, it is
interesting to note that there is a near even spread of projects between Technology and
Performance metrics in terms of numbers. The funding of these two categories however is very one-
sided. There has been $2.33 million spent on Technology while over $5 million has been spent on
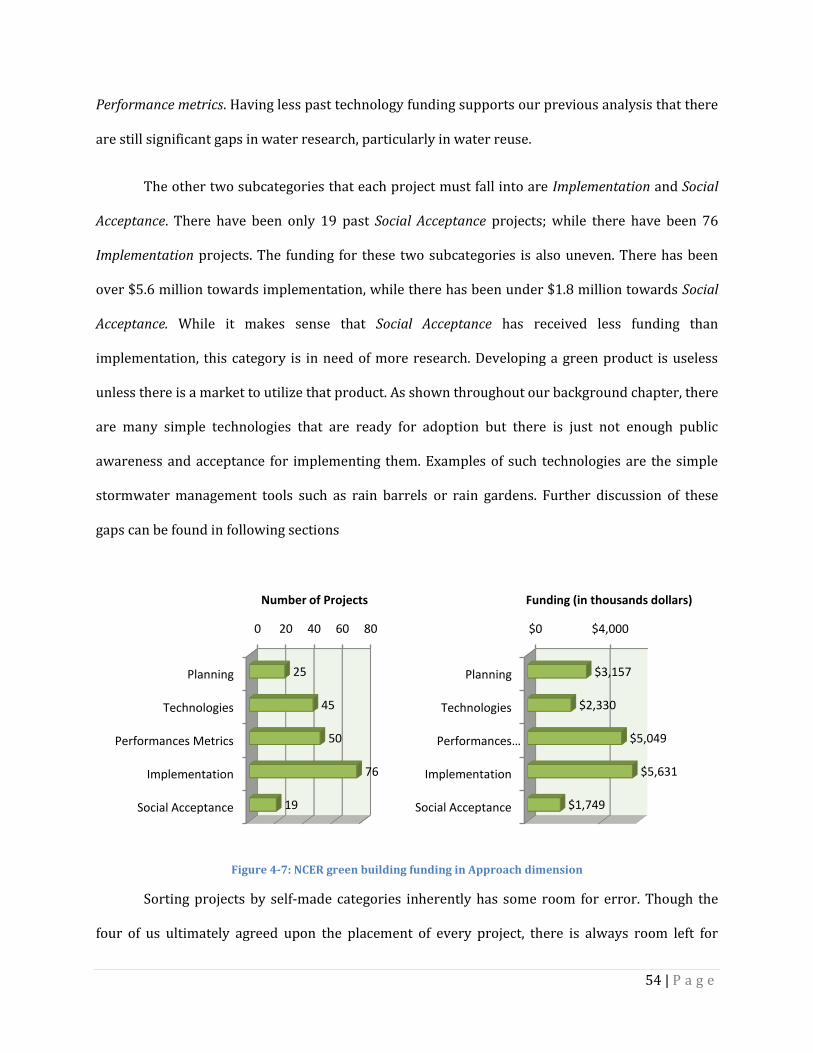
54 | P a g e
Performance metrics. Having less past technology funding supports our previous analysis that there
are still significant gaps in water research, particularly in water reuse.
The other two subcategories that each project must fall into are Implementation and Social
Acceptance. There have been only 19 past Social Acceptance projects; while there have been 76
Implementation projects. The funding for these two subcategories is also uneven. There has been
over $5.6 million towards implementation, while there has been under $1.8 million towards Social
Acceptance. While it makes sense that Social Acceptance has received less funding than
implementation, this category is in need of more research. Developing a green product is useless
unless there is a market to utilize that product. As shown throughout our background chapter, there
are many simple technologies that are ready for adoption but there is just not enough public
awareness and acceptance for implementing them. Examples of such technologies are the simple
stormwater management tools such as rain barrels or rain gardens. Further discussion of these
gaps can be found in following sections
Figure 4-7: NCER green building funding in Approach dimension
Sorting projects by self-made categories inherently has some room for error. Though the
four of us ultimately agreed upon the placement of every project, there is always room left for
0 20 40 60 80
Planning
Technologies
Performances Metrics
Implementation
Social Acceptance
25
45
50
76
19
Number of Projects
$0 $4,000
Planning
Technologies
Performances …
Implementation
Social Acceptance
$3,157
$2,330
$5,049
$5,631
$1,749
Funding (in thousands dollars)
55 | P a g e
personal interpretation. Another limitation was that since the number of green building projects is
relatively small, 95, it is more accurate to say that all areas will need to receive more funding.
However, we represent these data in categories to see the distribution and direction of NCER in
order to further recommend new priorities to address the green building research gaps better.
Figure 4-8: EPA Green Building Research Funding by Topic from 2002 to 2006
Compared with the overall EPA’s green building research from a study of the USGBC in
2006, the categories of Water Efficiency and Indoor Air has been focused by other offices in the EPA.
It made sense that this was not an agenda in NCER.
$510
$940
$650
$310
$1,270
$2,050
$7,840
$1,130
$700
$50
$30
$5,780
$140
$53,490
$3,040
0 10000 20000 30000 40000 50000 60000
Develop codes, standards & metrics
Development of resources and curricular
Economic research
General green building issues
Stormwater management
Other site issues
Water efficiency
Energy efficiency
Renewable energy
Commissioning and M&V
Other atmosphere issues
Building materials
Resource efficiency
Air quality & related health productivity issues
Other IEQ health/productivity issues
Thousands of Dollars
56 | P a g e
4.1.3 Project Investigator Interviews
After having categorized the 95 NCER sponsored projects, we selected approximately 20
that gave us a range of green building technologies to further analyze. We selected projects that
dealt with topics such as green roofs, green stormwater materials, and social acceptance. These
projects were selected from the 3 main NCER project programs, P3, SBIR, and CNS. However, of the
20 Project Investigators contacted for an interview, only PIs of 10 projects were successfully
contacted. This list of 10 projects can be found in Appendix F. Once contacted, we were able to
interview with 11 PIs of 10 projects on their opinions of what areas in green building and water
infrastructure research require more research.
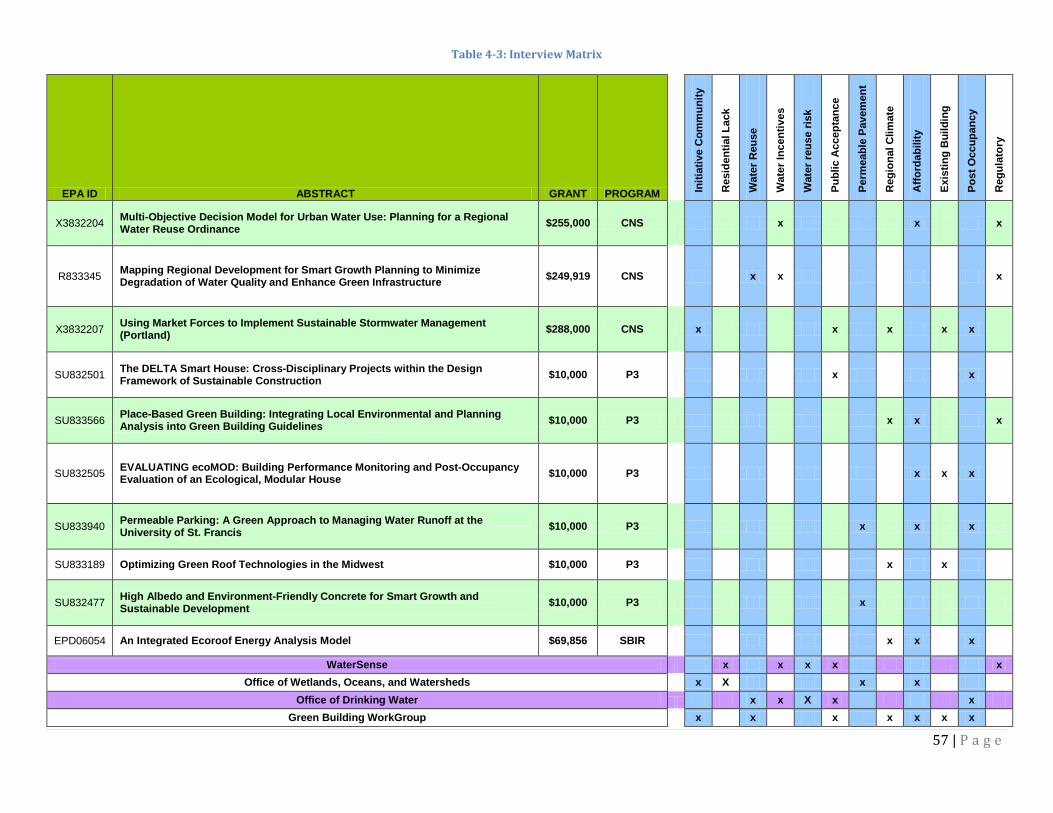
57 | P a g e
Table 4-3: Interview Matrix
EPA ID ABSTRACT GRANT PROGRAM Init
iati
ve C
om
mu
nit
y
Resid
en
tial L
ack
Wate
r R
eu
se
Wate
r In
cen
tives
Wate
r re
us
e r
isk
Pu
bli
c A
ccep
tan
ce
Perm
eab
le P
avem
en
t
Reg
ion
al C
lim
ate
Aff
ord
ab
ilit
y
Exis
tin
g B
uil
din
g
Po
st
Occu
pa
ncy
Reg
ula
tory
X3832204 Multi-Objective Decision Model for Urban Water Use: Planning for a Regional Water Reuse Ordinance
$255,000 CNS x x x
R833345 Mapping Regional Development for Smart Growth Planning to Minimize Degradation of Water Quality and Enhance Green Infrastructure
$249,919 CNS x x x
X3832207 Using Market Forces to Implement Sustainable Stormwater Management (Portland)
$288,000 CNS x x x x x
SU832501 The DELTA Smart House: Cross-Disciplinary Projects within the Design Framework of Sustainable Construction
$10,000 P3
x x
SU833566 Place-Based Green Building: Integrating Local Environmental and Planning Analysis into Green Building Guidelines
$10,000 P3 x x x
SU832505 EVALUATING ecoMOD: Building Performance Monitoring and Post-Occupancy Evaluation of an Ecological, Modular House
$10,000 P3 x x x
SU833940 Permeable Parking: A Green Approach to Managing Water Runoff at the University of St. Francis
$10,000 P3 x x x
SU833189 Optimizing Green Roof Technologies in the Midwest $10,000 P3
x x
SU832477 High Albedo and Environment-Friendly Concrete for Smart Growth and Sustainable Development
$10,000 P3 x
EPD06054 An Integrated Ecoroof Energy Analysis Model $69,856 SBIR x x x
WaterSense x x x x x
Office of Wetlands, Oceans, and Watersheds x X x x
Office of Drinking Water x x X x x
Green Building WorkGroup
x x x x x x x
58 | P a g e
Each of the 11 PIs interviewed was asked the same 13 questions found in our interview
protocol (see Appendix E). However, not every one of the base 13 questions were relevant to each
project, so in some cases questions were omitted as necessary per interview. We were able to
perform a content analysis on the data and created a comparison matrix, as displayed by Table 4-3
above.
Stormwater management is an area that was consistently brought up during our PI
interviews due to its relevance not only to water infrastructure but also to some of the PIs’ projects.
Within stormwater management, interviewees focused on green roofs and green paving materials.
We interviewed the PIs of three different green roof projects, where each PI shared their ideas on
current research gaps. It was brought to our attention that all of the technical advances made in
Germany regarding green roofs can not be applied in the United States. Differences in climate, flora,
and soil are too great for German research to be of use in the United States. Another interesting
research area is how to adapt green roofs to buildings with pitched roofs. The majority of
residential homes feature this roof design; therefore if green roofs were to be considered for this
mass market, more research would need to be done to arrive at a suitable green roof design. There
are important considerations for a green-pitched roof, such as the potential for more nutrient
runoff, and other structural concerns.
Several PIs mentioned that green roofs have other equally beneficial characteristics in
addition to reducing stormwater runoff. Theoretically, green roofs significantly reduce the urban
heat island effect of a building and reduce the heating and cooling costs of the building. However,
there is not enough data to support to these theories. Although, the PIs have noticed these benefits
after implementing the green roofs, they believe more research would be necessary before
determining if the thermal benefits of green roofs are as significant as currently theorized. The PIs
59 | P a g e
also recommended further research into the life cycle of the green roofs as well as making them
more cost effective and easier to implement.
Besides green roofs, we interviewed two project PIs who did research on green materials.
One such ongoing project dealt with pervious paving. These porous materials they are researching
will allow liquid to flow through them into the ground below, therefore eliminating stormwater
runoff. More information is necessary in order to determine how effective the pervious pavements
would be in managing stormwater runoff. Other than pervious pavements, the albedo content of
pavements was an interest to one of the PIs. The project dealt with increasing the albedo (the
reflectivity of a surface) content in concrete and making it more environmentally friendly by adding
different levels of fly ash or slag to the concrete mixture. This is necessary due to the heat island
effect caused when the pavement absorbs solar energy, which increases the surrounding
temperature, decreasing air quality and posing a threat to human health. However, the government
has limits on the amount of fly ash/slag contained in concrete mixtures. Although this limit made
sense before, the PI was concerned that this limitation is not appropriate. More research into this
topic would give the government more information to make better policies.
Two of the PIs interviewed dealt with a building and its performance rather than specific
parts of the building like the roof or the surrounding areas like the pavement surfaces. From the
interviews, we learned that an important tool missing from the design and implementation of green
buildings and related technologies is a software tool that allows designers, architects, engineers, etc
to easily find the necessary information that would aid in designing green buildings. The
information could include different methods and technologies that others have used successfully,
which would increase awareness in the architectural community of different green building
technologies and methods.

60 | P a g e
While green buildings and green technologies are important, two of the PIs were concerned
with sustainable development. One of the projects was on mapping regional development. Due to
the increase in population, there is a lot of community growth and urban sprawl, some of which is
unplanned. The PI of this project raised the question of the hidden costs of development such as in
cases where urban sprawling alters natural water flow patterns and can lead to long-term costs for
the community.
One of the common complaints issued by the PIs is the lack of data on a green building’s
performance after construction. Currently, LEED does not require post-occupancy evaluations of
the buildings in order to receive certification, which means that there is not much of an incentive
for building owners to expend the effort and expenses for the evaluations, In order to convince the
public and the government the benefits of green building more data would have to be acquired on
the long-term performance. Another issue raised by the PIs is the lack of government guidelines in
certain green technology areas such as water reuse. With more data collected from research and
after implementation of these technologies, the government would be better equipped to make
policies that provide better guidelines on the implementation of the technology. At this time, water
reuse is governed in by each state’s government,, which makes regulating water reuse across the
border a bit of a challenge, especially in certain areas that do not face as much water resource
challenges. These areas do not have the incentives to reuse their water or the knowledge of any
health risks in recycled water and thus the laws are much more limiting than necessary. However,
according to the PIs, were there more information on recycled water, such as the health risks and
costs involved, the government would better able to make policies that deal with water reuse on a
federal level.
It is important to note that some of the information from the interviews with the PIs may be
biased in favor of their particular research projects and areas of expertise. Therefore, the data they
61 | P a g e
have provided, though correct, must be considered with the opinions and data from other sources
In order to minimize biases. In retrospect it would have been beneficial if we were able to interview
with more PIs. Our initial goal was to interview with 15 projects, but after sending emails to 21
different projects we only received responses from 10 projects. This was done by interviewing EPA
employees and looking at other information provided by other organizations such as USGBC.
4.2 External NCER Research
The NCER is only one office within the EPA interested in continuing and focusing their green
building research. The EPA is divided into many offices such as the Office of Research and
Development (ORD) of which NCER is a part. There are other offices within the EPA, such as the
Office of Wetlands, Oceans, and Watersheds (OWOW), Office of Pollution Prevention and Toxics
(OPPT), and Office of Water (OW), also working on sustainable green building technologies. Often
these offices’ goals are not green building directly, but instead a specific technology that is or could
be implemented in a green building. For example, OWOW does extensive research on stormwater
prevention devices while OW works a lot on wastewater treatment. On a broader scale, there are
also other federal government agencies such as National Science Foundation (NSF) that have
completed or are currently working on green building related research. Other non-profit
organizations such as the U.S. Green Building Council (USGBC) and the American Society of
Landscape Architect (ASLA) are also researching green buildings and related technologies. By
considering all different organizations, we understood the green building research focus in a broad
scale to provide accurate recommendation fitted with the EPA’s mission while not overlapping with
existed research from others. For easier reference during this chapter, Table 4-4 shows the list of
people outside of the NCER that we interviewed. The detailed interview transcript can be found in
the Appendix F – EPA Offices Interviews.
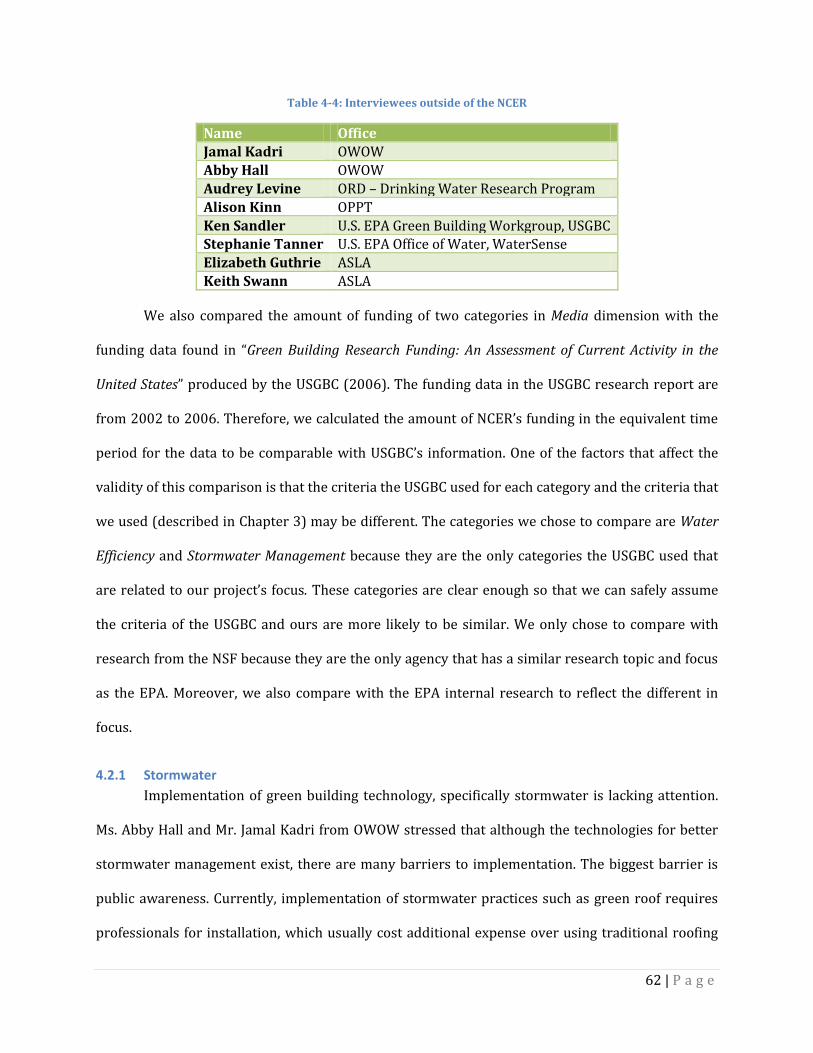
62 | P a g e
Table 4-4: Interviewees outside of the NCER
Name Office Jamal Kadri OWOW
Abby Hall OWOW
Audrey Levine ORD – Drinking Water Research Program
Alison Kinn OPPT
Ken Sandler U.S. EPA Green Building Workgroup, USGBC
Stephanie Tanner U.S. EPA Office of Water, WaterSense
Elizabeth Guthrie ASLA
Keith Swann ASLA
We also compared the amount of funding of two categories in Media dimension with the
funding data found in “Green Building Research Funding: An Assessment of Current Activity in the
United States” produced by the USGBC (2006). The funding data in the USGBC research report are
from 2002 to 2006. Therefore, we calculated the amount of NCER’s funding in the equivalent time
period for the data to be comparable with USGBC’s information. One of the factors that affect the
validity of this comparison is that the criteria the USGBC used for each category and the criteria that
we used (described in Chapter 3) may be different. The categories we chose to compare are Water
Efficiency and Stormwater Management because they are the only categories the USGBC used that
are related to our project’s focus. These categories are clear enough so that we can safely assume
the criteria of the USGBC and ours are more likely to be similar. We only chose to compare with
research from the NSF because they are the only agency that has a similar research topic and focus
as the EPA. Moreover, we also compare with the EPA internal research to reflect the different in
focus.
4.2.1 Stormwater
Implementation of green building technology, specifically stormwater is lacking attention.
Ms. Abby Hall and Mr. Jamal Kadri from OWOW stressed that although the technologies for better
stormwater management exist, there are many barriers to implementation. The biggest barrier is
public awareness. Currently, implementation of stormwater practices such as green roof requires
professionals for installation, which usually cost additional expense over using traditional roofing
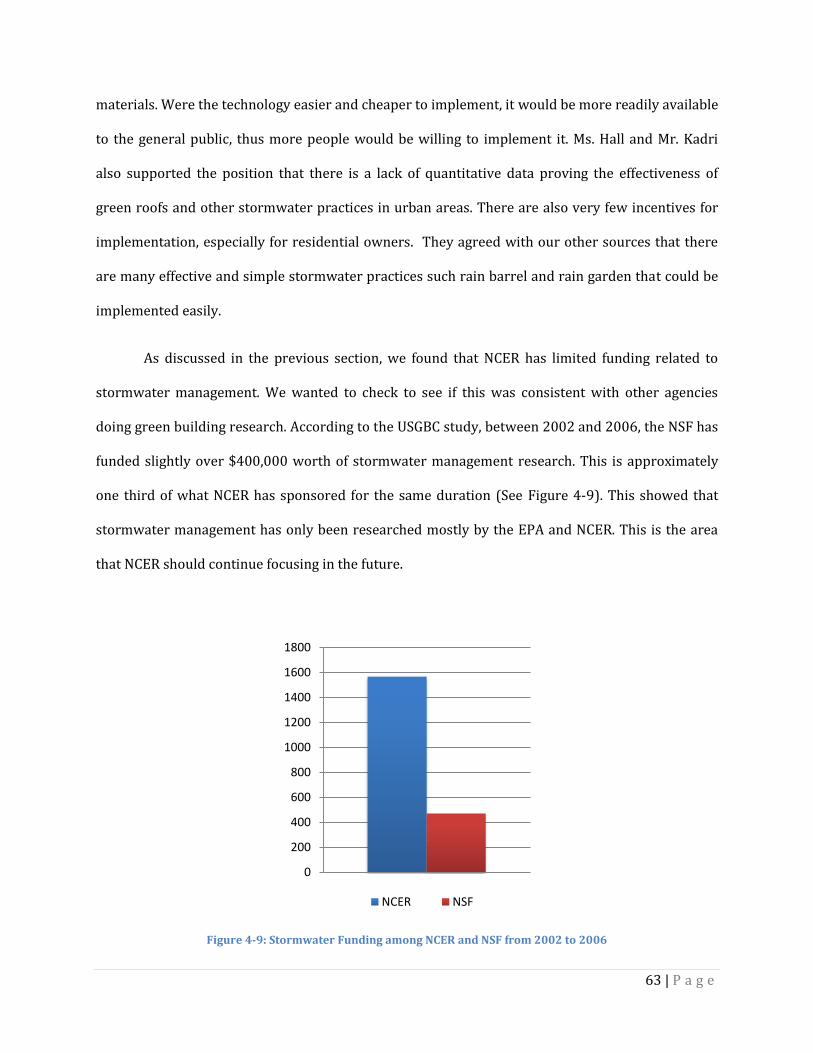
63 | P a g e
materials. Were the technology easier and cheaper to implement, it would be more readily available
to the general public, thus more people would be willing to implement it. Ms. Hall and Mr. Kadri
also supported the position that there is a lack of quantitative data proving the effectiveness of
green roofs and other stormwater practices in urban areas. There are also very few incentives for
implementation, especially for residential owners. They agreed with our other sources that there
are many effective and simple stormwater practices such rain barrel and rain garden that could be
implemented easily.
As discussed in the previous section, we found that NCER has limited funding related to
stormwater management. We wanted to check to see if this was consistent with other agencies
doing green building research. According to the USGBC study, between 2002 and 2006, the NSF has
funded slightly over $400,000 worth of stormwater management research. This is approximately
one third of what NCER has sponsored for the same duration (See Figure 4-9). This showed that
stormwater management has only been researched mostly by the EPA and NCER. This is the area
that NCER should continue focusing in the future.
Figure 4-9: Stormwater Funding among NCER and NSF from 2002 to 2006
0
200
400
600
800
1000
1200
1400
1600
1800
NCER NSF

64 | P a g e
Although the EPA and NCER has been doing many research on stormwater management,
there is still research gaps in many areas where funding are simply insufficient. One of the most
important areas is green roofs. Mr. Kadri and Ms. Abby Hall supported a lot of benefits of living
ecological system that requires little maintenance while effective in reducing runoff. They brought
up some areas of green roof that needs more research including regional climate adaptability and
growing media.
Mr. Kadri and Ms. Hall also mentioned about project DX, a project spin off from the Portland
project that implemented many stormwater practices on a large scale. The government of the city of
Portland, which received funding from the NCER through project DX, has promoted many low
impact development practices for stormwater management such as vegetated swales, porous
pavers, and infiltration planters. This helps reducing a significant amount of stormwater runoff
effectively and increases the public awareness of what people can do on their own properties.
4.2.2 Water
Water research has been fragmented into different areas instead of being viewed as a whole
connected cycle. Dr. Audrey Levine, the director of the U.S. EPA National Drinking Water Research
Program, had shared her thoughts with us regarding this issue. From this interview, we gathered
information about current problems associated with drinking water, water recycling and water
infrastructure. One of the key things emphasized by Dr. Levine was that water should not be
thought of as separated into different categories such as recycled, grey and black water and
stormwater, but we should have an integrated view and look at the whole system and how it is
transported and used. Researchers should consider the energy used for water and wastewater
transportation into cost and benefit analysis in order to more accurately address the problem. One
of the areas that need more attention, according to Dr. Levine, is reusing water on site instead of
transporting it. Reusing water increases the proximity of water to the building, which would reduce
65 | P a g e
significant required energy and make the process of delivering drinking water and transporting
wastewater much more efficiently. Also, using high quality water for potable uses and lower quality
water for other uses would save water and energy, especially in regions where water resources are
scarce.
As was shown in our analysis of previous NCER research, an area that has received limited
funding is water efficiency. NCER has given less than $100,000 towards water efficiency research,
while the EPA as a whole has contributed nearly $8 million between 2002 and 2006 (See Figure
4-10). The NSF has contributed even less to water efficiency research, only $50,000 in the same
time period. In this area, water efficiency, the EPA has done all its technological research at its own
regional laboratories and through programs including the WaterSense. However, according to Ms.
Stephanie Tanner from the WaterSense program, there is little research on the implementation of
technologies and how to increase people’s awareness of using water more efficiently. This is an
area which the NCER can support in the future.
Figure 4-10: Water Efficiency Funding among NCER, EPA, and NSF from 2002 to 2006 (Thousands of Dollars)
0
1000
2000
3000
4000
5000
6000
7000
8000
9000
NCER EPA NSF
66 | P a g e
4.2.3 LEED’s Gaps and Post Occupancy Monitoring
Considering the diverse areas of expertise from all these interviews there were several
common themes. Each of the interviewees mentioned a need for ease of implementation of green
technologies and more incentives and education for the public on these technologies. They also
stressed the need for more data on post-occupancy performance of the green buildings.
We interviewed Ms. Alison Kinn from OPPT and Mr. Ken Sandler from the U.S. EPA Green
Building Workgroup. We learned that LEED is currently certifying buildings without evaluating the
buildings’ performance after people start using them. In order to make green buildings more
effective, they believe an evaluation of the entire life cycle of a building is necessary. This will help
determine if the building is working as expected and, if the people using it are using it effectively.
This will also determine if the material used is efficient overall based on its lifespan as well as its
effectiveness during use. Better metrics are also needed to make measuring the effectiveness of
green buildings easier. Agreeing with OWOW staves, Ms. Kinn and Mr. Sandler also believe that
green technologies would be more frequently adopted if the technologies were easier to use and
readily available to the public, especially homeowners.
We interviewed Ms. Stephanie Tanner from EPA’s WaterSense program. Ms. Tanner is also a
member of the water committee of LEED. She has been working with LEED to better incorporate
water efficiency into their rating system. One of the most significant ideas mentioned was that the
LEED system has very few points based on water efficiency, currently only 2 points. There is
considerable focus on energy efficiency and the utilization of alternative energy, but water
efficiency is often overlooked.
Since there is so much emphasis on reducing buildings’ energy consumption, one of the
most common technologies used in today’s green buildings is water towers. Typically found sitting
atop the building these towers use water to transfer energy to cool the air rather than using energy
67 | P a g e
intensive HVAC systems. These cooling towers have not been rated by LEED yet in terms of the
amount of water they use and also the quality of water they discharge. The WaterSense program
has an interest in researching these devices to reduce their water consumption. Ms. Tanner said
that a future area that the WaterSense program is looking into is the impact of being water efficient
on the larger water infrastructure. There are no data available for knowing the impacts of using less
water on the existing water infrastructure. She emphasized that using less water would ultimately
reduce the needs for building more water and wastewater treatment plants as well as the needs for
larger water distribution systems.
Compared with the EPA and other agencies, non-profit environmental organizations such as
USGBC and local governments only have a limited amount of money for green building research,
especially when there is no green building strategy. In response to their published research “Green
Building Research Funding: An Assessment of Current Activity in the United States” showing a lack of
research funding on green building, the USGBC committed $2 million to act on the areas in need
mentioned in the paper and to leverage other trends as well as encourage other organizations to
increase their funding on green building. Of the projects that they funded, most of them focus at
implementation and how to promote green building practices. Local governments and
organizations are the closest form of management for the implementation of new technologies with
minimum bureaucratic delay. However, they still receive very little funding to support green
building practices.
4.3 Wide Scale Sustainability Implementation
Implementing green building on a large scale is suspected to have significant benefits to the
environment and larger infrastructures, specifically water and wastewater. With contributions
from the CNS program, Portland Oregon implemented a vast stormwater management system
throughout the city to reduce stormwater runoff. Green building technologies, such as water
efficiency and water reuse can ease the burden on the increasing demand for water. Water reuse
68 | P a g e
has been implemented on a large scale in a growing number of areas where natural water resources
are rapidly depleting. The scarcity of resources forces the cities in these areas to become the early
adopters of the sustainable technology and planning in large scale. Orange County is an example of
an area with a shortage of water that led to the development of intensive water reuse program.
4.3.1 Sustainability in Portland
Starting 10 years ago, the city of Portland, Oregon, made a move toward sustainable
development. The city decided to become initiative to implement environmentally friendly
practices to their surrounding, especially practices to reduce or eliminate stormwater runoff. Their
movement is sparked by the rising interest in weaving “green into the grey fabric.” This movement
is supported by NCER through the CNS program in 2003 because of the sustainability goal of the
project.
The city acts as an influential factor that affects the attitude of the people who are living in
it. When there are many green design constructed and managed in the city, the people will not only
witness the benefit these practices bring to the environment but also gradually start to see these
practices as common and not something extraordinary. It helps to increase public awareness and
indirectly urge people to become greener. There will be a tipping point where the number of green-
minded people becomes great enough to allow going green to become the new fashion.
Before, the problem existed is that people who want to go green do not know where to get
the information. Realizing the problem, the city begins to provide manual and guide about low
impact development practices that a person can easily implement at the house to reduce
stormwater runoff. These practices are often not complicated and not too costly while still
providing effective performance.
The method that the city offers to people may not be the most effective method but it can
have a large impact when achieving at the scalability of a city. A LEED Platinum certified building
69 | P a g e
can achieve 0% stormwater runoff with different stormwater management methods. While this
achievement is enormous to one building, it will be negligible when other buildings still have 100%
stormwater runoff. If most buildings just implement a small rain garden, the overall stormwater
runoff reduction will be significant. And that is something that can be achieved only with the
initiative of the city government.
Another problem of implementing green practices is public incentive. Green practices are
often more costly to implement while its benefits are not directly seen by the consumers. Therefore,
consumers are reluctant to implement technologies that only benefit the environment. For example,
stormwater management practices such as green roof and rain gardens help reduce runoff that can
cause erosion and pollution. While those impacts are direct to the environment, people fail to
realize that those impacts will eventually affect their health and their water usage … Local cities are
at the closest proximity to people that can educate them the importance of their action that can
have a large impacts on the environment and themselves. The cities can also provide different types
of incentives, from giving awards to reducing taxes.
After this project, the city started another project, called Project DX, to become an initiative
example of sustainable design and share their experience with other cities. Project DX is the first
step to provide tools and knowledge about stormwater management practices. The city
implemented a lot of rain gardens, basins, planters, etc. in the city to reduce the stormwater runoff.
The success of this project is largely based on the outreach towards the public. Portland has been
able to convince the public the benefit of reducing runoff. As mentioned in the previous section, we
interviewed with the Mr. Tom Puttman, the Principle Investigator of Project DX.
As Mr. Puttman told us about Project DX, a large scale data collection is an ongoing process
and will take a lot of time and work. Trends so far has showed that green technologies do indeed
reduce the consumption and impacts on the larger infrastructure, but to what extent is unknown.
70 | P a g e
4.3.2 Orange County’s Water Management
California has the one of most intensive water reuse programs in the US. There are several
factors which have led to the rapid movement of developing sustainable water infrastructure in
California. We have learned that several of the arid regions of California are simply running out of
water. Their demand for potable water can no longer be fulfilled strictly from natural sources.
As several EPA offices have mentioned to us about California, Orange County has made a
move toward wastewater reuse. Their treatment plant is one of a few in the country that can treat
wastewater to a quality that can be discharged back into the soil where it becomes groundwater.
Once the water is returned as groundwater it is ready for potable use. This method of discharging
what was once wastewater has negative implications on public opinion. During the initial stages of
developing the system the term “toilet to tap” was a common description of the process. However,
as Dr. Levine, the national director of Drinking Water Research program, repeatedly stressed, the
full water cycle must be considered. A better term for this cycle could be “indirect potable use”.
Ultimately it is these small details, including titling, that will dictate when there will be sufficient
public support.
The impacts of treating wastewater for potable use reflect directly toward preventing the
depletion of the natural sources. As shown in Figure 4-11, the blue markers represent all existing
wastewater treatment plants that discharge into the groundwater. Markers in green are planned
sites for future treatment facilities. As shown by the figure, the highest concentration of such
facilities is the Southwest region of the United States where water supplies are dwindling. The plant
in Orange County, California, which went live in early 2008, is planning to treat 15 million gallons of
wastewater per day. Each gallon of water added back to the groundwater is one less gallon needed.
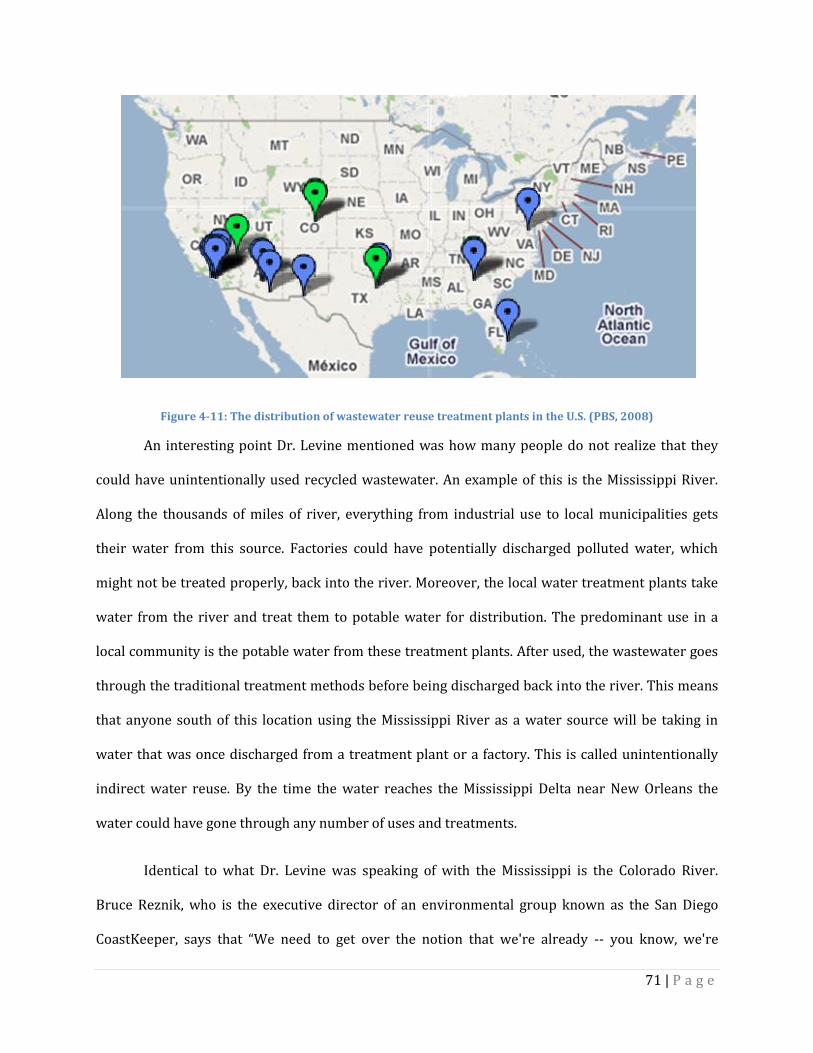
71 | P a g e
Figure 4-11: The distribution of wastewater reuse treatment plants in the U.S. (PBS, 2008)
An interesting point Dr. Levine mentioned was how many people do not realize that they
could have unintentionally used recycled wastewater. An example of this is the Mississippi River.
Along the thousands of miles of river, everything from industrial use to local municipalities gets
their water from this source. Factories could have potentially discharged polluted water, which
might not be treated properly, back into the river. Moreover, the local water treatment plants take
water from the river and treat them to potable water for distribution. The predominant use in a
local community is the potable water from these treatment plants. After used, the wastewater goes
through the traditional treatment methods before being discharged back into the river. This means
that anyone south of this location using the Mississippi River as a water source will be taking in
water that was once discharged from a treatment plant or a factory. This is called unintentionally
indirect water reuse. By the time the water reaches the Mississippi Delta near New Orleans the
water could have gone through any number of uses and treatments.
Identical to what Dr. Levine was speaking of with the Mississippi is the Colorado River.
Bruce Reznik, who is the executive director of an environmental group known as the San Diego
CoastKeeper, says that “We need to get over the notion that we're already -- you know, we're
72 | P a g e
drinking some kind of pure water and toilet-to-tap is something that's unsafe.” These types of social
influence are necessary for public acceptance of wastewater reuse.
4.3.3 Implementing Into Other Cities
The next logical step for green building and the move toward sustainability is the
implementation of green building technologies in other cities across the United States.
While many of the ideas mentioned in section 4.3 are the future of sustainable living, many
of these technologies are early in their testing phases. One of the biggest difficulties for wide scale
implementation remains social acceptance. Often the technology is accused of being unproven
outside the laboratory.
4.4 Budget and Regulations Analysis
To develop suitable recommendations, we had to carefully consider EPA’s and NCER’S
budget and agency regulations. For example, strict regulation of drinking water has been a big
hindrance to implementing water reuse practices and small amounts of money have limited the
number of projects the EPA can fund. These regulations and budgets as well as the EPA’s and
NCER’s missions govern the research that NCER decides to fund.
4.4.1 Budget
According to an interview with Dr. William Sanders and Dr. Diana Bauer, NCER employees,
the EPA does not have a designated budget for green building related research. Therefore, past
research on green building was funded only when a project’s objectives fit into NCER’s strategic
goals. According to the USGBC (2006), the amount of funding for green building research between
2002 and 2005 accounted for 3.16% of the total EPA funding.
EPA’s budget has seen consecutive yearly decreases over the past few years. In 2006 it was
approximately $7.6 billion and in 2008 it had decreased to $7.1 billion, a 6.6% decrease. NCER has
also seen a decline in its budget. From 1999 to 2008, NCER’s extramural research funding
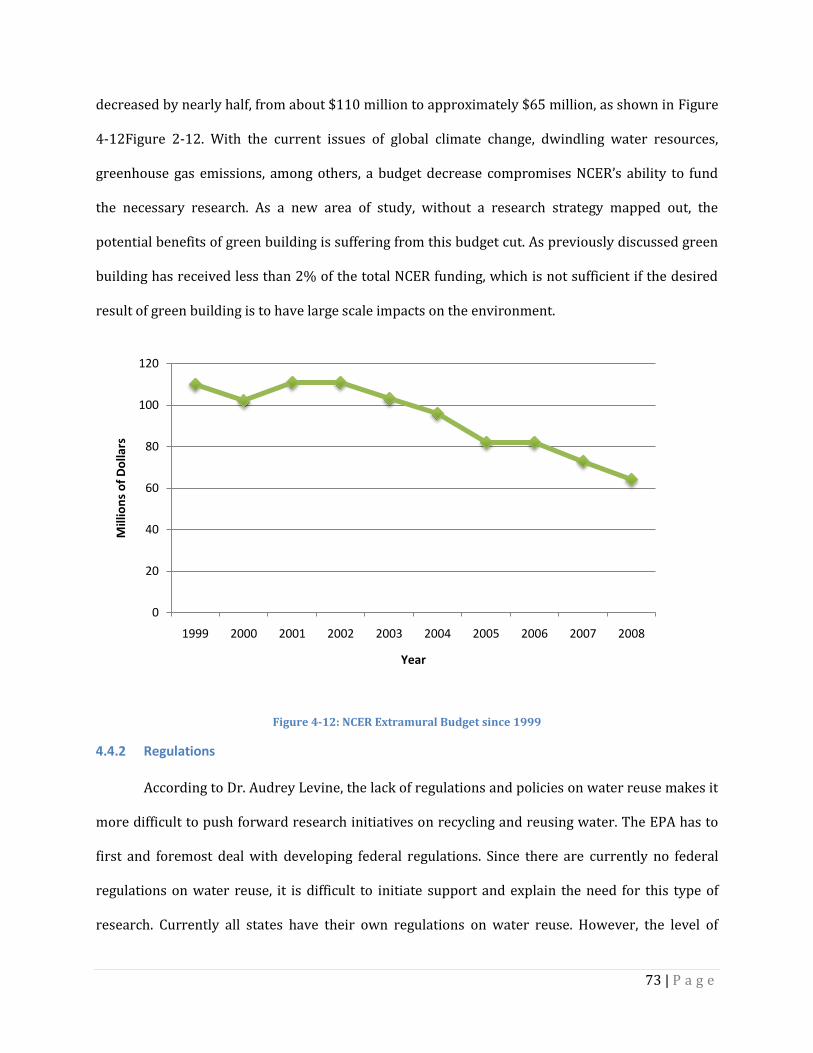
73 | P a g e
decreased by nearly half, from about $110 million to approximately $65 million, as shown in Figure
4-12Figure 2-12. With the current issues of global climate change, dwindling water resources,
greenhouse gas emissions, among others, a budget decrease compromises NCER’s ability to fund
the necessary research. As a new area of study, without a research strategy mapped out, the
potential benefits of green building is suffering from this budget cut. As previously discussed green
building has received less than 2% of the total NCER funding, which is not sufficient if the desired
result of green building is to have large scale impacts on the environment.
Figure 4-12: NCER Extramural Budget since 1999
4.4.2 Regulations
According to Dr. Audrey Levine, the lack of regulations and policies on water reuse makes it
more difficult to push forward research initiatives on recycling and reusing water. The EPA has to
first and foremost deal with developing federal regulations. Since there are currently no federal
regulations on water reuse, it is difficult to initiate support and explain the need for this type of
research. Currently all states have their own regulations on water reuse. However, the level of
0
20
40
60
80
100
120
1999 2000 2001 2002 2003 2004 2005 2006 2007 2008
Mill
ion
s o
f D
olla
rs
Year
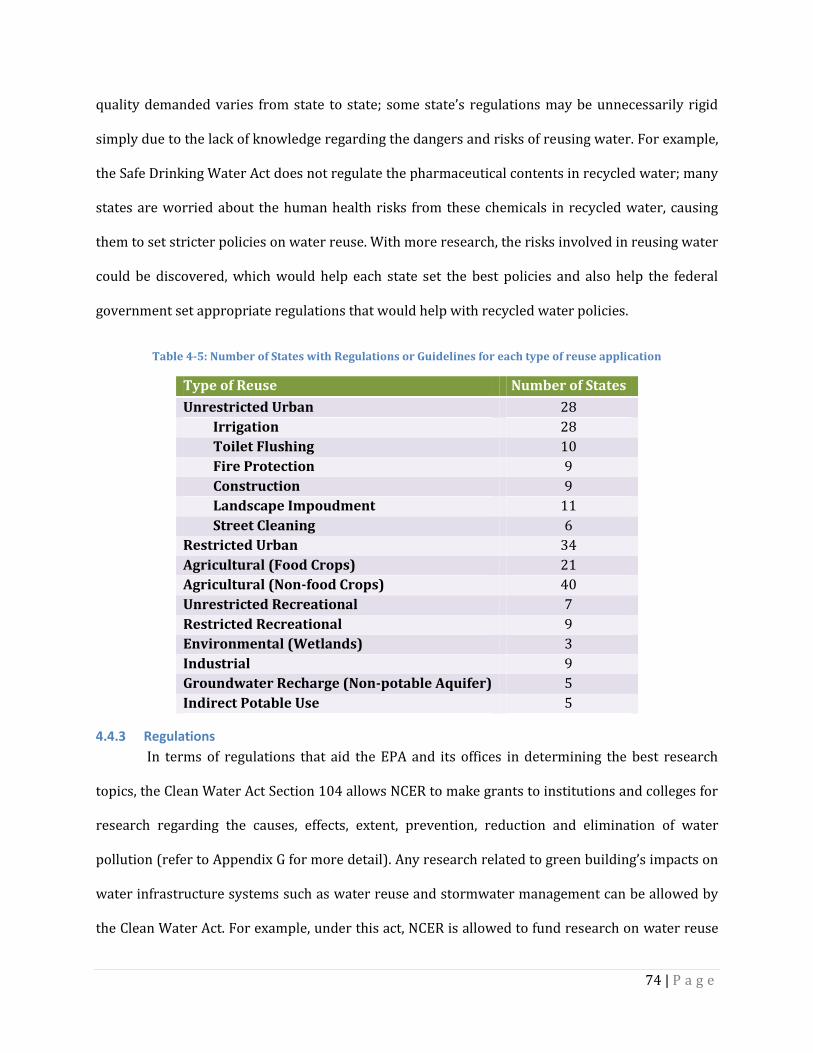
74 | P a g e
quality demanded varies from state to state; some state’s regulations may be unnecessarily rigid
simply due to the lack of knowledge regarding the dangers and risks of reusing water. For example,
the Safe Drinking Water Act does not regulate the pharmaceutical contents in recycled water; many
states are worried about the human health risks from these chemicals in recycled water, causing
them to set stricter policies on water reuse. With more research, the risks involved in reusing water
could be discovered, which would help each state set the best policies and also help the federal
government set appropriate regulations that would help with recycled water policies.
Table 4-5: Number of States with Regulations or Guidelines for each type of reuse application
Type of Reuse Number of States
Unrestricted Urban 28
Irrigation 28
Toilet Flushing 10
Fire Protection 9
Construction 9
Landscape Impoudment 11
Street Cleaning 6
Restricted Urban 34
Agricultural (Food Crops) 21
Agricultural (Non-food Crops) 40
Unrestricted Recreational 7
Restricted Recreational 9
Environmental (Wetlands) 3
Industrial 9
Groundwater Recharge (Non-potable Aquifer) 5
Indirect Potable Use 5
4.4.3 Regulations
In terms of regulations that aid the EPA and its offices in determining the best research
topics, the Clean Water Act Section 104 allows NCER to make grants to institutions and colleges for
research regarding the causes, effects, extent, prevention, reduction and elimination of water
pollution (refer to Appendix G for more detail). Any research related to green building’s impacts on
water infrastructure systems such as water reuse and stormwater management can be allowed by
the Clean Water Act. For example, under this act, NCER is allowed to fund research on water reuse
75 | P a g e
which will help reduce the amount of wastewater discharged into the environment and stormwater
management research which will help reduce the amount of polluted water runoff discharged into
water sources.
The Safe Drinking Water Act Section 1442 (Appendix E) also authorizes the EPA to make
grants for research on water quality especially in matters of causes, diagnosis, treatment, control,
prevention of physical and mental diseases, and other impairments of man resulting directly or
indirectly to water quality. Under this Act, NCER can fund various research initiatives on the health
risks involved in using recycled water for potable uses. Research into the various pharmaceuticals
in recycled water could also be authorized under this act.
76 | P a g e
5 Conclusions and Recommendations
Water reuse, storm water management practices and water infrastructure are the key
research gaps identified through our project. Furthermore, in order to aid implementation of green
practices there are significant gaps within social acceptance research. After garnering and analyzing
our data from NCER’s archive, interviews with project investigators, and employees of EPA and
USGBC, we developed two sets of recommendations for NCER.
The first set of recommendations focuses on researching the gaps we have identified
through the completion of our objectives. Water reuse, stormwater management practices and
water infrastructure were identified as future focus areas for NCER. These areas include water
reuse, both regional and onsite, water infrastructure, storm water management and the residential
market.
The second set of recommendations concern future focus areas for specific programs within
NCER. The P3 program is best suited for localized data collection, such as gathering green roof
climatic data. The SBIR program should focus on water reuse technology, which would ultimately
result in affordable products for consumers. Finally, the discontinued CNS program needs to be
replaced with another sustainable oriented program to continue implementing sustainable design
on a large scale. These recommendations will influence NCER’s future solicitations to better address
areas in need for green building research. They may also prove helpful in the formation of a green
building research strategy across the EPA.
Ultimately green building is an integration of many environmental technologies. While we
did consider all facets of green building research, our focus was on water infrastructure. We put our
primary concentration on technologies dealing with the management of stormwater and
wastewater and their resulting impacts on water infrastructure systems. Improving green building
77 | P a g e
technology and implementation would minimize buildings impacts on both the environment and
external infrastructures. With the limited budget available to NCER, our project sought to provide
research priorities to better focus on aspects of green building that have been previously
overlooked. Through our project, we hope these gaps will be better addressed through future NCER
solicitations.
5.1 Recommendations for areas of research
We identified water reuse, water infrastructure, storm water management and residential
market as areas in need of future research. Also essential for achieving sustainability is social
acceptance research. Our analysis of past and present green building research across the EPA has
led us to develop a list of future focus areas for green building development, specifically in water
and wastewater infrastructure. Due to aging water infrastructure systems, dwindling water
resources, and increasing residential construction, these four key areas will need to be address in
the move toward sustainability.
5.1.1 Water reuse
One of the most prominent areas of green building that lacks sufficient funding is water
reuse. From our analysis, we showed that NCER has funded only $99,000 since 1995, a completely
insufficient amount toward this essential research area. Water reuse also has the potential for
reducing inefficient non-potable uses, which currently use potable water for tasks such as
landscaping and flushing toilet. Water reuse does not only has the potential to significantly reduce
the amount of fresh water needed, but also indirectly reduce the energy used for water
transportation in and out of the buildings. It also relieves the stress of building more water
infrastructure system to meet the increasing demand for potable water.
Water reuse has been overlooked in the past primarily from insufficient knowledge of
potential health risks and the high cost of on-site treatment. There has also been essentially no
78 | P a g e
guidance from the federal government regarding the quality of water reuse and the water
purification process. This discouraged many cities and states from implementing water reuse
program.
1. Onsite treatment: More emphasis should be put on developing technologies that could
reduce the cost of onsite wastewater treatment. Onsite treatment increases water efficiency
and reduce the energy used to transport water. NCER should create a short-term goal of
improving non-potable treatment methods, as grey water account for a large percentage of
water use. A long-term goal can be to develop these technologies to a level that they can be
implemented cheaply and efficiently into existing buildings.
2. Water reuse risk: The lack of information on potential human risks from consuming
reused water is a big drawback to the implementation process. Future research should
focus on identifying any negative consequences associated with water reuse, such as the
buildup of pharmaceuticals. Furthermore, research should develop treatment processes to
effectively remove these potential risks. Human health is the most important factor when
considering implementation of a water reuse program.
3. Water incentives: Another problem is the lack of incentives encouraging people to
efficiently use their water, which is currently undervalued. An abundance of water in many
parts of the US led to inexpensive water bills and creates the impression that water has little
value. This also reflected by the low number of points offered for water efficiency in the
LEED rating system. Sociological and psychological studies need to be conducted to
determine the best method to persuade people to reuse water and become water efficient.
Studies could be about the reaction of people to different regulatory methods including
taxes and costs associated with water use.
4. Public acceptance: Social studies should also aid in determining the most effective
methods for changing public perceptions of water reuse. People could be educated about
79 | P a g e
the feasibility and dangers of water reuse for potable and non-potable purposes. Consumers
must understand that there is technology capable of treating wastewater to meet the
potable water standards. Future research should study states like California where
intensive water reuse has been implemented and how to gradually change the public
connotation to accepting water reuse.
5.1.2 Water infrastructure
There is lack of information regarding the impacts of buildings on the larger water
infrastructure. City planners and regulators need quantitative data to plan water infrastructure
systems that better fit the needs. Water and wastewater treatment plants, water distribution
systems, and the piping system all are affected by green buildings impacts. With the aging water
infrastructure in the U.S replacements or upgrades will be necessary in the near future. Therefore,
it is important to understand these issues to minimize the cost of building more infrastructure
systems.
1. Quantitative data: Future research should look at collecting quantitative data about impact
of buildings on water infrastructure, which could potentially reduce the needs of building
more plants as well as relieve the stress on water infrastructure systems by lower total
flow.
2. Water Cooling Tower: These devices are a specific component to many green buildings
that has been overlooked. Typically a large amount of water is used as a heat transfer
medium and then discharged as wastewater. This is very inefficient because this used water
typically has negligible contamination and could be treated and reused at a minimum cost.
3. Post Occupancy Monitoring: Monitoring systems put in place after a building is occupied
are essential for maintaining building efficiency. Ensuring a green building is achieving the
expected performance after construction is essential if the building is to be different from
traditional technologies. However, it is not guaranteed that the building performance can be
80 | P a g e
maintained after a period of occupancy. Therefore, real-time monitoring is necessary to
maintain the efficiency of the building. Computer system can be implemented to monitor
and inform consumers about the resource usage at building. It is also important to note that
the LEED rating system also has not yet addressed this problem.
5.1.3 Stormwater
Buildings, especially those in urban areas, can significantly reduce the amount of water
runoff by implementing proper stormwater management practices. While traditional engineering
methods are more reliable, the ever increasing population is resulting in increased impervious
surfaces. This requires constructing and managing a larger and more complex piping system at
higher operational costs. Ecological systems are a potential solution to solving these stormwater
runoff challenges that require further research.
1. Pervious pavement: Pervious pavements are important because they not only can reduce
the stormwater runoff by releasing the water on site but also help replenishing
groundwater resources. Previous NCER research is limited in both scope and depth on this
topic. Research into sustainable permeable materials needs more focus.
2. Affordability: Stormwater technologies and practices exist, however more emphasis needs
to be placed on their costs and marketing. A streamlined process for implementation would
be helpful, and research into easily producible technologies would prove useful.
3. Green roofs on existing buildings: While it is simpler to implement green roofs on new
buildings because the construction is designed to withstand the weight of a living roof,
existing buildings may also be able to install green roofs. Future research should improve
green roof technologies for ease of implementation on existing buildings.
4. Climatic Regions: Future research should include climate into considerations. The various
climatic zones act as hindrances for the US to adopt and implement green roofs and other
living systems. Research done on a particular area cannot be applied to other areas in other
81 | P a g e
parts of the country. Future research should focus on methods that can be readily adopted
and adjusted for the various climates. Research could also be done on a regional and
climate specific basis.
5. Quality of runoff: There is little research on the quality of the runoff from different sources.
Runoff from parking lots can contain heavy metals, hydrocarbons, and other vehicle related
compounds, while runoff from residential areas can contain pesticides and fertilizers.
Studying these contaminations can help treating runoff more effectively as well as provide
information for future research.
5.1.4 Residential Market
Research should be performed on the simplification of technologies and practices to aid the
residential market to accept green building practices. There are approximately 120 million
residential units in the United States (US Census Bureau, 2001). As mentioned previously, LEED has
a goal of having 1 million homes LEED certified by 2010. This amounts to less than one percent of
the current residential market. Having a greater impact on the residential market would be of
tremendous environmental value. Traditionally it has been easier to market green building
practices and technologies to the commercial and industrial sectors. There also tends to be fewer
incentives for residential home owners to implement green technologies. Currently the majority of
the market for green building in the residential sector is limited to individuals with the knowledge,
money, and desire to be environmentally friendly.
5.2 Recommendations for NCER’s programs
Since each program in NCER is different in strategy and budget. To better reflected green
building research gaps, each grant program should have different focus considering its nature to
provide suitable solicitations encouraging researchers to apply for these grants. The provided
recommendations will encourage the direction of future solicitations.
82 | P a g e
5.2.1 Small Business Innovative Research Program
The focus of the SBIR program is to provide grants for environmental product development.
SBIR’s grantees are typically entrepreneurs and small business firms. Therefore, projects ultimate
goal is often a product that could be commercialized, resulting in profits for the developer. These
projects should target products which can be implemented to multiple types of buildings and
regions.
The SBIR program should focus on water reuse technologies. This is one of the biggest areas
of focus overlooked by NCER. The program could focus on creating affordable on-site water
treatment products. An ideal end product would produce different levels of quality treatment for
each type of non-potable reuse purpose. For example, there is no need for water of potable quality
to be used when flushing a toilet. Grey water reuse requires comparatively elementary treatment
processing when compared with that of black water, therefore we recommend as a foremost reuse
priority to identify the best methods to treat grey water. Future development should also look at
how to monitor water use in real-time for data collection purposes. Past P3 projects have shown
that if people are aware of their instantaneous resource use they are more likely to reduce their
usage.
Stormwater management is an area where the SBIR program could also show its potential.
Future research should focus on measuring the runoff rate and treating the contaminants. Another
area to study is different types of soil, plants, and landscape technologies that have lower costs and
higher performance. The products should also consider aesthetic design criteria to make them
more marketable, as social acceptance is one of the major hindrances to mass implementation.
5.2.2 People, Planet, and Prosperity Program
We believe NCER could better utilize research results from the P3 program. Although P3 has
a comparatively small budget, it has the advantage of having a diversity of grantees with various
83 | P a g e
professional backgrounds in different geographic areas. Past recipients in the P3 program have
shown they can cover a wide range of topics. The broader solicitations bring the interests of
individuals rather than furthering the EPA’s own goals. These projects aim at students and
universities that are in an easier position to perform sociological studies compared with SBIR.
These projects should continue to look at different and effective ways to integrate all aspects of
green building together. Quantitative data collection is a very important aspect of green building
that the P3 program has shown to be effective at gathering in the past. This will allow for future
projects to build upon existing accomplishments rather than repeating past research.
5.2.3 Collaborative Science and Technology Network for Sustainability
We believe that to continue large scale green building research the NCER needs to develop a
replacement for the now discontinued CNS program. Since 2004 the CNS program was NCER’s
cornerstone for sustainability. Unfortunately, 2006 was the last year for a CNS solicitation.
Currently the NCER is developing a new strategic goal for green building. With the completion of
this document the NCER will seek to request designated funding for this newly developed goal.
Potentially a new program could emerge and become the new forefront for NCER’s move toward
sustainability and thus green building.
84 | P a g e
References ACEEE. (2008, September 20). ACEEE. Retrieved September 20, 2008, from http://aceee.org
Billatos, S. B., & Basaly, N. A. (1997). Green Technology and Design for the Environment.
Washington: Taylor & Francis.
Boulder Green Building. (2008). Green Building. Retrieved September 15, 2008, from
http://www.greenbuilding.com
Boutwell, S. (2008, June 24). Adoption of Green Technologies in the Buildings/Facilities
Sector: A Market Perspective. Retrieved September 25, 2008, from AECbytes:
http://www.aecbytes.com/viewpoint/2008/issue_39.html
Chiras, D. D. (2004). The New Ecological Home : A Complete Guide to Green Building Options.
White River Junction, Vermont, United States of America: Chelsea Green Publishing Company.
Coffman, L. S., & Clar, M. L. (2003). Low-Impact Development: An Ecologically Sensitive
Alternative for Stormwater Management. In R. Field, & D. Sullivan, Wet-Weather Flow in the Urban
Watershed: Technology and Management (pp. 271-294). Boca Raton: CRC Press.
ECY. (2008, September 25). Washington State Department of Ecology. Retrieved September
25, 2008, from http://www.ecy.wa.gov/
Environmental Services City of Portland. (2006, November). Ecoroof Fact Sheet. Retrieved
November 12, 2008, from http://www.portlandonline.com/shared/cfm/image.cfm?id=195199
Environmental Services City of Portland. (2006, November). When it falls on the roof.
Retrieved November 12, 2008, from
http://www.portlandonline.com/bes/index.cfm?c=43110&a=129056
Environmental Services City of Portland. (2006, November). When it gets to ground.
Retrieved November 12, 2008, from
http://www.portlandonline.com/bes/index.cfm?c=43110&a=129057
Florida Solar Energy Center. (2008). Florida Solar Energy Center. Retrieved September 25,
2008, from http://www.fsec.ucf.edu/en/
Fox, A. (2008, September 10). Green building basics: Roofs and water management. Retrieved
September 19, 2008, from http://salemnews.com/pulife/local_story_253222725.html
Grigg, N. S. (2003). Water, Wastewater, and Stormwater Infrastructure Management. Boca
Raton: CRC Press.
Healthwise. (2007, November 1). Environmental Illness - Overview. Retrieved September 20,
2008, from http://www.webmd.com/allergies/tc/environmental-illness-overview
85 | P a g e
Hong, T., Chou, S. K., & Bong, T. Y. (2000). Building Simulation: an overview of developments
and information sources. Singapore: Department of Mechanical and Production Engineering,
National University of Singapore.
Institute for Environmental Security. (2008). Institute for Environmental Security. Retrieved
September 14, 2008, from http://www.envirosecurity.org/
James, J. P., & Yang, X. (2006). Emissions of Volatile Organic Compounds from Several Green
and Non-Green Building Materials: A Comparison. Indoor and Buiilt Environment (14), 69-74.
Kats, G. (2003). The Costs and Financial Benefits of Green Buildings. Westborough:
Massachusetts Technology Collaborative.
Lockwood, C. (2008, May). The Blue-Collar Green-Building Boom. Harvard Business Review ,
50-53.
Ludwig, A. (2006). Create an Oasis with Grey water Choosing, Building and Using Grey water
Systems — Includes Branched Drains (5 ed.). New York, NY: Oasis Design.
US Census Bureau. (2001). American Housing Survey. Retrieved November 12, 2008, from
http://www.census.gov/hhes/www/housing/ahs/ahsfaq.html
US DOE. (2008). Department of Energy. Retrieved October 5, 2008, from
http://www.energy.gov/
US EPA. (1995). 1995 Clean Water Needs Survey Report to Congree. Retrieved September 27,
2008, from http://www.epa.gov/owm/mtb/cwns/1995rtc/toc.htm
US EPA. (2004, December 20). Buildings and the Environment: A Statistical Summary.
Retrieved September 15, 2008, from http://www.epa.gov/greenbuilding/pubs/gbstats.pdf
US EPA. (2008a). About EPA. Retrieved September 20, 2008, from
http://www.epa.gov/epahome/aboutepa.htm
US EPA. (2008b). EPA Green Building. Retrieved September 10, 2008, from
http://www.epa.gov/greenbuilding
US EPA. (2008c). Funding Opportunities. Retrieved September 25, 2008, from
http://www.epa.gov/greenbuilding/tools/funding.htm
US EPA. (2008d). 2006-2011 EPA Strategic Plan. Retrieved September 15, 2008, from
www.epa.gov/ocfopage/plan/2006/entire_report.pdf
US EPA NCER. (2008, August 7). NCER. Retrieved September 16, 2008, from
http://es.epa.gov/ncer/about/
USGBC. (2008a). Green Building Facts. Retrieved November 13, 2008, from
http://www.usgbc.org/ShowFile.aspx?DocumentID=3340
86 | P a g e
USGBC. (2008b). LEED. Retrieved September 10, 2008, from
http://www.usgbc.org/DisplayPage.aspx?CategoryID=19
Wüstenhagen, R., Wolsink, M., & Bürer, M. J. (2007). Social acceptance of renewable energy
innovation: An introduction to the concept. Science Direct , 35 (5), 2683-3120.
WPI. (2007, May 15). Interactive Qualifying Project. Retrieved October 13, 2008, from
http://www.wpi.edu/Academics/Depts/IGSD/iqp.html
Yudelson, J. (2008). The Green Building Revolution. Washington, DC: Island Press.
87 | P a g e
Appendices
Appendix A: Sponsor Description
The Environmental Protection Agency
The Environmental Protection Agency (EPA) was founded as an independent agency under
the Clean Air Act during President Nixon’s term in 1970 (US EPA, 2008a). Its mission is to protect
the environment and human health through developing environmental policies and regulations.
The EPA has to perform its mission while maintaining the nation’s economic competitiveness.
The current EPA administrator, Stephen L. Johnson, has a strong scientific background in
biology and environment (US EPA, 2008a). Since becoming the head of EPA, he has implemented
many significant environmental programs and enforced the nation’s environmental laws.
The EPA has 5 goals as outlined in its Strategic Plan 2006-2011, which is a five-year plan to
deliver a cleaner and healthier environment for the public(US EPA, 2008d). Its goals include having
“clean air, clean and safe water, land preservation and restoration, healthy communities and
ecosystems, and compliance and environmental stewardship.”(p. 5)
The structure of the EPA consists of a head administrator and a deputy administrator who
are responsible for the monitoring of the nine assistant administrators, three offices, and ten
regions that form the EPA (US EPA, 2008a). The nine assistant administrators are in charge of
Administration and Resource Management, Air and Radiation, Enforcement and Compliance
Assurance, International Affairs, Environmental Information, Prevention Pesticides and Toxic
Substances, Research and Development, Solid Waste and Emergency Response, and Water. The
three offices consist of the Chief Financial Officer, the General Counsel, and the Inspector General.
The ten regions that contain EPA offices are Boston, New York, Philadelphia, Atlanta, Chicago,
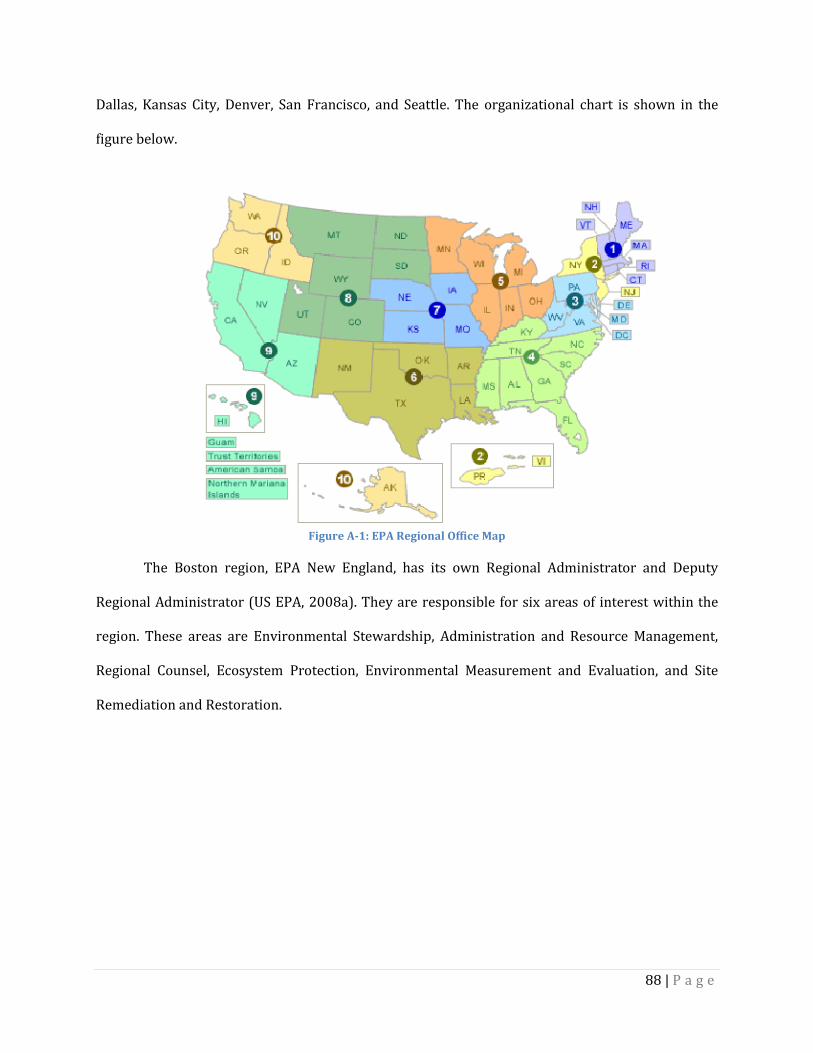
88 | P a g e
Dallas, Kansas City, Denver, San Francisco, and Seattle. The organizational chart is shown in the
figure below.
Figure A-1: EPA Regional Office Map
The Boston region, EPA New England, has its own Regional Administrator and Deputy
Regional Administrator (US EPA, 2008a). They are responsible for six areas of interest within the
region. These areas are Environmental Stewardship, Administration and Resource Management,
Regional Counsel, Ecosystem Protection, Environmental Measurement and Evaluation, and Site
Remediation and Restoration.
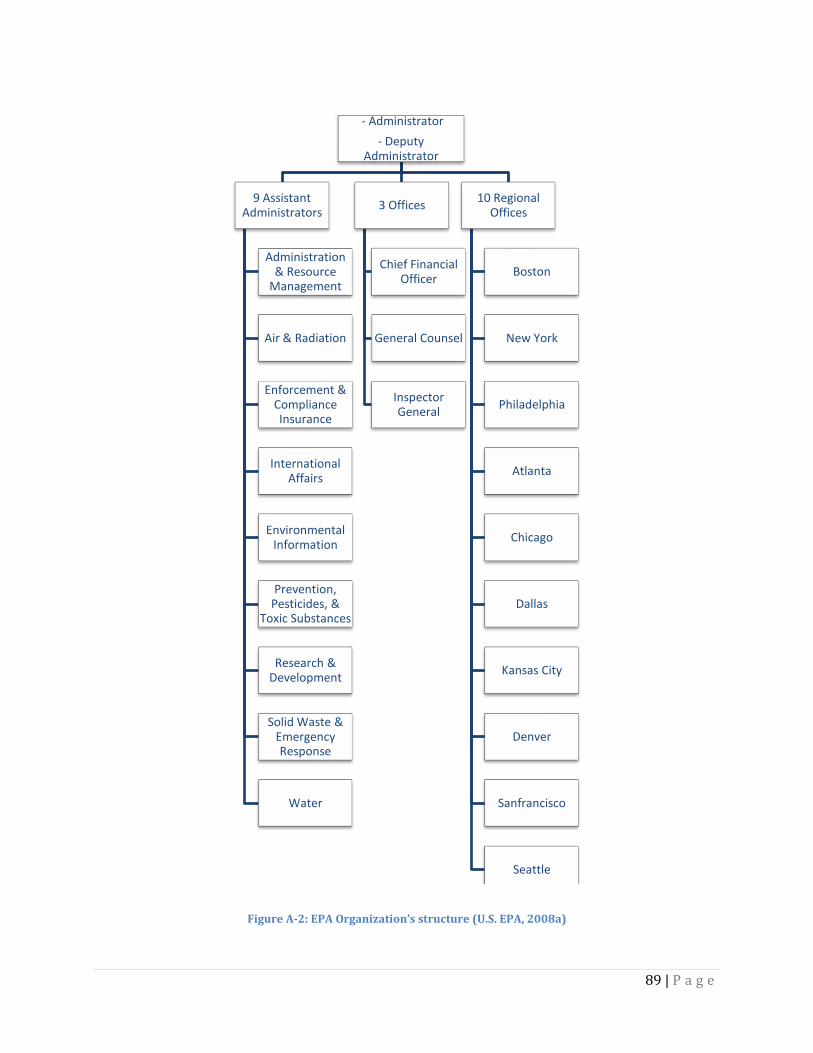
89 | P a g e
Figure A-2: EPA Organization’s structure (U.S. EPA, 2008a)
- Administrator
- Deputy Administrator
9 Assistant Administrators
Administration & Resource
Management
Air & Radiation
Enforcement & Compliance Insurance
International Affairs
Environmental Information
Prevention, Pesticides, &
Toxic Substances
Research & Development
Solid Waste & Emergency Response
Water
3 Offices
Chief Financial Officer
General Counsel
Inspector General
10 Regional Offices
Boston
New York
Philadelphia
Atlanta
Chicago
Dallas
Kansas City
Denver
Sanfrancisco
Seattle
90 | P a g e
The EPA strategic plan is divided into five different focus areas (US EPA, 2008d). Each focus
area is allocated a certain percentage of the total available resources. These descriptive divisions
allow straightforward placement of projects and jurisdictions. Our project has been identified as
fitting into goal 5 of the EPA, known as the Compliance and Environmental Stewardship division.
The EPA is a federally funded agency with an annual budget that must be split between the
5 divisions of the EPA (US EPA, 2008d). As of 2007 the EPA had a total budget of 7.32 billion dollars.
Of this money 734 million went to goal 5 of their strategic plan, roughly 10% of the total. It is worth
noting that this particular division of the EPA is receiving over 9 million dollars less in funding than
the previous year. Furthermore, it is also worth noting that the overall EPA budget has been
consistently cut year after year since its height in 2004. A specific place that division 5 puts money
is in grants to states and communities. With these funds they are obligated to provide technical
assistance, education and outreach to assist businesses and industries in identifying strategies and
solutions to reduce wastes and pollution at the source.
As of 2007, the EPA employed 17,560 full time individuals (US EPA, 2008a). Of these, there
are roughly 3,480 devoted to strategic goal 5 of the EPA. Although this section of the EPA receives
10% of the total budget, it does comprise nearly 20% of the workforce.
Evaluating problems and enacting solutions are only two of the resources the EPA can
utilize (US EPA, 2008d). Power of the enacted policies is critical to the EPA’s mission of protecting
the environment. On a basic level the EPA works to provide the compliance information to the
regulated community. This is partly accomplished on the state level, but also by universities that
were given research funds. Monitoring is the next step towards the long-term goal of environmental
improvement. A community under regulations is consistently reviewed and evaluated by the EPA,
“laws, regulations, permit conditions, and settlement agreements” are carefully monitored (p. 59).
Enforcement is a third step towards rehabilitating a community. The EPA works with the
91 | P a g e
Department of Justice to ensure compliance of legislation, should the need arise. Outside of the
EPA’s power is its desire for a regulated community to take initiative and use self-evaluation to
ensure compliance. The EPA works to partner with other federal organizations along with the state
and lower levels of the government to ensure the mission of the EPA is fulfilled.
Technology is essential for solving the complex issue of safeguarding both human health
and the environment. The EPA has a strong focus on partnering with industry (US EPA, 2008d). The
2007 budget outline highlights that the “EPA will continue to reduce the amount of toxic chemicals
in use by encouraging the design of alternative less toxic chemicals and industry processes through
its Green Chemistry and Green Engineering Programs” (p. 61).
Under Division 5 of the EPA is a program known as Performance Track (US EPA, 2008d).
The growing success of this program is attributed to the incentives to participate. The EPA
“recognizes and rewards private and public facilities that demonstrate environmental stewardship”
beyond the current requirements (p. 63).
Other than the EPA, there are other organizations that deal with the environment and
human health. These organizations work around the world fulfilling missions like the EPA’s. The
Institute for Environmental Security (2008) is an international non-profit organization established
to bring political attention to environmental security. The UN has several sub-groups that manage
environmental concerns such as the United Nations Environment Organization (UNEO, 2008) and
the United Nations Environment Programme (UNEP, 2008). In Europe, the European Environment
Agency (EEA) deals with environmental issues. The EEA is an agency of the 27 countries in the
European Union as well as Iceland, Norway, Liechtenstein, Turkey and Switzerland (EEA, 2008).
Another environmental agency is the Commission for Environmental Cooperation (CEC, 2008),
which was created by the USA, Canada and Mexico to address environmental concerns, promote
92 | P a g e
effective enforcement of environmental law and help prevent potential trade and environmental
conflicts.
There are also a lot of private agencies that help with environmental problems. Greenpeace
is one such organization. It deals with issues such as commercial whaling, nuclear testing … around
the world (Greenpeace, 2008). Another private agency is the Environmental Investigation Agency
(2008), which investigates crimes against wildlife and the environment. There are many more such
agencies such as Earth Policy Institute, Birdlife International, and World Conservation Union.
Some of these organizations collaborate with the EPA in order to protect human health and
the environment. The Centers for Disease Control (CDC) works with the EPA as well as the Boston
Public Health Commission to reduce emissions from the auto shops in low-income neighborhoods
(CDC, 2008). However, most of these groups, while they may not be collaborating with the EPA, are
not in competition with the EPA.
The National Center of Environment
The WPI team’s project is sponsored by the National Center for Environment Research
(NCER) of the EPA, one of the seven research organizations inside the Office of Research &
Development (ORD) of the EPA. NCER’s mission is to support high-quality research by the nation’s
leading scientists that will improve the scientific basis for national environmental decisions (US
EPA NCER, 2008). NCER and ORD mirror the National Academy of Sciences’ risk assessment
paradigm by focusing research on: Exposure, Effects, Risk Assessment, and Risk Management. NCER
supports leading edge, extramural research in each of these areas through competitions for grants,
fellowships, and innovative small business research contracts.
93 | P a g e
Appendix B: NCER Grant Programs
NCER funds are given to recipients who applied for and won a solicitation pertaining to a
specific field of research. There are three main programs that NCER funds: P3, CNS, and SBIR. Each
program has specific criteria that applicants must consider when drafting a proposal.
Small Business Innovative Research Program
SBIR or Small Business Innovation Research is an annual program that focuses on the
development of innovative environmental technologies and products. Solicitations begin annually
in March and typically last till December. A proposal selected for Phase I funding can receive up to
70,000 dollars. Upon the successful completion of Phase I of the project a recipient can apply for a
Phase II to continue development of their project. Phase II grants are up to 225,000 dollars.
Collaborative Science and Technology Network for Sustainability Program
The Collaborative Science and Technology Network for Sustainability (CNS) grant program
was launched in 2004 as the foundation for NCER’s move toward sustainability research. Under this
program 10 major projects have been funded dealing with developing and promoting sustainable
practices.
CNS projects often target to make large-scale impacts. Projects in the past have partnered
with universities, federal agencies, cities, states, regional planning organizations, nonprofit
organizations and industry.
People, Prosperity and Planet Program
The People, Prosperity, and Planet program (P3) is a yearly grant competition for
undergraduate students and their respective faculty. The P3 program is currently in its 6th year of
solicitations. The following three figures show the grant process from start to finish.
The competition begins with an RFA opening. These RFA’s fall under one of the following
categories: Agriculture Materials and Chemicals, Energy, Information Technology, Water, or Built
Environment. As seen in Figure below, the projects then go into a peer review process where
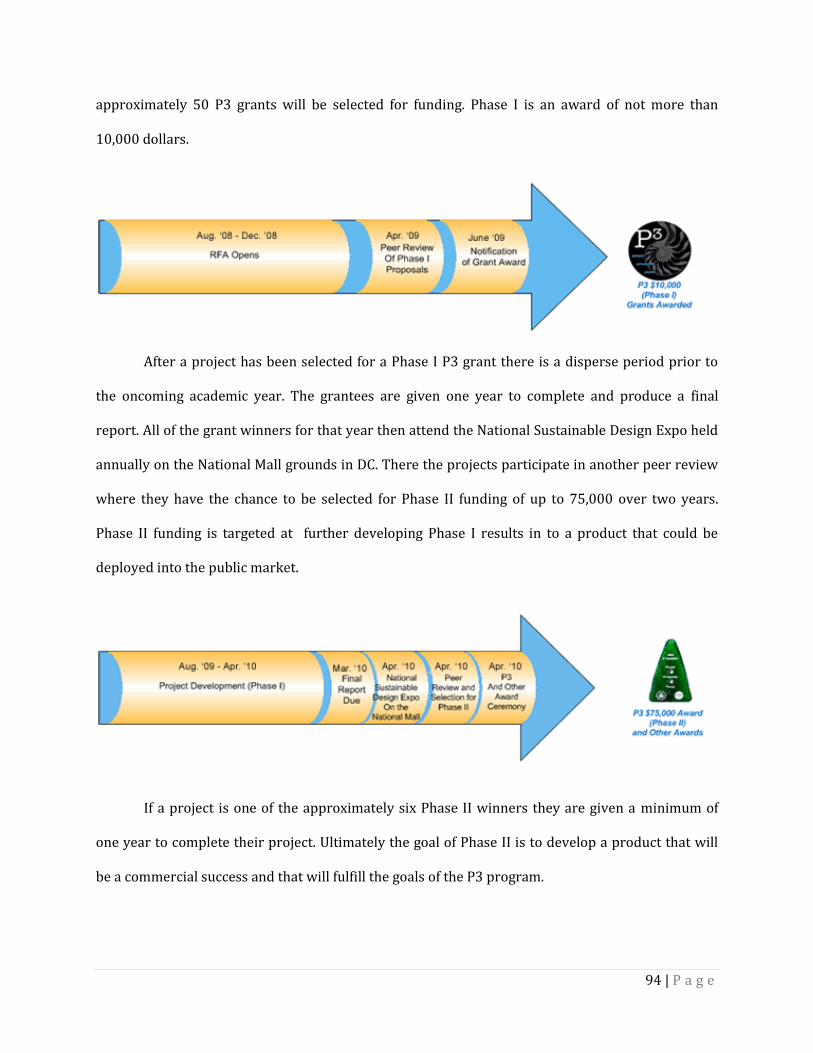
94 | P a g e
approximately 50 P3 grants will be selected for funding. Phase I is an award of not more than
10,000 dollars.
After a project has been selected for a Phase I P3 grant there is a disperse period prior to
the oncoming academic year. The grantees are given one year to complete and produce a final
report. All of the grant winners for that year then attend the National Sustainable Design Expo held
annually on the National Mall grounds in DC. There the projects participate in another peer review
where they have the chance to be selected for Phase II funding of up to 75,000 over two years.
Phase II funding is targeted at further developing Phase I results in to a product that could be
deployed into the public market.
If a project is one of the approximately six Phase II winners they are given a minimum of
one year to complete their project. Ultimately the goal of Phase II is to develop a product that will
be a commercial success and that will fulfill the goals of the P3 program.

95 | P a g e
96 | P a g e
Appendix C - WPI East Hall Green Dormitory Interview
Architect Lynne Deninger
Interviewees Architect Lynne Deninger
WPI attendants Manh-Hung Le (Chair), Brian Robie (Secretary)
Topic Green Building
Interviewees Background
Ms. Deninger is the architect of the East Hall dormitory at WPI, which received LEED Gold
Certification.
Tuesday, October 1, 2008 @ 11:15 AM
1. In general, is East Hall more efficient, regarding energy and water, than other buildings on
campus?
East hall is 31% more efficient than a conventional building of the same size and occupancy.
East hall contains high efficiency heating and cooling systems
2. Did you use any unique design elements which are different from conventional
technologies?
Yes, the air coolers on East Hall are very rare, approximately one of eight in the country.
Fins were also added to the exterior of the building that were designed to shade most of the
windows during the summer months, cutting down the energy needed to cool the building
immensely
Allowed for a smaller cooling system to be used
3. Did you implement a green roof?
Yes, East Hall has a green roof with active monitors to record water data such as amount, temp,
and quality.
4. How well does East Hall meet or exceed the green building standards of LEED?
East Hall is currently in the stages of certification by LEED, the expected outcome is a high silver
or low gold certification.
5. Did cost affect the extent of going green?
97 | P a g e
Yes, we designed East Hall to be as energy efficient as possible while considering the budget
given to us.
6. Were there green technologies that you were unable to include in the building?
Yes, the use of alternative energy was eliminated as a possibility due to the high costs and
relatively low returns in this region
Recycled water was also eliminated as there are multiple constraints placed upon recycled
water by the state of Massachusetts.
7. What criteria were considered when designing for water and wastewater management? Are
there any methods of wastewater treatment?
East Hall has a goal of zero stormwater runoff.
Site contains water retention systems and a green roof
The building contains no water treatment system
8. Are there any wastewater or water problems that exist within the building?
At this time there are no problems that have developed, the building is still relatively new
9. Did you use water efficient utilities that the EPA supports, such as green faucets or toilets?
Yes, all facilities in East Hall are water efficient.
Other interesting points:
Landscaping is self-sustaining, there is no irrigation system
Lighting energy consumption is less than one watt per square foot
The heating units only operate independently of each other and only as needed
Rooms contain occupancy sensors that automatically minimize the heating and cooling systems
when the rooms are vacant for more than 12 hours
Windows have sensors to shut off heat or cooling when opened
98 | P a g e
Professor Paul P. Mathisen
Interviewees Professor Paul P. Mathisen
WPI attendants Manh-Hung Le (Chair), Brian Robie (Secretary)
Topic Stormwater Management
Interviewees Background
Professor Paul P. Mathisen is currently a professor in the Civil Engineering Department at WPI who
concentrates on Environmental Engineering and Water Resources
Tuesday, October 3, 2008 @ 11:15 AM
1. What methods does East Hall use to keep stormwater to a minimum?
The building incorporates pervious landscaping around the sides of the building. There is also the
green roof.
2. The East Hall architect mentioned that the building has zero runoff. Does zero runoff mean
the water retention rate is 100% or the water pollutant is completely filtered?
It is unlikely to have 0% stormwater runoff. Often the most effective method for minimizing
stormwater runoff is to delay its release by incorporating storage containers.
3. What impurities can be found in the stormwater? Is the stormwater treated before
discharged to municipal sewer?
The stormwater quality should be of fairly good quality. There are no chemicals used on site.
4. Are there any additional methods used besides a green roof?
The use of stormwater storage would prevent potential flash flooding. Another area is porous
pavement
5. Is there anything besides costs preventing green buildings from become more widespread?
Inconvenience possibilities: low water flow (toilets, showers, sinks), space limitations, aesthetic
perception.
6. Do green building wastewater management systems have any the environmental impacts of
the surrounding areas?
Any building whether green or not will have an impact on the surrounding environment.
Stormwater runoff can be detrimental to the surrounding areas, especially during sudden
downpours.
99 | P a g e
7. Could you comment on what areas you think the EPA should focus on in regards to green
buildings, especially to water management system?
Stormwater management, especially in relation to storing the water and preventing immediate
discharge.
Ways of getting more green roofs on current buildings.
Energy efficiency
Reuse of water, especially useful in southern states where water shortage is often a problem in
the summer months.
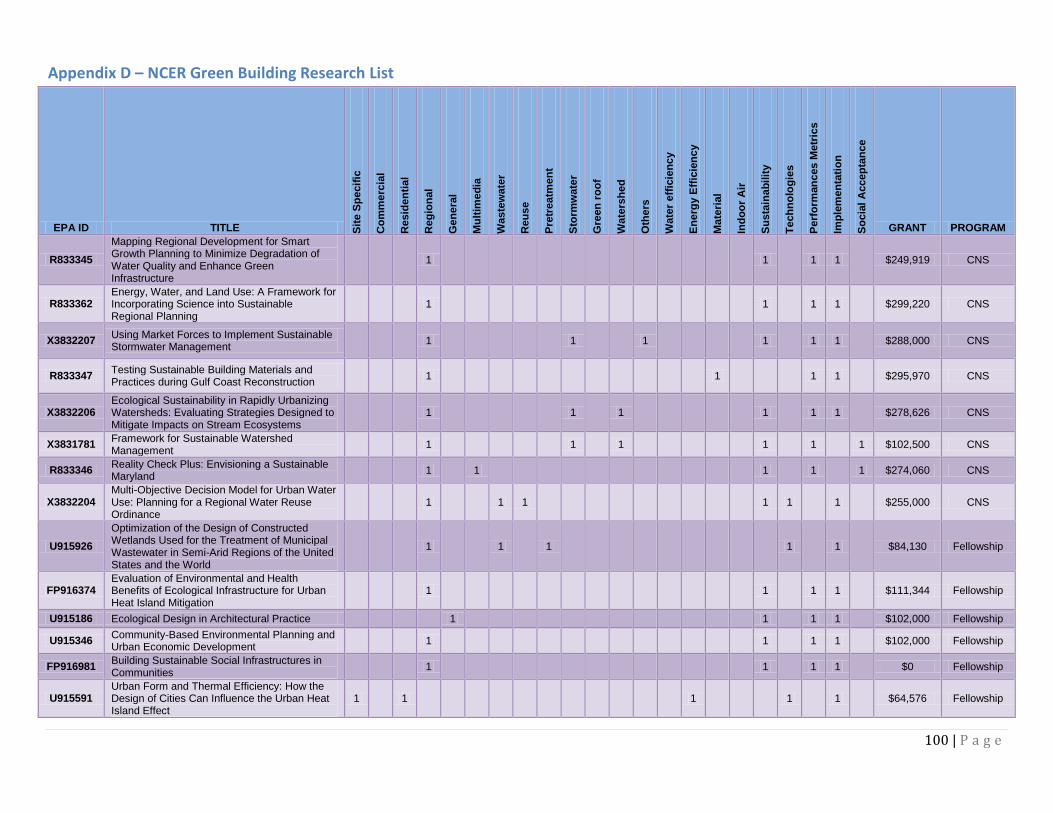
100 | P a g e
Appendix D – NCER Green Building Research List
EPA ID TITLE Sit
e S
pe
cif
ic
Co
mm
erc
ial
Resid
en
tial
Reg
ion
al
Gen
era
l
Mu
ltim
ed
ia
Waste
wate
r
Reu
se
Pre
treatm
en
t
Sto
rmw
ate
r
Gre
en
ro
of
Wate
rsh
ed
Oth
ers
Wate
r eff
icie
nc
y
En
erg
y E
ffic
ien
cy
Ma
teri
al
Ind
oo
r A
ir
Su
sta
ina
bilit
y
Te
ch
no
log
ies
Perf
orm
an
ces M
etr
ics
Imp
lem
en
tati
on
So
cia
l A
ccep
tan
ce
GRANT PROGRAM
R833345
Mapping Regional Development for Smart Growth Planning to Minimize Degradation of Water Quality and Enhance Green Infrastructure
1
1
1 1
$249,919 CNS
R833362 Energy, Water, and Land Use: A Framework for Incorporating Science into Sustainable Regional Planning
1
1
1 1
$299,220 CNS
X3832207 Using Market Forces to Implement Sustainable Stormwater Management
1
1
1
1
1 1
$288,000 CNS
R833347 Testing Sustainable Building Materials and Practices during Gulf Coast Reconstruction
1
1
1 1
$295,970 CNS
X3832206 Ecological Sustainability in Rapidly Urbanizing Watersheds: Evaluating Strategies Designed to Mitigate Impacts on Stream Ecosystems
1
1
1
1
1 1
$278,626 CNS
X3831781 Framework for Sustainable Watershed Management
1
1
1
1
1
1 $102,500 CNS
R833346 Reality Check Plus: Envisioning a Sustainable Maryland
1
1
1
1
1 $274,060 CNS
X3832204 Multi-Objective Decision Model for Urban Water Use: Planning for a Regional Water Reuse Ordinance
1
1 1
1 1
1
$255,000 CNS
U915926
Optimization of the Design of Constructed Wetlands Used for the Treatment of Municipal Wastewater in Semi-Arid Regions of the United States and the World
1
1
1
1
1
$84,130 Fellowship
FP916374 Evaluation of Environmental and Health Benefits of Ecological Infrastructure for Urban Heat Island Mitigation
1
1
1 1
$111,344 Fellowship
U915186 Ecological Design in Architectural Practice
1
1
1 1
$102,000 Fellowship
U915346 Community-Based Environmental Planning and Urban Economic Development
1
1
1 1
$102,000 Fellowship
FP916981 Building Sustainable Social Infrastructures in Communities
1
1
1 1
$0 Fellowship
U915591 Urban Form and Thermal Efficiency: How the Design of Cities Can Influence the Urban Heat Island Effect
1
1
1
1
1
$64,576 Fellowship
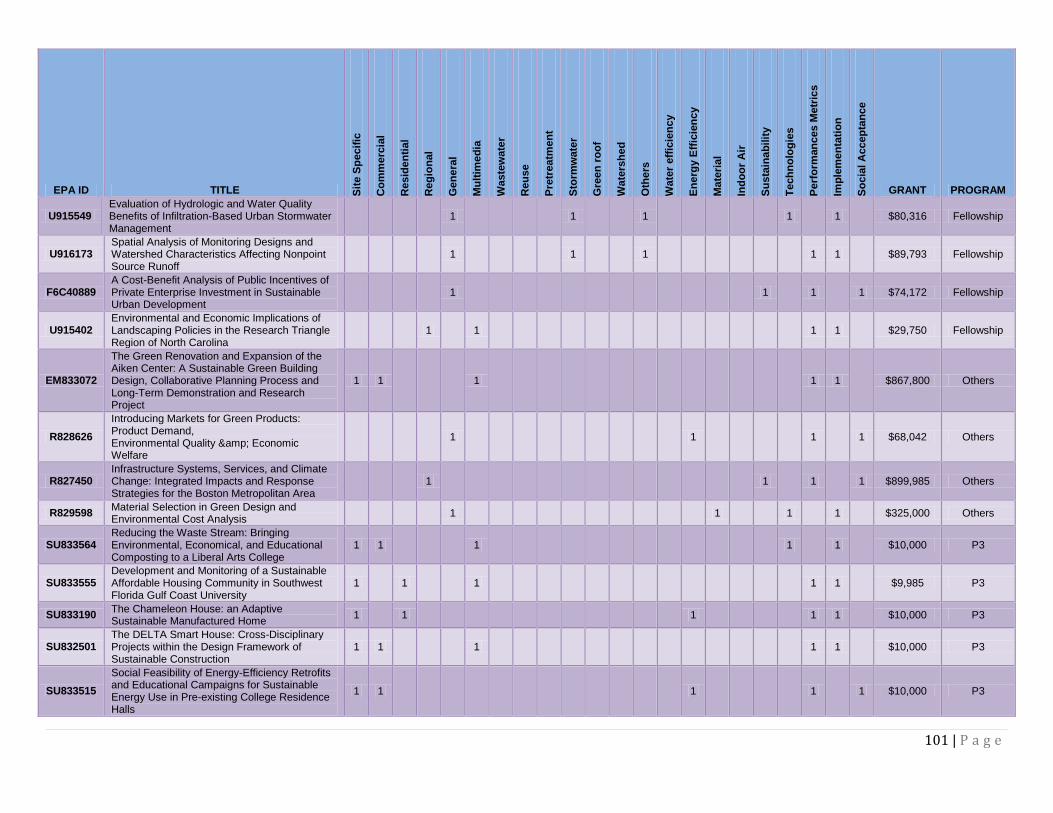
101 | P a g e
EPA ID TITLE Sit
e S
pe
cif
ic
Co
mm
erc
ial
Resid
en
tial
Reg
ion
al
Gen
era
l
Mu
ltim
ed
ia
Waste
wate
r
Reu
se
Pre
treatm
en
t
Sto
rmw
ate
r
Gre
en
ro
of
Wate
rsh
ed
Oth
ers
Wate
r eff
icie
nc
y
En
erg
y E
ffic
ien
cy
Ma
teri
al
Ind
oo
r A
ir
Su
sta
ina
bilit
y
Te
ch
no
log
ies
Perf
orm
an
ces M
etr
ics
Imp
lem
en
tati
on
So
cia
l A
ccep
tan
ce
GRANT PROGRAM
U915549 Evaluation of Hydrologic and Water Quality Benefits of Infiltration-Based Urban Stormwater Management
1
1
1
1
1
$80,316 Fellowship
U916173 Spatial Analysis of Monitoring Designs and Watershed Characteristics Affecting Nonpoint Source Runoff
1
1
1
1 1
$89,793 Fellowship
F6C40889 A Cost-Benefit Analysis of Public Incentives of Private Enterprise Investment in Sustainable Urban Development
1
1
1
1 $74,172 Fellowship
U915402 Environmental and Economic Implications of Landscaping Policies in the Research Triangle Region of North Carolina
1
1
1 1
$29,750 Fellowship
EM833072
The Green Renovation and Expansion of the Aiken Center: A Sustainable Green Building Design, Collaborative Planning Process and Long-Term Demonstration and Research Project
1 1
1
1 1
$867,800 Others
R828626
Introducing Markets for Green Products: Product Demand, Environmental Quality & Economic Welfare
1
1
1
1 $68,042 Others
R827450 Infrastructure Systems, Services, and Climate Change: Integrated Impacts and Response Strategies for the Boston Metropolitan Area
1
1
1
1 $899,985 Others
R829598 Material Selection in Green Design and Environmental Cost Analysis
1
1
1
1
$325,000 Others
SU833564 Reducing the Waste Stream: Bringing Environmental, Economical, and Educational Composting to a Liberal Arts College
1 1
1
1
1
$10,000 P3
SU833555 Development and Monitoring of a Sustainable Affordable Housing Community in Southwest Florida Gulf Coast University
1
1
1
1 1
$9,985 P3
SU833190 The Chameleon House: an Adaptive Sustainable Manufactured Home
1
1
1
1 1
$10,000 P3
SU832501 The DELTA Smart House: Cross-Disciplinary Projects within the Design Framework of Sustainable Construction
1 1
1
1 1
$10,000 P3
SU833515
Social Feasibility of Energy-Efficiency Retrofits and Educational Campaigns for Sustainable Energy Use in Pre-existing College Residence Halls
1 1
1
1
1 $10,000 P3
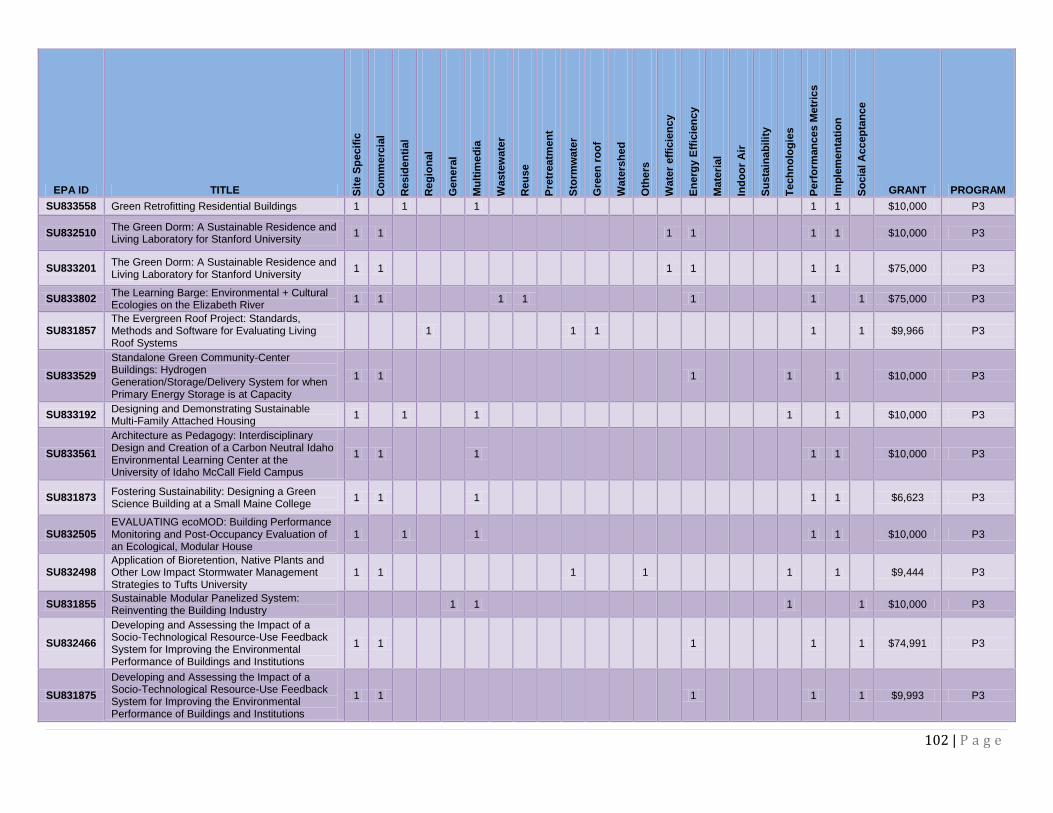
102 | P a g e
EPA ID TITLE Sit
e S
pe
cif
ic
Co
mm
erc
ial
Resid
en
tial
Reg
ion
al
Gen
era
l
Mu
ltim
ed
ia
Waste
wate
r
Reu
se
Pre
treatm
en
t
Sto
rmw
ate
r
Gre
en
ro
of
Wate
rsh
ed
Oth
ers
Wate
r eff
icie
nc
y
En
erg
y E
ffic
ien
cy
Ma
teri
al
Ind
oo
r A
ir
Su
sta
ina
bilit
y
Te
ch
no
log
ies
Perf
orm
an
ces M
etr
ics
Imp
lem
en
tati
on
So
cia
l A
ccep
tan
ce
GRANT PROGRAM
SU833558 Green Retrofitting Residential Buildings 1
1
1
1 1
$10,000 P3
SU832510 The Green Dorm: A Sustainable Residence and Living Laboratory for Stanford University
1 1
1 1
1 1
$10,000 P3
SU833201 The Green Dorm: A Sustainable Residence and Living Laboratory for Stanford University
1 1
1 1
1 1
$75,000 P3
SU833802 The Learning Barge: Environmental + Cultural Ecologies on the Elizabeth River
1 1
1 1
1
1
1 $75,000 P3
SU831857 The Evergreen Roof Project: Standards, Methods and Software for Evaluating Living Roof Systems
1
1 1
1
1 $9,966 P3
SU833529
Standalone Green Community-Center Buildings: Hydrogen Generation/Storage/Delivery System for when Primary Energy Storage is at Capacity
1 1
1
1
1
$10,000 P3
SU833192 Designing and Demonstrating Sustainable Multi-Family Attached Housing
1
1
1
1
1
$10,000 P3
SU833561
Architecture as Pedagogy: Interdisciplinary Design and Creation of a Carbon Neutral Idaho Environmental Learning Center at the University of Idaho McCall Field Campus
1 1
1
1 1
$10,000 P3
SU831873 Fostering Sustainability: Designing a Green Science Building at a Small Maine College
1 1
1
1 1
$6,623 P3
SU832505 EVALUATING ecoMOD: Building Performance Monitoring and Post-Occupancy Evaluation of an Ecological, Modular House
1
1
1
1 1
$10,000 P3
SU832498 Application of Bioretention, Native Plants and Other Low Impact Stormwater Management Strategies to Tufts University
1 1
1
1
1
1
$9,444 P3
SU831855 Sustainable Modular Panelized System: Reinventing the Building Industry
1 1
1
1 $10,000 P3
SU832466
Developing and Assessing the Impact of a Socio-Technological Resource-Use Feedback System for Improving the Environmental Performance of Buildings and Institutions
1 1
1
1
1 $74,991 P3
SU831875
Developing and Assessing the Impact of a Socio-Technological Resource-Use Feedback System for Improving the Environmental Performance of Buildings and Institutions
1 1
1
1
1 $9,993 P3
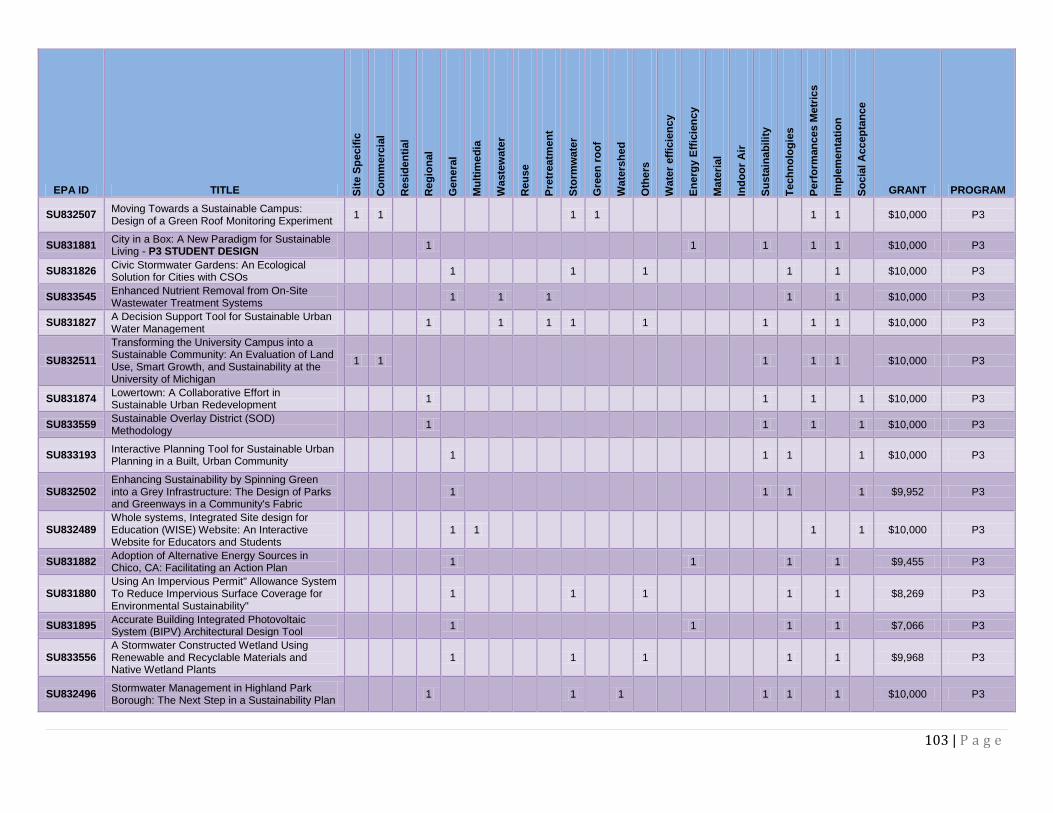
103 | P a g e
EPA ID TITLE Sit
e S
pe
cif
ic
Co
mm
erc
ial
Resid
en
tial
Reg
ion
al
Gen
era
l
Mu
ltim
ed
ia
Waste
wate
r
Reu
se
Pre
treatm
en
t
Sto
rmw
ate
r
Gre
en
ro
of
Wate
rsh
ed
Oth
ers
Wate
r eff
icie
nc
y
En
erg
y E
ffic
ien
cy
Ma
teri
al
Ind
oo
r A
ir
Su
sta
ina
bilit
y
Te
ch
no
log
ies
Perf
orm
an
ces M
etr
ics
Imp
lem
en
tati
on
So
cia
l A
ccep
tan
ce
GRANT PROGRAM
SU832507 Moving Towards a Sustainable Campus: Design of a Green Roof Monitoring Experiment
1 1
1 1
1 1
$10,000 P3
SU831881 City in a Box: A New Paradigm for Sustainable Living - P3 STUDENT DESIGN
1
1
1
1 1
$10,000 P3
SU831826 Civic Stormwater Gardens: An Ecological Solution for Cities with CSOs
1
1
1
1
1
$10,000 P3
SU833545 Enhanced Nutrient Removal from On-Site Wastewater Treatment Systems
1
1
1
1
1
$10,000 P3
SU831827 A Decision Support Tool for Sustainable Urban Water Management
1
1
1 1
1
1
1 1
$10,000 P3
SU832511
Transforming the University Campus into a Sustainable Community: An Evaluation of Land Use, Smart Growth, and Sustainability at the University of Michigan
1 1
1
1 1
$10,000 P3
SU831874 Lowertown: A Collaborative Effort in Sustainable Urban Redevelopment
1
1
1
1 $10,000 P3
SU833559 Sustainable Overlay District (SOD) Methodology
1
1
1
1 $10,000 P3
SU833193 Interactive Planning Tool for Sustainable Urban Planning in a Built, Urban Community
1
1 1
1 $10,000 P3
SU832502 Enhancing Sustainability by Spinning Green into a Grey Infrastructure: The Design of Parks and Greenways in a Community's Fabric
1
1 1
1 $9,952 P3
SU832489 Whole systems, Integrated Site design for Education (WISE) Website: An Interactive Website for Educators and Students
1 1
1
1 $10,000 P3
SU831882 Adoption of Alternative Energy Sources in Chico, CA: Facilitating an Action Plan
1
1
1
1
$9,455 P3
SU831880 Using An Impervious Permit" Allowance System To Reduce Impervious Surface Coverage for Environmental Sustainability"
1
1
1
1
1
$8,269 P3
SU831895 Accurate Building Integrated Photovoltaic System (BIPV) Architectural Design Tool
1
1
1
1
$7,066 P3
SU833556 A Stormwater Constructed Wetland Using Renewable and Recyclable Materials and Native Wetland Plants
1
1
1
1
1
$9,968 P3
SU832496 Stormwater Management in Highland Park Borough: The Next Step in a Sustainability Plan
1
1
1
1 1
1
$10,000 P3
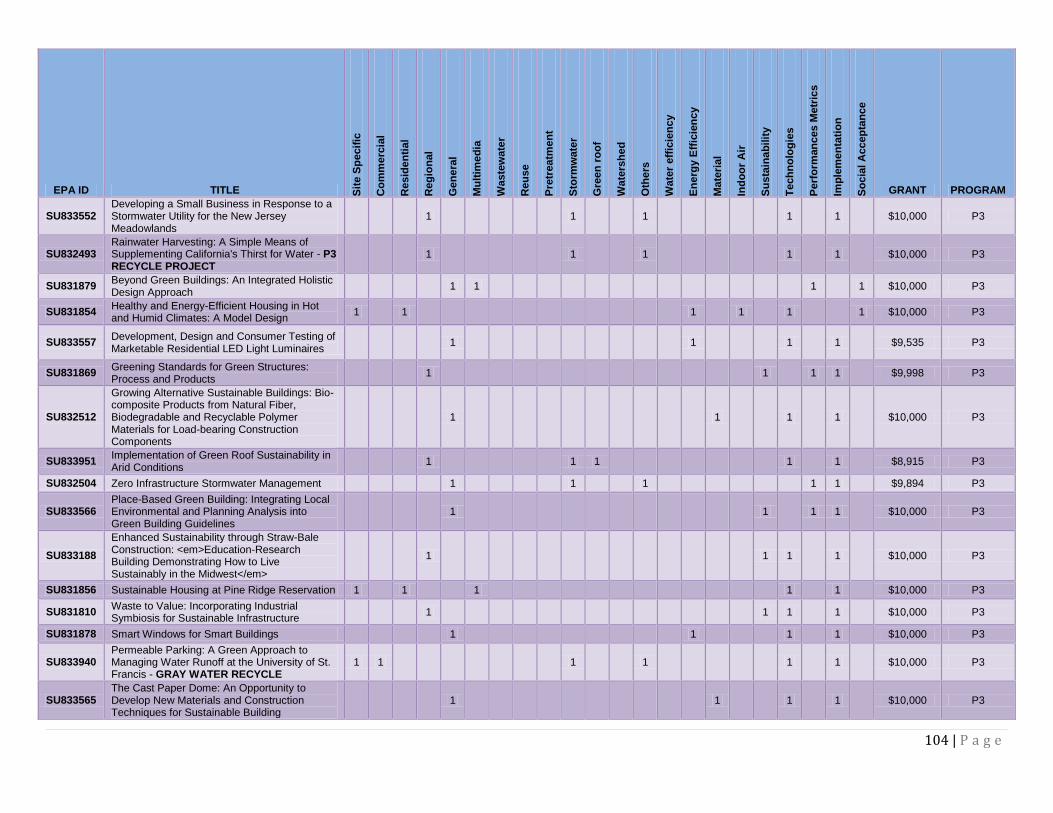
104 | P a g e
EPA ID TITLE Sit
e S
pe
cif
ic
Co
mm
erc
ial
Resid
en
tial
Reg
ion
al
Gen
era
l
Mu
ltim
ed
ia
Waste
wate
r
Reu
se
Pre
treatm
en
t
Sto
rmw
ate
r
Gre
en
ro
of
Wate
rsh
ed
Oth
ers
Wate
r eff
icie
nc
y
En
erg
y E
ffic
ien
cy
Ma
teri
al
Ind
oo
r A
ir
Su
sta
ina
bilit
y
Te
ch
no
log
ies
Perf
orm
an
ces M
etr
ics
Imp
lem
en
tati
on
So
cia
l A
ccep
tan
ce
GRANT PROGRAM
SU833552 Developing a Small Business in Response to a Stormwater Utility for the New Jersey Meadowlands
1
1
1
1
1
$10,000 P3
SU832493 Rainwater Harvesting: A Simple Means of Supplementing California's Thirst for Water - P3 RECYCLE PROJECT
1
1
1
1
1
$10,000 P3
SU831879 Beyond Green Buildings: An Integrated Holistic Design Approach
1 1
1
1 $10,000 P3
SU831854 Healthy and Energy-Efficient Housing in Hot and Humid Climates: A Model Design
1
1
1
1
1
1 $10,000 P3
SU833557 Development, Design and Consumer Testing of Marketable Residential LED Light Luminaires
1
1
1
1
$9,535 P3
SU831869 Greening Standards for Green Structures: Process and Products
1
1
1 1
$9,998 P3
SU832512
Growing Alternative Sustainable Buildings: Bio-composite Products from Natural Fiber, Biodegradable and Recyclable Polymer Materials for Load-bearing Construction Components
1
1
1
1
$10,000 P3
SU833951 Implementation of Green Roof Sustainability in Arid Conditions
1
1 1
1
1
$8,915 P3
SU832504 Zero Infrastructure Stormwater Management
1
1
1
1 1
$9,894 P3
SU833566 Place-Based Green Building: Integrating Local Environmental and Planning Analysis into Green Building Guidelines
1
1
1 1
$10,000 P3
SU833188
Enhanced Sustainability through Straw-Bale Construction: <em>Education-Research Building Demonstrating How to Live Sustainably in the Midwest</em>
1
1 1
1
$10,000 P3
SU831856 Sustainable Housing at Pine Ridge Reservation 1
1
1
1
1
$10,000 P3
SU831810 Waste to Value: Incorporating Industrial Symbiosis for Sustainable Infrastructure
1
1 1
1
$10,000 P3
SU831878 Smart Windows for Smart Buildings
1
1
1
1
$10,000 P3
SU833940 Permeable Parking: A Green Approach to Managing Water Runoff at the University of St. Francis - GRAY WATER RECYCLE
1 1
1
1
1
1
$10,000 P3
SU833565 The Cast Paper Dome: An Opportunity to Develop New Materials and Construction Techniques for Sustainable Building
1
1
1
1
$10,000 P3
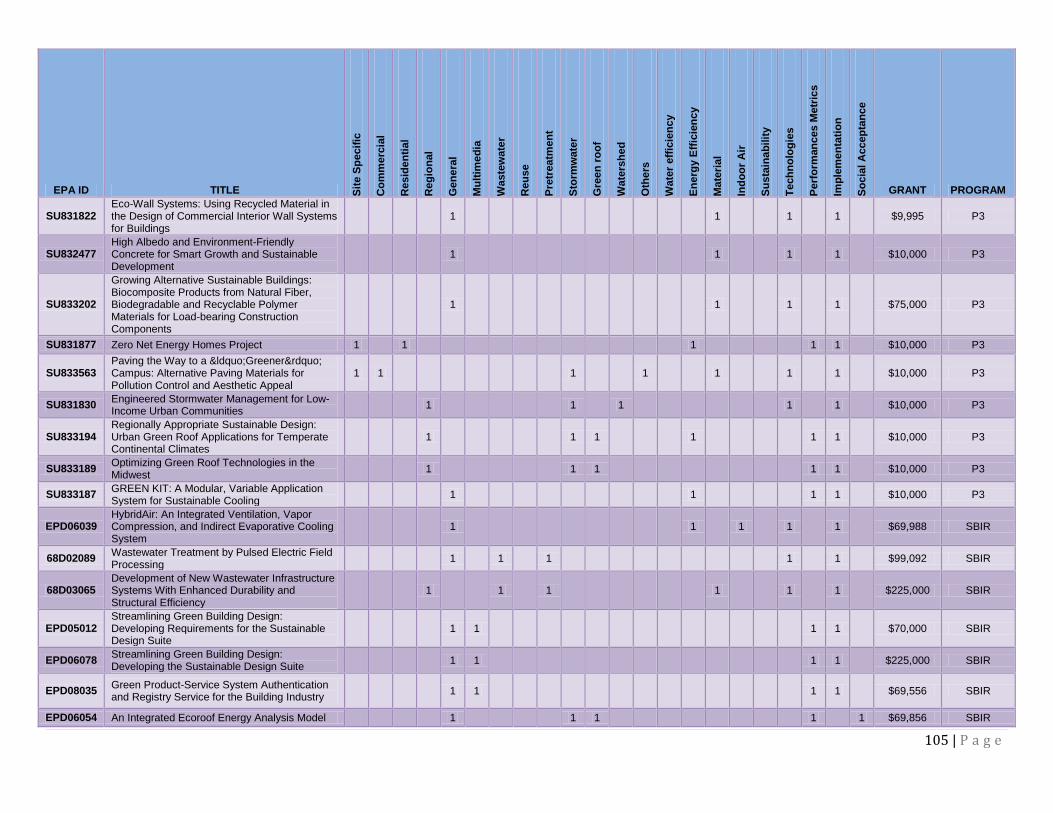
105 | P a g e
EPA ID TITLE Sit
e S
pe
cif
ic
Co
mm
erc
ial
Resid
en
tial
Reg
ion
al
Gen
era
l
Mu
ltim
ed
ia
Waste
wate
r
Reu
se
Pre
treatm
en
t
Sto
rmw
ate
r
Gre
en
ro
of
Wate
rsh
ed
Oth
ers
Wate
r eff
icie
nc
y
En
erg
y E
ffic
ien
cy
Ma
teri
al
Ind
oo
r A
ir
Su
sta
ina
bilit
y
Te
ch
no
log
ies
Perf
orm
an
ces M
etr
ics
Imp
lem
en
tati
on
So
cia
l A
ccep
tan
ce
GRANT PROGRAM
SU831822 Eco-Wall Systems: Using Recycled Material in the Design of Commercial Interior Wall Systems for Buildings
1
1
1
1
$9,995 P3
SU832477 High Albedo and Environment-Friendly Concrete for Smart Growth and Sustainable Development
1
1
1
1
$10,000 P3
SU833202
Growing Alternative Sustainable Buildings: Biocomposite Products from Natural Fiber, Biodegradable and Recyclable Polymer Materials for Load-bearing Construction Components
1
1
1
1
$75,000 P3
SU831877 Zero Net Energy Homes Project 1
1
1
1 1
$10,000 P3
SU833563 Paving the Way to a “Greener” Campus: Alternative Paving Materials for Pollution Control and Aesthetic Appeal
1 1
1
1
1
1
1
$10,000 P3
SU831830 Engineered Stormwater Management for Low-Income Urban Communities
1
1
1
1
1
$10,000 P3
SU833194 Regionally Appropriate Sustainable Design: Urban Green Roof Applications for Temperate Continental Climates
1
1 1
1
1 1
$10,000 P3
SU833189 Optimizing Green Roof Technologies in the Midwest
1
1 1
1 1
$10,000 P3
SU833187 GREEN KIT: A Modular, Variable Application System for Sustainable Cooling
1
1
1 1
$10,000 P3
EPD06039 HybridAir: An Integrated Ventilation, Vapor Compression, and Indirect Evaporative Cooling System
1
1
1
1
1
$69,988 SBIR
68D02089 Wastewater Treatment by Pulsed Electric Field Processing
1
1
1
1
1
$99,092 SBIR
68D03065 Development of New Wastewater Infrastructure Systems With Enhanced Durability and Structural Efficiency
1
1
1
1
1
1
$225,000 SBIR
EPD05012 Streamlining Green Building Design: Developing Requirements for the Sustainable Design Suite
1 1
1 1
$70,000 SBIR
EPD06078 Streamlining Green Building Design: Developing the Sustainable Design Suite
1 1
1 1
$225,000 SBIR
EPD08035 Green Product-Service System Authentication and Registry Service for the Building Industry
1 1
1 1
$69,556 SBIR
EPD06054 An Integrated Ecoroof Energy Analysis Model
1
1 1
1
1 $69,856 SBIR
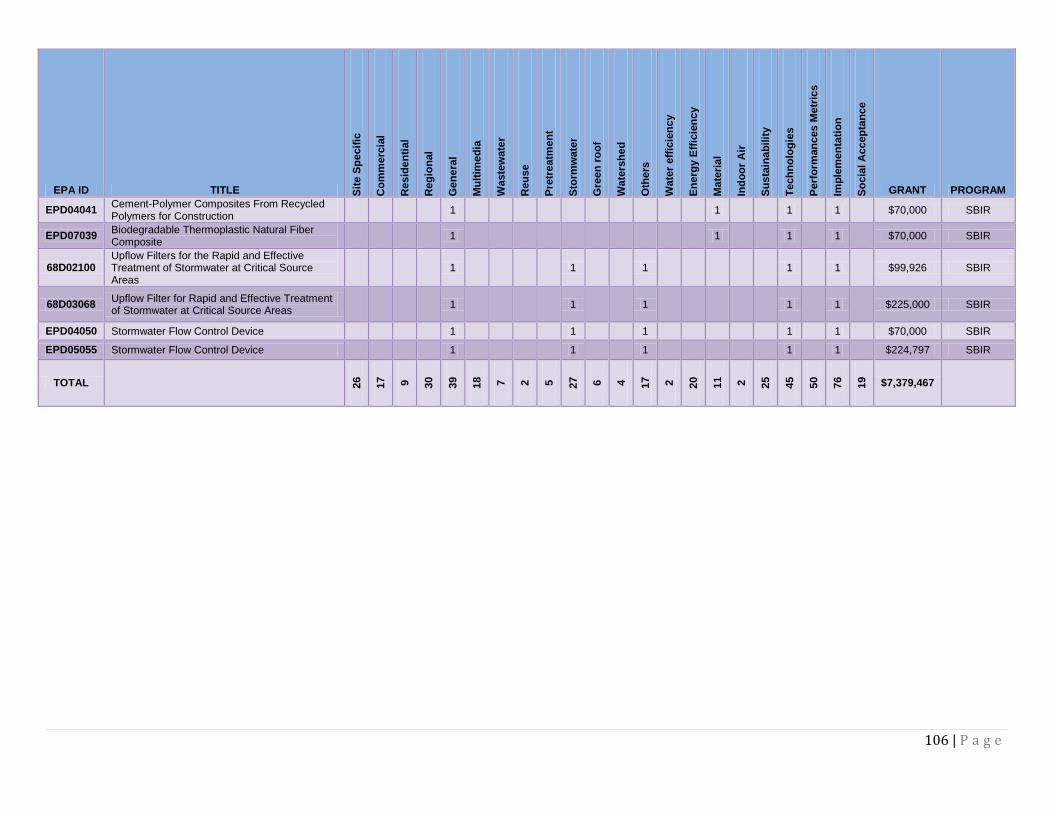
106 | P a g e
EPA ID TITLE Sit
e S
pe
cif
ic
Co
mm
erc
ial
Resid
en
tial
Reg
ion
al
Gen
era
l
Mu
ltim
ed
ia
Waste
wate
r
Reu
se
Pre
treatm
en
t
Sto
rmw
ate
r
Gre
en
ro
of
Wate
rsh
ed
Oth
ers
Wate
r eff
icie
nc
y
En
erg
y E
ffic
ien
cy
Ma
teri
al
Ind
oo
r A
ir
Su
sta
ina
bilit
y
Te
ch
no
log
ies
Perf
orm
an
ces M
etr
ics
Imp
lem
en
tati
on
So
cia
l A
ccep
tan
ce
GRANT PROGRAM
EPD04041 Cement-Polymer Composites From Recycled Polymers for Construction
1
1
1
1
$70,000 SBIR
EPD07039 Biodegradable Thermoplastic Natural Fiber Composite
1
1
1
1
$70,000 SBIR
68D02100 Upflow Filters for the Rapid and Effective Treatment of Stormwater at Critical Source Areas
1
1
1
1
1
$99,926 SBIR
68D03068 Upflow Filter for Rapid and Effective Treatment of Stormwater at Critical Source Areas
1
1
1
1
1
$225,000 SBIR
EPD04050 Stormwater Flow Control Device
1
1
1
1
1
$70,000 SBIR
EPD05055 Stormwater Flow Control Device
1
1
1
1
1
$224,797 SBIR
TOTAL 2
6
17
9
30
39
18
7
2
5
27
6
4
17
2
20
11
2
25
45
50
76
19
$7,379,467
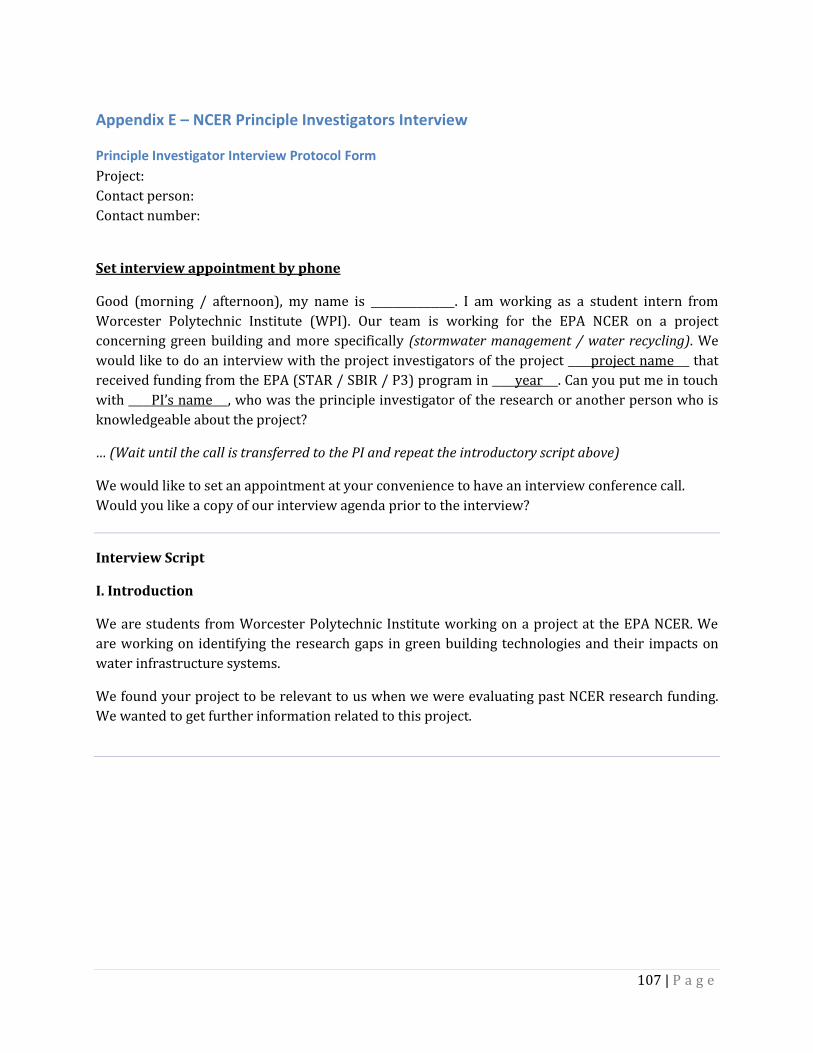
107 | P a g e
Appendix E – NCER Principle Investigators Interview
Principle Investigator Interview Protocol Form
Project:
Contact person:
Contact number:
Set interview appointment by phone
Good (morning / afternoon), my name is ___________. I am working as a student intern from
Worcester Polytechnic Institute (WPI). Our team is working for the EPA NCER on a project
concerning green building and more specifically (stormwater management / water recycling). We
would like to do an interview with the project investigators of the project ___project name__ that
received funding from the EPA (STAR / SBIR / P3) program in ___year__. Can you put me in touch
with ___PI’s name__, who was the principle investigator of the research or another person who is
knowledgeable about the project?
… (Wait until the call is transferred to the PI and repeat the introductory script above)
We would like to set an appointment at your convenience to have an interview conference call.
Would you like a copy of our interview agenda prior to the interview?
Interview Script
I. Introduction
We are students from Worcester Polytechnic Institute working on a project at the EPA NCER. We
are working on identifying the research gaps in green building technologies and their impacts on
water infrastructure systems.
We found your project to be relevant to us when we were evaluating past NCER research funding.
We wanted to get further information related to this project.
108 | P a g e
II. Questions
Preliminary
1. Could you tell us more about your project and why did you see a need for your project?
2. Could you tell us about the most interesting lessons and surprising results about your
project?
3. How does the regulatory climate affect your project?
Technology
4. How does it tie in with green building and/or water infrastructure systems?
5. What were the technology needs and information gaps that were uncovered by your
research result?
Implementation
6. Did you consider commercialization for your research result? If so, how would you envision
your product in the market and the challenges it would face? Who would be your primary
customers?.
7. Where has your research result been applied? What is the current scale of implementation
of your technology? What are the barriers for expansion?
Future Focus
8. What furthered work has you inspired?
9. Do you have current project ideas related to green building that need funding?
10. Where should future green building research focus, both in your area and more broadly?
Funding
11. Did you receive funding from other sources for related work?
Additional questions if applicable
12. Did you modify your research objectives to respond to the EPA solicitation? Would you do
the research differently?
13. Do you have any further suggestions for the EPA?
III. Call-Ending
We appreciate you taking your time to complete this interview with us. I’m sure that this
information will prove itself to be useful in our final report. We will follow up with you, and send
our interview meeting minutes within the next couple of days. Can we contact you with follow up
questions, if needed? Thanks again!!
109 | P a g e
P3 - High Albedo and Environment-Friendly Concrete
Project: High Albedo and Environment-Friendly Concrete for Smart Growth
and Sustainable Development
Institution Period EPA ID Grant
Ohio Northern University October 2005 – September 2006 SU832477 $10,000
Why we chose this project:
This project describes an external factor not inside building, i.e. high albedo as material for
sustainability. Through interview this project, we are seeking to understand about the impacts
between green building and the surrounding impervious surfaces. This is one of very few material
projects related to green building.
Principle Investigators: Dr. Reza Farhad
Interview
1. Could you tell us more about your project and why did you see a need for your project?
There is a lot of surface area covered by pavement. Traditional pavement can cause the heat island
effect, where the pavement absorbs solar energy, causing the surroundings to increase in
temperature. This decreases the air quality and poses human health risks.
2. Could you tell us about the most interesting lessons and surprising results about your project?
Fly ash is less effective at solar reflection, even though the material is lighter in color. Professor
Farhad expected the opposite to be true, where fly ash would be an effective material for solar
reflection. However, slag turned out to be a better material, which is what Professor Farhad and his
team recommended at the end of their research.
3. How does the regulatory climate affect your project?
There was concern for the pavement materials leeching offsite, becoming a potential environmental
concern. There is still research needed to discover any possible detriments to the surrounding
areas from using these materials. The government also has limits on the amount of slag/fly ash
contained in cement mixtures. This material is impervious and will still cause stormwater runoff.
4. How does it tie in with green building and/or water infrastructure systems?
This particular mixture is still in the development stage but it could be used in a green building.
LEED gives points for using these materials because they reduce the urban heat island effect.
5. What were the technology needs and information gaps that were uncovered by your research result?
110 | P a g e
Further development and implementation of green technologies is needed. More research is needed
to determine if any leeching will occur with the cement mixtures and also what amount of slag/fly
ash should be the new limit for regulatory concerns.
6. Did you consider commercialization for your research result? If so, how would you envision your product in the market and the challenges it would face? Who would be your primary customers?
Commercialization was envisioned but the product is still in the research and development stages.
The private sector would be more willing to accept this technology because the material costs less
and will reduce energy consumption of the property. The public sector faces more difficulties such
as highways because the material must be proven safe and effective so more research is necessary.
7. Where has your research result been applied? What is the current scale of implementation of your technology? What are the barriers for expansion?
This technology is still in the development stages, therefore this particular mixture of materials is
not in use. There are significant barriers, the first being insufficient research. There are regulations
that limit the amount of slag/fly ash that can be used at a site without justification for limiting these
new technologies.
8. Do you have current project ideas related to green building that need funding?
Not at this time.
9. Where should future green building research focus, both in your area and more broadly?
Reducing the cement consumption is good for everyone and the environment. More broadly,
alternative energy such as wind and solar energy should be more researched.
10. Did you receive funding from other sources for related work?
No, the Phase II of this project was also not funded. Phase II would have dealt with implementation,
one question was ‘does this more reflective and lighter concrete affect driver performance? And
how does the concrete hold up under different conditions as well long term use?’
11. Did you modify your research objectives to respond to the EPA solicitation? Would you do the research differently?
This was a P3 project. We came up with the idea and applied for the funding.
12. Do you have any further suggestions for the EPA?
EPA should focus more on cement because fly ash/slag is a recycled material and will minimize new
material consumption. Research and development of alternative energy sources, including wind
and solar is also necessary. Future research should also focus on improving the existing
technologies such as compressed natural gas.
111 | P a g e
P3 - Optimizing Green Roof Technologies in the Midwest
Project: Optimizing Green Roof Technologies in the Midwest
Institution Period EPA ID Grant
Southern Illinois University
Edwardsville
September 2006 - May 2007 SU833189 $10,000
Principle Investigators: Dr. William Retzlaff (618) 650-2728 [email protected]
Dr. Susan Morgan
Interview
November 19, 2008 @ 3:15PM EST
1. Could you tell us more about your project? Why did you see a need for your project?
In 2004, there was a local commercial manufacturing company working on green roof named Green
Roof Block. They wanted to evaluate the environmental & material benefits of green roof. About 65
to 80 students have worked on green roof research at the school. The retention rate of rain water
on the green roofs is 20-25% in winter and 80% in summer. No heavy metal found in the
downstream. The level of nitrates decreases over time as plants develop.
2. Could you tell us about the most interesting lessons and surprising results about your project?
During period of low rainfall, the green roof achieved 80% retention. During dry season with little
rain, the plants still grow.
3. How does the regulatory climate affect your project?
Only 14 students are allowed to be on the roof at one time for safety purpose. Otherwise, there are
no policies that affected the project.
4. How does it tie in with green building and/or water infrastructure systems?
Omitted
5. What were the technology needs and information gaps that were uncovered by your research result?
Different organic and inorganic medium in Germany were tried but cannot be applied with local
climate. Different species of plants were tried. Some work, some don’t. Each are is different
requiring different types of plant (Dr. Retzlaff and Dr. Morgan recommend a mixture of plants). The
biggest selling point is thermal benefit to building. It reduces heating and cooling cost. Data can be
found on the website www.green-siue.com
6. Did you consider commercialization for your research result? If so, how would you envision your product in the market and the challenges it would face? Who would be your primary customers?
112 | P a g e
There are 9 commercialized installation of green roof in the areas. Green roof is promoted by Green
roof for Healthy cities of which Dr. Retzlaff is the Vice-President.
7. Where has your research result been applied? What is the current scale of implementation of your technology? What are the barriers for expansion?
It usually requires higher cost for existing building. However, operation benefits can pay off over
time. If a new building goes over cost, the green roof is the first thing to be cut.
8. Do you have current project ideas related to green building that need funding?
We are in the process of making a proposal for a green wall research to retain stormwater and
heating. University of Texas also has a green roof project. Largest green roof research centers in the
nation are Penn. State, Michigan, University of Texas, and North Carolina.
9. Where should future green building research focus, both in your area and more broadly?
Besides green roof, future research should integrate other stormwater management practices.
10. Did you receive funding from other sources for related work?
Donations and funding from industry partners Look at Michigan State Research for Green roof and
Retention Pond.
11. Did you modify your research objectives to respond to the EPA solicitation? Would you do the research differently?
Omitted
12. Do you have any further suggestions for the EPA?
The EPA should fund more for green roof research.
113 | P a g e
P3 - Permeable Parking
Project: Permeable Parking: A Green Approach to Managing Water Runoff at
the University of St. Francis
Institution Period EPA ID Grant
University of St. Francis August 2008 – August 2009 SU833940 $10,000
Principle Investigators: Dr. Salim Diab (815) 740-3855 [email protected]
Interview
November 18, 2008 @ 3:15PM EST
1. Could you tell us more about your project? Why did you see a need for your project?
There has been a 5 year old movement for making the campus green named “Greening of Campus”
with 9 projects on green roofs and recycling initiatives. In the past three years, the school’s
recycling has increased to 27 percent of its waste. It started with a grant from Illinois State and this
project was an off shoot from this movement and the school’s philosophy and mission of
environmental stewardship.
2. Could you tell us about the most interesting lessons and surprising results about your project?
The project just recently started so there are no results yet. They anticipate a bit of an issue with
getting a good representative sample of cars for their parking lot in order to have good data.
3. How does the regulatory climate affect your project?
So far no regulations have really affected their projects
4. How does it tie in with green building and/or water infrastructure systems?
Omitted
5. What were the technology needs and information gaps that were uncovered by your research result?
None so far as the project is still in the beginning stages
6. Did you consider commercialization for your research result? If so, how would you envision your product in the market and the challenges it would face? Who would be your primary customers?
If the results are sound and innovative, they do consider commercializing, especially if there is as
large number of pollutants as they expect going into sewers from runoff. However, the project just
started so they have not fully thought about commercialization of results.
114 | P a g e
7. What areas could your research results be applied? What are the barriers for expansion?
According to Matt D., who is the student leader of the research project, the results could be applied
anywhere where pavements are used, especially with the new developments arising in their area.
One of the barriers they might face in expansion might be that the permeable pavements may be
more expensive than regular pavements.
8. Do you have current project ideas related to green building that need funding?
Not right now
9. Where should future green building research focus, both in your area and more broadly?
No information
10. Did you receive funding from other sources for related work?
They have received some grants from Illinois State, the university as well as City of Julian.
11. Did you modify your research objectives to respond to the EPA solicitation? Would you do the research differently?
Omitted
12. Do you have any further suggestions for the EPA?
EPA should provide more funding for green roof research.
115 | P a g e
P3 - EVALUATING ecoMOD
Project: EVALUATING ecoMOD: Building Performance Monitoring and Post-
Occupancy Evaluation of an Ecological, Modular House.
Institution Period EPA ID Grant
Auburn University Main
Campus.
August 2007-March 2008 SU833566 $10,000
Principle Investigators: John Quale (434) 924-6450
Interview
1. Could you tell us more about your project and why did you see a need for your project?
In 2002 he participated in the Solar Competition sponsored by the DOE. However, some of the ideas
were unrealistic and he wanted to work more with affordable housing. The monitoring of the house
consists of temperature, humidity, air quality, and energy and water use.
2. Could you tell us about the most interesting lessons and surprising results about your
project?
Evaulation is an area where you cant learn from others because there is no significant work done in
this area. There are no real world practices. LEED does fully require post-occupancy monitoring.
3. Affordable housing agencies are interested in sustainable housing.
How does the regulatory climate affect your project?
4. There needs to be more incentives, either through taxes or municipalities speeding the
process up.
5. How does it tie in with green building and/or water infrastructure systems?
N/A
6. What were the technology needs and information gaps that were uncovered by your
research result?
Software tools that integrate into BIN that are useful. This would allow designers, architects,
engineers, etc. to find the integrated energy factors. There needs to be greater agreement about life
cycle
7. Did you consider commercialization for your research result? If so, how would you envision
your product in the market and the challenges it would face? Who would be your primary
customers?
116 | P a g e
Customers are low budget homeseekers. A company did licence it about 2 years ago but little has
happened since then. Similar to car industry, the modular industry needs to be pushed forward.
8. Where has your research result been applied? What is the current scale of implementation
of your technology? What are the barriers for expansion?
9. What furthered work has you inspired?
Zero energy affordable homes are his long term goal.
10. Do you have current project ideas related to green building that need funding?
He is currently working on the design of his forth project.
11. Where should future green building research focus, both in your area and more broadly?
The development of zero energy affordable homes and then evaluating the performance of these
buildings
12. Did you receive funding from other sources for related work?
Yes, around 1.6 million dollars worth of funding from local, regional, and national partners.
Companies are willing to help the cause because they are helping students and putting their
product into a future use.
13. Did you modify your research objectives to respond to the EPA solicitation? Would you do
the research differently?
It is an openended solicitation but the guidelines are ponderious. There seems to be so many
guidelines that the judges are overwealmed when it comes to ranking the final product in the
competition.
14. Do you have any further suggestions for the EPA?
The built environment is where impacts can be made. There needs to be significant more dollars
into these existing structures.
117 | P a g e
P3 – The DELTA Smart House
Project: The DELTA Smart House: Cross-Disciplinary Projects within the
Design Framework of Sustainable Construction
Institution Period EPA ID Grant
Maine Department of Inland
Fisheries and Wildlife
R833345 $249,919
Principle Investigators: Jim Gaston (919) 660-5501
Interview
1. Could you tell us more about your project and why did you see a need for your project?
Project idea began with an undergrad electrical engineering senior. After graduation the student
stayed and formed a student team to design and develop the smart house. Currently 10 students
live in this on campus residence.
2. Could you tell us about the most interesting lessons and surprising results about your
project?
Interesting thing is that this is a student initiative and student run project. The construction
completed by contractors was the only outside help the students received.
3. How does the regulatory climate affect your project?
City and college regulations and requirements had to be followed. When a design issue came up
they went with whatever it took to achieve a LEED platinum score, which was awarded in the
summer of 2008.
4. How does it tie in with green building and/or water infrastructure systems?
This is a green building that monitors its energy and soon to be water usage.
5. What were the technology needs and information gaps that were uncovered by your
research result?
This house is essentially a living laboratory rather than a house. It has features such as removable
wall paneling giving easy access to managing the technology.
6. Did you consider commercialization for your research result? If so, how would you envision
your product in the market and the challenges it would face? Who would be your primary
customers?
They have only recently even moved into the house. They are still learning and refining the
technologies used within the house.
118 | P a g e
7. Where has your research result been applied? What is the current scale of implementation
of your technology? What are the barriers for expansion?
N/A
8. What furthered work has you inspired?
This work is ongoing to improve the efficiency in the house.
9. Do you have current project ideas related to green building that need funding?
Only the continuation of improving the smart house
10. Where should future green building research focus, both in your area and more broadly?
Sustainable technologies.
11. Did you receive funding from other sources for related work?
Home Depot gave materials and funding to the project. Unknown if there were other contributors.
12. Did you modify your research objectives to respond to the EPA solicitation? Would you do
the research differently?
Nope, P3 open solicitation.
13. Do you have any further suggestions for the EPA?
Nope
119 | P a g e
P3 - Place-Based Green Building
Project: Place-Based Green Building: Integrating Local Environmental and
Planning Analysis into Green Building Guidelines
Institution Period EPA ID Grant
Auburn University Main
Campus.
August 2007-March 2008 SU833566 $10,000
Principle Investigators: Retzlaff Rebecca
Interview
1. Could you tell us more about your project and why did you see a need for your project?
The project is about determining the best green technologies and approaches to use in specific
areas. For example it makes sense for a building to be pedestrian friendly in urban areas. There is a
need for this because there are flaws with the LEED rating system where developers will often take
the cheap way out so they can get the points and not make functionality their top priority.
2. Could you tell us about the most interesting lessons and surprising results about your
project?
This topic is far more complicated than originally thought to be. There is a lack of data for
developing strong recommendations.
3. How does the regulatory climate affect your project?
There really weren’t any regulation problems.
4. How does it tie in with green building and/or water infrastructure systems?
This is about building a green building that will maximize their environmental surroundings.
5. What were the technology needs and information gaps that were uncovered by your
research result?
6. Did you consider commercialization for your research result? If so, how would you envision
your product in the market and the challenges it would face? Who would be your primary
customers?
7. Where has your research result been applied? What is the current scale of implementation
of your technology? What are the barriers for expansion?
Cities, states and people who are not using LEED systems are potentially benefited from the
research result.
120 | P a g e
8. Do you have current project ideas related to green building that need funding?
Still working on this topic of green location.
9. Where should future green building research focus, both in your area and more broadly?
Need more funding in this area
10. Did you receive funding from other sources for related work?
NOAA, they also sought USGBC funding but did not receive.
11. Did you modify your research objectives to respond to the EPA solicitation? Would you do
the research differently?
No
12. Do you have any further suggestions for the EPA?
The EPA should fund more research in the social science area. Past grants were focusing on
engineering research which makes it very hard for social research to receive funding. There needs
to be more focus on policy and making buildings more locally adoptable.
121 | P a g e
SBIR - An Integrated Ecoroof Energy Analysis Model
Project: An Integrated Ecoroof Energy Analysis Model
Institution Period EPA ID Grant
Quantec LLC. August 2008 – August 2009 EPD06054 $69,856
Principle Investigators: Mr. Allen Lee (503) 228 2992 [email protected]
Interview
November 20, 2008 @ 12:00PM EST
1. Could you tell us more about your project and why did you see a need for your project?
Lee Allen has been involved in green building projects in the past, several dealing with reducing
energy consumption. There is an effort to get new construction to be at least LEED certified.
However, there is little empirical data and it has not been fully analyzed.
2. Could you tell us about the most interesting lessons and surprising results about your project?
The energy saving estimates was better than expected. There is noticeable heating savings.
3. How does the regulatory climate affect your project?
N/A
4. How does it tie in with green building and/or water infrastructure systems?
The project provides empirical data and understanding of the roof characteristics.
5. What were the technology needs and information gaps that were uncovered by your research result?
There needs to be more research into validation of the high energy savings proposed by having a
green roof. There needs to be more research into finding the best materials and growth media to
use. The stormwater quality is also another area that needs further testing and research.
6. Did you consider commercialization for your research result? If so, how would you envision your product in the market and the challenges it would face? Who would be your primary customers?
These results were used in a DOE Energy Plus Program, which runs simulations on green roofs
7. Where has your research result been applied? What is the current scale of implementation of your technology? What are the barriers for expansion?
The technology is used within the area but unknown how far it expanded. Needs more research to
be implemented.
8. Do you have current project ideas related to green building that need funding?
122 | P a g e
This project did not get Phase II, which would have dealt more with evaluating the energy savings
claims and implementation of the technology.
9. Where should future green building research focus, both in your area and more broadly?
Green roof lifespan, indoor air quality, what to do with existing buildings to make them more green,
discover whether the systems in the building are performing correctly, ensure the building is
performing as was designed, residential green roofs.
10. Did you receive funding from other sources for related work?
No
11. Did you modify your research objectives to respond to the EPA solicitation? Would you do the research differently?
Omitted
12. Do you have any further suggestions for the EPA?
EPA should provide more funding.
123 | P a g e
CNS - Smart growth planning to minimize degradation of water quality
Project: Mapping Regional Development for Smart Growth Planning to
Minimize Degradation of Water Quality and Enhance Green
Infrastructure
Institution Period EPA ID Grant
Maine Department of Inland
Fisheries and Wildlife
R833345 $249,919
Principle Investigators: Dr. Donald Katnik (207) 941 4455 [email protected]
Dr. Steve Walker
Interview
November 20, 2008 @ 3:00PM EST
1. Could you tell us more about your project? Why did you see a need for your project?
This project is intended to guide the community and avoid urban development fragmentation. The
result provides town planners with information about natural resources for new development.
There is lack of large scale geographic data. The project also forecast future development from
historical data.
2. Could you tell us about the most interesting lessons and surprising results about your project?
This is still in early stage. No surprising result has been identified yet.
3. How does the regulatory climate affect your project?
It’s bureaucratic and slow to be able to apply and use federal money at state system level. It
generally took 4 months for federal agency to approve contract.
4. How does it tie in with green building and/or water infrastructure systems?
The project aims at managing natural resource efficiently, stormwater runoff effectively. It also tries
to preserve the environment and the quality of drinking water.
5. What were the technology needs and information gaps that were uncovered by your research result?
The geographic data is expansive regarding the total budget of the project.
6. Did you consider commercialization for your research result? If so, how would you envision your product in the market and the challenges it would face? Who would be your primary customers?
Other state can easily adopt and are recommended to use the technology and result.
124 | P a g e
7. Where has your research result been applied? What is the current scale of implementation of your technology? What are the barriers for expansion?
How to maximize collaboration and get everybody involved. Working with large amount of
geographic imaginary data can take a lot of time without enough personnel.
8. Do you have current project ideas related to green building that need funding?
Focus on current project.
9. Where should future green building research focus, both in your area and more broadly?
Technology is often not an issue itself. It just has been used in the wrong place. Need research on
hidden cost rather than just initial tax and cost to make it more apparent to home users and
planners for decision-making.
10. Did you receive funding from other sources for related work?
No, without EPA funding the project wouldn’t have happened
11. Did you modify your research objectives to respond to the EPA solicitation? Would you do the research differently?
Omitted
12. Do you have any further suggestions for the EPA?
None
125 | P a g e
CNS - Multi-Objective Decision Model for Urban Water Use
Project: Multi-Objective Decision Model for Urban Water Use: Planning for a
Regional Water Reuse Ordinance
Institution Period EPA ID Grant
Maine Department of Inland
Fisheries and Wildlife
R833345 $249,919
Principle Investigators: Jeffery A. Wickenkamp
Interview
1. Could you tell us more about your project and why did you see a need for your project?
To provide technology transfer and knowledge to bring it further to the attention of the parties in
the region.
2. Could you tell us about the most interesting lessons and surprising results about your
project?
It is not confined in any individual or particular building. It is for retrofitting home neighborhood or
city in a large scale working with a specialized treatment system. Some people think there is a
cheaper way to do it. It is expensive because it involves piping and municipal systems. We are
trying to identify the actual driver factor affecting the water reuse project.
3. How does the regulatory climate affect your project?
There isn’t any regulation at the state level on industrial side. On irrigation side, we haven’t looked
much into. There is a regulatory gap for water discharge involving NPDES (National Pollution
Discharge Elimination System) which are permit given to industrial and municipal discharge
defining in Clean Water Act. State has also other system Slow Rate Land Application requires to put
all the water into land and open space. The issue is there is nothing for water reuse. It would be
helpful to have some guidelines.
4. How does it tie in with green building and/or water infrastructure systems?
5. What were the technology needs and information gaps that were uncovered by your
research result?
There is problem with satellite reuse by tapping into sewage to treat it onsite instead of
redistribution. Membrane technology is becoming cheaper which is potential.
6. Did you consider commercialization for your research result? If so, how would you envision
your product in the market and the challenges it would face? Who would be your primary
customers?
7. Where has your research result been applied? What is the current scale of implementation of your technology? What are the barriers for expansion?
126 | P a g e
8. Do you have current project ideas related to green building that need funding?
Other planning projects related to green building: water supply project on the region. We are try to
estimate water demand and identify different possible water site. These projects are connected
with each other.
9. Where should future green building research focus, both in your area and more broadly?
10. Did you receive funding from other sources for related work?
11. Did you modify your research objectives to respond to the EPA solicitation? Would you do
the research differently?
12. Do you have any further suggestions for the EPA?
127 | P a g e
Principle Investigators: Paul Anderson
Interview
1. Could you tell us more about your project and why did you see a need for your project?
Illinois is running out of water.
2. Could you tell us about the most interesting lessons and surprising results about your
project?
Water reuse is expensive to implement in urban area. There is resistance to change from the
industries about water reuse because there are unknown risks associated with new methods even
though it helps them saving money.
3. How does the regulatory climate affect your project?
The federal government has no water reuse regulation. They handle to the state to deal with while
state of Illinois has little experience and hesitates to act because they don’t know any hazardous
problem related with water reuse.
4. How does it tie in with green building and/or water infrastructure systems?
5. What were the technology needs and information gaps that were uncovered by your
research result?
Technology is not a problem: the technology exists; just the cost of implementing them is the
problem.
6. Did you consider commercialization for your research result? If so, how would you envision
your product in the market and the challenges it would face? Who would be your primary
customers?
7. Where has your research result been applied? What is the current scale of implementation
of your technology? What are the barriers for expansion?
Not yet to be applied. It could be applied to water reuse in the city of Chicago: Metropolitan Water
Reclamation District of Greater Chicago (MWRDGC), Chicago Metropolitan Agency for Planning
(CMAP). The research could be applied to other cities in the area around Great Lakes such as
Indiana.
8. Do you have current project ideas related to green building that need funding?
There is a project on development on wastewater treatment using satellite membrane reactors for
water reuse on-site instead of extending a secondary distribution system of pipelines for
wastewater treatment plants
128 | P a g e
9. Where should future green building research focus, both in your area and more broadly?
Barrier of wastewater reuse: cost. There is no incentive to use water efficiently due to low cost of
water. Problems related to water quality issues.
10. Did you receive funding from other sources for related work?
This is a collaboration project of 3 different agencies: Department of Economic Development in
Illinois, Waste management research
11. Did you modify your research objectives to respond to the EPA solicitation? Would you do
the research differently?
Fit in the solicitation. Just a little change about the place running out of water is not exactly in the
Chicago.
12. Do you have any further suggestions for the EPA?
Because of the expensive cost of putting in a secondary distribution system, we are looking at some
other values of. Hybrid system to treat wastewater and water also serves as a heat transfer
medium.
129 | P a g e
Appendix F – EPA Offices Interviews
Office of Wetlands, Oceans and Watersheds
Interviewees Ms. Abby Hall, Mr. Jamal Kadri
NCER attendants Dr. Diana Bauer, Ms. April Richards
WPI attendants Adam Brooks (Secretary), Manh-Hung Le (Chair), Brian Robie, Fidelis
Wambui
Topic Water infrastructure and stormwater management
Interviewees Background
Ms. Abby Hall U.S. EPA, Office of Wetlands, Oceans and Watersheds
Mr. Jamal Kadri U.S. EPA, Office of Wetlands, Oceans and Watersheds
Thursday, October 30, 2008 @ 15:00
EPA Ronald Reagan Building, 1424 EPA West
Discussion
Terms
CSO- Combined Sewer Overflow
MS4- Municipal Separate Storm Sewer System
IRE- Infiltration Reuse and Evapotransporation
Three scales: Watershed, Neighborhood, and Site
Watershed: Most efficient to build in compact areas
Neighborhood: Focus on street size, organization, and accessibility. USGBC is developing the
program LEED-ND to promote green building of neighborhoods
Site: Implemented technologies and efficiency of buildings
Examples of management systems and practices:
General public disbelief about capabilities of newly developed systems to deal with water
volume
Common practices to manage stormwater are: green roof, rain garden, offline storage, and
bedrock tunnel
“Green into grey fabric” ~ Abby
There are cases where it would be more cost effective to buy and/or construct water
management systems for point sources than to upgrade the existing sewer system or CSO
Realistic goal would not be to completely replace the sewer system but to implement
management systems that control the smaller (under one inch) storms and have a back-up
of the municipal sewer system
130 | P a g e
Suggested interview with Steve Saari from Watershed department in the DDOE (District
Department of the Environment) ([email protected])
Suggested talking to landscape architects as well.
ASLA has data on effects of seasons on green roofs effectiveness in managing stormwater.
Project DX? – Example: If a city building cannot incorporate stormwater management they
can donate money to an area outside the city of equal value in terms of impact.
Melissa Keeley has some data on stormwater management
Areas that need most attention
Further research into methods for implementation of management systems
Simple instructions and regulations need to be developed for the design and construction of
various systems
Lack of data to prove the effectiveness of green roof in urban areas. In many places,
engineers and local government still rely on the traditional tunnel method rather than using
new practices.
Need to build social confidence in green water technologies.
Already developed systems need to be simplified
Incentives need to be given for implementation of management systems such as tax
incentives and cost for the government to manage stormwater.
Political regulation is one of the biggest barriers for implementing green building practices
Stormwater practices often need constant maintenance and monitoring (In Chicago, the
government implemented green alley practices however there was a lack of maintenance
planning)
There is no incentive for people to reuse and recycle water because it is cheap and readily
available.
131 | P a g e
NCER Director - Dr. William Sanders
Interviewees Dr. William Sanders
NCER attendants Dr. Diana Bauer, Ms. April Richards
WPI attendants Adam Brooks (Secretary), Manh-Hung Le (Chair), Brian Robie, Fidelis
Wambui
Topic Green Building Research Strategy
Interviewees Background
Dr. William Sanders U.S. EPA, Head of NCER
Tuesday, November 4, 2008 @ 11:30 AM
Discussion
We introduced our project to Dr. Sanders whereupon he gave us some of his ideas.
Dr. Sanders informed us there are approximately 80 green building projects sponsored by NCER
Dr. Sanders informed us of several green communities: Portland, Chicago
One of the biggest obstacles is getting people to do the “green” thing. Citizens need to be bribed into
going green. People do not want to pay a premium for going green.
Dr. Sanders mentioned there are several P3 projects that deal with real time updating of water and
energy use within a system.
We asked Dr. Sanders several relevant questions.
1. What do you think is the current gaps with green building technologies? Which areas are
underdeveloped?
Dr. Sanders mentioned that one of the biggest gaps with current green buildings is with
developing metrics. We need to know what a constructed building is doing after construction.
We need quantitative data.
Commissioning of a building would ensure people are using the building correctly.
Occupancy Surveys would ensure satisfaction of users
2. Our project is related to green building impacts to water infrastructure systems such as
wastewater recycling and stormwater management. We are trying to identify the research
gap to develop priorities for future research. Do you have any comments on this topic?
Materials research is an area that needs further research.
Water infrastructure is greatly influenced by location, making it a tricky subject.
Need to know how much water we use
Policies limit what can be implemented => waterless toilets
132 | P a g e
3. Green building research didn’t receive a large amount of funding, approximately 3% of total
EPA funding, relatively small compared to air pollution and other researches. Why there
was such a deficiency in funding despite the potential benefits of green building?
A green building strategy is only just now being developed.
Projects sponsored in the past had no category to fit in.
NCER wants to spend more money in the area of green buildings.
Many of the projects sponsored by NCER results in policy creation rather than a consumer
product. Policies would deal with regulating the existing contamination.
Roughly 25% of SBIR projects result in a commercialized product.
4. Do you suggest any agencies or organizations other than the EPA and the NCER we should
talk to?
Inter Agency Workgroup => GSA
Department of Energy
USDA
Department of Education
Department of Defense
Interview Source => Bob Thompson => has knowledge of indoor air quality and green building
Some country in the EU has quantitative data on waste and water infrastructure.
133 | P a g e
U.S. EPA, Office of Pollution Prevention and Toxics
U.S. EPA, Green Building Workgroup
Interviewees Ms. Alison Kinn, Mr. Ken Sandler
NCER attendants Dr. Diana Bauer, Ms. April Richards
WPI attendants Adam Brooks (Secretary), Manh-Hung Le (Chair), Brian Robie, Fidelis
Wambui
Topic Green building strategy and LEED rating system
Interviewees Background
Ms. Alison Kinn U.S. EPA, Office of Pollution Prevention
Mr. Ken Sandler U.S. EPA, Office of Research and Development
Co-Chair of EPA Green Building Workgroup
Member of USGBC Research Committee
Discussion
WPI intern team explained their project. Alison and Ken then gave an introduction into their offices.
Water foot printing => the water used to create a material needs to be accounted for.
There are 30 EPA building programs over the past 5 years.
ASTM, ASHRAE
USGBC has received some funding from the EPA. Energy Star program gave money. LEED ND was
partly funded by green building at EPA
WPI intern team began asking questions in interview format.
1. Why are there more green buildings for the commercial sector than private or existing
buildings.
Easier market to affect
Difficult to get existing homeowners to change;
Big impacts come from commercial sector;
Architects are biggest proponents of green.
2. What is current status of promoting green building in homes sector.
Energy Star homes are 750,000 and increasing.
Difficult to do at local level “not user friendly”; need to get people educated, understand the long
term benefits that people usually don’t care about
Insurance companies interested in sustainability
Builders often do not get the benefit of building the more expensive green buildings. Needs to
be restructured
134 | P a g e
3. It seemed there is sufficient stormwater technology but lack of implementation, true or not?
There is a lot of information that is bad, wrong, tricky for installation.
Currently working on website with internal and external links for do it yourselfers
4. Downsides to LEED?
There are other competing systems.
There needs to be more of a minimal requirement to satisfy the EPA
Need more prerequisites
Points don’t always make sense – Ex. Building a bike rack gets points no matter what the
location of the building is.
Need to reevaluate buildings to ensure they are working correctly.
Region to region differences in LEED.
Being addressed slowly. 2009 version speaks about regional chapters of LEED.
Different points will carry more weight in different regions.
Different LEED direction with LEED ND
No, same direction more broad
Star Community Index
5. USGBC have common metrics? Problems facing data and measure of performance?
Need more focus on metrics and performance
LEED has been criticized for giving new buildings plaques when there is no follow-up. Need to
recertify.
Some sources show LEED buildings perform little better than a regular building.
6. Places outside EPA and USGBC to look at?
NIST, DOE, European Union countries, Green Dragon
7. Green building at its tipping point?
A lot of new interest.
New administration.
8. What areas of green building need more research?
Metrics, Life Cycle
Technology exists, make it cheap and affordable
Make it easier for homeowners to use and do
Material Infrastructure => reuse, recycle, separate
Indoor air => Ventilation systems, less toxic materials, certification
U.S. Drinking Water Research Program
Interviewees Dr. Audrey Levine
135 | P a g e
NCER attendants Dr. Diana Bauer, Ms. April Richards
WPI attendants Adam Brooks (Secretary), Manh-Hung Le (Chair), Brian Robie, Fidelis
Wambui
Topic Sustainable water infrastructure & drinking water program
Interviewees Background
Dr. Levine is an environmental engineer with extensive research experience in water quality, water
treatment and distribution systems, treatment technologies, and water reuse. Prior to joining the
EPA, she was a faculty member of the Department of Civil and Environmental Engineering at the
University of South Florida in Tampa. She is a Diplomat of Environmental Engineering (DEE) and a
registered professional engineer (P.E.). She has more than 20 years of broad-based, technical
experience within academic, government, industry, and consulting settings. She has a doctorate in
civil engineering from the University of California at Davis, and a master’s degree in Public Health
from Tulane University.
Terms:
Hydraulic Cycle: - Flow of water in the environment.
Water reuse, reclaimed/recycled water- not wastewater recycling
Discussion:
In California
o 10% of energy money is used for water transportation
o Its an extreme example due to little availability of water sources and the higher
energy efficiency in the state
We should think of water not as separated with different classes such as recycled,
grey/black water and stormwater, but rather have an integrated view and look at the whole
system and how its transported and used. Also think of the energy used in the water system
for transportation and such.
How are water pipes sized? Why the infrastructure is built the way it is?
o It was built in a way to provide enough water to put out a certain sized fire or a 2nd
storey building for a certain amount of time.
o Not built for other uses such as supporting population with drinking water
o Nowadays it is also sized for perceived demand.
Can you tell us more about the feasibility of on-site treatment and recycling of wastewater?
o It requires less transportation so less energy which makes more sense in terms of
efficiency.
o Phoenix, Arizona is using recycled water for a Plant since there is little availability of
water sources.
136 | P a g e
We know that the regulations for using recycled wastewater as potable water are strict and
even forbidden in some states. What level of regulation is necessary for the recycled water
used in irrigation and flushing toilets?
o There are no federal regulations for water recycling, the regulations are at state
level so each state has different regulations
o California and Florida recycle their water. Some of it is used in irrigating crops such
as citrus crops.
o There is also a lot of unplanned water reuse such as in the Mississippi River where
different cities use the water for drinking and then put back treated water back into
the river.
o The USGS has an inventory of how water is used in agriculture and other industries
which we should look up to determine water reuse statistics.
o The EPA Water Reuse Guidelines contains all the state regulations for water use
reuse which would be useful to our project.
The school said the treated wastewater is drinkable but the regulations do not allow it to be
consumed. What do you think about this issue regarding technology and ethics?
o One of the issues is that the Safe Drinking Water Act does not regulate the
pharmaceuticals contained in recycled water so part of the worry with state
governments is the concern of the chemicals that could be harmful to human health.
A problem we have identified is that the cost of water is too low, which creates little to no
incentive for people to reduce or recycle their water. How does the EPA plan to change this
perspective?
o The EPA cannot regulate prices of water
o Not much they can do other than educate people about the need to recycle water
How much funding had been allocated for water recycling research? Do you think this
amount of funding is sufficient?
o The amount is not sufficient.
o The EPA has to first and foremost deal with regulations meaning all their research
has to deal with what regulations are around and future regulations. Since there are
no regulations on water reuse, it is difficult to rally support and explain the need for
the research.
Where do you think future research should be focused regarding green building
technologies and water infrastructure?
Recommendations & Areas in Need
Where do you think future research should be focused regarding green building
technologies and water infrastructure?
o Think of water not as an afterthought when it comes to Green Building
o Use good quality water for drinking water
o But less quality water or recycled water for other uses such as irrigation,
bathrooms, etc…
o Perform mass balance analysis of water use to determine how much water is going
into a system and coming out
137 | P a g e
o Be more efficient when making water safe and be more energy aware with water
use/transportation/recycling/treatment
Come up with better ways to develop water infrastructure systems
o Have a small pipeline for drinking/portable water since less water is used for this
area
o Another pipeline for irrigation/fires/cleaning and such
We should have baseline regulations/standards for public health and water reuse/use
Need to look at how all groups work together- water recycling, stormwater management,
energy efficiency and others.
Research different countries, states and organizations to find out water reuse information
Japan, China, Namibia, Netherlands, Australia (have National Regulations on water reuse),
Florida, California, Arizona, Water Reuse Foundation, Water Environment
Federation(wef.org)
“It is best to keep water where it is and reuse it than to transport it and use energy.”
138 | P a g e
WaterSense
Interviewees Ms. Stephanie Tanner
NCER attendants Dr. Diana Bauer
WPI attendants Adam Brooks, Manh-Hung Le, Brian Robie, Fidelis Wambui
Topic WaterSense program and water efficiency
Interviewees Background
Dr. Levine is an environmental engineer with extensive research experience in water quality, water
treatment and distribution systems, treatment technologies, and water reuse. Prior to joining the
EPA, she was a faculty member of the Department of Civil and Environmental Engineering at the
University of South Florida in Tampa. She is a Diplomat of Environmental Engineering (DEE) and a
registered professional engineer (P.E.). She has more than 20 years of broad-based, technical
experience within academic, government, industry, and consulting settings. She has a doctorate in
civil engineering from the University of California at Davis, and a master’s degree in Public Health
from Tulane University.
Interview
1. What is your most supported implemented device?
Currently only two devices exist. Bathroom faucets as well as low flow toilets. Other devices such as
shower head and irrigations are in pilot stage.
2. What are the barriers to promoting your products?
Since WaterSense is voluntary, they have limited consumer outreach. They must rely on partners to
promote their product as well as public servie announcements. WaterSense can not pay for
announcements in advertising.
3. Is WaterSense looking into other water consuming devices, such as washing machines?
Currently they are working on 12 devices. Washing machines is not one of them because they are
covered under the sister program EnergyStar.
4. What do you think about water reuse and rain harvesting in relation with WaterSense?
There is no need for these areas to be reviewed because they are efficient by their nature. They do
not need a WaterSense label. There is no such thing as an inefficient rain barrel. WaterSense
concentrates on the efficiency performance of water devices, it is currently has no plan to go on
water reuse.
139 | P a g e
5. Are you planning to create product supporting water reuse?
Not inthe current future
6. What are the incentives for the residential market to push them to use less water?
There is no incentive really. WaterSense relies on advertisement by their supporters.
7. To what degree do you cooperate with the USGBC on LEED system?
This is an area that has been slowly developing. There is a need to analyze energy efficient devices
that use water for cooling because often that water use is not only extremely high but also becomes
contaminated. There are very few water efficiency points in the LEED rating system right now. The
LEED currently has not adopted the rating system of WaterSense yet due to lack of products on the
market. WaterSense is developing its own certificate for water efficiency.
8. You have some partners with contractors and water appliances manufacturers such as
Timothy Maloody and Kohler. What is the percentage of supporters in construction industry
with WaterSense products?
There is no way to get exact numbers. The numbers WaterSense receives come from the
manufactures on how many devices they ship to market. After only one year WaterSense products
had captured approximately 2% of the market.
9. It seems water availability is becoming or has become a prominent issue throughout several
areas of the US. Does WaterSense have any plans or ideas for these areas?
Seatle, Texas, and California are areas that need more effort.
10. What are the areas regarding green building technology (especially in water infrastructure)
that need more research?
There is no statistical data detailing the impacts of saving large amounts of water from a particular
building on the existing water infrastructure. There is research needed in “Pre Rinse Spray Valves”
which are typically found in restaurant kitchens to pre wash the dishes.
140 | P a g e
Appendix G - Regulatory for the NCER
Clean Air Act--Section 103.
Section 103 of the Clean Air Act authorizes the EPA to make grants to institutions for research,
investigations, experiments, demonstrations, surveys and studies relating to the causes, effects
(including health and welfare effects), extent, prevention and control of air pollution.
Federal Insecticide, Fungicide and Rodenticide Act--Section 20.
Section 20 of the Federal Insecticide, Fungicide and Rodenticide Act authorizes the EPA to make
grants for pesticide-related research, development, monitoring, public education, training,
demonstrations, and studies.
Solid Waste Disposal Act--Section 8001.
Section 8001 of the Solid Waste Disposal Act authorizes the EPA to make grants for research,
investigations, experiments, training, demonstrations, surveys, public education programs and
studies relating to: (1) adverse health and welfare effects from solid waste; (2) solid waste
management programs; (3) resource recovery and conservation, and hazardous waste
management systems; (4) production of usable forms of recovered resources; (5) waste reduction;
(6) improved solid waste collection and disposal methods; (7) identification of solid waste
components; (8) small scale and low technology solid waste management systems; (9) methods to
improve performance of recovered solid waste; (10) improvements in land disposal practices; (11)
methods for sound disposal of resources, including sludge and coal slurry; (12) methods of
hazardous waste management; and (13) air quality impacts from the burning of solid waste.
Clean Water Act--Section 104.
Section 104 of the Clean Water Act authorizes the EPA to make grants to institutions for research,
investigations, experiments, training, demonstrations, surveys and studies relating to the causes,
effects, extent, prevention, reduction, and elimination of water pollution.
Clean Water Act--Section 104 (freshwater ecosystems)
Section 104 of the Clean Water Act authorizes the EPA to make grants to colleges and universities
to conduct basic research into the structure and function of freshwater aquatic ecosystems and to
improve understanding of the ecological characteristics necessary to the maintenance of the
chemical, physical, and biological integrity of these systems.
Safe Drinking Water Act--Section 1442.
Section 1442 of the Safe Drinking Water Act authorizes the EPA to make grants for research,
training, studies, and demonstrations relating to the causes, diagnosis, treatment, control, and
prevention of physical and mental diseases and other impairments of man resulting directly or
indirectly from contaminants in water, or to the provision of a dependably safe supply of drinking
water, including (A) improved methods: (i) to identify and measure the existence of contaminants
in drinking water (including methods which may be used by State and local health and water
141 | P a g e
officials), and (ii) to identify the source of such contaminants; (B) improved methods to identify and
measure the health effects of contaminants in drinking water; (C) new methods of treating raw
water to prepare it for drinking, so as to improve the efficiency of water treatment and to remove
contaminants from water; (D) improved methods for providing a dependably safe supply of
drinking water, including improvements in water purification and distribution, and methods of
assessing the health related hazards of drinking water; and (E) improved methods of protecting
underground water sources of public water systems from contamination.
Toxic Substance Control Act--Section 10.
Section 10 of the Toxic Substance Control Act authorizes the EPA to make grants for research,
development, monitoring, public education, training, demonstrations and studies directed toward
the development of the fundamental scientific basis of screening and monitoring techniques used to
detect toxic chemical substances and quantify the effects of toxic chemical substances and mixtures
in the environment.