Embed Size (px)
Citation preview

Institute for Financial Management and Research:
Centre for Development Finance
Analysis of grazing exclusion policy through a climate change
mitigation lens:
Case from Barsey rhododendron sanctuary, West Sikkim
November 2011
Shweta Bhagwat
Manasi Diwan
Vivek V.
The paper is submitted to the Government of Sikkim for inclusion in the forthcoming book on
Climate Change aspects in Sikkim.
The views expressed in this note are entirely those of the authors and should not be
attributed to the Institutions with which the authors are associated.

1 Analysis of grazing exclusion policy through a climate change mitigation lens:
Case from Barsey rhododendron sanctuary, West Sikkim
IFMR-CDF
ABSTRACT
Forest ecosystems assume a significant role in climate change mitigation by the virtue of
being one of the largest terrestrial carbon sinks. In India, Sikkim is one of the most pro-active
states in leading the implementation of conservation policies and is recognised as a key
conservation hub. Sikkim adopted a grazing exclusion policy in 1998 owing to the escalating
anthropogenic pressure on the forest ecosystems and their consequent rapid degradation. This
provided a chance for the revival of the health of the forest ecosystems. The main focus of
this paper is to highlight the net positive impact on forest carbon stocks 12 years after the
introduction of grazing exclusion policy in the State of Sikkim. We develop this case based
on our field work in and around Barsey Rhododendron Sanctuary in the West District of
Sikkim. The paper develops this case by comparing two alternative scenarios: (i) Forest
carbon stocks in the absence of the grazing exclusion policy (ii) Forest carbon stocks with
implementation of the grazing exclusion policy. We carried out extensive field surveys using
FSI methodology for collecting vegetation data and conducted focused group discussions and
household surveys to understand the resource consumption pattern of the herder community
in the forests. The study adopted 1998 as the baseline year. The baseline growing stock was
estimated based on earlier FSI surveys while the current growing stock was developed based
on the current field work. The carbon losses were estimated based on resource consumption
patterns. Our estimates show that the difference between with and without policy intervention
scenarios amounts to about 585 thousand tonnes of carbon. Impact of this increase in
sequestered carbon is not limited to the study site but is contributing to global carbon
emissions abatement. Moreover, it is suggested to conduct similar study on a state-wide scale
to develop a holistic picture for climate change impacts in the region.
Key words: grazing ban; grazing exclusion; Sikkim, forest carbon stock, growing stock
Key
Kanchendzonga range from Phuktey top, BRS

2 Analysis of grazing exclusion policy through a climate change mitigation lens:
Case from Barsey rhododendron sanctuary, West Sikkim
IFMR-CDF
INTRODUCTION
Forest ecosystems assume significance in addressing climate change associated challenges by
playing a vital role in maintaining the carbon balance of the atmosphere. Interestingly, on one
hand they form one of the largest terrestial carbon sinks and on the other, deforestation
constitutes 20% of the anthropogenic GHG emissions worldwide (IPCC-WGI, 2007). Thus,
their role in international climate mechanisms has been limited. Issues such as uncertainty of
activities, non – permenenace1, leakage, establishing additionality and practical difficulties in
measurement, reporting and verification were the leading cause for concern. (WWF Position
Paper, 2009). However, recognizing the potential of forests and land use measures to reduce
net carbon emissions by the equivalent of 10-20% of projected fossil fuel emissions through
2050 (UCS, 2005), Bali Action Plan inducted an international framework to halt
deforestation. Reducing Emissions from Deforestation and Degradation (REDD), was
inducted at the 13th Conference of Parties in 2007. Inclusion such as the REDD encourages
and provides an opportunity to conservation-centric government policies, ultimately resulting
in carbon abation and forest enhancement, to participate and benefit from the growing
carbon market. Successful mitigation of climate change through REDD requires effective
forest governance. (FAO and ITTO, 2009) Adaptive policies, developed through a bottom up
approach, not only ensures stringent compliance to conservation centric policies,but also
provides clarity on issues such as forest rights and access. (Bushley, 2010) Such forest
management policies counter degradation of forest ecosystem and also enhance the capacity
of stocking territorial carbon in them.
In India, Sikkim is one of the most pro-active states in leading the implementation of
conservation policies. With over 80% of its geographic area notified as recorded forest area
(FSI, 2009) and over 30% of its area under protected area networks, Sikkim is recognised as a
key conservation hub. Furthermore, Sikkim plays an important role in biodiversity
conservation at the global level as it is located in Eastern Himalayas, one of the 34 global
biodiversity hotspots (DFEWM, Sikkim, 2011). It is home to a variety of flora (4500 species)
and fauna (150 species of mammals & 550 species of birds & 600 types of butterflies) and
also the magnificent peak Mt. Khangchendzonga, the highest peak in India. The rich
diversity in a relatively small landmass puts forward considerable challenge in terms of
governance. The issue is compounded by the fact that a high percentage of total population is
forest dependent in the State2. For such a resource rich mountainous State, maintaining the
health of natural resources also helps in minimizing the loss due to recurring natural disasters
such as landslides and sinking areas. Realising the need for maintaining the balance between
development and environment, Sikkim State government has launched a number of eco-
friendly policies and initiatives in the last two decades to achieve the twin goals of
conservation and sustainable development.
One of the challenging task was the implementation of the policy of banning grazing in the
forest areas. Considering the high dependence of the local communities on the forest areas for
subsistence needs such as fuelwood, fodder, timber and livelihood dependency on livestock
rearing, policy implementation was a formidable task. With support from local communities,
the successful implementation of the grazing exclusion policy provided a restoration chance
to these degraded landscapes through undisturbed natural regeneration. Grazing exclusion
leads to restoration of forest ecosystems and is recognised as a decisive policy measure
1 Defines the risk of reversal of emissions removed by sinks through natural disasters 2 As per the government records, each of the 907 villages in the State is a a forest fringe village. (DFEWM, Sikkim, 2011)

3 Analysis of grazing exclusion policy through a climate change mitigation lens:
Case from Barsey rhododendron sanctuary, West Sikkim
IFMR-CDF
contributing to mitigating climate change. The main focus of this paper would be to highlight
the net positive impact on forest carbon stocks by the introduction of grazing exclusion policy
in the State of Sikkim. We develop this case based on our field work in Barsey
Rhododendron Sanctuary (BRS) in the West District of Sikkim. We build this case by
comparing two alternative scenarios: (i) Forest carbon stocks in the absence of the grazing
exclusion policy (ii) Forest carbon stocks with implementation of the grazing exclusion
policy.
Destroyed temporary cattle shed in BRS
STUDY SCENARIOS
The government of Sikkim introduced conservation policy banning open grazing of domestic
livestock in reserved forests, plantations and water sources in 1998. Following the ban on
grazing, the process of cow-shed removal was started in Barsey Rhododendron Sanctuary and
by 2004; the policy was successfully implemented in the protected area. There was a
reduction of about 93% in the livestock population units grazing in the study area. (Tambe,
Bhutia, & Arrawatia, 2005) The decline in anthropogenic pressure on the forest resources is
supposed to improve the condition of the degraded forest landscape and contribute in
enhancing the forest carbon stock. The paper attempts to quantify this change in forest carbon
stocks that can be attributed to the policy implementation. The paper develops two scenarios
and compares them to highlight the change in forest carbon stocks due to the introduction of
the grazing ban policy in BRS.

4 Analysis of grazing exclusion policy through a climate change mitigation lens:
Case from Barsey rhododendron sanctuary, West Sikkim
IFMR-CDF
Scenario 1: Without Policy directive on grazing exclusion
In developing this scenario, we make projections for the forest carbon stocks in BRS for
2010, presuming that the grazing ban intervention had not been implemented for that area.
The dynamics of livestock population variation over the last seven decades in BRS reveal that
the livestock pressure was maximum around the late ninety’s. Moreover around the same
time, in 1998, there was detailed forest inventory survey conducted by Forest Survey of India
in the West and South districts of Sikkim. BRS was one of the areas where plots where laid
for the FSI inventory exercise. Around this time, the grazing pressure in BRS had also been
established. Thus, looking at data availability, 1998 was chosen as the base year for
developing this scenario. The projections are based on the assumption that in the absence of
the policy directive on grazing exclusion, the grazing pressure would have remained constant
over the next decade.
This scenario develops estimates for the growing stock in BRS for the year 2010, taking
baseline growing stock from FSI 1998 survey. Change in forest carbon stocks from 1998 to
2010 is estimated as below:
Ct = Ct−1 + Ci − Cl -- Equation 1
Where, t varies from 1999 to 2010
Ct = forest carbon stock at time period t
Ci = increment in forest carbon stock due to mean annual increment
Cl = losses in forest carbon stock due to anthropogenic pressures
t = year
Scenario 2: With Policy directive on grazing exclusion
Following the Sikkim government notification on banning grazing in forest areas, the
intervention was implemented in BRS by 2004 as discussed earlier. The baseline remains the
same for both the scenarios. In this scenario, the estimates for the forest carbon stocks in BRS
for the year 2010 are developed based on the primary data collected through intensive field
survey during November- December 2010. The estimates generated from this scenario can be
treated on the lower side as data has been collected from areas that were earlier subjected to
grazing pressure. And undisturbed areas have not been covered in the survey.
The objective of constructing the two scenarios is to capture the policy impact of the grazing
ban implementation in BRS. The first scenario captures the growing stock (2010) of degraded
forests as it assumes that the disturbances do not cease to exist even after 1998. The second
scenario captures the actual growing stock for 2010 based on field data, which reveals the
removal of anthropogenic pressure from BRS after policy implementation in 1998. This
difference in forest stocks in both the scenarios is emphasised by taking their respective
carbon stocks into consideration. Thus, the potential and scope of forest cover to act as
carbon sinks if conserved is also highlighted.
5 Analysis of grazing exclusion policy through a climate change mitigation lens:
Case from Barsey rhododendron sanctuary, West Sikkim
IFMR-CDF
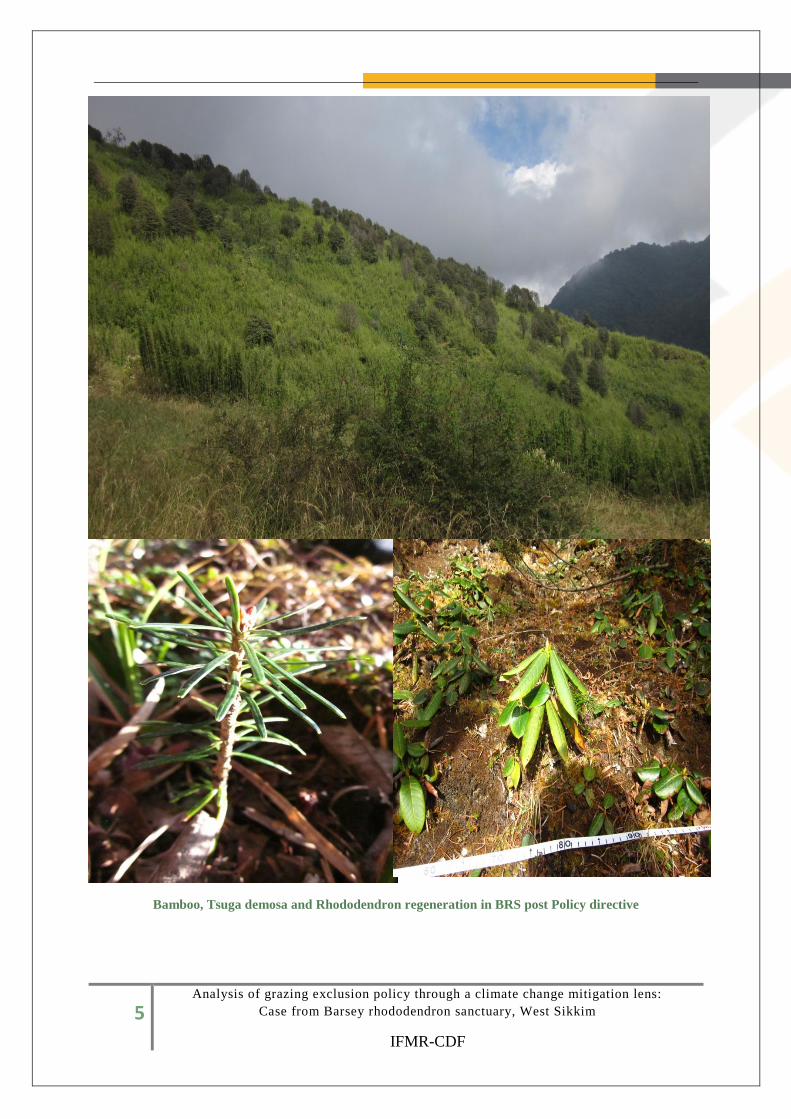
Bamboo, Tsuga demosa and Rhododendron regeneration in BRS post Policy directive

6 Analysis of grazing exclusion policy through a climate change mitigation lens:
Case from Barsey rhododendron sanctuary, West Sikkim
IFMR-CDF
MATERIALS AND METHODS
Features of the study area
Barsey Rhododendron Sanctuary lies in the south-west corner of the West district of Sikkim
with an area of 104sq. km. It is bounded by the Shingallilla Ridge which forms the natural
international border with Nepal and in the south the Rammam river separates it from the
West Bengal. The altitudinal gradient varies from 2200m – 4100m. The major significance of
the sanctuary is the presence of a wide variety of rhododendron species and that it is home to
some of the rare Schedule I species including Red Panda (Sikkim Forest Department, 2008).
BRS is surrounded by more than 30 fringe villages comprising of above 5000 households.
(Sikkim Forest Department, 2008). In addition to stray cattle grazing in forest fringes, the
sanctuary was home to 288 herders and 5,370 cows, 370 buffaloes, 506 yaks and 135 sheep.
Prior to the ban, pattas (permits) were given to herders for grazing their livestock. Herders
followed an agro-pastoralist lifestyle with establishing permanent goaths (cattle-sheds), in the
forests and practicing mostly subsistence agriculture in the villages. In the forest, vegetation
in and around the cattle-shed would be cleared to create kharka (open space for grazing). In
the adjacent areas, trees would be heavily lopped for fodder and cut for firewood and timber.
The movement of the herders depended upon availability of fodder, water, livestock type and
was seasonal in nature. From mid of 1970s to late 1990’s, there was an increase in the
livestock population and rise in the number of heavy livestock types such as yak, and yak-
cow hybrids. With livestock density as 61 livestock / km2 and cattle shed of density of 4.5 /
km2, the sanctuary was immensely degraded due to the anthropogenic activities. (Tambe,
Bhutia, & Arrawatia, 2005).
Field survey - Vegetation
We conducted extensive field surveys during Nov – Dec 2010. Data on vegetation and soil
parameters was collected in the field while qualitative data was collected on hydrological and
wildlife aspects. The study area was stratified into into 4 broad categories based on the forest
type:
1. Upper Hill-Himalayan Wet Temperate Forest (Oak and dwarf bamboo dominated)
2. Moist temperate forest (Mixed coniferous)
3. Sub-alpine forest (Birch/Fir & Rhododendron forests)
4. Sub-Alpine scrub (Rhododendron & scrub thickets)
In each of the forest type zone, cow-shed spots were identified in high and low grazing
intensity (disturbance) areas. The high and low disturbed areas were identified by
consultations with local herders and forest officials. 10 plots were laid in each of the forest
type zones within 1 ha radius of the cow-shed locations, except for the sub-alpine scrub forest
where quadrants were laid. In all, 30 plots of 0.1 ha each and 20 1 m2 quadrants were laid.
Also, 35 soil samples were collected. The methodology prescribed by the Forest Survey of
India was followed for collecting vegetation data from the plots. In each of the plot, four 3 m
X 3m sub-plots were laid to capture regeneration and shrubs data and four 1m X 1m
quadrants were laid to capture data on herbs. (FSI, 2002). A detailed inventory on important
vegetation attributes such as canopy cover, regeneration, girth at breast height, tree height etc

7 Analysis of grazing exclusion policy through a climate change mitigation lens:
Case from Barsey rhododendron sanctuary, West Sikkim
IFMR-CDF
was prepared. Also, details on forest disturbance such as lopping, cutting, fire, signs of
domestic livestock grazing were also recorded. Noting of wild life was also recorded during
the survey.
Upper Hill Himalayan Wet Temperate Forest
Moist Temperate Forest

8 Analysis of grazing exclusion policy through a climate change mitigation lens:
Case from Barsey rhododendron sanctuary, West Sikkim
IFMR-CDF
Rhododendron Forest
Sub Alpine Forest

9 Analysis of grazing exclusion policy through a climate change mitigation lens:
Case from Barsey rhododendron sanctuary, West Sikkim
IFMR-CDF
Field survey – Socio-economic
The data for average fuelwood, fodder and pole requirements were collected through Focused
Group Discussions with Joint Forest Management Committee and Eco-Development
Committee members, and Household Surveys of 60 herder households in the fringe villages
of the sanctuary. Annual requirements of the herder population alone, was considered for this
study.
Focused Group Discussions with JFMC and EDC members
Household survey of ex-herders

10 Analysis of grazing exclusion policy through a climate change mitigation lens:
Case from Barsey rhododendron sanctuary, West Sikkim
IFMR-CDF
Secondary information
The average growing stock estimates were adopted from the FSI, Interim Report, (1998).
Area calculation
We used a LISS III
classified image for
calculating area
under each of the
forest type. The
image classified on
the basis of altitude
was taken from the
Management Plan of
the sanctuary as
developed by the
state forest
department. The
image was divided
into six classes
namely: 0-1000m,
1000-2000m, 2000-
2500m, 2500-3000m,
3000-3500m and
3500-4000m. Arc
GIS (version 9.2) was used to calculate the area under each altitude class, these area estimates
were utilized for further estimation of carbon stock.
Methodology for estimation of growing stock
The study measures the impacts of grazing exclusion policy by considering four variables, i.e.
Pre-ban growing stock, mean annual increment, anthropogenic pressures and post ban
growing stock.
The baseline growing stock for the year 1998 is estimated based on average volume of
growing stock values obtained from Forest Survey of India, Kolkata, interim report (1998).
The growing stock in the year 2010 is estimated based on the plot level data obtained during
the field surveys. Local allometric equations given in table 1 were utilized for calculating
volumes of different tree species. Thus, the methodology for calculating the baseline and
current growing stock are both based on FSI technique. State level Mean Annual Increment
(MAI) estimate of 0.767 Mm3 (FAO 1998), as provided by the Food and Agriculture
Organization report 1998, was adopted for this study. Activities causing loss of carbon stock,
collectively taken as anthropogenic pressures, include lopping for fuelwood &fodder, poles
for maintenance and construction of cow-sheds and free grazing of domestic livestock un
forest areas. Field based primary data was used for calculating carbon loss due to
anthropogenic pressure and post-ban growing stock as in 2011.
Figure1: Elevation map of Barsey Rhododendron Sanctuary (Source:
FEWMD, Sikkim)

11 Analysis of grazing exclusion policy through a climate change mitigation lens:
Case from Barsey rhododendron sanctuary, West Sikkim
IFMR-CDF
Table 1 : Allometric Volume Equations (FSI, 1998)
Form Class Local Allometric Equation
I V/D2= 0.001559 +0.06674/D2 - 0.02039/D
II V/D2= 0.0012897 + 0.25564/D2 - 0.030418/D
III V= 0.12652 - 0.018037 D + 0.000956D2
IV V/D2= 0.001184 + 0.1812/D2 - 0.02348/D
Estimation of Bamboo biomass (Hairiah K., Sitompul, Noordwijk, & Palm, 2001)
W = .131 (D^ 2.28)
Methodology for estimation of carbon equivalent
Methodology, prescribed by the Indian Council of Forestry Research and Education, was
adopted to calculate carbon content of growing stock of trees and to estimate the loss in
carbon stock due to anthropogenic pressures. As soil carbon estimates for the baseline are not
available, the paper limits itself to biomass carbon, stored in forest vegetation, to highlight
change in territorial carbon stock due to grazing ban.
Biomass carbon includes above-ground as well as below-ground biomass; where below-
ground is a derived as a product of the root-to-shoot ratio 3 and above-ground biomass. For
the baseline, average volume per hectare was considered from the FSI interim report.
However, documented dbh at plot level was used in local allometric volume equations to
estimate the above ground volume for estimating growing stock for 2010. These estimated
growing stocks (in m3) were multiplied by the national biomass expansion factor to obtain
above ground volume (AGV) and subsequently below ground volume (BGV). Conversion
from biomass (in terms of volume) to biomass (in Tonnes) was done by assuming mean wood
density as 0.7116. Even though the study doesn’t include carbon stock assessment of forest
litter and dead trees, carbon pool of other vegetation (on the forest floor biomass) was
incorporated to calculate the Total Forest Biomass (TFB). Further carbon equivalent of
biomass was estimated considering the dry weight of TFB.(Refer box 1 below)
Box 1: Methodology to estimate Carbon Content
3 ratio of belowground biomass to aboveground biomass of a tree species
Forest Carbon Stock = Biomass Carbon + Soil Carbon
(The paper assess only biomass carbon in order to highlight policy impact)
Biomass Carbon = Above Ground Biomass (AGV) + Below Ground Biomass (BGV)
Above Ground Volume (AGV) (Mm3) = Growing Stock (Mm3) * Biomass Expansion Factor (1.575)
Below Ground Biomass (BGV) (Mm3) = Above Ground Volume (AGV) * Root-Shoot Ratio (0.266)
Total Biomass (Volume) (Mm3) = ABV + BGV
Biomass of Trees (Million Tonnes) = Total Biomass*Wood Density (0.7116)
Other Vegetation (Million Tonnes) = Biomass*Ratio (0.015)
Total Forest Biomass (TFB) (Million Tonnes) = Biomass (Tree) + Other Vegetation
Dry Weight of Biomass (Million Tonnes) = TFB*0.8
Carbon Equivalent of Biomass (Million Tonnes) = Dry weight of Biomass*0.4
Source: (Kishwan, Pandey, & Dadhwal, 2009)

12 Analysis of grazing exclusion policy through a climate change mitigation lens:
Case from Barsey rhododendron sanctuary, West Sikkim
IFMR-CDF
RESULTS
Scenario 1: Without Policy directive on grazing exclusion
Estimation of baseline
The estimation of baseline growing stock is a prerequisite for the calculation of change in
carbon stocks. Table 2 presents an overview of the growing stock assessment for the West
district of Sikkim according to the FSI 1998 report. The FSI study had divided the forests into
reserved and unreserved categories, which were further divided into 4 stratums based on the
altitude. The paper has adopted the estimates developed for the reserved forests in West
Sikkim. As most of the area in BRS lies above 2000m hence the values for stratum III and IV
only were utilized for this paper. The area of BRS lying below 2500m was multiplied by
growing stock estimates under stratum III while for area between 2500-3500m stratum IV
estimates were used. Above 3500m, the tree line starts diminishing and subalpine thickets
start dominating. In BRS 0.202 sq. km of area lies above 3500m and it has been excluded for
the growing stock estimations.
Table 2 : Baseline volume estimates adopted for the study site (FSI, 1998)
Stratum Altitude (m) Volume
(m3/ha)
Stems per
(ha)
I ≤ 900m 66.813 144.999
II 901 to 1800m 111.266 287.307
III 1801 to 2400m 130.196 190.811
IV ≥ 2400m 283.047 270.714
Source: FSI 1998 Report - Values for West district reserved forests
From the LISS image, the estimated area in BRS was 54.055 sq.km under stratum III and
85.14 sq.km under stratum IV. The total volume of growing stock was calculated by
multiplying average volume per hectare by area. It was estimated as 0.704 Mm3 for stratum
III and 2.410 Mm3 for stratum IV. The total forest biomass after converting the growing
stock to biomass stood at 4.484Mt. From the above, the net accumulation of carbon in the
forest stock was projected at 1.435Mt for the year 1998. Form the findings of the FSI report,
it is observed that, the forests in stratum III were dominated by Quercus spp. that contributed
the most (37.89 percent) while the stratum IV was predominated by Abies species (45.15
percent). In both the stratums, mature trees (over 60cm diameter) majorly contribute to the
volume (63 to 65 %). The forests in stratum III correspond to the Upper Hill Himalayan wet
temperate forests while, the forests in stratum IV cover the moist temperate and sub-alpine
forest types. This estimated carbon stock is used as the reference level to detect change in
carbon stock level.
Estimation of loss of carbon due to anthropogenic pressure
Forest ecosystem presents a unique case: when conserved or managed sustainably, they act as
sink for carbon, while when degraded or destroyed they turn into sources of carbon dioxide
emission. The rapid increase in anthropogenic pressure in BRS was a significant factor
contributing to degradation. The livestock population in BRS increased from just over

13 Analysis of grazing exclusion policy through a climate change mitigation lens:
Case from Barsey rhododendron sanctuary, West Sikkim
IFMR-CDF
thousand in 1960’s to over 6000 livestock units in 1990’s4, an increase of over 250%. This
led to intensification of the human activities in the sanctuary, resulting in clearing up of the
forested areas for constructing cattle-sheds and grazing areas. This human induced pressure
in terms of extraction for fuelwood, construction and lopping for fodder was the main factor
contributing to the forest degradation and resulting in diminishing the value of the forest
carbon stock. Table 3 lists the livestock pressure in BRS for the year 2000. These values have
been adopted in this paper for estimating the grazing pressure.
To estimate the carbon loss, a consumption based approach has been adopted. Information on
activities contributing to extraction of the resource was documented through interviews with
the herders. There were about 288 herders practicing pastoralism in BRS around the year
2000 (Tambe, Bhutia, & Arrawatia, 2005). The discussions with the herders revealed that the
preferred species for fuelwood were Arundinaria maling (malingo), Quercus spp (bante), and
Viburnum cordifolium (asare) in the temperate forests while Abies densa and Rhododendron
spp were mostly used at the higher altitudes. The mean consumption of fuelwood by herder
was 40kgs d-1
(1 head load)5 for cooking and heating purposes. The average requirement of a
herder was 21 metric tonnes year-1
.
Table 3: Livestock pressure in Barsey Rhododendron Sanctuary (Tambe, Bhutia, & Arrawatia, 2005)
Livestock Population Months grazed inside forest
Cow 5370 8
Buffalo 370 8
Yak 506 12
Sheep 135 12
Lopping of trees for fodder constituted another cause for loss in tree stock leading to loss in
forest carbon. Lopping was mostly done for providing fodder to the young calves in the cattle
sheds and to supplement the fodder requirements of livestock, especially in winter when
ground availibaility of fodder declines. Some of the preferred species lopped for fodder were
Thamnocalamus Aristata (Raat Ningale), Arundinaria maling (malingo), Quercus spp
(bante), Litsaea polyantha (pahenley), Ilex dipyrena (lissey)and Sorbus Cuspidata
(Teiga).The average fodder requirement of a herder was 90kgs d-1
(2.5 head loads) Net
demand for fodder per herder was 33 metric tonnes year-1
. Herders also required poles for
maintenance and construction of the cattle sheds. Species like Viburnum cordifolium (asare)
and in higher altitudes Abbies densa (Silver Fir) and Tsuga Dumosa (hemlock) were utilized
for this purpose. The herder on an average required 92 tonnes year-1
, for the purpose of
constructing and repairing his cattle shed.
Table 4: Carbon losses due to various disturbances
Disturbance Consumption
(Tonnes p.a.)
Biomass Equivalent
(Tonnes p.a.)
Carbon equivalent
(Tonnes p.a.)
Fuelwood 6165.504 9710.669 3107.414
Fodder 9642.24 15186.528 4859.689
Timber (poles) 92.16 145.152 46.449
Grazing 100371.600 100371.600 17263.915
4 Information from focussed group discussions with local communities 5 For the purpose of calculations, 1HL has been taken as 40kgs and 1 Peel as 12HL.

14 Analysis of grazing exclusion policy through a climate change mitigation lens:
Case from Barsey rhododendron sanctuary, West Sikkim
IFMR-CDF
Drivers of forest degradation in BRS

15 Analysis of grazing exclusion policy through a climate change mitigation lens:
Case from Barsey rhododendron sanctuary, West Sikkim
IFMR-CDF
Besides lopping, another source of biomass loss to forests was in the form of livestock
grazing freely in the forests. To estimate this loss, the average daily consumption of green
fodder for a cow has been adopted as 60 kg. The other livestock such as yaks, sheep etc have
been converted to equivalent cow units, which are multiples of this average cow
consumption. For the purpose of calculation, they were taken as cattle/cow=1, buffalo=2,
yak=1, and sheep=0.5 (Paljor, 1998).
The total average annual biomass extraction for a herder amounted to 33 metric tonnes of
fuelwood, 52 metric tonnes of fodder, and 145 metric tonnes of poles. These annual estimates
were then converted into their biomass equivalents using standard biomass expansion factors
and further converted into their carbon equivalents by applying the carbon content conversion
factor of 0.4 to them. Displayed in table 4 are the corresponding losses in the stocks of
carbon due to lopping for fuelwood, fodder and grazing. The contribution of grazing to the
loss of carbon stocks was estimated to be 68%6 as compared to fuelwood and fodder which
were at 12% and 19% respectively.
Projection of stock of carbon
As per methodology, the forest stocks in 2010 were estimated by taking the baseline stocks of
1998 and deducting the losses in carbon due to anthropogenic pressure from them and adding
the natural regeneration of forest stocks every year. For this, the MAI of 0.353 t/ha/yr
reported at the state level has been adopted. This was an addition of 4920.3963 tonnes of
carbon per annum to the growing stock every year. By adopting equation 1, the carbon stock
for 2010 for BRS was estimated to be 1.17 Million tonnes. The calculations indicate a
reduction from 1.43 Million tonnes of carbon in 1998 (baseline year) at a rate of 22.054
thousand tonnes per annum. This continuous decline, over 12 years, suggests that the rate of
removal of biomass to be higher than the associated natural regeneration and growth. Such
projections with constant anthropogenic pressure eventually predict role reversal of trees-
from carbon stocks to sinks. (Bhat & Ravindranath, 2010)
Scenario 2 - With Policy directive as government intervention
This scenario quantifies the effectiveness of grazing exclusion policy, in terms of carbon
stocks. A positive change in sequestered territorial carbon levels points towards increase in
forest biomass- a direct result of undisturbed natural regeneration. A negative change
indicates continuation (or acceleration) of degradation activities resulting in higher carbon
loss as compared to sequestration. Field based forestry inventory data is used to calculate the
growing stock and its carbon equivalent for 2010, 12 years into the policy intervention. Based
on the field inventory data, an average volume per hectare for each of the forest type- Upper
Hill Himalayan wet temperate, moist temperate and sub alpine is estimated by taking an
average of total volume in each of the ten plots laid.
6 The loss of carbon due to grazing was estimated after considering the seasonality in grazing of the different types of
livestock(Table 4)

16 Analysis of grazing exclusion policy through a climate change mitigation lens:
Case from Barsey rhododendron sanctuary, West Sikkim
IFMR-CDF
Table 5: Volume, Biomass and Carbon Stock estimation in 2010
Forest type Average Volume
(m3 per ha)
Forest Biomass Equivalent
(Million Tonnes)
Upper Hill Himalayan Wet Temperate 189.462 1.474
Moist Temperate 233.659 2.317
Sub –Alpine 603.760 1.173
Most of the bamboo documented during the field survey had dbh in the range of 3-7cm,
indicating rapid regeneration at the study site. The study adopted a diameter-dry weight
relationship to estimate the growing stock for bamboo (Hairiah K., Sitompul, Noordwijk, &
Palm, 2001). Carbon stored in bamboo forms 7% of the total carbon stock in the study site
with maximum contribution of approximately 16 % in the wet temperate zone. In addition to
bamboo species, Quercus species contribute upto half of the above ground volume in the wet
temperate forests while Litsaea polyantha and Rhododendron species contribute 18.20% and
7.27% respectively. In the moist temperate zone there was a mix of broadleaved species with
coniferous. There was dominance of coniferous (Tsuga dumosa, Abies densa) and
Rhodendron species, adding upto 50% percent of the above ground volume. Some of the
prominent broadleaved species were Acer cambelli (4.53%), Osmanthus suavis (6.79%), and
Quercus spp. (9.73%). In the sub-alpine region, Rhododendron spp. was conspicuous owing
to the luxuriant regeneration and contributed about 46.76% to the above ground volume. The
regions had Abies densa (39.63%) is the other dominant species of the zone.
The stock of biomass of wet temperate, moist temperate and sub alpine forests was 1.474 Mt,
2.317 Mt and 1.173 Mt respectively (Table 5). Total Forest Biomass, inclusive of enumerated
trees as well as other forest floor biomass, for the site is estimated as 5.059 Million tonnes
while the carbon equivalent for same is 1.755 Million Tonnes. The estimates show that there
was an increase of about 320 thousand tonnes of carbon over the baseline in the BRS. Table 6
presents the comparative scenario. The augmentation in the forest carbon stock can be
attributed to the effective implementation of grazing exclusion policy in the BRS.
Table 6: Change in forest carbon stock between 1998 - 2010
Item with description Factor 1998 2010
Growing Stock of Sanctuary (Mm3) 3.114 3.513
Mean Biomass Expansion Factor (EF) 1.575
Ration (Below to Above Ground Biomass) – RBA 0.266
Above Ground Biomass (Volume) AGB=GS*EF 4.904 5.533
Below Ground Biomass - AGB*RBA 1.305 1.472
Total Biomass (TGB) AGB + BGB 6.209 7.005
Mean Density – MD 0.7116
Biomass in Metric Tonnes = Growing Stock (Mm3) * MD 4.418 4.984
Ratio (Other Vegetation to Tree Biomass) 0.015
Total Forest Biomass in Mt (Trees + Herbs + Shrubs) - TFB 4.484 5.059
Dry Weight in Mt (TFB*80%) - DW 7 3.927 4.387
Stock of Carbon in Mt (DW*40%) 1.435 1.755
7 DW(2010) is inclusive of the dry weight of bamboo species

17 Analysis of grazing exclusion policy through a climate change mitigation lens:
Case from Barsey rhododendron sanctuary, West Sikkim
IFMR-CDF
DISCUSSION
Figure 2: Comparison of scenarios - forest carbon stocks with and without grazing exclusion policy
This article reveals the impact of the grazing exclusion policy in terms of enhancement of the
forest carbon stock on a relatively finer scale. Figure 2 presents a comparative account of the
with and without policy intervention. It is observed that the difference between the with and
without policy intervention scenarios amounts to about 585 thousand tonnes of carbon. This
translates to 21428 thousand tonnes of carbon di-oxide equivalent. (Assuming an average
price of the offsets in the forest carbon market scenario at $4.6/tCO2e9, it can be valued at Rs
45.3310
crores.) This change indicates active role played by forests in enhancing carbon sink
and sequestering carbon which would have been absent if grazing exclusion had not been
implemented. This conservation promoting policy has improved carbon sequestration,
considered as a low cost abatement option. Value of this carbon sequestrated is not limited to
the geographic area of study site but rather is a contributor to global reduction in net carbon
emissions. (Richards & Anderrson, 2001). Usually such studies are either designed at a broad
regional scale based upon country or landscape level estimates or are micro-level site specific
& data intensive studies, requiring time series data for longer time intervals. In either case
data availability is a crucial factor. In the absence of the detailed longitudinal data, the case
has been developed with limited information and scope. The estimates should be treated
carefully and are indicative in nature. The intention behind developing this case using a
available information was to highlight the significance of the impacts generated by the policy
instrument and to showcase them by developing a case study.
Currently the working plan is being developed for the state of Sikkim for which intensive
forest inventories are been conducted across all the districts. This data can be utilized along
with the data from earlier forest inventories in the State (1988 or 1998) by Forest Survey of
8 Based on the carbon dioxide to carbon ratio of 44 /12
9 The average price for offsets across the primary forest carbon markets were $3.8/tCO2e in 2008, $4.5/tCO2e in
2009, and $5.5/tCO2e in 2010 (Diaz, Hamilton, & Johnson, 2011) 10
Conservative estimate taking 1$ equivalent as Rs 46.

18 Analysis of grazing exclusion policy through a climate change mitigation lens:
Case from Barsey rhododendron sanctuary, West Sikkim
IFMR-CDF
India to develop a picture of forest carbon stock change at the State level. Such an exercise
will help in establishing the presenting a holistic picture of the policy measures and create a
useful data repository for climate change related topics. Not only can such study contribute
towards decision making on relevant policy issues, but by combining this data with socio-
economic indicators, it is possible to establish program effectiveness and creating useful
information for strengthening policy performance.
Sikkim with its effective implementation of conservation promoting policies has been able to
reverse the trend of forest degradation. It has great potential in leading India’s initiative on
international conservation funding mechanisms. Efforts have to be made for creating linkages
between its policy measures on conservation to the international mechanisms of climate
funding by creating necessary frameworks This is great opportunity to utilize the State’s
internal institutional frameworks and prepare for playing a larger role by participating in
global efforts of establishing market mechanisms to support initiatives on reducing forest loss
and degradation.

19 Analysis of grazing exclusion policy through a climate change mitigation lens:
Case from Barsey rhododendron sanctuary, West Sikkim
IFMR-CDF
BIBLIOGRAPHY
Bushley, B. R. (2010, December 8). Seeing the Communities for the Carbon: Governance
Challenges of Reducing Emissions from Deforestation and Forest Degradation in Nepal.
Reconsidering Development .
Department of Forest, Environment & Wildlife Management, GOVERNMENT OF SIKKIM.
(2006, May 27). Notification: State Government Directive on Decentralization and
Universalization of Joint. Retrieved September 2011, from Sikkim Envis:
http://www.sikenvis.nic.in/docs/Universalization%20of%20JFMC%20order.pdf
DFEWM, Sikkim. (2011). Retrieved from Sikkim Biodiveristy Conservation and Forest
Management Project (JICA assisted): http://sbfpjica.org/About%20Project.htm
Diaz, D., Hamilton, K., & Johnson, E. (2011). State of the Forest Carbon Markets 2011.
Forest trends : Ecosystem Marketplace. Forest trends: Ecosystem Marketplace.
FAO. (1998). The status of the forest resources assessment in the south-asian sub-region and
the country capacity building needs. Dehradun: FAO.
FAO and ITTO. (2009). Forest governance and climate-change mitigation. Food and
Agriculture Organization and International Tropical Timber Organization.
FSI. (1998). Forest resources of West and South districts of Sikkim. Kolkata: FSI.
Hairiah, K., Sitompul, S. M., Noordwijk, M. v., & Palm, C. (2001). Methods for sampling
carbon stocks above and below ground. Bogor, Indonesia: International Centre for Research
in Agroforestry.
IPCC. (2007). IPCC Fourth Assessment Report : Climate Change 2007. Intergovernmental
Panel for Climate Change.
IPCC-WGI. (2007). Climate Change 2007: The Physical Science Basis. Cambridge, UK:
Cambridge University Press.
Paper, W. G. (2009, July). WWF position on forests and climate change mitigation. UK:
WWF .
Richards, K., & Anderrson, K. (2001). The leaky sink : persistent obstacles to a forest carbon
sequestration program based on individual projects. Climate Policy , 1, 41-54.
Sikkim Forest Department. (2008). Management Plan of Barsey Rhododendron Sanctuary,
West Sikkim. Gangtok, Sikkim: West Wildlife Division, Department of Forest, Environment
and Wildlife Management, Government of Sikkim.
Singh, P. (2008). Exploring biodiversity and climate change benefits of community-based
forest management. Global Environmental Change, 468-478.
Singh, S. (1998). Chronic disturbance, a principle cause of environmental degradation in
developing countries. Environmental Conservation, 1-2.

20 Analysis of grazing exclusion policy through a climate change mitigation lens:
Case from Barsey rhododendron sanctuary, West Sikkim
IFMR-CDF
Tambe, S., Bhutia, N., & Arrawatia, M. (2005). People’s opinion on the Impacts of “Ban on
Grazing” in Barsey Rhododendron Sanctuary. Sikkim, India: The Mountain Institute.
UCS. (2005). Forests and Climate Change - Recognizing Forest's Role in Climate Change.
Union of Concerned Scientists and Rainforest Coalition.