Embed Size (px)
Citation preview
©FUNPEC-RP www.funpecrp.com.brGenetics and Molecular Research 12 (2): 1962-1973 (2013)
Analysis of genetic diversity among Chinese wild Vitis species revealed with SSR and SRAP markers
Z.B. Jing1,2,3, X.P. Wang2,3 and J.M. Cheng1
1College of Animal Science and Technology, Northwest A&F University, Yangling, Shaanxi, China2College of Horticulture, Northwest A&F University,Key Laboratory of Horticultural Plant Biology and Germplasm Innovation in Northwest China, Ministry of Agriculture, Yangling, China3State Key Laboratory of Crop Stress Biology in Arid Areas,Northwest A&F University, Yangling, Shaanxi, China
Corresponding author: X.P. Wang E-mail: [email protected]
Genet. Mol. Res. 12 (2): 1962-1973 (2013)Received November 30, 2012Accepted March 30, 2013Published June 13, 2013DOI http://dx.doi.org/10.4238/2013.June.13.5
ABSTRACT. The genetic diversity among 80 Vitis materials including 62 indigenous accessions of 17 wild Vitis species in China and 7 interspecific hybrids, 10 V. vinifera L. cultivars, and 1 V. riparia Michaux were evaluated by simple sequence repeat and sequence-related amplified polymorphism markers. A total of 10 simple sequence repeat primers and 11 sequence-related amplified polymorphism primer combinations were amplified, and 260 bands were generated, of which 252 were polymorphic with an average polymorphism rate of 97.02%. Genetic relationships among the different Vitis species indicated that V. ficifolia and V. yeshanensis could be considered a separate species. As for the 4 major ecogeographic regions of Chinese wild Vitis species, the genetic diversities of Chinese wild Vitis species from the Qinling Mountain region (H = 0.1947, I = 0.3067) and the mid-downstream
1963
©FUNPEC-RP www.funpecrp.com.brGenetics and Molecular Research 12 (2): 1962-1973 (2013)
Genetic diversity analysis of Chinese wild Vitis species
Yangtze River region (H = 0.1834, I = 0.2925) were higher, with results suggesting that these regions may be one of the major centers of Vitis origin. An understanding of the genetic diversity of these Chinese wild Vitis species could provide the theoretical foundation for further protection and reasonable utilization in grape breeding.
Key words: Chinese wild grape; Vitis; Genetic diversity; SSR; SRAP
INTRODUCTION
Grape (Vitis vinifera L.) is one of the most important fruit crop in the world, and grows in South Europe, Asia Minor, East Asia, and North and Central America (Wan et al., 2008). There are more than 70 Vitis species, mainly distributed in the Northern Hemisphere (Ercisli et al., 2008).
China is one of the major germplasm gene centers of Vitis species origination. More than 35 Vitis species have their origin in China (Wan et al., 2008). Chinese wild Vitis species have many excellent characteristics, including 1) high-quality wine-making attributes, such as high sugar content and moderate acidity (Li and He, 2000); 2) a high level of resistance to fungal diseases, including powdery mildew [Uncinula necator (Schw.) Burr.], anthracnose [Elsinoë ampelina (de Barry) Shear], ripe rot [Glomerella cingulata (Ston.) Spauld and Sch-renk], and crown gall [Agrobacterium tumefaciens Smith and Townsend] (He et al., 1991; Wang et al., 1995, 2007); 3) highly efficient photosynthesis in V. quinquangularis (Zhu et al., 1994); and 4) the facts that Chinese wild Vitis can be easily crossed with American Vitis spe-cies, and the undesirable “foxy” flavor compounds in the berries of American Vitis species are nonexistent in Chinese wild Vitis species (He, 1999b; Wan et al., 2008).
Up to now, selection for the desirable characteristics of Chinese wild grape has enlarged the scope of applications for grape breeding. This has resulted in many intermediate and tran-sitional types of Vitis, which cause difficulties in germplasm research of the wild Chinese Vitis. Moreover, the classification of a few Chinese Vitis species adopted by Chinese taxonomists has led to some controversy and confusion, and further studies are necessary to classify and elucidate the evolutionary relationships between the various Vitis species. In previous studies, the taxonomy and germplasm identification of some wild Vitis species natives to China have been completed based on morphological and isoenzyme approaches (He et al., 1996; Niu and He, 1996; Ma and He, 1998). However, the morphological characteristics and isoenzymes of grapes are easily affected by the developmental period and the environment (Luo et al., 2001). DNA molecular marker technologies are available for the analysis of genetic diversity at the DNA level. A few studies applying ran-dom amplified polymorphic DNA (RAPD), sequence-related amplified polymorphism (SRAP), and start codon targeted techniques have reported the use of DNA markers to classify and analyze the genetic relationships between and within Chinese wild grape, and foreign cultivars (Luo et al., 2001; Guo et al., 2012a,b). So far, there are no reports to assess the genetic diversity and relation-ships for more than 18 Chinese wild Vitis species by combination of simple sequence repeat (SSR) and SRAP markers. Two technologies, SSR and SRAP, are recognized as being the most used molecular markers because they are simple, reliable, and effective (Guo et al., 2012b).
In this study, we combined SSR and SRAP markers to analyze the genetic diversity and relationships among wild Vitis species native to China, America, and European cultivars from different ecogeographic regions in China. Our studies will facilitate the efficient evalua-
1964
©FUNPEC-RP www.funpecrp.com.brGenetics and Molecular Research 12 (2): 1962-1973 (2013)
Z.B. Jing et al.
tion, conservation, management, and utilization of Chinese wild grape germplasm resources.
MATERIAL AND METHODS
Plant materials
A total of 80 Vitis materials including 62 clones of 17 wild Vitis species native to China, and 7 interspecific hybrids, 10 European cultivars, and 1 V. riparia Michaux were col-lected from the orchard of grape germplasm resources, Northwest A&F University, Yangling, Shaanxi, China. The 62 wild grapes were from 4 ecogeographic regions in China. Information for the 80 Vitis materials is listed in Table 1. Young healthy leaves from plants of each acces-sion were collected and stored under -80°C for later DNA extraction.
Species Pop. Code Clones Origin Species Pop. Code Clones Origin code No. code No.
V. pseudoreticulata A 1 Baihe-13-1 R4 41 Liu-9W.T. Wang 2 Guangxi-2 42 Baishui-40V. amurensis Rupr. B 3 Zuoshan-75079 R1 V. davidii (Roman) I 43 Tangwei R3 4 Taishan-11 Foex 44 Fujian-4 5 Zuoshan-2 45 Xuefeng 6 Zuoshan-1 46 Lueyang-4 7 Heilongjiang♂ 47 Ningqiang-6 8 Tonghua-3 V. adstricta Hance J 48 Taishan-1 ♂ R3 9 Shuangyou 49 Taishan-2 10 Zuoshan-76097 50 Taishan-1 11 Zuoshan-12 51 Anlin-3V. baihensis L.X. Niu C 12 Baihe-40 R3 52 Anlin-2 ♂V. bashanica P.C. He D 13 Baihe-41 R2 V. hancockii Hance K 53 Jiangxi-3 R3V. liubaensis L.X. Niu E 14 Langao-2 R3 54 Jiangxi-3 ♂ 15 Liu-10 V. qinlingensis P.C. He L 55 Pingli-5 R2V. quinquangularis F 16 Weinan-3 R2 56 Lueyang-4Rehd. 17 83-4-94 ♀ V. yeshanensis J.X. Chen M 57 Yanshan-1 R2 18 83-4-96 ♀ V. ficifolia Bunge. N 58 Sangye R2 19 Shang-24 V. spp (Qiufuyie) O 59 Meixian-6 R1 20 83-4-49 ♀ 60 Liu-7 21 83-4-49 ♂ V. riparia Michaux P 61 Hean-3 US 22 Dan-2 Interspecific hybrid Q 62 Tengnian (V. binifera x V. labrusca) 23 Huaxian-11 63 Early-TakasumiV. romanetii Roman. G 24 Jiangxi-2 R3 64 Jingya 25 Pingli-2 65 Kyoho 26 Pingli-2 ♂ 66 Jingyou 27 Jiangxi-1(green)♂ 67 Hutai-8 28 Jiangxi-1(green) ♀ 68 Campbell Early 29 Jiangxi-2(red) ♂ V. vinifera L. R 69 Merlot 30 Liuba-11 70 White Riesling 31 Jiangxi-1(red) ♀ 71 Chardonnay 32 Jiangxi-2(red) ♀ 72 Early-Rose 33 Pingli-7 73 Italian Riesling 34 Baihe-22 74 Jingxiu 35 Liuba-1 75 Christmas RoseV. piasekii Maxim H 36 Nanzheng-2 R2 76 Carignane 37 Gansu-91 ♂ 77 Pinot Noir 38 Gansu-91 ♀ 78 Princes seedless 39 Liu-8 Vitis sp S 79 Bianye R4 40 Liu-6 Unknown T 80 Wanxian-15 R3
Table 1. Vitis materials used in this study.
R1, R2, R3, R4 = 4 major ecogeographic regions of Chinese wild grape distribution. R1 = Changbaishan and Xiaoxing’anling Mountain regions; R2 = Qinling Mountain region; R3 = Yangtze River region; R4 = Guangxi region.
1965
©FUNPEC-RP www.funpecrp.com.brGenetics and Molecular Research 12 (2): 1962-1973 (2013)
Genetic diversity analysis of Chinese wild Vitis species
DNA extraction
Genomic DNA was extracted from fresh leaves using a modification of the hexa-decyltrimethylammonium bromide method described by Qu et al. (1996), and the quality was tested by 0.8% (w/v) agarose gel electrophoresis. DNA concentrations were determined with a UV-VIS spectrophotometer, and samples were diluted to 40 ng/μL and then stored at -20°C for PCR amplification.
PCR amplification and electrophoresis
A total of 10 SSR primers and 11 SRAP primer combinations were synthesized by Beijing Aoke Biological Technology and Service Co. Ltd. The SSR and SRAP primer sequences are listed in Table 2. For SSR analysis, each 20-μL amplification reaction sys-tem consisted of 20 ng template DNA, 10X PCR buffer (100 mM Tris-HCl, pH 8.3, and 500 mM KCl), 0.20 mM each dNTP, 0.75 mM each primer, 2.0 mM MgCl2, and 1 U Taq DNA polymerase. The PCR amplification was conducted under the following conditions: initial 5 min at 94°C; followed by 35 cycles of 1 min at 94°C, annealing at appropriate temperature for 1 min, 90 s extension at 72°C; and a final extension of 8 min at 72°C. The PCR amplification of SRAP markers was carried out in a 20-μL volume, containing 20 ng template DNA, 10X PCR buffer (100 mM Tris-HCl, pH 8.3, 500 mM KCl), 0.18 mM each dNTP, 0.75 mM each primer, 1.87 mM MgCl2, and 1 U Taq DNA polymerase. The PCRs were performed as follows: 5 min of denaturing at 94°C followed by 5 cycles of 3 steps: 1 min of denaturing at 94°C, 1 min of annealing at 35°C, and 2 min of elongation at 72°C. In the following 30 cycles, the annealing temperature was increased to 50°C, with a final elongation step of 5 min at 72°C.
The PCR products were separated on 6% denatured polyacrylamide gels and detected by silver staining. Then, clearly and reproducibly distinguished bands were recorded and used in the following analysis. The DL 2000 DNA ladder (TaKaRa Biotechnology Dalian Co., Ltd., China) was used as DNA markers.
Data analyses
After silver staining, each SRAP and SSR fragment was scored as present (1) or absent (0) for each of the 80 DNA samples, excluding the weak and blurred bands, thus generating a binary data matrix. The binary data matrix was analyzed using the NTSYS-pc version 2.1e software package (Rohlf, 2000). The pairwise genetic distances among all accessions, according to Nei (1978), were calculated based on the Jaccard similarity coefficient. Cluster analyses (SSR + SRAP) were performed using the unweighted pair-group method with arithmetic average (UPGMA). The dendrogram was constructed us-ing the NTSYS-pc version 2.1 software package and MEGA version 4.0 (Tamura et al., 2007). The principal coordinate analysis (PCoA) was performed using the DCENTER and EIGEN programs in the NTSYS-pc version 2.1 software package. Finally, the observed number of alleles (NA), effective number of alleles (NE), Nei’s gene diversity index (H), and Shannon information index (I) were calculated using POPGENE version 1.32 (Yeh et al., 1999).
1966
©FUNPEC-RP www.funpecrp.com.brGenetics and Molecular Research 12 (2): 1962-1973 (2013)
Z.B. Jing et al.
RESULTS
Polymorphism analysis
A total of 36 SSR primer pairs and 168 SRAP primer combinations were used to screen for polymorphism between 5 accessions from different species. Among them, 10 SSR primer pairs and 11 SRAP primer combinations amplified clear and abundant fragments, and were used to evaluate the genetic diversity of 80 Vitis accessions.
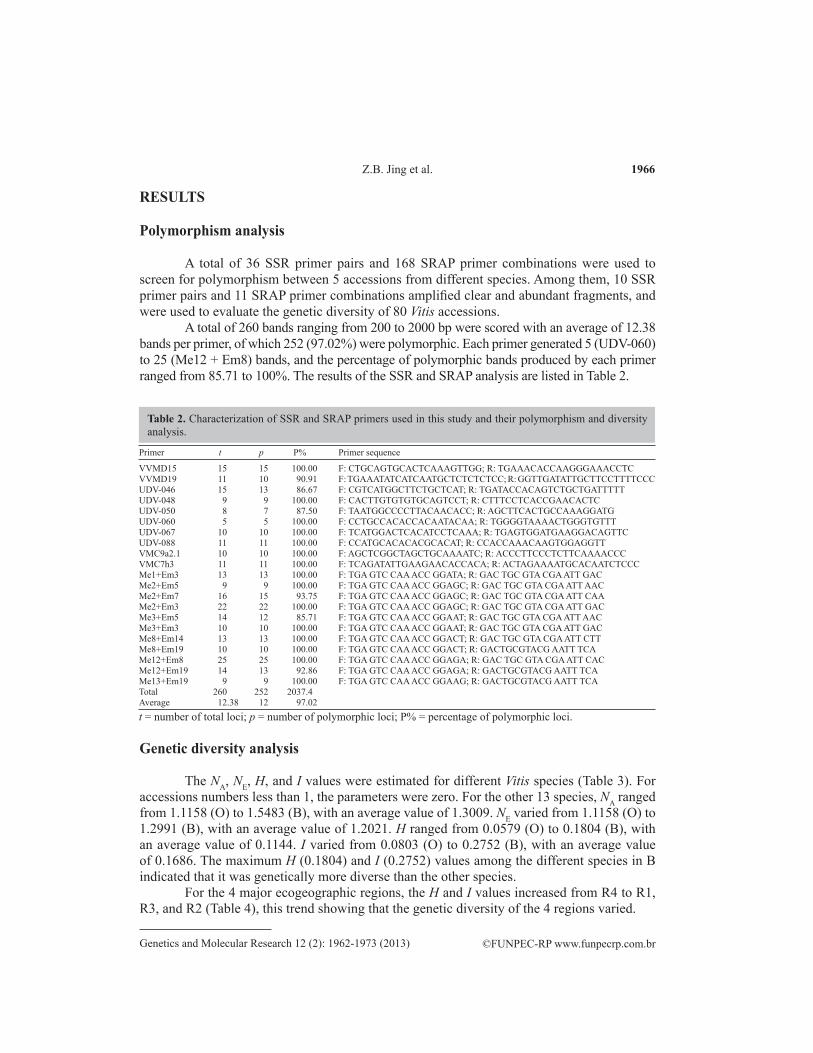
A total of 260 bands ranging from 200 to 2000 bp were scored with an average of 12.38 bands per primer, of which 252 (97.02%) were polymorphic. Each primer generated 5 (UDV-060) to 25 (Me12 + Em8) bands, and the percentage of polymorphic bands produced by each primer ranged from 85.71 to 100%. The results of the SSR and SRAP analysis are listed in Table 2.
Primer t p P% Primer sequence
VVMD15 15 15 100.00 F: CTGCAGTGCACTCAAAGTTGG; R: TGAAACACCAAGGGAAACCTCVVMD19 11 10 90.91 F: TGAAATATCATCAATGCTCTCTCTCC; R: GGTTGATATTGCTTCCTTTTCCCUDV-046 15 13 86.67 F: CGTCATGGCTTCTGCTCAT; R: TGATACCACAGTCTGCTGATTTTTUDV-048 9 9 100.00 F: CACTTGTGTGTGCAGTCCT; R: CTTTCCTCACCGAACACTCUDV-050 8 7 87.50 F: TAATGGCCCCTTACAACACC; R: AGCTTCACTGCCAAAGGATGUDV-060 5 5 100.00 F: CCTGCCACACCACAATACAA; R: TGGGGTAAAACTGGGTGTTTUDV-067 10 10 100.00 F: TCATGGACTCACATCCTCAAA; R: TGAGTGGATGAAGGACAGTTCUDV-088 11 11 100.00 F: CCATGCACACACGCACAT; R: CCACCAAACAAGTGGAGGTTVMC9a2.1 10 10 100.00 F: AGCTCGGCTAGCTGCAAAATC; R: ACCCTTCCCTCTTCAAAACCCVMC7h3 11 11 100.00 F: TCAGATATTGAAGAACACCACA; R: ACTAGAAAATGCACAATCTCCCMe1+Em3 13 13 100.00 F: TGA GTC CAA ACC GGATA; R: GAC TGC GTA CGA ATT GACMe2+Em5 9 9 100.00 F: TGA GTC CAA ACC GGAGC; R: GAC TGC GTA CGA ATT AACMe2+Em7 16 15 93.75 F: TGA GTC CAA ACC GGAGC; R: GAC TGC GTA CGA ATT CAAMe2+Em3 22 22 100.00 F: TGA GTC CAA ACC GGAGC; R: GAC TGC GTA CGA ATT GACMe3+Em5 14 12 85.71 F: TGA GTC CAA ACC GGAAT; R: GAC TGC GTA CGA ATT AACMe3+Em3 10 10 100.00 F: TGA GTC CAA ACC GGAAT; R: GAC TGC GTA CGA ATT GACMe8+Em14 13 13 100.00 F: TGA GTC CAA ACC GGACT; R: GAC TGC GTA CGA ATT CTTMe8+Em19 10 10 100.00 F: TGA GTC CAA ACC GGACT; R: GACTGCGTACG AATT TCAMe12+Em8 25 25 100.00 F: TGA GTC CAA ACC GGAGA; R: GAC TGC GTA CGA ATT CACMe12+Em19 14 13 92.86 F: TGA GTC CAA ACC GGAGA; R: GACTGCGTACG AATT TCAMe13+Em19 9 9 100.00 F: TGA GTC CAA ACC GGAAG; R: GACTGCGTACG AATT TCATotal 260 252 2037.4Average 12.38 12 97.02
Table 2. Characterization of SSR and SRAP primers used in this study and their polymorphism and diversity analysis.
t = number of total loci; p = number of polymorphic loci; P% = percentage of polymorphic loci.
Genetic diversity analysis
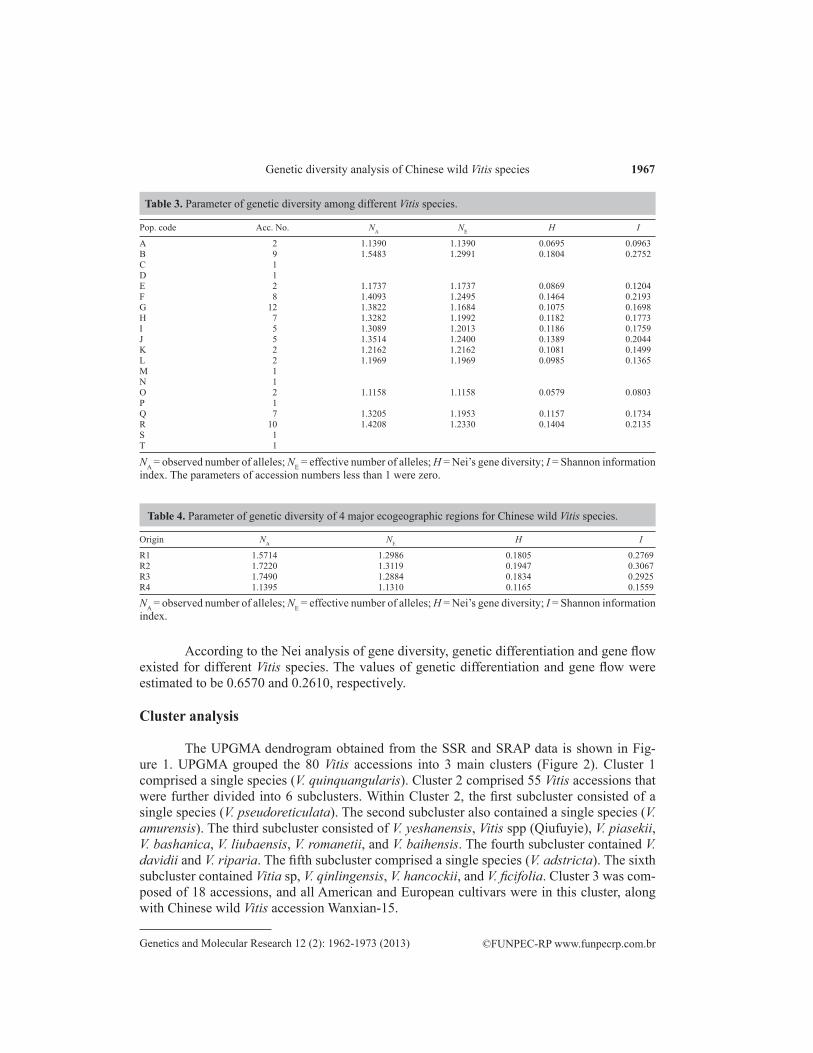
The NA, NE, H, and I values were estimated for different Vitis species (Table 3). For accessions numbers less than 1, the parameters were zero. For the other 13 species, NA ranged from 1.1158 (O) to 1.5483 (B), with an average value of 1.3009. NE varied from 1.1158 (O) to 1.2991 (B), with an average value of 1.2021. H ranged from 0.0579 (O) to 0.1804 (B), with an average value of 0.1144. I varied from 0.0803 (O) to 0.2752 (B), with an average value of 0.1686. The maximum H (0.1804) and I (0.2752) values among the different species in B indicated that it was genetically more diverse than the other species.
For the 4 major ecogeographic regions, the H and I values increased from R4 to R1, R3, and R2 (Table 4), this trend showing that the genetic diversity of the 4 regions varied.
1967
©FUNPEC-RP www.funpecrp.com.brGenetics and Molecular Research 12 (2): 1962-1973 (2013)
Genetic diversity analysis of Chinese wild Vitis species
Pop. code Acc. No. NA NE H I
A 2 1.1390 1.1390 0.0695 0.0963B 9 1.5483 1.2991 0.1804 0.2752C 1D 1E 2 1.1737 1.1737 0.0869 0.1204F 8 1.4093 1.2495 0.1464 0.2193G 12 1.3822 1.1684 0.1075 0.1698H 7 1.3282 1.1992 0.1182 0.1773I 5 1.3089 1.2013 0.1186 0.1759J 5 1.3514 1.2400 0.1389 0.2044K 2 1.2162 1.2162 0.1081 0.1499L 2 1.1969 1.1969 0.0985 0.1365M 1N 1O 2 1.1158 1.1158 0.0579 0.0803P 1Q 7 1.3205 1.1953 0.1157 0.1734R 10 1.4208 1.2330 0.1404 0.2135S 1T 1
Table 3. Parameter of genetic diversity among different Vitis species.
NA = observed number of alleles; NE = effective number of alleles; H = Nei’s gene diversity; I = Shannon information index. The parameters of accession numbers less than 1 were zero.
Origin NA NE H I
R1 1.5714 1.2986 0.1805 0.2769R2 1.7220 1.3119 0.1947 0.3067R3 1.7490 1.2884 0.1834 0.2925R4 1.1395 1.1310 0.1165 0.1559
NA = observed number of alleles; NE = effective number of alleles; H = Nei’s gene diversity; I = Shannon information index.
Table 4. Parameter of genetic diversity of 4 major ecogeographic regions for Chinese wild Vitis species.
According to the Nei analysis of gene diversity, genetic differentiation and gene flow existed for different Vitis species. The values of genetic differentiation and gene flow were estimated to be 0.6570 and 0.2610, respectively.
Cluster analysis
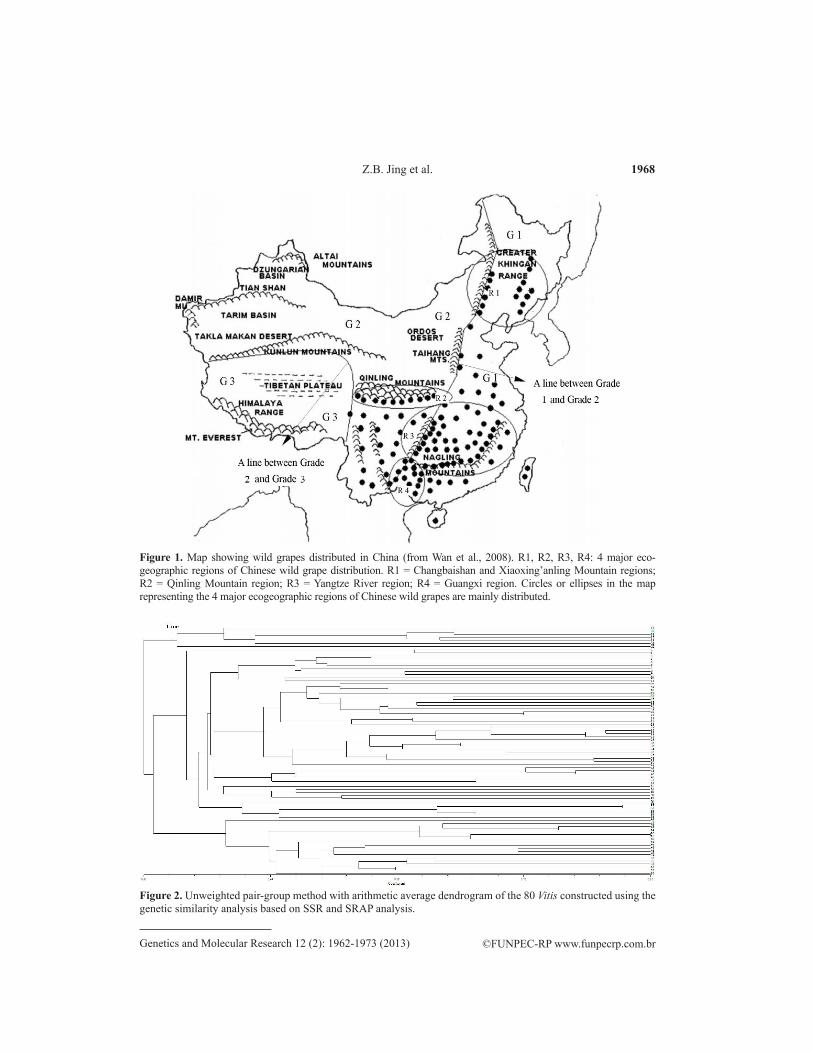
The UPGMA dendrogram obtained from the SSR and SRAP data is shown in Fig-ure 1. UPGMA grouped the 80 Vitis accessions into 3 main clusters (Figure 2). Cluster 1 comprised a single species (V. quinquangularis). Cluster 2 comprised 55 Vitis accessions that were further divided into 6 subclusters. Within Cluster 2, the first subcluster consisted of a single species (V. pseudoreticulata). The second subcluster also contained a single species (V. amurensis). The third subcluster consisted of V. yeshanensis, Vitis spp (Qiufuyie), V. piasekii, V. bashanica, V. liubaensis, V. romanetii, and V. baihensis. The fourth subcluster contained V. davidii and V. riparia. The fifth subcluster comprised a single species (V. adstricta). The sixth subcluster contained Vitia sp, V. qinlingensis, V. hancockii, and V. ficifolia. Cluster 3 was com-posed of 18 accessions, and all American and European cultivars were in this cluster, along with Chinese wild Vitis accession Wanxian-15.
1968
©FUNPEC-RP www.funpecrp.com.brGenetics and Molecular Research 12 (2): 1962-1973 (2013)
Z.B. Jing et al.
Figure 1. Map showing wild grapes distributed in China (from Wan et al., 2008). R1, R2, R3, R4: 4 major eco-geographic regions of Chinese wild grape distribution. R1 = Changbaishan and Xiaoxing’anling Mountain regions; R2 = Qinling Mountain region; R3 = Yangtze River region; R4 = Guangxi region. Circles or ellipses in the map representing the 4 major ecogeographic regions of Chinese wild grapes are mainly distributed.
Figure 2. Unweighted pair-group method with arithmetic average dendrogram of the 80 Vitis constructed using the genetic similarity analysis based on SSR and SRAP analysis.
1969
©FUNPEC-RP www.funpecrp.com.brGenetics and Molecular Research 12 (2): 1962-1973 (2013)
Genetic diversity analysis of Chinese wild Vitis species
Principal coordinate analysis
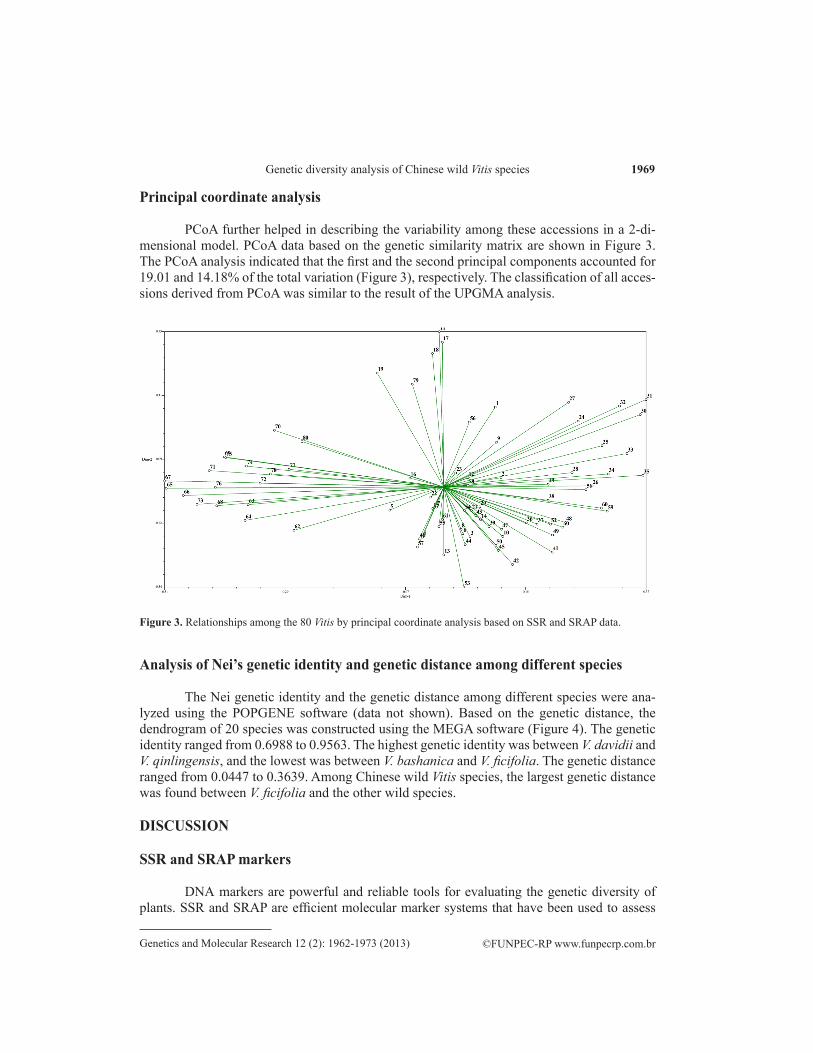
PCoA further helped in describing the variability among these accessions in a 2-di-mensional model. PCoA data based on the genetic similarity matrix are shown in Figure 3. The PCoA analysis indicated that the first and the second principal components accounted for 19.01 and 14.18% of the total variation (Figure 3), respectively. The classification of all acces-sions derived from PCoA was similar to the result of the UPGMA analysis.
Figure 3. Relationships among the 80 Vitis by principal coordinate analysis based on SSR and SRAP data.
Analysis of Nei’s genetic identity and genetic distance among different species
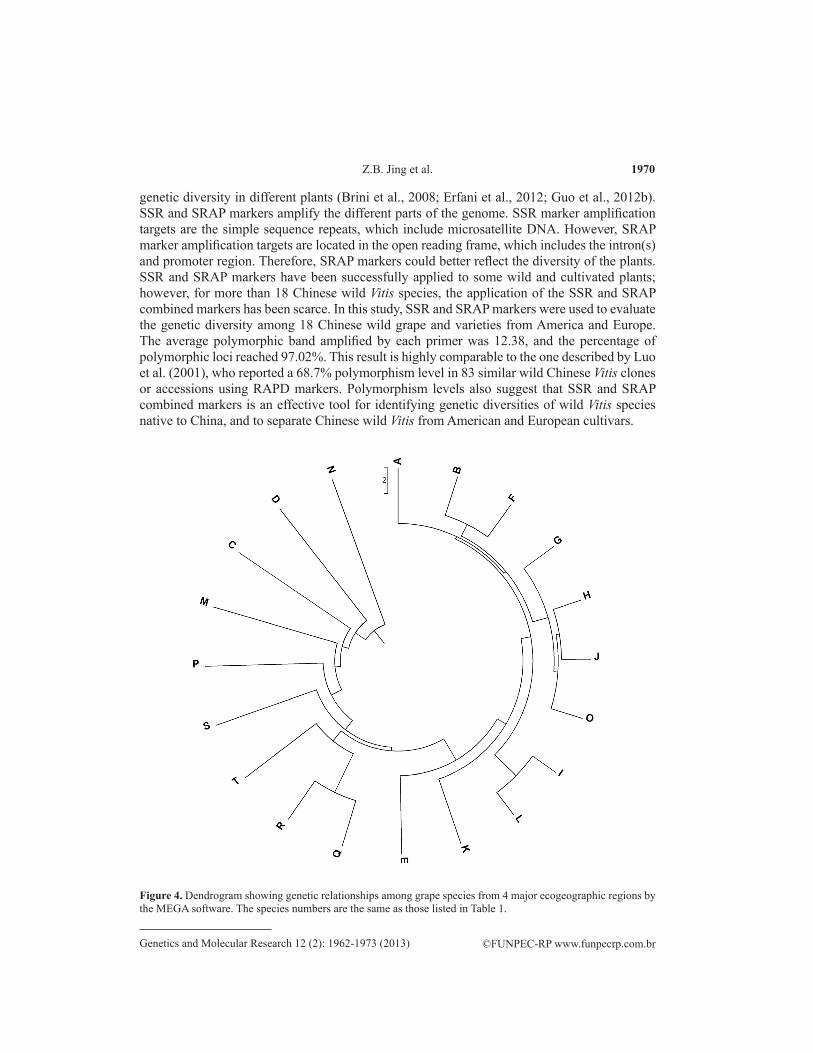
The Nei genetic identity and the genetic distance among different species were ana-lyzed using the POPGENE software (data not shown). Based on the genetic distance, the dendrogram of 20 species was constructed using the MEGA software (Figure 4). The genetic identity ranged from 0.6988 to 0.9563. The highest genetic identity was between V. davidii and V. qinlingensis, and the lowest was between V. bashanica and V. ficifolia. The genetic distance ranged from 0.0447 to 0.3639. Among Chinese wild Vitis species, the largest genetic distance was found between V. ficifolia and the other wild species.
DISCUSSION
SSR and SRAP markers
DNA markers are powerful and reliable tools for evaluating the genetic diversity of plants. SSR and SRAP are efficient molecular marker systems that have been used to assess
1970
©FUNPEC-RP www.funpecrp.com.brGenetics and Molecular Research 12 (2): 1962-1973 (2013)
Z.B. Jing et al.
genetic diversity in different plants (Brini et al., 2008; Erfani et al., 2012; Guo et al., 2012b). SSR and SRAP markers amplify the different parts of the genome. SSR marker amplification targets are the simple sequence repeats, which include microsatellite DNA. However, SRAP marker amplification targets are located in the open reading frame, which includes the intron(s) and promoter region. Therefore, SRAP markers could better reflect the diversity of the plants. SSR and SRAP markers have been successfully applied to some wild and cultivated plants; however, for more than 18 Chinese wild Vitis species, the application of the SSR and SRAP combined markers has been scarce. In this study, SSR and SRAP markers were used to evaluate the genetic diversity among 18 Chinese wild grape and varieties from America and Europe. The average polymorphic band amplified by each primer was 12.38, and the percentage of polymorphic loci reached 97.02%. This result is highly comparable to the one described by Luo et al. (2001), who reported a 68.7% polymorphism level in 83 similar wild Chinese Vitis clones or accessions using RAPD markers. Polymorphism levels also suggest that SSR and SRAP combined markers is an effective tool for identifying genetic diversities of wild Vitis species native to China, and to separate Chinese wild Vitis from American and European cultivars.
Figure 4. Dendrogram showing genetic relationships among grape species from 4 major ecogeographic regions by the MEGA software. The species numbers are the same as those listed in Table 1.
1971
©FUNPEC-RP www.funpecrp.com.brGenetics and Molecular Research 12 (2): 1962-1973 (2013)
Genetic diversity analysis of Chinese wild Vitis species
Genetic diversity and cluster analysis
The abundant genetic diversity of Chinese wild Vitis species in different ecogeographic regions has resulted from many causes, including climatic, ecologic, and geographic factors, and cultivation history. Chinese wild Vitis species are found predominantly in the Qinling Mountains and the Bashan Mountains, and the Jiangxi, Hubei, and Hunan Provinces have relatively high diversity, with over 30 species found in these areas (Wan et al., 2008). In this study, the genetic diversities of Chinese wild Vitis species from R2 (H = 0.1947, I = 0.3067) and R3 (H = 0.1834, I = 0.2769) were higher. These results are consistent with those of Wan et al. (2008). The ecogeographic regions R2 and R3 comprised the Shaanxi, Henan, Gansu, Hunan, Jiangxi, Zhejiang, Hubei, Anhui, Jiangsu, and some of Shanghai Provinces. The temperature, annual rainfall, and soil are suitable for grape growth, and thus these regions have a higher Vitis diversity (He, 1999b; Kong, 2004).
Genetic similarity values among all the 80 grape accessions ranged from 0.31 to 0.86, which showed a high genetic diversity among these Vitis accessions. The classification of a few Chinese Vitis species adopted by Chinese taxonomists has some controversy and confusion. Whether V. ficifolia is a subspecies of V. quinquangularis or a separate species is still being disputed (Kong, 2004). In this study, the largest genetic distance was found between V. ficifolia and the other wild species, and the relationship between V. ficifolia and V. quinquangularis was distant (Figure 4); therefore, our result agrees with that of Wang (1979) in that V. ficifolia could be considered a separate species. Through morphological trait analysis, He et al. (1996) found that a close relationship existed between V. yeshanensis and V. amurensis, and V. yeshanensis was considered to be a variety of V. amurensis (Lu and Liang, 1993). However, the leaf and shoot morphologies as well as drought tolerance and cold hardiness of V. yeshanensis are dif-ferent from those of V. amurensis, suggesting that it may be a separate species (Niu and He, 1996; He, 1999a). In the present study, a large distance was found between V. yeshanensis and V. amurensis (Figure 4), supporting the view that V. yeshanensis is a separate species.
In this study, SSR and SRAP markers classified studied accessions into different spe-cies (Figure 2); for example, Huaxian-11 was clustered into V. piasekii. The reasons were that interspecific hybridization and gene introgression had probably been involved in the evolution and conservation of the various species (Bell and Hough, 1986). This was also confirmed by the gene flow (Nm = 0.2610) among different Vitis species.
Theoretical significance for Chinese wild Vitis germplasm and breeding
The evaluation and conservation of wild grape germplasms are important for grape breeding programs. Chinese wild Vitis species have been used in breeding program. For exam-ple, V. amurensis, V. quinquangularis, and V. davidii are the most widely used wild Vitis species for breeding in China, the United States, and Germany (He, 1999a). Large genetic variations could provide the opportunity to select and breed new varieties with adaptability to different environments (Hummer and Sugar, 1998). According to the previous and present results, there is a high degree of genetic diversity in Chinese wild Vitis species. Results indicated that parent materials of grape breeding could be selected from the Chinese wild grape species mentioned in this paper, and the genetic distance of parents should be considered first, whereas geographic distance is not important. Furthermore, it is necessary to reinforce the collection and protection
1972
©FUNPEC-RP www.funpecrp.com.brGenetics and Molecular Research 12 (2): 1962-1973 (2013)
Z.B. Jing et al.
of wild grape germplasm resources from ecogeographic regions with higher diversity, such as the Qinling Mountains region and the mid-downstream Yangtze River region.
ACKNOWLEDGMENTS
Research supported by the National Natural Science Foundation of China (#31071782), the 948 Project from Ministry of Agriculture of China (#2012-S12), and the Chinese Universi-ties Scientific Fund (#QN2011056).
REFERENCES
Bell RL and Hough LF (1986). Interspecific and intergeneric hybridization of Pyrus. Hort. Sci. 21: 62-64.Brini W, Mars M and Hormaz JI (2008). Genetic diversity in local Tunisian pears (Pyrus communis L.) studied with SSR
markers. Sci. Hortic. 115: 337-341.Ercisli S, Orhan E, Hizarci Y, Yildirim N, et al. (2008). Genetic diversity in grapevine germplasm resources in the Coruh
valley revealed by RAPD markers. Biochem. Genet. 46: 590-597.Erfani J, Ebadi A, Abdollahi H and Fatahi R (2012). Genetic diversity of some pear cultivars and genotypes using simple
sequence repeat (SSR) markers. Plant. Mol. Biol. Rep. 30: 1065-1072.Guo DL, Zhang JY and Liu CH (2012a). Genetic diversity in some grape varieties revealed by SCoT analyses. Mol. Biol.
Rep. 39: 5307-5313.Guo DL, Zhang JY, Liu CH, Zhang GH, et al. (2012b). Genetic variability and relationships between and within grape
cultivated varieties and wild species based on SRAP markers. Tree Genet. Genomes 8: 789-800.He PC (1999a). Viticulture. China Agriculture Press, Beijing.He PC (1999b). Wild Grape Resources; their Utilization in China. Sino-Overseas Grapevine Wine. Special Volume. 1-5. He PC, Wang YJ, Wang GY, Ren ZB, et al. (1991). The studies on the disease-resistance of Vitis wild species originated
in China. Sci. Agric. Sin. 24: 50-56.He YH, Li CL and Cao YL (1996). Comparative anatomy of vegetative organs in the genus Vitis L.; its systematic
significance. Chinese J. Appl. Environ. Biol. 2: 234-253.Hummer KE and Sugar D (1998). Pear gene bank information on world-wide web. Acta Hort. 475: 117-121.Kong QS (2004). Flora of Chinese Grapes. China Agriculture and Technology Press, Beijing.Li JM and He PC (2000). Study on Important Wine Making Quality Character of Chinese Wild Vitis. Sci. Agric. Sin. 33:
17-23.Lu DZ and Liang HP (1993). A new species of Vitis. J. Beijing For. Univ. 15: 134.Luo SL, He PC, Zheng XQ and Zhou P (2001). Genetic diversity in wild grapes native to China based on randomly
amplified polymorphic DNA (RAPD) analysis. Acta Bot. Sin. 43: 158-163.Ma ZS and He PC (1998). A study on the taxonomy and relationship of wild Vitis native to China with POD isozyme. Acta
Agricult. Boreali-Sin. 13: 122-126.Nei M (1978). Estimation of average heterozygosity and genetic distance from a small number of individuals. Genetics
89: 583-590.Niu LX and He PC (1996). Taxonomy classification of Chinese wild Vitis plants. Acta Hortic. Sin. 23: 209-212.Qu X, Lu J and Lamikanra O (1996). Genetic diversity in Muscadine and American bunch grapes based on randomly
amplified polymorphic DNA (RAPD) analysis. J. Am. Soc. Hort. Sci. 121: 1020-1023.Rohlf FJ (2000). NTSYS-pc: Numerical Taxonomy and Multivariate Analysis System. Version 2.1. Exeter Software,
Setauket.Tamura K, Dudley J, Nei M and Kumar S (2007). MEGA4: Molecular Evolutionary Genetics Analysis (MEGA) software
version 4.0. Mol. Biol. Evol. 24: 1596-1599.Wan YZ, Schwaninger HDL, Simon CJ, Wang YJ, et al. (2008). A review of taxonomic research on Chinese wild grapes.
Vitis 47: 81-88.Wang WT (1979). Vitacearum novitiates. Acta Phytotax. Sin. 17: 73-96.Wang XP, Wang Y, Zhang CH and Zhang J (2007). Isolation and characterization of cDNA encoding stilbene synthases
from Chinese wild Vitis pseudoreticulata. Vitis 46: 104-109.Wang Y, Liu Y, He P, Chen J, et al. (1995). Evaluation of foliar resistance to Uncinula necator in Chinese wild Vitis species.
Vitis 34: 159-164.
1973
©FUNPEC-RP www.funpecrp.com.brGenetics and Molecular Research 12 (2): 1962-1973 (2013)
Genetic diversity analysis of Chinese wild Vitis species
Yeh FC, Yang RC and Boyle T (1999). POPGENE. Microsoft Windows-Based Freeware for Population Genetic Analysis. Release 1.31. University of Alberta, Edmonton.
Zhu L, Wen XY and Li WW (1994). Studies on Photosynthetic Characteristic of a Chinese Wild Species Grapevine. Acta Hortic. Sin. 21: 31-34.