Embed Size (px)
Citation preview
International Journal of Technical Innovation in Modern
Engineering & Science (IJTIMES) Impact Factor: 5.22 (SJIF-2017), e-ISSN: 2455-2585
Volume 4, Issue 9, September-2018
IJTIMES-2018@All rights reserved 233
Analysis of Gap Acceptance, Capacity and Level of service at Unsignalised ‘T’
Intersection under Mixed Traffic Condition
Bhagyalaxmi A1, Dr. D. Rajashekar Reddy
2
1,2Civil Engg. Department, Osmania University, [email protected]
Abstract— The analysis of gap acceptance, capacity and level of service at uncontrolled unsignalised intersection is
very important in developing countries like India. In developed countries such as USA, these intersections are
controlled by using stop sign because their existed individual lanes for different class of vehicles and uniform
traffic conditions. But in India, this was totally different due to all type of vehicles are using same lane which is
considered as mixed traffic condition. Under this condition, each driver’s behavior is different while taking
decision to maneuver the intersection safely. Generally, signals are installing instead of stop signs at these
intersections because, day to day the traffic is increasing continuously and there are no rules and regulation
followed by different drivers to avoid accidents and conflict movements. Installing such signals at every
unsignalised intersection is very expensive. So, before installing signals it is necessary to analyze these
intersections to know the present service of roads. For the present study two uncontrolled unsignalised
intersections at Peerzadiguda X road and Chengicherla X road both NH-163 were selected because, these two
intersections are tackled more congestion as increasing daily traffic. The video graphic survey was carried out to
estimate the gap/lag, arrival rate, approaching vehicle types, waiting time etc.. Based on this data, further
parameters like critical gap, follow-up times, capacity and level of service were estimated accurately using
different field techniques like Modified Raff’s method, Harder Method, Greenshield method and Clearing time
method etc..which were old and latest methods and also used HCM 2010 as a reference manual. Finally, the
results were compared at these intersections to give further solutions like improving of intersection, installing
signals, extent of roads, providing medians, providing stop sign etc. to provide better service for future trends.
Keywords— Unsignalised intersections, Critical gap, Field technique methods, Capacity, Level of service, HCM 2010
I . INTRODUCTION
Two-Way Stopped-Control (TWSC) intersections are common type of intersections. A three-legged intersection was
considered as a standard type of TWSC intersection. This type of intersection consisted a minor street road and vehicles
are used to merge or cross the major street road with stop signs installed on minor road. The service of these
intersections based on relative priorities of the conflicting movements where lower priority movement must yield to
higher priority movement. At these intersections merging, crossing, diverging of traffic was very difficult. The
performance of an unsignalized intersection was strongly influenced by the delay caused by low-priority movements on
minor roads. So the study of such intersections was very risky and challenging one.
The gap was expressed in terms space or time. That means, the distance between the two vehicles considered then gap
was expressed in terms of space. When time elapsed between arrivals of vehicles was considered then gap expressed in
terms of time.
Gap acceptance was a process by which a minor stream vehicle accepts an available gap to maneuver.
Gap acceptance was a behavior of the driver’s decision. This depends on the performance of the drivers. It was a choice
(or) decision chosen by young and old drivers to accept or reject gap. This was a decision process of human brains.
The minimum major-stream headway during which a minor-street vehicle can make a maneuver. That means,
the minimum gap required in major stream for minor stream vehicle to cross the intersection safely. So, the driver’s
critical gap was minimum and must be acceptable. All the drivers rejected the gaps which are less than the critical gap
and accepted the gaps more than critical gap.
International Journal of Technical Innovation in Modern Engineering & Science (IJTIMES) Volume 4, Issue 9, September-2018, e-ISSN: 2455-2585,Impact Factor: 5.22 (SJIF-2017)
IJTIMES-2018@All rights reserved 234
The maximum hourly rate at which persons or vehicles can reasonably be expected to traverse a point or
uniform section of a lane or a roadway during a given time period under prevailing roadway, traffic and control
conditions. Capacity is a quantitative parameter. This was estimated based on HCM manual by choosing input
parameters like critical gap and follow-up time. It was necessary to analyze the capacity at uncontrolled intersections to
improve the service of intersections.
Delay is a fundamental parameter for highway investments. This was an extra time consumed by vehicle than
reference values. Or the additional travel time experienced by a driver, passenger or pedestrian. At these intersections, the
minor street vehicles or low priority vehicles were consumed some extra time and considered as delay. This was the
inversed of capacity.
Level of Service (LOS) is defined as a qualitative measure describing the operational conditions within a traffic
stream and their perception by motorists and or passengers.
This document is a template. An electronic copy can be downloaded from the Journal website. For questions on
paper guidelines, please contact the journal publications committee as indicated on the journal website. Information
about final paper submission is available from the conference website.
II. LITERATURE REVIEW
The gap was defined differently by various researchers. According to them the details of gap and lag was
defined briefly below.
According to Ashworth and Green (1966) gap measured from the rear of one vehicle to the front of the
following vehicle. Adibesi (1982) gap was defined as the major stream headway wholly available to a waiting vehicle
from the minor road. Based on Polus (1983), it as the time interval between two successive vehicles in the major road
stream.
The lag is measurement between two vehicles on different roads. The number of studies done on measuring of
gap, lag and critical gaps. Gap acceptance studies done at unsignalised intersections with priority of vehicles concept
includes, Hawkes (1968), Ashworth(1969), Ashton(1971), Miller(1974), Polus et al(2003), Davis and Swenson(2004),
Kay et al.(2006), and Xu and Tian (2008).
According to Greenshields et al. (1947) , critical gap is the acceptable average minimum time gap. Later, in 1950 maiden
applied regression analysis which is a empirical method to estimate critical gap. In 1950, Raff and Hart defined critical
gap as the lag for which the number of accepted shorter gaps is equal to the number of rejected longer than it.
Ashalatha et al (2011) carried out a study on critical gap by clearing behavior of drivers at unsignalised
intersections under mixed traffic condition. In his study, video recording technique was used for data collection. The
method was simple and applicable to mixed traffic conditions.
Sai et.al (2014) found that the capacity of any uncontrolled intersection of Indian, was highly depends on the
gap acceptance behavior. In his study, a micro second difference in gap measurement leads to considerable error in
capacity estimation. So, they concluded that the majority of the gaps were between 0-2 sec.
In 1991, Heidemann analysed formulas for the calculation of mean queue lengths and average delays for
vehicles on the minor roads at priority intersections. In 1999 Troutbeck observed the limited priority situations such that
minor street vehicles were entered into a major stream. Troutbeck developed the relationships to estimate capacity and
maximum delay for minor street vehicles. Kaysi and Alam in 2000 developed a simulation technique to understand the
driver behaviors such as aggressiveness, impatience, experience and traffic stream intersection at normally priority
unsignalised intersections. In 2007, Wan Hashim et.al showed that critical gap acceptance procedure is still widely used
for estimating vehicle capacity of unsignalised intersection.
III. OBJECTIVES OF THE STUDY
1. To decide critical gap by various methods like Raff’s Method, Harder method, Greenshield method & Clearing time
method which are old and latest methods.
2. To find out the control delay, queue lengths and level of service of minor and major streams.
3. To scrutinize the capacity and level of service of minor and major turns of selected intersections using HCM 2010.
4. To judge against the results at selected uncontrolled intersections under heterogeneous traffic conditions.
5. To ascertain the present condition and service of intersections based on the analysis.
6. To provide alternative solutions for better service of intersections.
International Journal of Technical Innovation in Modern Engineering & Science (IJTIMES) Volume 4, Issue 9, September-2018, e-ISSN: 2455-2585,Impact Factor: 5.22 (SJIF-2017)
IJTIMES-2018@All rights reserved 235
IV. STUDY AREA AND DATA COLLECTION
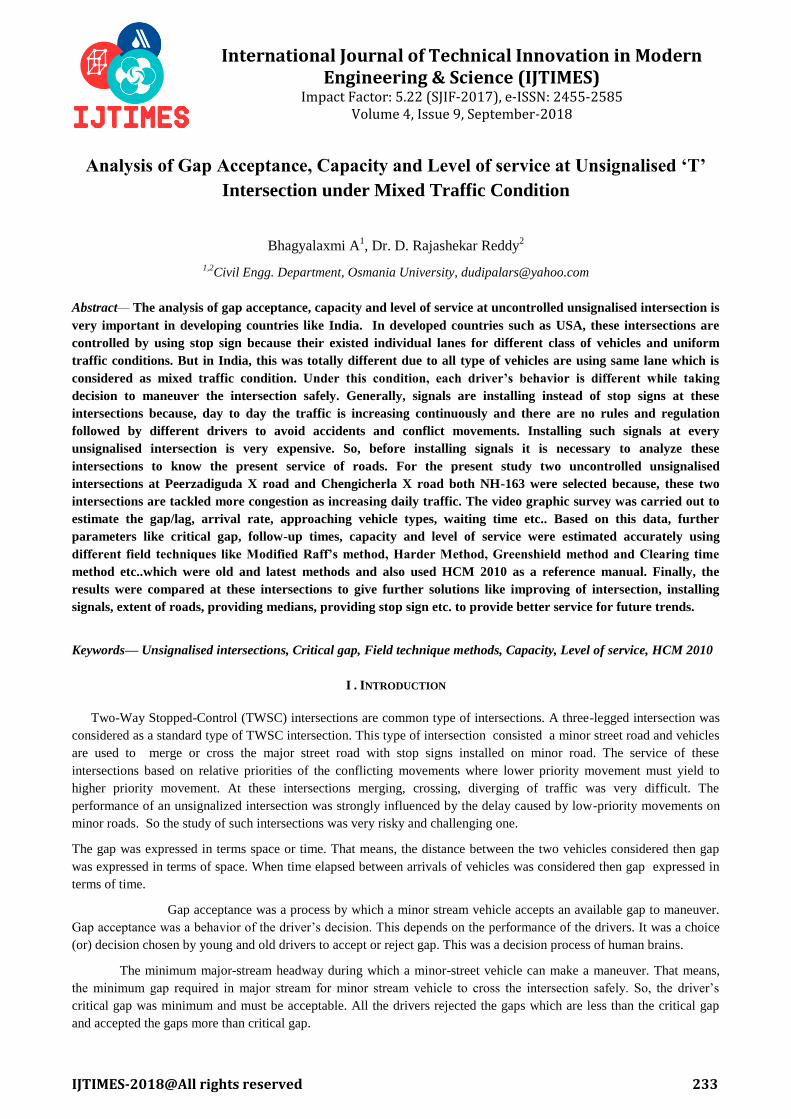
For the present study two “T” intersections were selected one at Peerzadiguda X road near to Boduppal and
another at Chengicherla X road near to Medipally of Hyderabad for estimating critical gap and analyzing LOS. These
intersections are controlled traffic police.
Fig. 1 Layout of Chengicherla X Road and Peerzadiguda X Road
The video graphic technique was used to determine all parameters. The preliminary survey was conducted to know the
geometric conditions of chosen intersections. The video camera was fixed at a side of intersections to observe all
movements through major as well as minor streams. The survey was conducted for one week on Monday, Wednesday
and Friday during morning 8-10A.M to extract traffic data by using video editor tool.
From the video graphic survey the various parameters like, gap, accepted or rejected, follow-up times, clearing time etc.,
were measured from major right turn as well as minor right turn for both intersections. In this study, only two directions
were chosen as conflict movements.
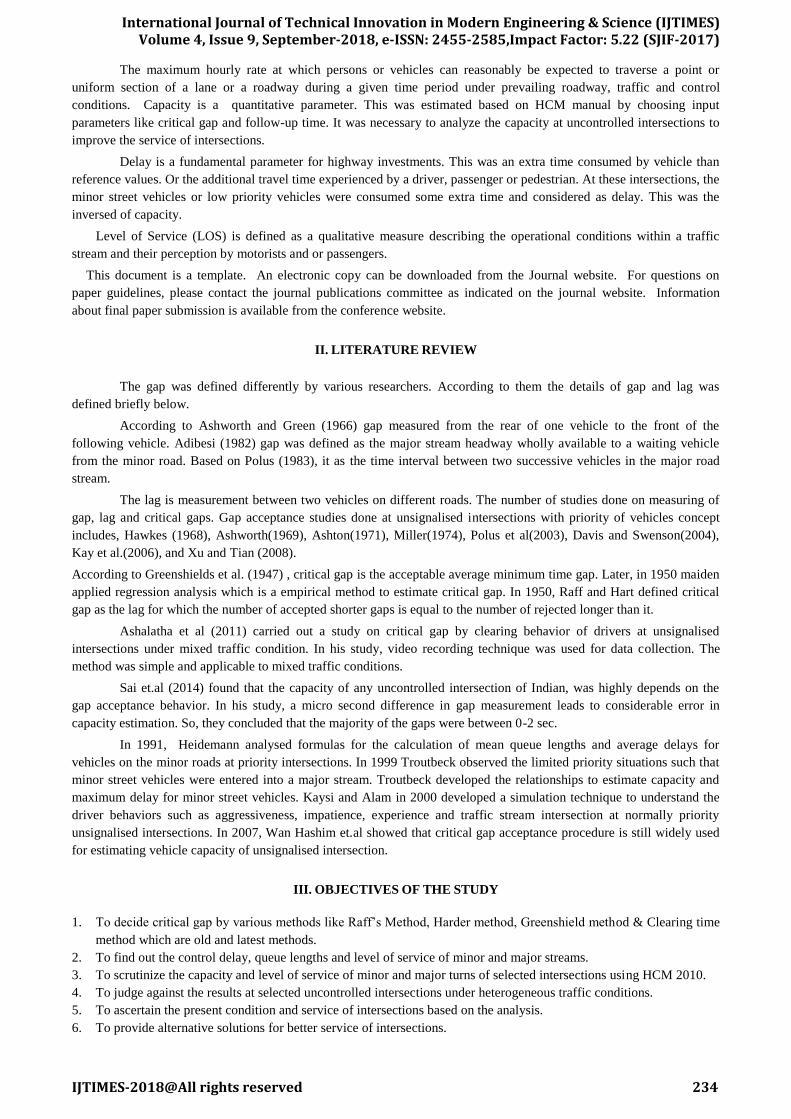
Table 1 Input Data from the field for LOS Analysis
N
o
Minor to Major Major to Straight
Vehicle
type
(A)
Entry
time
(B)
Start
time
(C)
Exit
Time
(D)
Vehicle
type
(E)
Entry
time
(F)
Clearance
of area
time(G)
Gap
(H)
A/R
(I)
Follow-
up
time
Clearing
time
1 Bike 00:22:110 00:23:010 00:28:820 Bike 00:22:360 00:23:760 1.65 R 5.81
Bike 00:26:360 00:27:970 2.6 A
2 4W 02:01:230 02:07:420 02:16:180 Car 02:01:360 02:03:440 2.21 R 1.69 8.76
Bike 02:08:430 02:08:430 02:13:420 Car 02:03:660 02:06:480 0.22 R 4.99
Bike 02:09:330 02:09:330 02:14:490 Car 02:07:720 02:09:800 1.24 R 1.07 5.16
Bike 02:11:700 02:16:270 1.9 A
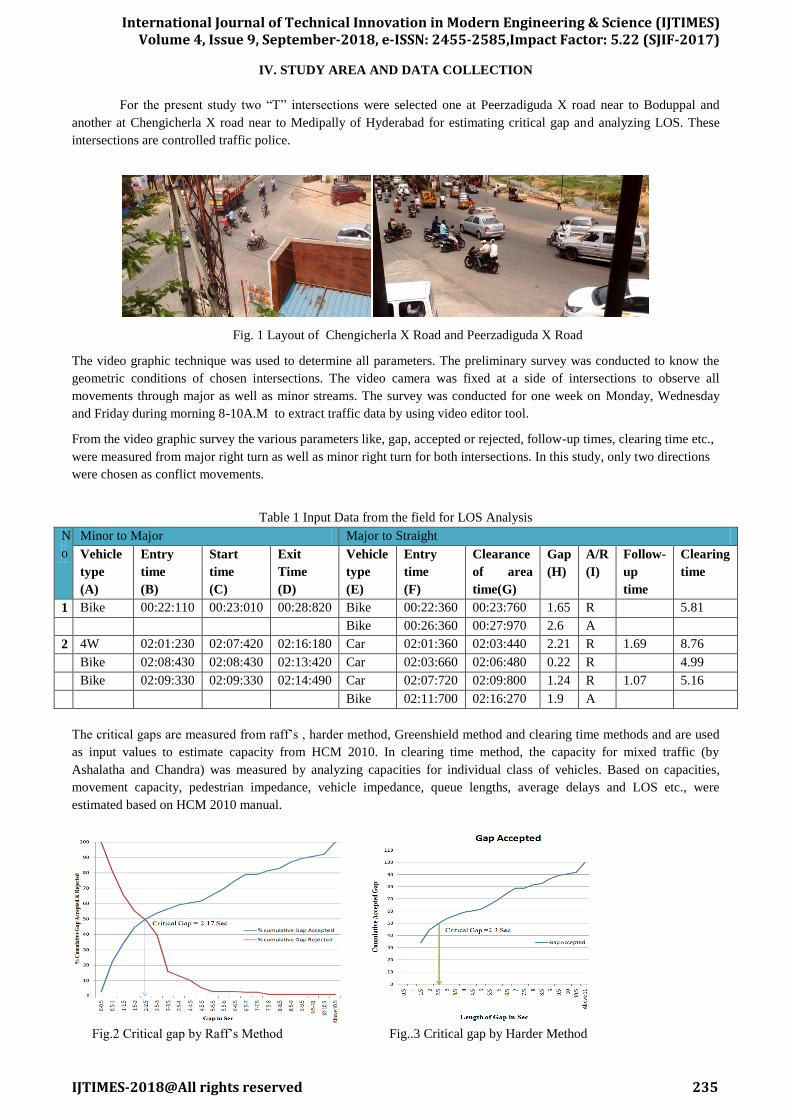
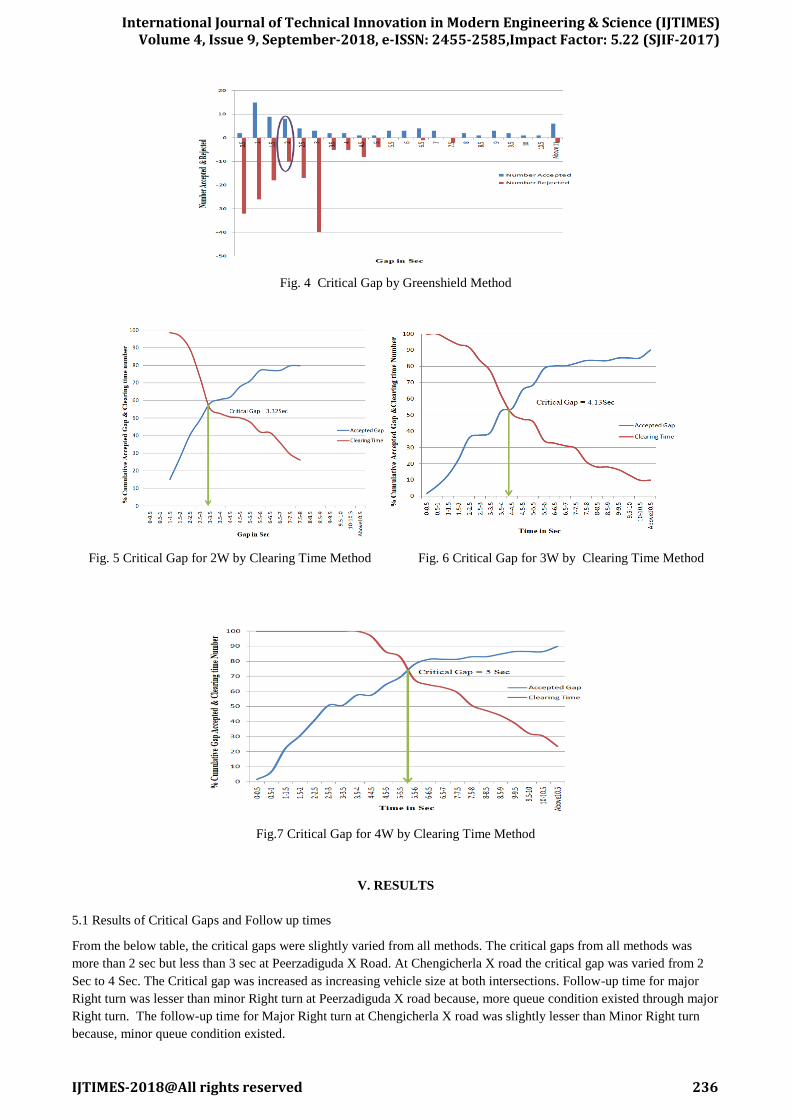
The critical gaps are measured from raff’s , harder method, Greenshield method and clearing time methods and are used
as input values to estimate capacity from HCM 2010. In clearing time method, the capacity for mixed traffic (by
Ashalatha and Chandra) was measured by analyzing capacities for individual class of vehicles. Based on capacities,
movement capacity, pedestrian impedance, vehicle impedance, queue lengths, average delays and LOS etc., were
estimated based on HCM 2010 manual.
Fig.2 Critical gap by Raff’s Method Fig..3 Critical gap by Harder Method
International Journal of Technical Innovation in Modern Engineering & Science (IJTIMES) Volume 4, Issue 9, September-2018, e-ISSN: 2455-2585,Impact Factor: 5.22 (SJIF-2017)
IJTIMES-2018@All rights reserved 236
Fig. 4 Critical Gap by Greenshield Method
Fig. 5 Critical Gap for 2W by Clearing Time Method Fig. 6 Critical Gap for 3W by Clearing Time Method
Fig.7 Critical Gap for 4W by Clearing Time Method
V. RESULTS
5.1 Results of Critical Gaps and Follow up times
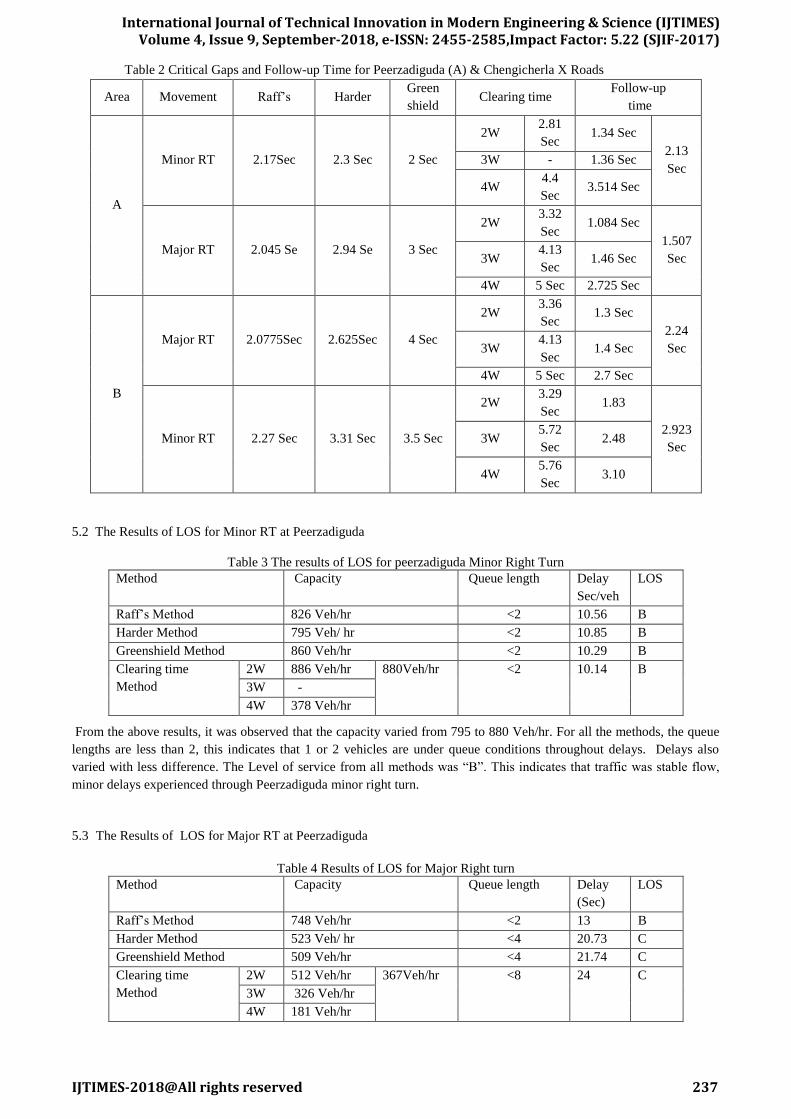
From the below table, the critical gaps were slightly varied from all methods. The critical gaps from all methods was
more than 2 sec but less than 3 sec at Peerzadiguda X Road. At Chengicherla X road the critical gap was varied from 2
Sec to 4 Sec. The Critical gap was increased as increasing vehicle size at both intersections. Follow-up time for major
Right turn was lesser than minor Right turn at Peerzadiguda X road because, more queue condition existed through major
Right turn. The follow-up time for Major Right turn at Chengicherla X road was slightly lesser than Minor Right turn
because, minor queue condition existed.
International Journal of Technical Innovation in Modern Engineering & Science (IJTIMES) Volume 4, Issue 9, September-2018, e-ISSN: 2455-2585,Impact Factor: 5.22 (SJIF-2017)
IJTIMES-2018@All rights reserved 237
Table 2 Critical Gaps and Follow-up Time for Peerzadiguda (A) & Chengicherla X Roads
Follow-up
time Clearing time
Green
shield Harder Raff’s Movement Area
2.13
Sec
1.34 Sec 2.81
Sec 2W
2 Sec 2.3 Sec 2.17Sec Minor RT
A
1.36 Sec - 3W
3.514 Sec 4.4
Sec 4W
1.507
Sec
1.084 Sec 3.32
Sec 2W
3 Sec 2.94 Se 2.045 Se Major RT 1.46 Sec
4.13
Sec 3W
2.725 Sec 5 Sec 4W
2.24
Sec
1.3 Sec 3.36
Sec 2W
4 Sec 2.625Sec 2.0775Sec Major RT
B
1.4 Sec 4.13
Sec 3W
2.7 Sec 5 Sec 4W
2.923
Sec
1.83 3.29
Sec 2W
3.5 Sec 3.31 Sec 2.27 Sec Minor RT 2.48 5.72
Sec 3W
3.10 5.76
Sec 4W
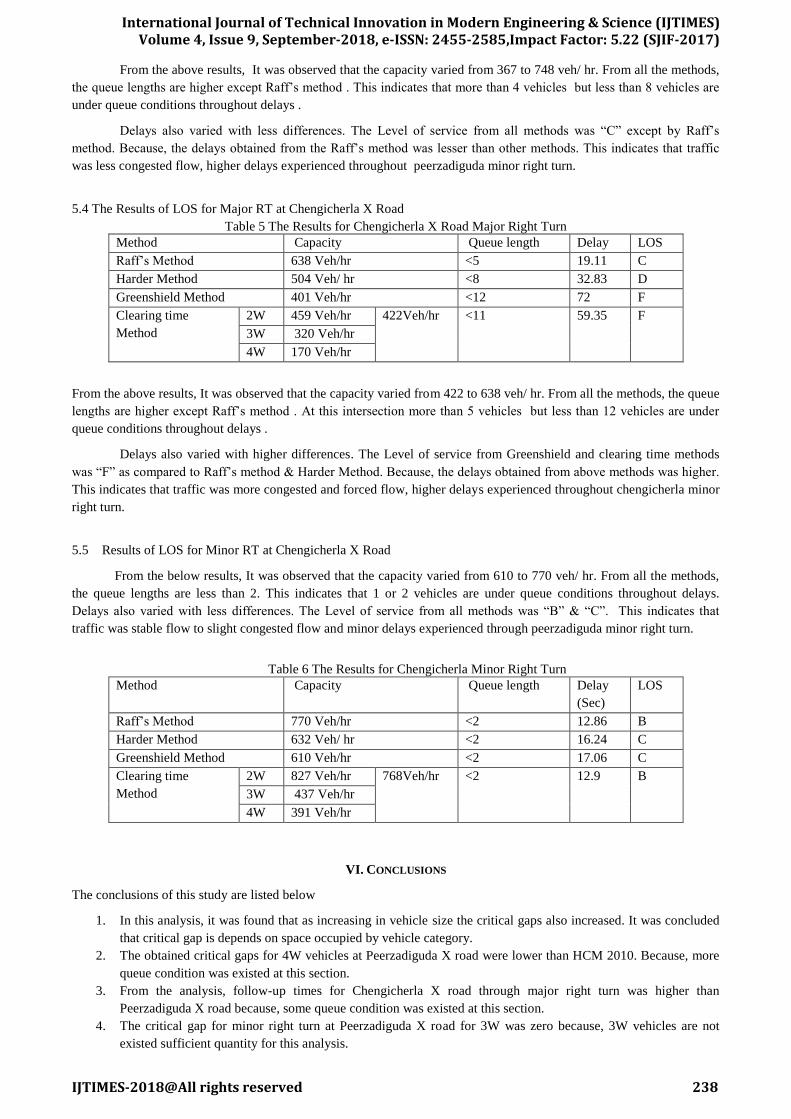
5.2 The Results of LOS for Minor RT at Peerzadiguda
Table 3 The results of LOS for peerzadiguda Minor Right Turn
Method Capacity Queue length Delay
Sec/veh
LOS
Raff’s Method 826 Veh/hr <2 10.56 B
Harder Method 795 Veh/ hr <2 10.85 B
Greenshield Method 860 Veh/hr <2 10.29 B
Clearing time
Method
2W 886 Veh/hr 880Veh/hr <2 10.14 B
3W -
4W 378 Veh/hr
From the above results, it was observed that the capacity varied from 795 to 880 Veh/hr. For all the methods, the queue
lengths are less than 2, this indicates that 1 or 2 vehicles are under queue conditions throughout delays. Delays also
varied with less difference. The Level of service from all methods was “B”. This indicates that traffic was stable flow,
minor delays experienced through Peerzadiguda minor right turn.
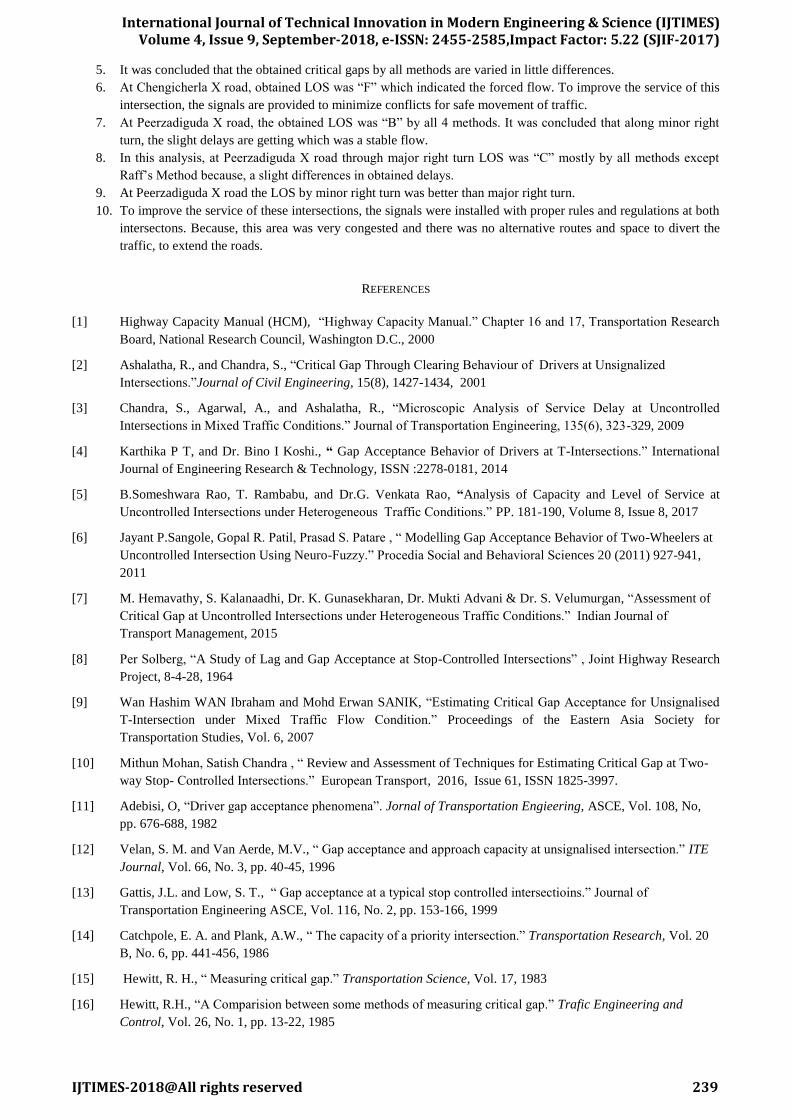
5.3 The Results of LOS for Major RT at Peerzadiguda
Table 4 Results of LOS for Major Right turn
Method Capacity Queue length Delay
(Sec)
LOS
Raff’s Method 748 Veh/hr <2 13 B
Harder Method 523 Veh/ hr <4 20.73 C
Greenshield Method 509 Veh/hr <4 21.74 C
Clearing time
Method
2W 512 Veh/hr 367Veh/hr <8 24 C
3W 326 Veh/hr
4W 181 Veh/hr
International Journal of Technical Innovation in Modern Engineering & Science (IJTIMES) Volume 4, Issue 9, September-2018, e-ISSN: 2455-2585,Impact Factor: 5.22 (SJIF-2017)
IJTIMES-2018@All rights reserved 238
From the above results, It was observed that the capacity varied from 367 to 748 veh/ hr. From all the methods,
the queue lengths are higher except Raff’s method . This indicates that more than 4 vehicles but less than 8 vehicles are
under queue conditions throughout delays .
Delays also varied with less differences. The Level of service from all methods was “C” except by Raff’s
method. Because, the delays obtained from the Raff’s method was lesser than other methods. This indicates that traffic
was less congested flow, higher delays experienced throughout peerzadiguda minor right turn.
5.4 The Results of LOS for Major RT at Chengicherla X Road
Table 5 The Results for Chengicherla X Road Major Right Turn
Method Capacity Queue length Delay LOS
Raff’s Method 638 Veh/hr <5 19.11 C
Harder Method 504 Veh/ hr <8 32.83 D
Greenshield Method 401 Veh/hr <12 72 F
Clearing time
Method
2W 459 Veh/hr 422Veh/hr <11 59.35 F
3W 320 Veh/hr
4W 170 Veh/hr
From the above results, It was observed that the capacity varied from 422 to 638 veh/ hr. From all the methods, the queue
lengths are higher except Raff’s method . At this intersection more than 5 vehicles but less than 12 vehicles are under
queue conditions throughout delays .
Delays also varied with higher differences. The Level of service from Greenshield and clearing time methods
was “F” as compared to Raff’s method & Harder Method. Because, the delays obtained from above methods was higher.
This indicates that traffic was more congested and forced flow, higher delays experienced throughout chengicherla minor
right turn.
5.5 Results of LOS for Minor RT at Chengicherla X Road
From the below results, It was observed that the capacity varied from 610 to 770 veh/ hr. From all the methods,
the queue lengths are less than 2. This indicates that 1 or 2 vehicles are under queue conditions throughout delays.
Delays also varied with less differences. The Level of service from all methods was “B” & “C”. This indicates that
traffic was stable flow to slight congested flow and minor delays experienced through peerzadiguda minor right turn.
Table 6 The Results for Chengicherla Minor Right Turn
Method Capacity Queue length Delay
(Sec)
LOS
Raff’s Method 770 Veh/hr <2 12.86 B
Harder Method 632 Veh/ hr <2 16.24 C
Greenshield Method 610 Veh/hr <2 17.06 C
Clearing time
Method
2W 827 Veh/hr 768Veh/hr <2 12.9 B
3W 437 Veh/hr
4W 391 Veh/hr
VI. CONCLUSIONS
The conclusions of this study are listed below
1. In this analysis, it was found that as increasing in vehicle size the critical gaps also increased. It was concluded
that critical gap is depends on space occupied by vehicle category.
2. The obtained critical gaps for 4W vehicles at Peerzadiguda X road were lower than HCM 2010. Because, more
queue condition was existed at this section.
3. From the analysis, follow-up times for Chengicherla X road through major right turn was higher than
Peerzadiguda X road because, some queue condition was existed at this section.
4. The critical gap for minor right turn at Peerzadiguda X road for 3W was zero because, 3W vehicles are not
existed sufficient quantity for this analysis.
International Journal of Technical Innovation in Modern Engineering & Science (IJTIMES) Volume 4, Issue 9, September-2018, e-ISSN: 2455-2585,Impact Factor: 5.22 (SJIF-2017)
IJTIMES-2018@All rights reserved 239
5. It was concluded that the obtained critical gaps by all methods are varied in little differences.
6. At Chengicherla X road, obtained LOS was “F” which indicated the forced flow. To improve the service of this
intersection, the signals are provided to minimize conflicts for safe movement of traffic.
7. At Peerzadiguda X road, the obtained LOS was “B” by all 4 methods. It was concluded that along minor right
turn, the slight delays are getting which was a stable flow.
8. In this analysis, at Peerzadiguda X road through major right turn LOS was “C” mostly by all methods except
Raff’s Method because, a slight differences in obtained delays.
9. At Peerzadiguda X road the LOS by minor right turn was better than major right turn.
10. To improve the service of these intersections, the signals were installed with proper rules and regulations at both
intersectons. Because, this area was very congested and there was no alternative routes and space to divert the
traffic, to extend the roads.
REFERENCES
[1] Highway Capacity Manual (HCM), “Highway Capacity Manual.” Chapter 16 and 17, Transportation Research
Board, National Research Council, Washington D.C., 2000
[2] Ashalatha, R., and Chandra, S., “Critical Gap Through Clearing Behaviour of Drivers at Unsignalized
Intersections.”Journal of Civil Engineering, 15(8), 1427-1434, 2001
[3] Chandra, S., Agarwal, A., and Ashalatha, R., “Microscopic Analysis of Service Delay at Uncontrolled
Intersections in Mixed Traffic Conditions.” Journal of Transportation Engineering, 135(6), 323-329, 2009
[4] Karthika P T, and Dr. Bino I Koshi., “ Gap Acceptance Behavior of Drivers at T-Intersections.” International
Journal of Engineering Research & Technology, ISSN :2278-0181, 2014
[5] B.Someshwara Rao, T. Rambabu, and Dr.G. Venkata Rao, “Analysis of Capacity and Level of Service at
Uncontrolled Intersections under Heterogeneous Traffic Conditions.” PP. 181-190, Volume 8, Issue 8, 2017
[6] Jayant P.Sangole, Gopal R. Patil, Prasad S. Patare , “ Modelling Gap Acceptance Behavior of Two-Wheelers at
Uncontrolled Intersection Using Neuro-Fuzzy.” Procedia Social and Behavioral Sciences 20 (2011) 927-941,
2011
[7] M. Hemavathy, S. Kalanaadhi, Dr. K. Gunasekharan, Dr. Mukti Advani & Dr. S. Velumurgan, “Assessment of
Critical Gap at Uncontrolled Intersections under Heterogeneous Traffic Conditions.” Indian Journal of
Transport Management, 2015
[8] Per Solberg, “A Study of Lag and Gap Acceptance at Stop-Controlled Intersections” , Joint Highway Research
Project, 8-4-28, 1964
[9] Wan Hashim WAN Ibraham and Mohd Erwan SANIK, “Estimating Critical Gap Acceptance for Unsignalised
T-Intersection under Mixed Traffic Flow Condition.” Proceedings of the Eastern Asia Society for
Transportation Studies, Vol. 6, 2007
[10] Mithun Mohan, Satish Chandra , “ Review and Assessment of Techniques for Estimating Critical Gap at Two-
way Stop- Controlled Intersections.” European Transport, 2016, Issue 61, ISSN 1825-3997.
[11] Adebisi, O, “Driver gap acceptance phenomena”. Jornal of Transportation Engieering, ASCE, Vol. 108, No,
pp. 676-688, 1982
[12] Velan, S. M. and Van Aerde, M.V., “ Gap acceptance and approach capacity at unsignalised intersection.” ITE
Journal, Vol. 66, No. 3, pp. 40-45, 1996
[13] Gattis, J.L. and Low, S. T., “ Gap acceptance at a typical stop controlled intersectioins.” Journal of
Transportation Engineering ASCE, Vol. 116, No. 2, pp. 153-166, 1999
[14] Catchpole, E. A. and Plank, A.W., “ The capacity of a priority intersection.” Transportation Research, Vol. 20
B, No. 6, pp. 441-456, 1986
[15] Hewitt, R. H., “ Measuring critical gap.” Transportation Science, Vol. 17, 1983
[16] Hewitt, R.H., “A Comparision between some methods of measuring critical gap.” Trafic Engineering and
Control, Vol. 26, No. 1, pp. 13-22, 1985
International Journal of Technical Innovation in Modern Engineering & Science (IJTIMES) Volume 4, Issue 9, September-2018, e-ISSN: 2455-2585,Impact Factor: 5.22 (SJIF-2017)
IJTIMES-2018@All rights reserved 240
[17] Brilon, W., and Wu, N., “ Capacity at Unsignalized Intersections Derived by conflict Technique.”
Transportation Research Record, 1776, 82-90, 2001
[18] Brilon, W., Koenig, R., and Troutbeck, R.J., “ Useful Estimation Procedures for Critical Gap.” Transportation
Research Part A:Policy and Practice, 33(3-4), 161-186, 1999
[19] B.D. Greenshields, D. Shapiro, E.L. Erickson, Traffic Performance at Urban Street 4 Intersections,Technical
Report 1, Bureau of Highway Traffic, Yale University, New Haven, 1947
[20] M.S Raff, J.W. Hart, A Volume Warrant for Urban Stop Sign, Traffic Engineering and Control, 5/1983, pp.255-
258, 1950