Embed Size (px)
Citation preview

Analysis of Food Labels for Agricultural Biotechnology
by
Everald Mclennon and R. Wes Harrison 1
January 8, 2003
Corresponding Author:
R. Wes Harrison 101 Agr. Administration Bldg., LSU
Dept. of Agricultural Economics & Agribusiness Baton Rouge, LA 70803-5604
Selected Paper Presented at the Southern Agricultural Economics Association
2003 Annual Meeting Mobile, Alabama
Copyright 2003 by Everald Mclennon and R. Wes Harrison. All rights reserved
1 Everald Mclennon and R. Wes Harrison are former research assistant and associate professor, respectively. Department of Agricultural Economics and Agribusiness, Louisiana State University Agricultural Center, Baton Rouge LA.

Abstract Analysis of Food Labels for Agricultural Biotechnology. Everald Mclennon, Louisiana State University, R. Wes Harrison, Louisiana State University Conjoint analysis is used to measure consumer preferences for alternative biotech labeling formats. The study found that consumers overwhelmingly support mandatory labeling of biotech foods. Results also showed that the preferred labeling format is a text disclosure that describes the benefits of biotechnology in combination with a biotech logo.
Analysis of Food Labels for Agricultural Biotechnology
Food labeling has been an important policy issue since the Nutrition Labeling and
Education Act (NLEA) of 1990 replaced the voluntary system of labeling established by
the U.S. Food and Drug Administration (FDA) in 1973. The act requires mandatory
nutrition labeling for packaged food and strict regulation of nutrition content and health
claims. Labeling is a means of shaping consumers’ knowledge and purchasing patterns,
as well as, altering manufacturers’ product offering and marketing practices (Caswell and
Mojduszka, 1996). It influences product design, promotes consumer confidence, and
contributes to the consumer’s education regarding diet and health.
Agricultural biotechnology is a collection of scientific techniques that involves
taking the genes from one plant or animal species and inserting them in another species to
transfer a desired trait or characteristic. Modern techniques include genetic engineering
and the use of transgenic plants. For farmers, biotechnology is a means to reduce
production costs, enhance yields, and increase profits. Public benefits of agricultural
biotechnology include reductions in pesticide and herbicide use, as well as enhanced
nutritional value, flavor, and shelf life of many foods. Despite the benefits and rapid
adoption by farmers, consumer acceptance has been controversial, as some consumer and
special interest groups have expressed concerns over the safety and environmental effects
of biotech foods (USDA/ERS, 1991). This is largely due to fears that biotech foods may
have some unforeseen health risks, as well as, unforeseen negative effects on wildlife and
the environment.
Consumer concerns regarding the possible negative affects of biotechnology have
made labeling of biotech foods an important public policy issue. The FDA has adopted a
2
voluntary labeling policy, since tests have shown that the nutritional value of biotech
foods is not significantly different from their traditional counterparts. Proponents of this
policy argue that mandatory labeling would unnecessarily raise health concerns about
biotech foods, and lead to higher food prices. Critics of the policy argue that food
produced through biotechnology should be labeled, even if the nutritional aspect of the
food has not been altered. They argue consumers have a right to know. This study
examines the labeling preferences of United States consumers for biotech foods. The
objective of the study is to measure consumer preferences for alternate biotech labeling
formats.
The Current Debate
The theory of food labeling was articulated in the mid 1990’s by Caswell and
Padberg (1992) and Caswell and Mojduzka (1996). Economic theory suggests that
government regulation of food labels is justified when market failure occurs because of
information asymmetry between consumers and food suppliers. Caswell and Mojduzka
(1996) argue that food products may be viewed as bundles of product characteristics that
consumers evaluate when making buying decisions. Food characteristics can be
classified as search attributes, experience attributes, or credence attributes. Search
attributes are characteristics that consumers can easily inspect or research prior to
purchase, e.g. price, diversity of goods supplied, color, and some quality characteristics.
Experience attributes can be evaluated only after purchase, such as flavor and cooking
characteristics. Food safety characteristics may also be experience attributes, but food-
borne illnesses are often difficult to trace back to a specific food or food-borne pathogen.
Credence attributes are attributes that consumers cannot easily identify or inspect prior to,
3
or after purchase. These include most food safety attributes, as well as process-oriented
attributes such as how a crop is grown, how food is processed, and whether
biotechnology was used in the production of food ingredients. Much of the debate over
the labeling of biotech foods is couched in terms of the consumer’s right to full disclosure
of the biotech ingredients, balanced by the government’s role in regulating the amount
and type of information supplied to consumers, and the cost of supplying this
information.
The right to full disclosure is the basis for the European Union’s mandatory
labeling policy. As discussed by Isaac and Phillips (2000), consumers are concerned
about the long-term impacts on human health, environmental biodiversity, as well as the
moral, ethical, and religious implication of biotechnology. Voluntary labeling means that
consumer’s are not given the choice to avoid biotechnology if they wish to. Even if food
suppliers chose to label some products “GMO free”, consumers would not know whether
products without this label contained GMO ingredients or not. Lack of a mandatory
labeling policy means consumers have no way to know if their food contains biotech
ingredients.
On the other hand, Caswell (2000) argues there are several practical and
economic reasons for not requiring all information to be disclosed on food labels. For
example, the present status of the global supply chain for food makes it virtually
impossible to ensure that GMO ingredients are not commingled with non-GMO
ingredients (Isaac and Phillips, 2000). The cost of assuring the segregation of GMO and
non-GMO ingredients would be large, and this cost would be passed on to consumers in
the form of higher food prices. Moreover, there is a limit to the amount of information

4
that can be realistically displayed on a label, as well as, limits on the desire and ability of
consumers to make use of this information.
The current U.S. policy is based on the rational that the consumer’s right to know
should be mitigated by the fact that scientific testing shows biotech foods are
nutritionally the same as their traditional counterparts. Therefore, they pose no greater
health risks than any other food. If biotech foods are determined to be nutritionally
different from their traditiona l counterparts, then mandatory labeling is required.
Otherwise, mandatory labeling would unnecessarily raise the health concerns of
consumers, would be costly implement, and would lead to higher labeling costs, and
therefore higher food prices. The U.S. policy provides for voluntary labeling of food
products that contain no biotech ingredients, given that a disclaimer is added noting the
government’s judgment about any differences between foods that use or do not use
GMOs (Caswell, 1998).
Literature Review
Several studies have examined the linkages between the consumer’s knowledge of
biotechnology and the perceived health risks associated with biotech foods. Grobe et al.
(1996), conducted a national survey to analyze consumers’ risk perceptions of
recombinant bovine growth hormone, (rbGH). A multinomial logit model was used to
analyze how respondents’ risk perceptions are affected by their knowledge of rbGH, as
well as differences in their personal health risks and other socioeconomic and
demographic variables. The study found that consumers with similar information
displayed varying levels of risk perception. Consumers who were unaware of rbGH’s use,
but were provided the same brief description of rbGH as more informed respondents, still
5
exhibited diverse risk perceptions that ranged from believing the product was safe to
perceiving personal susceptibility.
Hoban and Kendal (1992) analyzed consumers’ perception about food safety and
biotechnology in developed countries such as the United States, Australia, United
Kingdom and Japan. Telephone surveys were conducted in both Japan and the United
States from 1995 to 1998. Results indicated that an increasing number of consumers were
willing to purchase genetically modified food products. In Australia, a national
government survey of 1,378 people showed that 89% of respondents said that genetically
engineered tomatoes should be labeled so that people could decide whether they wanted
to eat these tomatoes or not. Only 4% percent were against labeling. About 65% percent
said that labeling engineered tomatoes would be a good idea, while 65% percent said that
unlabeled engineered tomato would be a bad idea (www. consumersinternational.org/
campaigns/surveys.html)
Previous studies have indicated that consumers desire labels to indicate the
presence of genetically modified ingredients (Huffman et al., 2001). One study relating to
the labeling of GE foods was conducted by the Wirthlin Group Quorum Survey.
Approximately 1000 telephone interviews were conducted in March 1997, February
1999, and October 1999. When asked how informed they are about biotechnology, less
than 20 percent of consumers felt they were very well informed about the technology.
The study found that on average, 78% of Americans support the current FDA labeling
policy for biotech foods. The present policy of the FDA is that labeling of biotech foods
should be voluntary, since it has been determined these foods have the same safety and
nutritional contents as other foods. According to the study, consumers were still likely to
6
agree with the labeling position of the FDA’s even after they were told of the mandatory
labeling policy as argued by critics of the FDA. Critics of the policy say that any food
produced through biotechnology should be labeled, even if the safety aspect of the food
has not been altered.
According to Hallman et al., (1995), 84% of the 604 residents surveyed wanted
mandatory labeling on engineered fruits and vegetables. Sixty percent of the population
would consider buying fresh vegetables if they were labeled as having been produced by
genetic engineering. Also, 58% would not specifically look for biotech labels while
shopping. Forty-two percent of the people who said they would look for produce labeled
as not genetically engineered, also said they would buy produce that was genetically
engineered if the label gave this information. Other studies by Hoban and Kendall (1992),
Maki (1995), Douthitt (1990), and Novartis (1997) found that most Americans want
foods that are genetically modified to be clearly identified with labels.
Methods
Conjoint analysis (CA) is widely used in market research because it allows for a
consumer’s total utility for a multidimensional product to be decomposed into
combinations of part-worth utilities for each attribute of the product. CA is useful
because it provides a technique for measuring and evaluating the relative importance of
the individual characteristics of a product. Numerous studies have used conjoint analysis
to examine consumer or buyer preferences (Holland and Wessels, 1998; Harrison,
Özayan, and Meyers; 1998; Huang and Fu, 1995; Halbrendt, Wirth, and Vaughn, 1991;
Anderson and Bettencourt, 1993). The present study applies conjoint analysis to the
biotech labeling issue. CA is used to determine consumer preferences for alternative
labeling formats. The steps involved in a conjoint study include identification of relevant
product attributes and their respective levels, selection of an experimental design and
7
survey instrument, and estimation of consumer part-worth utilities. Each step is
discussed in this section of the paper.
Selection of Product Attributes
A focused group discussion is frequently used for identifying and refining
attribute levels in a CA stud ies. The focus group for this study was conducted on October
17, 2001. Five women and one man from the Baton Rouge area were recruited randomly
from the phone book. The purpose of the focus group was to, (1) obtain information
regarding the consumers’ general knowledge about biotechnology, and to (2) identify
labeling attributes that are most likely to contribute to the consumer’s preferences and
understanding of biotech foods. Participants were asked to briefly describe what they
knew about biotechnology. The moderator then guided them through a discussion about
biotechnology and labeling issues in general. Handouts with information on
biotechnology were distributed to each participant. Information included (a) a scientific
definition of biotechnology, (b) examples of food that contained genetically modified
ingredients, (c) agencies that are responsible for food labeling and food label
requirements in the U.S., and (d) information provided by food labels. The second part of
the focus group focused on labeling of products using biotechnology. Participants were
presented with twelve different examples of biotech food labeling. The labels differed in
terms of (1) the use of a biotech logo, (2) text disclosure of biotech ingredients, (3)
information about government agencies that inspect and approve food products for
human consumption. Participants were asked to rank labeling formats that ranged from a
simple text disclosure to a “GMO Free” logo. Results of the focus group suggested that
participants ranked short and simple text disclosures the highest, e.g., “this product
8
contains ingredients produced through biotechnology”. Text disclosures that contained
beneficial information were also ranked highly by focus group participates, e.g. “this
product contains soybean oil developed using biotechnology to decrease the amount of
saturated fat”. A biotech logo was also included in the pre-tests. Labels with only a logo
were ranked lower than text disclosure, but some respondents indicated that a logo on the
primary display panel with text disclosure on the information panel was desirable. The
“GMO Free” label did not rank high among the focus group participants. Based on these
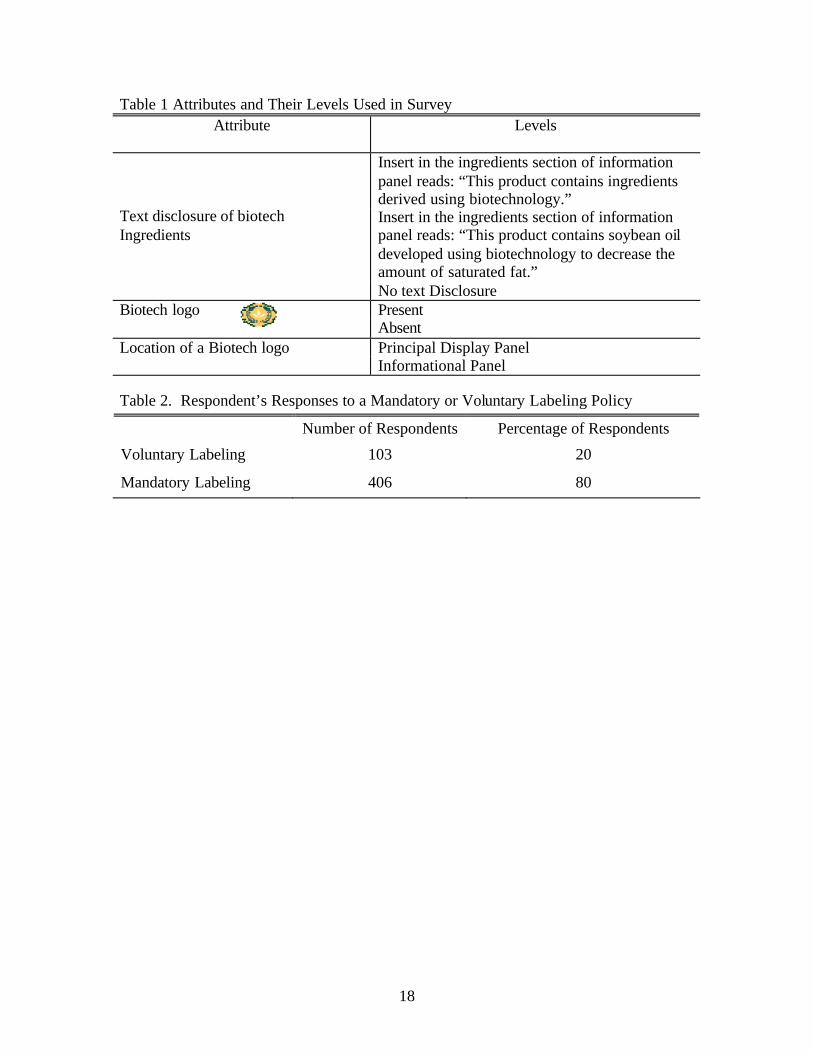
results, the attributes and attribute- levels selected for this study are presented in table 1.
As illustrated in the table, the study calls for a 3X2X2 factorial design. A full factorial
experimental design would involve 12 hypothetical labeling formats. Most subjects have
difficulty rating more than 10 product profiles, so a fractional factorial design was used to
reduce the number of profiles to 7 attribute-level combinations. The Bretton-Clark
Designer (1988) program was used to select the sample. This program minimizes the
confounding of attribute main effects by selecting a sub sample of orthogonal product
combinations.
The Survey A questionnaire was developed that included questions on mandatory versus
voluntary labeling preferences; a conjoint experimental design on labeling formats;
questions on the purchasing patterns of biotech foods; questions regarding the
consumer’s use of food labels; and, questions on consumer demographics.
The first part of the questionnaire provided background information on
biotechnology. It included a definition, the present and future uses (benefits), and
examples of present applications of the technology. This was followed by several

9
questions regarding the respondent’s general knowledge of, and their attitudes toward
biotechnology. Following this introductory section, respondents were asked to choose
between a mandatory labeling and a voluntary labeling policy for biotech foods. A
second question asked respondents to choose the minimum percentage of genetically
modified ingredients necessary for a product to be labeled. The final set of questions
collected information regarding the demographic and socio-economic characteristics of
the respondent, e.g., age, income, marital status and education.
The conjoint section of the questionnaire was a two-page layout of 7 hypothetical
biotech label formats as prescribed by previously described fractional design.
Respondents were asked to rate each example of a product with a biotech label. The
instructions required respondents to rate each example (product profile) on a scale from 0
(least preferred) to 10 (most preferred). Ties were allowed. The survey was administered
by mail during the month of July 2002. Dillman’s total design method was used to
administer the survey. Three thousand four hundred and fifty (3450) surveys were
mailed to randomly selected household individuals in Denver, Chicago, Atlanta, Los
Angeles, New Orleans, New York, and Houston. Responses were received from 524 (15
% of sample) respondents. However, not all of the returned surveys were completed.
Only 509 respondents returned a completed questionnaire for a 14.75 % useable response
rate.
The Model
As described in the previous section, respondents were presented with 7
hypothetical labeling formats and were asked to rate each using a interval rating scale
from 0 to 10. The label formats had three attributes; (1) use of biotech logo with three

10
levels, (2) location of the biotech logo on the package with two level, and (3) the text
disclosure of biotech ingredients with two levels. An ordered probit model is used to
estimate consumer preferences for the labeling attributes. Conjoint measurement assumes
a consumer’s total utility for a particular combination of attributes is a linear function of
part-worth effects. The structural equation for the model is specified as follows:
,iX*Ui εβ +=
where Ui* is a latent variable representing the ith individual’s total utility for a particular
combination of label attributes; ß is a row vector of part-worth utility effects and the
effects associated with selected demographic variables; X is a matrix containing dummy
variables that identify the selected attribute- levels for alternate labeling formats, and
dummy variables that indicate socioeconomic/demographic information; and ei is the
error term. The OP model assumes U* is censored, with the following relationship to the
observed dependent variable (denoted Ri):
Ri = 0, if U*i ≤ 0;
Ri = 1, if 0 < U*i ≤ µ1 ;
Ri = 2, if µ1 < U*i ≤ µ2; and, . . . Ri = 10, if µ9 ≤ U*i, where Ri is the respondent’s rating (0-10 scale) of the ith labeling format, and the µ’s are
unknown threshold parameters, which are estimated along with other model parameters.
The OP model assumes gi is normally distributed with zero mean and variance equal to
one. This restriction is necessary because all values of U* are assumed to be censored in
the OP model (Long, 1997).
11
The dummy variable coding for the X matrix is defined as follows: X1= 1, X2 =
0, if the text disclosure reads “this product contains soybean oil developed using
biotechnology to decrease the amount of saturated;” X1= 0, X2= 1 if the text disclosure
reads “this product contains ingredients derived using biotechnology;” and, X1= -1, X2 =
-1 if no text disclosure is present. The logo’s location attribute is coded as follows; X3 =
1 if the logo appears on the primary display panel (PDP); X3 = -1 if the biotech logo
appears on the information panel (IP); and, X4= 1 if a logo is present and X4= -1 if no
logo is present.
The coding for the socioeconomic/demographic variables are defined as follows:
EDUij = 1 if the ith respondent’s education level falls in the jth of six education
categories, zero otherwise; INCij = 1 if the ith respondent’s income falls in the jth of nine
income categories, zero otherwise; ETHij = 1 if the ith respondent indicated their ethnic
origins corresponds to the jth of six ethnic categories, zero otherwise; AGEij = 1 if ith
respondent ’s age corresponds to the jth of six age groups, zero otherwise; and, GENij = 1
if the ith respondent is male, zero otherwise.
Results
Frequency distributions regarding respondents’ agreement or disagreement with a
voluntary versus mandatory labeling policy are also presented in table 2. Of the 509
respondents, 80% of the sample were in favor of a mandatory labeling policy for biotech
foods. Only 20% of the respondents indicated they agreed with FDA’s voluntary labeling
policy, despite being informed of FDA’s conclusion that biotech foods carry no greater
health risks than non-biotech foods, and the concern that mandatory labeling would
unnecessarily raise heath concerns among consumers.
12
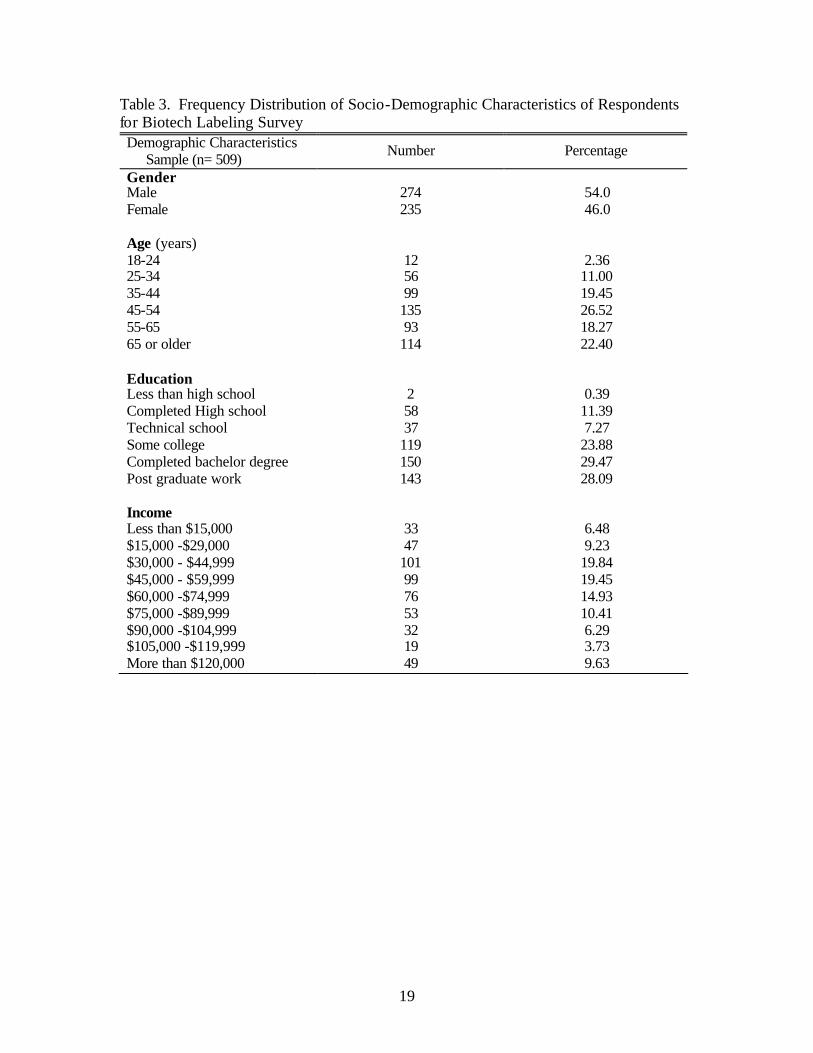
Frequency distributions of the socioeconomic/demographic composition of the
sample is presented in table 3. Of the 509 respondents, 274 or (54%) were men and 235
(46%) were women. All age groups were represented in the sample, with the 45-54 age
group accounting for most responses, approximately 27% of sample. The median age of
the sample was between 45 to 54 years of age. Most of the respondents were also well
educated, as over three quarters of the sample (80%) completed some college courses,
graduated with a bachelor degree, or had done post graduate work. The median annual
income of respondents was between $30,000-$44,999, which accounted for about 20% of
the sample. Six percent had annual income of less than $15,000, and 10% of respondents
made in excess of $120,000 in yearly earnings.
Results of the ordered probit model are presented in table 4. The chi-square
statistic indicates that the overall model is significant at a = .001 level of confidence. All
part-worth estimates are also significant at the a = .001 level of confidence. The
relatively large positive coefficient (0.575, table 4) for the disclosure attribute that reads
“this product contains soybean oil developed using biotechnology to decrease the amount
of saturated fat” suggests that consumers prefer disclosures describing the benefits of
biotechnology. The negative sign on the “simple disclosure” statement suggests that
consumers desire for labeling decreases even when biotech ingredients are revealed. This
implies a clear preference for labeling only if the beneficial aspects of biotechnology are
also revealed on the label. The relatively large negative coefficient associated with an
absence of text disclosure is consistent with the finding that most respondents preferred
mandatory labeling. The coefficient indicating a presence of a biotech tech logo had the
second largest positive coefficient (0.56, table 4). In implies that the presence of a biotech
13
logo increases the average consumer’s overall preference for biotech labeling. The
location of the logo had the lowest effect on respondents’ utility. However, when the logo
appears on the Principal Display Panel (PDP), as opposed to the Informational Panel (IP),
the average consumer’s preference for labeling increased as indicated by the positive
0.12.
To control for differences in respondent characteristics on labeling preferences,
socioeconomic and demographic variables were also included in the model. These
included age, education, income, gender, and ethnicity. Most coefficients associated with
education are not significant. However, respondents having a bachelor degree were
significantly different from the post graduate category (the omitted category) at the s =
.10 level. This provides some evidence support the hypothesis that less educated
individuals have a greater preferences for biotech labels, compared to respondents with
the most highly educated consumer. The coefficient for the 55 to 65, and 65 or greater,
age categories are positive and significant at the s = .10 or higher level. This suggest that
respondents older than 55 years of age have a greater preference for biotech labeling
relative to the omitted age group (45-54). Most of the income dummy variables are not
significant. However, the $15,000 - $29,000 group, and the more than $120,000 group,
coefficients are negative and significant at the 5% or better level. This implies that
respondents in these categories have a less preference for biotech labeling relative to the
omitted category of $30,000 to $44,999. In regard to ethnic background, all estimated
coefficients are not significant except for whites, which was negative and significant at
the s = .10 level. This suggests that Asians (the omitted category) are more likely to
prefer labeling of food products produced from biotechnology relative to whites. The
14
gender coefficient was not significantly different form zero, indicating that men and
women have similar preference regarding biotech labels.
The relative importance of product attributes was also calculated using the part-
worth estimates from the ordered probit model. To determine the relative importance of
an attribute, each attribute’s highest and lowest part-worth utilities are utilized. The
difference between the highest and lowest part-worth values establishes the utility range
for the given attribute. Once the utility range for all attributes is determined, the relative
importance of each attribute is calculated by dividing the utility range for the attribute by
the sum of all attributes (Harrison et al., 1998). The equation used is,
where RII is the relative importance for the ith attribute. The results indicate the most
important attribute was the presence of a logo, contributing 48.7 % to the preference
rating. The type of text disclosure was determined to be the second most relevant
attribute, accounting for 40.87% of the preference rating. The third most important
attribute, contributing 10.43%, was the location of the logo on the product package.
Conclusions
This study examined the labeling preferences of United States consumers for
biotech foods. The objective was to measure consumer preferences for alternate labeling
formats for biotech foods. Conjoint analysis was used to measure consumer preferences
for alternative labeling formats. A national survey was administered to collect the
conjoint data, and an ordered probit model was used to estimate part-worth values for
selected biotech labeling attributes.
RIi iUtility Range utility ranges attributes 100=
÷ ∀∑ ×
15
The most significant finding of the study is that consumers overwhelmingly
support mandatory labeling of biotech foods. Moreover, conjoint analysis showed that the
preferred format is an information label with a text disclosure that describes the benefits
of biotechnology in combination with a biotech logo located on the primary display panel
of the package. This implies that any educational effort (mandatory or voluntary) should
focus on the informing consumer of the beneficial aspects of biotech food products.
One limitation of the study is that only the 7 largest metropolitan regions of the
United States were surveyed. The preferences of individuals from rural areas of the
United States may differ from those found among urban consumers. Another limitation of
the study was that most respondents had either some college, or higher levels of
education, thus results presented here should be interpreted with this in mind. Future
research could focus on sampling a more diverse group of consumers. Future research
could also focus on measuring consumers’ willingness to pay for biotech labels.
16
References
Anderson, J.L. and Bettencourt, S. 1993. “A Conjoint Approach to Model Product Preferences: The New England Market for Fresh and Frozen Salmon.” Marine Resource Economics. 8,1:31-47.
Bretton-Clark. 1988. Conjoint Designer. New York: Bretton-Clark Co. Caswell, Julie A. (1999) An Evaluation of Risk Analysis as Applied to Agricultural
Biotechnology (with a Case Study of GMO Labeling) "paper presented at the Transitions in Agbiotech: Economics of Strategy and Policy Conference. NE-165 Washington, DC, June 24-25. 1999
Caswell, Julie A. (1998) How Labeling of Safety and Process Attributes Affects Markets
for Food. Agricultural and Resource Economics Review. 28/2: 151-158. Caswell, Julie A. and Eliza M. Mojduszka. (1996) "Using Informational Labeling to
Influence the Market for Quality in Food Products. American Journal of Agricultural Economics, 78: 1248-1253.
Caswell Julie A. and Daniel I. Padberg. (1992) Towards a More Comprehensive Theory
of Food Labels: American Agricultural Economics Association. Dillman, D. (1978) Mail and Telephone Surveys: The Total Design Method. John Wiley
and Sons, New York. Douthitt, R. 1990. Biotechnology and Consumer Choice in the Market Place: Should
there be Mandatory Labeling? A Case Study of Bovine Somatotrpin and Wisconsin Dairy Products. Paper presented at the Second International Conference on Research in the Consumer Interest. Snowbird, UT. Aug 9-11.
Grobe, Deana, Robin Diuthitt and Lydia Zepeda. (1996) "Consumer Risk Perception
Profiles for the Food-Related Biotechnology, Recombinant Bovine Growth Hormone (rbGH) "paper presented at the Transitions in Agbiotech: Economics of Strategy and Policy Conference. NE-165 Washington, DC, June 20-21, 1996
Halbrendt, C.K., F.F. Wirth, and G.F. Vaughn. (1991) Conjoint Analysis of the Mid-
Atlantic Food-Fish Market for Farm-Raised Hybrid Strip Bass. Southern Journal of Agricultural Economics, 23:155-63
Hallman, William K, and Jennifer Metcalfe. (1995) Public Perceptions of Agricultural
Biotechnology: A survey of New Jersey Residents. http://www.nal.usda.gov/bic/pubpercep
Harrison, R. W., A.Ozayan and S.P. Meyers. (1998) " A Conjoint Analysis of New Food Products Processed from Underutilized Small Crawfish". Journal of Agriculture and Applied Economics. Dec. Vol. 30 (2) p.257-265

17
Hoban, T.J. and P. A. Kendall. (1992) "Consumer Attitudes about the Use of Biotechnology in Agriculture and Food Production” USDA
Holland, D. and C.R. Wessells. 1998. “Predicting Consumer Preferences for Fresh
Salmon: The Influence of Safety Inspection and Production Method Attributes.” Agricultural and Resource Economics Review. 27,1:1-14.
Huang, C.L., and Fu J. 1995. “Conjoint Analysis of Consumer Preferences and
Evaluations of a Processed Meat.” Journal of International Food and Agribusiness Marketing. 7: 62-75.
Huffman Wallace, Jason F. Shogren, Matthew Rousu, Abe Tegene. (2001) The Values to
Consumers of Genetically Modified Food Labels in a Markek with Diverse Information: Evidence from Experimental Auction, Iowa State University.
Isaac, Grant E., and Peter W.B. Phillips. (2000). "Market Access and Market Acceptance
for Genetically Modified Products", paper presented at the Transitions in Agbiotech: Economics of Strategy and Policy Conference. NE-165 Washington, DC, June 24-25, 1999
Long, J.S. 1997. Regression Models for Categorical and Limited Dependent Variables. Thousand Oaks: SAGE Publications.
Maki, D.A. 1995 Food Futurists Predict Trends. Food R& D, February, pg. 39 Novartis. 1997. “Most Americans Want Foods that are Genetically Altered to be Clearly
Labeled”. Paper presented at the First International Conference on Regulation of Crop Protection and Its Implication for the Food Supply.
USDA/ERS. (1991) Economic Issues in Agricultural Biotechnology. AIB 762.
18
Table 1 Attributes and Their Levels Used in Survey Attribute Levels
Insert in the ingredients section of information panel reads: “This product contains ingredients derived using biotechnology.” Insert in the ingredients section of information panel reads: “This product contains soybean oil developed using biotechnology to decrease the amount of saturated fat.”
Text disclosure of biotech Ingredients
No text Disclosure Present Biotech logo Absent Principal Display Panel Location of a Biotech logo Informational Panel
Table 2. Respondent’s Responses to a Mandatory or Voluntary Labeling Policy
Number of Respondents Percentage of Respondents
Voluntary Labeling 103 20
Mandatory Labeling 406 80
19
Table 3. Frequency Distribution of Socio-Demographic Characteristics of Respondents for Biotech Labeling Survey Demographic Characteristics Sample (n= 509) Number Percentage
Gender Male 274 54.0 Female 235 46.0 Age (years) 18-24 12 2.36 25-34 56 11.00 35-44 99 19.45 45-54 135 26.52 55-65 93 18.27 65 or older 114 22.40 Education Less than high school 2 0.39 Completed High school 58 11.39 Technical school 37 7.27 Some college 119 23.88 Completed bachelor degree 150 29.47 Post graduate work 143 28.09 Income Less than $15,000 33 6.48 $15,000 -$29,000 47 9.23 $30,000 - $44,999 101 19.84 $45,000 - $59,999 99 19.45 $60,000 -$74,999 76 14.93 $75,000 -$89,999 53 10.41 $90,000 -$104,999 32 6.29 $105,000 -$119,999 19 3.73 More than $120,000 49 9.63

20
Table 4. Ordered Probit Part Worth Estimates for Conjoint Analysis of Biotech Labeling Formats in Combination with Demographic
Variable Coefficient Standard Error (t-ratio) P-Value
Label Attributes
Constant 1.207*** 0.151 7.961 0.000 Text disclosure that describes the benefits of biotech ingredients 0.575*** 0.037 15.255 0.000
Simple biotech text disclosure -0.218*** 0.039 -5.522 0.000 No Text -0.357*** 0.049 -7.262 0.000 Biotech logo appears on the PDP 0.122*** 0.030 4.029 0.001 Presence or absence of a biotech logo 0.557*** 0.033 17.074 0.000 Gendera Female 0.012 0.051 0.241 0.809
Educationb
Completed high school 0.083 0.097 0.856 0.392 Technical college 0.042 0.099 0.422 0.673 Some college 0.064 0.073 0.886 0.376 Bachelor degree 0.119* 0.071 1.684 0.092 Income c
Less than 15,000 -0.191 0.127 -1.510 0.131 $15,000 - $29,999 -0.258*** 0.094 -2.746 0.006 $45,000 - $59,999 -0.244*** 0.081 -3.019 0.003 $60,000 -$74,999 -0.121 0.088 -1.383 0.167 $75,000 -$89,999 -0.041 0.094 -0.441 0.659 $90,000 -$104,999 -0.074 0.113 -0.657 0.511 $105,000 -$119,999 -0.014 0.133 -0.104 0.917 More than $120,000 -0.282** 0.119 -2.364 0.018
Aged
18-24 0.135 0.161 0.834 0.405 25-34 0.026 0.096 0.271 0.786 35-44 0.101 0.075 1.396 0.163 55-65 0.124* 0.069 1.813 0.069 65 or older 0.172** 0.078 2.197 0.028
Ethnic Origine
White -0.229* 0.132 -1.743 0.081 African American -0.255 0.176 -1.447 0.148 American Indian -0.139 0.394 -0.353 0.724 Hispanic -0.237 0.167 -1.415 0.157 Other -0.203 0.180 -1.125 0.260 ***, **,*, Indicates estimated coefficient is significant at the .01,.05,and .10 level, respectively χ2 Log-L -4150.94 ; Chi-square = 777.28; N= 3,563; a Excludes the gender male. b Excludes the post graduate work category. c Excludes the $30,000 - $44,999 income category; d Excludes the 45 –54 age group category. e Excludes the Asian category.


![Sample Food Labels - Food System Curriculum · Lesson 10: Decoding Food Labels l [1] Lesson 10: Decoding Food Labels ohns Hopkins niversity Sample Food Labels Photo credit (fish fillets):](https://img.pdfslide.us/doc/110x75/5f9aa95a5d8d891a2f313e3f/sample-food-labels-food-system-curriculum-lesson-10-decoding-food-labels-l-1.jpg)