Embed Size (px)
Citation preview
Analysis of Five Gene Sets in Chimpanzees Suggests
Decoupling between the Action of Selection on
Protein-Coding and on Noncoding Elements
Gabriel Santpere1,y, Elena Carnero-Montoro1,y, Natalia Petit1,y, Francois Serra2, Christina Hvilsom3,Jordi Rambla1, Jose Maria Heredia-Genestar1, Daniel L. Halligan4, Hernan Dopazo5, Arcadi Navarro1,6,7,8,*,and Elena Bosch1,*1Departament de Ciencies Experimentals i la Salut, Institute of Evolutionary Biology (UPF-CSIC), Universitat Pompeu Fabra, PRBB, Barcelona,
Spain2Structural Genomics Team, Genome Biology Group, Centre Nacional d’Analisi Genomica (CNAG), Barcelona, Spain3Research and Conservation, Copenhagen Zoo, Frederiksberg, Denmark4Institute of Evolutionary Biology, School of Biological Sciences, University of Edinburgh, Edinburgh, United Kingdom5Biomedical Genomics & Evolution Laboratory, Departamento de Ecologıa, Genetica y Evolucion, IEGEBA (CONICET-UBA), Facultad de Ciencias
Exactas y Naturales, Universidad de Buenos Aires, Argentina6National Institute for Bioinformatics (INB), PRBB, Barcelona, Spain7Institucio Catalana de Recerca i Estudis Avancats (ICREA), PRBB, Barcelona, Spain8Center for Genomic Regulation (CRG), PRBB, Barcelona, Spain
*Corresponding author: E-mail: [email protected]; [email protected] authors contributed equally to this work.
Accepted: May 9, 2015
Data deposition: BAM files for each sample have been deposited at SRA under the accession 285270.
Abstract
We set out to investigate potential differences and similarities between the selective forces acting upon the coding and noncoding
regions of five different sets of genes defined according to functional and evolutionary criteria: 1) two reference gene sets presenting
accelerated and slow rates of protein evolution (the Complement and Actin pathways); 2) a set of genes with evidence of accelerated
evolution in at least one of their introns; and 3) two gene sets related to neurological function (Parkinson’s and Alzheimer’s diseases).
To that effect, we combine human–chimpanzee divergence patterns with polymorphism data obtained from target resequencing
20 central chimpanzees, our closest relatives with largest long-term effective population size. By using the distribution of fitness
effect-alpha extension of the McDonald–Kreitman test, we reproduce inferences of rates of evolution previously based only on
divergence data on both coding and intronic sequences and also obtain inferences for other classes of genomic elements (untrans-
lated regions, promoters, and conserved noncoding sequences). Our results suggest that 1) the distribution of fitness effect-alpha
method successfully helps distinguishing different scenarios of accelerated divergence (adaptation or relaxed selective constraints)
and 2) the adaptive history of coding and noncoding sequences within the gene sets analyzed is decoupled.
Key words: : chimpanzee, biochemical pathways, natural selection, distribution of fitness effects, fraction of adaptive sub-
stitution (a) and adaptive substitution rate (oa), Alzheimer, Parkinson.
Introduction
Adaptive evolution may result in an excess of substitutions
between species at functional sites compared with what
would be expected from the fixation of neutral (and mildly
deleterious) mutations. Methods based on that idea have
been applied at two new levels of analysis. First, at the level
of gene networks (or pathways), revealing that sets of func-
tionally related genes can be subject to modes of selection
that are generally consistent within sets, while differing be-
tween them (Serra et al. 2011). Second, at the level of
GBE
� The Author(s) 2015. Published by Oxford University Press on behalf of the Society for Molecular Biology and Evolution.
This is an Open Access article distributed under the terms of the Creative Commons Attribution Non-Commercial License (http://creativecommons.org/licenses/by-nc/4.0/), which permits
non-commercial re-use, distribution, and reproduction in any medium, provided the original work is properly cited. For commercial re-use, please contact [email protected]
1490 Genome Biol. Evol. 7(6):1490–1505. doi:10.1093/gbe/evv082 Advance Access publication May 14, 2015
by guest on July 18, 2015http://gbe.oxfordjournals.org/
Dow
nloaded from
noncoding regions, with the signature of selection detected in
the regulatory regions of certain genes (Gazave et al. 2007;
Haygood et al. 2007). However, the detailed, joint study of
different classes of noncoding elements together with their
accompanying coding regions in the context of gene path-
ways or functional gene sets has not yet been addressed.
This is the central goal of this work.
The McDonald–Kreitman test (MKT) (McDonald and
Kreitman 1991) along with several derived methods (Fay
et al. 2001; Bustamante et al. 2002, 2005; Bierne and Eyre-
Walker 2004) have been devised to disentangle whether an
excess of functionally fixed mutations is due to the relaxation
of selective constraints, the action of positive selection, or
changes in rates of mutation. All of these methods compare
diversity within a species with divergence between species
at two types of sites: Functional (usually nonsynonymous
changes) and putatively neutral sites (usually synonymous
sites). In absence of adaptation, the ratio of functional to neu-
tral divergence between species is expected to be equal to the
corresponding ratio of polymorphism within a species. The
most frequent scenario, however, is that functional variants
are mildly deleterious and, since purifying selection tends to
avoid their fixation, the ratio of functional to neutral diver-
gence between species is smaller than the analogous ratio
for polymorphism. In contrast, an excess of functional diver-
gence (i.e., a higher ratio of functional to neutral fixed muta-
tions relative to the same ratio for polymorphisms) is usually
interpreted as the action of positive selection in promoting the
fixation of functional variants.
Building upon these basic premises, modifications of the
MKT allow for the quantification of the proportion of func-
tional fixed differences that are adaptive (a) and the rate at
which these new adaptive mutations appear (oa) (Smith and
Eyre-Walker 2002; Eyre-Walker 2006; Fay 2011). Alpha (a)
can be directly estimated as 1� (dS pN)/(dN pS) (Smith and
Eyre-Walker 2002) where pN and pS are the average number
of polymorphisms per nonsynonymous and synonymous site,
respectively; and dN and dS the average number of divergent
differences for the same kind of sites. The ratio of adaptive
to neutral divergence, omega-alpha (oa), is computed as
oa =a�(dN/dS).
Because it uses interdigitated sites, the classical MKT is
robust to variation in mutation rates (over scales greater
than a single base pair) and to differential genealogies at
the various classes of sites under analysis. However, other
confounding factors such as the presence of slightly deleteri-
ous mutations or particular demographic events that could
significantly contribute to the amount of polymorphism are
known to affect the results of the test (Fay 2011). Recently, a
number of extensions of the MKT have been proposed to
control for these confounding factors when trying to estimate
the proportion of adaptive changes along a given branch of
the phylogeny. The most popular extensions use the site fre-
quency spectra (SFS) in functional and putatively neutral sites
to estimate population size histories and the distribution of
fitness effects (DFEs) at functional sites (Eyre-Walker and
Keightley 2007; Keightley and Eyre-Walker 2007; Boyko
et al. 2008). One striking conclusion of these latter studies is
that noncoding elements tend to experience more adaptive
events than protein-coding genes, at least in mice (Eyre-
Walker and Keightley 2007; Halligan et al. 2013) and
Drosophila (Kousathanas et al. 2011; Mackay et al. 2012).
However, when applying MKT extensions to noncoding ele-
ments results may also be affected by the choice of the neu-
trally evolving reference against which levels of functional
divergence and polymorphism are compared. For instance,
although nonregulatory intronic sequences, synonymous
sites and ancestral repeat sequences are known to be gener-
ally neutral, they, or at least some fragments within them,
may be subject to some selection (Lawrie et al. 2013).
Over several decades, all these methods have yielded impor-
tant insights about the role of adaptation in shaping molecular
evolution in different lineages. In particular, rates of adaptive
molecular evolution have been found to range from low values
in yeast (Elyashiv et al. 2010) or humans (Bustamante et al.
2005; Boyko et al. 2008) to high values in flies (Welch 2006;
Elyashiv et al. 2010), bacteria (Charlesworth and Eyre-Walker
2006), or mice (Halligan et al. 2013). Such enormous variability
across species has been attributed to different effective popu-
lation sizes, as the efficiency of selection and, thus, the propor-
tion of adaptive substitutions are higher in larger populations
(Fay 2011; Jensen and Bachtrog 2011; Lanfear et al. 2014). A
few attempts have also been made to quantify adaptive evolu-
tion in regulatory elements using similar MK-type tests.
Although in hominids no adaptive evolution was detected nei-
ther upstream nor downstream protein-coding genes
(Keightley et al. 2005), in Drosophila, the proportion of substi-
tutions fixed by positive selection was estimated to be around
60% in untranslated regions (UTRs) and 20% in introns
(Andolfatto 2005).
To date, and to the best of our knowledge, neither the
MKT nor its many extensions have been applied to sets of
genes interacting in the same pathway. Such pathway-
based strategy might help to shed more light on how different
functions are subject to different selective pressures than the
analysis of single genes. Moreover, none of the analyses of
natural selection available so far on pathways have investi-
gated selection acting on noncoding regulatory regions of
the studied genes, so it is not yet known whether modes of
selection are shared among the coding and noncoding ele-
ments of a given functional gene set.
In this study, we aimed to investigate differences in the
selective forces acting in different gene sets and in their
coding and noncoding regions. To that effect, we initially se-
lected three different reference gene sets that, according to
the literature (Serra et al. 2011), and to our own results, are
examples of evolution under different adaptive pressures in
the chimpanzee lineage. The first two reference sets, the
Analysis of Five Gene Sets in Chimpanzee GBE
Genome Biol. Evol. 7(6):1490–1505. doi:10.1093/gbe/evv082 Advance Access publication May 14, 2015 1491
by guest on July 18, 2015http://gbe.oxfordjournals.org/
Dow
nloaded from
Complement and the Actin pathways present accelerated and
constrained rates of protein evolution, respectively, whereas
the third is a set of genes with evidence of accelerated evolu-
tion in at least one of their introns. Then, we combined poly-
morphism data from 20 central chimpanzee individuals with
divergence patterns from humans and used the DFE-alpha
extension of the MKT (Keightley and Eyre-Walker 2007) to
compare the action of selection across pathways and across
different classes of genomic elements. In particular, we com-
pared patterns of evolution in protein-coding DNA sequences
(CDS), introns, conserved noncoding sequences (CNCs), pro-
moters, and UTRs of these reference sets with that of the
same genomic elements from two additional gene sets related
to neurological function (Parkinson’s and Alzheimer’s dis-
eases). These neurological pathways may have evolved
under different adaptive pressures in humans and chimpan-
zees, and, importantly, their associated diseases have not
been observed in the latter species. We focused on Pan trog-
lodytes troglodytes because its effective population size is one
of the largest among the great apes (24.4–48.7�103) (Prado-
Martinez et al. 2013), being around two times higher than
that of humans (13.1–16.2� 103) (Prado-Martinez et al.
2013). Moreover, the ancestral homo-chimpanzee effective
population size has been estimated to be 49.6–
62.9�103(Prado-Martinez et al. 2013). By using that chim-
panzee subspecies, we expected to have greater power to
detect significant differences in the fraction of adaptive sub-
stitutions and to better distinguish any different evolutionary
trend among pathways and their functional elements than if a
similar approach was carried in the human lineage.
Materials and Methods
Samples
Blood-derived DNA samples for 20 wild-born nonrelated
chimpanzees (P. t. troglodytes) from Gabon and Equatorial
Guinea were obtained from the Research and Conservation
Copenhagen Zoo. Detailed information on these individuals is
provided in supplementary table S1, Supplementary Material
online. DNA concentration was quantified with an Invitrogen
QBit fluorometer to ensure a minimum of 6 ng (at 50 ng/ml) in
each sample.
Gene Sets and Regions Analyzed
The selection of gene sets presenting accelerated or deceler-
ated rates of protein evolution was based on the Gene Set
Selection Analysis (GSSA) method presented in Serra et al.
(2011). These authors focused on sets of functionally related
genes included in KEGG (Kyoto Encyclopedia of Genes and
Genomes) pathways (Kanehisa et al. 2004) and in GO (gene
ontology) terms and compared their o (dN/dS) values for
humans, chimpanzees, rats, and mice. In particular, they
ranked o values in each lineage for all genes and tested
whether certain pathways were overrepresented in the tails
of the o distributions. We focused on o measures in the chim-
panzee lineage only, and we selected the following KEGG
pathways: 1) the “Regulation of Actin Cytoskeleton”
(KEGG: hsa04810) pathway, whose protein coding regions
have evolved at a slow rate. That is, 63% of the genes
(median o= 0.08) are in the lower part of a genome-wide odistribution (with median = 0.17) and 2) the “Complement
and coagulation cascade” (KEGG: hsa04610) pathway,
which, on the contrary, shows an enrichment of genes with
high dN/dS ratios, with 62% of the genes (mediano= 0.39) in
the corresponding high side of the o distribution (Serra et al.
2011). For these two pathways, we studied 58 genes from the
Actin module and 109 genes from the Complement module.
Additionally, we defined a set of genes presenting evidence
of accelerated rates of divergence in their noncoding regions.
To do so, we analyzed intron divergence patterns by means of
a likelihood ratio test implemented in HYPHY (Pond et al.
2005) and similar to that from Haygood et al. (2007).
Briefly, the method compares rates of evolution of some
target sequences against a neutral reference by performing
a branch-site test. The test contrasts the likelihood of a sub-
stitution model in which only neutral and selected sites are
allowed against a model in which positively selected sites are
also possible. Human–chimpanzee alignments were obtained
for all introns and subsequently tested using neighboring an-
cestral repeats as a neutral reference. After this procedure, we
obtained a set of 134 chimpanzee genes with evidence of
accelerated evolution in one of their introns (see further details
in Supplementary Note S1, Supplementary Material online).
Finally, we included in our analysis two gene pathways re-
lated to two human neurological diseases (Parkinson’s and
Alzheimer’s disease). In particular, 65 genes from the
“Alzheimer disease-amyloid secretase” pathway (PANTHER:
P00003), 109 genes from the “Alzheimer disease-Presenilin”
pathway (PANTHER: P00004), and 87 genes from the
“Parkinson disease” pathway (PANTHER: P0049). The two
gene sets related to Alzheimer’s disease were merged in
one category, comprising 156 genes. We will refer to each
of these sets of curated genes as the “Complement,”
“Actin,” “Alzheimer,” and “Parkinson” pathways in the
rest of the text.
In total, we studied 518 unique genes (~8% of genes ap-
peared in different gene sets; see complete list in supplemen-
tary table S2, Supplementary Material online). From the
longest transcript of each particular gene included in these
datasets, we selected all their exons and both 5’- and 3’-
UTRs. Promoters and trailers were defined as 5 kb upstream
and downstream from the start and end of the gene, respec-
tively. As for introns, we included up to a maximum of
1 intronic kb flanking each intron–exon boundary except for
the case of those introns with accelerated substitution rates
where the complete intron length was studied. We will refer
to this latter group as “Only Acc. Introns.”
Santpere et al. GBE
1492 Genome Biol. Evol. 7(6):1490–1505. doi:10.1093/gbe/evv082 Advance Access publication May 14, 2015
by guest on July 18, 2015http://gbe.oxfordjournals.org/
Dow
nloaded from

Capture Design and Sequencing
The complete list of genomic target intervals of interest in the
PanTro2 chimpanzee genome (March 2006, University of
California-Santa Cruz Genome Browser) was uploaded to
the eArray XD software (Agilent Technologies) for custom
design of two Agilent SureSelect Target Enrichment kits.
Bait Tile parameters were set to use Illumina as a
Sequencing Technology, Pair-End Long Read as Sequencing
Protocol, and avoidance of masked repeat elements. We
retiled those exonic regions not covered by baits, due to avoid-
ing masked repeating regions, with the masking OFF option.
To ensure the specific retrieval of these genomic regions
during enrichment, baits created with the masking OFF
option were then mapped with BLAT and only included in
the design when their second match scored below 60 (half
the baits length).
All capturing and sequencing procedures were performed
at the Genomics Unit of the Center for Genomic Regulation
Core Facilities. Briefly, 6mg of genomic DNA from each indi-
vidual was fragmented to 150–200 bp with the use of the
Adaptive Focused Acoustics (Covaris), end-repaired, adeny-
lated, and ligated to specific PE-tagged genomic adapters fol-
lowing the standard protocol of the Illumina Paired-End
Sample Preparation kit. Different pools of 2–3 indexed libraries
were then hybridized in multiplex with the 120 bp biotinylated
RNA baits of each custom Agilent SureSelect kits. After en-
richment with each individual kit, captured fragments were
purified, pooled in two groups (each containing the two sets
of captured regions from each of 10 different samples), and
sequenced on two lanes of an Illumina HiSeq 2000 System
with the use of 96-bp paired-end reads. See detailed informa-
tion on enrichment and sequencing scheme in supplementary
table S3, Supplementary Material online.
Mapping, Single-Nucleotide Polymorphism Calling, andCallable Genome Construction
Burrows–Wheeler Aligner was used to align reads to the chim-
panzee reference genome (PanTro3), using the default param-
eters. We used the Genome Analysis Toolkit (GATK) to call
indels and to perform re-alignments of reads falling in their
surrounding regions. We then carried out recalibration of
reads’ bases quality scores, considering cycle effect (position
in the read) and sequencing chemistry effect (the preceding
and current nucleotide). UnifiedGenotype from GATK was
used to call genotypes. Next, we filtered single-nucleotide
polymorphisms (SNPs) by the variant quality score recalibration
(VQSR) method in GATK. We provided a training set consisting
of a high-quality SNP subset, that is, SNPs called with at least
10,000 of quality score and not falling in SNP clusters (three or
more SNPs in windows of 10 bp) or in a region at 5 bp or less
from an indel. After filtering the whole set of SNPs using
VQSR, we also removed SNPs falling in clusters and close to
indels the same way than in the high-quality subset.
The proportion of genome that is callable and that we
finally used in all analyses was calculated using the
UnifiedGenotype tool from GATK, by emitting genotypes
for all confident reference and variant sites. We kept only
those sites with a confidence genotype call of at least 30 of
Phred score (the same minimum threshold applied to variable
sites). We masked all indels with a padding of 5 bp. All sites
with SNPs filtered by the VQSR method and SNP cluster criteria
were also removed from the callable fraction of the genome.
We finally kept only those positions in which all-20 chimpan-
zee individuals possess coverage of at least 5X. That left
8,599,335 bp of callable regions including 79,650 SNPs with
a Ti/Tv ratio of 2.29. SNPs found in coding regions have a Ti/Tv
ratio of 3.89, consistent with the elevated GC content of
exons (see supplementary table S4, Supplementary Material
online, for detailed sequencing statistics in each individual
sample).
Nonsynonymous and Synonymous Sites
Zero-fold degenerate sites were treated as nonsynonymous
and the 4-fold degenerate sites as synonymous. Exonic se-
quences and genomic annotation from all genes were down-
loaded from the Pan troglodytes genes (CHIMP2.1.4) dataset
at Ensembl v66 (http://feb2012.archive.ensembl.org/index.
html, last accessed May 22, 2015) and mapped to the chim-
panzee genome (PanTro3 assembly) using the liftOver tool at
the Galaxy website (http://main.g2.bx.psu.edu/, last accessed
May 22, 2015).
Conserved Noncoding Elements
CNCs within promoters, introns, and trailers of all genes stud-
ied were identified in the Human genome (hg19) using
PhastCons on a 12-way Vertebrate Multiz Alignment.
PhastCons parameters were tuned to produce 5% conserved
elements in the genome for the vertebrate conservation mea-
surement (expected length = 45, target coverage = 0.3,
rho = 0.31). CNC hg19 coordinates were then mapped to
the chimpanzee genome (PanTro3) using the liftOver tool at
the Galaxy website (http://main.g2.bx.psu.edu/). Conserved
elements in noncoding sequences can be used as a proxy
for functional regulatory motifs in flanking regions surround-
ing CDS. Unfortunately, both their overall length and the total
amount of each specific noncoding region (i.e., promoters,
introns, and trailers) harbors in any given pathway, does not
render enough power to evaluate, and compare their evolu-
tionary patterns separately (data not shown). Thus, we con-
catenated all CNC from each pathway and analyzed them as a
single category.
Inference of Unfolded SFS
SNPs were oriented according to ancestral states in the node
separating chimpanzee, human, and orangutan. Ancestral
states were inferred by parsimony in the Galaxy website
Analysis of Five Gene Sets in Chimpanzee GBE
Genome Biol. Evol. 7(6):1490–1505. doi:10.1093/gbe/evv082 Advance Access publication May 14, 2015 1493
by guest on July 18, 2015http://gbe.oxfordjournals.org/
Dow
nloaded from
(http://main.g2.bx.psu.edu/) using the following strategy. Sites
diverging between panTro3 and hg19 were obtained using
the regional variation/fetch substitutions from the pairwise
alignments tool. For each identified nucleotide substitution,
pairwise alignments of panTro3/hg19 and panTro3/ponAbe2
were downloaded using the fetch alignments/fetch pairwise
MAF blocks tool given our set of genomics intervals.
Substitutions in panTro3 were considered as derived when
the nucleotide in panTro3 was different from the nucleotide
in hg19 and ponAbe2. We did not include substitutions with a
multiallelic state or without information in ponAbe2. Derived
substitutions identified in panTro3 were compared with data
from ancestral states obtained for P. t. troglodytes in Prado-
Martinez et al. (2013), obtaining a 99.1% of coincidences for
monomorphic positions and 97% of coincidences with the
derived allele when including polymorphic positions in the
node separating the three species. To obtain the SFS of poly-
morphism, the derived alleles in each frequency category from
1 to n� 1 chromosomes were counted. We also counted the
number of invariant sites and the derived substitutions. Gap
positions were not taken into account for the SFS.
Measures of Divergence and Polymorphism
For all gene sets and genomic elements in a given set, we
obtained descriptive statistics of polymorphism and diver-
gence in putatively selected and nonselected sites. For
coding regions, we considered only the 4-fold sites as
nonselected (i.e., neutral) sites and the 0-fold sites as puta-
tively selected sites. For all noncoding elements, we used all
trailer sites (excluding CNC) of each specific pathway as the
neutral reference (which we denote as nonselected sites or
NSel) and all sites in the remaining noncoding regions were
considered as putatively under selection (PUS). In particular,
we first obtained the proportion of nonsynonymous or PUS
SNPs (pN or pPUS), the proportion of synonymous or NSel
SNPs (pS or pNSel), the proportion of nonsynonymous or
PUS substitutions (dN or dPUS), as well as the proportion of
synonymous or NSel substitutions (dS or dNSel). We then cal-
culated the corresponding rates of putatively selected versus
neutral SNPs and substitutions as pN/pS and dN/dS in coding
regions and as pPUS/pNSel and dPUS/dNSel in noncoding re-
gions, respectively.
To evaluate whether there are significant differences be-
tween gene sets in their average values of rates and ratios of
polymorphism and divergence, we obtained a distribution of
all the corresponding descriptive values by randomly resam-
pling 1,000 times with replacement individual genes within
each gene set. At each round of random gene resampling, we
required a minimum number of sites analyzed equal to the
number of sites analyzed in the real list of genes for each gene
set. These distributions allowed us to calculate, for each
observed value, the percentile it represents in the distribution
of 1,000 randomizations of the compared gene set.
We considered that gene set values are significantly different
(two-tail test) when observed values fall reciprocally in the tails
of the distribution, considering percentiles 2.5% and 97.5%
as thresholds.
Biased AT to GC (weak to strong; W->S) nucleotide sub-
stitutions can lead to accelerated rates of nonsynonymous
changes and generate significant results for usual tests of pos-
itive selection, including likelihood ratio tests for accelerated
dN/dS and the MKT (Berglund et al. 2009). To explore
whether the accelerated rates observed in any genomic ele-
ment could result from biased fixation of W->S mutations,
we analyzed the ratio of W->S to S->W substitutions in all
selected versus nonselected sites within each dataset (supple-
mentary table S5, Supplementary Material online). Only in-
trons in the Actin and the Alzheimer gene sets showed
statistically different ratios of W->S versus S->W substitution
types when compared with their corresponding neutral refer-
ences (supplementary table S5, Supplementary Material
online).
We also explored the possible bias introduced by different
proportions of hyper-mutable CpG sites in different pathways.
We compared the proportion of substitutions from C or G
nucleotides with changes coming from A or T nucleotides in
each genomic element against the corresponding neutral ref-
erence by means of a Fisher’s exact test (supplementary table
S5, Supplementary Material online). We only found significant
differences in introns and UTRs for the Alzheimer and Acc.
Introns gene sets, respectively (Fisher’s exact test, P<0.05).
DFEs of new Mutations
DFEs of new mutations and demographic parameters were
obtained using a maximum likelihood approach based on
polymorphism data as described by Keightley and Eyre-
Walker (2007). Briefly, the method assumes two classes of
sites (one evolving neutrally and another under mutation-
selection-drift balance) and contrasts the folded SFS at these
two classes. Under this model, sites can be either neutral or
damaging. In the latter case, deleterious effects are sampled
from a gamma distribution. The model estimates the frequen-
cies of four different categories of values of the population
selection value (Nes, where Ne is the effective population size
and s is the selection coefficient against novel mutations).
These four categories are: 0–1, 1–10, 10–100, and> 100,
considered as nearly neutral, mildly deleterious, deleterious,
and very deleterious, respectively. Demography is modeled
considering 2-epochs with one-step change from N1 initial
size equal to 100 to N2 final size in generation t in the past,
the ratio of change N1/N2 is estimated together with the pro-
portion of unmutated sites (fo). As neutral evolutionary rates at
4-fold sites are similar among the different datasets (supple-
mentary table S6, Supplementary Material online), we consid-
ered the concatenation of all 4-fold sites (synonymous sites) as
the neutral reference for all coding regions analyzed.
Santpere et al. GBE
1494 Genome Biol. Evol. 7(6):1490–1505. doi:10.1093/gbe/evv082 Advance Access publication May 14, 2015
by guest on July 18, 2015http://gbe.oxfordjournals.org/
Dow
nloaded from

For noncoding regions, we used the trailer sites of each gene
set as neutral reference.
A simple extension of the method described above allows
the calculation of the proportion of fixed adaptive substitu-
tions (a) and the relative rate of adaptive substitution (oa)
using the parameters calculated in the DFE together with di-
vergence data (Eyre-Walker and Keightley 2009). This is an
extension of the classic MKT that benefits of accounting for
the possible effect of slightly deleterious mutations contribut-
ing to polymorphisms and for biases due to demographic
changes.
Statistical Comparisons between Gene Sets and Elements
We calculated a andoa for our putative selected classes within
each element in all gene sets analyzed and calculated their
confidence intervals by bootstrapping genes using the same
strategy than for the polymorphism and divergence measures.
We analyzed independently each genomic element and
resampled genes with replacement requiring that the
number of base pairs analyzed at each resample gene list
should be at least equal to the number of base pairs analyzed
in the original gene set. Again, to evaluate whether propor-
tions and rates of adaptive changes based on a and oa values
were significantly different between gene sets, we calculated
the percentile where each observed value corresponding to a
given gene set falls in the distribution of bootstrapped values
of the gene set against which it is compared. We considered
the gene set’s observed value significantly different from the
one it is compared with if it falls in the tails of the distribution
considering percentiles 2.5% and 97.5% as thresholds.
Within this framework, we refer to a comparison between
gene sets being reciprocally significant when both observed
values fall beyond the significant threshold in the correspond-
ing bootstrap distributions.
Results
Gene sets and Functional Elements under Study
We set out to study the rates of molecular evolution in coding
and different regulatory regions of five functional and evolu-
tionary gene sets by combining polymorphism data from 20
chimpanzees with human–chimpanzee divergence. The two
first gene sets were the Complement pathway and the regu-
lation of Actin cytoskeleton pathway (“Complement” and
“Actin”), which we included in our study because, according
to the GSSA presented in Serra et al. (2011), they were sig-
nificantly enriched in genes with accelerated and de-acceler-
ated evolution in the chimpanzee lineage, respectively. These
rates of evolution are in agreement with the known functions
of these pathways. The Actin cytoskeleton is essential for di-
verse structural and housekeeping functions in the cell and
various human diseases are known to result from cytoskeletal
malfunctions (Lee and Dominguez 2010). In contrast, the
Complement system relates to the innate immunity response
and genes involved in such pathway have been under the
recurrent influence of positive and balancing selection as a
response to interaction with pathogens (Ferrer-Admetlla
et al. 2008; Kosiol et al. 2008).
A third set of genes was selected because of the putative
signature of positive selection acting upon noncoding se-
quences. In particular, we studied a set of genes with introns
under accelerated evolution. To compile that set, we analyzed
intron divergence patterns using a likelihood ratio test similar
to that from Haygood et al. (2007) (see supplementary note
S1, Supplementary Material online, for details about the meth-
od) and obtained a set of 134 genes with at least one of
their introns showing significantly accelerated substitution
rates (see supplementary table S2, Supplementary Material
online). We refer to this set as “Acc. Intron” dataset.
Finally, the evolutionary patterns found in the coding and
noncoding regions of the gene sets described above were
compared with those from two additional gene sets related
to common neurodegenerative disorders (Alzheimer and
Parkinson gene sets, see below). Interestingly, although both
neurological diseases seem to appear exclusively in humans,
the main neuropathological hallmarks of AD (i.e., Ab and
hyper-phosphorylated tau deposition) have also been ob-
served in the ageing brain of chimpanzees (Gearing et al.
1994; Rosen et al. 2008). Furthermore, crucial proteins in
AD and PD pathogenesis (i.e., APP, precursor of Ab, tau,
and alpha-synuclein) are conserved between human and
chimpanzees (Hamilton 2004; Holzer et al. 2004; Rosen
et al. 2008). However, these proteins are found within well-
studied neurological networks whose elements might have
undergone different evolutionary histories. Even though
14% of Alzheimer’s genes and 11% of Parkinson’s have sig-
nificantly decreased their corresponding dN/dS ratios since the
common human–chimpanzee ancestor, neither the PD nor
the AD pathways were enriched for low or high o values
when using the data from Serra et al. (2011). All these fea-
tures made pathways related to AD and PD interesting test
pathways to be included in our MKT analysis of coding versus
noncoding regions.
To study differences between coding and noncoding ge-
nomic elements across the five gene sets under study, we
sequenced different classes of sequence: Protein coding
(CDSs), introns, promoters, untranslated regions [UTRs], and
CNCs (see details in Materials and Methods).
Sequencing and Descriptive Statistics
A complete list of genes included in each of the five datasets
under study is presented in supplementary table S2,
Supplementary Material online. Their corresponding CDS, in-
trons, and regulatory regions were specifically sequenced with
an Illumina Hiseq2000 instrument after enrichment with two
custom Agilent SureSelect kits in 20 central chimpanzee
Analysis of Five Gene Sets in Chimpanzee GBE
Genome Biol. Evol. 7(6):1490–1505. doi:10.1093/gbe/evv082 Advance Access publication May 14, 2015 1495
by guest on July 18, 2015http://gbe.oxfordjournals.org/
Dow
nloaded from
individuals (supplementary table S1, Supplementary Material
online) to an average depth of 72X (see Materials and
Methods and supplementary tables S3 and S4,
Supplementary Material online). A total of 79,650 SNPs
(with a Ti/Tv ratio = 2.29) were identified in a total callable
length of 8,599,335 bp (see Materials and Methods). Next,
we calculated measures of polymorphism and human–
chimpanzee divergence for all five-gene datasets and five
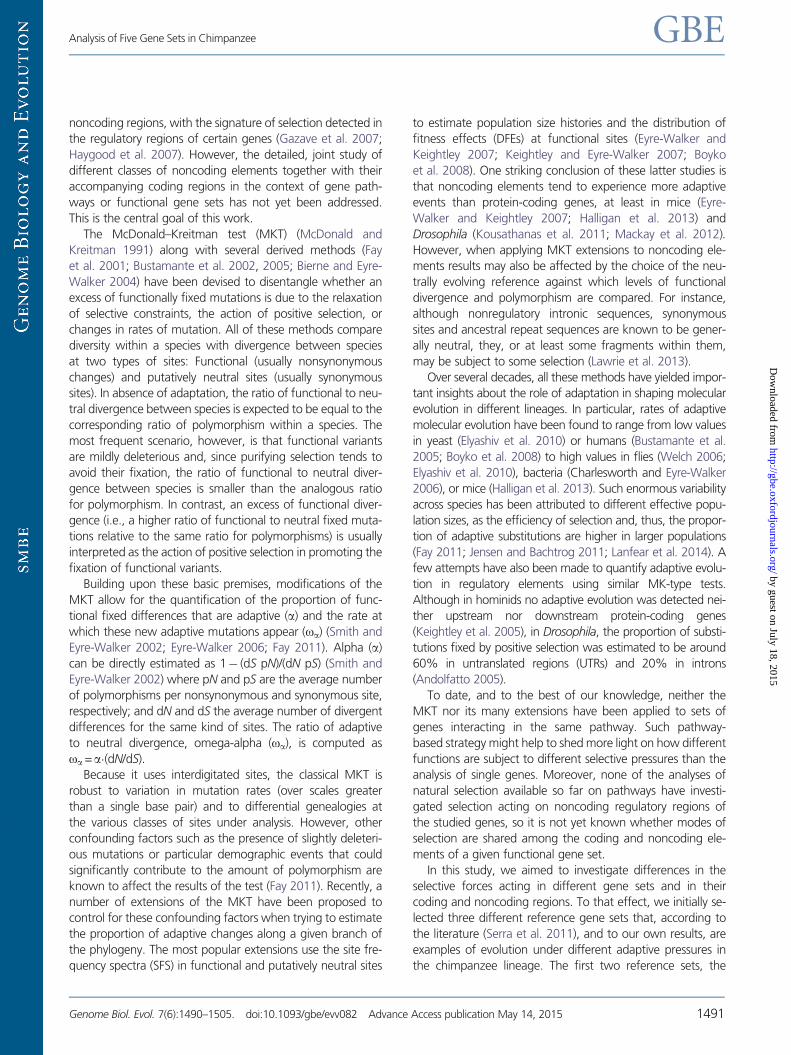
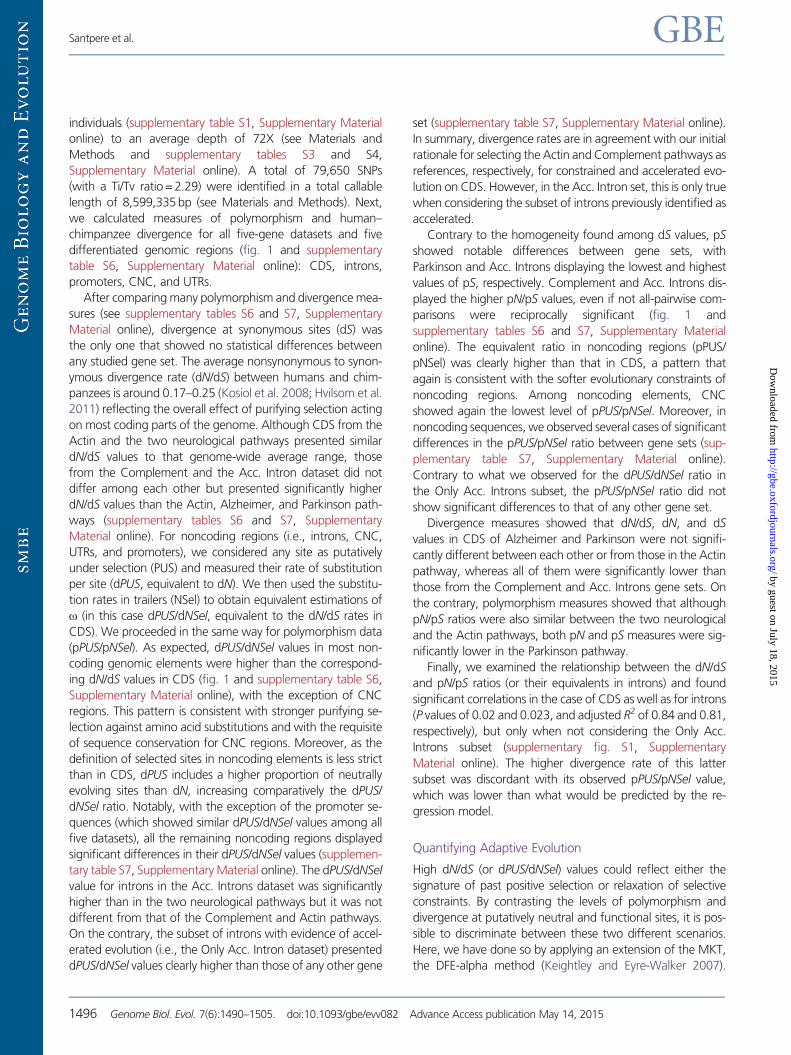
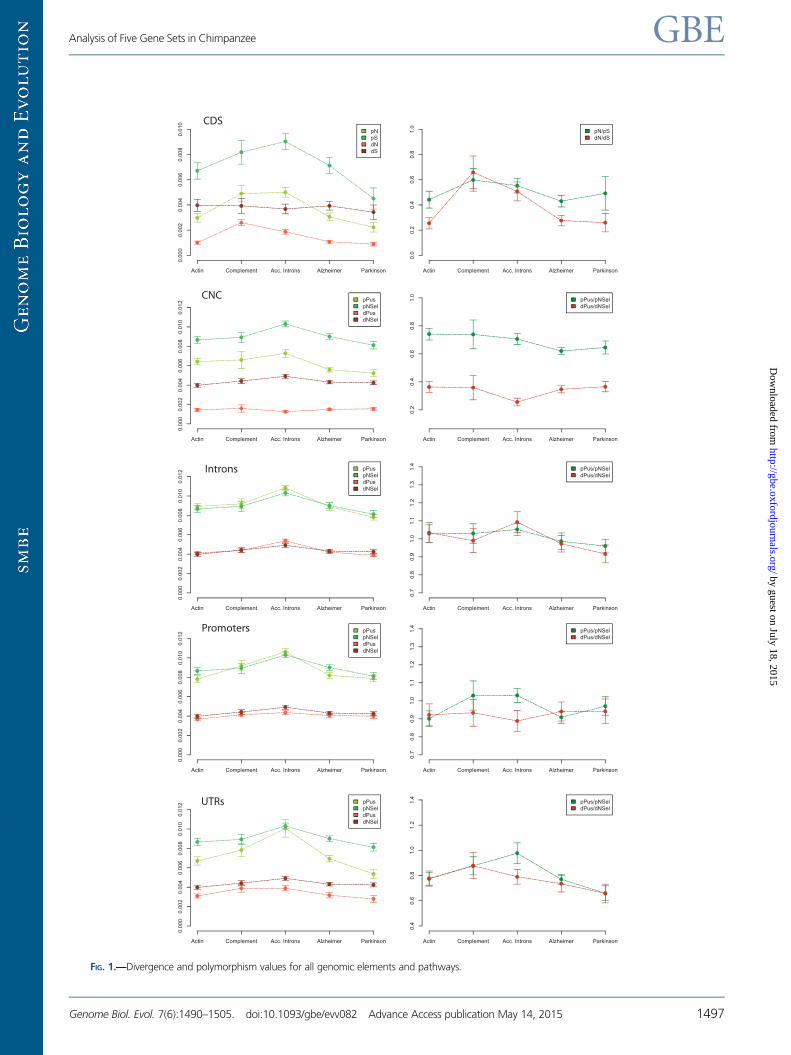
differentiated genomic regions (fig. 1 and supplementary
table S6, Supplementary Material online): CDS, introns,
promoters, CNC, and UTRs.
After comparing many polymorphism and divergence mea-
sures (see supplementary tables S6 and S7, Supplementary
Material online), divergence at synonymous sites (dS) was
the only one that showed no statistical differences between
any studied gene set. The average nonsynonymous to synon-
ymous divergence rate (dN/dS) between humans and chim-
panzees is around 0.17–0.25 (Kosiol et al. 2008; Hvilsom et al.
2011) reflecting the overall effect of purifying selection acting
on most coding parts of the genome. Although CDS from the
Actin and the two neurological pathways presented similar
dN/dS values to that genome-wide average range, those
from the Complement and the Acc. Intron dataset did not
differ among each other but presented significantly higher
dN/dS values than the Actin, Alzheimer, and Parkinson path-
ways (supplementary tables S6 and S7, Supplementary
Material online). For noncoding regions (i.e., introns, CNC,
UTRs, and promoters), we considered any site as putatively
under selection (PUS) and measured their rate of substitution
per site (dPUS, equivalent to dN). We then used the substitu-
tion rates in trailers (NSel) to obtain equivalent estimations of
o (in this case dPUS/dNSel, equivalent to the dN/dS rates in
CDS). We proceeded in the same way for polymorphism data
(pPUS/pNSel). As expected, dPUS/dNSel values in most non-
coding genomic elements were higher than the correspond-
ing dN/dS values in CDS (fig. 1 and supplementary table S6,
Supplementary Material online), with the exception of CNC
regions. This pattern is consistent with stronger purifying se-
lection against amino acid substitutions and with the requisite
of sequence conservation for CNC regions. Moreover, as the
definition of selected sites in noncoding elements is less strict
than in CDS, dPUS includes a higher proportion of neutrally
evolving sites than dN, increasing comparatively the dPUS/
dNSel ratio. Notably, with the exception of the promoter se-
quences (which showed similar dPUS/dNSel values among all
five datasets), all the remaining noncoding regions displayed
significant differences in their dPUS/dNSel values (supplemen-
tary table S7, Supplementary Material online). The dPUS/dNSel
value for introns in the Acc. Introns dataset was significantly
higher than in the two neurological pathways but it was not
different from that of the Complement and Actin pathways.
On the contrary, the subset of introns with evidence of accel-
erated evolution (i.e., the Only Acc. Intron dataset) presented
dPUS/dNSel values clearly higher than those of any other gene
set (supplementary table S7, Supplementary Material online).
In summary, divergence rates are in agreement with our initial
rationale for selecting the Actin and Complement pathways as
references, respectively, for constrained and accelerated evo-
lution on CDS. However, in the Acc. Intron set, this is only true
when considering the subset of introns previously identified as
accelerated.
Contrary to the homogeneity found among dS values, pS
showed notable differences between gene sets, with
Parkinson and Acc. Introns displaying the lowest and highest
values of pS, respectively. Complement and Acc. Introns dis-
played the higher pN/pS values, even if not all-pairwise com-
parisons were reciprocally significant (fig. 1 and
supplementary tables S6 and S7, Supplementary Material
online). The equivalent ratio in noncoding regions (pPUS/
pNSel) was clearly higher than that in CDS, a pattern that
again is consistent with the softer evolutionary constraints of
noncoding regions. Among noncoding elements, CNC
showed again the lowest level of pPUS/pNSel. Moreover, in
noncoding sequences, we observed several cases of significant
differences in the pPUS/pNSel ratio between gene sets (sup-
plementary table S7, Supplementary Material online).
Contrary to what we observed for the dPUS/dNSel ratio in
the Only Acc. Introns subset, the pPUS/pNSel ratio did not
show significant differences to that of any other gene set.
Divergence measures showed that dN/dS, dN, and dS
values in CDS of Alzheimer and Parkinson were not signifi-
cantly different between each other or from those in the Actin
pathway, whereas all of them were significantly lower than
those from the Complement and Acc. Introns gene sets. On
the contrary, polymorphism measures showed that although
pN/pS ratios were also similar between the two neurological
and the Actin pathways, both pN and pS measures were sig-
nificantly lower in the Parkinson pathway.
Finally, we examined the relationship between the dN/dS
and pN/pS ratios (or their equivalents in introns) and found
significant correlations in the case of CDS as well as for introns
(P values of 0.02 and 0.023, and adjusted R2 of 0.84 and 0.81,
respectively), but only when not considering the Only Acc.
Introns subset (supplementary fig. S1, Supplementary
Material online). The higher divergence rate of this latter
subset was discordant with its observed pPUS/pNSel value,
which was lower than what would be predicted by the re-
gression model.
Quantifying Adaptive Evolution
High dN/dS (or dPUS/dNSel) values could reflect either the
signature of past positive selection or relaxation of selective
constraints. By contrasting the levels of polymorphism and
divergence at putatively neutral and functional sites, it is pos-
sible to discriminate between these two different scenarios.
Here, we have done so by applying an extension of the MKT,
the DFE-alpha method (Keightley and Eyre-Walker 2007).
Santpere et al. GBE
1496 Genome Biol. Evol. 7(6):1490–1505. doi:10.1093/gbe/evv082 Advance Access publication May 14, 2015
by guest on July 18, 2015http://gbe.oxfordjournals.org/
Dow
nloaded from
Actin Complement Acc. Introns Alzheimer Parkinson
0.00
00.
002
0.00
40.
006
0.00
80.
010
0.01
2 pPuspNSeldPusdNSel
Actin Complement Acc. Introns Alzheimer Parkinson
0.2
0.4
0.6
0.8
1.0
pPus/pNSeldPus/dNSel
CNC
Actin Complement Acc. Introns Alzheimer Parkinson
0.00
00.
002
0.00
40.
006
0.00
80.
010
0.01
2 pPuspNSeldPusdNSel
Actin Complement Acc. Introns Alzheimer Parkinson
0.7
0.8
0.9
1.0
1.1
1.2
1.3
1.4
pPus/pNSeldPus/dNSel
Introns
Actin Complement Acc. Introns Alzheimer Parkinson
0.00
00.
002
0.00
40.
006
0.00
80.
010
0.01
2 pPuspNSeldPusdNSel
Actin Complement Acc. Introns Alzheimer Parkinson
0.7
0.8
0.9
1.0
1.1
1.2
1.3
1.4
pPus/pNSeldPus/dNSel
Promoters
Actin Complement Acc. Introns Alzheimer Parkinson
0.00
00.
002
0.00
40.
006
0.00
80.
010
0.01
2 pPuspNSeldPusdNSel
Actin Complement Acc. Introns Alzheimer Parkinson
0.4
0.6
0.8
1.0
1.2
1.4
pPus/pNSeldPus/dNSel
UTRs
Actin Complement Acc. Introns Alzheimer Parkinson
0.00
00.
002
0.00
40.
006
0.00
80.
010
pNpSdNdS
Actin Complement Acc. Introns Alzheimer Parkinson
0.0
0.2
0.4
0.6
0.8
1.0
pN/pSdN/dS
CDS
FIG. 1.—Divergence and polymorphism values for all genomic elements and pathways.
Analysis of Five Gene Sets in Chimpanzee GBE
Genome Biol. Evol. 7(6):1490–1505. doi:10.1093/gbe/evv082 Advance Access publication May 14, 2015 1497
by guest on July 18, 2015http://gbe.oxfordjournals.org/
Dow
nloaded from
Briefly, neutral sites (either 4-fold or trailer, depending on the
genomic element analyzed) were used to infer demographic
parameters of the chimpanzee population. We then used the
inferred demography to assess the DFEs at functional sites and
to estimate a and oa for each gene set and class of genomic
element under analysis.
Both the choice of different neutral references and the
number of putative neutral sites can affect the estimation of
a and oa. For that, we evaluated in CDS the potential discrep-
ancies between estimates of a and oa when using, as neutral
reference, either 1) only the 4-fold sites of each corresponding
pathway or 2) the concatenation of the 4-fold sites of all path-
ways. In the rest of the text, we focus on the results obtained
with the latter strategy but make the appropriate comments
when the use of the 4-fold sites of each pathway produces
discordant patterns. As for noncoding elements, and as ex-
plained above, we used the trailer region of each pathway
(removing conserved tracks) as neutral reference.
DFE of New Mutations
We first examined the DFEs distinguishing between nearly
neutral (Nes< 1), mildly deleterious (1<Nes< 10), deleterious
(10<Nes< 100), and very deleterious (Nes>100) mutations
(Keightley and Eyre-Walker 2007). As expected under the
action of purifying selection, the coding sequences of the
Actin pathway show an excess of very deleterious mutations
(47.5%, see supplementary fig. S2 and table S8,
Supplementary Material online). The CDS of the two neuro-
logical pathways displayed a proportion of deleterious to very
deleterious mutations similar to that from the purifying selec-
tion reference set (supplementary fig. S2 and table S8,
Supplementary Material online). In contrast, the CDS of the
Complement and Acc. Introns gene sets displayed the highest
proportions of nearly neutral mutations (42% and 52%, re-
spectively). Except for the Actin pathway, the use of each-
pathway 4-fold sites as neutral reference produced very
slightly different results, mainly affecting the proportion of
very deleterious mutations.
As for DFE in noncoding elements, a substantial proportion
of new mutations were predicted to be deleterious in CNC
and UTRs, particularly in the two neurological pathways. This
suggests the presence of a proportion of functional sites in
these regulatory regions and that the action of selection can,
in principle, be detected. In contrast, polymorphic sites in pro-
moters and introns were predicted to be almost exclusively
neutral in all gene sets. As in CDS, both neurological pathways
showed very similar DFE in all noncoding genomic elements.
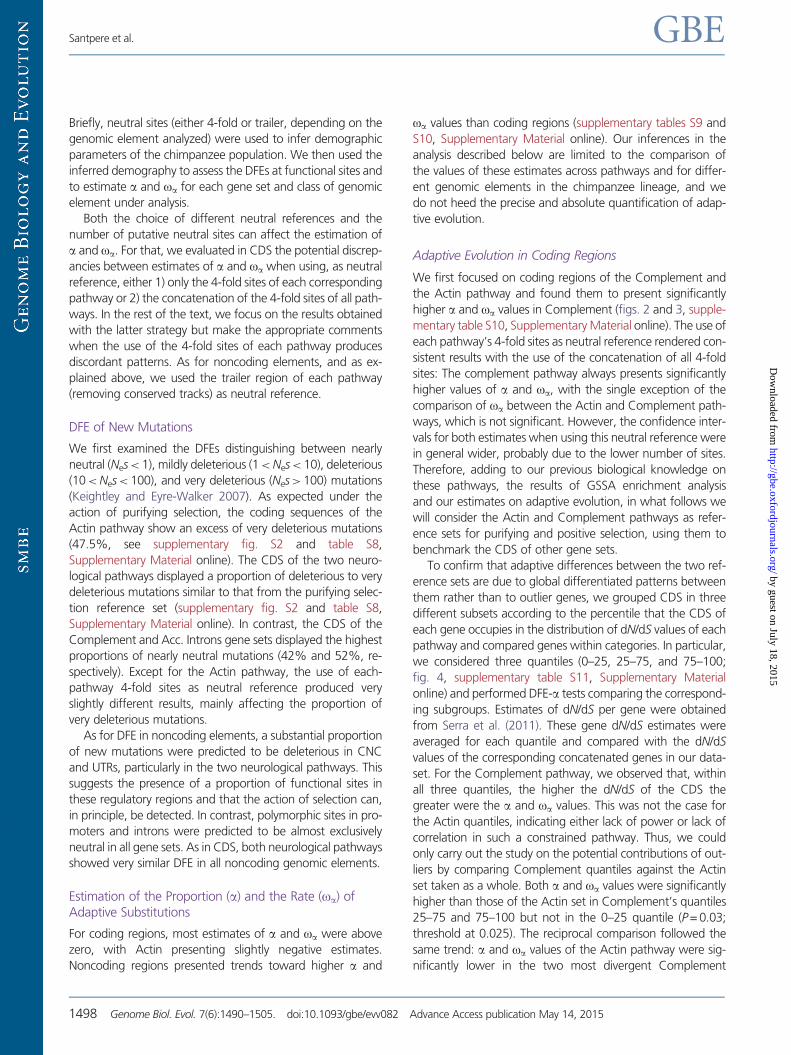
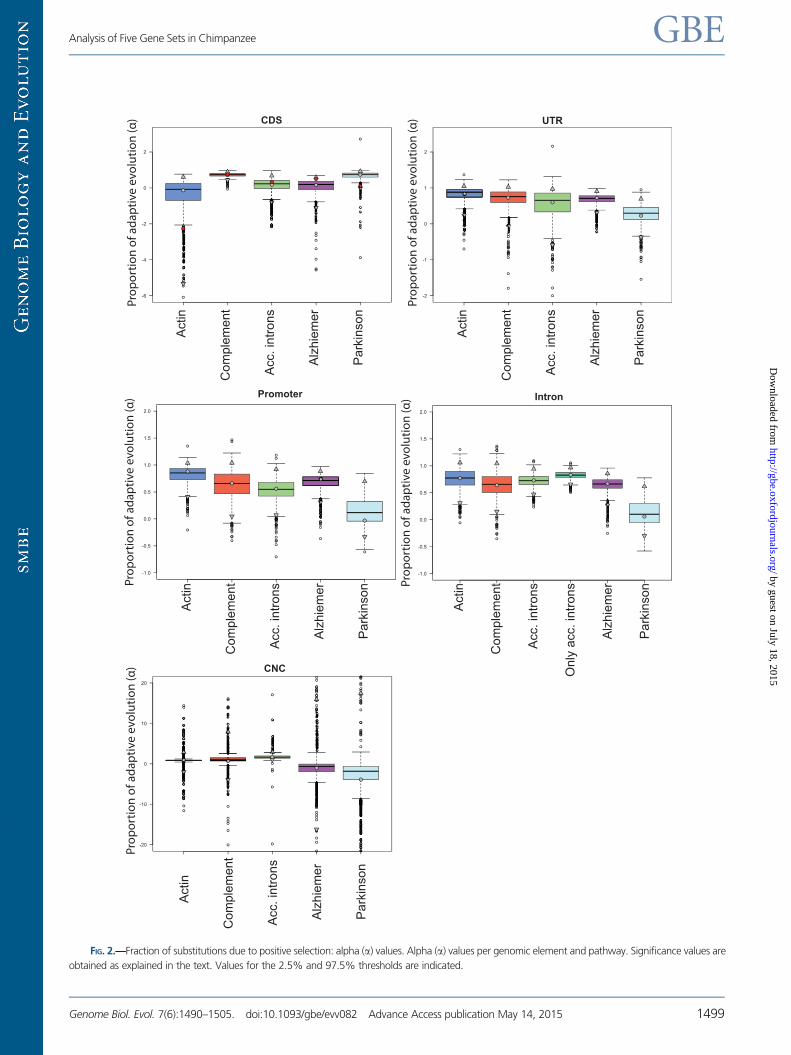
Estimation of the Proportion (a) and the Rate (oa) ofAdaptive Substitutions
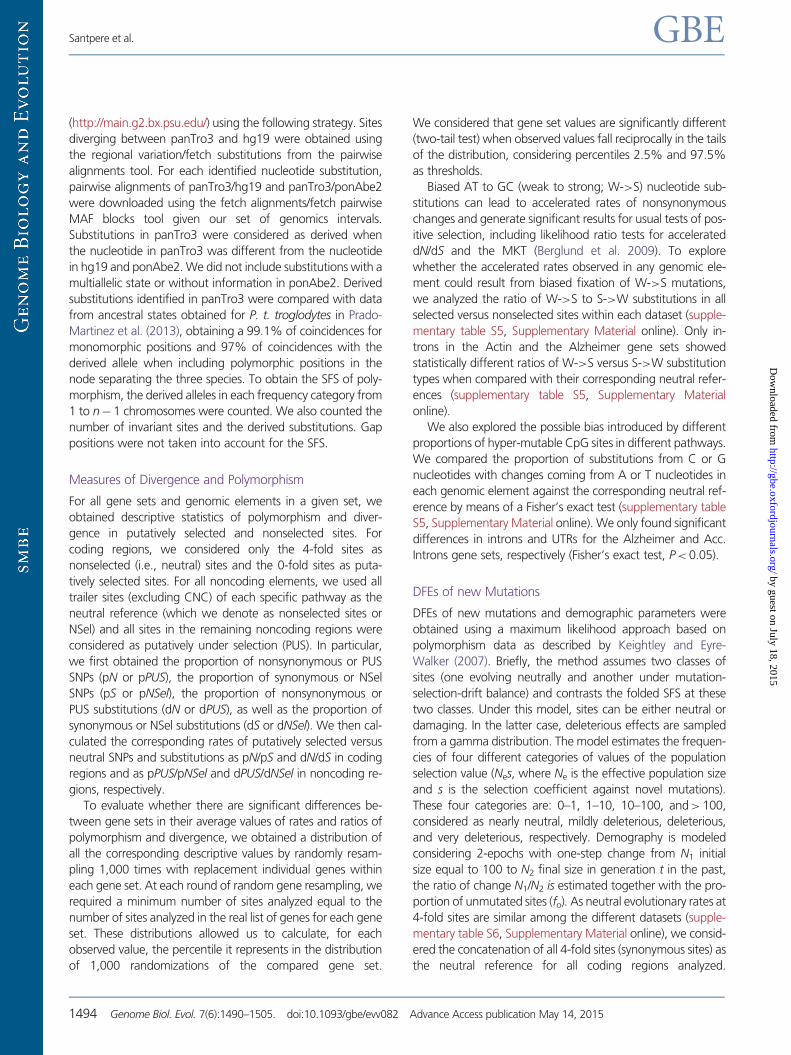
For coding regions, most estimates of a and oa were above
zero, with Actin presenting slightly negative estimates.
Noncoding regions presented trends toward higher a and
oa values than coding regions (supplementary tables S9 and
S10, Supplementary Material online). Our inferences in the
analysis described below are limited to the comparison of
the values of these estimates across pathways and for differ-
ent genomic elements in the chimpanzee lineage, and we
do not heed the precise and absolute quantification of adap-
tive evolution.
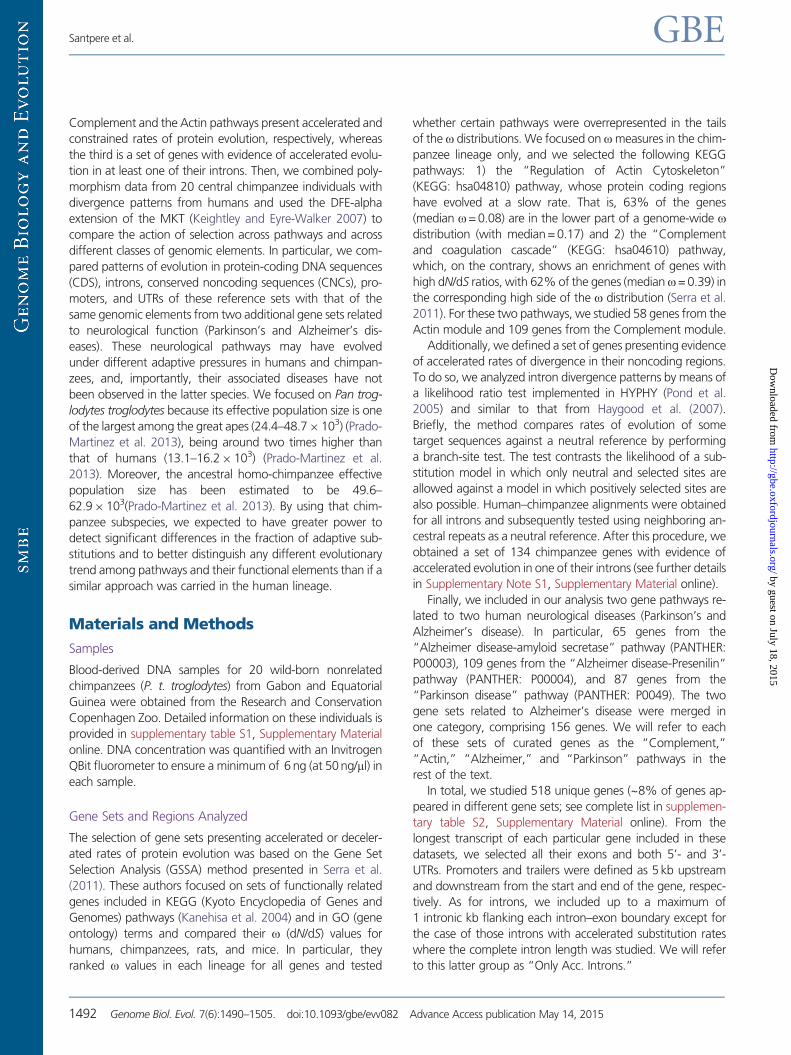
Adaptive Evolution in Coding Regions
We first focused on coding regions of the Complement and
the Actin pathway and found them to present significantly
higher a and oa values in Complement (figs. 2 and 3, supple-
mentary table S10, Supplementary Material online). The use of
each pathway’s 4-fold sites as neutral reference rendered con-
sistent results with the use of the concatenation of all 4-fold
sites: The complement pathway always presents significantly
higher values of a and oa, with the single exception of the
comparison of oa between the Actin and Complement path-
ways, which is not significant. However, the confidence inter-
vals for both estimates when using this neutral reference were
in general wider, probably due to the lower number of sites.
Therefore, adding to our previous biological knowledge on
these pathways, the results of GSSA enrichment analysis
and our estimates on adaptive evolution, in what follows we
will consider the Actin and Complement pathways as refer-
ence sets for purifying and positive selection, using them to
benchmark the CDS of other gene sets.
To confirm that adaptive differences between the two ref-
erence sets are due to global differentiated patterns between
them rather than to outlier genes, we grouped CDS in three
different subsets according to the percentile that the CDS of
each gene occupies in the distribution of dN/dS values of each
pathway and compared genes within categories. In particular,
we considered three quantiles (0–25, 25–75, and 75–100;
fig. 4, supplementary table S11, Supplementary Material
online) and performed DFE-a tests comparing the correspond-
ing subgroups. Estimates of dN/dS per gene were obtained
from Serra et al. (2011). These gene dN/dS estimates were
averaged for each quantile and compared with the dN/dS
values of the corresponding concatenated genes in our data-
set. For the Complement pathway, we observed that, within
all three quantiles, the higher the dN/dS of the CDS the
greater were the a and oa values. This was not the case for
the Actin quantiles, indicating either lack of power or lack of
correlation in such a constrained pathway. Thus, we could
only carry out the study on the potential contributions of out-
liers by comparing Complement quantiles against the Actin
set taken as a whole. Both a and oa values were significantly
higher than those of the Actin set in Complement’s quantiles
25–75 and 75–100 but not in the 0–25 quantile (P = 0.03;
threshold at 0.025). The reciprocal comparison followed the
same trend: a and oa values of the Actin pathway were sig-
nificantly lower in the two most divergent Complement
Santpere et al. GBE
1498 Genome Biol. Evol. 7(6):1490–1505. doi:10.1093/gbe/evv082 Advance Access publication May 14, 2015
by guest on July 18, 2015http://gbe.oxfordjournals.org/
Dow
nloaded from
Act
in
Com
plem
ent
Acc
. int
rons
Alz
hiem
er
Par
kins
on
CDSPr
opor
tion
of a
dapt
ive
evol
utio
n (α
)
Act
in
Com
plem
ent
Acc
. int
rons
Alz
hiem
er
Par
kins
on
UTR
Act
in
Com
plem
ent
Acc
. int
rons
Alz
hiem
er
Par
kins
on
CNC
Act
in
Com
plem
ent
Acc
. int
rons
Alz
hiem
er
Par
kins
on
Promoter
Act
in
Com
plem
ent
Acc
. int
rons
Alz
hiem
er
Par
kins
on
Intron
Onl
y ac
c. in
trons
-6
-4
-2
0
2
-2
-1
0
1
2
-20
-10
0
10
20
-1.0
-0.5
0.0
0.5
1.0
1.5
2.0
-1.0
-0.5
0.0
0.5
1.0
1.5
2.0Pr
opor
tion
of a
dapt
ive
evol
utio
n (α
)
Prop
ortio
n of
ada
ptiv
e ev
olut
ion
(α)
Prop
ortio
n of
ada
ptiv
e ev
olut
ion
(α)
Prop
ortio
n of
ada
ptiv
e ev
olut
ion
(α)
FIG. 2.—Fraction of substitutions due to positive selection: alpha (a) values. Alpha (a) values per genomic element and pathway. Significance values are
obtained as explained in the text. Values for the 2.5% and 97.5% thresholds are indicated.
Analysis of Five Gene Sets in Chimpanzee GBE
Genome Biol. Evol. 7(6):1490–1505. doi:10.1093/gbe/evv082 Advance Access publication May 14, 2015 1499
by guest on July 18, 2015http://gbe.oxfordjournals.org/
Dow
nloaded from
Act
in
Com
plem
ent
Acc
. int
rons
Alz
hiem
er
Par
kins
on
CDS
-2
-1
0
1
2
3
Rate
of a
dapt
ive
evol
utio
n (ω
α)
Act
in
Com
plem
ent
Acc
. int
rons
Alz
hiem
er
Par
kins
on
-5
0
5
10
UTR
Rate
of a
dapt
ive
evol
utio
n (ω
α)
-6
-4
-2
0
2
4
6
Act
in
Com
plem
ent
Acc
. int
rons
Alz
hiem
er
Par
kins
on
CNC
Rate
of a
dapt
ive
evol
utio
n (ω
α)
-5
0
5
10
Act
in
Com
plem
ent
Acc
. int
rons
Alz
hiem
er
Par
kins
on
Promoter
Rate
of a
dapt
ive
evol
utio
n (ω
α)
-20
-10
0
10
20
Act
in
Com
plem
ent
Acc
. int
rons
Alz
hiem
er
Par
kins
on
Intron
Rate
of a
dapt
ive
evol
utio
n (ω
α)
Onl
y ac
c. in
trons
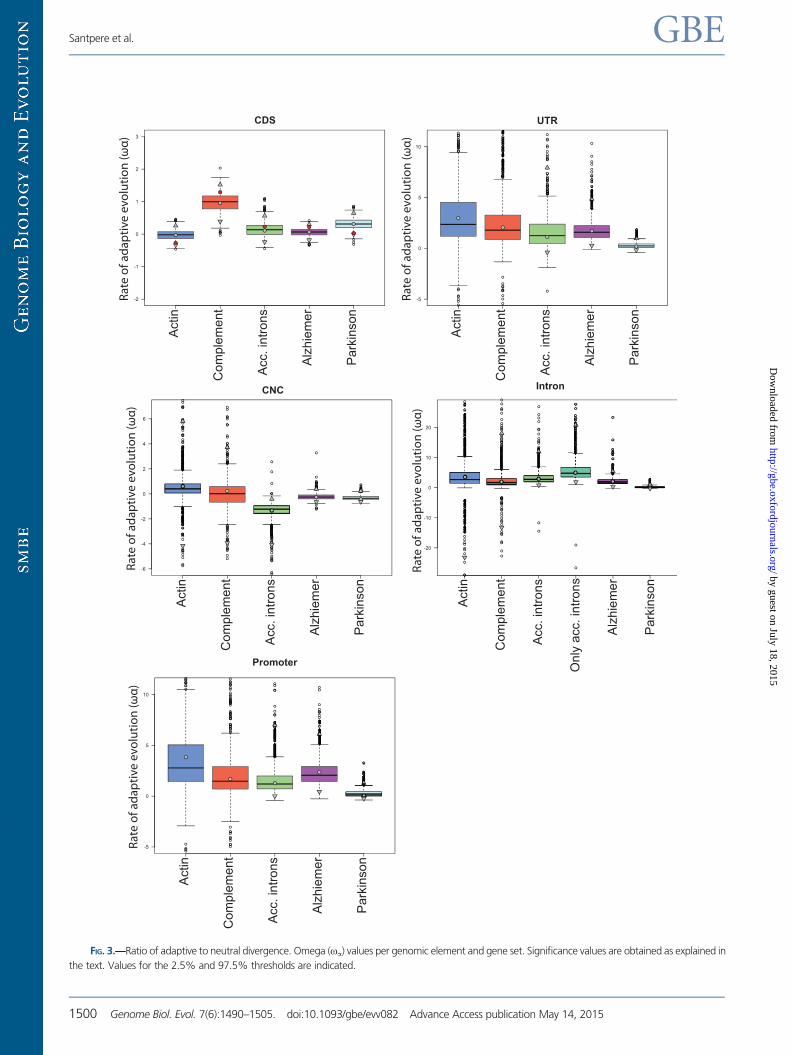
FIG. 3.—Ratio of adaptive to neutral divergence. Omega (oa) values per genomic element and gene set. Significance values are obtained as explained in
the text. Values for the 2.5% and 97.5% thresholds are indicated.
Santpere et al. GBE
1500 Genome Biol. Evol. 7(6):1490–1505. doi:10.1093/gbe/evv082 Advance Access publication May 14, 2015
by guest on July 18, 2015http://gbe.oxfordjournals.org/
Dow
nloaded from
percentiles but not in the 0–25 quantile (supplementary table
S12, Supplementary Material online). The use of 4-fold sites of
each gene set as neutral reference did not substantially affect
the results (adjusted R2= 0.995 and 0.92; P value = 0.03 and
0.132, for a and oa respectively).
All these observations suggest first, that the accelerated
evolution in the CDS of the Complement was contributed
by adaptive processes rather than being the result of relaxed
constraints and, second, that adaptation acted globally in the
pathway rather than only into outlier genes.
In coding regions, the combination of information coming
from both, divergence and polymorphism data, confirms and
refines the evolutionary trends previously inferred using only
divergence data. The CDS of the Actin pathway, which was
included in the study for its constrained divergence levels, do
show significantly lower a and oa values than the CDS se-
lected for accelerated divergence (Complement). However,
our observations go beyond that distinction. For instance, it
is interesting that, although dN/dS measures (supplementary
table S6, Supplementary Material online) were high in the
coding regions of the Complement and the Acc. Intron data-
sets (dN/dS of 0.60 and 0.55, respectively; supplementary
table S6, Supplementary Material online), a and oa values
were significantly increased only in the Complement CDS.
The coding regions of the Acc. Intron dataset which also
show the second lower proportion of very deleterious muta-
tions just after the Complement (supplementary fig. S2,
Supplementary Material online) did not show significantly dif-
ferent oa values to those from the Actin pathway. These re-
sults suggest that while the increased dN/dS ratio in the
Complement pathway has been driven by adaptive evolution,
such elevated ratio in the coding regions of the Acc. Intron
dataset rather reflects the relaxation of purifying selection.
When comparing the a and oa estimates obtained for the
coding regions of the two neurological pathways with those
of the reference gene sets for positive and purifying selection,
some patterns emerge (figs. 2 and 3 and supplementary tables
S9 and S10, Supplementary Material online): a and oa values
for Alzheimer’s CDS are not significantly different from those
of the highly conserved Actin pathway but are significantly
lower than those of Complement. On the contrary, a and
oa estimates for Parkinson’s CDS are significantly higher
than those from the Actin pathway, and only oa is also sig-
nificantly lower to that of the Complement.
When using each-pathway 4-fold sites as neutral reference,
Parkinson a and oa values are not significantly different from
those from Actin, and only the latter is significantly lower than
Alzheimer’s oa. Moreover, a and oa values for Complement
CDS only remain suggestive of being differentially increased to
those of Parkinson and Alzheimer. However, the wider confi-
dence intervals obtained in some pathways when using this
latter reference may decrease the power of particular statisti-
cal comparisons. In particular, Parkinson and Complement
pathways showed the largest residuals in both a and oa cor-
relations, implying that these two gene sets are probably the
most affected by the choice of the neutral reference.
Although oa estimates obtained with the two different neu-
tral references for CDS show significant correlation (adjusted
R2= 0.81; P value = 0.024) that is not the case for a estimates
(adjusted R2= 0.27; P value = 0.21). Thus, the most robust ob-
servation is that CDS in both Alzheimer and Parkinson gene
sets have adaptive rates that are lower than those of the
CDSPr
opor
tion
of a
dapt
ive
evol
utio
n (α
)CDS
Rate
of a
dapt
ive
evol
utio
n (ω
α)
-4
-2
0
2
4
6
-2
0
2
4
actin
Com
plem
ent
Com
plem
ent 0
-25
Com
plem
ent 2
5-75
Com
plem
ent 7
5-10
0
actin
Com
plem
ent
Com
plem
ent 0
-25
Com
plem
ent 2
5-75
Com
plem
ent 7
5-10
0
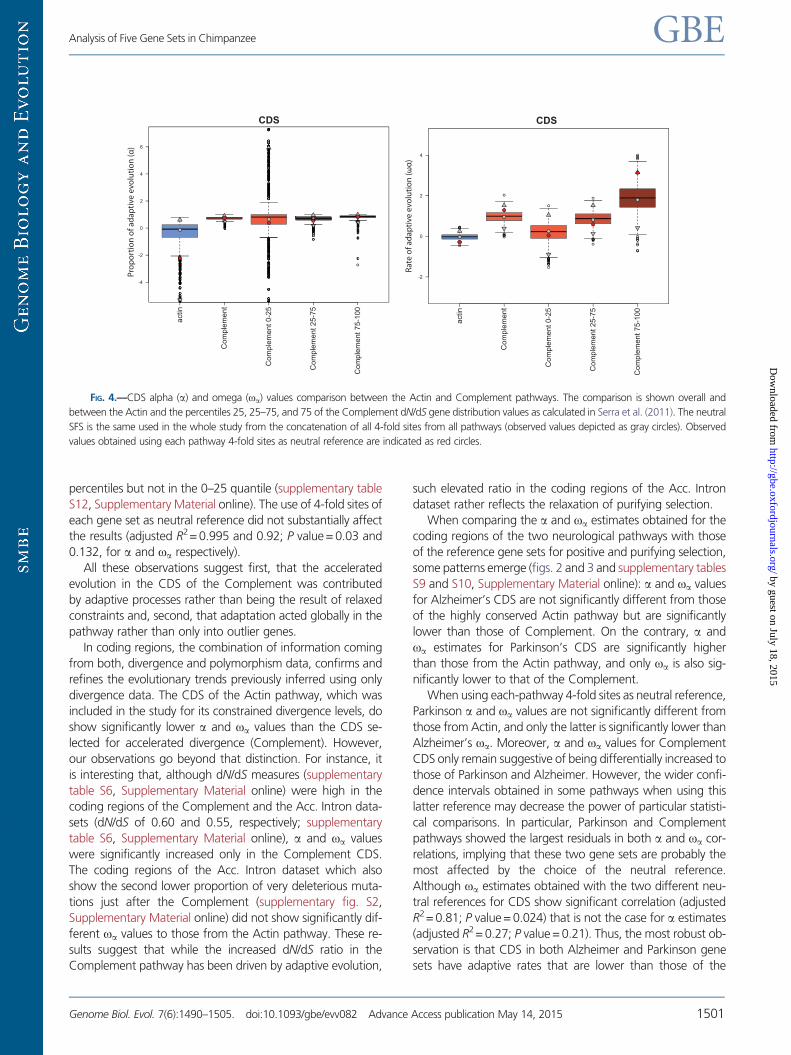
FIG. 4.—CDS alpha (a) and omega (oa) values comparison between the Actin and Complement pathways. The comparison is shown overall and
between the Actin and the percentiles 25, 25–75, and 75 of the Complement dN/dS gene distribution values as calculated in Serra et al. (2011). The neutral
SFS is the same used in the whole study from the concatenation of all 4-fold sites from all pathways (observed values depicted as gray circles). Observed
values obtained using each pathway 4-fold sites as neutral reference are indicated as red circles.
Analysis of Five Gene Sets in Chimpanzee GBE
Genome Biol. Evol. 7(6):1490–1505. doi:10.1093/gbe/evv082 Advance Access publication May 14, 2015 1501
by guest on July 18, 2015http://gbe.oxfordjournals.org/
Dow
nloaded from
positively selected Complement pathway and overall similar to
those of the remaining gene sets.
Adaptive Evolution in Noncoding Regions
We next examined patterns of evolution in the Acc. Introns
dataset, where at least one intron showed significant diver-
gence patterns of acceleration (see Materials and Methods).
When considering either all introns or only the accelerated
introns in this set and comparing them with the introns
from the other gene sets, we did not find significantly differ-
ent a and oa estimates (figs. 2 and 3; supplementary table
S10, Supplementary Material online). Thus, introns in the Acc.
Introns gene set did not display any particular adaptive signal
neither as a whole or when considering only the accelerated
introns. In this case, and contrary to what occurs in
Complement’s CDS, the accelerated divergence found in
the introns of the Only Acc. Introns set is not accompanied
by evidence for any particularly higher adaptive process com-
pared with the introns of other gene sets.
We then focused on the estimated values of a and oa in
the remaining noncoding genomic elements and found no
major differences among pathways for any of the noncoding
elements. All noncoding regions in Actin and Complement
gene set displayed similar values of a and oa, contrary to
what we observed in their coding regions. Interestingly,
CNC in the Acc. Introns gene set showed a significantly
higher value of a and a significantly lower value of oa. This
suggests that the few changes occurred in the CNC of this
gene set (low oa) may have been the result of adaptive evo-
lution in a particularly higher proportion (higher a). Another
relevant observation is that all noncoding elements in the
Parkinson pathway displayed significantly lower values of aand oa against most gene sets.
Comparing Adaptive Evolution in Coding and NoncodingRegions
Next, we focused on the question of whether evolutionary
trends detected for the CDS in a given pathway are correlated
with the noncoding regions in these pathways and vice versa,
whether observations in noncoding elements are also ob-
served in CDS.
First, it is clear that the differences between gene sets de-
tected for a certain genomic element do not necessarily
extend to the others. For instance, a and oa in Complement
CDSs are significantly higher than those of the remaining CDS
sets, but these higher proportion and rates of adaptive
changes was not observed in any of its corresponding non-
coding elements. That is, the a and oa values from noncoding
elements of the Complement pathway did not display any
particular trend when compared against the noncoding ele-
ments from the other gene sets. The same decoupling be-
tween coding and noncoding elements was found for the
Acc. Intron dataset: a and oa values in CNC tends to be
significantly higher and lower, respectively, than those of
the noncoding elements in the rest of gene sets, but these
differences are not detected in the CDS of the Acc. Introns
gene set (supplementary table S10, Supplementary Material
online, and figs. 2 and 3). These results suggest that natural
selection is acting differently in coding and noncoding regions
within the same functional or evolutionary gene set. This gen-
eral decoupling is also observed in the case of Parkinson.
Although noncoding elements in Parkinson present signifi-
cantly lower a and oa values than those of the remaining
gene sets, a and oa values in Parkinson CDS are not signifi-
cantly decreased compared with CDS in any other gene set.
Discussion
We have applied an extension of the MK test to compare rates
and proportions of adaptive evolution acting on different
coding and noncoding genomic elements from different
gene sets. This method has proven useful to discriminate be-
tween different scenarios resulting in accelerated divergence.
Three gene sets were chosen for their enrichment in genes
with accelerated or constrained dN/dS or high intron evolu-
tionary rates. As we obviously did not select random gene
sets, the finding of accelerated and decelerated rates of adap-
tive evolution on their corresponding genomic elements is ex-
pected. However, confirmation with polymorphism data was
needed to use them as reference gene sets with comparative
value. Indeed, although coding regions in the Complement
pathway showed highest values of adaptive evolution, those
of the Acc. Introns dataset, with similar divergence rates, did
not show any particularly high proportion or rate of adaptive
evolution. Similarly, highly accelerated divergence rates in in-
trons are not accompanied by any particularly high estimate of
adaptive evolution in the Only Acc. Introns subset. Thus, only
in CDS, we can reinforce the idea that accelerated rates of
divergence in these specific preselected elements are due to
positive selection and not just to relaxation of purifying selec-
tion. Moreover, we have determined that at least for the
Complement pathway, the enhanced adaptive process af-
fected globally all genes within the pathway, rather than re-
sulting from the contribution of few highly diverged genes.
Neurological Gene Sets
The coding regions of the Alzheimer and Parkinson pathways
showed levels of polymorphism and divergence, as well as
DFEs estimates, that are suggestive of the prevalent action
of purifying selection on these two neurological gene sets in
the chimpanzee lineage. Parkinson, in particular, presented a
pattern of constrained diversity (lower pN and pS values with a
left-skewed SFS), which is highly suggestive of the recent
action of purifying selection in chimpanzees. The action of
purifying selection in the chimpanzee lineage upon the
Alzheimer and Parkinson pathways, even if presenting differ-
ent intensities in the two pathways, is consistent with the low
Santpere et al. GBE
1502 Genome Biol. Evol. 7(6):1490–1505. doi:10.1093/gbe/evv082 Advance Access publication May 14, 2015
by guest on July 18, 2015http://gbe.oxfordjournals.org/
Dow
nloaded from
rates of protein evolution reported for these functional gene
sets in humans (Hamilton 2004; Holzer et al. 2004; Rosen
et al. 2008; Serra et al. 2011). Disease-related genes are
known to present higher degrees of conservation (Arbiza
et al. 2006). However, humans are the only animals known
to be susceptible to Alzheimer and Parkinson, even though
the main hallmarks of Alzheimer (i.e., Ab and hyper-
phosphorylated tau deposition) have also been reported in
the great apes (Gearing et al. 1997; Kimura et al. 2001;
Rosen et al. 2008). In a recent study analyzing aging-associ-
ated changes in brains from humans (up to 88-year old) and
chimpanzees (up to 51-year old), the authors found signifi-
cantly higher neuropathological effects in human brains and
concluded that these resulted from an extended lifespan in
our species (Sherwood et al. 2011). However, the neurobiol-
ogy of ageing in the great apes is largely unknown due to the
scarcity of available brain samples from older individuals, since
even under continuous medical care the maximum lifespan of
captive chimpanzees rarely reaches 60 years (Erwin et al.
2002). Thus, the absence of severe neurodegenerative pro-
cesses in chimpanzees can hardly be considered a dogma and
rather than the often claimed trade-off between human–spe-
cific neurological adaptations, or the even more unlikely
human-specific relaxation of selective pressures in neurologi-
cal function, neurodegeneration might have been reported
only in humans due to our extended lifespan.
Analysis of Potential Caveats
Three important limitations when quantifying adaptive evolu-
tion are the selection of a proper neutral reference, the power
rendered by the number of sites used to obtain the SFS, and
the small proportion of sites that might actually be under se-
lection in particularly large genomic elements such as introns
or promoters.
A reasonable and well-established neutral reference for
coding regions is the use of interdigitated sites, normally pro-
vided by the 4-fold degenerated positions. However, such
strategy has the disadvantage of reducing considerably the
data available to obtain a neutral SFS for correcting a and
oa estimates with the information of the DFE and inferred
linkage/demographic changes. We tried to overcome this lim-
itation by using, as neutral SFS, the concatenation of all 4-fold
sites in the whole dataset. This has the advantage of increas-
ing the number of polymorphisms to construct the SFS but
may produce a neutral SFS significantly different from the one
of each specific gene set analyzed. In all analyses, we com-
pared the results produced by using both strategies to empha-
size only robust observations.
For noncoding elements, the use of 4-fold degenerated
sites might not be as advisable since these are generally sub-
jected to stronger constraints than most sites in noncoding
regions (Lawrie et al. 2013). In our case, we used the infor-
mation provided by the trailer regions, concatenating all 5-kb
regions downstream the end of each gene within each given
gene set and excluding all fragments that were candidates to
being CNCs. This strategy has the additional advantage of
providing enough sites in each individual gene set to be
used as neutral reference, without the need of merging sites
from different pathways.
As both a and oa estimates depend on quantifying an
excess of fixed functional substitutions, there may exist a
degree of correlation between dN/dS (or dPUS/dNSel in non-
coding regions) and a and oa values. This might raise some
concerns on circularity between the criteria for choosing
genes and the measures obtained on them. Indeed, such cor-
relation is expected but only when all polymorphisms are pre-
dicted to be neutral. This correlation can be broken when
there are some deleterious mutations skewing the DFE and,
therefore, it is important to correct for their contribution to
divergence when estimating a and oa. In those elements
where deleterious effects for new mutations are estimated
at different proportions among gene sets (as in CDS), diver-
gence measures will be corrected differently, producing oa
estimates not-necessarily correlated with dN/dS. In contrast,
in cases where all DFE are identical among gene sets (as in
introns), such correlation is expected to be higher. As depicted
in supplementary figure S3, Supplementary Material online,
our observations match these expectations.
When all or most new mutations are predicted to be neu-
tral, divergence rates perfectly correlate with a and oa adap-
tive estimates. This is the pattern we observed in introns and
promoters. However, the absence of predicted nonneutral
new mutations does not necessarily exclude the action of nat-
ural selection. Both strongly advantageous and very deleteri-
ous mutations will very rarely be observed as polymorphisms
as they are either swept through or removed from the popu-
lation very quickly. Therefore, an excess of substitutions in
selected sites could still be interpreted as adaptive evolution
coming from strongly selected advantageous mutations.
Decoupling Action of Selection on Genomic Elements
The adaptive history of coding and noncoding sequences
seems to be decoupled, at least for the gene sets analyzed.
For instance, when evidence for positive selection is inferred
from protein divergence and polymorphism, it does not imply
that noncoding regions of the same genes will present similar
selective pressures. When making this observation, we do not
imply that selection acts always differently in coding and non-
coding elements, we rather state that the former is not a
requisite or a general law. Moreover, we also observe in-
stances of coupled action of selection among different non-
coding genomic elements of particular pathways, with most
Parkinson regulatory elements, for instance, evolving at con-
sistently lower levels. In short, our results, although based on a
limited number of gene sets, render some support to the idea
that regulatory and protein-coding sequences can present
Analysis of Five Gene Sets in Chimpanzee GBE
Genome Biol. Evol. 7(6):1490–1505. doi:10.1093/gbe/evv082 Advance Access publication May 14, 2015 1503
by guest on July 18, 2015http://gbe.oxfordjournals.org/
Dow
nloaded from
different rates of substitution and adaptive changes respond-
ing to their own evolutionary dynamics.
Supplementary Material
Supplementary note S1, figures S1–S4, and tables S1–S12 are
available at Genome Biology and Evolution online (http://
www.gbe.oxfordjournals.org/).
Acknowledgments
This work was supported by Ministerio de Ciencia e
Innovacion, Spain (SAF2011-29239 to E.B. and BFU2012-
38236 to A.N.), Direccio General de Recerca, Generalitat de
Catalunya (2014SGR1311 and 2014SGR866), the Spanish
National Institute of Bioinfomatics of the Instituto de Salud
Carlos III (PT13/0001/0026), and FEDER (Fondo Europeo de
Desarrollo Regional)/FSE (Fondo Social Europeo). The authors
also thank Heinz Himmelbauer, Miquel-Angel Adrover, and
Rebecca Curley from the Genomics Unit of the Centre for
Genomic Regulation (CRG) for their technical sequencing sup-
port and advice.
Literature CitedAndolfatto P. 2005. Adaptive evolution of non-coding DNA in Drosophila.
Nature 437:1149–1152.
Arbiza L, et al. 2006. Selective pressures at a codon-level predict deleteri-
ous mutations in human disease genes. J Mol Biol. 358:1390–1404.
Berglund J, Pollard KS, Webster MT. 2009. Hotspots of biased nucleotide
substitutions in human genes. PLoS Biol. 7:e26.
Bierne N, Eyre-Walker A. 2004. The genomic rate of adaptive amino acid
substitution in Drosophila. Mol Biol Evol. 21:1350–1360.
Boyko AR, et al. 2008. Assessing the evolutionary impact of amino acid
mutations in the human genome. PLoS Genet. 4:e1000083.
Bustamante CD, et al. 2002. The cost of inbreeding in Arabidopsis. Nature
416:531–534.
Bustamante CD, et al. 2005. Natural selection on protein-coding genes in
the human genome. Nature 437:1153–1157.
Charlesworth J, Eyre-Walker A. 2006. The rate of adaptive evolution in
enteric bacteria. Mol Biol Evol. 23:1348–1356.
Elyashiv E, et al. 2010. Shifts in the intensity of purifying selection: an
analysis of genome-wide polymorphism data from two closely related
yeast species. Genome Res. 20:1558–1573.
Erwin JM, Hof PR, Ely JJ, Perl DP. 2002. One gerontology: advancing
understanding of aging through studies of great apes and other pri-
mates. In: Erwin JM, Rockville M, Hof PR, editors. Aging in nonhuman
primates, Interdiscipl Top Gerontol, Vol. 31. Basel: Karger. p. 1–21.
Eyre-Walker A. 2006. The genomic rate of adaptive evolution. Trends Ecol
Evol. 21:569–575.
Eyre-Walker A, Keightley PD. 2007. The distribution of fitness effects of
new mutations. Nat Rev Genet. 8:610–618.
Eyre-Walker A, Keightley PD. 2009. Estimating the rate of adaptive mo-
lecular evolution in the presence of slightly deleterious mutations and
population size change. Mol Biol Evol. 26:2097–2108.
Fay JC. 2011. Weighing the evidence for adaptation at the molecular level.
Trends Genet. 27:343–349.
Fay JC, Wyckoff GJ, Wu CI. 2001. Positive and negative selection on the
human genome. Genetics 158:1227–1234.
Ferrer-Admetlla A, et al. 2008. Balancing selection is the main force
shaping the evolution of innate immunity genes. J Immunol.
181:1315–1322.
Gazave E, Marques-Bonet T, Fernando O, Charlesworth B, Navarro A.
2007. Patterns and rates of intron divergence between humans and
chimpanzees. Genome Biol. 8:R21.
Gearing M, Rebeck GW, Hyman BT, Tigges J, Mirra SS. 1994.
Neuropathology and apolipoprotein E profile of aged chimpanzees:
implications for Alzheimer disease. Proc Natl Acad Sci U S A. 91:9382–
9386.
Gearing M, Tigges J, Mori H, Mirra SS. 1997. Beta-amyloid (A beta)
deposition in the brains of aged orangutans. Neurobiol Aging.
18:139–146.
Halligan DL, et al. 2013. Contributions of protein-coding and regulatory
change to adaptive molecular evolution in murid rodents. PLoS Genet.
9:e1003995.
Hamilton BA. 2004. Alpha-synuclein A53T substitution associated with
Parkinson disease also marks the divergence of Old World and New
World primates. Genomics 83:739–742.
Haygood R, Fedrigo O, Hanson B, Yokoyama KD, Wray GA. 2007.
Promoter regions of many neural- and nutrition-related genes have
experienced positive selection during human evolution. Nat Genet.
39:1140–1144.
Holzer M, Craxton M, Jakes R, Arendt T, Goedert M. 2004. Tau gene
(MAPT) sequence variation among primates. Gene 341:313–322.
Hvilsom C, et al. 2011. Extensive X-linked adaptive evolution in central
chimpanzees. Proc Natl Acad Sci U S A. 109:2054–2059.
Jensen JD, Bachtrog D. 2011. Characterizing the influence of effective
population size on the rate of adaptation: Gillespie’s Darwin
domain. Genome Biol Evol. 3:687–701.
Kanehisa M, Goto S, Kawashima S, Okuno Y, Hattori M. 2004. The KEGG
resource for deciphering the genome. Nucleic Acids Res. 32:D277–
D280.
Keightley PD, Eyre-Walker A. 2007. Joint inference of the distribution
of fitness effects of deleterious mutations and population demogra-
phy based on nucleotide polymorphism frequencies. Genetics
177:2251–2261.
Keightley PD, Lercher MJ, Eyre-Walker A. 2005. Evidence for widespread
degradation of gene control regions in hominid genomes. PLoS Biol.
3:e42.
Kimura N, et al. 2001. Senile plaques in an aged western lowland gorilla.
Exp Anim. 50:77–81.
Kosiol C, et al. 2008. Patterns of positive selection in six mammalian
genomes. PLoS Genet. 4:e1000144.
Kousathanas A, Oliver F, Halligan DL, Keightley PD. 2011. Positive
and negative selection on noncoding DNA close to protein-
coding genes in wild house mice. Mol Biol Evol. 28:1183–1191.
Lanfear R, Kokko H, Eyre-Walker A. 2014. Population size and the rate of
evolution. Trends Ecol Evol. 29:33–41.
Lawrie DS, Messer PW, Hershberg R, Petrov DA. 2013. Strong purifying
selection at synonymous sites in D. melanogaster. PLoS Genet.
9:e1003527.
Lee SH, Dominguez R. 2010. Regulation of actin cytoskeleton dynamics in
cells. Mol Cells. 29:311–325.
Mackay TF, et al. 2012. The Drosophila melanogaster Genetic Reference
Panel. Nature 482:173–178.
McDonald JH, Kreitman M. 1991. Adaptive protein evolution at the Adh
locus in Drosophila. Nature 351:652–654.
Pond SL, Frost SD, Muse SV. 2005. HyPhy: hypothesis testing using phy-
logenies. Bioinformatics 21:676–679.
Prado-Martinez J, et al. 2013. Great ape genetic diversity and population
history. Nature 499:471–475.
Rosen RF, et al. 2008. Tauopathy with paired helical filaments in an aged
chimpanzee. J Comp Neurol. 509:259–270.
Santpere et al. GBE
1504 Genome Biol. Evol. 7(6):1490–1505. doi:10.1093/gbe/evv082 Advance Access publication May 14, 2015
by guest on July 18, 2015http://gbe.oxfordjournals.org/
Dow
nloaded from

Serra F, Arbiza L, Dopazo J, Dopazo H. 2011. Natural selection on func-
tional modules, a genome-wide analysis. PLoS Comput Biol.
7:e1001093.
Sherwood CC, et al. 2011. Aging of the cerebral cortex differs between
humans and chimpanzees. Proc Natl Acad Sci U S A. 108:13029–
13034.
Smith NG, Eyre-Walker A. 2002. Adaptive protein evolution in Drosophila.
Nature 415:1022–1024.
Welch JJ. 2006. Estimating the genomewide rate of adaptive protein evo-
lution in Drosophila. Genetics 173:821–837.
Associate editor: Naruya Saitou
Analysis of Five Gene Sets in Chimpanzee GBE
Genome Biol. Evol. 7(6):1490–1505. doi:10.1093/gbe/evv082 Advance Access publication May 14, 2015 1505
by guest on July 18, 2015http://gbe.oxfordjournals.org/
Dow
nloaded from