Embed Size (px)
Citation preview
You have learnt about the financial statements(Income Statement and Balance Sheet) of
companies. Basically, these are summarisedfinancial reports which provide the operating resultsand financial position of companies, and the detailedinformation contained therein is useful for assessingthe operational efficiency and financial soundnessof a company. This requires proper analysis andinterpretation of such information for which anumber of techniques (tools) have been developedby financial experts. In this chapter we will have anoverview of these techniques.
4.1 Meaning of Analysis of Financial Statements
The process of critical evaluation of the financialinformation contained in the financial statements inorder to understand and make decisions regardingthe operations of the firm is called ‘FinancialStatement Analysis’. It is basically a study ofrelationship among various financial facts andfigures as given in a set of financial statements, andthe interpretation thereof to gain an insight into theprofitability and operational efficiency of the firm toassess its financial health and future prospects.
The term ‘financial analysis’ includes both‘analysis and interpretation’. The term analysismeans simplification of financial data by methodicalclassification given in the financial statements.Interpretation means explaining the meaning andsignificance of the data. These two arecomplimentary to each other. Analysis is useless
LEARNING OBJECTIVES
After studying this chapter,you will be able to :
• explain the nature andsignificance of financialanalysis;
• identify the objectives offinancial analysis;
• describe the various toolsof financial analysis;
• state the limitations offinancial analysis;
• prepare comparative andcommonsize statementsand interpret the datagiven therein; and
• calculate the trendpercentages and interpretthem.
Analysis of Financial Statements 4
without interpretation, and interpretation without analysis is difficult or evenimpossible.
BoxFinancial statement analysis is very aptly defined by Bernstein as, “a judgementalprocess which aims to estimate current and past financial positions and theresults of the operation of an enterprise, with primary objective of determiningthe best possible estimates and predictions about the future conditions.” Itessentially involves regrouping and analysis of information provided by financialstatements to establish relationships and throw light on the points of strengthsand weaknesses of a business enterprise, which can be useful in decision-makinginvolving comparison with other firms (cross sectional analysis) and with firms’own performance, over a time period (time series analysis).
4.2 Significance of Financial Analysis
Financial analysis is the process of identifying the financial strengths andweaknesses of the firm by properly establishing relationships between the variousitems of the balance sheet and the profit and loss account. Financial analysiscan be undertaken by management of the firm, or by parties outside the firm,viz. owners, trade creditors, lenders, investors, labour unions, analysts andothers. The nature of analysis will differ depending on the purpose of the analyst.A technique frequently used by an analyst need not necessarily serve the purposeof other analysts because of the difference in the interests of the analysts.Financial analysis is useful and significant to different users in the followingways:
(a) Finance manager: Financial analysis focusses on the facts andrelationships related to managerial performance, corporate efficiency,financial strengths and weaknesses and creditworthiness of the company.A finance manager must be well-equipped with the different tools ofanalysis to make rational decisions for the firm. The tools for analysishelp in studying accounting data so as to determine the continuity of theoperating policies, investment value of the business, credit ratings andtesting the efficiency of operations. The techniques are equally importantin the area of financial control, enabling the finance manager to makeconstant reviews of the actual financial operations of the firm to analysethe causes of major deviations, which may help in corrective actionwherever indicated.
(b) Top management: The importance of financial analysis is not limited tothe finance manager alone. Its scope of importance is quite broad whichincludes top management in general and the other functional managers.
201Analysis of Financial Statements
202 Accountancy : Company Accounts and Analysis of Financial Statements
Management of the firm would be interested in every aspect of the financialanalysis. It is their overall responsibility to see that the resources of thefirm are used most efficiently, and that the firm’s financial condition issound. Financial analysis helps the management in measuring thesuccess or otherwise of the company’s operations, appraising theindividual’s performance and evaluating the system of internal control.
(c) Trade creditors: A trade creditor, through an analysis of financialstatements, appraises not only the urgent ability of the company to meetits obligations, but also judges the probability of its continued ability tomeet all its financial obligations in future. Trade creditors are particularlyinterested in the firm’s ability to meet their claims over a very short periodof time. Their analysis will, therefore, confine to the evaluation of thefirm’s liquidity position.
(d) Lenders: Suppliers of long-term debt are concerned with the firm’s long-term solvency and survival. They analyse the firm’s profitability overtime,its ability to generate cash to be able to pay interest and repay the principaland the relationship between various sources of funds (capital structurerelationships). Long-term tenders do analyse the historical financialstatements. But they place more emphasis on the firm’s projected financialstatements to make analysis about its future solvency and profitability.
(e) Investors: Investors, who have invested their money in the firm’s shares,are interested about the firm’s earnings. As such, they concentrate onthe analysis of the firm’s present and future profitability. They are alsointerested in the firm’s capital structure to ascertain its influences onfirm’s earning and risk. They also evaluate the efficiency of themanagement and determine whether a change is needed or not. However,in some large companies, the shareholders’ interest is limited to decidewhether to buy, sell or hold the shares.
(f) Labour unions: Labour unions analyse the financial statements to assesswhether it can presently afford a wage increase and whether it can absorba wage increase through increased productivity or by raising the prices.
(g) Others: The economists, researchers, etc. analyse the financial statementsto study the present business and economic conditions. The governmentagencies need it for price regulations, taxation and other similar purposes.
4.3 Objectives of Financial Analysis
Analysis of financial statements reveals important facts concerning managerialperformance and the efficiency of the firm. Broadly speaking, the objectives ofthe analysis are to apprehend the information contained in financial statements
203Analysis of Financial Statements
with a view to know the weaknesses and strengths of the firm and to make aforecast about the future prospects of the firm thereby, enabling the analysts totake decisions regarding the operation of, and further investment in, the firm.To be more specific, the analysis is undertaken to serve the following purposes(objectives):
• to assess the current profitability and operational efficiency of the firmas a whole as well as its different departments so as to judge the financialhealth of the firm.
• to ascertain the relative importance of different components of thefinancial position of the firm.
• to identify the reasons for change in the profitability/financial positionof the firm.
• to judge the ability of the firm to repay its debt and assessing theshort-term as well as the long-term liquidity position of the firm.
Through the analysis of financial statements of various firms, an economist canjudge the extent of concentration of economic power and pitfalls in the financialpolicies pursued. The analysis also provides the basis for many governmentalactions relating to licensing, controls, fixing of prices, ceiling on profits, dividendfreeze, tax subsidy and other concessions to the corporate sector.
It also helps the management in self-appraisal and the shareholders (owners)and others to judge the performance of the management.
4.4 Tools of Financial Analysis
The most commonly used techniques of financial analysis are as follows:1. Comparative Statements: These are the statements showing the
profitability and financial position of a firm for different periods of time ina comparative form to give an idea about the position of two or more periods.It usually applies to the two important financial statements, namely,Balance Sheet and Income Statement prepared in a comparative form.The financial data will be comparative only when same accounting principlesare used in preparing these statements. If this is not the case, the deviationin the use of accounting principles should be mentioned as a footnote.Comparative figures indicate the trend and direction of financial positionand operating results. This analysis is also known as ‘horizontal analysis’.
2. Common Size Statements: These are the statements which indicate therelationship of different items of a financial statement with some commonitem by expressing each item as a percentage of the common item. Thepercentage thus calculated can be easily compared with the resultscorresponding percentages of the previous year or of some other firms, as
204 Accountancy : Company Accounts and Analysis of Financial Statements
the numbers are brought to common base. Such statements also allow ananalyst to compare the operating and financing characteristics of twocompanies of different sizes in the same industry. Thus, common-sizestatements are useful, both, in intra-firm comparisons over different yearsand also in making inter-firm comparisons for the same year or for severalyears. This analysis is also known as ‘Vertical analysis’.
3. Trend Analysis: It is a technique of studying the operational results andfinancial position over a series of years. Using the previous years’ data of abusiness enterprise, trend analysis can be done to observe the percentagechanges over time in the selected data. The trend percentage is thepercentage relationship, which each item of different years bear to thesame item in the base year. Trend analysis is important because, with itslong run view, it may point to basic changes in the nature of the business.By looking at a trend in a particular ratio, one may find whether the ratiois falling, rising or remaining relatively constant. From this observation, aproblem is detected or the sign of good management is found.
4. Ratio Analysis: It describes the significant relationship which existsbetween various items of a balance sheet and a profit and loss account ofa firm. As a technique of financial analysis, accounting ratios measure thecomparative significance of the individual items of the income and positionstatements. It is possible to assess the profitability, solvency and efficiencyof an enterprise through the technique of ratio analysis.
5. Cash Flow Analysis: It refers to the analysis of actual movement of cashinto and out of an organisation. The flow of cash into the business is calledas cash inflow or positive cash flow and the flow of cash out of the firm iscalled as cash outflow or a negative cash flow. The difference between theinflow and outflow of cash is the net cash flow. Cash flow statement isprepared to project the manner in which the cash has been received andhas been utilised during an accounting year as it shows the sources ofcash receipts and also the purposes for which payments are made. Thus,it summarises the causes for the changes in cash position of a businessenterprise between dates of two balance sheets.
In this chapter, we shall have a brief idea about the first three techniques,viz. comparative statements common size statements and trend analysis. Theratio analysis and cash flow analysis is covered in detail in chapters 5 and 6respectively.
205Analysis of Financial Statements
Test your Understanding – I
Fill in the blanks with appropriate word(s),
1. Analysis simply means—————data.
2. Interpretation means —————data.
3. Comparative analysis is also known as ———————— analysis.
4. Common size analysis is also known as ———————— analysis.
5. The analysis of actual movement of money inflow and outflow in anorganisation is called——————— analysis.
4.5 Comparative Statements
As stated earlier, these statements refer to the Profit and Loss Account andBalance Sheet prepared by providing columns for the figures for both the currentyear as well as for the previous year and for the changes during the year, both inabsolute and relative terms. As a result, it is possible to find out not only thebalances of account as on different dates and summaries of different operationalactivities of different periods, but also the extent of their increase or decreasebetween these dates. The figures in the comparative statements can be used foridentifying the direction of changes and also the trends in different indicators ofperformance of an organisation.
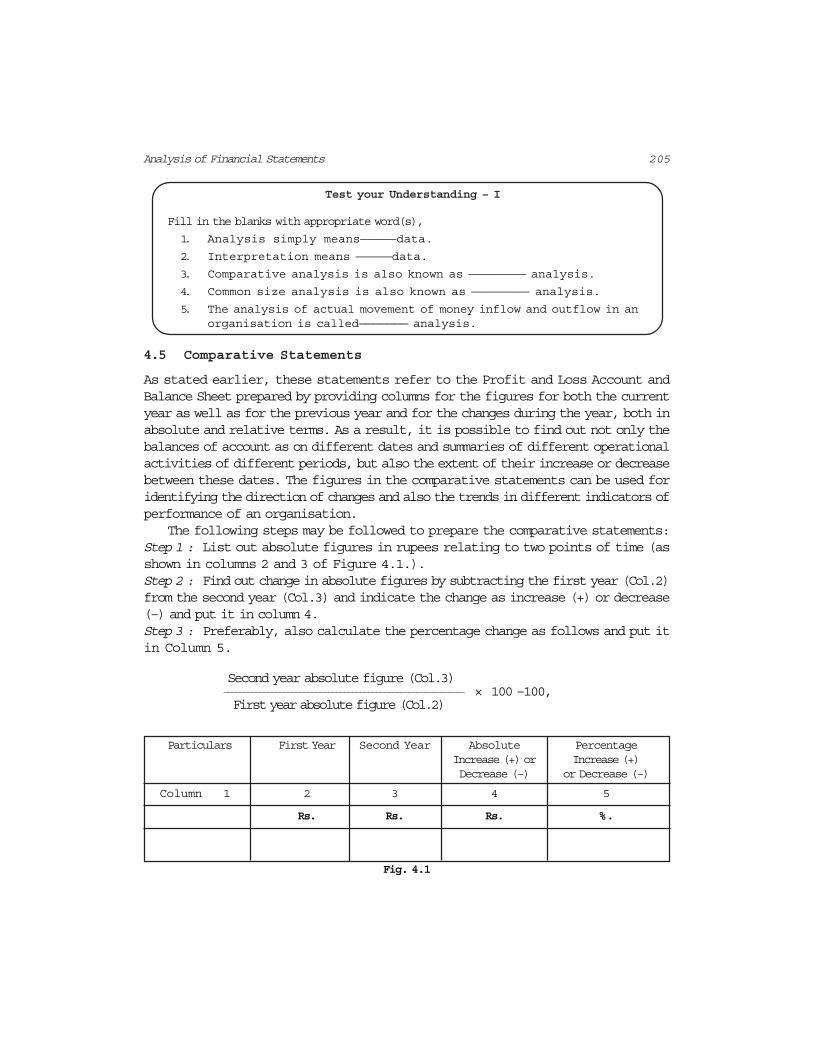
The following steps may be followed to prepare the comparative statements:Step 1 : List out absolute figures in rupees relating to two points of time (asshown in columns 2 and 3 of Figure 4.1.).Step 2 : Find out change in absolute figures by subtracting the first year (Col.2)from the second year (Col.3) and indicate the change as increase (+) or decrease(–) and put it in column 4.Step 3 : Preferably, also calculate the percentage change as follows and put itin Column 5.
Second year absolute figure (Col.3) ____________________________________________________________ × 100 –100, First year absolute figure (Col.2)
Particulars First Year Second Year Absolute PercentageIncrease (+) or Increase (+)Decrease (–) or Decrease (–)
Column 1 2 3 4 5
Rs. Rs. Rs. %.
Fig. 4.1
206 Accountancy : Company Accounts and Analysis of Financial Statements
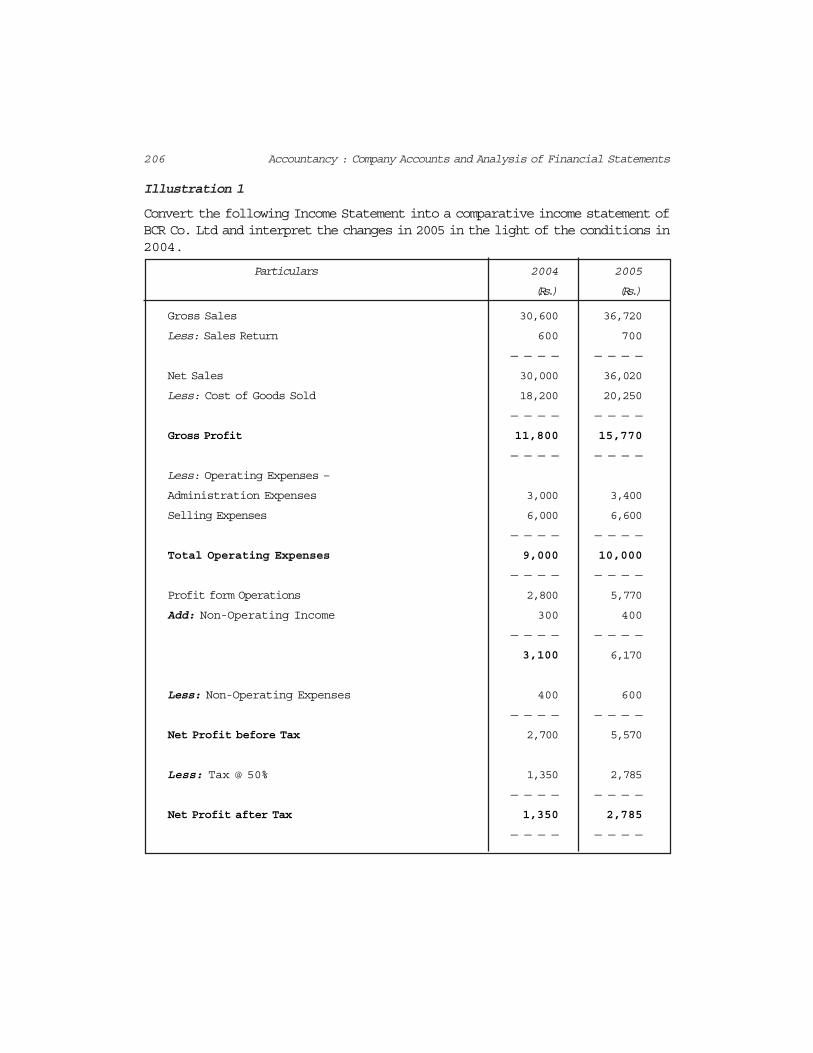
Illustration 1
Convert the following Income Statement into a comparative income statement ofBCR Co. Ltd and interpret the changes in 2005 in the light of the conditions in2004.
Particulars 2004 2005
(Rs.) (Rs.)
Gross Sales 30,600 36,720
Less: Sales Return 600 700
— — — — — — — —
Net Sales 30,000 36,020
Less: Cost of Goods Sold 18,200 20,250
— — — — — — — —
Gross Profit 11,800 15,770
— — — — — — — —
Less: Operating Expenses –
Administration Expenses 3,000 3,400
Selling Expenses 6,000 6,600
— — — — — — — —
Total Operating Expenses 9,000 10,000
— — — — — — — —
Profit form Operations 2,800 5,770
Add: Non-Operating Income 300 400
— — — — — — — —
3,100 6,170
Less: Non-Operating Expenses 400 600
— — — — — — — —
Net Profit before Tax 2,700 5,570
Less: Tax @ 50% 1,350 2,785
— — — — — — — —
Net Profit after Tax 1,350 2,785
— — — — — — — —
207Analysis of Financial Statements
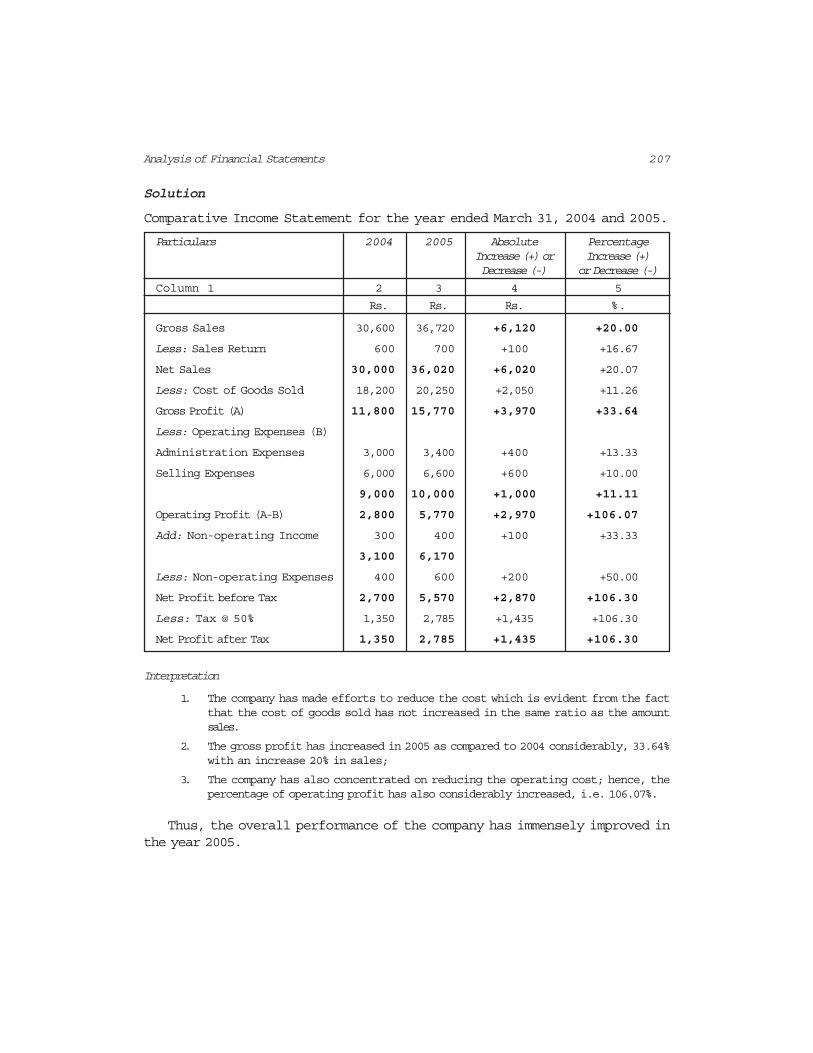
Solution
Comparative Income Statement for the year ended March 31, 2004 and 2005.
Particulars 2004 2005 Absolute PercentageIncrease (+) or Increase (+)Decrease (-) or Decrease (-)
Column 1 2 3 4 5
Rs. Rs. Rs. %.
Gross Sales 30,600 36,720 +6,120 +20.00
Less: Sales Return 600 700 +100 +16.67
Net Sales 30,000 36,020 +6,020 +20.07
Less: Cost of Goods Sold 18,200 20,250 +2,050 +11.26
Gross Profit (A) 11,800 15,770 +3,970 +33.64
Less: Operating Expenses (B)
Administration Expenses 3,000 3,400 +400 +13.33
Selling Expenses 6,000 6,600 +600 +10.00
9,000 10,000 +1,000 +11.11
Operating Profit (A-B) 2,800 5,770 +2,970 +106.07
Add: Non-operating Income 300 400 +100 +33.33
3,100 6,170
Less: Non-operating Expenses 400 600 +200 +50.00
Net Profit before Tax 2,700 5,570 +2,870 +106.30
Less: Tax @ 50% 1,350 2,785 +1,435 +106.30
Net Profit after Tax 1,350 2,785 +1,435 +106.30
Interpretation
1. The company has made efforts to reduce the cost which is evident from the factthat the cost of goods sold has not increased in the same ratio as the amountsales.
2. The gross profit has increased in 2005 as compared to 2004 considerably, 33.64%with an increase 20% in sales;
3. The company has also concentrated on reducing the operating cost; hence, thepercentage of operating profit has also considerably increased, i.e. 106.07%.
Thus, the overall performance of the company has immensely improved inthe year 2005.
208 Accountancy : Company Accounts and Analysis of Financial Statements
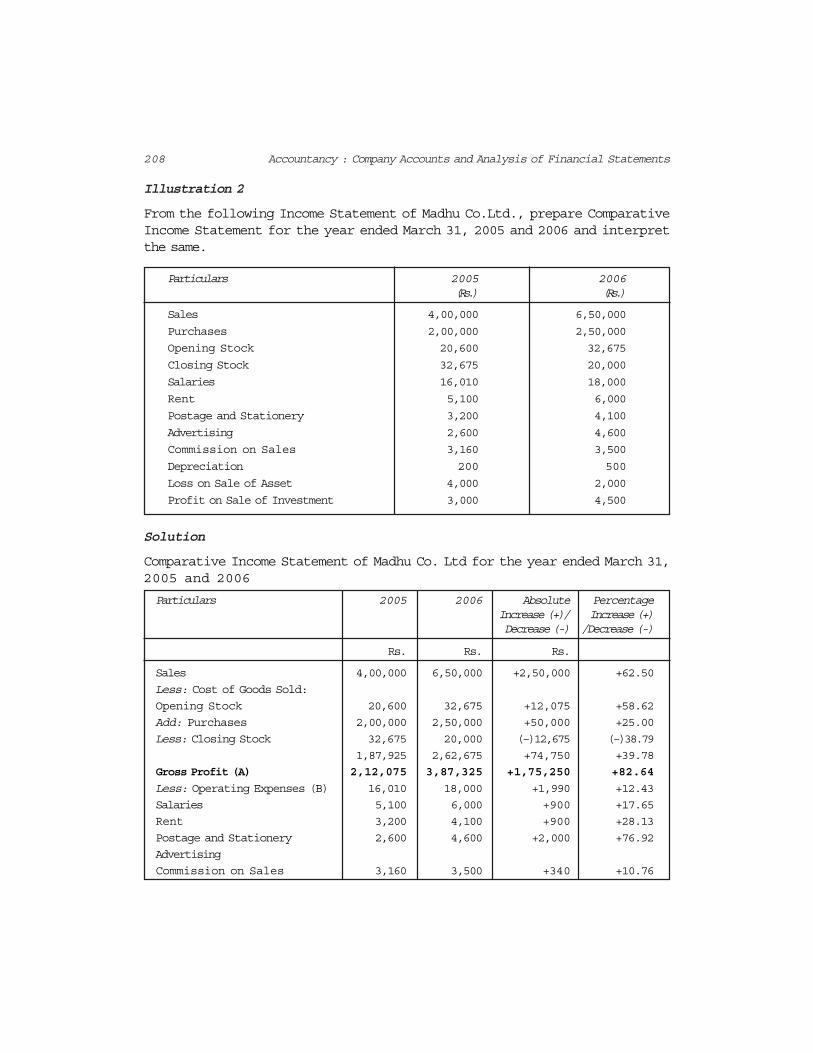
Illustration 2
From the following Income Statement of Madhu Co.Ltd., prepare ComparativeIncome Statement for the year ended March 31, 2005 and 2006 and interpretthe same.
Particulars 2005 2006(Rs.) (Rs.)
Sales 4,00,000 6,50,000
Purchases 2,00,000 2,50,000
Opening Stock 20,600 32,675
Closing Stock 32,675 20,000
Salaries 16,010 18,000
Rent 5,100 6,000
Postage and Stationery 3,200 4,100
Advertising 2,600 4,600
Commission on Sales 3,160 3,500
Depreciation 200 500
Loss on Sale of Asset 4,000 2,000
Profit on Sale of Investment 3,000 4,500
Solution
Comparative Income Statement of Madhu Co. Ltd for the year ended March 31,2005 and 2006
Particulars 2005 2006 Absolute PercentageIncrease (+)/ Increase (+)Decrease (-) /Decrease (-)
Rs. Rs. Rs.
Sales 4,00,000 6,50,000 +2,50,000 +62.50
Less: Cost of Goods Sold:
Opening Stock 20,600 32,675 +12,075 +58.62
Add: Purchases 2,00,000 2,50,000 +50,000 +25.00
Less: Closing Stock 32,675 20,000 (–)12,675 (–)38.79
1,87,925 2,62,675 +74,750 +39.78
Gross Profit (A) 2,12,075 3,87,325 +1,75,250 +82.64
Less: Operating Expenses (B) 16,010 18,000 +1,990 +12.43
Salaries 5,100 6,000 +900 +17.65
Rent 3,200 4,100 +900 +28.13
Postage and Stationery 2,600 4,600 +2,000 +76.92
Advertising
Commission on Sales 3,160 3,500 +340 +10.76
209Analysis of Financial Statements
Depreciation 200 500 +300 +150.00
30,270 36,700 +6,430 +21.24
Operating Profit
(A-B) 1,81,805 3,50,625 +1,68,820 +92.86
Add: Non-operating Income
Profit on Sale of Investment 3,000 4,500 +1,500 +50.00
1,84,805 3,55,125
Less: Non-operating Expenses
Loss on Sale of Assets 4,000 2,000 (–)2,000 (–)50.00
Net Profit 1,80,805 3,53,125 + 1,72,320 +95.31
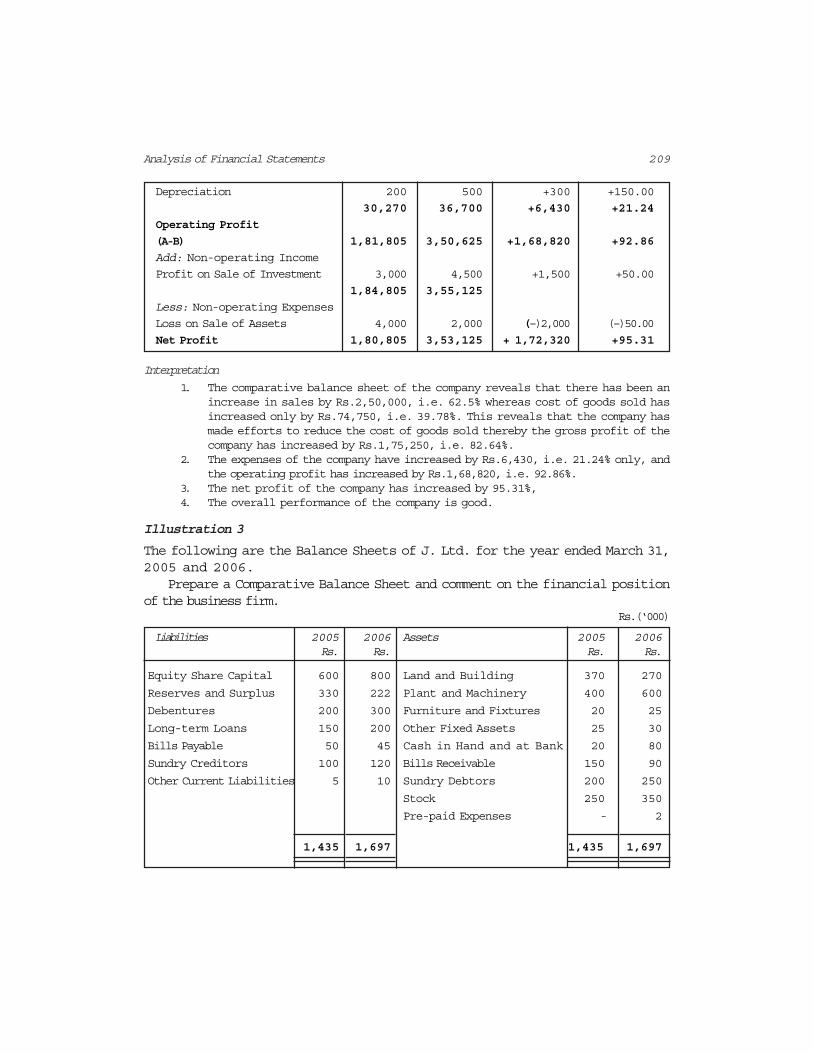
Interpretation
1. The comparative balance sheet of the company reveals that there has been anincrease in sales by Rs.2,50,000, i.e. 62.5% whereas cost of goods sold hasincreased only by Rs.74,750, i.e. 39.78%. This reveals that the company hasmade efforts to reduce the cost of goods sold thereby the gross profit of thecompany has increased by Rs.1,75,250, i.e. 82.64%.
2. The expenses of the company have increased by Rs.6,430, i.e. 21.24% only, andthe operating profit has increased by Rs.1,68,820, i.e. 92.86%.
3. The net profit of the company has increased by 95.31%,4. The overall performance of the company is good.
Illustration 3
The following are the Balance Sheets of J. Ltd. for the year ended March 31,2005 and 2006.
Prepare a Comparative Balance Sheet and comment on the financial positionof the business firm.
Rs.(‘000)
Liabilities 2005 2006 Assets 2005 2006Rs. Rs. Rs. Rs.
Equity Share Capital 600 800 Land and Building 370 270
Reserves and Surplus 330 222 Plant and Machinery 400 600
Debentures 200 300 Furniture and Fixtures 20 25
Long-term Loans 150 200 Other Fixed Assets 25 30
Bills Payable 50 45 Cash in Hand and at Bank 20 80
Sundry Creditors 100 120 Bills Receivable 150 90
Other Current Liabilities 5 10 Sundry Debtors 200 250
Stock 250 350
Pre-paid Expenses - 2
1,435 1,697 1,435 1,697
210 Accountancy : Company Accounts and Analysis of Financial Statements
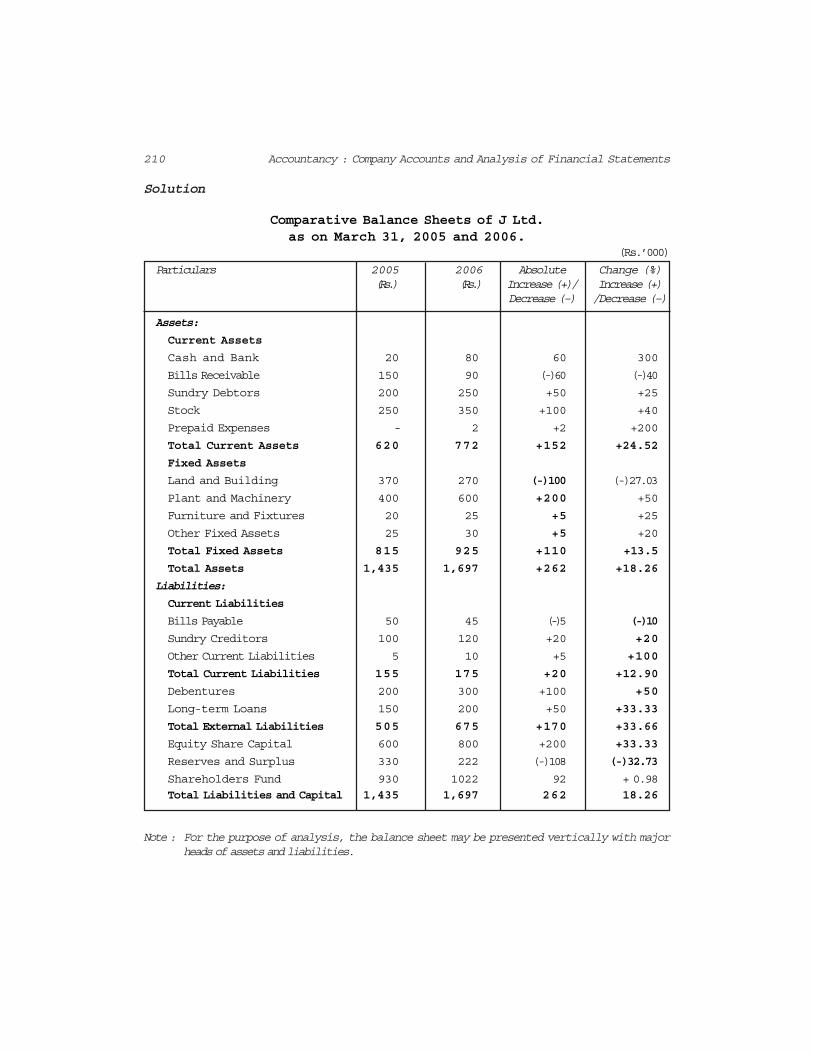
Solution
Comparative Balance Sheets of J Ltd.as on March 31, 2005 and 2006.
(Rs.’000)
Particulars 2005 2006 Absolute Change (%)(Rs.) (Rs.) Increase (+)/ Increase (+)
Decrease (–) /Decrease (–)
Assets:
Current Assets
Cash and Bank 20 80 60 300
Bills Receivable 150 90 (-)60 (-)40
Sundry Debtors 200 250 +50 +25
Stock 250 350 +100 +40
Prepaid Expenses - 2 +2 +200
Total Current Assets 620 772 +152 +24.52
Fixed Assets
Land and Building 370 270 (-)100 (-)27.03
Plant and Machinery 400 600 +200 +50
Furniture and Fixtures 20 25 +5 +25
Other Fixed Assets 25 30 +5 +20
Total Fixed Assets 815 925 +110 +13.5
Total Assets 1,435 1,697 +262 +18.26
Liabilities:
Current Liabilities
Bills Payable 50 45 (-)5 (-)10
Sundry Creditors 100 120 +20 +20
Other Current Liabilities 5 10 +5 +100
Total Current Liabilities 155 175 +20 +12.90
Debentures 200 300 +100 +50
Long-term Loans 150 200 +50 +33.33
Total External Liabilities 505 675 +170 +33.66
Equity Share Capital 600 800 +200 +33.33
Reserves and Surplus 330 222 (-)108 (-)32.73
Shareholders Fund 930 1022 92 + 0.98
Total Liabilities and Capital 1,435 1,697 262 18.26
Note : For the purpose of analysis, the balance sheet may be presented vertically with majorheads of assets and liabilities.
211Analysis of Financial Statements
Interpretation1. The comparative balance sheet of the company reveals that during the year
2006, there has been an increase in fixed assets by Rs.1,10,000, i.e. 13.5%while long-term liabilities have relatively increased by Rs.1,50,000 and equityshare capital has increased by Rs.2 lakhs. This fact depicts that the policy ofthe company is to purchase fixed assets from long-term source of finance, therebynot affecting the working capital.
2. The current assets have increased by Rs.1,52,000, i.e. 24.52%. The currentliabilities have increased only by Rs.20,000, i.e. 12.9%. This shows animprovement in the liquid position of the Company.
3. Shareholder’s funds (share capital plus reserves) have shown an increase of Rs.92,000.
4. The overall financial position of the company is satisfactory.
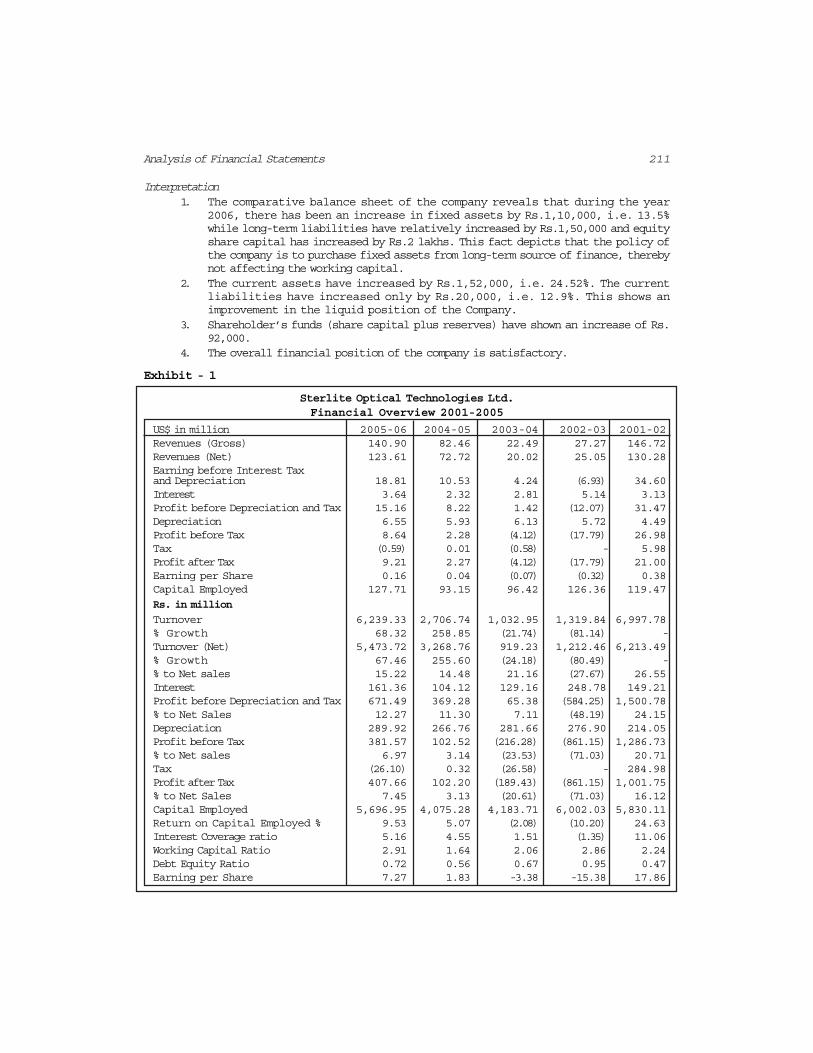
Exhibit - 1
Sterlite Optical Technologies Ltd.Financial Overview 2001-2005
US$ in million 2005-06 2004-05 2003-04 2002-03 2001-02Revenues (Gross) 140.90 82.46 22.49 27.27 146.72Revenues (Net) 123.61 72.72 20.02 25.05 130.28Earning before Interest Taxand Depreciation 18.81 10.53 4.24 (6.93) 34.60Interest 3.64 2.32 2.81 5.14 3.13Profit before Depreciation and Tax 15.16 8.22 1.42 (12.07) 31.47Depreciation 6.55 5.93 6.13 5.72 4.49Profit before Tax 8.64 2.28 (4.12) (17.79) 26.98Tax (0.59) 0.01 (0.58) - 5.98Profit after Tax 9.21 2.27 (4.12) (17.79) 21.00Earning per Share 0.16 0.04 (0.07) (0.32) 0.38Capital Employed 127.71 93.15 96.42 126.36 119.47
Rs. in million
Turnover 6,239.33 2,706.74 1,032.95 1,319.84 6,997.78% Growth 68.32 258.85 (21.74) (81.14) -Turnover (Net) 5,473.72 3,268.76 919.23 1,212.46 6,213.49% Growth 67.46 255.60 (24.18) (80.49) -% to Net sales 15.22 14.48 21.16 (27.67) 26.55Interest 161.36 104.12 129.16 248.78 149.21Profit before Depreciation and Tax 671.49 369.28 65.38 (584.25) 1,500.78% to Net Sales 12.27 11.30 7.11 (48.19) 24.15Depreciation 289.92 266.76 281.66 276.90 214.05Profit before Tax 381.57 102.52 (216.28) (861.15) 1,286.73% to Net sales 6.97 3.14 (23.53) (71.03) 20.71Tax (26.10) 0.32 (26.58) - 284.98Profit after Tax 407.66 102.20 (189.43) (861.15) 1,001.75% to Net Sales 7.45 3.13 (20.61) (71.03) 16.12Capital Employed 5,696.95 4,075.28 4,183.71 6,002.03 5,830.11Return on Capital Employed % 9.53 5.07 (2.08) (10.20) 24.63Interest Coverage ratio 5.16 4.55 1.51 (1.35) 11.06Working Capital Ratio 2.91 1.64 2.06 2.86 2.24Debt Equity Ratio 0.72 0.56 0.67 0.95 0.47Earning per Share 7.27 1.83 -3.38 -15.38 17.86
212 Accountancy : Company Accounts and Analysis of Financial Statements
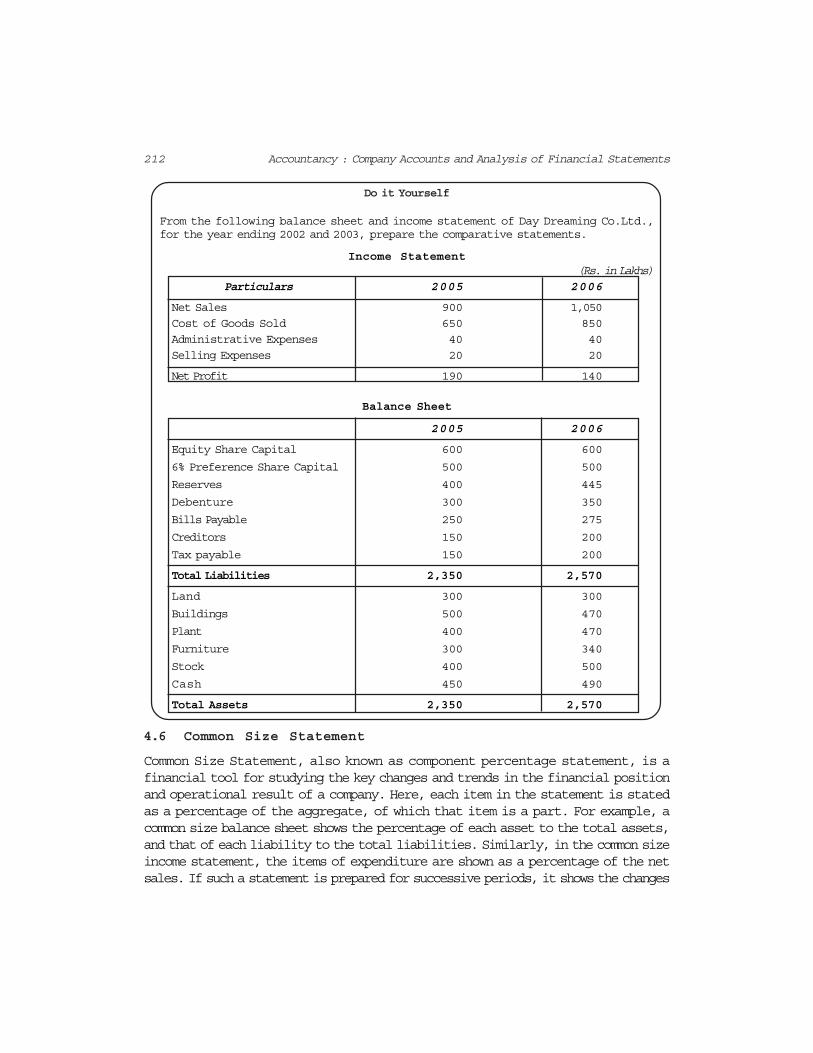
Do it Yourself
From the following balance sheet and income statement of Day Dreaming Co.Ltd.,for the year ending 2002 and 2003, prepare the comparative statements.
Income Statement(Rs. in Lakhs)
Particulars 2005 2006
Net Sales 900 1,050
Cost of Goods Sold 650 850
Administrative Expenses 40 40
Selling Expenses 20 20
Net Profit 190 140
Balance Sheet
2005 2006
Equity Share Capital 600 600
6% Preference Share Capital 500 500
Reserves 400 445
Debenture 300 350
Bills Payable 250 275
Creditors 150 200
Tax payable 150 200
Total Liabilities 2,350 2,570
Land 300 300
Buildings 500 470
Plant 400 470
Furniture 300 340
Stock 400 500
Cash 450 490
Total Assets 2,350 2,570
4.6 Common Size Statement
Common Size Statement, also known as component percentage statement, is afinancial tool for studying the key changes and trends in the financial positionand operational result of a company. Here, each item in the statement is statedas a percentage of the aggregate, of which that item is a part. For example, acommon size balance sheet shows the percentage of each asset to the total assets,and that of each liability to the total liabilities. Similarly, in the common sizeincome statement, the items of expenditure are shown as a percentage of the netsales. If such a statement is prepared for successive periods, it shows the changes
213Analysis of Financial Statements
of the respective percentages over time. [See the Five year Review of Asian paints(India) Ltd. Exhibit 2].
Common size analysis is of immense use for comparing enterprises whichdiffer substantially in size as it provides an insight into the structure of financialstatements. Inter-firm comparison or comparison of the company’s positionwith the related industry as a whole is possible with the help of common sizestatement analysis.
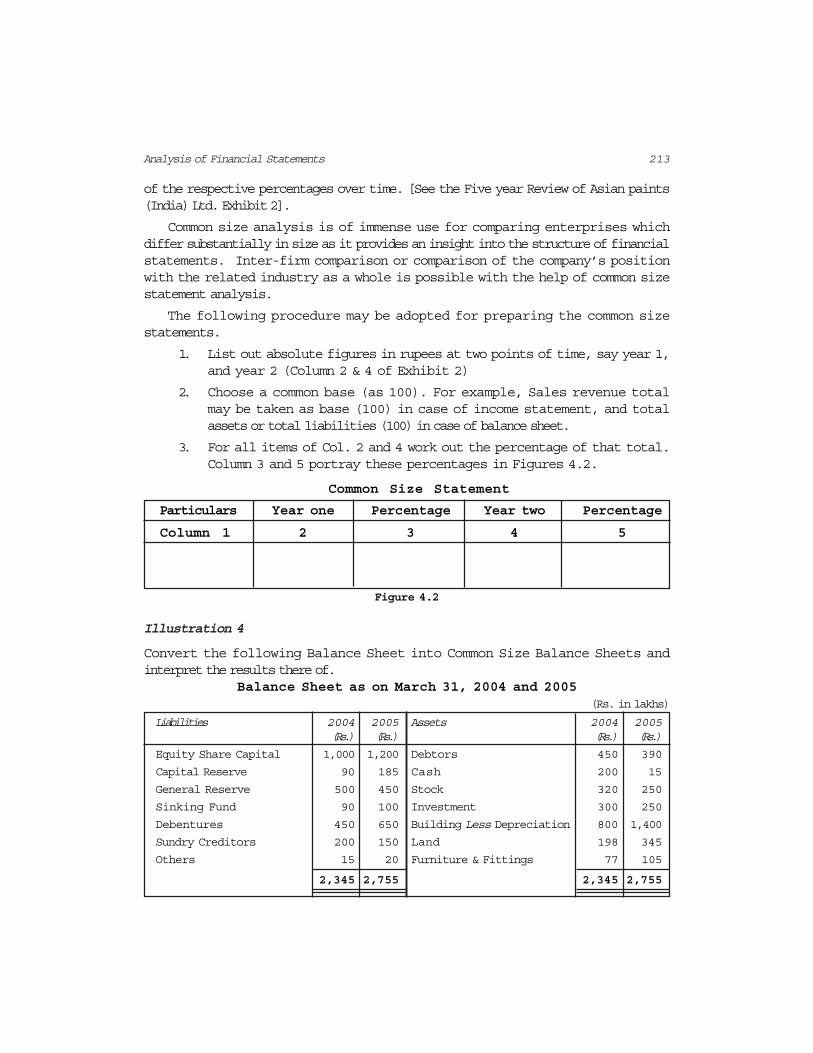
The following procedure may be adopted for preparing the common sizestatements.
1. List out absolute figures in rupees at two points of time, say year 1,and year 2 (Column 2 & 4 of Exhibit 2)
2. Choose a common base (as 100). For example, Sales revenue totalmay be taken as base (100) in case of income statement, and totalassets or total liabilities (100) in case of balance sheet.
3. For all items of Col. 2 and 4 work out the percentage of that total.Column 3 and 5 portray these percentages in Figures 4.2.
Common Size Statement
Particulars Year one Percentage Year two Percentage
Column 1 2 3 4 5
Figure 4.2
Illustration 4
Convert the following Balance Sheet into Common Size Balance Sheets andinterpret the results there of.
Balance Sheet as on March 31, 2004 and 2005(Rs. in lakhs)
Liabilities 2004 2005 Assets 2004 2005(Rs.) (Rs.) (Rs.) (Rs.)
Equity Share Capital 1,000 1,200 Debtors 450 390
Capital Reserve 90 185 Cash 200 15
General Reserve 500 450 Stock 320 250
Sinking Fund 90 100 Investment 300 250
Debentures 450 650 Building Less Depreciation 800 1,400
Sundry Creditors 200 150 Land 198 345
Others 15 20 Furniture & Fittings 77 105
2,345 2,755 2,345 2,755
214 Accountancy : Company Accounts and Analysis of Financial Statements
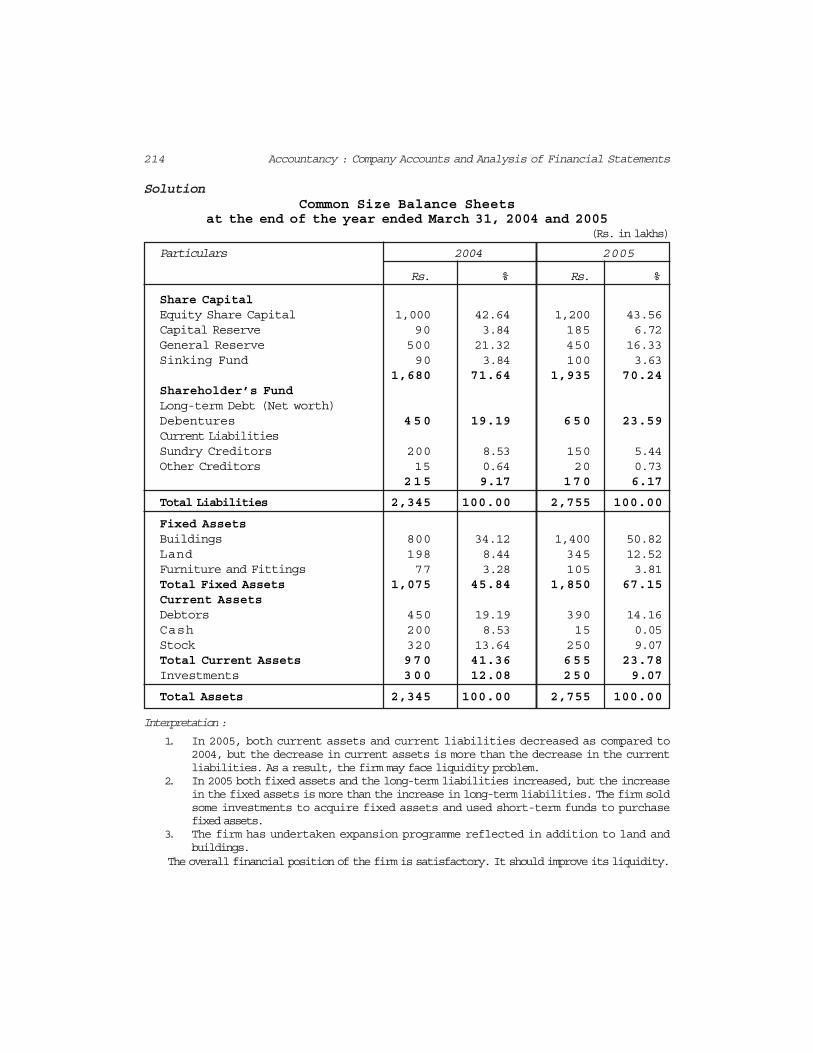
SolutionCommon Size Balance Sheets
at the end of the year ended March 31, 2004 and 2005(Rs. in lakhs)
Particulars 2004 2005
Rs. % Rs. %
Share CapitalEquity Share Capital 1,000 42.64 1,200 43.56Capital Reserve 90 3.84 185 6.72General Reserve 500 21.32 450 16.33Sinking Fund 90 3.84 100 3.63
1,680 71.64 1,935 70.24Shareholder’s FundLong-term Debt (Net worth)Debentures 450 19.19 650 23.59Current LiabilitiesSundry Creditors 200 8.53 150 5.44Other Creditors 15 0.64 20 0.73
215 9.17 170 6.17
Total Liabilities 2,345 100.00 2,755 100.00
Fixed AssetsBuildings 800 34.12 1,400 50.82Land 198 8.44 345 12.52Furniture and Fittings 77 3.28 105 3.81Total Fixed Assets 1,075 45.84 1,850 67.15Current AssetsDebtors 450 19.19 390 14.16Cash 200 8.53 15 0.05Stock 320 13.64 250 9.07Total Current Assets 970 41.36 655 23.78Investments 300 12.08 250 9.07
Total Assets 2,345 100.00 2,755 100.00
Interpretation :
1. In 2005, both current assets and current liabilities decreased as compared to2004, but the decrease in current assets is more than the decrease in the currentliabilities. As a result, the firm may face liquidity problem.
2. In 2005 both fixed assets and the long-term liabilities increased, but the increasein the fixed assets is more than the increase in long-term liabilities. The firm soldsome investments to acquire fixed assets and used short-term funds to purchasefixed assets.
3. The firm has undertaken expansion programme reflected in addition to land andbuildings.
The overall financial position of the firm is satisfactory. It should improve its liquidity.
215Analysis of Financial Statements
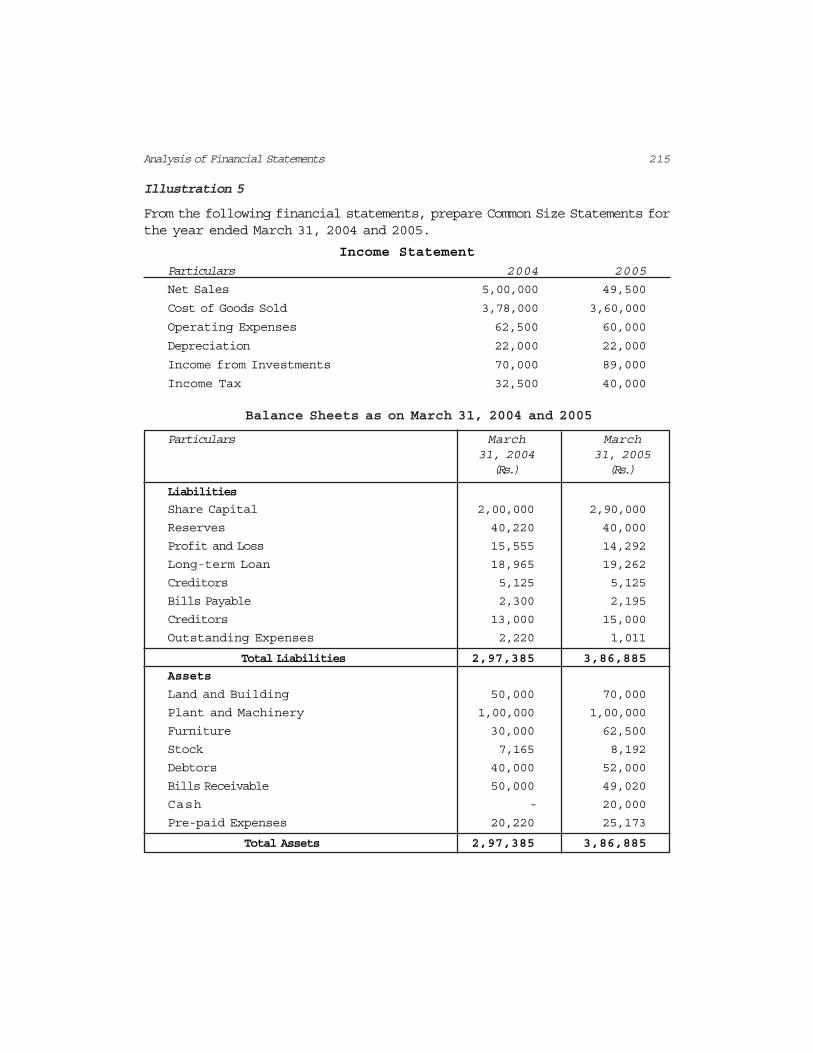
Illustration 5
From the following financial statements, prepare Common Size Statements forthe year ended March 31, 2004 and 2005.
Income Statement
Particulars 2004 2005
Net Sales 5,00,000 49,500
Cost of Goods Sold 3,78,000 3,60,000
Operating Expenses 62,500 60,000
Depreciation 22,000 22,000
Income from Investments 70,000 89,000
Income Tax 32,500 40,000
Balance Sheets as on March 31, 2004 and 2005
Particulars March March31, 2004 31, 2005(Rs.) (Rs.)
Liabilities
Share Capital 2,00,000 2,90,000
Reserves 40,220 40,000
Profit and Loss 15,555 14,292
Long-term Loan 18,965 19,262
Creditors 5,125 5,125
Bills Payable 2,300 2,195
Creditors 13,000 15,000
Outstanding Expenses 2,220 1,011
Total Liabilities 2,97,385 3,86,885
Assets
Land and Building 50,000 70,000
Plant and Machinery 1,00,000 1,00,000
Furniture 30,000 62,500
Stock 7,165 8,192
Debtors 40,000 52,000
Bills Receivable 50,000 49,020
Cash - 20,000
Pre-paid Expenses 20,220 25,173
Total Assets 2,97,385 3,86,885
216 Accountancy : Company Accounts and Analysis of Financial Statements
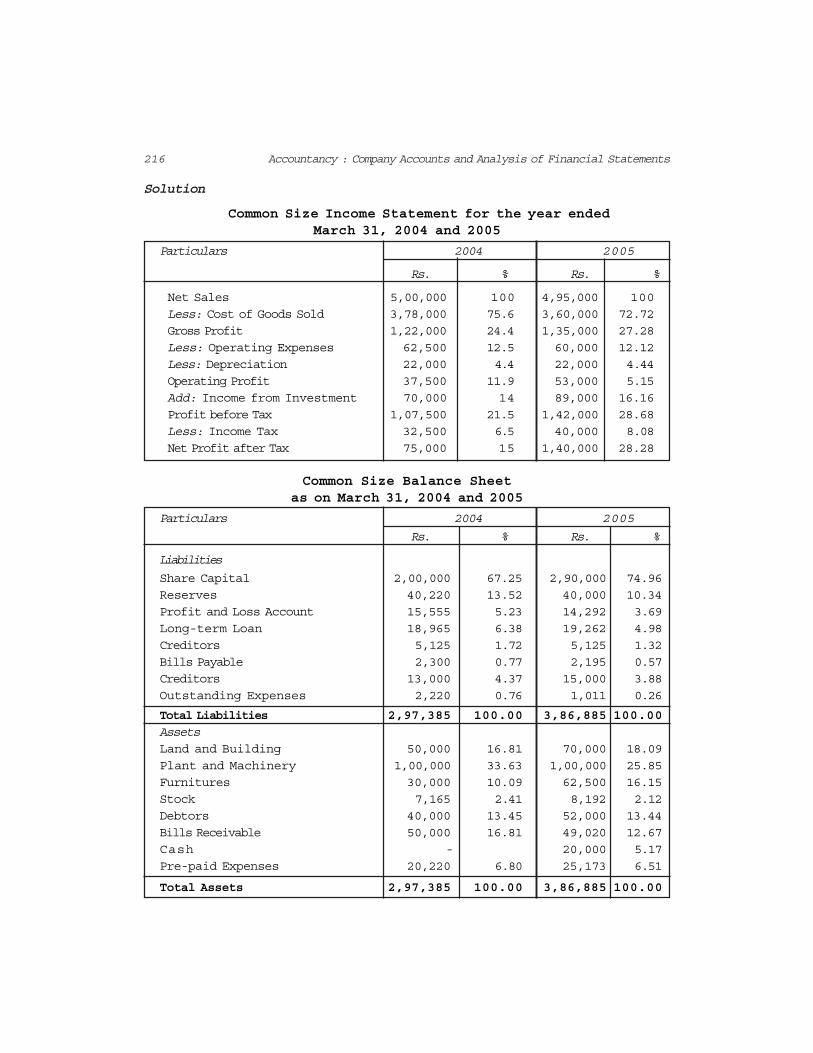
Solution
Common Size Income Statement for the year endedMarch 31, 2004 and 2005
Particulars 2004 2005
Rs. % Rs. %
Net Sales 5,00,000 100 4,95,000 100
Less: Cost of Goods Sold 3,78,000 75.6 3,60,000 72.72
Gross Profit 1,22,000 24.4 1,35,000 27.28
Less: Operating Expenses 62,500 12.5 60,000 12.12
Less: Depreciation 22,000 4.4 22,000 4.44
Operating Profit 37,500 11.9 53,000 5.15
Add: Income from Investment 70,000 14 89,000 16.16
Profit before Tax 1,07,500 21.5 1,42,000 28.68
Less: Income Tax 32,500 6.5 40,000 8.08
Net Profit after Tax 75,000 15 1,40,000 28.28
Common Size Balance Sheetas on March 31, 2004 and 2005
Particulars 2004 2005
Rs. % Rs. %
Liabilities
Share Capital 2,00,000 67.25 2,90,000 74.96
Reserves 40,220 13.52 40,000 10.34
Profit and Loss Account 15,555 5.23 14,292 3.69
Long-term Loan 18,965 6.38 19,262 4.98
Creditors 5,125 1.72 5,125 1.32
Bills Payable 2,300 0.77 2,195 0.57
Creditors 13,000 4.37 15,000 3.88
Outstanding Expenses 2,220 0.76 1,011 0.26
Total Liabilities 2,97,385 100.00 3,86,885 100.00
AssetsLand and Building 50,000 16.81 70,000 18.09
Plant and Machinery 1,00,000 33.63 1,00,000 25.85
Furnitures 30,000 10.09 62,500 16.15
Stock 7,165 2.41 8,192 2.12
Debtors 40,000 13.45 52,000 13.44
Bills Receivable 50,000 16.81 49,020 12.67
Cash - 20,000 5.17
Pre-paid Expenses 20,220 6.80 25,173 6.51
Total Assets 2,97,385 100.00 3,86,885 100.00
217Analysis of Financial Statements
Interpretation :
1. On comparison of the percentage of the cost of goods sold, it is observed thatthe company has tried to reduce its cost to improve its profit margin.
2. The profitability of the company has improved as compared to the previous yearas the profit after tax percentage has gone up by 13.28%.
3. The company has issued share capital in order to finance the purchase of fixedassets like furniture and land and buildings.
4. The company has improved its liquidity position as reflected in the increase ofits current assets.
Thus, there is an improvement in the working of the company.
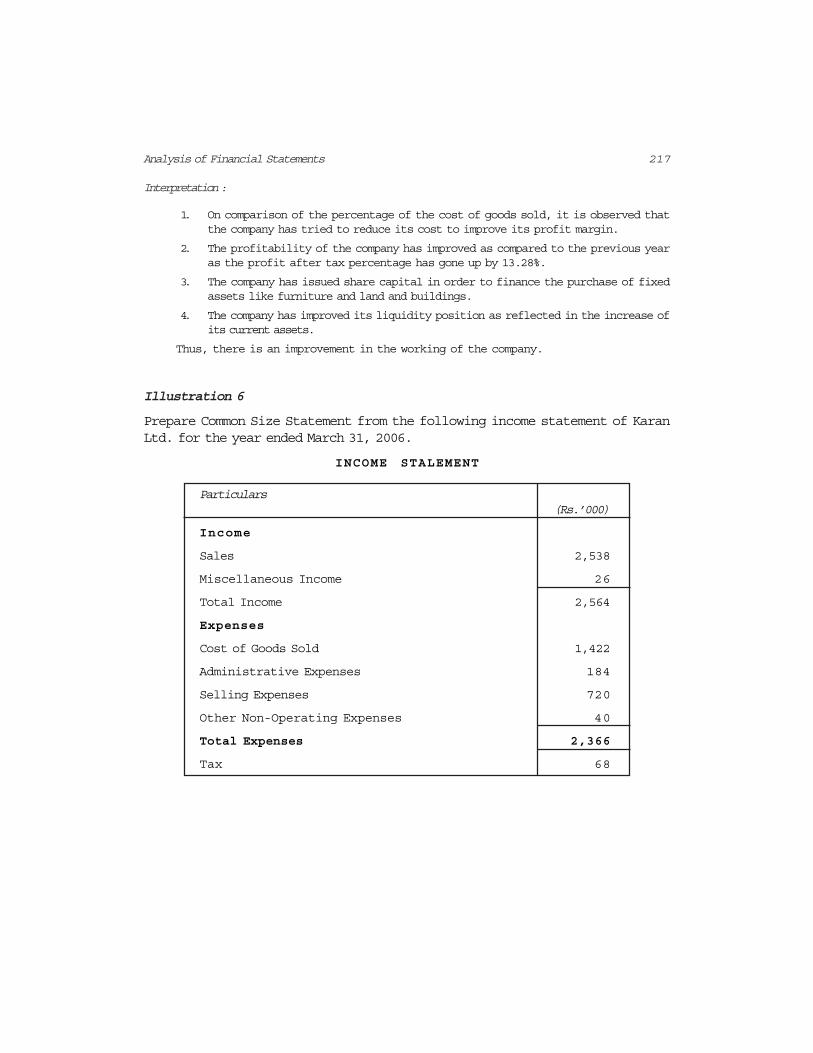
Illustration 6
Prepare Common Size Statement from the following income statement of KaranLtd. for the year ended March 31, 2006.
INCOME STALEMENT
Particulars(Rs.’000)
Income
Sales 2,538
Miscellaneous Income 26
Total Income 2,564
Expenses
Cost of Goods Sold 1,422
Administrative Expenses 184
Selling Expenses 720
Other Non-Operating Expenses 40
Total Expenses 2,366
Tax 68
218 Accountancy : Company Accounts and Analysis of Financial Statements
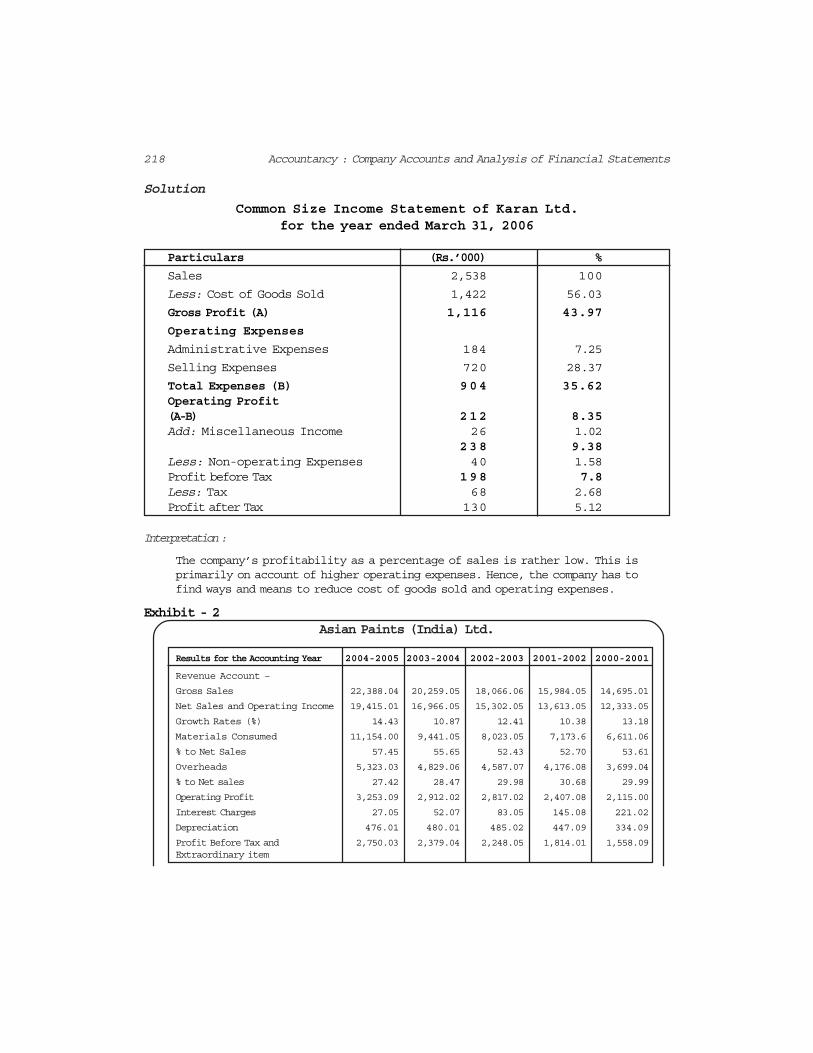
Solution
Common Size Income Statement of Karan Ltd.for the year ended March 31, 2006
Particulars (Rs.’000) %
Sales 2,538 100
Less: Cost of Goods Sold 1,422 56.03
Gross Profit (A) 1,116 43.97
Operating Expenses
Administrative Expenses 184 7.25
Selling Expenses 720 28.37
Total Expenses (B) 904 35.62Operating Profit(A-B) 212 8.35Add: Miscellaneous Income 26 1.02
238 9.38Less: Non-operating Expenses 40 1.58Profit before Tax 198 7.8Less: Tax 68 2.68Profit after Tax 130 5.12
Interpretation :
The company’s profitability as a percentage of sales is rather low. This isprimarily on account of higher operating expenses. Hence, the company has tofind ways and means to reduce cost of goods sold and operating expenses.
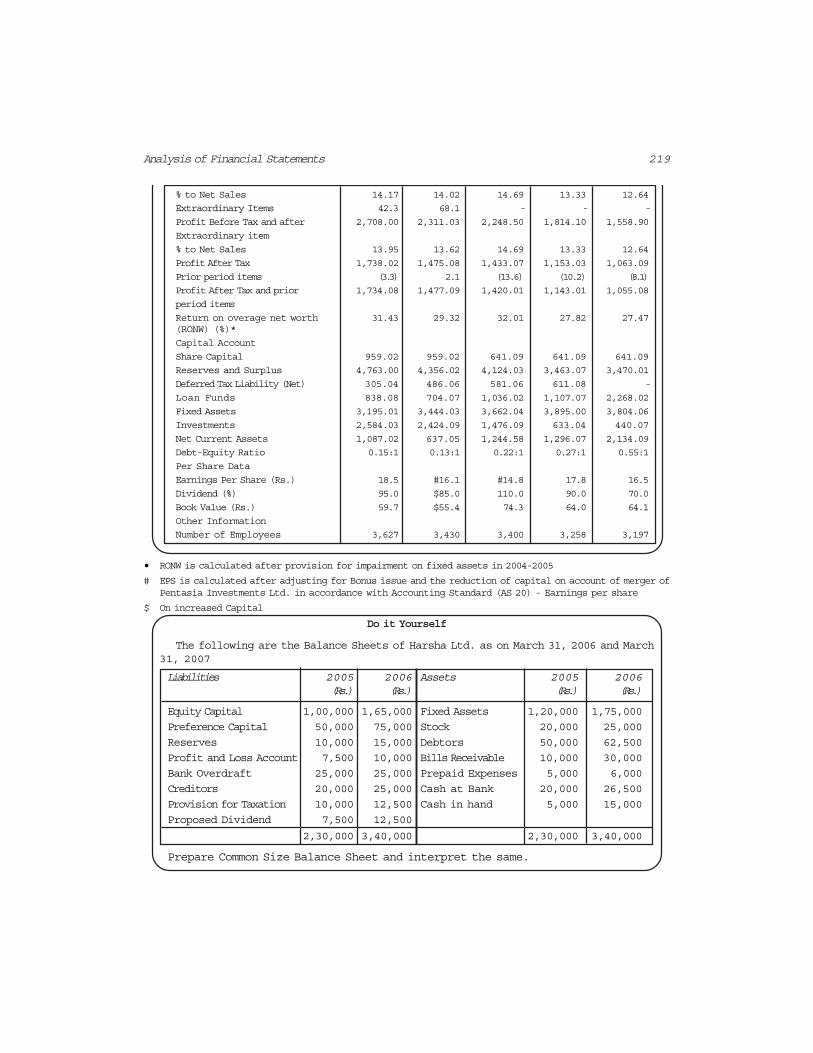
Exhibit - 2Asian Paints (India) Ltd.
Results for the Accounting Year 2004-2005 2003-2004 2002-2003 2001-2002 2000-2001
Revenue Account –
Gross Sales 22,388.04 20,259.05 18,066.06 15,984.05 14,695.01
Net Sales and Operating Income 19,415.01 16,966.05 15,302.05 13,613.05 12,333.05
Growth Rates (%) 14.43 10.87 12.41 10.38 13.18
Materials Consumed 11,154.00 9,441.05 8,023.05 7,173.6 6,611.06
% to Net Sales 57.45 55.65 52.43 52.70 53.61
Overheads 5,323.03 4,829.06 4,587.07 4,176.08 3,699.04
% to Net sales 27.42 28.47 29.98 30.68 29.99
Operating Profit 3,253.09 2,912.02 2,817.02 2,407.08 2,115.00
Interest Charges 27.05 52.07 83.05 145.08 221.02
Depreciation 476.01 480.01 485.02 447.09 334.09
Profit Before Tax and 2,750.03 2,379.04 2,248.05 1,814.01 1,558.09Extraordinary item
219Analysis of Financial Statements
% to Net Sales 14.17 14.02 14.69 13.33 12.64
Extraordinary Items 42.3 68.1 - - -
Profit Before Tax and after 2,708.00 2,311.03 2,248.50 1,814.10 1,558.90
Extraordinary item
% to Net Sales 13.95 13.62 14.69 13.33 12.64
Profit After Tax 1,738.02 1,475.08 1,433.07 1,153.03 1,063.09
Prior period items (3.3) 2.1 (13.6) (10.2) (8.1)
Profit After Tax and prior 1,734.08 1,477.09 1,420.01 1,143.01 1,055.08
period items
Return on overage net worth 31.43 29.32 32.01 27.82 27.47(RONW) (%)*
Capital Account
Share Capital 959.02 959.02 641.09 641.09 641.09
Reserves and Surplus 4,763.00 4,356.02 4,124.03 3,463.07 3,470.01
Deferred Tax Liability (Net) 305.04 486.06 581.06 611.08 -
Loan Funds 838.08 704.07 1,036.02 1,107.07 2,268.02
Fixed Assets 3,195.01 3,444.03 3,662.04 3,895.00 3,804.06
Investments 2,584.03 2,424.09 1,476.09 633.04 440.07
Net Current Assets 1,087.02 637.05 1,244.58 1,296.07 2,134.09
Debt-Equity Ratio 0.15:1 0.13:1 0.22:1 0.27:1 0.55:1
Per Share Data
Earnings Per Share (Rs.) 18.5 #16.1 #14.8 17.8 16.5
Dividend (%) 95.0 $85.0 110.0 90.0 70.0
Book Value (Rs.) 59.7 $55.4 74.3 64.0 64.1
Other Information
Number of Employees 3,627 3,430 3,400 3,258 3,197
• RONW is calculated after provision for impairment on fixed assets in 2004-2005
# EPS is calculated after adjusting for Bonus issue and the reduction of capital on account of merger ofPentasia Investments Ltd. in accordance with Accounting Standard (AS 20) - Earnings per share
$ On increased Capital
Do it Yourself
The following are the Balance Sheets of Harsha Ltd. as on March 31, 2006 and March31, 2007
Liabilities 2005 2006 Assets 2005 2006(Rs.) (Rs.) (Rs.) (Rs.)
Equity Capital 1,00,000 1,65,000 Fixed Assets 1,20,000 1,75,000
Preference Capital 50,000 75,000 Stock 20,000 25,000
Reserves 10,000 15,000 Debtors 50,000 62,500
Profit and Loss Account 7,500 10,000 Bills Receivable 10,000 30,000
Bank Overdraft 25,000 25,000 Prepaid Expenses 5,000 6,000
Creditors 20,000 25,000 Cash at Bank 20,000 26,500
Provision for Taxation 10,000 12,500 Cash in hand 5,000 15,000
Proposed Dividend 7,500 12,500
2,30,000 3,40,000 2,30,000 3,40,000
Prepare Common Size Balance Sheet and interpret the same.
220 Accountancy : Company Accounts and Analysis of Financial Statements
Test your Understanding – II
Choose the right answer :
1. The financial statements of a business enterprise include:(a) Balance sheet(b) Profit and loss account(c) Cash flow statement(d) All the above
2. The most commonly used tools for financial analysis are:(a) Horizontal analysis(b) Vertical analysis(c) Ratio analysis(d) All the above
3. An Annual Report is issued by a company to its:(a) Directors(b) Auditors(c) Shareholders(d) Management
4. Balance Sheet provides information about financial position of the enterprise:(a) At a point in time(b) Over a period of time(c) For a period of time(d) None of the above
5. Comparative statement are also known as:(a) Dynamic analysis(b) Horizontal analysis(c) Vertical analysis(d) External analysis
4.7 Trend Analysis
The financial statements may be analysed by computing trends of series ofinformation. Trend analysis determines the direction upwards or downwardsand involves the computation of the percentage relationship that each item bearsto the same item in the base year. In case of comparative statement, an item iscompared with itself in the previous year to know whether it has increased ordecreased or remained constant. Common size is observed to know whether theproportion of an item (say cost of goods sold) is increasing or decreasing in thecommon base (say sales). But in case of trend analysis, we learn about thebehaviour of the same item over a given period, say, during the last 5 years.Take for example, administrative expenses, whether they are exhibitingincreasing tendency or decreasing tendency or remaining constant over the periodof comparison, generally trend analysis is done for a reasonably long period.Many companies present their financial data for a period of 5 or 10 years invarious forms in their annual reports.
221Analysis of Financial Statements
4.7.1 Procedure for Calculating Trend Percentage
One year is taken as the base year. Generally, the first year is taken as the baseyear. The figure of base year is taken as 100. The trend percentages are calculatedin relation to this base year. If a figure in other year is less than the figure in baseyear, the trend percentage will be less than 100 and it will be more than 100 iffigure is more than the base year figure. Each year’s figure is divided by thebase year figure.
Present year valueTrend Percentage = ____________________________________ 100
Base year value
The accounting procedures and conventions used for collecting data andpreparation of financial statements should be similar; otherwise the figures willnot be comparable.
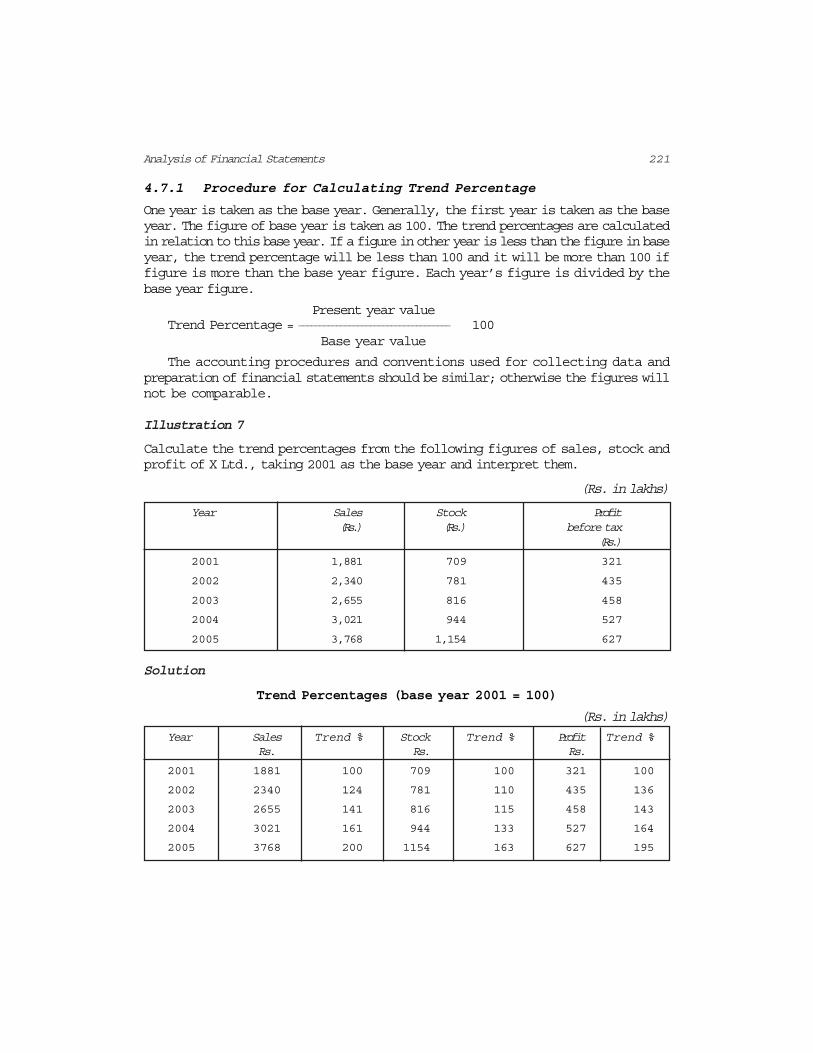
Illustration 7
Calculate the trend percentages from the following figures of sales, stock andprofit of X Ltd., taking 2001 as the base year and interpret them.
(Rs. in lakhs)
Year Sales Stock Profit(Rs.) (Rs.) before tax
(Rs.)
2001 1,881 709 321
2002 2,340 781 435
2003 2,655 816 458
2004 3,021 944 527
2005 3,768 1,154 627
Solution
Trend Percentages (base year 2001 = 100)
(Rs. in lakhs)
Year Sales Trend % Stock Trend % Profit Trend %Rs. Rs. Rs.
2001 1881 100 709 100 321 100
2002 2340 124 781 110 435 136
2003 2655 141 816 115 458 143
2004 3021 161 944 133 527 164
2005 3768 200 1154 163 627 195
222 Accountancy : Company Accounts and Analysis of Financial Statements
Interpretation :
1. The sales have continuously increased in all the years up to 2005, though indifferent proportions. The percentage in 2005 is 200 as compared to 100 in2001. The increase in sales is quite satisfactory.
2. The figures of stock have also increased over a period of five years. The increasein stock is more in 2004 and 2005 as compared to earlier years.
3. Profit has substantially increased. The profits have increased in greaterproportion than sales which implies that the company has been able to reducetheir cost of goods sold and control the operating expenses.
Do it Yourself
The following data is available from the P&L A/c of Deepak Ltd.
Particulars 2003 (Rs.) 2004 (Rs.) 2005 (Rs.) 2006 (Rs.)
Sales 3,10,000 3,27,500 3,20,000 3,32,500
Wages 1,07,500 1,07,500 1,15,000 1,20,000
Selling Expenses 27,250 29,000 29,750 27,750
Gross Profit 90,000 95,000 77,500 80,000
You are required to show Trend Percentages of different items.
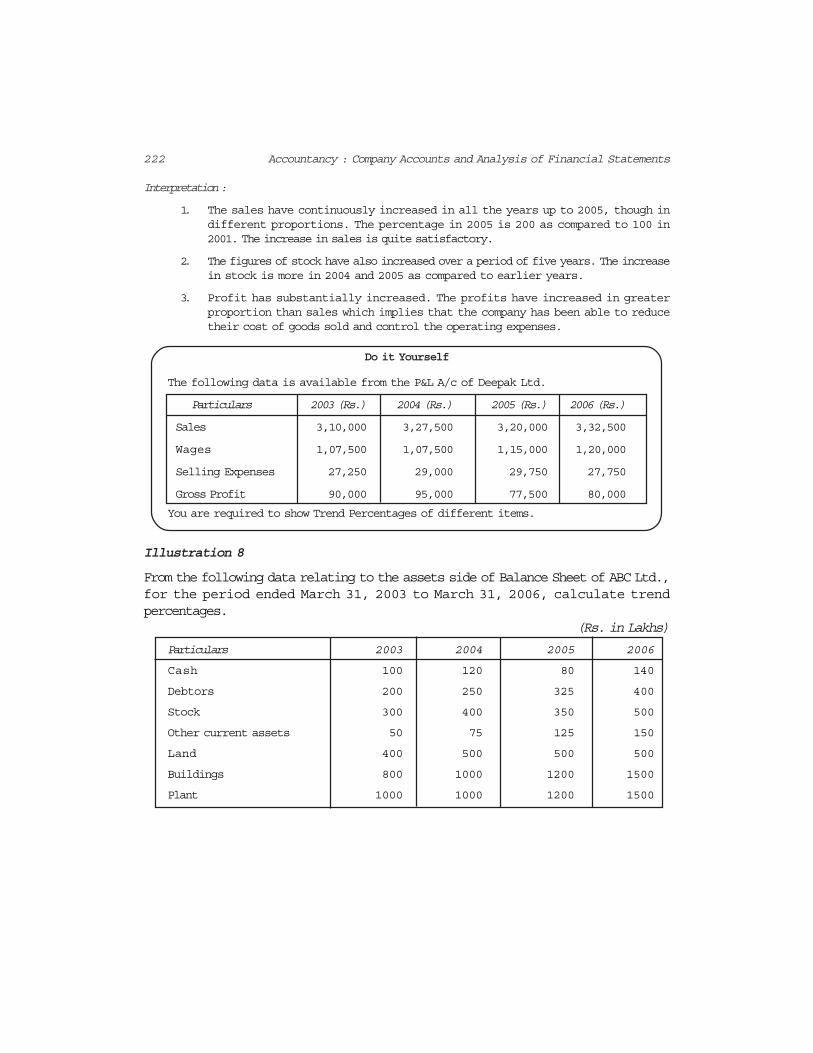
Illustration 8
From the following data relating to the assets side of Balance Sheet of ABC Ltd.,for the period ended March 31, 2003 to March 31, 2006, calculate trendpercentages.
(Rs. in Lakhs)
Particulars 2003 2004 2005 2006
Cash 100 120 80 140
Debtors 200 250 325 400
Stock 300 400 350 500
Other current assets 50 75 125 150
Land 400 500 500 500
Buildings 800 1000 1200 1500
Plant 1000 1000 1200 1500
223Analysis of Financial Statements
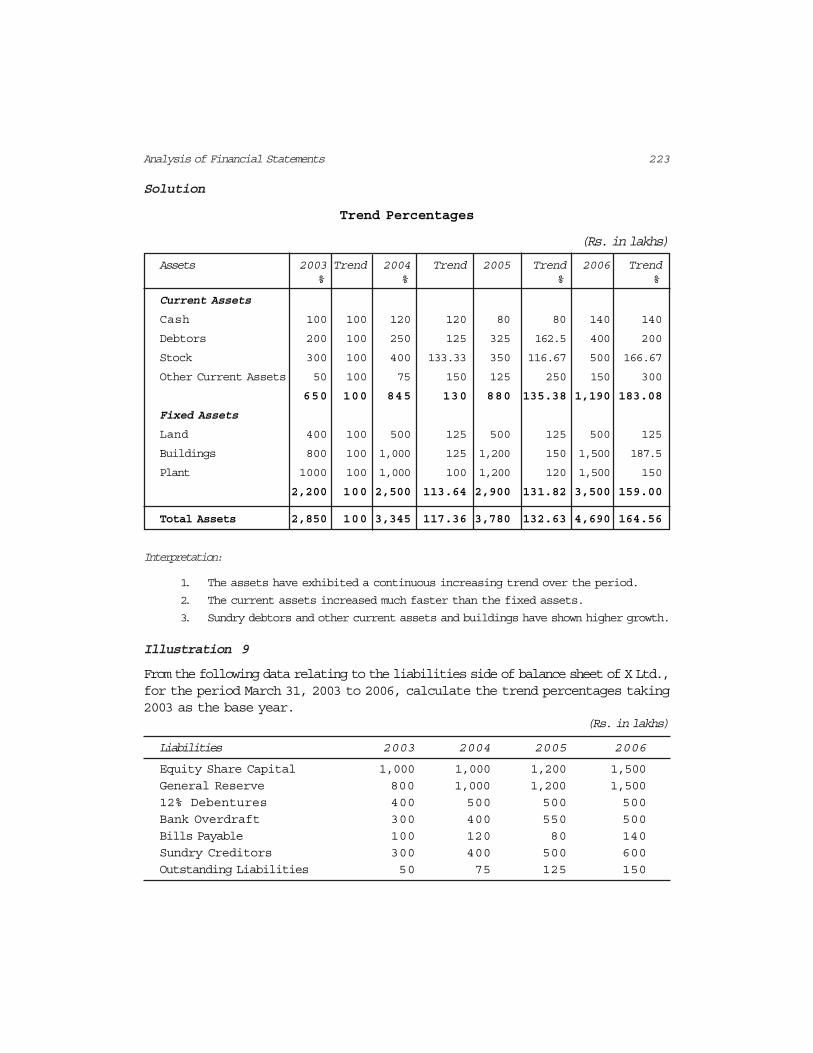
Solution
Trend Percentages
(Rs. in lakhs)
Assets 2003 Trend 2004 Trend 2005 Trend 2006 Trend% % % %
Current Assets
Cash 100 100 120 120 80 80 140 140
Debtors 200 100 250 125 325 162.5 400 200
Stock 300 100 400 133.33 350 116.67 500 166.67
Other Current Assets 50 100 75 150 125 250 150 300
650 100 845 130 880 135.38 1,190 183.08
Fixed Assets
Land 400 100 500 125 500 125 500 125
Buildings 800 100 1,000 125 1,200 150 1,500 187.5
Plant 1000 100 1,000 100 1,200 120 1,500 150
2,200 100 2,500 113.64 2,900 131.82 3,500 159.00
Total Assets 2,850 100 3,345 117.36 3,780 132.63 4,690 164.56
Interpretation:
1. The assets have exhibited a continuous increasing trend over the period.
2. The current assets increased much faster than the fixed assets.
3. Sundry debtors and other current assets and buildings have shown higher growth.
Illustration 9
From the following data relating to the liabilities side of balance sheet of X Ltd.,for the period March 31, 2003 to 2006, calculate the trend percentages taking2003 as the base year.
(Rs. in lakhs)
Liabilities 2003 2004 2005 2006
Equity Share Capital 1,000 1,000 1,200 1,500
General Reserve 800 1,000 1,200 1,500
12% Debentures 400 500 500 500
Bank Overdraft 300 400 550 500
Bills Payable 100 120 80 140
Sundry Creditors 300 400 500 600
Outstanding Liabilities 50 75 125 150
224 Accountancy : Company Accounts and Analysis of Financial Statements
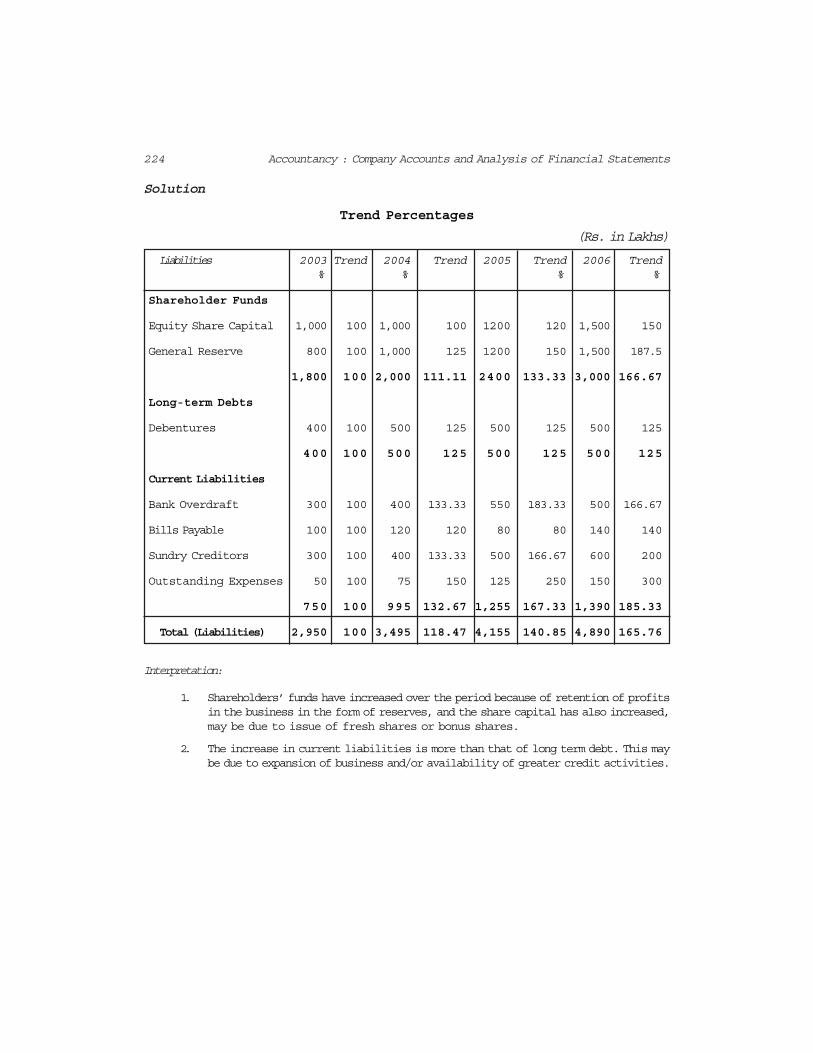
Solution
Trend Percentages
(Rs. in Lakhs)
Liabilities 2003 Trend 2004 Trend 2005 Trend 2006 Trend% % % %
Shareholder Funds
Equity Share Capital 1,000 100 1,000 100 1200 120 1,500 150
General Reserve 800 100 1,000 125 1200 150 1,500 187.5
1,800 100 2,000 111.11 2400 133.33 3,000 166.67
Long-term Debts
Debentures 400 100 500 125 500 125 500 125
400 100 500 125 500 125 500 125
Current Liabilities
Bank Overdraft 300 100 400 133.33 550 183.33 500 166.67
Bills Payable 100 100 120 120 80 80 140 140
Sundry Creditors 300 100 400 133.33 500 166.67 600 200
Outstanding Expenses 50 100 75 150 125 250 150 300
750 100 995 132.67 1,255 167.33 1,390 185.33
Total (Liabilities) 2,950 100 3,495 118.47 4,155 140.85 4,890 165.76
Interpretation:
1. Shareholders’ funds have increased over the period because of retention of profitsin the business in the form of reserves, and the share capital has also increased,may be due to issue of fresh shares or bonus shares.
2. The increase in current liabilities is more than that of long term debt. This maybe due to expansion of business and/or availability of greater credit activities.
225Analysis of Financial Statements
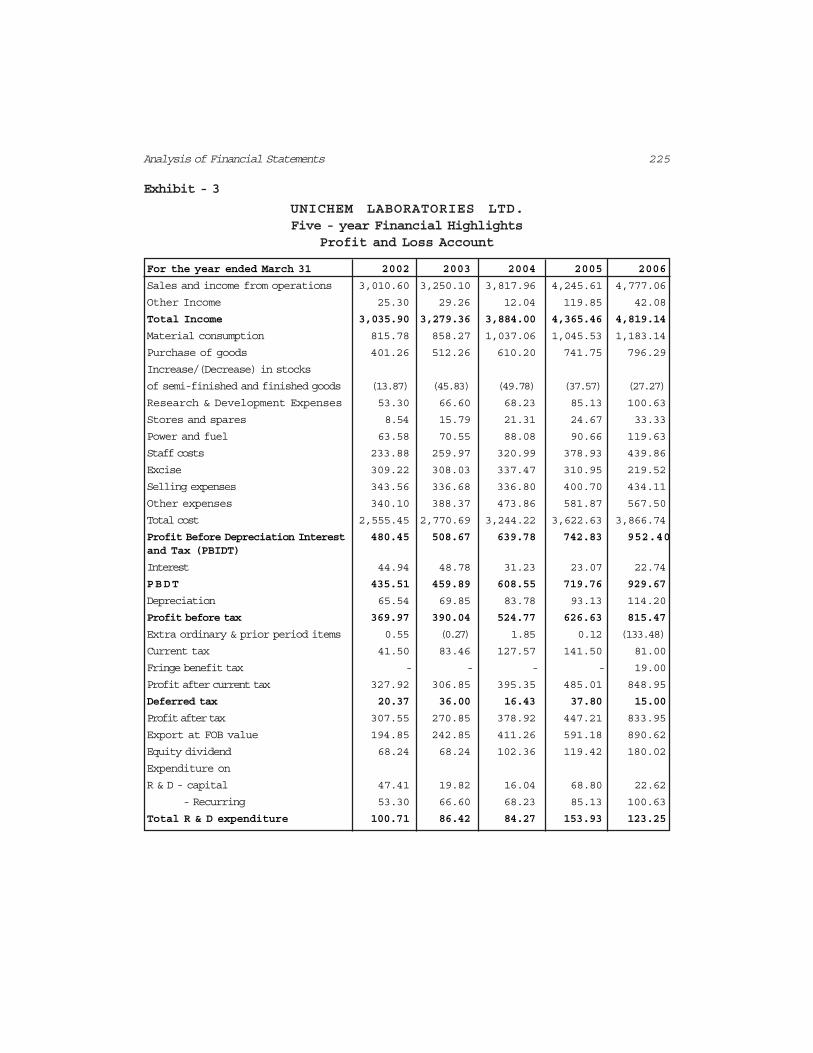
Exhibit - 3
UNICHEM LABORATORIES LTD.Five - year Financial Highlights
Profit and Loss Account
For the year ended March 31 2002 2003 2004 2005 2006
Sales and income from operations 3,010.60 3,250.10 3,817.96 4,245.61 4,777.06
Other Income 25.30 29.26 12.04 119.85 42.08
Total Income 3,035.90 3,279.36 3,884.00 4,365.46 4,819.14
Material consumption 815.78 858.27 1,037.06 1,045.53 1,183.14
Purchase of goods 401.26 512.26 610.20 741.75 796.29
Increase/(Decrease) in stocks
of semi-finished and finished goods (13.87) (45.83) (49.78) (37.57) (27.27)
Research & Development Expenses 53.30 66.60 68.23 85.13 100.63
Stores and spares 8.54 15.79 21.31 24.67 33.33
Power and fuel 63.58 70.55 88.08 90.66 119.63
Staff costs 233.88 259.97 320.99 378.93 439.86
Excise 309.22 308.03 337.47 310.95 219.52
Selling expenses 343.56 336.68 336.80 400.70 434.11
Other expenses 340.10 388.37 473.86 581.87 567.50
Total cost 2,555.45 2,770.69 3,244.22 3,622.63 3,866.74
Profit Before Depreciation Interest 480.45 508.67 639.78 742.83 952.40and Tax (PBIDT)
Interest 44.94 48.78 31.23 23.07 22.74
PBDT 435.51 459.89 608.55 719.76 929.67
Depreciation 65.54 69.85 83.78 93.13 114.20
Profit before tax 369.97 390.04 524.77 626.63 815.47
Extra ordinary & prior period items 0.55 (0.27) 1.85 0.12 (133.48)
Current tax 41.50 83.46 127.57 141.50 81.00
Fringe benefit tax - - - - 19.00
Profit after current tax 327.92 306.85 395.35 485.01 848.95
Deferred tax 20.37 36.00 16.43 37.80 15.00
Profit after tax 307.55 270.85 378.92 447.21 833.95
Export at FOB value 194.85 242.85 411.26 591.18 890.62
Equity dividend 68.24 68.24 102.36 119.42 180.02
Expenditure on
R & D - capital 47.41 19.82 16.04 68.80 22.62
- Recurring 53.30 66.60 68.23 85.13 100.63
Total R & D expenditure 100.71 86.42 84.27 153.93 123.25
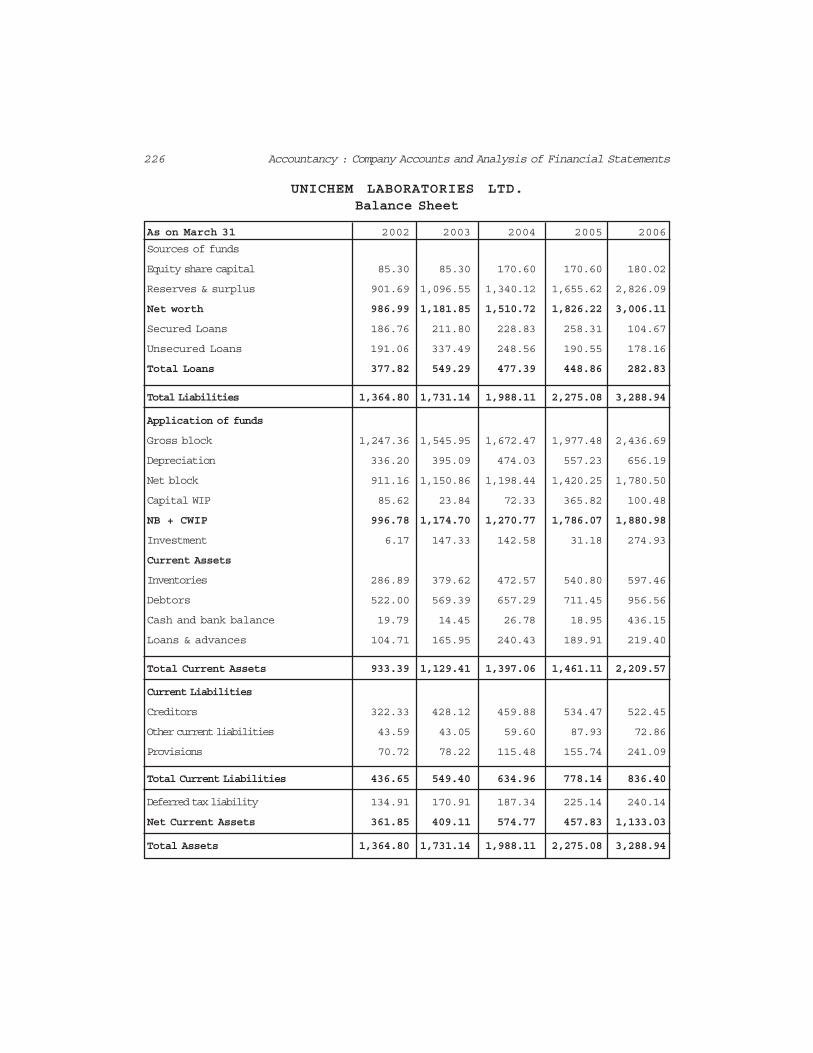
226 Accountancy : Company Accounts and Analysis of Financial Statements
UNICHEM LABORATORIES LTD.Balance Sheet
As on March 31 2002 2003 2004 2005 2006
Sources of funds
Equity share capital 85.30 85.30 170.60 170.60 180.02
Reserves & surplus 901.69 1,096.55 1,340.12 1,655.62 2,826.09
Net worth 986.99 1,181.85 1,510.72 1,826.22 3,006.11
Secured Loans 186.76 211.80 228.83 258.31 104.67
Unsecured Loans 191.06 337.49 248.56 190.55 178.16
Total Loans 377.82 549.29 477.39 448.86 282.83
Total Liabilities 1,364.80 1,731.14 1,988.11 2,275.08 3,288.94
Application of funds
Gross block 1,247.36 1,545.95 1,672.47 1,977.48 2,436.69
Depreciation 336.20 395.09 474.03 557.23 656.19
Net block 911.16 1,150.86 1,198.44 1,420.25 1,780.50
Capital WIP 85.62 23.84 72.33 365.82 100.48
NB + CWIP 996.78 1,174.70 1,270.77 1,786.07 1,880.98
Investment 6.17 147.33 142.58 31.18 274.93
Current Assets
Inventories 286.89 379.62 472.57 540.80 597.46
Debtors 522.00 569.39 657.29 711.45 956.56
Cash and bank balance 19.79 14.45 26.78 18.95 436.15
Loans & advances 104.71 165.95 240.43 189.91 219.40
Total Current Assets 933.39 1,129.41 1,397.06 1,461.11 2,209.57
Current Liabilities
Creditors 322.33 428.12 459.88 534.47 522.45
Other current liabilities 43.59 43.05 59.60 87.93 72.86
Provisions 70.72 78.22 115.48 155.74 241.09
Total Current Liabilities 436.65 549.40 634.96 778.14 836.40
Deferred tax liability 134.91 170.91 187.34 225.14 240.14
Net Current Assets 361.85 409.11 574.77 457.83 1,133.03
Total Assets 1,364.80 1,731.14 1,988.11 2,275.08 3,288.94
227Analysis of Financial Statements
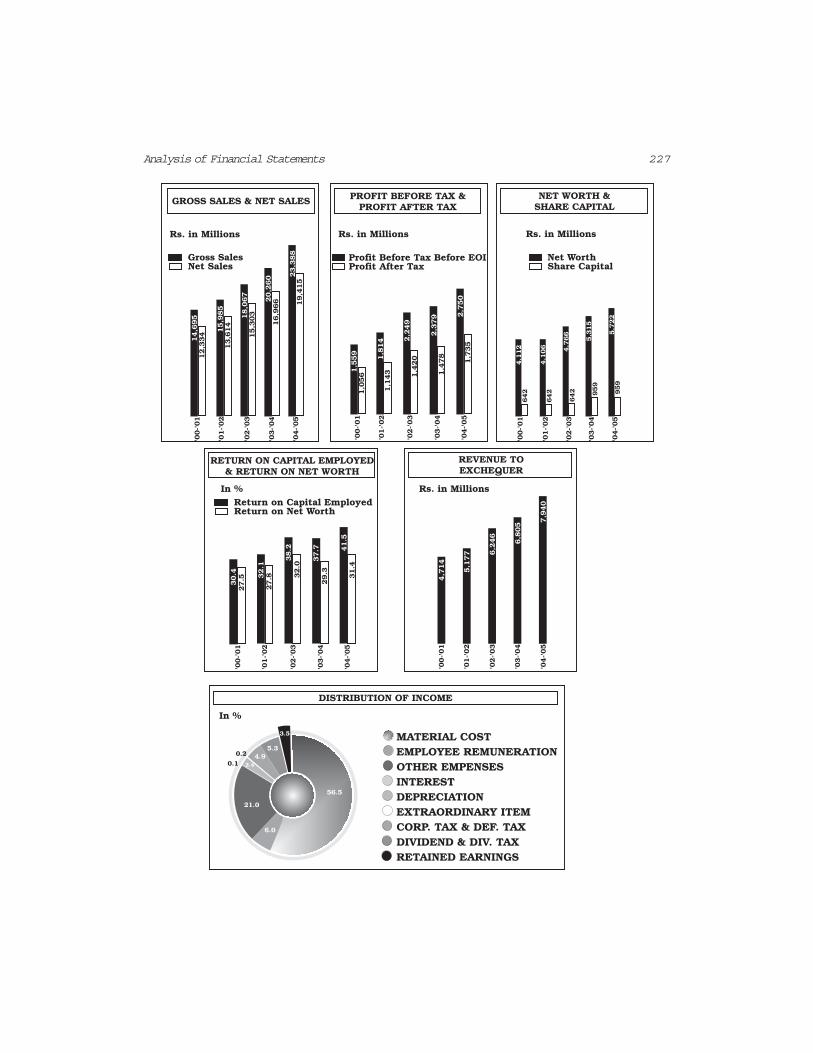
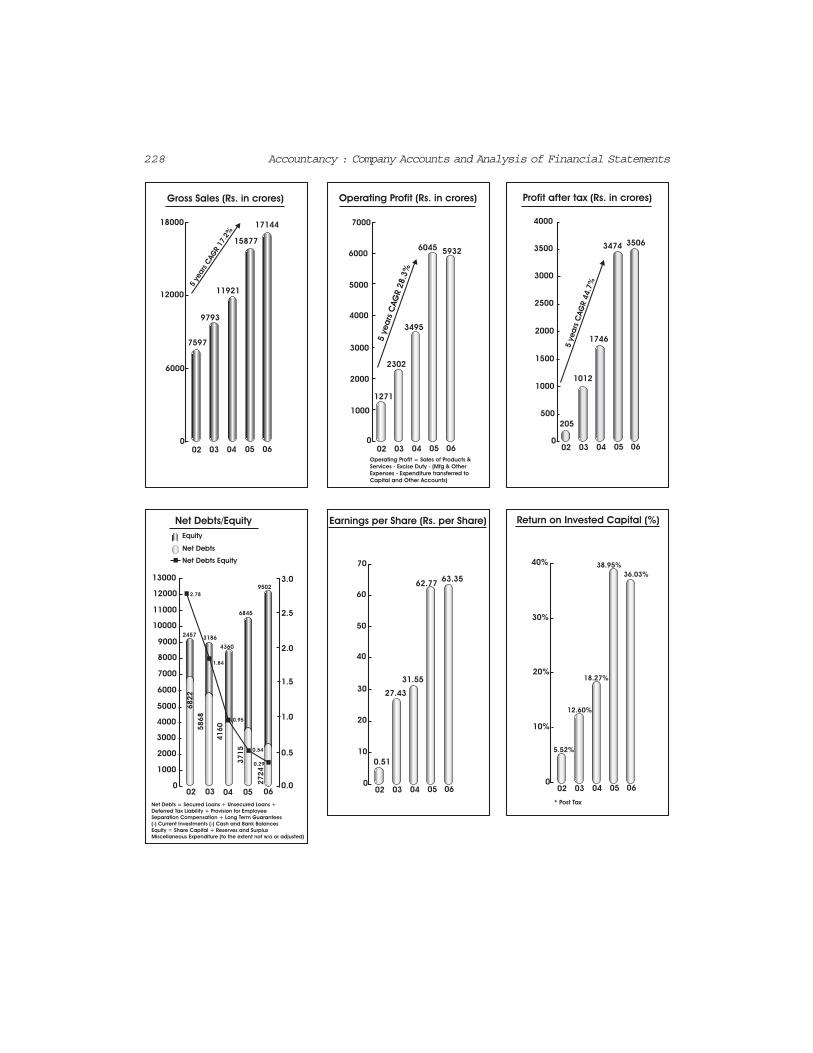
Gross Sales
Return on Capital Employed
RETAINED EARNINGSDIVIDEND & DIV. TAXCORP. TAX & DEF. TAXEXTRAORDINARY ITEMDEPRECIATIONINTERESTOTHER EMPENSESEMPLOYEE REMUNERATIONMATERIAL COST
In %
In %
5.34.9
2.4
21.0
0.1
0.2
6.0
56.5
3.5
Rs. in Millions
Rs. in Millions
GROSS SALES & NET SALES PROFIT BEFORE TAX &PROFIT AFTER TAX
RETURN ON CAPITAL EMPLOYED& RETURN ON NET WORTH
DISTRIBUTION OF INCOME
'00-'01
'00-'01
30.4 32.1
38.2
4,7
14
5,1
77 6
,246
6,8
05
7,9
40
37.7 4
1.5
27.5
27.8 3
2.0
29.3 31.4
'01-'02
'01-'02
'02-'03
'02-'03
'03-'04
'03-'04
'04-'05
'04-'05
'00-'01
14,6
95
15,9
85
18,0
67
20,2
60 2
3,3
88
12,3
34
13,6
14
15,3
03
16,9
66 19,4
15
'01-'02
'02-'03
'03-'04
'04-'05
'00-'01
1,5
59
1,8
14 2
,249
2,3
79 2
,750
1,0
56
1,1
43 1,4
20
1,4
78
1,7
35
'01-'02
'02-'03
'03-'04
'04-'05
'00-'01
4,1
12
4,1
06 4,7
66
5,3
15
5,7
22
642
642
642 959
959
'01-'02
'02-'03
'03-'04
'04-'05
NET WORTH &SHARE CAPITAL
REVENUE TOEXCHEQUER
Rs. in Millions Rs. in Millions
Profit Before Tax Before EOI Net WorthNet Sales
Return on Net Worth
Profit After Tax Share Capital
228 Accountancy : Company Accounts and Analysis of Financial Statements
002 03 04 05 06
205
1012
1746
3474 3506
5yea
rsC
AG
R44.7
%
500
1000
1500
2000
2500
3000
3500
4000
002 03 04 05 06
7597
9793
11921
15877
17144
5ye
ars
CAG
R17.2
%
6000
12000
002 03 04
Operating Profit = Sales of Products &
Services - Excise Duty - (Mfg & Other
Expenses - Expenditure transferred to
Capital and Other Accounts)
05 06
1271
2302
3495
6045 5932
5yea
rsC
AG
R28.3
%1000
2000
3000
4000
5000
6000
7000
02 03 04 05 060.0
0.5
1.0
1.5
2.0
2.5
3.0
5868
4160
3715
2724
4360
31862457
6845
9502
2.78
0
0
1000
2000
3000
4000
5000
6000
7000
8000
9000
10000
11000
12000
13000
Equity
* Post Tax
Net Debts
Net Debts Equity
002 03 04 05 06
5.52%
12.60%
18.27%
38.95%
36.03%
10%
20%
30%
40%
Return on Invested Capital (%)Earnings per Share (Rs. per Share)Net Debts/Equity
Gross Sales (Rs. in crores) Operating Profit (Rs. in crores) Profit after tax (Rs. in crores)
002 03 04 05 06
0.51
27.43
31.55
62.7763.35
10
20
30
40
50
60
70
18000
1.84
0.95
0.29
0.54
Net Debts = Secured Loans + Unsecured Loans +
Deferred Tax Liability + Provision for Employee
Separation Compensation + Long Term Guarantees
(-) Current Investments (-) Cash and Bank Balances
Equity = Share Capital + Reserves and Surplus
Miscellaneous Expenditure (to the extent not w/o or adjusted)
6822
229Analysis of Financial Statements
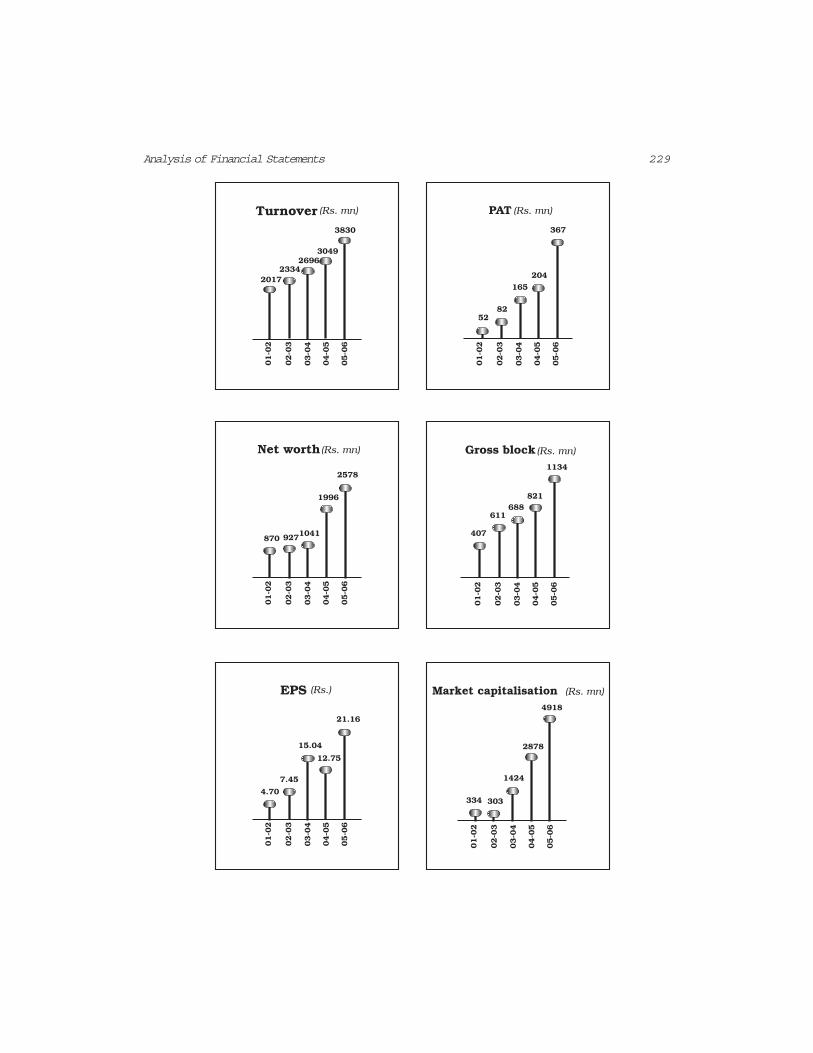
Turnover (Rs. mn)
3830
30492696
01-0
2
02-0
3
03-0
4
04-0
5
05-0
6
23342017
Net worth (Rs. mn)
2578
1996
1041
01-0
2
02-0
3
03-0
4
04-0
5
05-0
6
927870
EPS (Rs.)
21.16
12.75
15.04
01-0
2
02-0
3
03-0
4
04-0
5
05-0
6
7.45
4.70
PAT (Rs. mn)
367
204
165
01-0
2
02-0
3
03-0
4
04-0
5
05-0
6
8252
Gross block (Rs. mn)
1134
821688
01-0
2
02-0
3
03-0
4
04-0
5
05-0
6
611
407
Market capitalisation (Rs. mn)
4918
2878
1424
01-0
2
02-0
3
03-0
4
04-0
5
05-0
6
303334
230 Accountancy : Company Accounts and Analysis of Financial Statements
Test your Understanding – III
State whether each of the following is True or False :
(a) The financial statements of a business enterprise include funds flow statement.
(b) Comparative statements are the form of horizontal analysis.
(c) Common size statements and financial ratios are the two tools employed invertical analysis.
(d) Ratio analysis establishes relationship between two financial statements.
(e) Ratio analysis is a tool for analysing the financial statements of any enterprise.
(f) Financial analysis is used only by the creditors.
(g) Profit and loss account shows the operating performance of an enterprise for aperiod of time.
(h) Financial analysis helps an analyst to arrive at a decision.
(i) Cash Flow Statement is a tool of financial statement analysis.
(j) In a Common size statement each item is expressed as a percentage of somecommon base.
4.8 Limitations of Financial Analysis
Though financial analysis is quite helpful in determining financial strengthsand weaknesses of a firm, it is based on the information available in financialstatements. As such, the financial analysis also suffers from various limitationsof financial statements. Hence, the analyst must be conscious of the impact ofprice level changes, window dressing of financial statements, changes inaccounting policies of a firm, accounting concepts and conventions, personaljudgement, etc. Some other limitations of financial analysis are:
1. Financial analysis does not consider price level changes.
2. Financial analysis may be misleading without the knowledge of thechanges in accounting procedure followed by a firm.
3. Financial analysis is just a study of interim reports.
4. Monetary information alone is considered in financial analysis whilenon-monetary aspects are ignored.
5. The financial statements are prepared on the basis of on-going concept,as such, it does not reflect the current position.
231Analysis of Financial Statements
Terms Introduced in the Chapter
1. Financial Analysis 2. Common Size Statements
3. Comparative Statements 4. Trend Analysis
5. Ratio Analysis 6. Cash Flow Analysis
7. Intra Firm Comparison 8. Inter Firm Comparison
9. Horizontal Analysis 10. Vertical Analysis
Summary
Major Parts of an Annual Report
An annual report contains basic financial statements, viz. Balance Sheet, Profitand Loss Account and Cash Flow Statement. It also carries management’sdiscussion of corporate performance of the year under review and peeps into thefuture prospects.
Tools of Financial Analysis
Commonly used tools of financial analysis are: Comparative statements, Commonsize statement, trend analysis, ratio analysis, funds flow analysis and cash flowanalysis.
Comparative Statement
Comparative statement captures changes in all items of financial statements inabsolute and percentage terms over a period of time for a firm or between twofirms.
Common Size Statement
Common size statements expresses all items of a financial statements as apercentage of some common base such as sales for profit and loss account andtotal assets for balance sheet.
Ratio Analysis
Ratio analysis is a tool of financial analysis which involves the methods ofcalculating and interpreting financial ratios in order to assess the strengths andweaknesses in the performance of a business enterprise.
232 Accountancy : Company Accounts and Analysis of Financial Statements
Question for Practice
A. Short Answer Questions1. List the techniques of Financial Statement Analysis.2. Distinguish between Vertical and Horizontal Analysis of financial data.3. Explain the meaning of Analysis and Interpretation.4. Bring out the importance of Financial Analysis?5. What are Comparative Financial Statements.6. What do you mean by Common Size Statements?
B. Long Answer Questions1. Describe the different techniques of financial analysis and explain the
limitations of financial analysis.2. Explain the usefulness of trend percentages in interpretation of financial
performance of a company.3. What is the importance of comparative statements? Illustrate your
answer with particular reference to comparative income statement.4. What do you understand by analysis and interpretation of financial
statements? Discuss their importance.5. Explain how common size statements are prepared giving an example.
Numerical Questions
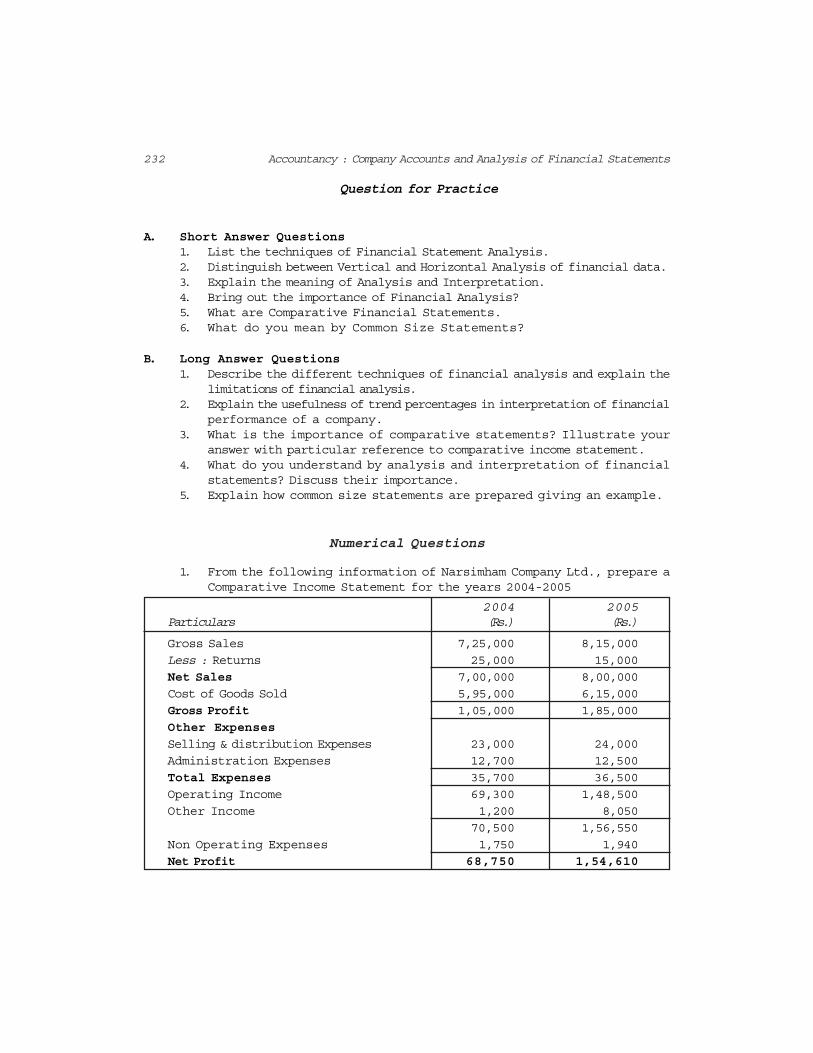
1. From the following information of Narsimham Company Ltd., prepare aComparative Income Statement for the years 2004-2005
2004 2005Particulars (Rs.) (Rs.)
Gross Sales 7,25,000 8,15,000
Less : Returns 25,000 15,000
Net Sales 7,00,000 8,00,000
Cost of Goods Sold 5,95,000 6,15,000
Gross Profit 1,05,000 1,85,000
Other Expenses
Selling & distribution Expenses 23,000 24,000
Administration Expenses 12,700 12,500
Total Expenses 35,700 36,500
Operating Income 69,300 1,48,500
Other Income 1,200 8,050
70,500 1,56,550
Non Operating Expenses 1,750 1,940
Net Profit 68,750 1,54,610
233Analysis of Financial Statements
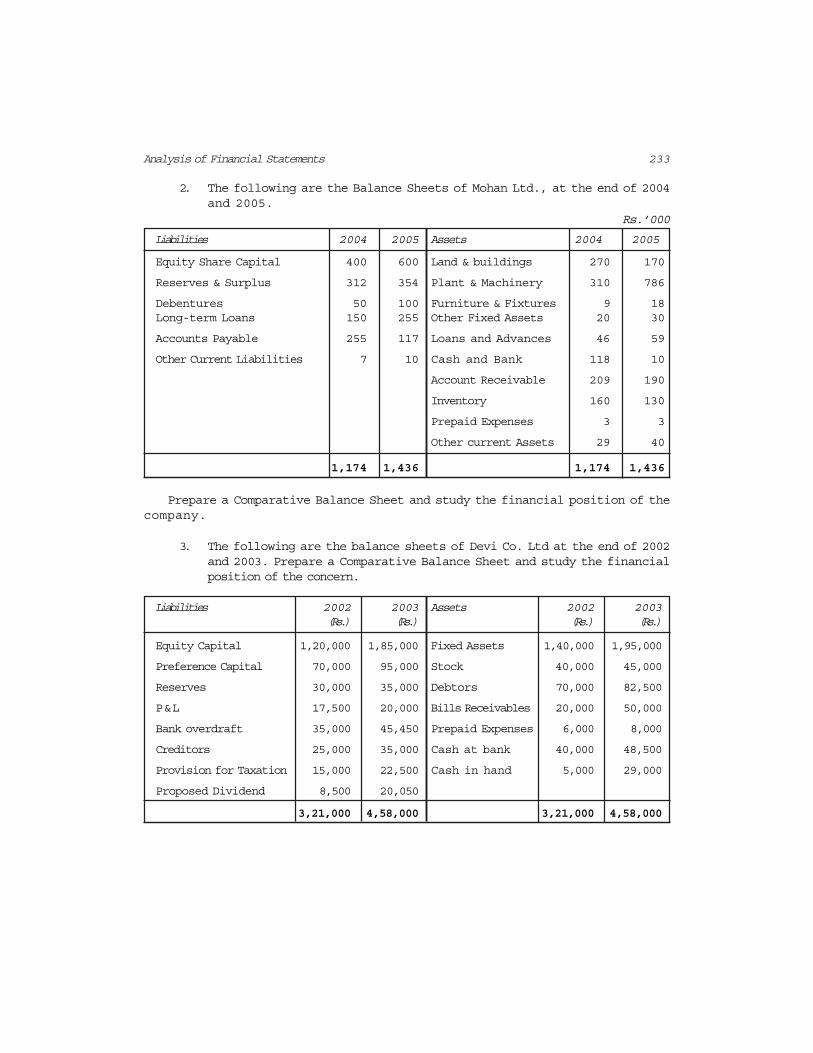
2. The following are the Balance Sheets of Mohan Ltd., at the end of 2004and 2005.
Rs.’000
Liabilities 2004 2005 Assets 2004 2005
Equity Share Capital 400 600 Land & buildings 270 170
Reserves & Surplus 312 354 Plant & Machinery 310 786
Debentures 50 100 Furniture & Fixtures 9 18Long-term Loans 150 255 Other Fixed Assets 20 30
Accounts Payable 255 117 Loans and Advances 46 59
Other Current Liabilities 7 10 Cash and Bank 118 10
Account Receivable 209 190
Inventory 160 130
Prepaid Expenses 3 3
Other current Assets 29 40
1,174 1,436 1,174 1,436
Prepare a Comparative Balance Sheet and study the financial position of thecompany.
3. The following are the balance sheets of Devi Co. Ltd at the end of 2002and 2003. Prepare a Comparative Balance Sheet and study the financialposition of the concern.
Liabilities 2002 2003 Assets 2002 2003(Rs.) (Rs.) (Rs.) (Rs.)
Equity Capital 1,20,000 1,85,000 Fixed Assets 1,40,000 1,95,000
Preference Capital 70,000 95,000 Stock 40,000 45,000
Reserves 30,000 35,000 Debtors 70,000 82,500
P&L 17,500 20,000 Bills Receivables 20,000 50,000
Bank overdraft 35,000 45,450 Prepaid Expenses 6,000 8,000
Creditors 25,000 35,000 Cash at bank 40,000 48,500
Provision for Taxation 15,000 22,500 Cash in hand 5,000 29,000
Proposed Dividend 8,500 20,050
3,21,000 4,58,000 3,21,000 4,58,000
234 Accountancy : Company Accounts and Analysis of Financial Statements
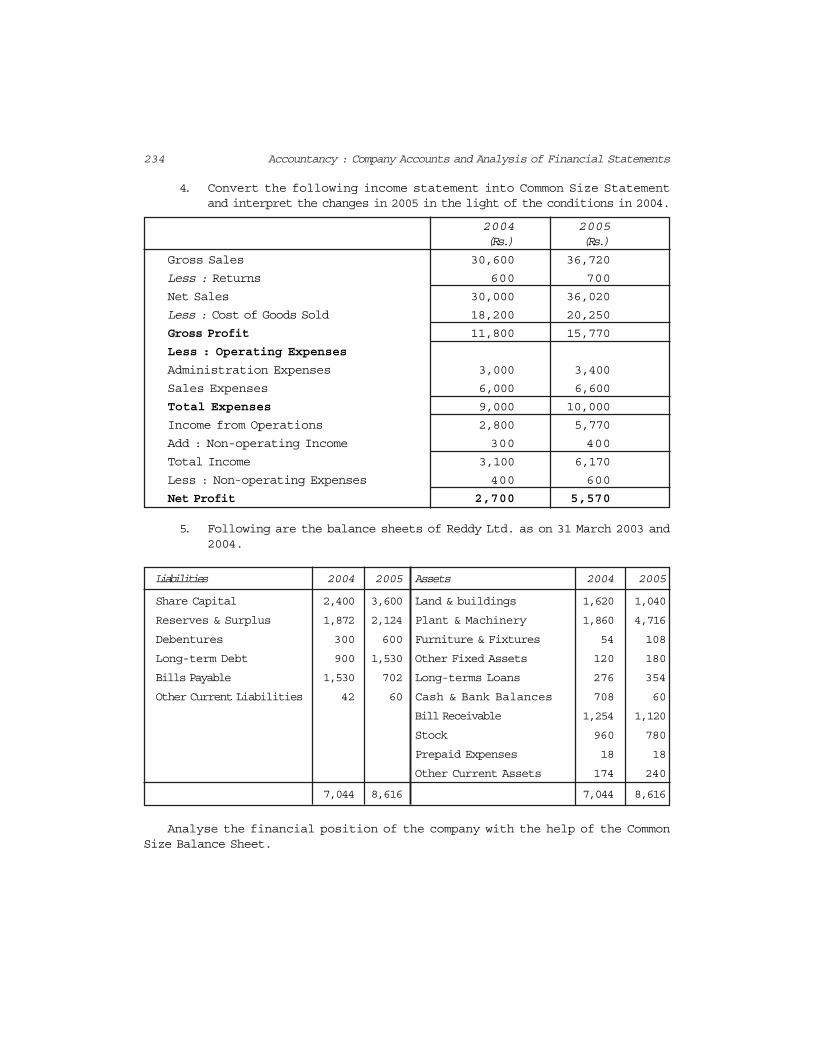
4. Convert the following income statement into Common Size Statementand interpret the changes in 2005 in the light of the conditions in 2004.
2004 2005(Rs.) (Rs.)
Gross Sales 30,600 36,720
Less : Returns 600 700
Net Sales 30,000 36,020
Less : Cost of Goods Sold 18,200 20,250
Gross Profit 11,800 15,770
Less : Operating Expenses
Administration Expenses 3,000 3,400
Sales Expenses 6,000 6,600
Total Expenses 9,000 10,000
Income from Operations 2,800 5,770
Add : Non-operating Income 300 400
Total Income 3,100 6,170
Less : Non-operating Expenses 400 600
Net Profit 2,700 5,570
5. Following are the balance sheets of Reddy Ltd. as on 31 March 2003 and2004.
Liabilities 2004 2005 Assets 2004 2005
Share Capital 2,400 3,600 Land & buildings 1,620 1,040
Reserves & Surplus 1,872 2,124 Plant & Machinery 1,860 4,716
Debentures 300 600 Furniture & Fixtures 54 108
Long-term Debt 900 1,530 Other Fixed Assets 120 180
Bills Payable 1,530 702 Long-terms Loans 276 354
Other Current Liabilities 42 60 Cash & Bank Balances 708 60
Bill Receivable 1,254 1,120
Stock 960 780
Prepaid Expenses 18 18
Other Current Assets 174 240
7,044 8,616 7,044 8,616
Analyse the financial position of the company with the help of the CommonSize Balance Sheet.
235Analysis of Financial Statements
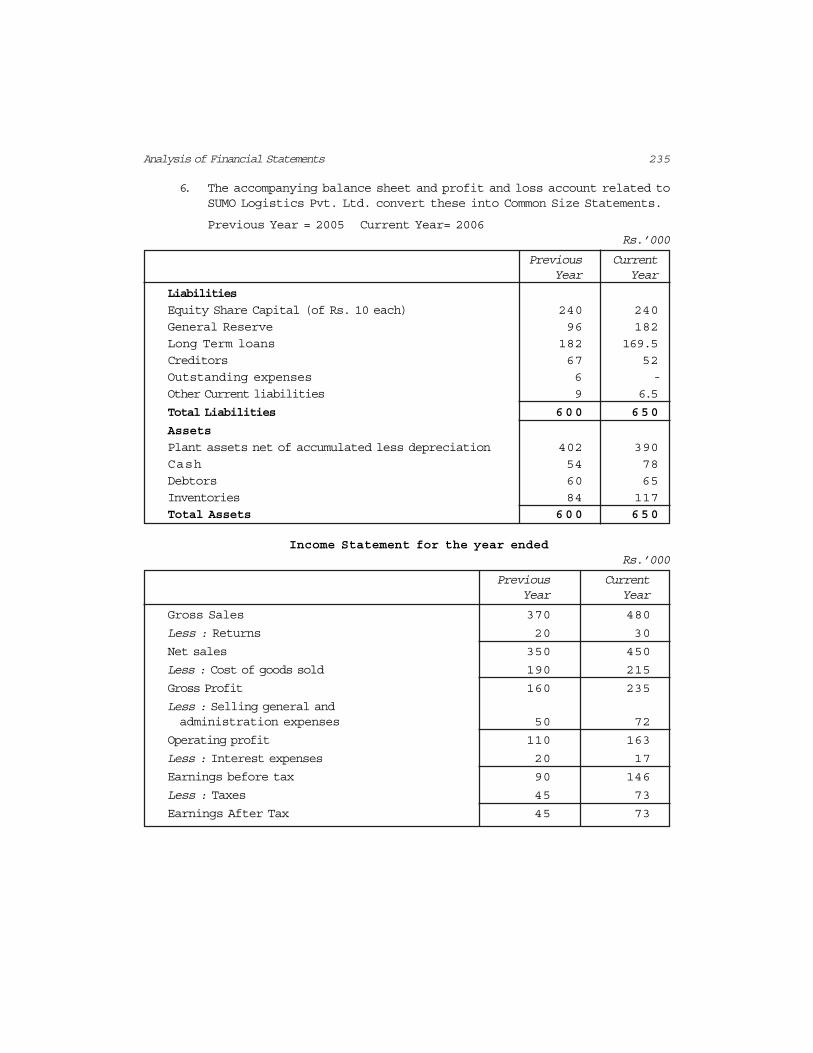
6. The accompanying balance sheet and profit and loss account related toSUMO Logistics Pvt. Ltd. convert these into Common Size Statements.
Previous Year = 2005 Current Year= 2006Rs.’000
Previous CurrentYear Year
Liabilities
Equity Share Capital (of Rs. 10 each) 240 240
General Reserve 96 182
Long Term loans 182 169.5
Creditors 67 52
Outstanding expenses 6 -
Other Current liabilities 9 6.5
Total Liabilities 600 650
Assets
Plant assets net of accumulated less depreciation 402 390
Cash 54 78
Debtors 60 65
Inventories 84 117
Total Assets 600 650
Income Statement for the year endedRs.’000
Previous CurrentYear Year
Gross Sales 370 480
Less : Returns 20 30
Net sales 350 450
Less : Cost of goods sold 190 215
Gross Profit 160 235
Less : Selling general andadministration expenses 50 72
Operating profit 110 163
Less : Interest expenses 20 17
Earnings before tax 90 146
Less : Taxes 45 73
Earnings After Tax 45 73
236 Accountancy : Company Accounts and Analysis of Financial Statements
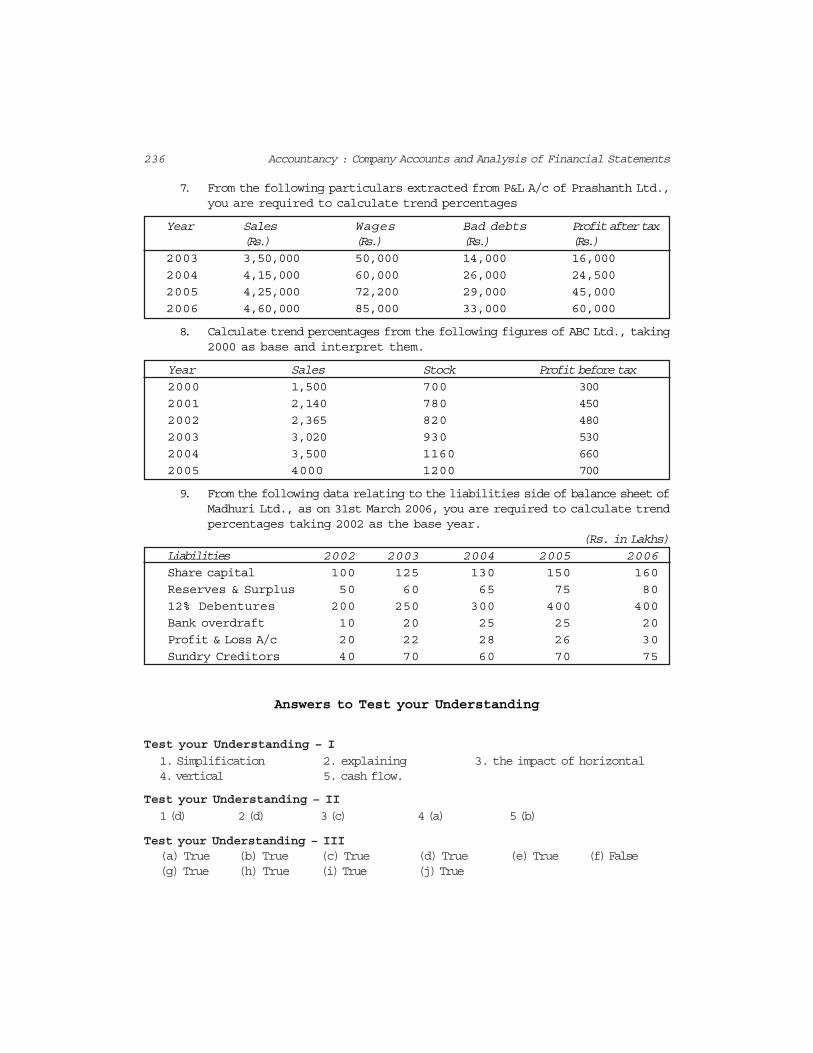
7. From the following particulars extracted from P&L A/c of Prashanth Ltd.,you are required to calculate trend percentages
Year Sales Wages Bad debts Profit after tax(Rs.) (Rs.) (Rs.) (Rs.)
2003 3,50,000 50,000 14,000 16,000
2004 4,15,000 60,000 26,000 24,500
2005 4,25,000 72,200 29,000 45,000
2006 4,60,000 85,000 33,000 60,000
8. Calculate trend percentages from the following figures of ABC Ltd., taking2000 as base and interpret them.
Year Sales Stock Profit before tax2000 1,500 700 300
2001 2,140 780 450
2002 2,365 820 480
2003 3,020 930 530
2004 3,500 1160 660
2005 4000 1200 700
9. From the following data relating to the liabilities side of balance sheet ofMadhuri Ltd., as on 31st March 2006, you are required to calculate trendpercentages taking 2002 as the base year.
(Rs. in Lakhs)Liabilities 2002 2003 2004 2005 2006Share capital 100 125 130 150 160
Reserves & Surplus 50 60 65 75 80
12% Debentures 200 250 300 400 400
Bank overdraft 10 20 25 25 20
Profit & Loss A/c 20 22 28 26 30
Sundry Creditors 40 70 60 70 75
Answers to Test your Understanding
Test your Understanding – I
1. Simplification 2. explaining 3. the impact of horizontal4. vertical 5. cash flow.
Test your Understanding – II
1 (d) 2 (d) 3 (c) 4 (a) 5 (b)
Test your Understanding – III(a) True (b) True (c) True (d) True (e) True (f) False(g) True (h) True (i) True (j) True