Embed Size (px)
Citation preview
Science Journal of Energy Engineering 2017; 5(2): 40-47
http://www.sciencepublishinggroup.com/j/sjee
doi: 10.11648/j.sjee.20170502.11
ISSN: 2376-810X (Print); ISSN: 2376-8126 (Online)
Analysis of Failure Modes Effect and Criticality Analysis (FMECA): A Stand-Alone Photovoltaic System
Omar Ngala Sarr, Fabe Idrissa Barro, Oumar Absatou Niasse, Fatou Dia, Nacir Mbengue,
Bassirou Ba, Cheikh Sene
Department of Physics, Faculty of Science and Technology, Semiconductors and Solar Energy Laboratory - Cheikh Anta Diop University,
Dakar, Senegal
Email address: [email protected] (O. N. Sarr)
To cite this article: Omar Ngala Sarr, FABE Idrissa Barro, Oumar Absatou Niasse, Fatou Dia, Nacir Mbengue, Bassirou Ba, Cheikh SENE. Analysis of Failure
Modes Effect and Criticality Analysis (FMECA): A Stand-Alone Photovoltaic System. Science Journal of Energy Engineering.
Vol. 5, No. 2, 2017, pp. 40-47. doi: 10.11648/j.sjee.20170502.11
Received: February 24, 2017; Accepted: March 8, 2017; Published: March 27, 2017
Abstract: This study deals with the implementation of a methodological guide for the maintenance of photovoltaic systems in
Senegal. Typical PV systems components are photovoltaic panels, and inverter, a regulator, connecting cables and the battery; so
Failure Modes Effect and Criticality Analysis (FMECA) is performed on the PV system in order to increase the reliability and
reduce system failures. To do that, a functional analysis of the system through an octopus diagram and a dysfunctional analysis
through a fault tree, are used as a decision support for the choice of the coefficients to obtain the full system FMEA. The obtained
results allowed us to detect about 40% of the types of failure that cause over 60% of system malfunction. Anticipating these types
of failure through preventive maintenance would make the PV system more reliable.
Keywords: FMECA, Photovoltaic Systems, Maintenance
1. Introduction
In the actual context of sustainable development.
Renewable energies are undoubtedly an ideal solution from
their availability and their perennity. That explains surely all
works carried out in renewable energies and particularly
photovoltaic. Photovoltaic solar energy represents a factor
impossible to circumvent in the race with energies in Africa
and particularly in Senegal; however, there is a lack of about
maintenance on PV systems. It is then of prior importance to
fill this gap. For example, practically 80% of the photovoltaic
street lamps does not function practically more than two to
three months. It remains obvious that it is not the solar
illumination, which is lacking, but rather a bad installation or a
poor maintenance. Moreover this remains also valid for
photovoltaic power plant. It is then a great interest to set a
system for the maintenance of photovoltaic power plants in
Senegal. The main objectives of this work is then to analyze
the failure mode in PV systems and then apply FMECA
method to set up or improve the maintenance of those systems.
2. Analysis of the Modes of Failure
2.1. The Reliability of a System
� Reliability
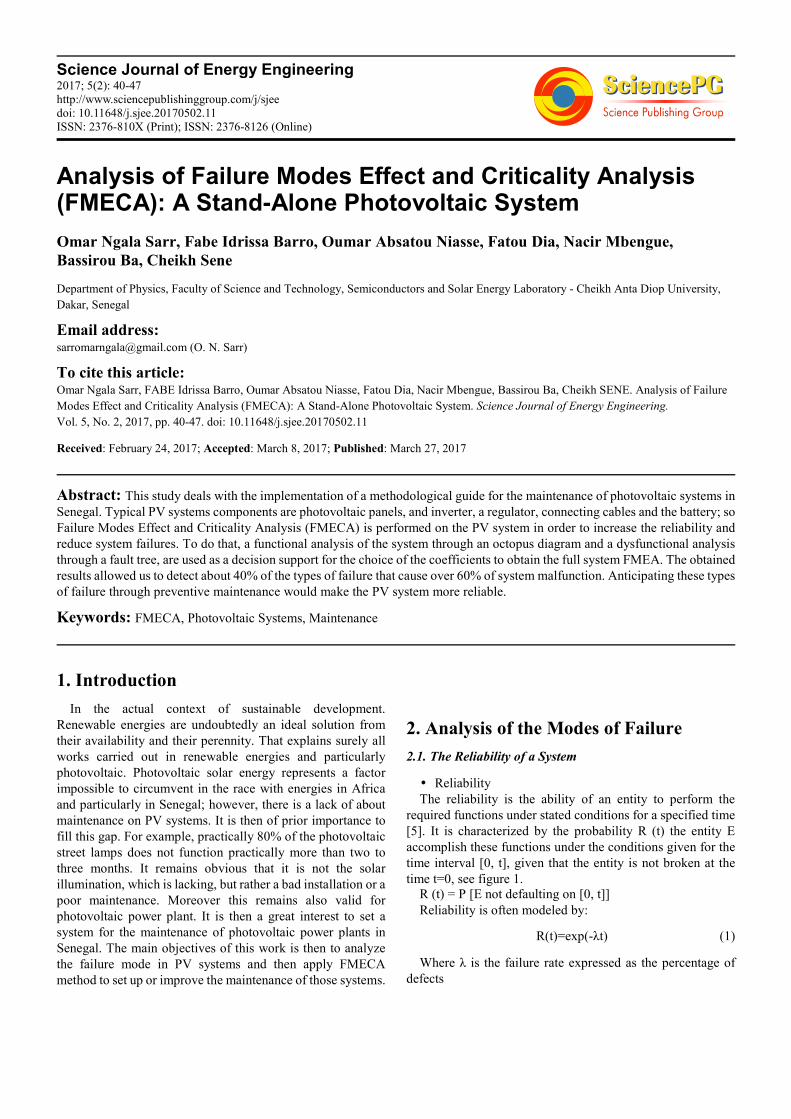
The reliability is the ability of an entity to perform the
required functions under stated conditions for a specified time
[5]. It is characterized by the probability R (t) the entity E
accomplish these functions under the conditions given for the
time interval [0, t], given that the entity is not broken at the
time t=0, see figure 1.
R (t) = P [E not defaulting on [0, t]]
Reliability is often modeled by:
R(t)=exp(-λt) (1)
Where λ is the failure rate expressed as the percentage of
defects
41 Omar Ngala Sarr et al.: Analysis of Failure Modes Effect and Criticality Analysis (FMECA):
A Stand-Alone Photovoltaic System
Figure 1. Reliability.
� Availability of a system Availability is the ability of an entity to be able to
accomplish the functions required under the given conditions
and at a given time [1]. It is characterized by the probability A
(t) of the entity E at time t, to perform the duties required
under given conditions.
A (t) = P [E non-defaulting at time t]
� Maintainability of a system
Maintainability is the ability of an entity to be maintained or
restored to a state in which it can perform a required function,
when maintenance is performed under given conditions with
prescribed procedures and resources. It is characterized by the
probability M (t) the entity E is in state at time t, to perform his
duties, knowing that the entity was not working at time t = 0
[1].
M (t) = P [E is repaired on [0, t]]
� Safety
Safety is the ability of an entity to avoid, under given
conditions, critical or catastrophic events. It is characterized
by the probability S (t) that the entity E does not let appear in
given conditions, critical or catastrophic events.
S (t) = P [E avoids critical or catastrophic events on [0, t]]
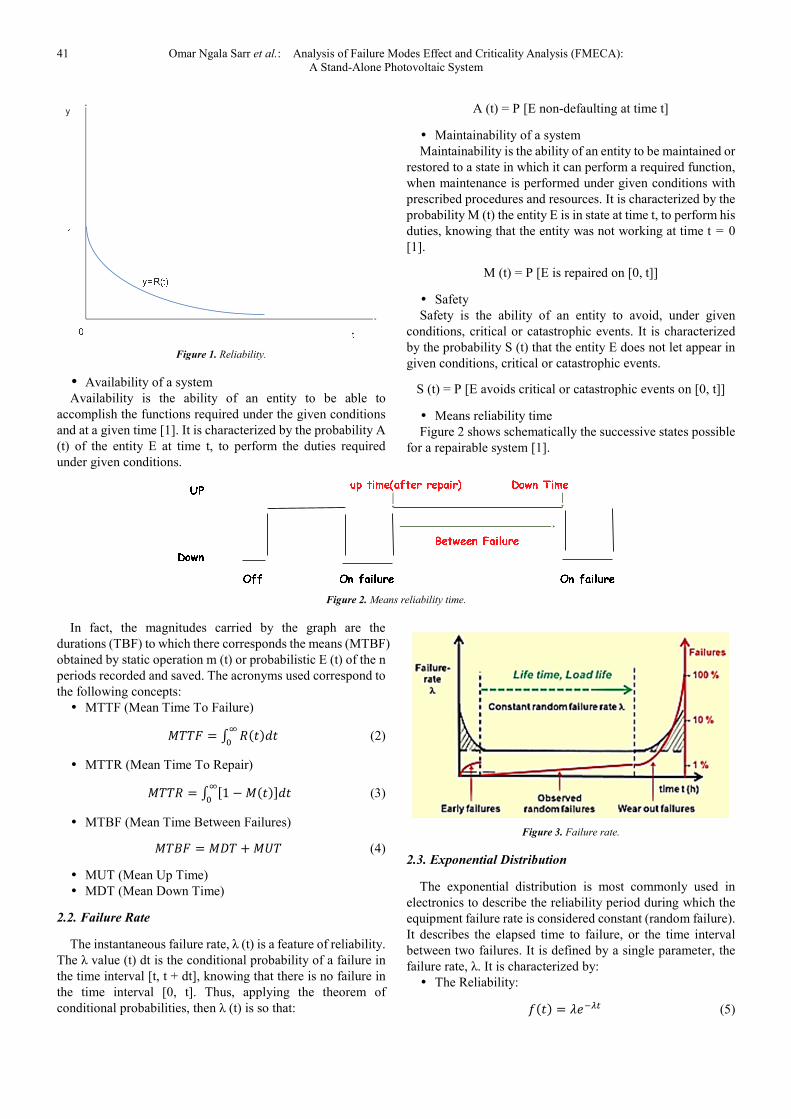
� Means reliability time
Figure 2 shows schematically the successive states possible
for a repairable system [1].
Figure 2. Means reliability time.
In fact, the magnitudes carried by the graph are the
durations (TBF) to which there corresponds the means (MTBF)
obtained by static operation m (t) or probabilistic E (t) of the n
periods recorded and saved. The acronyms used correspond to
the following concepts:
� MTTF (Mean Time To Failure)
���� � � �����
� (2)
� MTTR (Mean Time To Repair)
���� � � 1 � ������
� (3)
� MTBF (Mean Time Between Failures)
���� � ��� � ��� (4)
� MUT (Mean Up Time)
� MDT (Mean Down Time)
2.2. Failure Rate
The instantaneous failure rate, λ (t) is a feature of reliability.
The λ value (t) dt is the conditional probability of a failure in
the time interval [t, t + dt], knowing that there is no failure in
the time interval [0, t]. Thus, applying the theorem of
conditional probabilities, then λ (t) is so that:
Figure 3. Failure rate.
2.3. Exponential Distribution
The exponential distribution is most commonly used in
electronics to describe the reliability period during which the
equipment failure rate is considered constant (random failure).
It describes the elapsed time to failure, or the time interval
between two failures. It is defined by a single parameter, the
failure rate, λ. It is characterized by:
� The Reliability:
��� � ����� (5)
y
Science Journal of Energy Engineering 2017; 5(2): 40-47 42
� The probability density:
��� � ���� (6)
� The failure rate:
��� � � (7)
� MTBF (Mean Time Between Failure):
���� ��
� (8)
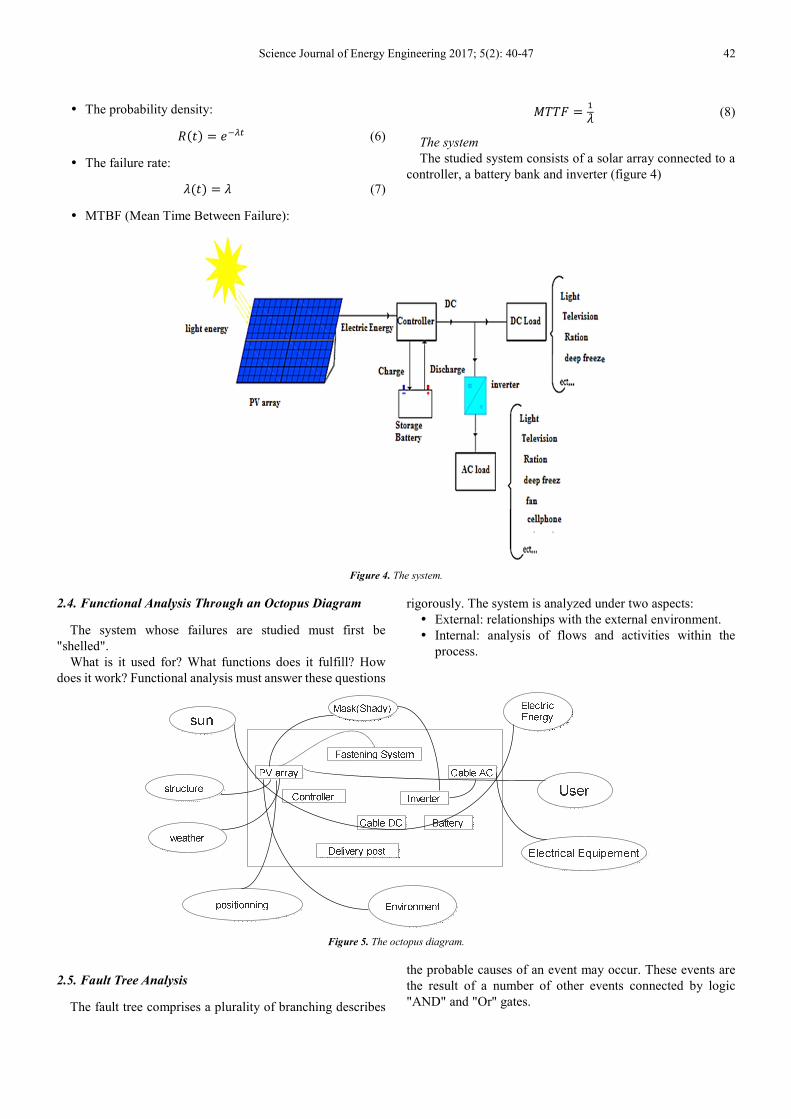
The system
The studied system consists of a solar array connected to a
controller, a battery bank and inverter (figure 4)
Figure 4. The system.
2.4. Functional Analysis Through an Octopus Diagram
The system whose failures are studied must first be
"shelled".
What is it used for? What functions does it fulfill? How
does it work? Functional analysis must answer these questions
rigorously. The system is analyzed under two aspects:
� External: relationships with the external environment.
� Internal: analysis of flows and activities within the
process.
Figure 5. The octopus diagram.
2.5. Fault Tree Analysis
The fault tree comprises a plurality of branching describes
the probable causes of an event may occur. These events are
the result of a number of other events connected by logic
"AND" and "Or" gates.
43 Omar Ngala Sarr et al.: Analysis of Failure Modes Effect and Criticality Analysis (FMECA):
A Stand-Alone Photovoltaic System
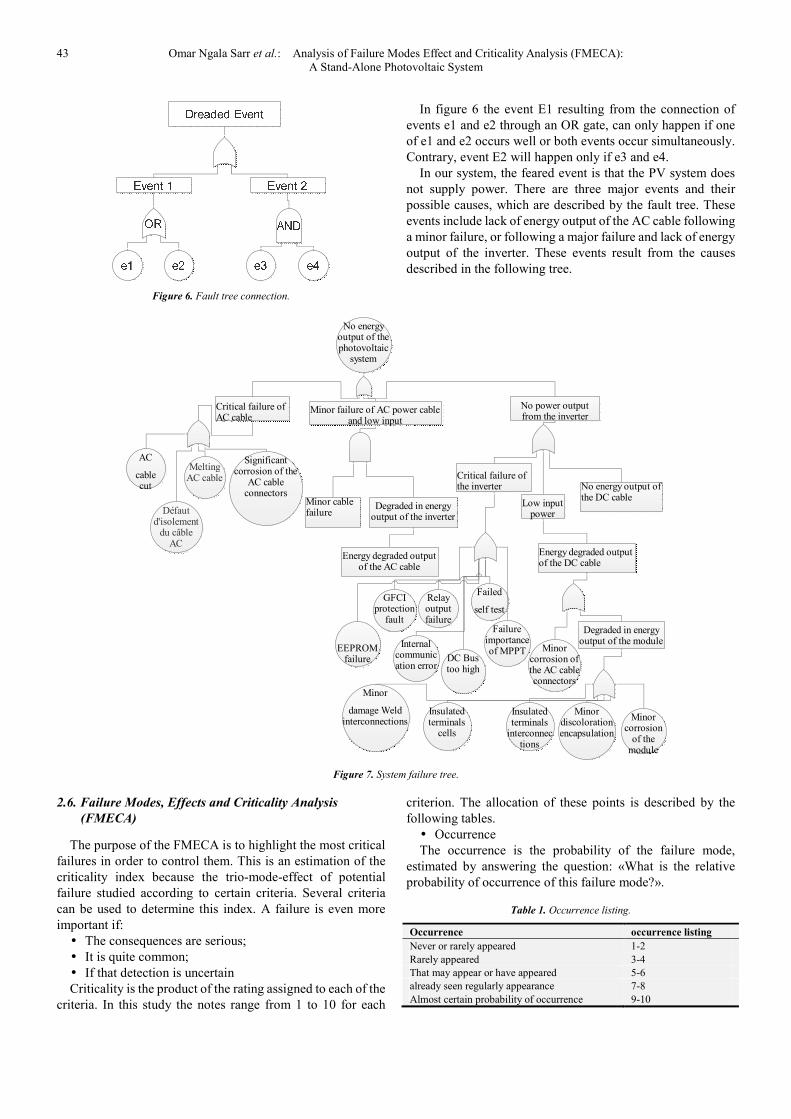
Figure 6. Fault tree connection.
In figure 6 the event E1 resulting from the connection of
events e1 and e2 through an OR gate, can only happen if one
of e1 and e2 occurs well or both events occur simultaneously.
Contrary, event E2 will happen only if e3 and e4.
In our system, the feared event is that the PV system does
not supply power. There are three major events and their
possible causes, which are described by the fault tree. These
events include lack of energy output of the AC cable following
a minor failure, or following a major failure and lack of energy
output of the inverter. These events result from the causes
described in the following tree.
Figure 7. System failure tree.
2.6. Failure Modes, Effects and Criticality Analysis
(FMECA)
The purpose of the FMECA is to highlight the most critical
failures in order to control them. This is an estimation of the
criticality index because the trio-mode-effect of potential
failure studied according to certain criteria. Several criteria
can be used to determine this index. A failure is even more
important if:
� The consequences are serious;
� It is quite common;
� If that detection is uncertain
Criticality is the product of the rating assigned to each of the
criteria. In this study the notes range from 1 to 10 for each
criterion. The allocation of these points is described by the
following tables.
� Occurrence
The occurrence is the probability of the failure mode,
estimated by answering the question: «What is the relative
probability of occurrence of this failure mode?».
Table 1. Occurrence listing.
Occurrence occurrence listing
Never or rarely appeared 1-2
Rarely appeared 3-4
That may appear or have appeared 5-6
already seen regularly appearance 7-8
Almost certain probability of occurrence 9-10
No energy output of the photovoltaic
system
Critical failure of AC cable
Minor failure of AC power cable and low input
No power output from the inverter
AC
cable cut
Melting AC cable
Significant corrosion of the
AC cable connectors
Défaut d'isolement
du câble AC
Minor cable failure
Degraded in energy output of the inverter
Energy degraded output of the AC cable
Critical failure of the inverter
Low input power
No energy output of the DC cable
Relay output failure
Failed
self test
GFCI protection
fault
Internal communication error
DC Bus too high
EEPROM failure
Failure importance of MPPT
Energy degraded output of the DC cable
Minor corrosion of the AC cable connectors
Degraded in energy output of the module
Insulated terminals
interconnections
Minor discoloration encapsulation
Minor corrosion
of the module
Insulated terminals
cells
Minor
damage Weld interconnections
Science Journal of Energy Engineering 2017; 5(2): 40-47 44
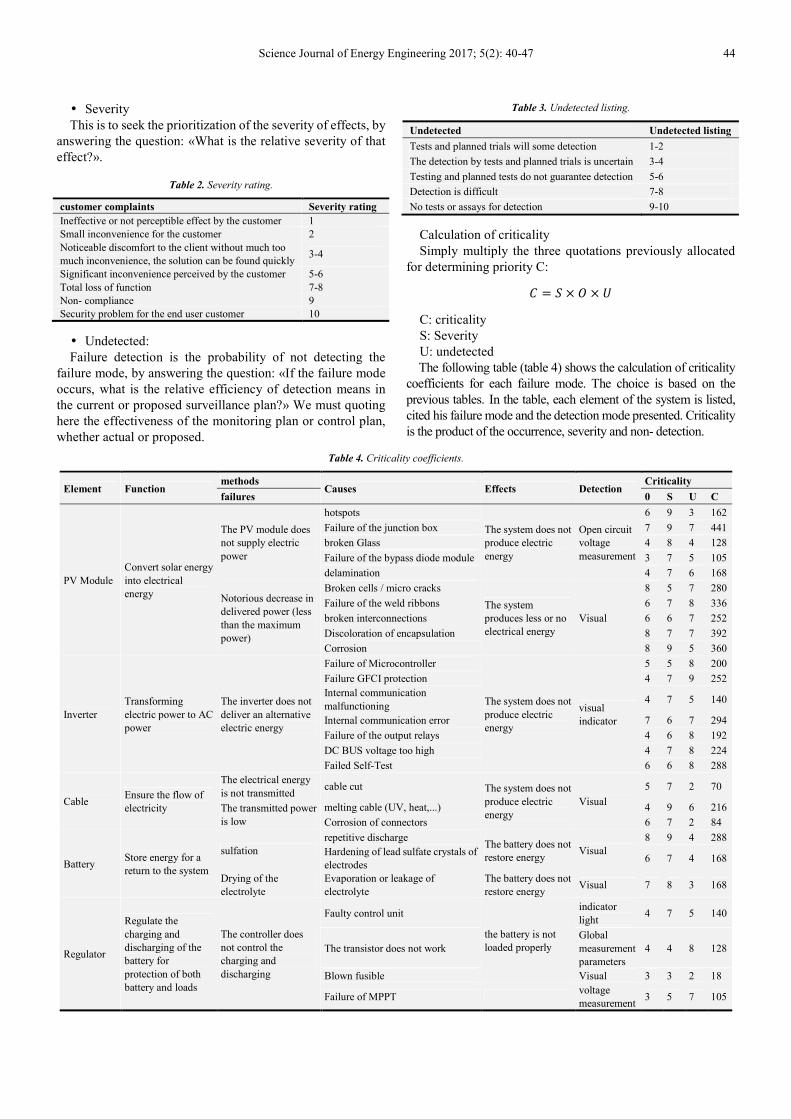
� Severity
This is to seek the prioritization of the severity of effects, by
answering the question: «What is the relative severity of that
effect?».
Table 2. Severity rating.
customer complaints Severity rating
Ineffective or not perceptible effect by the customer 1
Small inconvenience for the customer 2
Noticeable discomfort to the client without much too
much inconvenience, the solution can be found quickly 3-4
Significant inconvenience perceived by the customer 5-6
Total loss of function 7-8
Non- compliance 9
Security problem for the end user customer 10
� Undetected:
Failure detection is the probability of not detecting the
failure mode, by answering the question: «If the failure mode
occurs, what is the relative efficiency of detection means in
the current or proposed surveillance plan?» We must quoting
here the effectiveness of the monitoring plan or control plan,
whether actual or proposed.
Table 3. Undetected listing.
Undetected Undetected listing
Tests and planned trials will some detection 1-2
The detection by tests and planned trials is uncertain 3-4
Testing and planned tests do not guarantee detection 5-6
Detection is difficult 7-8
No tests or assays for detection 9-10
Calculation of criticality
Simply multiply the three quotations previously allocated
for determining priority C:
� � � × × �
C: criticality
S: Severity
U: undetected
The following table (table 4) shows the calculation of criticality
coefficients for each failure mode. The choice is based on the
previous tables. In the table, each element of the system is listed,
cited his failure mode and the detection mode presented. Criticality
is the product of the occurrence, severity and non- detection.
Table 4. Criticality coefficients.
Element Function methods
Causes Effects Detection Criticality
failures 0 S U C
PV Module
Convert solar energy
into electrical
energy
The PV module does
not supply electric
power
hotspots
The system does not
produce electric
energy
Open circuit
voltage
measurement
6 9 3 162
Failure of the junction box 7 9 7 441
broken Glass 4 8 4 128
Failure of the bypass diode module 3 7 5 105
delamination 4 7 6 168
Notorious decrease in
delivered power (less
than the maximum
power)
Broken cells / micro cracks
The system
produces less or no
electrical energy
Visual
8 5 7 280
Failure of the weld ribbons 6 7 8 336
broken interconnections 6 6 7 252
Discoloration of encapsulation 8 7 7 392
Corrosion 8 9 5 360
Inverter
Transforming
electric power to AC
power
The inverter does not
deliver an alternative
electric energy
Failure of Microcontroller
The system does not
produce electric
energy
visual
indicator
5 5 8 200
Failure GFCI protection 4 7 9 252
Internal communication
malfunctioning 4 7 5 140
Internal communication error 7 6 7 294
Failure of the output relays 4 6 8 192
DC BUS voltage too high 4 7 8 224
Failed Self-Test 6 6 8 288
Cable Ensure the flow of
electricity
The electrical energy
is not transmitted cable cut The system does not
produce electric
energy
Visual
5 7 2 70
The transmitted power
is low
melting cable (UV, heat,...) 4 9 6 216
Corrosion of connectors 6 7 2 84
Battery Store energy for a
return to the system
sulfation
repetitive discharge The battery does not
restore energy Visual
8 9 4 288
Hardening of lead sulfate crystals of
electrodes 6 7 4 168
Drying of the
electrolyte
Evaporation or leakage of
electrolyte
The battery does not
restore energy Visual 7 8 3 168
Regulator
Regulate the
charging and
discharging of the
battery for
protection of both
battery and loads
The controller does
not control the
charging and
discharging
Faulty control unit
the battery is not
loaded properly
indicator
light 4 7 5 140
The transistor does not work
Global
measurement
parameters
4 4 8 128
Blown fusible Visual 3 3 2 18
Failure of MPPT voltage
measurement 3 5 7 105
45 Omar Ngala Sarr et al.: Analysis of Failure Modes Effect and Criticality Analysis (FMECA):
A Stand-Alone Photovoltaic System
For a more detailed overview of the calculation, each
element will be studied separately and Pareto study will locate
types of failure on which the priorities will be.
3. Analysis of Results of the FMECA
Study of the System
Calculating coefficients allowed to find for each item
different types of failure and their values in terms of
criticality.
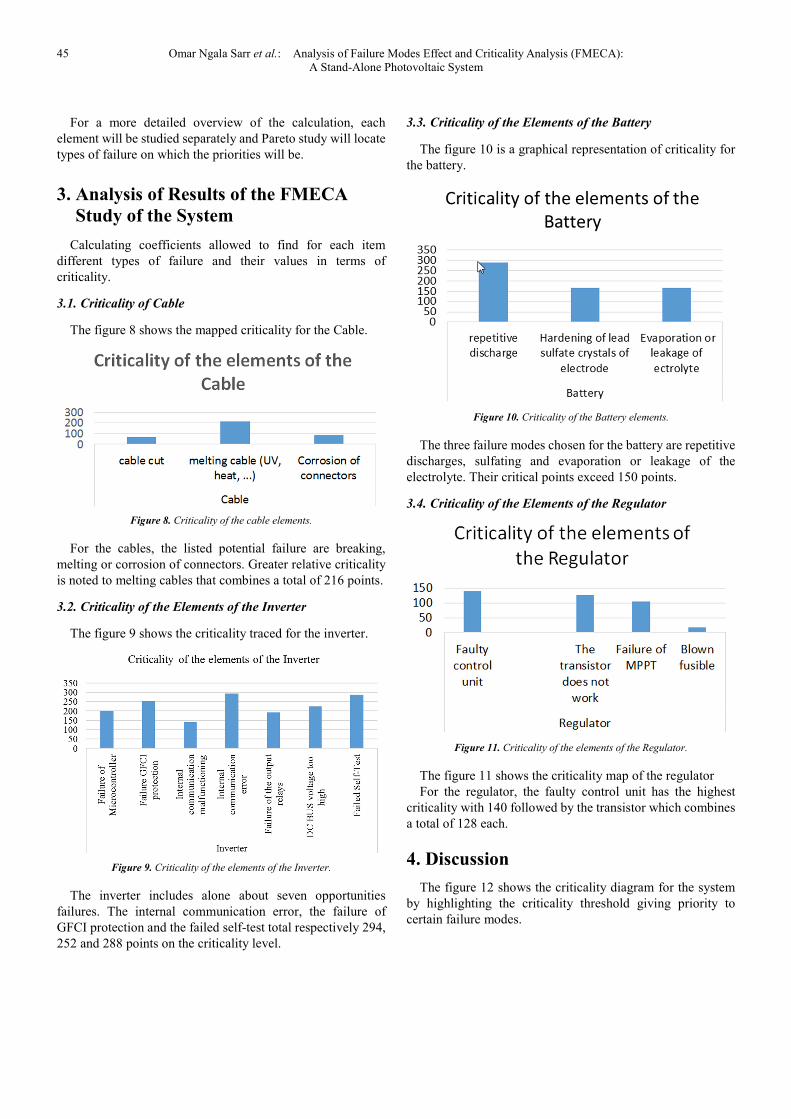
3.1. Criticality of Cable
The figure 8 shows the mapped criticality for the Cable.
Figure 8. Criticality of the cable elements.
For the cables, the listed potential failure are breaking,
melting or corrosion of connectors. Greater relative criticality
is noted to melting cables that combines a total of 216 points.
3.2. Criticality of the Elements of the Inverter
The figure 9 shows the criticality traced for the inverter.
Figure 9. Criticality of the elements of the Inverter.
The inverter includes alone about seven opportunities
failures. The internal communication error, the failure of
GFCI protection and the failed self-test total respectively 294,
252 and 288 points on the criticality level.
3.3. Criticality of the Elements of the Battery
The figure 10 is a graphical representation of criticality for
the battery.
Figure 10. Criticality of the Battery elements.
The three failure modes chosen for the battery are repetitive
discharges, sulfating and evaporation or leakage of the
electrolyte. Their critical points exceed 150 points.
3.4. Criticality of the Elements of the Regulator
Figure 11. Criticality of the elements of the Regulator.
The figure 11 shows the criticality map of the regulator
For the regulator, the faulty control unit has the highest
criticality with 140 followed by the transistor which combines
a total of 128 each.
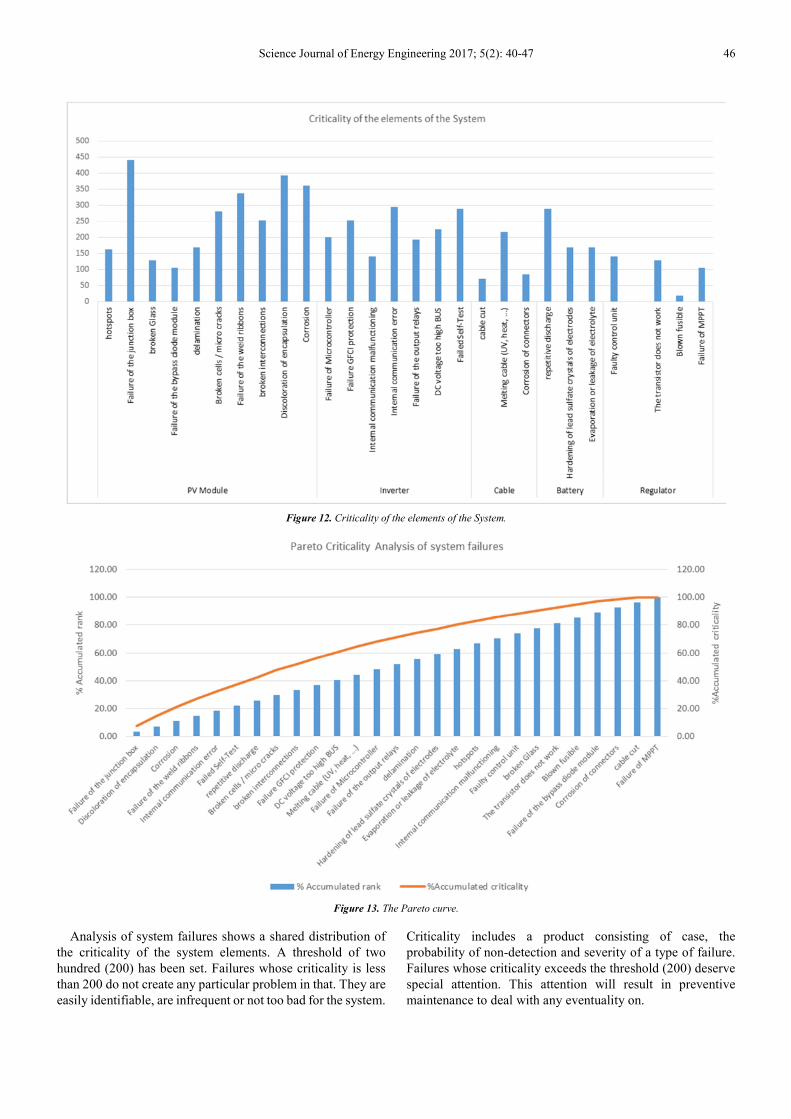
4. Discussion
The figure 12 shows the criticality diagram for the system
by highlighting the criticality threshold giving priority to
certain failure modes.
Science Journal of Energy Engineering 2017; 5(2): 40-47 46
Figure 12. Criticality of the elements of the System.
Figure 13. The Pareto curve.
Analysis of system failures shows a shared distribution of
the criticality of the system elements. A threshold of two
hundred (200) has been set. Failures whose criticality is less
than 200 do not create any particular problem in that. They are
easily identifiable, are infrequent or not too bad for the system.
Criticality includes a product consisting of case, the
probability of non-detection and severity of a type of failure.
Failures whose criticality exceeds the threshold (200) deserve
special attention. This attention will result in preventive
maintenance to deal with any eventuality on.
47 Omar Ngala Sarr et al.: Analysis of Failure Modes Effect and Criticality Analysis (FMECA):
A Stand-Alone Photovoltaic System
For better visibility, a Pareto analysis was performed.
Pareto analysis
The Pareto analysis allows to see the minimum of causes
that leads to maximum effect on the system. Figure 13
represents the Pareto curve. For the draw, a ranking of failure
modes has been achieved in decreasing order, and a
percentage was calculated through the combination of
criticality.
The Pareto analysis shows that 40% of failures makes over
60% of the criticality cumulating. In this 40% we find for the
battery failures, the repetitive discharge and for photovoltaic
panels, among other failures we have the broken
interconnections. And finally to the failure modes of an
inverter may be mentioned the failure of microcontroller and
the overvoltage of the BUS.
A mastering of these failure modes (40% of the total) could
reduce by 60% the system crashes and contribute strongly to
the reliability of autonomous photovoltaic systems.
5. Conclusion
The study focused on maintenance of autonomous
photovoltaic systems. After a reminder of the exponential
law, a functional analysis of the system was made through
an octopus diagram and a fault tree. This was done in order
to help us choose the criticality coefficients through the
Failure Modes Effects and criticality Analysis (FMECA). A
Pareto study applied to the system showed that 40% of
possible failures themselves include nearly 60% of the
criticality of the system. Mastering these failures will
increase the reliability of the entire autonomous
photovoltaic system.
References
[1] Monchy, François, Vernier Maintenance: Méthodes et organisations Ed. 3, Dunod 2010 page 140-141.
[2] M. V´azquez, C. Algora, I. Rey-Stolle et J. Gonza´lez. “III-V concentrator solar cell reliability prediction based on quantitative LED reliability data”. Progress in Photovoltaics: Research and Applications, Vol. 15, No. 6, pp. 477–491, 2007.
[3] Lyonnet, Patrick, Fiabilité industrielle: La boîte à outils des processus de fiabilité et maintenance AFNOR 2016.
[4] A. Labouret et M. Villoz. “Energie solaire photovoltaïque”. 4e Ed., 2009.
[5] Heng, Jean, Pratique de la maintenance preventive, Dunod 2011 page 17.
[6] H. Liao et E. Elsayed. “Reliability prediction and testing plan based on an accelerated degradation rate model”. International Journal of Materials and Product Technology, Vol. 21, No. 5, pp. 402–422, 2004.
[7] Antonio Luque, Steven Hegedus, “Handbook of Photovoltaic Science and Engineering”, 2003.
[8] Gillet-Goinard, Florence, Monar, Christel, “Toute la fonction QSSE (Qualité/Santé/Sécurité/ Environnement): Savoir/ Savoir-faire/ Savoir être”, Dunod 2013.
[9] Landy, Gérard, “AMDEC: Guide pratique”, AFNOR 2011.
[10] Rémi LARONDE, Thèse de Doctorat: Fiabilité et durabilité d’un système complexe dédié aux énergies renouvelables Application à un système photovoltaïque.
[11] Labib, Ashraf, “Learning from Failures: Decision Analysis of Major Disasters”, Elsevier Science, 2014.


![[ON TIME-CRITICALITY] TIME-CRITICALITY … · ["ON TIME-CRITICALITY"] TIME-CRITICALITY Time-critical signal processing in humans and machines ... - ancient Greek prosody based on](https://img.pdfslide.us/doc/110x75/5b914fb509d3f215288b5a2b/on-time-criticality-time-criticality-on-time-criticality-time-criticality.jpg)