Embed Size (px)
Citation preview

ANALYSIS OF EXTENDED CONSTANT POWER SPEED
RANGE OF THE PERMANENT MAGNET
SYNCHRONOUS MACHINE DRIVEN BY DUAL MODE
INVERTER CONTROL
A Dissertation
Presented for the
Doctor of Philosophy Degree
The University of Tennessee, Knoxville
João Onofre Pereira Pinto
August 2001

i
To the Graduate Council:
I am submitting herewith a dissertation written by João Onofre Pereira Pinto entitled
"Analysis of Extended Constant Power Speed Range Of The Permanent Magnet
Synchronous Machine Driven by Dual Mode Inverter Control". I have examined the
final copy of this dissertation for form and content and recommended that it be
accepted in partial fulfillment of the requirements for the degree of Doctor of
Philosophy, with a major in Electrical Engineering.

ii
DEDICATION
This dissertation is dedicated to my parents
Mr. Benedito Pereira Pinto†
and
Mrs. Damiana de Freitas Pinto
who have taught me the values of belief and perseverance.

iii
ACKNOWLEDGEMENTS
Before acknowledging anyone, I would like to convey that this is very
difficult for me because I know that my best English is not good enough to fully
express my gratitude to the people who were my guides, my friends, and my support
during this journey through the PhD program.
I would like to thank Dr. Jack. S. Lawler. His unconditional support was one
of the main reasons for my success. Dr. Lawler showed me that advising and kindness
are perfectly compatible. From Dr. Lawler I have not only learned the interesting
topics of research involved in this dissertation but have also learned to adopt a
practical way of thinking.
In addition to Dr. Lawler, I would like to thank the other members of the
dissertation committee, Dr. J. Milton Bailey, Dr. Paul B. Crilly, Dr. Leon M. Tolbert,
Dr. Luiz E. B. Silva, and Dr. Tse-Wei Wang, for their careful review of my work and
their suggestions for the improvement that resulted in this dissertation. I also want to
thank them for sparing some of their busy time to review my work in such a short
amount of time.
There are some people whose kindness and help are immeasurable. Among
them, I would like to highlight my great friend Burak Ozpineci, for his friendship,
technical discussions, careful review of my writings, and encouragement. I would like
to thank Dr. Luiz Eduardo Borges da Silva, my friend and also a member of my
dissertation committee. Luiz's wisdom helped me pass through rough times during

iv
my stay in the U.S. As if that was not enough, he gifted me with his presence in my
dissertation defense, leaving his business and his family in Brazil and traveling such a
long distance. I also would like to specially recognize the precious assistance of Dr.
Subrata Mondal and Nicolau Pereira Filho who helped me improve the results of this
work.
I also want to thank the Brazilian community, which I consider to be my
family in Knoxville, for their friendship and support. During this time, many people
have come and gone, but their friendship has always stayed, and also the memories of
the good and bad times as well.
During my stay in the Ph.D. program in Knoxville, I had the opportunity to
meet very nice people from all over the world with whom I exchanged valuable
cultural experiences that helped me to grow as a human being. They are from the
U.S., like Alev and Wesley, from Turkey like Omer and Orkun, from Lebanon like
Ibrahim, from Germany like Claudia, from India and Mexico, like the couple Samuel
and Claudia, from Korea like Dr. Jong-Son Ko and Sewoong Kim, and so many other
people from so many other places.
I would also like to thank my brothers and sisters for their support throughout
my life and particularly during this time in which I was geographically separated
from them. They are Maria, Marinalva, Mauro, Marina, Marlene, Maurilio, Maura,
Mara and Sebastião. Although they were in Brazil, I could still feel their caring
presence all the time.

v
Finally, I would like to thank those who made this journey more enjoyable,
my wife Alexandra, and my son João Vitor. I thank them for being so understanding
of my absence during many moments of their lives due to my work, but I also offer
my apologies for those times.
I would like to recognize the importance of CAPES from Brazil, Universidade
Federal de Mato Grosso do Sul and The Electrical, and Computer Engineering
Department of The University of Tennessee in Knoxville; without their financial
support this work could not have been completed.

vi
DEDICATÓRIA
Esta tese é dedicada aos meus pais
Sr. Benedito Pereira Pinto†
e
Sra. Damiana de Freitas Pinto
que me ensinaram a acreditar e a perseverar.

vii
AGRADECIMENTOS
Antes de fazer qualquer agradecimento, eu gostaria de dizer que isso é muito
difícil para mim, porque sei que não conseguirei expressar, em linguagem escrita, a
minha gratidão às pessoas que foram meus guias, meus amigos, e meu suporte
durante minha jornada no programa de doutorado.
Gostaria de agradecer ao Dr. Jack. S. Lawler. Seu apoio incondicional foi uma
das principais razões para o meu sucesso. Dr. Lawler me mostrou que orientação e
carinho são perfeitamente conciliáveis. Com Dr. Lawler, aprendi não somente os
tópicos interessantes da minha tese, mas tambem a adoção de uma forma prática de
pensar.
Além do Dr. Lawler, agradeço aos demais membros da Banca Examinadora
da minha tese, Dr. J. Milton Bailey, Dr. Paul B. Crilly, Dr. Leon M. Tolbert, Dr. Luiz
E. B. Silva e Dr. Tse-Wei Wang, pela cuidadosa revisão do meu trabalho e pelas
sugestões de melhorias, as quais resultaram nesta tese. Gostaria de agradecê-los ainda
por seus esforços e disponibilidade na revisão deste trabalho em tão curto espaço de
tempo.
Há algumas pessoas, cujo carinho e a ajuda são imensuráveis. Entre elas,
destaco o meu grande amigo Burak Ozipineci, pela sua amizade, discussões técnicas,
cuidadosa revisão dos meus textos e pelo incentivo. Agradeço também ao Dr. Luiz
Eduardo Borges da Silva, meu amigo e também membro da minha Banca de tese; sua
maturidade e seu discernimento me ajudaram a passar por difíceis fases durante o

viii
tempo que permaneci nos Estados Unidos. Como se isso não fosse suficiente, ele me
presenteou com sua participação na minha defesa, deixando sua família e seus
negócios no Brasil e fazendo essa longa viagem do Brasil aos Estados Unidos.
Gostaria também de reconhecer, especialmente, a preciosa assistência do Dr. Subrata
Mondal e do Prof. Nicolau Pereira Filho, os quais me ajudaram a melhorar os
resultados do meu trabalho.
Agradeço também à comunidade Brasileira, extensão da minha família em
Knoxville, pela amizade e apoio. Durante esse tempo, muitas pessoas vieram e muitas
pessoas se foram, mas a amizade deles permanece, e também as lembranças dos bons
e dos difícieis momentos.
Durante minha estada no programa de doutorado em Knoxville, tive a
oportunidade de encontrar excelentes pessoas do mundo todo, com as quais pude
trocar experiências culturais, que me ajudaram a crescer como ser-humano. São
pessoas dos Estados Unidos, como Alev e Wesley; da Turquia, como Omer e Orkun;
do Libano, como Ibrahim; da Alemanha, como Claudia; da Índia e do México, como
o casal Samuel e Claudia; da Corea, como Dr. Jong-Son Ko e Sewoong Kim; e
muitas outras pessoas de muitos outros lugares.
Expresso também minha gratidão às minhas irmãs e aos meus irmãos, pelo
apoio que me deram durante toda a minha vida e, particularmente, durante o período
em que estive geograficamente separado deles. Sao eles, Maria, Marinalva, Mauro,
Marina, Marlene, Maurílio, Maura, Mara e Sebastião. Mesmo estando eles no Brasil,
senti a presença carinhosa de cada um todo o tempo.

ix
Finalmente, minha eterna gratidão àqueles que fizeram minha jornada mais
agradável, minha esposa Alexandra e meu filho João Vitor. Agradeco-os por
entenderem minha ausênica em muitos momentos de suas vidas, por causa do meu
trabalho. Peço-lhes perdão por isso.
Gostaria de reconhecer a importância da CAPES, da Universidade Federal de
Mato grosso do Sul e do The Electrical, and The Computer Engineering Department
of The University of Tennessee, de Knoxville; sem apoio financeiro desses órgãos,
este trabalho não poderia ter sido concluído.

x
ABSTRACT
The scope of this work is the Permanent Magnet Synchronous Machine
(PMSM) operating at Constant Power Speed Range (CPSR). The proposed technique
to drive the PMSM at CPSR is the Dual Mode Inverter Control (DMIC). The main
idea behind DMIC is to change the three-phase operation of the PMSM below base
speed to hybrid, single-phase and three-phase, operation above the base speed. This
technique allows driving the PMSM in a wide CPSR. The DMIC uses three facts to
achieve wide CPSR. First, it introduces the idea of the advance angle, which allows
driving current into the machine while the back-emf is smaller than the DC link
voltage. Second, the blanking angle is used to maximize the electrical to mechanical
power conversion by increasing the on time of the transistors of the Voltage-Fed
Inverter (VFI) and therefore slowing down the decreasing voltage in the outgoing
phase. Finally, this technique avoids regeneration through the bypass diodes by
introducing an ac-voltage controller interfacing the VFI and the PMSM.
The analysis of DMIC/PMSM drive system shows that it uses the same
principle of Vector Control with Field Weakening (VCFW) i.e., the armature current
is controlled to have a field component that weakens the air gap field, and therefore
opposes the back emf. However, the armature current vector must satisfy the voltage
and current constraints, which are the maximum current and armature voltage. In
VCFW, the voltage limit circle shrinks fast as speed increases because the maximum
armature voltage is the maximum output voltage of the VFI, which is limited by the

xi
DC link voltage. In DMIC, on the other hand, the voltage limit circle shrinks slower,
since after the commutation period the machine is operating in single-phase mode.
The total armature voltage is the contribution of the DC link voltage, the back emf,
and the induced voltage provided by the derivative of the on-phase currents. In fact,
this operation eliminates the voltage constraint, and the machine can operate at any
speed, and then the only constraint is the current limit. Therefore, it is shown in this
work that theoretically there is no speed limit for DMIC driving PMSM over constant
power operation range.

xii
PREFACE
Permanent Magnet Synchronous Machines (PMSM) have high efficiency,
high power density, high torque-to-inertia ratio, and fast dynamic response. These
features make this machine very attractive for applications such as: actuators,
robotics, servo drives, etc. Electric Vehicles is another potential application of this
type of machine. However, because of its nature, i.e., constant magnet flux provided
by magnets, these machines have a narrow constant power operation range. This
limitation is a strong drawback for application of PMSM in electric vehicles, where
high speed is a top requirement. This dissertation proposes, describes, evaluates, and
analyzes Dual Mode Inverter Control (DMIC). DMIC is a technique that provides a
wide CPOR for PMSM.
Chapter I Briefly reviews the recent advances in PMSM drive systems, their
advantages and their drawbacks and states the necessity of a scheme that truly can
drive PMSM in wide constant power speed range.
Chapter II presents PMSM models. Initially. it gives the three-phase model of
the PMSM in the stationary frame, which is used in chapter III to describe how DMIC
works. Then, the d-q model of PMSM in rotating frame is given. This model is used
in chapter IV and V for analysis and comparison of Vector Control with Field
Weakening and DMIC.

xiii
Chapter III proposes DMIC driving PMSM. Initially, it describes the Phase-
Advance method (PHA), gives simulations results for PHA driving a low inductance
Brushless DC machine (BDCM) and discusses its limitations doing so. In the
sequence it describes DMIC driving BDCM. The superiority of DMIC compared to
PHA for low inductance BDCM is given and the reason for this superiority is
identified. Finally, in this chapter, DMIC driving PMSM is described. Simulation
results are given and the effectiveness of the DMIC/PMSM drive system is shown.
Analysis showing why DMIC/PMSM drive system has a good performance for
operation above base speed is addressed in Chapter V.
Chapter IV discusses Vector Control with Field Weakening (VCFW) of
PMSM. VCFW is the most popular method of driving PMSM above base speed. The
VC principles driving PMSM is described in details for Constant Torque Operation
Region (CTOR) as well as for Constant Power Operation Region (CPOR). The speed
limit of the CTOR and CPOR is given using the voltage and current constraints. The
system driving a low inductance PMSM is simulated and simulation results are given.
The CPOR is found to be narrow for low inductance PMSM.
Chapter V explains why DMIC works from the machine perspective,
compares DMIC and VCFW, and proves that there is no theoretical speed limit for
CPOR when DMIC drives PMSM. In this chapter, the d-q model of PMSM in
rotating reference frame is used. Analytical expression of the phase currents and
voltages provided by DMIC are given. The d-q currents and voltages are found by
doing the inverse vector rotation of the phase currents and voltages. The average

xiv
values of the pulsating d-q currents and voltages are found. The d-q currents and
voltages of the PMSM controlled by VCFW and by DMIC are plotted in the same
plot in such a way that the two techniques can be compared. The superiority of DMIC
over VCFW with respect to speed limit of CPOR is shown. Finally, the theoretical
speed limit of CPOR is found to be infinity for DMIC driving PMSM.
Chapter IV draws conclusions from the presented work, and gives
recommendations for future research topics.

xv
TABLE OF CONTENTS
CHAPTER PAGE III. INTRODUCTION………………………………………………………. 1 I.1. Background………………..……………………………………… 1 I.2. Objective of the Research………….……………………...……… 7 II. PERMANENT MAGNET SYNCHRONOUS MACHINE MODELS. 9 II.1. Introduction…………..…………………………………………… 9 II.2. PMSM three-phase model………….…………………………….. 10 II.3. PMSM d-q model………………………………………………… 14 II.4. Conclusions……………………………………………………….. 19 III. DUAL MODE INVERTER CONTROL………………………………. 20 III.1. Introduction……………………………………………………….. 20 III.2. PHA driving a BDCM……………………………………………. 21 III.3. DMIC driving a BDCM…………………………………………... 27 III.4. DMIC driving a PMSM…………………………………………... 33 III.5. Conclusion………………………………………………………... 37 IV. FIELD WEAKENING TECHNIQUE FOR PMSM……….…………. 39 IV.1. Introduction……………………………………………………….. 39 IV.2. Vector Control of PMSM………………………………………… 40 IV.3. Analysis of limits of operation of PMSM with Vector Control….. 46 IV.3.1 Voltage and current limits……………………………... 46 IV.3.2 Constant Torque Operation Region…………………… 52 IV.3.3 Constant Power Operation Region…………………….. 55 IV.4 System Description of Vector Control of PMSM with Field
Weakening Operation…………………………………………….. 61 IV.5 Simulation Results of Vector Control of PMSM with Field
Weakening Operation…………………………………………….. 68 IV.6 Conclusions………………………………………………………. 84 V. ANALYSIS OF DUAL MODE INVERTER CONTROL……………. 86 V.1 Introduction……………………………………………………….. 86 V.2 Analytical Equations of the PMSM Armature Phase Currents and
Phase Voltages in DMIC/PMSM System………………………… 87

xvi
CHAPTER PAGE V.2.1 Analytical Equations of the PMSM Armature Phase
Currents………………………………………………... 88 V.2.2 Analytical Equations of the PMSM Phase Voltages…... 99 V.3 Equations of the dq Components of the Armature Current and
Voltage……………………………………………………………. 101 V.3.1 Equations of the dq Components of the Armature
Current………………………………………………… 102 V.3.2 Equations of the dq Components of the Armature
Voltage………………………………………………… 105 V.4 Analysis of PMSM Driven by DMIC Using the PMSM d-q
Model……………………………………………………………... 107 V.5 Limit of Constant Power Operation Range of the PMSM Driven
by DMIC………………………………………………………….. 114 V.6 Conclusions……………………………………………………….. 121 VI. SUMMARY……………………………………………………………… 123 VI.1 Conclusions……………………………………………………….. 123 VI.2 Recommendation for future work………………………………… 125 REFERENCES……………………………………………………….………... 128 APPENDIX…………………………………………………………………….. 135 Simulation Block Diagram……………………………………………….. 136 VITA……………………………………………………………………………. 144

xvii
LIST OF FIGURES
FIGURE PAGE
1.1 Typical phase a current excitation for a Brushless DC motor…………... 3
1.2 Typical phase a current excitation for a Permanent Magnet Synchronous Machine………………………………………………………………….. 4
2.1 PMSM three-phase model……………………………………………….. 10
2.2 Phasor diagram showing abc and dq reference frames………………….. 16
2.3 d-q equivalent circuit in synchronously rotating frame (I)...……………. 18
3.1 Standard VFI…………………………………………………………….. 21
3.2 Gate signal For Q1 and Q4 in the phase advance method………………... 23
3.3 Current in phase a, transistor Q1 and Diode D1 for n=5 and θa = 50°…… 25
3.4 Instantaneous total power, phase a power, and power flowing through the phase a transistors and diodes for n=5 and θa = 50°………………… 26
3.5 Inverter Topology for the DMIC………………………………………… 28
3.6 Firing scheme for motoring mode of DMIC driving a BDCM………….. 30
3.7 Current in phase a, transistor Q1 and Q4 and Diode D1 and D4 for n=5, θa = 36.6°, θb = 20°…………………………………………………….. 32
3.8 Instantaneous total power, phase a power (transistors) for n=5, θa = 36.6°, θb = 20°……………………………………………………… 32
3.9 Firing scheme for motoring mode of DMIC driving a PMSM………….. 35
3.10 Current in phase a, transistor Q1 and Diode D1 for n=5, θa = 42°, θb = 20°………………………………………………………………….. 36
3.11 Instantaneous total power, phase a power (all flowing through the transistors) for n=5, θa = 42°, θb = 20°…………………………………... 37
4.1 d-q equivalent circuit in synchronously rotating frame (II)..……………. 41
4.2 Phasor diagram showing the variables of the d-q model of the PMSM…. 43
4.3 Normalized current limit circle in the synchronously rotating reference frame……………………………………………………………………... 47
4.4 Voltage limit circles in the synchronously rotating reference frame……. 51

xviii
FIGURE PAGE
4.5 Current circle limit and voltage limit circle for PMSM drive system…… 52
4.6 Armature current trajectory for vector control of PMSM operating in CTOR……………………………………………………………………. 53
4.7 Armature current trajectory for vector control of PMSM operating in CPOR with id=0………………………………………………………….. 56
4.8 Armature current trajectory for vector control of PMSM operating in CPOR with field weakening……………………………………………... 57
4.9 Maximum torque-speed and power-speed envelope…………………….. 61
4.10 System description of VC of PMSM with closed loop speed control…… 62
4.11 Command and actual rotor speeds at base speed (2600 rpm)…………… 71
4.12 Load and developed torque at base speed (2600 rpm)…………………... 71
4.13 Machine output power at base speed (2600 rpm)……………………….. 72
4.14 id and iq components of the armature current at base speed (2600 rpm) 72
4.15 Command and actual rotor speeds at critical speed (3198 rpm)………… 74
4.16 Load and developed torque at critical speed (3198 rpm)………………... 74
4.17 Machine output power at critical speed (3198 rpm)…………………….. 75
4.18 id and iq components of the armature current at critical speed (3198 rpm) 75
4.19 Command and actual rotor speeds at 50% above base speed (3900 rpm). 77
4.20 Load and developed torque at 50% above base speed (3900 rpm)……… 77
4.21 Machine output power at 50% above base speed (3900 rpm)…………… 78
4.22 id and iq components of the armature current at 50% above base speed (3900 rpm)……………………………………………………………….. 78
4.23 Command and actual rotor speeds at 3 times base speed (7800 rpm)…… 79
4.24 Load and developed torque at 3 times base speed (7800 rpm)………….. 80
4.25 Machine output power at 3 times base speed (7800 rpm)………………. 80
4.26 id and iq components of the armature current at 3 times base speed (7800 rpm)……………………………………………………………………… 81
4.27 Rotor speed dynamic response of the system……………………………. 82
4.28 Load and developed torque during machine acceleration……………….. 83

xix
FIGURE PAGE
4.29 Machine output power during machine acceleration……………………. 83
4.30 iq and id behavior during machine acceleration………………………….. 84
5.1 DMIC driving a PMSM…………………………………………………. 89
5.2 DMIC driving a PMSM during commutation period…………………… 91
5.3 Line-to-line Back emf waveform with respect to the reference at DMIC/PMSM system……………………………………………………. 92
5.4 DMIC driving a PMSM after commutation period……………………… 96
5.5 Armature phase currents for the machine operating at 5 times base speed 98
5.6 Armature phase voltages for the machine operating at 5 times base speed……………………………………………………………………... 101
5.7 id and iq currents for the machine operating at 5 times base speed……… 105
5.8 vd and vq voltages for the machine operating at 5 times base speed…….. 107
5.9 Current and voltage limits of the PMSM using DMIC and VCFW for machine operating at twice the base speed………………………………. 112
5.10 Current and voltage limit of the PMSM using DMIC and VCFW for machine operating 5 times base speed…………………………………... 113
5.11 Current and voltage limits of the PMSM using DMIC and VCFW for machine operating 9 times the base speed………………………………. 114
5.12 Minimum radius of the voltage limit circle for PMSM to develop rated power…………………………………………………………………….. 116
5.13 Voltage radius provided by DMIC, VCFW, and the minimum radius….. 118
5.14 Actual and fitting function of the voltage limit radius provided by DMIC……………………………………………………………………. 120

xx
LIST OF TABLES
TABLE PAGE
3.1 Drive system parameters………………………………………………… 24
4.1 Drive system parameters – VCFW……………………………………… 69
5.1 Average Values of Voltages and Currents………………………………. 110

xxi
LIST OF SYMBOLS∗
λabc Total flux linkages in phases a, b and c
ia, ib, ic Phase currents
van, vbn, vcn Terminal phase to neutral voltages
R Winding resistance per phase
Ls Self-inductance per phase
M Mutual inductance
φa Phase flux linkages established by the permanent
magnets
φm Amplitude of the flux linkages established by the
permanent magnet
N0 Power supply neutral point
N1 PMSM neutral point
P Number of pole pairs
ωe Electrical speed
ωr Angular speed of the rotor
Te Electromagnetic torque
TL Load torque
B Damping constant
∗Symbols are given in order of appearance

xxii
J Rotor inertia
fan, fbn, fcn Phase variables in the abc stationary frame
fd, fq, f0 Variables in the dqo rotating reference frame
Q1 ~ Q6 Voltage fed inverter main devices
D1 ~ D6 Anti-parallel diodes of Q1 ~ Q6
Vdc DC link voltage
ean, ebn, ecn Phase to neutral back-emf
Prated Machine rated power
Nb Mechanical base speed in rpm
fb Base frequency in Hz
Eb Peak phase-to-neutral back-emf at base speed
Irated (peak) Rated peak current of the inverter devices
Irated (rms) Rated rms current of the inverter devices
n Actual speed to base speed ratio
T1 ~ T6 AC voltage controller thyristors
θb Blanking angle
θa Advance angle
θc Commutation angle
θd Delay angle
∆θe Difference between θa and θd
vq Quadrature component of the PMSM terminal
voltage

xxiii
vd Direct component of the PMSM terminal voltage
iq Quadrature component of the PMSM current
id Direct component of the PMSM current
Imax Maximum stator current
m PWM modulation index
V* Peak value of the fundamental voltage generated by
the PWM modulator
V1sw Peak value of the fundamental voltage at square-
wave operation
Va Amplitude of the applied armature voltage
Vmax Maximum amplitude of the applied armature voltage
ωrb Base speed
ωrc Critical speed
ωr* Rotor speed command
KωI Integral constant for the rotor speed controller
KωP Proportional constant for the speed controller
KqI Integral constant for the iq controller
KqP Proportional constant for the iq controller
KdI Integral constant for the id controller
KdP Proportional constant for the id controller
iq* iq command
id* id command

xxiv
0 0,q dv v Decoupling voltages
vqc Compensated value of vq
vdc Compensated value of vd
fs PWM switching frequency
Ts PWM sample time
k Load constant
eab Line-to-line back emf
Iq Average value of iq
Id Average value of id
Vq Average value of vq
Vd Average value of vd
VR-DMIC Voltage circle limit radius provided by DMIC
VR-VCFW Voltage circle limit radius provided by VCFW
VRn Minimum voltage circle limit radius at n times base
speed

1
CHAPTER I
INTRODUCTION
I.1 Background
Permanent magnet AC machines (PMAC) are becoming more and more
popular because of their high efficiency, high power density, and high torque-to-
inertia ratio. The efficiency of the PMAC is high because no excitation winding is
used since the air gap magnetic flux is provided by the permanent magnets. The high
density and the high torque-to-inertia ratio are achieved when rare-earth magnet
materials are used. Fast dynamic response is another feature that makes this machine
attractive for applications such as actuators, robotics, and servo drives. The electric
vehicle is another potential application for this type of machines, mainly because of
their appealing efficiency, which is a top requirement for battery or fuel-cell supplied
vehicles. These machines are synchronous type machines and therefore their
excitation frequency (stator frequency) must be perfectly synchronized with their
rotational frequency (rotor speed). PMAC machines may or may not have auxiliary
rotor windings. If auxiliary rotor windings are provided, these machines can be easily
controlled, since they start as an induction machine, and after the rotor frequency gets
close to the excitation frequency, it is pulled into synchronism by a combination of
the reluctance and synchronous motor torques provided by the magnets [1]. However,

2
the auxiliary rotor windings decrease the efficiency, the power density, and the
torque-to-inertia ratio of the PMAC. The dynamic response is also affected by the
auxiliary rotor windings. For that reason, PMAC without auxiliary rotor windings is
generally desired. However, the absence of the auxiliary rotor windings makes the
control of PMAC complex and power electronics is essential to achieve perfect
rotational-excitation synchronization and to generate useful steady-state torque [2]. In
the past few years, many researchers have put much effort on this subject. In general,
their research involve selecting permanent magnet materials, designing machine
configurations [3], achieving motor and drive physical integration [4], using
sensorless PMAC control [5], [6], developing PWM techniques for controlling
PMAC machines, and so forth.
With respect to the back-EMF shape, the PMAC machine can be classified
into two types: trapezoidal back-EMF, which is also known as Brushless DC machine
(BDCM), and sinusoidal back-EMF, known as Permanent Magnet Synchronous
Machine (PMSM). The back-EMF shape will result in different rules for their motion
control. For instance, the BDCM must be excited with a six-step switched current in
order to develop almost constant torque. Figure 1.1 shows a typical phase a current
excitation waveform for a three-phase BDCM. There is a 120° conduction angle in
both positive and negative half-cycle, meaning that in BDCM only two phases are on
at a time, which characterizes single-phase operation. The b and c phase current
excitation waveforms are respectively 120° and 240° phase shifted with respect to
phase a. A PWM technique is then used to control the amplitude of the current wave,

3
120°
Time
0
i
Fig. 1.1 Typical phase a current excitation for a Brushless DC motor
and consequently control the torque magnitude. The hysteresis band PWM current
control is the most accepted PWM control for this type of machine [1]. On the other
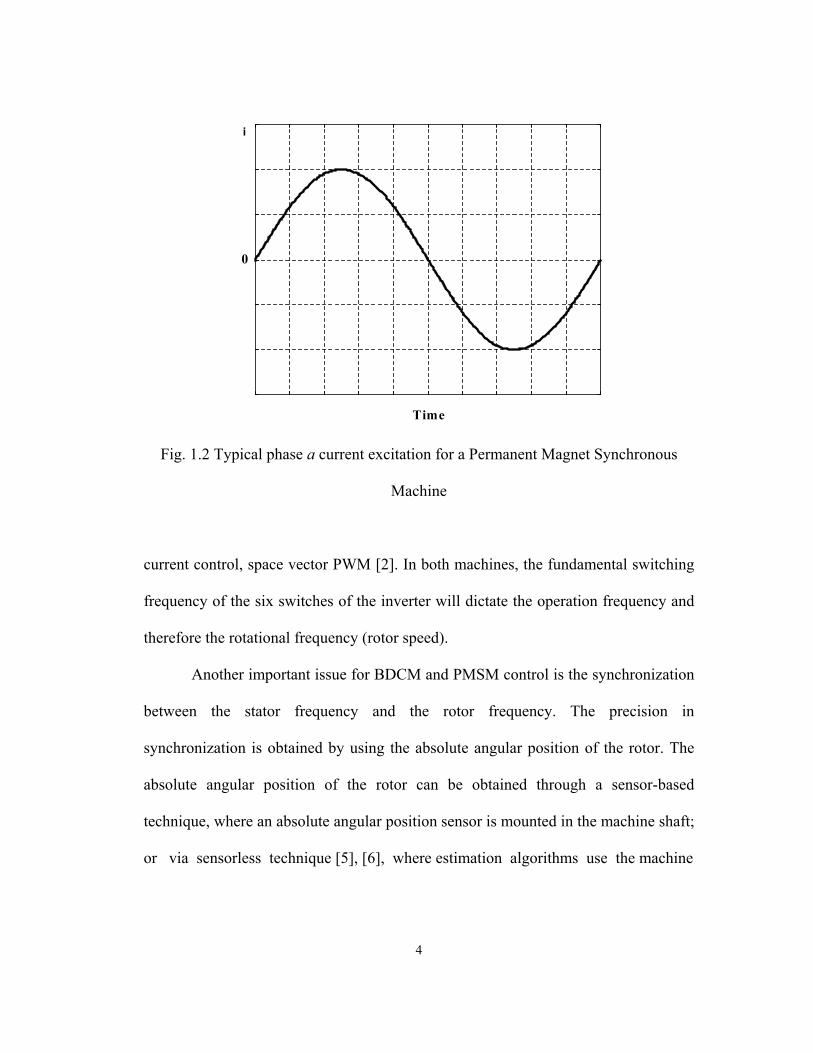
hand, the PMSM must be excited with a sinusoidal current. Figure 1.2 shows a typical
phase a current excitation waveform for a three-phase PMSM. Notice that in this type
of machine there is 180° conduction angle in both positive and negative half-cycle,
i.e., the three phases are on all the time, which characterizes three-phase operation.
The b and c phase current excitation waveforms are respectively 120° and 240° phase
shifted with respect to phase a. Again, a PWM technique is used to control current
amplitude and consequently to control the torque magnitude, and to eliminate the low
order harmonics and therefore to make the torque smooth. Among many PWM
techniques used for this type of machine are: sinusoidal PWM, hysteresis band PWM
4
Time
0
i
Fig. 1.2 Typical phase a current excitation for a Permanent Magnet Synchronous
Machine
current control, space vector PWM [2]. In both machines, the fundamental switching
frequency of the six switches of the inverter will dictate the operation frequency and
therefore the rotational frequency (rotor speed).
Another important issue for BDCM and PMSM control is the synchronization
between the stator frequency and the rotor frequency. The precision in
synchronization is obtained by using the absolute angular position of the rotor. The
absolute angular position of the rotor can be obtained through a sensor-based
technique, where an absolute angular position sensor is mounted in the machine shaft;
or via sensorless technique [5], [6], where estimation algorithms use the machine

5
terminal voltage and current waveforms as inputs to obtain the rotor position. The
difference between BDCM and PMSM in the rotor position requirement comes from
the nature of the back-emf shape. In a trapezoidal back-emf, the required rotor
position signal is discrete, every 60° interval, which makes the synchronization much
simpler and requires less resolution of the rotor position signal. The sinusoidal back-
emf on the other hand, requires feedback of a continuous rotor position signal and
therefore high resolution in such signal is required.
Although much research is being conducted in order to improve the
inverter/machine overall performance, the control of BDCM and PMSM at low speed
is well understood [1], [7]. However, in both, BDCM and PMSM, the back-EMF
magnitude increases linearly with the rotor speed and consequently after the back-
EMF amplitude reaches the same value as the DC link voltage, at so called Base
Speed, the current cannot be controlled any longer. Until this point the machine is
said to be in the constant torque operation region. At this speed the inverter output
voltage has reached its maximum value and so has the machine developed power.
From this point on, the machine is said to be operating in constant power range.
Unfortunately, the constant power range, without the use of any special control
strategy, is very narrow and maximum speed is low if the rated current cannot be
exceeded [8]. However, high-speed operation capability is a very important feature
especially for electric vehicle applications [9]. Vector control, with so-called field
weakening technique (VCFW), can make the constant power speed range wider by
introducing a field current component (id) in the stator current [10], [11], [12].

6
However, this technique requires d-q transformation, and although it can readily be
applied to sinusoidal back-emf type of machine (PMSM), it cannot be directly applied
to the trapezoidal back-emf type (BDCM). Fourier series can be applied to the square-
wave in order to decompose it into sine waves and then apply the d-q transformation,
but this increases the signal processing complexity [13].
Vector Control of PMSM is well-understood and largely accepted for the
operation below base speed. In this operation region, the machine is controlled to
operate with optimum torque/ampere ratio. To achieve this operation condition, the
field component of the armature current id is controlled to be zero, and therefore the
armature current is only composed of the torque component iq. Beyond the base
speed, the optimum torque/ampere ratio is no longer a priority. The priority is to
accomplish the widest possible constant power operation range. The id component is
then controlled to be negative and therefore produces flux that weakens the air gap
flux, which in the constant torque operation range is only provided by the permanent
magnets. However, the flux produced by the id current is also proportional to the
inductance of the machine, and if the inductance is low, the id current must be really
large in order to effectively oppose permanent magnet flux. Therefore, in order for
the armature current not to exceed the current limit of the drive system, the current iq
must decrease as id increases, which makes the developed torque smaller than the
torque at the rated power. In other words, in the field weakening technique, the speed
range is machine parameter dependent, i. e., the maximum speed is proportional to

7
the machine inductance, and therefore a low inductance machine will have a low
speed limit.
Another technique proposed to overcome the low speed limit is Phase
Advance Method (PHA) [14]. This technique was proposed only for BDCM and it is
successful only for a high inductance BDCM.
I.2 Objective of the Research
Recently, the Dual Mode Inverter Control (DMIC) [9] has been proposed to
drive a BDCM over a wide constant power speed range. This method was shown to
be effective in driving both low and high inductance machines. The objective of this
work is to analyze the DMIC and to show its feasibility for driving the PMSM. It is
also an objective of this work to compare the performances of DMIC and VCFW
driving PMSM above the base speed with respect to their constant power operation
range widths.
Initially in this work, the PMSM is modeled. In the sequence, the PHA
method is analyzed. Simulation results are given and the reasons of its failure driving
a low inductance BDCM are pointed out. Then, the DMIC driving a BDCM is
addressed. The similarities and differences between this method and PHA are
presented. The effectiveness of DMIC/BDCM drive system regarding the width of the
constant power operation range is shown through simulation results. The DMIC
concept is extended to PMSM machines and simulation results are given. Next,

8
description, analysis and simulation of the Vector Control (VC) technique with Field
Weakening are given. Finally, the explanation of DMIC driving PMSM using dq
model of PMSM is given and the derivation of the theoretical limit of the CPSR for
the PMSM driven by DMIC is done. Comparison between DMIC and VCFW
concerning the capability of driving low inductance PMSM in a wide constant power
operation range is also given. The results of this comparison show the superiority of
DMIC over VCFW.

9
CHAPTER II
PERMANENT MAGNET SYNCHRONOUS MACHINE MODELS
II.1 – Introduction
Regarding excitation, Permanent Magnet Machines can be classified into two
groups: Trapezoidal back-EMF (BDCM) and sinusoidal back-EMF (PMSM). This
difference in the back-EMF waveform dictates a different control strategy for each
machine. This work is concerned about the sinusoidal excitation machine control in
constant power operation range. Therefore, the objective of this chapter is to present
two models for the surface-mounted three-phase PMSM to give theoretical support
for the proposed control strategy. First, a three-phase (a, b, c) PMSM model in the
stationary reference frame is presented. In sequence, a three-phase in stationary frame
to two-phase in the synchronously rotating reference frame transformation is applied,
and the two-phase PMSM model in the rotating reference frame is obtained. The
importance of these two models lies in the fact that the three-phase model in the
stationary frame allows us to show the theory behind the Dual Mode Inverter Control
(DMIC) from the converter point of view while the two-phase model allows us to
show the theory behind the DMIC from the machine point of view.

10
II.2 – PMSM three-phase model
Figure 2.1 shows the PMSM three-phase model. Equation 2.1 describes this
model [15].
( , )
0 0( , ) 0 0
0 0( , )
a abc r
a anb abc r
b bn
c cnc abc r
d idt R i v
d i R i vdt
R i vd idt
λ θ
λ θ
λ θ
= − +
(2.1)
a
tφ∂∂
b
tφ∂∂
c
tφ∂∂
+
van
vbn
vcn
R
R
R
LS
LS
LS
M
M
M
+
+
+ -
-
- +
+ -
-
-
N0 N1
ib
ia
ic
Fig. 2.1 PMSM three-phase model

11
where:
λabc – flux linkages
ia, ib, ic – phase currents
θr – rotor position
R – winding resistance per phase
van, vbn, vcn – terminal phase to neutral voltages
The flux linkages are given by:
a s a a
b s b b
c s c c
L M M iM L M iM M L i
λ φλ φλ φ
− − = − − + − −
(2.2)
where:
Ls – Self-inductance per phase
M – Mutual inductance
φa – phase flux linkages established by the permanent magnets
The phase flux linkages established by the permanent magnets are:

12
cos( )2cos( )34cos( )3
m ra
b m r
cm r
P
P
P
φ θφπφ φ θ
φ πφ θ
= − −
(2.3)
where:
φm - is the amplitude of the flux linkages established by the permanent
magnet
P – number of magnetic pole pairs
Since the neutral points are isolated, the node equation in any of the neutral
points N0 or N1 is:
0a b ci i i+ + = (2.4)
Making:
sL L M= + (2.5)
Then, combining Equations 2.2, 2.3, 2.4 and 2.5, the flux linkage equations
become:

13
cos( )0 020 0 cos( )3
0 0 4cos( )3
m ra a
b b m r
c cm r
PL iL i P
L i P
φ θλπλ φ θ
λ πφ θ
= + − −
(2.6)
Finally, substituting Equation 2.6 in Equation 2.1 and rearranging it, the phase
equations are obtained as given below:
sin( )0 0 0 020 0 0 0 sin( )3
0 0 0 0 4sin( )3
r m ran a a
bn b b r m r
cn c cr m r
P Pv R i L idv R i L i P Pdt
v R i L i P P
ω φ θπω φ θ
πω φ θ
= + − − −
(2.7)
The relationship between rotor speed ωr and stator speed ωe, and rotor
position θr and stator position θe respectively are:
e er rand
P Pω θω θ= = (2.8)
Equation 2.4 shows that the currents sum to zero, therefore only two of the
three equations above are independent and a second order model can be derived.
Equation 2.9 shows the second order model of the PMSM [9].

14
( )sin( )2 2
4sin2 2 3
r m rab a a
r m rcb c c
P Pv i iR R L L dP Pv i iR R L L dt
ω φ θπω φ θ
= + − − (2.9)
where vab and vcb are the line-to-line armature voltages
The mechanical dynamics of the PMSM are given by:
( )e L rr T T Bddt J
ωω − −= (2.10)
rr
ddtθ ω= (2.11)
where
Te – electromagnetic torque
TL – load torque
B – damping constant
J – rotor inertia
II.3 – PMSM d-q model
In this section a two-phase model of the PMSM in synchronously rotating
reference frame is presented. This model is obtained by applying the Park

15
Transformation [15] to the three-phase model presented in section 2.1. This
transformation is a mathematical tool that maps the three-phase coupled variables in
the stator reference frame into three orthogonal (decoupled) variables in any
reference frame. In some specific cases, for example, the isolated wye connected
PMSM, one of the three orthogonal components becomes zero, and therefore the
transformation becomes a three to two phase transformation. It is convenient to
choose the synchronous frame as the new reference frame because the sinusoidal
three-phase variables of the stationary frame become DC quantities and this makes
the analysis simpler.
Equation 2.12 shows a transformation matrix that maps three-phase variables
in stationary frame to three-phase variables in any other reference frame.
( ) ( )( ) ( )
0
2 2cos cos cos3 32 2 2sin sin sin3 33
1 1 12 2 2
q an
d bn
cn
f ff ff f
π πθ θ θ
π πθ θ θ
− + = − +
(2.12)
In this transformation, f is the variable that undergoes transformation. The
variables fan, fbn, and fcn are the phase variables in stationary frame. The variables fd,
fq, and f0 are variables in the new reference frame. Figure 2.2 shows the phasor
diagram illustrating the abc and dq reference frames. The three new axes quadrature
(q), direct (d) and zero sequence component (0) are simultaneously orthogonal, where

16
q-axis and d-axis are in the same plane as an, bn and cn axis while 0 axis is
perpendicular to that plane. If the sum of fan, fbn, and fcn is zero, then the 0-axis
component is zero and the transformation becomes a three-phase to two-phase
transformation. In Equation 2.12, the angle θ represents the angle between the q-axis
and the an-axis as shown in the phasor diagram in Figure 2.2.
As noted above, the transformation given in 2.12 is a generic transformation,
i.e., it maps variables from the stationary frame to a new reference frame, which is
displaced by θ, and θ-π/3 angles from that of the old frame. The new reference frame
is defined by the value of θ. For instance, if the angle θ is made constant and is equal
to zero, then the two-phase machine model is in the stationary frame. If the angle θ
varies at the rate of the synchronous speed, then the two-phase machine model is in
the synchronously rotating frame.
θ
fq
fd
fan
fbn
fcn
Fig. 2.2 Phasor diagram showing abc and dq reference frames

17
The two-phase machine model at the synchronously rotating frame is obtained
by applying the transformation given by Equation 2.12, in the three-phase model at
the stationary rotating frame with etθ ω= . The two-phase machine model in
synchronously rotating frame is then given by Equation 2.13.
0 0
r rd dq r m
q qdr r
d dP L R L P L R Li iv P edt dti iv d dR L P L R L P L
dt dt
ω ωω φ
ω ω
+ + = + = +
+ +
(2.13)
where e is the back-emf.
Notice that this is a model for a surface mounted permanent magnet machine,
and therefore the direct-axis inductance and the quadrature-axis inductance are equal
and their value is equal to the sum of the self-inductance per phase Ls and the mutual
inductance M, i.e., the same as given in Equation 2.5.
Neglecting rotational losses, the electromagnetic torque is then given by:
32e m qT P iφ= (2.14)
The mechanical variables do not undergo transformation, therefore the
mechanical dynamics are the same as given in Equations 2.9 and 2.10.
Figure 2.3 shows the two-phase machine model in the synchronously rotating
frame.

18
R L
vq
+
-
+
+
-
- Pωr Lid
iq
e
(a) q-axis equivalent circuit
R L
vd
+
+
-
- PωrLiq
id
(b) d-axis equivalent circuit
Fig. 2.3 d-q equivalent circuit in synchronously rotating frame (I)

19
II.4 – Conclusions
This chapter presented the three-phase model of PMSM in the stationary reference
frame and the dq model of PMSM in the rotating reference frame. The three-phase
model of PMSM will be used in the next chapter to help describe DMIC driving a
PMSM. The d-q model of PMSM will be used to describe and to analyze vector
control with field weakening of PMSM in Chapter IV, and also to explain why DMIC
works in Chapter V.

20
CHAPTER III
DUAL MODE INVERTER CONTROL
III.1 – Introduction
As discussed in Chapter 1, the problem in driving a permanent magnet
machine above base speed is that the back-emf increases above the DC bus voltage
and therefore no current can be driven into the machine. If current is not driven into
the machine, no electrical to mechanical energy conversion is possible. Therefore, the
target of any scheme to drive this type of machine above base speed is to find a way
to drive current into the machine in order to make the electrical to mechanical energy
conversion.
The Dual Mode Inverter Control (DMIC) is a control technique that allows
operation of the Permanent Magnetic Machine over a wide constant power speed
range. This technique was proposed by Lawler et al. [9] and is well described to
drive a Brushless DC motor (BDCM). However it seems to be feasible for Permanent
Magnet Synchronous Machine (PMSM) as well. The aim of this chapter is to describe
the DMIC and to show its effectiveness driving a PMSM. Initially, Phase Advanced
Method (PHA) driving a BDCM is described and simulation results are given. The
description of PHA and the analysis of its drawbacks help to explain the DMIC
strategy. In the sequence, DMIC driving BDCM is described and simulated. The

21
performances of PHA and DMIC driving a BDCM regarding their capability of
driving low inductance BDCM withou exceeding the current limit, are analyzed and
compared. Then the concept of DMIC is extended to PMSM, and finally some
simulation results are given showing its feasibility.
III.2 – PHA driving a BDCM
The so-called Phase Advanced Method [14] was developed to drive a BDCM
over a wide constant power operation region (CPSR). This technique uses a standard
voltage-fed inverter topology as shown in Figure 3.1.
Vdc
D1 Q3 Q5
Q4 Q6 Q2
D3 D5
D4 D6 D2
Q1
Fig. 3.1 Standard VFI [14]

22
Figure 3.2 shows typical gate signals to fire the transistors Q1 and Q4 in the
PHA method. The back-emf for phase a (ean) is also shown in this figure. The
transistor control pulses are θa radians ahead of the instant that phase to neutral back-
emf ean reaches its maximum value. The angle θa is called Advance Angle and is
defined as the angle between the instant that a transistor is turned on and the point
where the phase to neutral back-emf related to that transistor reaches its maximum.
For instance, Figure 3.2 shows the advanced angle between the instant that the
transistor Q1 is turned on and the instant that phase to neutral back-emf ean reaches its
maximum positive value. This figure also shows the advance angle for the transistor
Q4 and the time that ean reaches its minimum. The gate signals for the transistor in
phase b and c are similar to those for phase a, the difference is 120° and 240° delay
for phases b and c respectively. The pulse width of each transistor is 120°.
Below base speed, θa is zero and the power driven into the machine
(developed torque) is controlled by any PWM method, such as hysteresis current
control. However as the speed increases toward the base speed, the PWM controllers
start to saturate, meaning that the current cannot be controlled anymore since the
back-emf has reached the same value as the DC bus voltage. In other words, current
cannot be driven into the machine any longer. The Phase Advance Method uses the
fact that during transition from the negative flat portion of back-emf to its positive flat
portion, and vice-versa, the back-emf assumes values that are momentarily smaller
than DC bus voltage in absolute value. Therefore, the PHA technique makes the

23
ean
ean
θ a
θ a Angle
V
V
120o
120o
Q 1
Q 4
Fig. 3.2 Gate signal for Q1 and Q4 in the phase advance method [14]
advance angle different from zero, i.e., the transistors are fired while the back emf is
smaller than Vdc, and during this time a large amount of current can be driven into
the machine and power can be developed. This technique has two main drawbacks:
first, the current increases too much and its overall performance is poor. The second
is the negative current that passes through the bypass diodes, caused by the high value
that the back-emf assumes at high speed. At this point the voltage is positive and the
current is negative, i.e., during this time the power is flowing back from the machine
to the power supply. Therefore, the three phases will be conducting all the time, and
the machine loses the single-phase operation mode that it had below base speed. The

24
problem with that is that each phase will be operating in both motoring and
regenerating mode. Therefore, for a low inductance machine, the motoring and
regenerating currents must be much larger than the rated current in order to develop
rated motoring power.
As an example of the PHA performance, consider inverter/machine system
parameters given in Table 3.1.
The system described in Table 3.1 operating at 5 times base speed 5r
rb
NnN
= =
,
Table 3.1 Drive system parameters
=============================================================
DC-link voltage: 162 V
Brushless DC motor: Prated = 49.5 hp (36,927 Watts), 12-pole, ORNL
Base Speed: Nb = 2600 rpm
Base frequency: fb = 260 Hz
Peak phase-to-neutral back-emf at base speed: Eb = 74.2 V
Stator resistance: Rs = 0.0118 Ω
Stator inductance: Ls = 61.8 µH
Stator mutual inductance: M = 11.8 µH
Rated peak current: Irated (peak) = 249 A
Rated rms current: Irated (rms) = 203.3 A
=============================================================

25
using the PHA method results in current waves given in Figure 3.3. Instantaneous
total power, power developed in phase a, power flowing through phase a transistors,
and power flowing through phase a diodes are given in Figure 3.4. Notice that in
order to develop the rated power, the phase a current peak is close to 900 A and the
rms current is around 600 A, while the rated peak and rms currents are 249A and
203.3 respectively. From Figure 3.4, one can see clearly that during certain period of
time the machine is regenerating, and therefore much more motoring power must
flow to the machine in order for the net power/cycle to be the motoring rated power.
In other words, the system is operating in a very low power factor.
Fig. 3.3 Current in phase a, transistor Q1 and Diode D1 for n=5 and θa = 50°

26
Fig. 3.4 Instantaneous total power, phase a power, and power flowing through the
phase a transistors and diodes for n=5 and θa = 50°
The increase in current causes two problems. First, the switching device
current ratings must be increased. The second problem is related to electrical losses,
which are proportional to the square of the current, i.e., a substantial increase in the
current will lead to an even more substantial increase in the electrical losses. These
are the two main facts that make the PHA method not viable for low inductance
BDCMs.
The performance of the PHA can be improved if a high inductance BDCM is
used. If only a low inductance machine is available, then external inductances can be

27
inserted in series with the BDCM, but this will require increases of the Vdc because of
the voltage drop in the external inductances, and it will also make the whole system
bulky. Because of the voltage level sensitivity of the PHA method, its application for
electrical vehicles is difficult.
III.3 – DMIC driving a BDCM
The PHA method described in the previous section is not effective in driving a
low inductance BDCM in the high speed, constant power range. The main problem
with this method is the bypass diodes of the conventional VFI. Below base speed the
voltage potential of the idling phase voltage is always smaller in absolute value than
the positive or negative rails of the dc supply. Therefore, after the commutation
period, the bypass diodes are reverse biased, and the transistors as well as the bypass
diodes in the idling phase are off, which configures a single-phase operation.
However, above base speed the voltage potential of the idling phase is greater in
absolute value than either the positive rail or the negative rail of the dc supply.
Consequently, the bypass diodes in the idling phase are forward biased. As a result,
there is not an idling phase at any time, i.e., each phase current in the motor is
contributing both motoring and regenerating power. If the motor inductance is low,
then the current magnitude for both motoring and regenerating components are much
larger than the rated current.

28
The DMIC controller works in the direction of avoiding the forward biasing of
the bypass diodes [9], i.e., keeping the single-phase operation of the BDCM also
above base speed. In order to achieve that, the converter configuration as well as the
control (firing scheme) is different from those of the PHA controller. Figure 3.5
shows the inverter topology used by the DMIC.
The configuration of the converter in DMIC method is basically a standard
VFI, connected to a thyristor-based ac voltage controller. The output of the thyristor-
based ac voltage controller is then connected to the BDCM. The principal function of
the thyristor-based ac voltage controller is to avoid the forward biasing of the bypass
T1
T4 T3
T5 T6
T2
Vdc
D1 D3
Q5
D5
D2
Q1 Q3
Q2 Q6
D6
Q4
D4
a
b
c
Fig. 3.5 Inverter Topology for the DMIC [9]

29
diodes, i.e., once the phase currents in the outgoing phase reach zero, the thyristor
shuts off independent of the voltage potential of this phase. Therefore, there will be
no regeneration through this phase, and the single-phase operation of the BDCM is
assured.
Figure 3.6 shows the firing scheme for the motoring mode of the DMIC. The
gate signals to fire the switches in phase a, i.e., transistors Q1 and Q4, and thyristors
T1 and T4, are shown.
Notice that in the DMIC a firing sequence is required for both transistors and
thyristors. The firing sequence is similar to the sequence for PHA method, but the
advance angle is defined relative to phase-to-phase back emf and dc supply voltage
crossing point. In contrast to the PHA method, where each transistor always conducts
120o, in the DMIC the transistor conduction interval can vary from 1200 to 1800. The
conduction interval is controlled by the blanking angle θb. The main reason to use a
variable conduction interval is to maximize the electrical to mechanical power
conversion above base speed. This maximization is achieved because during the
commutation time, the phase current in the outgoing phase may be large, but
decreasing in magnitude because the back-emf is now higher than Vdc. But, although
the phase current is decreasing, it is contributing in a large amount to motoring power
(both, high current and voltage have the same sign). If the transistor is turned off, i.e.
θb=60°, the current of the outgoing phase will commutate to the bypass diode of the
opposite transistor and the opposite rail voltage will then be applied to the machine.

30
V
T1
Vdceab
θ a
V eab
θ a60o
Vdc
Q 1
V eab
T4
180o - θ b
-Vdc
θ a
Angle
V eab 60o
-Vdc
Q4
θ a
180o - θ b
Fig. 3.6 Firing scheme for motoring mode of DMIC driving a BDCM [9]

31
This commutation will make the voltage difference between the machine back-emf
and the inverter voltage higher, and therefore current will decrease very fast. If the
transistor is allowed to be on for a long period, i.e. θb<60°, the same rail voltage will
be applied to the machine, the voltage difference between the machine back-emf and
the inverter voltage will be lower, and as a result, the phase current will decrease
slower. Therefore, the period with high voltage and high current will be enlarged and
the outgoing phase will contribute to the electrical to mechanical power conversion
longer, increasing the overall performance of the system at a few rms amperes
increasing cost. However, it is very important that at speeds slightly above base speed
that the blanking angle does not decrease to very small values. At these speeds the
back-emf is slightly bigger than Vdc and if the blanking angle is too small a
commutation failure may occur, i.e., the current may not reach zero and commutation
will not happen.
In order to compare DMIC with the PHA, the same drive system (Table 3.1)
was simulated using DMIC at 5 times the base speed (n=5). Figure 3.7 shows the
phase a current, phase a back-emf, current flowing through the transistors in phase a,
and current flowing through the bypass diodes in phase a. Notice that in order to
develop the rated power the phase a current peak is 271 A and the rms current is
191.6 A, while the rated peak and rms currents are 249A and 203.3 respectively. The
current through the diode is zero, i.e., the period with regenerating power was
effectively avoided by the ac-voltage controller. Instantaneous total power and power
developed in phase a are given in Figure 3.8.

32
Fig. 3.7 Current in phase a, transistor Q1 and Q4 and Diode D1 and D4
for n=5, θa = 36.6°, θb = 20°
Fig. 3.8 Instantaneous total power, phase a power (transistors) for
n=5, θa = 36.6°, θb = 20°

33
III.4 – DMIC driving a PMSM
In Section III.3, DMIC was proven to be effective driving a low inductance
BDCM. It was shown in the previous section that three factors are vital for the DMIC
effectiveness; two are related to the firing scheme and one is related to the inverter
topology. The first related to the firing scheme is the advance angle, which allows
current to be driven into the machine during the time the phase back-emf is smaller
than DC link voltage Vdc. The second related to the firing scheme is the blanking
angle, which maximizes the power conversion process by increasing the on time of
the transistors and therefore slowing the rate of decrease of the current in the outgoing
phase. The factor related to the inverter topology is the reversed blocking capability
given by ac-voltage controller, which is used to avoid the regeneration when
motoring is desired.
The aim of this section is to show that the same principle can be applied to
Permanent Magnet Synchronous Machine (PMSM), which has sinusoidal back-emf,
rather than trapezoidal back-emf like the BDCM. The biggest difference between
these two machines, from the drive point of view, is that the BDCM operates at
single-phase (120° conduction) below base speed and the PMSM operates at three-
phase (180° conduction). Therefore, the DMIC philosophy for PMSM will be
different than for the BDCM. The DMIC method keeps the single-phase operation
(less than 180° conduction) also above base speed for BDCM. However, for PMSM,

34
the DMIC will change the three-phase operation below base speed to single-phase
(less than 180° conduction) operation above base speed.
The inverter topology for DMIC driving a PMSM is identical to that one
driving the BDCM and is given in Figure 3.5. The firing scheme for DMIC driving a
PMSM is given in Figure 3.9. The gate signals to fire the switches in phase a, i.e.,
transistors Q1 and Q4, and thyristors T1 and T4, are shown. In this scheme, as in DMIC
driving a BDCM, the advance angle θa is measured relative to the phase-to-phase
back-emf and DC supply voltage crossing point. The conduction angle starts at 180°
at base speed, and slowly decreases toward 120° in such a way that the single-phase
operation is reached and commutation failure is avoided. This control is made
possible by controlling the blanking angle θb. The thyristor-based AC-voltage
controller interfaces the standard VFI and the PMSM. Therefore, by shutting off as
the current reaches zero, the thyristors avoid the current reversal and the resultant
regeneration that occurs due to bypass diode conduction.
The DMIC/PMSM system was simulated in order to evaluate the DMIC
efficacy driving a PMSM. The system is the same as the one given in Table 3.1.
However, the machine is a PMSM, i.e., a sinusoidal back-emf type of machine,
therefore, considering the same peak phase-to-neutral back-emf at base speed
(Eb=74.2 volts), the equivalent rated power is 31,980 W and the rms current is 176 A.
The machine simulated was then a PMSM, but with the same parameters for the
BDCM as given in Table 3.1. The system was simulated at 5 times the base speed

35
θ a 180o - θ bV eab
T4
-Vdc
Angle
θ aeab 60o
-Vdc
Q 4
V
eab Vdc
θ a
Q 1
V
60o
eab
180o - θ b
T 1
Vdc
θ a
V
Fig. 3.9 Firing scheme for motoring mode of DMIC driving a PMSM

36
(n=5). Figure 3.10 shows the phase a current, phase a back-emf, current flowing
through the transistors in phase a, and current flowing through the bypass diodes in
phase a. Notice that in order to develop 36,800 W the phase a current peak is 277.7 A
and the rms current is 187 A, while the rated peak and rms currents are 249A and 176
A respectively. Therefore, the machine developed 15% more power at a cost of 11%
and 6% more current than the rated peak and rms currents respectively. The current
through the diode is zero, i.e., the period with regenerating power was effectively
avoided by the ac-voltage controller. Instantaneous total power and power developed
in phase a are given in Figure 3.11. However, the pulsating torque, which follows the
pulsating power, is high, but it will be filtered out by the load/machine inertia.
Phase A Current and Back EMF
Current Flowing through Phase A Transistors
Current Flowing through Phase A Bypass Diodes
Ipk = 277.7 A Irms = 187 A
600
-600
0
0
0
-400
-400
400
400
Time6.1ms 6.5ms 7.0ms 7.5ms
Fig. 3.10 Current in phase a, transistor Q1 and Diode D1 for n=5, θa = 42°, θb = 20°

37
Instantaneous Total Power
Instantaneous Power develop in Phase A
Pavg = 36,800 Watts
Pavg = 12,270 Watts
100 KW
-100 KW
0 W
400 KW
-400 KW
0 W
Time 6.1 ms 6.5 ms 7.0 ms 7.5 ms
Fig. 3.11 Instantaneous total power, phase a power (all flowing through the
transistors) for n=5, θa = 42°, θb = 20°
III.5 – Conclusion
The Phase Advance Angle (PHA) method driving a BDCM was described,
and its inefficiency for low inductance machine was shown. The deficiency of this
method was pointed out as being the conduction of the bypass diodes, which allowed
regeneration when motoring action was desired. In sequence, the DMIC driving a
BDCM was presented. The DMIC principle was then described. The main differences
between DMIC and PHA were highlighted. It was discussed that the DMIC method is
more effective in driving a low inductance BDCM mainly because of its capability of

38
avoiding the bypass diodes conduction and therefore the regeneration period. Finally,
the DMIC driving a PMSM was addressed. The same principle used to allow driving
a BDCM above base speed was used to drive the PMSM, i. e., the ac-voltage
controller that interfaces the VFI and the machine was used to block the bypass
diodes conduction. In other words, the PMSM operation changes from three-phase
operation below base speed to single-phase operation above base speed. The
performance was found to be excellent, the developed power of the machine was 15%
more than the rated power at five times the base speed with a peak current 11%
bigger than the rated peak current, while the rms current was 6% bigger than the rated
value. The drawback of the DMIC is the high pulsating torque. However, considering
that the frequency of the pulsating torque is six times the fundamental frequency, the
fundamental frequency is high above base speed and that the inertia of the machine
and load can filter out the pulsating torque, the pulsating torque should not be a
problem for electric vehicle application.
This chapter showed DMIC driving PMSM in the time domain. This was
useful to explain the DMIC strategy to drive PMSM in high speed successfully, i.e. to
achieve a wide constant power operation range. Chapter V will show the results of
DMIC driving PMSM in the phasor domain. There, the dq model of the machine will
allow us to understand why the DMIC/PMSM system can reach such a wide constant
power operation range.

39
CHAPTER IV
FIELD WEAKENING TECHNIQUE FOR PMSM
IV.1 - Introduction
The Vector Control (VC) technique is used to achieve DC machine like
performance/dynamic response in AC machines [16], [17], [18]. In a DC machine, the
field current and the armature (torque) current are orthogonal and therefore
decoupled. In other words, the currents can be controlled independently, without one
affecting the other. This decoupling allows fast dynamic response for DC machines.
The theory behind VC of AC machines relies on the dq-model of these
machines. Therefore, the dq model of the PMSM will be used in order to describe the
VC of PMSM. As discussed in chapter 2, the dq model of the PMSM leads to two
equivalent electric circuits: the q–axis equivalent circuit and the d-axis equivalent
circuit. The current iq, in the q–axis equivalent circuit is the torque component of the
stator current, and is analogous to the armature current in a DC machine. The current
id, in the d–axis equivalent circuit is the field component of the stator current, and is
analogous to the field current in a DC machine. In VC applications, these two current
components are controlled independently, i.e., one control loop controls the torque
component of the armature current and another controls the field component of the
armature current.

40
The objective of this chapter is to review VC of PMSM. Initially the machine
voltage equations are given and analyzed. The analysis of these equations is helpful to
understand the effect of id and iq in the machine. Then, the analysis of the machine
operation regarding the current and voltage limits is given. This analysis allows
understanding of how the current and voltage constraints define the range of the
constant torque and constant power operation regions. Moreover, this analysis reveals
the best strategy to control the id and iq currents in order to make the constant power
operation range as wide as possible. Finally, the PMSM drive system with VC that
operates in both, constant torque and constant power operation regions is given and
carefully described. Simulation results of this system are also given.
IV.2 - Vector Control of PMSM
The Vector Control Technique uses the d-q model of the PMSM shown in
Figure 4.1 (same as Figure 2.3).
The voltage equation for q-axis equivalent circuit is:
q qq r d q r m r d q
di div P Li Ri L P P Li Ri L e
dt dtω ω φ ω= + + + = + + + (4.1)
where
e - the back-emf, which is proportional to the speed ωr and the rotor
magnet flux φm ( r me Pω φ= ).

41
R L
vq
+
-
+
+
-
- Pωr Lid
iq
e
(a) q-axis equivalent circuit
R L
vd
+
+
-
- PωrLiq
id
(b) d-axis equivalent circuit
Fig. 4.1 d-q equivalent circuit in synchronously rotating frame (II)

42
er P
ωω = - rotor speed
P – number of pole pairs
sL L M= +
The voltage equation for d-axis equivalent circuit is:
dd d r q
div Ri L P Lidt
ω= + + (4.2)
Figure 4.2 shows the phasor diagram representing the above equations. The d-
axis is aligned with the rotor magnet flux φm.
The electromagnetic torque is then given by:
32e m qT P iφ= (4.3)
As shown in Equation 4.3, the electromagnetic torque is proportional to the
magnet flux φm and to the quadrature component of the stator current iq.
In a PMSM, the field is provided by the permanent magnets and is constant;
therefore no field component of the armature current is required. However, because
the field is constant, as the rotor speed increases, the back-emf also increases, which
makes it difficult to have electrical to mechanical power conversion with acceptable

43
φm d-axis
q-axis
iq
id vd
vq
e
Lid
Liq
Ia
Va
RIa
φg
Fig. 4.2 Phasor diagram showing the variables of the d-q model of the PMSM
current level above a certain speed level. Therefore, the control of PMSM must be
divided into two operation regions: Constant Torque Operation Region (CTOR) and
Constant Power Operation Region (CPOR).
The constant torque operation region is defined as the region where the back-
emf is lower or equal to the maximum output voltage that can be provided by the
inverter and the DC link voltage. The speed at the end of this operation region, i. e.
where the back-emf is equal to the maximum voltage provided by the inverter is
called Base Speed (ωrb). Within this region the machine can provide up to rated
torque, at any speed. In order to achieve optimum torque/ampere in this region, the

44
field component of the armature current id is held at zero, and the torque component
of the armature current iq is controlled according to the desired torque [19], [20], [21].
The idea behind vector control of the PMSM, which was qualitatively
described above, can be easily understood by analyzing Equations 4.1, 4.2 and 4.3. In
steady state, if optimum torque/current ratio is desired, then id is held at zero, and
Equations 4.1, 4.2 and 4.3 become:
q q r mv Ri Pω φ= + (4.4)
d r qv P Liω= (4.5)
32e m qT P iφ= (4.6)
The vd and vq voltages are then controlled to provide the iq necessary to
develop the desired torque.
However, as the speed increases the back-emf given by r mPω φ also increases.
At the base speed, the inverter output voltage reaches its maximum value and
therefore vq and vd cannot be increased further. This is the beginning of the Constant
Power Operation Region. In this region, rated torque cannot be provided anymore,
and the maximum developed torque decreases as speed increases. In order to oppose
the effect of the constant flux provided by the permanent magnet, id is controlled to be
45
negative. The effect of id is to weaken the air gap flux, which was previously
provided only by the permanent magnets. This is the reason that this region is called
the Field Weakening Region.
The strategy of controlling id is what dictates the range of this region. If id is
held to zero, as the speed increases the back-emf will also increase, making iq
decrease quickly, and therefore the operation range above base speed will be very
narrow. Therefore a different strategy to control id and iq is required to make this
operation range wider [22]-[31].
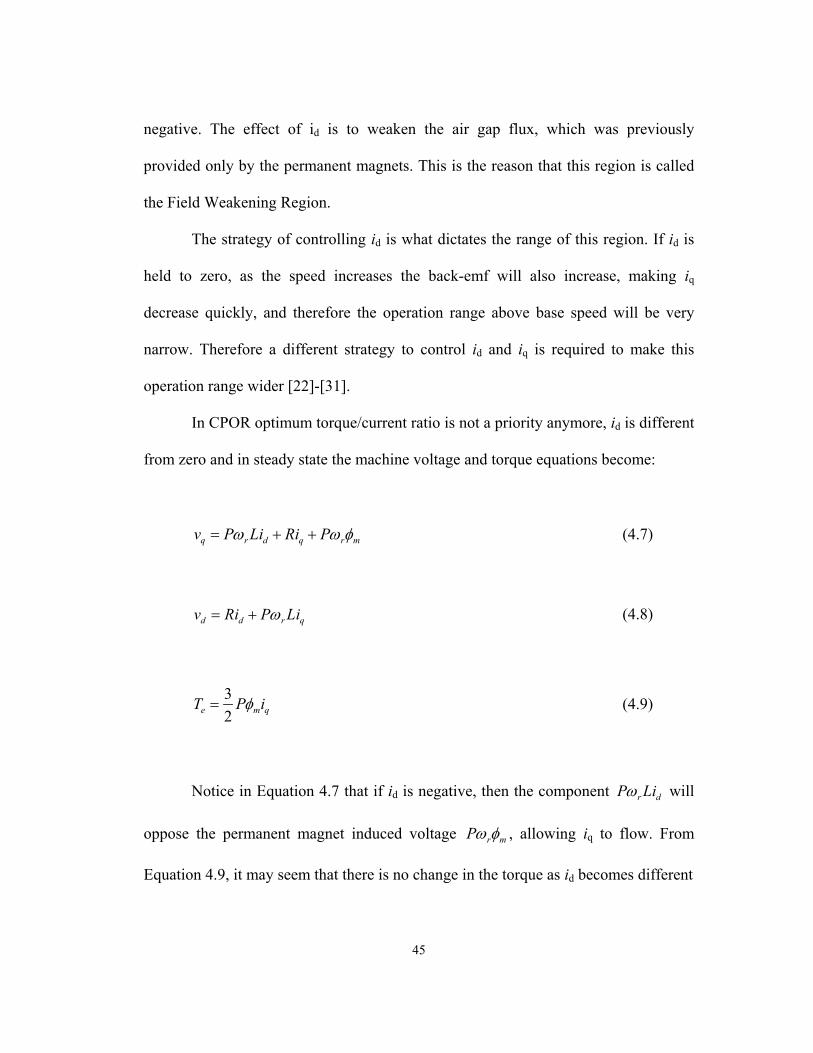
In CPOR optimum torque/current ratio is not a priority anymore, id is different
from zero and in steady state the machine voltage and torque equations become:
q r d q r mv P Li Ri Pω ω φ= + + (4.7)
d d r qv Ri P Liω= + (4.8)
32e m qT P iφ= (4.9)
Notice in Equation 4.7 that if id is negative, then the component r dP Liω will
oppose the permanent magnet induced voltage r mPω φ , allowing iq to flow. From
Equation 4.9, it may seem that there is no change in the torque as id becomes different

46
from zero. However, what this equation does not show is that as id increases in
absolute value, iq must decrease in order to obey the current constraint, which will in
turn decrease the developed torque. Analysis regarding this constraint will be given in
the next section.
IV.3 – Analysis of limits of operation of PMSM with Vector Control
The previous section described how to obtain DC machine-like performance
of the PMSM. However, the operating limits of the VC of PMSM was not taken into
consideration. Analysis of such limits will now be done. Although, there are many
limits related to the DC link voltage (battery), inverter, machine, mechanical
coupling, and so on, it is assumed that the most restrictive limits are imposed by the
DC link voltage and current ratings of the inverter devices. The analysis of these
limits will lead to power/torque-speed operating envelope of the PMSM.
IV.3.1 – Voltage and current limits
First, consider the current ratings of the inverter switches at maximum
allowed machine stator current Imax. The maximum allowed current can then be
represented in the synchronously rotating frame iq-id plane as a circle centered at the
origin and with radius Imax. Normalizing the maximum current to unity, the circle is
then centered at zero with radius 1. The interior of this circle represents the locus
where current regulators can generate any normalized current phasor without

47
exceeding the current limits of the drive system. Figure 4.3 shows the current limit as
well as a typical armature current phasor I operating within this limit.
The other operation limit that must be considered is the maximum output
voltage provided by the inverter. The output voltage of the inverter is a function of
the DC link voltage. In VC, the ability to control the stator current is critical. This
ability to control the current is given by the PWM operation of the inverter, and it is
lost if the inverter switches saturate. Therefore, the inverter must operate within the
so-called undermodulation region of the PWM.
In PWM operation, modulation index m can be defined as the ratio of the peak
value of the fundamental voltage generated by the modulator and the peak value of
id [p.u.]
iq [p.u.]
Imax
I
Current limit circle
1
-1
-1
1
Fig. 4.3 Normalized current limit circle in the synchronously rotating reference frame

48
the fundamental component of output voltage at square-wave operation [32], [33].
The modulation index is then given by Equation 4.10.
*
1
Vm
Vsw
= (4.10)
12* dc
swVV
π= (4.11)
where:
V* - Peak value of the fundamental voltage generated by the modulator
V1sw – Peak valued of the fundamental voltage at square-wave
operation
Notice that with modulation index defined by Equation 4.10, its value varies
from 0 to 1, 1 being the value for square wave operation. The maximum value of the
modulation index that characterizes undermodulation region operation depends on the
PWM algorithm. If sinusoidal PWM with the addition of triplen harmonics or if space
vector PWM is used as the PWM algorithm, then the limit of the undermodulation
region is given when the modulation index is [33], [37], [38]:
3 0.9076
m π= = (4.12)

49
Therefore, for VC of PMSM, the maximum peak value of the inverter output
voltage as function of the DC link voltage is:
max33
dcVV = (4.13)
On the other hand, the machine terminal voltage amplitude is given by:
( ) ( )2 22a r q q r m r d dV PL i Ri P PL i Riω ω φ ω= + + + + (4.14)
where Va is the applied armature voltage.
Neglecting the armature resistance and rearranging equation 4.14, it becomes:
( )2 2
2a mq d
r
V i iP L L
φω
= + +
(4.15)
Therefore, Equation 4.15 represents the voltage relations in terms of the
currents id and iq. This relation can then be represented in the synchronously rotating
frame iq-id plane as a circle centered at ,0m
Lφ −
and with radius a
r
VP Lω
. The radius
is proportional to the applied armature voltage Va and inversely proportional to rotor

50
speed ωr. It is important to notice that for a given Va, the radius of the circle decreases
as the speed increases.
The operation limit established by the DC link voltage can be determined by
substituting the applied armature voltage Va in equation 4.15 by maximum peak value
of the inverter output voltage from equation 4.13. This limit is given by:
( )2 2
233
dc mq d
r
V i iP L L
φω
= + + (4.16)
Equation 4.16 represents the family of circles that limit the operation of the
PMSM due to the DC link voltage constraint. In other words, for each speed there
will be a voltage limit circle. Notice that as the speed increases, the circle shrinks.
Figure 4.4 shows three examples of the voltage circle limit for speeds ωr1, ωr2, and
ωr3. Where ωr3 is bigger than ωr2 and ωr2 is bigger than ωr1.
The two constraints discussed above must be combined in order to define the
drive operation limits. Notice that since the two constraints must be satisfied, the
drive operation limit will then be defined by the intersection of the two circles defined
by the current and voltage limits.
Figure 4.5 shows the two constraints for PMSM drive system. The current
limit circle and the voltage limit circle are given. In this figure, the shaded area
represents the operation region where the machine can operate at speed ωr2, i. e., any
armature current vector can be generated by the controller within this area and

51
id
iq
Voltage limit circles
m
Lφ
−
ωr1 ωr2
ωr3
Fig. 4.4 Voltage limit circles in the synchronously rotating reference frame
therefore any torque/speed associated with this current can be provided. The voltage
limit circle in continuous line is the voltage limit circle for base speed (ωr1 = ωrb).
In order to understand the operation of VC of PMSM drive system and its
operation limits, the analysis will be divided into two parts, the constant torque region
and the constant power region. Analysis of the best armature current vector trajectory
will also be given.

52
id
iq
Imax
Voltage limit circles
m
Lφ
−
Current limit circle
1
1
ωr3
ωr2
ωr1
Fig. 4.5 Current circle limit and voltage limit circle for PMSM drive system
IV.3.2 - Constant Torque Operation Region
In a PMSM, the magnetic field is provided by the permanent magnets, and therefore
optimum torque/ampere ratio is obtained if the armature current is composed only of
its torque component. In other words, the controller should control the machine in
such a way that the id component of the armature current is zero, while the iq
component is proportional to the desired torque. This principle can be graphically
observed by looking at Figure 4.6. The condition of maximum torque/ampere ratio

53
will be achieved by having the armature current trajectory along the iq axis, as shown
in the figure.
Figure 4.6 shows examples of armature current vector. The current I1 is in the q-axis,
and therefore id is zero. I1 then represents a typical operation point where the voltage
applied to the machine is V1, which is smaller than Vmax. The armature current I1 is
smaller than Imax, and the machine is providing a torque T1 at speed ωr1. Notice that
the same torque T1 can be provided by the same current I1, but with different
combinations of V1 and ω1, i.e. lower or higher speeds can be reached by varying V1.
id
iq
Imax
m
Lφ
−
Current limit circle
1
1
I1
ωrb
Voltage limit circle
I2
Fig. 4.6 Armature current trajectory for vector control of PMSM operating in CTOR

54
In the operating point I2, the machine is operating at maximum or rated torque. At this
point any combination of the applied voltage V2 and speed ω2 can be used. However,
there will be a speed that will allow the voltage limit circle to pass through the point
where the current limit circle crosses the q-axis. This is the maximum speed where
the rated torque can be developed. This speed is the aforementioned base speed ωrb.
The base speed is the limit of the constant torque operation range. Below this speed,
the machine can provide the rated torque at any speed, but beyond this speed, the
rated torque cannot be provided any longer, and this is the beginning of the constant
power operation region. It is important to notice that in general the base speed is
defined as the speed where the maximum circle voltage is provided by square-wave
operation of the inverter. However, as mentioned before, at square-wave operation the
inverter loses its ability to control the current, which is a requirement for VC and fast
dynamic response of the system. Therefore, for vector control, the maximum voltage
circle is defined in the limit of the undermodulation operation region of the inverter.
The base speed for vector control will then be 9.3 % smaller then the generally
accepted base speed. Another important observation is that a well-designed PMSM
drive system using VC will have the maximum voltage limit circle and the maximum
circle current crossing at the same point on the q-axis. Any different design will be
over designing the system either from the voltage or current point of view.

55
IV.3.3 - Constant Power Operation Region
As the speed increases beyond the maximum speed, the voltage limit circle
passes through a point where the maximum current circle crosses the iq axis, the
voltage limit circle shrinks and the maximum torque can no longer be provided. It is
important to emphasize that before this point the current command id was zero and the
current command iq was proportional to the desired torque. However, from this point
on, although the current limit may not be violated, the controller cannot control the
current in a way that the rated torque is provided, and the command currents id and iq
must be changed.
There are many different ways to control the id and iq currents. For instance,
consider that the current command will be controlled to be in the limit of the voltage
limit circle, and inside the current limit circle; however, optimum torque/ampere ratio
is desired and therefore id will be controlled to be zero. Figure 4.7 shows three
operation points for speeds ωr1, ωr2, and ωr3 with this control strategy. Notice that as
the speed increases from ωr1 to ωr2, and from ωr2 to ωr3, and the voltage limit circle
shrinks, and therefore the maximum torque that can be developed also decreases. At
speed ωr3, the voltage limit circle is tangent to the iq axis and the machine cannot
provide any torque at this speed or higher. Therefore, if the current command
trajectory is along the iq axis, the range above base speed in which the machine can
provide torque is very narrow.

56
id
iq
Imax
m
Lφ
−
Current limit circle
1
1
I1
ωr2
ωr1
Voltage limit circle
ωr3
Fig. 4.7 Armature current trajectory for vector control of PMSM operating in CPOR
with id=0
Consider as an alternative for the previous current command trajectory, the
trajectory that does not keep the id component of the command current zero. A
possible current trajectory as the speed increases is along the current limit circle.
Figure 4.8 shows this trajectory. In this trajectory, the id component of the current
command increases negatively. In order to stay within the current limit circle, the iq
component must decrease, which causes the developed torque to decrease. However,

57
id
iq
m
Lφ
−
Current limit circle
1
1
ωr5
Voltage limit circle
I1 I2
I3
ωr3
ωr4 Iq1 Iq2 Iq3
Id1 Id2 Id3
Fig. 4.8 Armature current trajectory for vector control of PMSM operating in CPOR
with field weakening
in this way the decreasing rate of the torque as the speed increases is smaller,
meaning that the range that the machine can operate above base speed is wider.
The armature current vectors I1, I2, and I3 are examples of the currents in this
trajectory. Notice that they have nonzero id and iq components, unlike the previous
trajectory. In this case the optimum torque/ampere is not achieved anymore. However
torque can be developed at higher speeds. For instance, as shown in Figure 4.7, if the
machine is required to operate at speed ωr3, by using the trajectory along the q-axis,

58
there would not be any iq current, and therefore the machine would not be able to
develop any torque. On the other hand, if the trajectory along the current limit circle
is used, as shown in Figure 4.8, the iq current would be Iq3 and a considerable amount
of torque would be developed.
The objective of the field weakening technique is then to control id and iq
current in such way that the machine can develop constant power. The power, speed
and torque relation in the machine shaft is given by:
Pratede
r
Tω
= (4.17)
In constant power operation region, the power is constant and thus, the torque
profile as a function of speed is a hyperbola. If rated power in the constant power
operation region is desired, then the current iq should be controlled to provide torque
as given in Equation 4.17, i.e., iq must be controlled as:
maxIbq
r
i ωω
= (4.18)
Therefore, to keep the current satisfying the two constraints described above,
the id current has to be controlled following Equation 4.19.

59
1 b md
r
iL
ω φω
= − −
(4.19)
Neglecting the losses, if the machine is operating at high speed at no-load
condition, iq current is required to be zero, however the flux still has to be weakened
and the id current has to be controlled as follows:
max1d m
r
ViL P
φω
= − −
(4.20)
Therefore, to attend the load and no-load operation conditions described
above, the id current must be controlled as given in Equation 4.21.
max max
max
1Iq
d m mr r
iV ViL P L P
φ φω ω
= − − − −
(4.21)
However, even if using the iq and id currents given in Equations 4.18 and 4.21,
the constant power operation region will have a maximum speed ωrmax. This speed
will depend on the machine parameters. Analysis of Figure 4.8 gives a qualitative
idea of the limit of the CPOR. The center of the voltage limit circle is ( m
Lφ
− ). The
radius of the voltage limit circle is 33
dc
r
VP Lω
. As mentioned before, as the speed

60
increases, the radius of the voltage limit circle decreases. The radius then goes to zero
when speed goes to infinity. Therefore, there will always be a voltage limit circle
within which the machine can operate. However, as discussed previously, the current
limit also must be satisfied, and therefore, the operating current vector locus is the
area defined by the intersection of the two limit circles. Therefore, if maxmIL
φ≥ ,
which means that the center of the voltage limit circle will be either in the current
limit circle or inside of it, then the CPOR is theoretically infinite. On the other hand,
if maxmIL
φ< , then the intersection will vanish at finite value of ωr. If the inductance is
large enough, the constant power speed range can be infinite. There will be a
maximum speed at which the machine can develop rated torque. This speed is called
critical speed ωrc and is the limit of the CPOR. Therefore, the constant power range
then starts at ωrb and ends at ωrc. From Equations 4.18 and 4.19, and not exceeding
the inverter current limit, the critical speed ωrc is found as:
( )( )
22max
22max
II
mrc b
m
LL
φω ω
φ
+=
− (4.22)
The analysis done in this section leads to the maximum torque-speed
operating envelope shown in Figure 4.9.

61
ωrb Speed
Torq
ue/P
ower
Power
Torque
Constant Torque Operation Range
Constant Power Operation Range
Fig. 4.9 Maximum torque-speed and power-speed envelope
IV.4. – System Description of Vector Control of PMSM with Field Weakening
Operation
The physical principle of the VC of PMSM operating at CTOR and CPOR
with field weakening was addressed in the previous section. This section will describe
how this system can be implemented. Figure 4.10 shows a typical block diagram of
VC of PMSM with closed loop speed control. The system can be divided into two

62
VOLTAGE-FEDINVERTER
VECTOR ROTATOR
PWM
ALGORITHM
θr
Vdc
+
-
FEEDBACK SIGNAL COMPUTATION
θr ωr iq id
PMSM
ia, ib
PS
θr
van* vbn
* vcn*
ωr PI
vd*
PI PI
iqωr
ωr* iq
* -- + + vq
*
id
-+
EQUATION 4.29
VOLTAGE COMPENSATOREQUATION 4.30
vqc*
vdc*
Fig. 4.10 System description of VC of PMSM with closed loop speed control

63
parts, the power subsystem, which is composed of the PMSM, the VFI, and the DC
link voltage (battery).
The other part is the signal subsystem, which is composed of a position
sensor, feedback signal computation, PWM algorithm, current control loops, speed
control loop, and vector rotator. Each element of the signal subsystem will be briefly
described.
The phase currents ia and ib as well as the rotor position θr are sensed to be the
inputs of the feedback signal computation block. Notice that because the machine has
a neutral isolated connection, only two current sensors are required and the current ic
can be calculated as:
( )c a bi i i= − + (4.23)
The currents id and iq are then calculated using line currents ia, ib, ic, and the
rotor position θr through equation 4.24. This operation is called inverse Vector
Rotation (VR-1) and it maps the machine variables from three-phase stationary
reference frame to the two-phase rotating reference frame. It needs high resolution of
the rotor position.

64
( ) ( )( ) ( )
0
2 2cos cos cos3 32 2 2sin sin sin3 33
1 1 12 2 2
r r rq an
d r r r bn
cn
i ii ii i
π πθ θ θ
π πθ θ θ
− + = − +
(4.24)
Notice that because the machine has a neutral isolated connection the i0
component will be zero.
The speed ωr is calculated using equation 4.25.
rr
ddtθω = (4.25)
The drive system shown in Figure 4.10 is sensor-based; it uses a position
sensor to obtain the rotor position of the PMSM. In sensorless PMSM control, voltage
sensors are used, instead of position sensor [32]. In such a case, the signal
computation block uses the machine terminal voltages and currents to estimate the
rotor position as well as the rotor speed. There are many different rotor and speed
estimator algorithms proposed in literature. Although it is an interesting area,
sensorless PMSM control is not in the scope of this work.
The feedback signals are used by the control loops. There are three control
loops, the id current loop, the iq current loop, and the speed loop, which is an outer
loop of the iq current loop. Equation 4.26 gives the output of the speed PI controller.

65
* *( ) ( )q I r r P r ri K dt Kω ωω ω ω ω∗ = − + −∫ (4.26)
where:
KωI – Integral constant for the rotor speed controller
ωr* – Rotor speed command
ωr – Actual rotor speed
KωP – Proportional constant for the speed controller
Equation 4.27 gives the output of the iq PI controller.
* *0( ) ( )q qI q q qP q q qv K i i dt K i i v∗ = − + − +∫ (4.27)
where
KqI – Integral constant for the iq controller
iq* – iq command
iq – Actual iq
KqP – Proportional constant for the iq controller
0q r mv Pω φ= decoupling voltage
Equation 4.28 gives the output of the id PI controller.

66
* *0( ) ( )d dI d d dP d d dv K i i dt K i i v∗ = − + − +∫ (4.28)
where
KdI – Integral constant for the id controller
id* – id command
id – Actual id
KdP – Proportional constant for the id controller
0d r qv P Liω= − - decoupling voltage
The voltages vd0 and vq0 are called decoupling voltages. They are used to
decouple the id and iq control loops [10], i.e., they allow independent control of id and
iq currents.
For operation with the field weakening operation the id command must be a
function of the rotor speed ωr. If the machine is operating below base speed, the id
command must be zero, however, if the machine is operating above base speed, id
command will follow equation 4.21. The id command is then given by equation 4.29.
*
** max max
max
0
1I
r rb
d
qd m m
r b
if then
ielse
iV ViL P L P
ω ω
φ φω ω
≤
=
= − − − −
(4.29)

67
The outputs of the controllers are the command voltages vd and vq. However,
the amplitude of the vector defined by these two command voltages cannot exceed
the maximum inverter output voltage. If this occurs, the current controllers will
saturate. The saturation of the current controllers will mean coupling between them,
and the system will lose the fast dynamic response. In order to avoid the saturation of
the controller, the command voltages vd and vq are compensated. The compensated
values of vd and vq are vdc and vqc. This compensation gives priority to the control of id
rather than iq. If the amplitude of the vector defined by command voltages exceeds
the maximum inverter output voltage, the amplitude of the vdc is made equal to vd, and
vqc is the value that will make the amplitude of vector defined by vdc and vqc equal to
the maximum inverter output voltage. The only condition that will make vdc smaller
than vd is whenever the decoupling voltage vq0 is large, and the vector defined by vd
and vq0 has amplitude larger than the maximum inverter output voltage. In this case,
vqo has priority over vd. Equation 4.30 uses if-then statements to explain the approach
of the voltage command compensation discussed above.
2 2* * 2max
* * *
2 2* * 20 max
2* * * 2 *max
2* 2 * *max 0 0
d q
dc d qc q
d q
dc d qc d
dc q qc q
if v v V then
v v and v v
elseif v v V then
v v and v V velse
v V v and v v
+ ≤
= =
+ ≤
= = −
= − =
(4.30)

68
The compensated command voltages are in d-q rotating frame and must be
mapped to the abc stationary frame. The d-q rotating frame to abc stationary frame is
done using the Vector Rotator (VR) given in Equation 4.31.
( ) ( )( ) ( )
* *
* *
* *0
cos sin 12 2cos sin 13 32 2cos sin 13 3
r ran qc
bn r r dc
cnr r
v v
v v
v v
θ θπ πθ θ
π πθ θ
= − − + +
(4.31)
The command voltages in abc stationary frame are then fed to a PWM
algorithm to generate the gate signals for the VFI switches. There are many PWM
algorithm options, among them; sinusoidal PWM and space vector PWM are the most
popular. Description of this algorithm is not in the scope of this work, but it can be
found in [34] – [40].
IV.5 – Simulation Results of Vector Control of PMSM with Field Weakening
Operation
Vector control of PMSM with field weakening was described and analyzed in the
previous sections. A SIMULINK model of the system described in section IV.4,
Figure 4.10 is built (Appendix 1) [41], [42], [43]. The system parameters are given in
Table 4.1. The PWM algorithm used is the space vector PWM. The motor parameters
used are of a PMSM equivalent to the brushless DC motor used in Chapter 3 (Table

69
Table 4.1 – Drive system parameters - VCFW
=============================================================
DC-link voltage: Vdc = 162 V
PWM Switching Frequency: fs = 10 kHz (Ts=100 µs)
Brushless DC motor: Prated = 42.9 hp (31,980 Watts), 12-pole
Base Speed: Nb = 2600 rpm (260 Hz)
Peak phase-to-neutral back-emf at Nb: Eb=74.2V
Stator resistance: Rs = 0.0118 Ω
Stator inductance: Ls = 61.8 µH
Stator mutual inductance: M = 11.8 µH
Rated peak current: Irated (peak) = 249 A
Rated rms current: Irated (rms) = 176 A
System limits Maximum voltage provided by the VFI: Vmax=103 V
Maximum current: Imax = 245 A
Frequency limit of the CTOR: fb = 260 Hz (2600 rpm)
Frequency limit of the CPOR: fc = 320 Hz (3198 rpm)
Load: TL=kωr2
Below base speed: 31.58 10k −=
Above base speed 3
31.58 10
r
kω
−
=

70
3.1). The values of the proportional-integral controller constants were not tuned for
the optimal operation because the objective of this work is to evaluate the "steady-
state" performance of the system, not the dynamic response, although results showing
the dynamic response of the system are also given. The aim, here, is to show the
maximum speed at which the machine can provide rated power without exceeding the
rated current.
The system was simulated and results at 5 different steady-state operating
points were recorded and plotted. Figure 4.11, 4.12, 4.13 and 4.14 show the results
for the machine providing rated power and rated torque at base speed. Figure 4.11
shows the commanded rotor speed and actual rotor speed. Figure 4.12 shows the load
torque and the developed torque. The load was chosen in such way that the developed
torque was the rated torque at base speed. Figure 4.13 shows the output power at the
machine shaft. The machine is providing rated torque at base speed; therefore, as
expected, the power is equal the rated power. Figure 4.14 shows the id and iq
components of the armature current. Notice that the maximum torque/ampere ratio
strategy is used, since the id is zero and iq is the rated current. The high frequency
pulsating torque and power as well as the high frequency components of the iq and id
current are expected because of the PWM operation of the inverter.
The machine system was simulated at critical speed. As defined in the
previous section, the critical speed is the maximum speed that the machine can
develop rated power using VC with field weakening, i.e., the speed limit of the
CPOR. The critical rotor speed, ωrc for the PMSM in the study was calculated using

71
1.2 1.3 1.4 1.5 1.6 1.7 1.8 1.9 20
1000
2000
3000
4000
Time [s]
Ne,
Nr
[rp
m]
Ne
Nr
Fig. 4.11 Command and actual rotor speeds at base speed (2600 rpm)
1.2 1.3 1.4 1.5 1.6 1.7 1.8 1.9 2-50
0
50
100
150
200
Time [s]
Te,
TL
[Nm
]
Te
TL
Fig. 4.12 Load and developed torque at base speed (2600 rpm)

72
1.2 1.3 1.4 1.5 1.6 1.7 1.8 1.9 20
1
2
3
4
5x 10
4
Time [s]
P [W
]
Fig. 4.13 Machine output power at base speed (2600 rpm)
1.2 1.3 1.4 1.5 1.6 1.7 1.8 1.9 2-600
-400
-200
0
200
400
Time [s]
Iq, I
d [A
]
Iq
Id
Fig. 4.14 id and iq components of the armature current at base speed (2600 rpm)

73
Equation 4.22 and it was found to be 23% higher than the base speed. Therefore,
speed limit of the CTOR is 1632.8 rad/s and the speed limit of the CPOR is 2009.6
rad/s. Thus, the CPOR is very narrow for the example motor, meaning that this drive
system cannot be used for high speed applications. This narrowness is due to the low
inductance of the machine under study. Although low inductance machines have a
wide CTOR, their CPOR are very narrow. On the other hand, high inductance
machines have a low CTOR, but their CPOR is much wider than that for low
inductance machines [19].
The results for machine operating at critical speed are given in Figures 4.15-
4.18. Figure 4.15 shows the command and actual speed. Figure 4.16 shows the
developed and load torques. Notice that the machine is operating at constant power
region, therefore the developed torque is smaller than the rated torque. Figure 4.17
shows the developed power. As expected, the developed power equals to the rated
power. Figure 4.18 shows the id and iq currents. At this operating point, the id current
is different from zero, and it is controlled to be negative in order to oppose the
permanent magnet flux effect. In order to keep the total armature current equal to the
maximum current, iq is controlled to be smaller than the rated value. This is the speed
limit at which the total current equals the maximum current limit if the machine is
required to develop rated power. From this point on, in order to develop rated torque
the current will increase above the maximum current.

74
2.8 2.9 3 3.1 3.20
1000
2000
3000
4000
5000
Time [s]
Ne,
Nr
[rp
m]
Ne
Nr
Fig. 4.15 Command and actual rotor speeds at critical speed (3198 rpm)
2.8 2.9 3 3.1 3.2-50
0
50
100
150
200
Time [s]
Te,
TL
[Nm
]
Te
TL
Fig. 4.16 Load and developed torque at critical speed (3198 rpm)
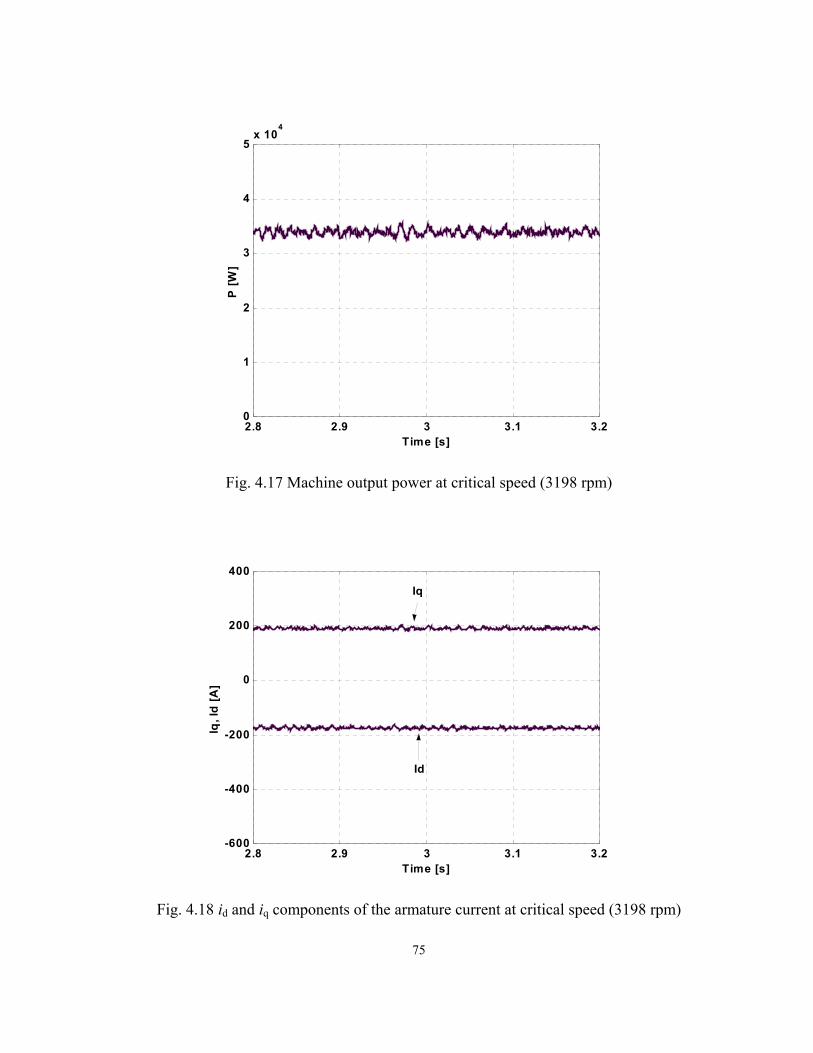
75
2.8 2.9 3 3.1 3.20
1
2
3
4
5x 10
4
Time [s]
P [W
]
Fig. 4.17 Machine output power at critical speed (3198 rpm)
2.8 2.9 3 3.1 3.2-600
-400
-200
0
200
400
Time [s]
Iq, I
d [A
]
Iq
Id
Fig. 4.18 id and iq components of the armature current at critical speed (3198 rpm)

76
In order to evaluate the poor performance of the vector control with field weakening
at higher speeds, the system was simulated right above the critical speed and also at 3
times the base speed. Figure 4.19 through 4.22 show the results of the machine
operating at 50% above base speed (3900 rpm), which is only 20% above critical
speed ωc. The objective is to keep the output power of the machine constant and
evaluate the increase in the current amplitude. Figure 4.19 shows the command and
actual rotor speeds. Figure 4.20 shows the developed and load torques. It is important
to notice that the decrease in the developed torque is inversely proportional to the
speed (1/ωr) in order to keep the machine output power constant. The load torque is
controlled to match the developed torque at this operating point. Figure 4.21 shows
that the output power of the machine is kept constant and Figure 4.22 shows the
substantial increase in the total current necessary to achieve the rated output power.
The iq component is 165.8 A and the id component is -252 A. With these values of id
and iq components of the armature current, the total armature current is 301.65 A,
against a maximum current of 250A. This increase in current is prohibited by the
inverter switch rating, machine losses and heating of inverter and machine.
A simulation at 3 times the base speed was done to further explore the
limitations of the VC with field weakening for low inductance PMSMs. However,
because of the long computation time to reach this speed, the PWM waves were
replaced by pure sine waves to increase the simulation speed. The effect of this
procedure is just the elimination of the high frequency ripple, but the average values
of the results stay the same. Figures 4.23 through 4.26 show such results. Figure 4.26
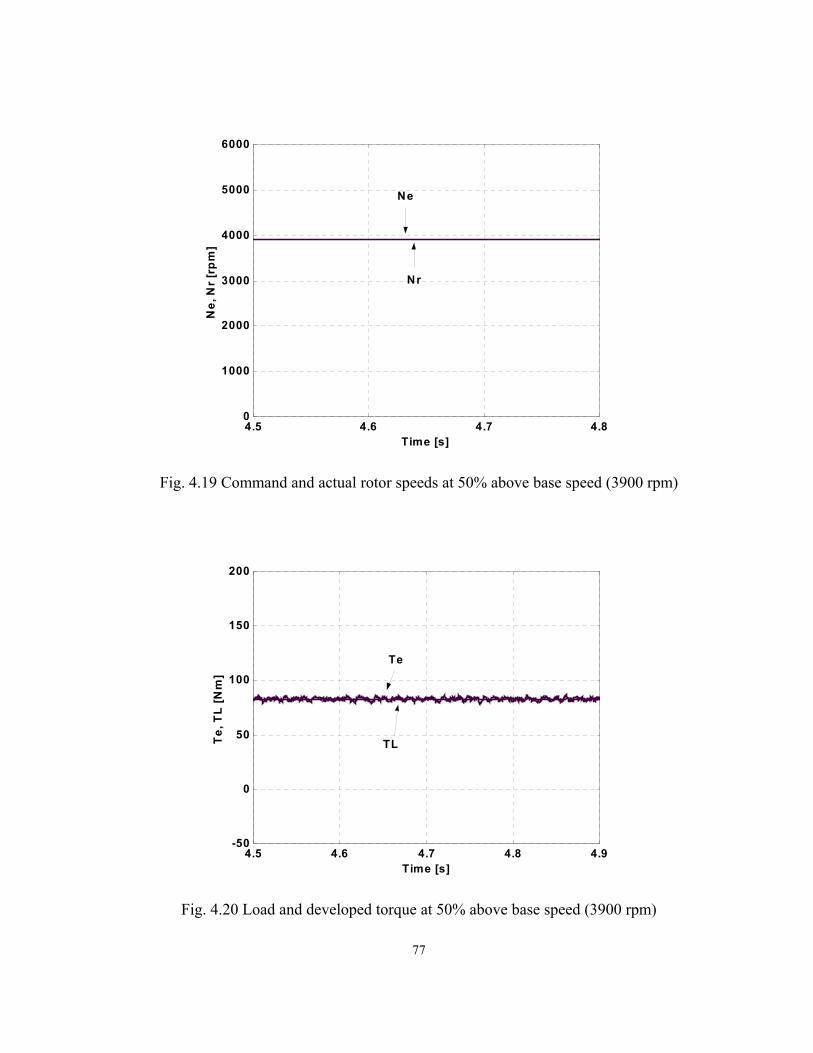
77
4.5 4.6 4.7 4.80
1000
2000
3000
4000
5000
6000
Time [s]
Ne,
Nr
[rp
m]
Ne
Nr
Fig. 4.19 Command and actual rotor speeds at 50% above base speed (3900 rpm)
4.5 4.6 4.7 4.8 4.9-50
0
50
100
150
200
Time [s]
Te,
TL
[Nm
]
Te
TL
Fig. 4.20 Load and developed torque at 50% above base speed (3900 rpm)

78
4.5 4.6 4.7 4.8 4.90
1
2
3
4
5x 10
4
Time [s]
P [W
]
Fig. 4.21 Machine output power at 50% above base speed (3900 rpm)
4.5 4.6 4.7 4.8 4.9-600
-400
-200
0
200
400
Time [s]
Iq, I
d [A
]
Iq
Id
Fig. 4.22 id and iq components of the armature current at 50% above base speed (3900
rpm)

79
shows the iq and id currents. The iq component is 83 A and id component is –503.6 A.
Therefore the total current is 510.4A, which is more than doubling of the current
limit.
The results shown in Figures 4.11-4.26 were in steady-state operation of the
system at different operating points. The system was also simulated in such a way
that its dynamic response could be observed. In order to save simulation time, the
dynamic results were also obtained using pure sine waves instead of the PWM waves.
9.5 9.6 9.7 9.8 9.90
1000
2000
3000
4000
5000
6000
7000
8000
9000
10000
Time [s]
Ne,
Nr
[rp
m]
Ne
Nr
Fig. 4.23 Command and actual rotor speeds at 3 times base speed (7800 rpm)

80
9.5 9.6 9.7 9.8 9.9-50
0
50
100
150
200
Time [s]
Te,
TL
[Nm
]
Te
TL
Fig. 4.24 Load and developed torque at 3 times base speed (7800 rpm)
9.5 9.6 9.7 9.8 9.90
1
2
3
4
5x 10
4
Time [s]
P [W
]
Fig. 4.25 Machine output power at 3 times base speed (7800 rpm)

81
9.5 9.6 9.7 9.8 9.9-600
-500
-400
-300
-200
-100
0
100
200
300
400
Time [s]
Iq, I
d [A
]
Iq
Id
Fig. 4.26 id and iq components of the armature current at 3 times base speed (7800
rpm)
Figures 4.27 through 4.30 show the dynamic response of the system during
acceleration. The command speed is such that the machine starts from zero speed,
stays at base speed until it reaches steady state at that speed. In the sequence the
machine is accelerated until the critical speed, and it is held at that speed until it
reaches steady state. This acceleration and holding process is repeated for 1.5 and 3
times base speed. Figure 4.27 shows the command and actual rotor speeds. Notice
that below base speed, the system has fast response, but as the machine speed goes
above base speed, the system response is slow. The system response gets sluggish
above base speed because the output voltage of the inverter has already reached its
maximum value at base speed. Therefore the system lacks capacity to provide high

82
torque and fast speed response for the machine. Notice that as the speed increases, the
system sluggishness increases because the torque decreases inversely proportional to
speed. Figure 4.28 shows the developed torque behavior as speed increases. Figure
4.29 shows the output power of the machine. Notice that the power is held constant
above base speed. Figure 4.30 shows the steady state and dynamic behavior of iq and
id for machine operating below and above base speed.
0 2 4 6 8 100
1000
2000
3000
4000
5000
6000
7000
8000
9000
Time [s]
Ne,
Nr
[rp
m]
Ne
Nr
Fig. 4.27 Rotor speed dynamic response of the system

83
0 1 2 3 4 5 6 7 8 9 10-50
0
50
100
150
200
Time [s]
Te,
TL
[Nm
]
Te
TL
Fig. 4.28 Load and developed torque during machine acceleration
0 2 4 6 8 100
1
2
3
4
5x 10
4
Time [s]
P [W
]
Fig. 4.29 Machine output power during machine acceleration

84
0 1 2 3 4 5 6 7 8 9 10-600
-500
-400
-300
-200
-100
0
100
200
300
400
Time [s]
Iq, I
d [A
]
Iq
Id
Fig. 4.30 iq and id behavior during machine acceleration
IV.6 – Conclusions
Vector control of PMSM with field weakening was described. Analysis of the
operation limits of the system was done. This analysis considers the voltage and
current limits. The result of this analysis showed that the constant power operation
range of the PMSM when using VC with field weakening technique is narrow for low
inductance machines. For the machine under study the CPOR is only 23% of the base
speed.
In order to verify the analysis, a SIMULINK model of the system was built
and the system was simulated. Steady state and dynamic results at base speed, critical
speed and above critical speed were given. The results showed that in order to keep

85
the machine developing rated power above the base speed the current has to increase
above the current limit, which is extremely pernicious to the system. However, if the
armature current is kept under the current limit, the machine stops developing rated
power at 23% above base speed. Therefore, this technique cannot be used for
applications that require high-speed operation. In order to show that DMIC is a better
option for these kind of applications, Chapter V will compare the performance of
VCFW with DMIC in high speed operation and show that DMIC/PMSM system can
develop rated power at high speed without exceeding the current limit, while
VCFW/PMSM system cannot.

86
CHAPTER V
ANALYSIS OF DUAL MODE INVERTER CONTROL
V.1 – Introduction
The vector control technique with field weakening has its principles well
explained from the machine perspective. The three-phase model of the machine
cannot be used to explain it. It was developed after the advent of the three-phase
stationary frame to two-phase rotating frame transformation. Therefore, the stator
voltage/current required to drive the PMSM above base speed is obtained from the
analysis of d-q machine model using the field weakening principle, as described in
Chapter IV. The inverter is then controlled in such a way that it supplies the machine
with the required voltage/current. In other words, the field weakening technique was
developed based on the machine operation principle. The inverter was assumed to be
able to satisfy the voltage/current machine requirement.
The DMIC, described in Chapter III, on the other hand, was developed using
the three-phase model of the PMSM machine in adjunct with the inverter operation.
The principle of the DMIC is to control the power flowing between the dc link and
the machine through the inverter and to avoid regeneration through the bypass diodes
when motoring operation is desired. Therefore, the DMIC is well understood using
the DC link-machine power flow and the inverter/ac-voltage control; however, it is

87
not explained from the machine operation point of view. The coupling among the
three phases given in the machine model makes it difficult to understand the machine
behavior when it is driven by DMIC. Although, the machine is not in three-phase
operation when driven by DMIC, it is still possible to apply the three-phase rotating
frame to two-phase synchronous frame transformation. The analysis of the d-q model
of the PMSM/DMIC system can help to explain DMIC from the machine perspective.
The limit of the constant power speed range using DMIC can also be found from this
analysis. Therefore, the objective of this work is to explain DMIC by analyzing
DMIC driven PMSM using the d-q model of the PMSM.
V.2 – Analytical Equations of the PMSM Armature Phase Currents and Phase
Voltages in DMIC/PMSM System
The DMIC driving a PMSM was described in Chapter III. However, there,
only the description and simulation results were given. In this section, analytical
expressions of the phase currents and phase voltages will be derived.
Above the base speed, the DMIC drives PMSM in two different modes: three-
phase operation and single-phase operation. The three-phase operation occurs during
commutation and the single-phase operation after commutation is over. The switching
states change every 60 degrees, meaning that every 60 degrees there will be a
commutation period and an post commutation period. An inverter can operate in 8
different states; six non-zero states and two zero states. This analysis is only

88
concerned about the six non-zero states. It would seem to be necessary to do the
commutation and post commutation analysis for six 60 degrees sub-intervals in order
to get the analytical expression of the phase currents and voltages for a full cycle.
However, the symmetry of the system allows analyzing only one 60 degrees
subinterval and to obtain the analysis for the next five sub-intervals by shifting and
permuting the expressions derived for the first 60 degree sub-interval.
V.2.1 – Analytical Equations of the PMSM Armature Phase Currents
Figure 5.1 shows DMIC driving a PMSM. To derive the analytical
expressions of the phase currents for the first 60° sub-interval, consider that in the
previous 60° sub-interval the switches Q5, T5, Q6 and T6 were ON. Therefore the
machine was operating on two phases, phase b and phase c. Phase b was connected to
the negative terminal of the DC power supply and phase c was connected to the
positive terminal of the DC power supply. Consider that at the end of that sub-interval
the current in phase a was zero, current in phase b was -I0 and current in phase c was
I0. This is then the initial condition for the 600 sub-interval that will be analyzed, and
at this instant the reference is set, i.e., t is zero (θ = 0).
In the subinterval to be analyzed, the machine stops operating in phases c and
b, and starts to operate in phases a and b. In other words, in this interval, phase c is
the outgoing phase, and phase a is the incoming phase. Initially, when t is zero (θ =

89
T1
T4 T3
T5 T6
T2
M
M
M
R LS ane
+ -
NR LS
bne+ -
R LS cne
+ -
Vdc
D1 D3
Q5
D5
D2
Q1 Q3
Q2 Q6
D6
Q4
D4
Fig. 5.1 DMIC driving a PMSM

90
0), the switches Q1 and T1 are turned ON. The current in phase c commutates to phase
a. Switch Q5 is left ON, but conduction in phase c stops when the current reaches zero
causing thyristor T5 to snap off. Phase c is then isolated from the supply and
commutation is complete. During the commutation period, the machine operates in
three-phase mode. The commutation period starts at θ = 0, and finishes at θ = θc,
where θc is the commutation angle. Figure 5.2 shows the DMIC/PMSM circuit
during the commutation period. The dark continuous line corresponds to elements
that are part of the circuit during this interval, while the gray dashed line corresponds
to the elements that are not part of the circuit.
The second order model of PMSM, as given in chapter II, is:
0( ) ( ) ( ) ( )2 11( ) ( ) ( ) ( )1 230
a a ab ab
c c cb cb
Ri t i t v t e td Li t i t v t e tRdt L
L
− −− = + −− − (5.1)
Making the following change of variable:
bn tθ ω= (5.2)
where:
ωb – base speed
n – rotor speed ωr to base speed ωb ratio;

91
T1
T4 T3
T5 T6
T2
M
M
M
R LS
ane+ -
NR LS
bne+ -
R LS
cne+ -
Vdc
D1 D3
Q5
D5
D2
Q1 Q3
Q2 Q6
D6
Q4
D4
Fig. 5.2 DMIC driving a PMSM during commutation period

92
Substituting Equation 5.2 in 5.1, it results:
0( ) ( ) ( ) ( )2 11 1( ) ( ) ( ) ( )1 230
a a ab ab
c c cb cbb b
Ri i v ed Li i v eRd n n L
L
θ θ θ θθ θ θ θθ ω ω
− −− = + −− − (5.3)
From the description of DMIC driving a PMSM, in Chapter 3, the switches Q1
and T1 are turned ON θa degrees before the line-to-line back-emf eab crosses the DC
link voltage value. If the reference t = 0 (θ=0) is set in the instant that Q1 and T1 are
turned on, then Figure 5.3 shows the line-to-line back emf eab waveform with respect
to the reference.
bnE6
θ
Vdc
abe
dθ aθ
eθ∆
Fig. 5.3 Line-to-line Back emf waveform with respect to the reference at
DMIC/PMSM system

93
From Figure 5.3, the PMSM line-to-line back emfs eab(θ) and ecb(θ) can be
described as:
( )
( )
( ) 6 sin
( ) 6 sin 3
ab b d
cb b d
e nE
e nE
θ θ θ
πθ θ θ
= −
= − +
(5.4)
In Figure 5.3, θa is the advance angle, the angle in advance of the instant that
eab equals Vdc where Q1 and T1 are fired. Angle θd is the delay angle. θd is the angle
after firing Q1 and T1 at which eab crosses zero. The angle ∆θe is the difference
between θa and θd and is given by:
1sin6
dce a d
b
VnE
θ θ θ − ∆ = − =
(5.5)
In this discussion we consider only commutation option 1, and the applied
machine armature voltages vab and vcb during commutation are:
ab cb dcv v V= = (5.6)
Therefore, for 0 cθ θ≤ ≤ , disregarding the winding resistance R, the state
model of the circuit shown in Figure 5.2 is:

94
( ) ( )2 11( ) ( )1 23
a dc ab
c dc cbb
i V edi V ed n L
θ θθ θθ ω
−− = −−
(5.7)
The first order differential equations above were solved with the following
boundary values:
1
0 1
0
(0) 0 ( )(0) ( )(0) ( ) 0
a a c
b b c
c c c
i i Ii I i Ii I i
θθθ
= == − = −= =
(5.8)
The analytical expressions of phase currents during the commutation period
are:
( )
( )
( )
0
1 2 2( ) 3 2 sin 3 2 sin3 3 3
1 2( ) 2 3 2 sin 3 2 sin3 3
23 2 sin 3 2 sin3
1( ) 3 2 sin 3 2 sin3
a dc b d b db
b dc b d b db
b d b d
c dc b d bb
i V nE nEn L
i V nE nEn L
nE nE I
i V nE nEn L
π πθ θ θ θ θω
πθ θ θ θ θ θω
πθ θ
θ θ θ θ θω
= − − − − +
= − − − − − − − + − −
= − − − ( )( ) 0d I+
(5.9)
where I0 and I1 are given by:

95
( ) ( )( )0
1
1 3 2 sin 3 2 sin3
1 2 23 2 sin 3 2 sin3 3 3
dc c b c d b db
dc c b c d b db
I V nE nEn L
I V nE nEn L
θ θ θ θω
π πθ θ θ θω
= − − − −
= − − − − +
(5.10)
After the commutation period is over, the phase c current reaches zero and
thyristor T5 turns OFF. From this point on, the machine starts to operate in single-
phase, i.e., on two phases a and b. Figure 5.4 shows the active circuit between the
instant that the commutation is over and the end of the 600 sub-interval. Therefore
this circuit is valid for θ between θc and 3π .
Equation 5.11 gives the first order model of the circuit in two-phase operation.
( )( ) 1 ( ) ( )2
aab ab
di t v t e tdt L
= − (5.11)
The boundary values for the first order differential equation above are:
( )( )( )
1 0
1 0
( ) 3
( ) 3
( ) 0 03
a c a
b c b
c c c
i I i I
i I i I
i i
πθ
πθ
πθ
= =
= − = −
= =
(5.12)

96
T1
T4 T3
T5 T6
T2
M
M
M
R LS
ane+ -
NR LS
bne+ -
R LS
cne+ -
Vdc
D1 D3
Q5
D5
D2
Q1 Q3
Q2 Q6
D6
Q4
D4
a
b
c
Fig. 5.4 DMIC driving a PMSM after commutation period

97
Equation 5.13 gives the phase currents obtained solving Equation 5.11 subject
to the boundary values given in Equation 5.12.
1
1
1( ) ( ) 6 sin 6 sin2 2 2
1( ) ( ) 6 sin 6 sin (5.13)2 2 2
( ) 0
a dc c b d b c db
b dc c b d b c db
c
i V nE nE In L
i V nE nE In L
i
π πθ θ θ θ θ θ θω
π πθ θ θ θ θ θ θω
θ
= − − − − + − − +
= − − − − − + − − −
=
Equations 5.9, 5.10, and 5.13 completely describe the phase currents in the
600 sub-interval under consideration as functions of the system parameters and the
commutation angle θc. The commutation angle θc can be found from Equation 5.14.
( )2 sin 2 sin 03 3 3
dc dcd c c d
b b
V VnE nE
π πθ θ θ θ + − + − − =
(5.14)
Equation 5.14 is an implicit equation of θc and the system parameters.
Therefore, the phase current equations cannot be found explicitly only as function of
the system parameters. An approximation of Equation 5.14 could be found, but this
would give some errors in the results. The choice then is to numerically solve
Equation 5.14, to find θc, and to use the value of θc in Equations 5.9, 5.10, and 5.13.
Then the phase current equations will be only functions of the system parameters.

98
To test the equations, a MATLAB code was written, and the same system
parameters given in Table 4.1 were used. Figure 5.5 shows the phase currents ia, ib
and ic for the machine operating at 5 times base speed. The current waveforms are
similar to those current waveforms in Figure 3.10. The difference in the peak value is
because that, unlike the PSpice simulator where all machine parameters were
considered, in the present analytical equations the winding resistance was
disregarded. The winding resistance causes the peak value of the phase currents from
the PSpice simulation to be smaller, since it increases the machine impedance.
0 1 2 3 4 5 6 7
x 10-4
-300
-200
-100
0
100
200
300
Time [s]
Ph
ase
curr
ents
[A]
ia ib ic
Fig. 5.5 Armature phase currents for the machine operating at 5 times base speed

99
The current waveforms in Figure 5.5 does not help to explain the DMIC
principles from the machine point of view. The next sections of this chapter will
explain it using the d-q current components.
V.2.2 – Analytical Equations of the PMSM Phase Voltages
During the commutation period, because each phase has a thyristor
conducting, the phase voltages at the PMSM armature are the phase voltages at the
output of the VFI. The armature phase voltage during this interval is then given in
Equation 5.15.
3
23
3
dcan
dcbn
dccn
Vv
Vv
Vv
=
= −
=
(5.15)
After the commutation is over, because both thyristors in one phase are OFF,
the phase voltages at the PMSM armature are not the same as the phase voltage at the
output of the VFI. In fact, the expressions of the PMSM armature phase voltages are
not so obvious to obtain for this interval. During this interval, the DMIC/PMSM
system is in two-phase operation. The difference of potential between the machine
neutral point and a fictitious center tap of the DC link voltage vn0 is not one third of

100
the sum of the three phase-to-middle point of DC link voltages va0, vb0, and vc0.
Therefore, the equations generally used to obtain the phase-to-neutral voltages are not
valid. For this operation, the mesh analysis of the circuit must be done. Equation 5.16
shows the equation to be solved in order to obtain the expressions of phase-to-neutral
PMSM armature voltages. These equations were derived based in the circuit shown in
Figure 5.4.
aan s an
bbn s bn
cn cn
div L edt
div L edt
v e
= +
= +
=
(5.16)
Using expressions of the phase currents given in Equation 5.13 to solve
Equation 5.16, the following expressions for PMSM armature phase voltages are
found:
6 cos 2 sin2 2 2 6
6 cos 2 sin2 2 2 6
2 sin2
dc ban b d b b d
dc bbn b d b b d
cn b b d
V E nv n t E n n t
V E nv n t E n n t
v E n n t
π πω θ ω θ
π πω θ ω θ
πω θ
= − − − + − −
= − − − − + − −
= − +
(5.17)

101
Figure 5.6 shows the phase voltages for a full cycle. This figure was plotted
using a MATLAB code that implemented Equations 5.16 and 5.17.
The voltage waveforms shown in Figure 5.6 do not give much information
about the power conversion process in the DMIC/PMSM drive system. However,
they show that the voltages assume higher amplitudes than the square-wave operation
case of the standard VFI.
V.3 – Equations of the dq Components of the Armature Current and Voltage
The analytical equations of phase currents and voltages of the PMSM when
0 1 2 3 4 5 6 7
x 10-4
-450
-350
-250
-150
-50
50
150
250
350
450
Time [s]
Pha
se V
olta
ge [V
]
vcn van vbn
Fig. 5.6 Armature phase voltages for the machine operating at 5 times base speed

102
PMSM is driven by DMIC were derived in the previous section. However, these
equations do not explain why the PMSM can develop rated power at speeds as high
as 5 times base speed without exceeding the current limit. In this section, analytical
expressions of id, iq, vd, and vq are derived. These expressions and the dq model of the
PMSM will be used to explain the capability of the DMIC to drive PMSM at high
speeds The id, iq, vd, and vq expressions are obtained by applying the abc to dq
transformation to the phase current and voltage equations obtained in the previous
sections.
V.3.1 – Equations of the dq Components of the Armature Current
As shown is Figure 5.1, the PMSM is wye connected, therefore, Equation 5.18
gives the abc to d-q transformation of the current.
( ) ( )( ) ( )
2 2cos cos cos2 3 33 2 2sin sin sin3 3
aq
bd
c
ii
ii
i
π πθ θ θ
π πθ θ θ
− + = − +
(5.18)
As it was done for the phase current, the derivation of id and iq currents will be
done initially for 600 sub-interval, and the results will be shifted and permuted in
order to obtain the whole 3600 cycle The transformation given in Equation 5.18 is
applied in one 600 sub-interval. Within the 600 subinterval, the transformation must

103
be applied twice, during the commutation period and after the commutation period is
over.
Equation 5.19 shows id and iq equations of the PMSM armature current during
the commutation period.
( )
( )
2sin sin sin6 36
sin sin sin3 33 2
3 2sin sin sin3 3 26 2 3
q b d d b dbb
c b d c d b dbb
d b d d b dbb b
KVdc Ki t n t n tE
KVdc Kt n t n tE
KVdc K Ki t n t n tE
KVdc
π πω θ θ ω θω
π πω θ θ θ ω θω
π π πω θ θ ω θωω
= − + − + − −
− + + − − +
= − − − + + − + −
( )sin sin sin6 63 2 c b d c d b d
bb
Kt n t n tE
π πω θ θ θ ω θω
− − + − − −
(5.19)
where: 2 63
bEKL
=
r
rb
n ωω
= - actual and base speed ratio
cc
b
tnθω
= - commutation period
After commutation is over, the equations for id and iq currents are:

104
( ) ( ) ( )( )
( ) ( )
( )
( )
3( ) 3 sin sin 246 2
3 2sin sin sin sin2 2 3
2sin sin3
(5.20)
3 3( ) 3 sin sin 22 4 46 2
q c b d b dbb
c d b d c d b db b
d b db
d c b db bb
KVdc Ki t t t n t n tE
K Kn t n t
K n t
KVdc K Ki t t t n tE
ω θ ω θω
π πθ θ ω θ θ θ ω θω ω
πθ ω θω
πω θω ω
= − − + − +
− − − − − − − −
+ −
= − − − − +
( )2
3 2sin sin sin sin2 2 2 3 2
2sin sin3 2
b d
c d b d c d b db b
d b db
n t
K Kn t n t
K n t
πω θ
π π π πθ θ ω θ θ θ ω θω ω
π πθ ω θω
− − +
− − − − − − − − − −
+ − −
Therefore, equations 5.19 and 5.20 are the analytical expressions of id and iq
over a 60° interval. Figure 5.7 shows the id, and iq currents for the machine operating
at 5 times base speed. This is the same operating point as the one for the phase
currents shown in Figure 5.5.
As we can see from Figure 5.7, the currents id and iq repeat at all six 600 sub-
intervals. It means that id and iq are periodic functions of the time, and the period is
six times smaller than the fundamental period of the three-phase currents. In other
words, the frequency of the id and iq currents is 6 times the fundamental frequency.
Therefore, equations 5.19 and 5.20 fully describe the behavior of id and iq when
PMSM is driven by DMIC.
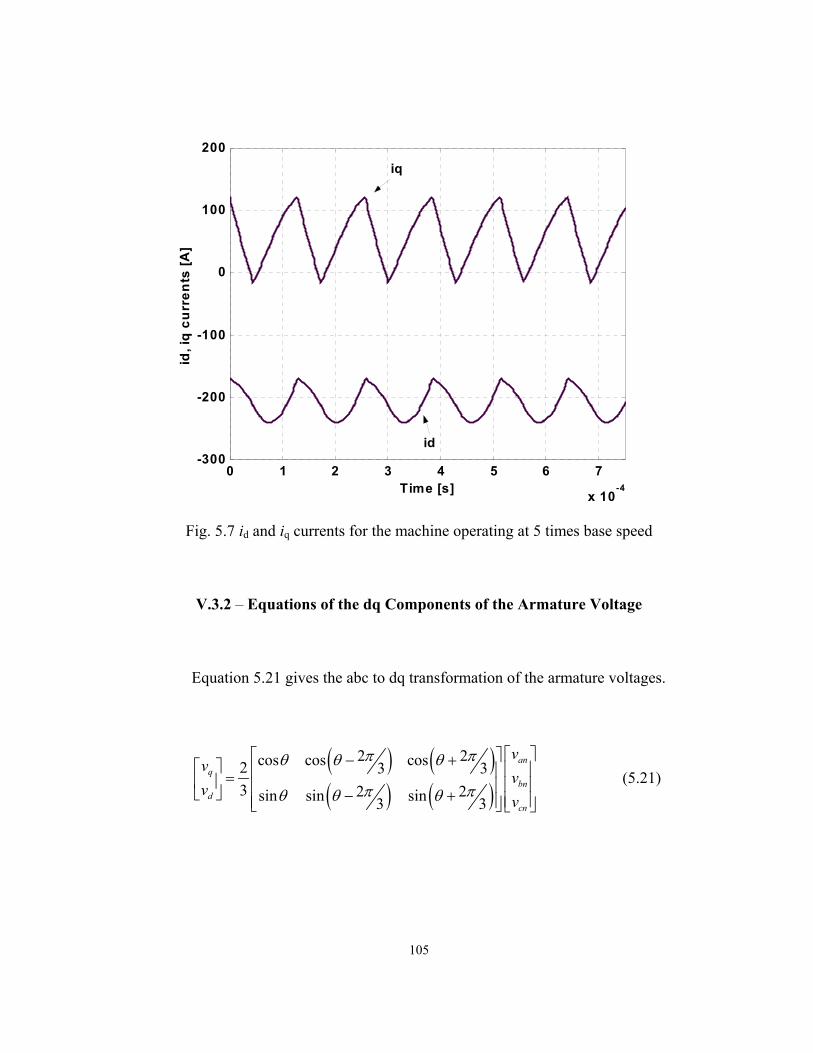
105
0 1 2 3 4 5 6 7
x 10-4
-300
-200
-100
0
100
200
Time [s]
id, i
q c
urr
ents
[A]
iq
id
Fig. 5.7 id and iq currents for the machine operating at 5 times base speed
V.3.2 – Equations of the dq Components of the Armature Voltage
Equation 5.21 gives the abc to dq transformation of the armature voltages.
( ) ( )( ) ( )
2 2cos cos cos2 3 33 2 2sin sin sin3 3
anq
bnd
cn
vv
vv
v
π πθ θ θ
π πθ θ θ
− + = − +
(5.21)
106
Following the same strategy done for the currents, the dq expressions of the
voltages were found. Equation 5.22 shows the expressions of vd and vq voltages
during the commutation period.
2 sin3 6
2 sin3 3
dcq d
dcd d
Vv
Vv
πθ θ
πθ θ
= − +
= − −
(5.22)
Equation 5.23 shows the expressions of vd and vq voltages after the
commutation period is over.
( )
( )
23 sin 2 cos ( )3
3 2sin sin(2( ))3 2
dcq b d b b d
dc bd b d b d
Vv n t E n n t
V E nv n t n t
ω θ ω θ
ω θ ω θ
= − + −
= − − + −
(5.23)
Equations 5.22 and 5.23 are the analytical expressions of vd and vq over a 600
interval. Figure 5.8 shows vd and vq for full cycle. They are the vd and vq equivalent
voltages to van, vbn, and vcn shown in Figure 5.6. Because vd and vq are pulsating, it is
difficult to understand their effect in the PMSM operation. The effect of the d-q
voltages and currents given in this section for the PMSM operation is given in the
next sections using the average values of the d-q voltages and currents.

107
0 1 2 3 4 5 6 7
x 10-4
-200
-100
0
100
200
300
400
Time [s]
DQ
vo
ltag
es [
V]
vq
vd
Fig. 5.8 vd and vq voltages for the machine operating at 5 times base speed
V.4 – Analysis of PMSM Driven by DMIC Using the PMSM dq Model.
The analytical expressions of dq equivalent currents and voltages as functions
of the system parameters were derived in section V.3. Therefore, now, the PMSM
driven by DMIC can be analyzed using the dq theory. In other words, the same
analysis in the dq plane that was done for VC with field weakening (VCFW) will be
done for DMIC.
However, the analysis in dq plane must be done with DC values, while for
DMIC, id, iq, vd, and vq, as shown in section V.3, are pulsating. Therefore, the analysis
has to be done considering the average values of these variables. The analysis of the

108
average values of id, iq, vd, and vq is a valid approach since we are concerned about the
average power developed by the machine and also because the peak values of the
equivalent phase currents and voltages at the inverter are monitored not to exceed the
switches ratings.
The id, iq expressions are obtained using the definition of average value, as
given in (5.24).
3 3
1 20 0
3 3
1 20 0
1 3( ) ( ) ( )3
1 3( ) ( ) ( )3
c
c
c
c
q q q q
d d d d
I i d i d i d
I i d i d i d
π πθ
θ
π πθ
θ
θ θ θ θ θ θπ π
θ θ θ θ θ θπ π
= = +
= = +
∫ ∫ ∫
∫ ∫ ∫
(5.24)
where:
iq1(θ) – instantaneous iq current during commutation interval (Equation 5.19)
id1(θ) – instantaneous id current during commutation interval (Equation 5.19)
iq2(θ) – instantaneous iq current after commutation is over (Equation 5.20)
id2(θ) – instantaneous id current after commutation is over (Equation 5.20)
The final expressions of the average value of id and iq are very complex and
do not give any explicit information about their behavior as functions of speed. For
this reason, they are not given.

109
The expressions of the average values of vd and vq were obtained following
the steps used for id and iq. However, the expressions for the average value of vd and
vq are not complicated and they are given by:
( )
( )
2 2 23 cos cos3 6 3 6 2 3
3 3 2 2cos cos sin3 3 3 4 3
2 sin4
2 2 23 2cos cos cos3 3 3 3 4 3
dc dc bq d c d c
dc dc bc d d d
bc d
dc dc bd c d d
V V EV n
V V E n
E n
V V EV n
π π πθ θ θ θπ
π πθ θ θ θ
θ θ
π π πθ θ θπ
= − − − + + − +
− − − + − −
−
= − − − + − − −
( )
2
2 cos 2 24
d
bc d
E n
θ
θ θ
− +
−
(5.25)
The equations of average values of id, iq, vd and vq do not result in conclusions
about their behavior as functions of speed. However, in Equation 5.25, the factor n,
which is the ratio of actual speed to base speed, multiplies some terms of the
equation. This implies that the absolute value of the average values of the armature
voltages increase as speed increases.
In order to see the behavior of the average values of the currents and voltages
as functions of speed, a MATLAB code was written and the average values of the
quadrature current Iq, direct current Id, total armature current IT, quadrature voltage
Vq, direct voltage Vd, and total armature voltage VT were calculated for the example

110
motor. Table 5.1 shows these values for speeds varying from 2 to 10 times base
speed. These values were obtained for the machine developing rated power and the
peak and rms values of the armature phase currents below the limit. Column eight is
the voltage circle limit radius calculated using the average values of the voltages for
DMIC. Column nine is the voltage circle limit radius for VCFW. This radius is
calculated using the maximum output voltage of the VFI.
The results shown in Table 5.1 are meaningful. Table 5.1 shows that the value of the
d and q components of the armature current varies, but the total current, which is the
magnitude of the vector defined by these components, is almost constant and its value
is around the value of current limit 215A. Notice that the current iq decreases as
Table 5.1 – Average Values of Voltages and Currents
n Iq (A) Id (A) IT (A) Vq (V) Vd(V) V (V) VR-DMIC VR-VCFW
2 143.74 -160.61 215.54 109.76 -34.55 115.08 478.54 428.88
3 95.87 -194.28 216.65 152.51 -34.55 156.37 433.51 285.92
4 71.89 -204.47 216.75 198.44 -34.50 201.42 418.81 214.44
5 57.62 -209.43 217.21 245.08 -34.59 247.51 411.71 171.55
6 47.95 -211.43 216.84 292.66 -34.45 294.68 408.48 142.96
7 40.94 -212.34 216.25 340.66 -34.45 342.40 406.82 122.54
8 35.81 -212.75 215.75 388.96 -34.25 390.46 405.94 107.22
9 32.00 -215.00 217.36 435.10 -34.69 436.48 403.36 95.31
10 28.78 -214.94 216.85 483.55 -34.47 436.48 403.19 85.78

111
speed increases following the 1n
rule, which assures that the machine develops
average power equal to the rated power. On the other hand, the voltages have an
interesting behavior. The q component of the voltage increases as the speed increases,
but the d component remains constant. Therefore, the total armature voltage increases
as speed increases.
In order to understand the influence of the current and voltage behavior on the
machine operation, the analysis using the iq-id plane must be done. This is the same
analysis as that done for VC with field weakening in Chapter IV. The current limit
circle is the same, thus, the voltage limit circle will change. In VCFW, the maximum
PMSM armature voltage is the maximum output voltage that the VFI can provide. In
the DMIC, the PMSM is not connected to the three-phase output of the VFI, but only
to two of them. The third phase is floating and therefore the armature voltage is not
the three-phase voltages provided by the VFI, but the voltages given in Equations
5.16 and 5.17 This operating condition, which is guaranteed by the thyristor turning
off to avoid regeneration, provides a total armature voltage to the machine that is
higher than the output voltage a VFI can provide. Moreover, as shown in Table 5.1,
this voltage increases as the speed increases. To better illustrate this phenomenon,
waveforms of the three different operating conditions of the PMSM using DMIC and
VCFW are plotted.
Figure 5.9 shows a plot of the current and voltage limits of the PMSM using
DMIC and VCFW for machine operating at twice the base speed. The current vectors
for both drive systems are also shown in this figure. Notice that the current limit

112
-1200 -1000 -800 -600 -400 -200 0 200-600
-500
-400
-300
-200
-100
0
100
200
300
400
500
600n=2
VCFW
DMIC
Iq1=Iq2
Id1Id2
iq [A]
id[A]
Fig. 5.9 Current and voltage limits of the PMSM using DMIC and VCFW for
machine operating at twice the base speed
circle is the same for both techniques, however the voltage limit circle is bigger for
DMIC than for VCFW. If iq is controlled to vary following the mI ax
n rule, then the
machine is assured to be developing rated power. For DMIC driving the machine, the
current vector is inside of the intersection of the two circles defined by the current
and voltage limits. However, if VCFW is used, the current vector will be either
violating the current limit or smaller than what is required to develop rated power.

113
The capability of the DMIC to drive PMSM above the base speed against the
ineffectiveness of VCFW becomes yet more apparent when speed increases. Figure
5.10 shows the plot of id-iq plane for the machine operating at 5 times the base speed.
Again notice that in order to develop rated power, the machine when driven by DMIC
operates without violating the voltage and current constraints, while when it is driven
by VCFW one of the constraints must be violated. It is clear from this figure that the
voltage limit shrinks for both techniques; however, it shrinks faster for VCFW than
for DMIC.
-1200 -1000 -800 -600 -400 -200 0 200-600
-500
-400
-300
-200
-100
0
100
200
300
400
500
600n=5 iq [A]
Iq1=Iq2
Id1Id2
VCFW DMIC
id[A]
- E bω b L
Fig. 5.10 Current and voltage limit of the PMSM using DMIC and VCFW for
machine operating 5 times base speed

114
Finally, to show the the superiority of DMIC compared to VCFW more
effectively, Figure 5.11 shows the plot of id-iq plane for the machine operating at 9
times the base speed.
V.5 – Limit of Constant Power Operation Range of the PMSM Driven by DMIC
The differences between DMIC and VCFW from the machine point of view were
identified and analyzed in section V.4. The superiority of DMIC over VCFW in
allowing the machine to develop rated power at high speed was pointed out.
-1200 -1000 -800 -600 -400 -200 0 200-600
-500
-400
-300
-200
-100
0
100
200
300
400
500
600 n=9 iq [A]
Iq1=Iq2
Id1Id2
VCFW DMIC
id[A]
- Ebω bL
Fig. 5.11 Current and voltage limits of the PMSM using DMIC and VCFW for
machine operating 9 times the base speed

115
However, the question about the speed limit at which the DMIC can drive PMSM
developing rated power remains unanswered. This section addresses this subject to
show that there is no theoretical limit of CPOR when PMSM is driven by DMIC.
As mentioned before, for the machine to develop rated torque at n times the
base speed, the quadrature current at that speed Iqn must be controlled following
Equation 5.26.
m mI In
rb ax axq
r
In
ωω
= = (5.26)
In order to maintain the total current equal to the current limit Imax, Idn must be
controlled following Equation 5.27.
22 2m m
max 1n
ax axd
I II I nn n
= − = −
(5.27)
The radius of the voltage limit circle at n times base speed is given by:
n
n
ar
b
VV
n Lω= (5.28)
where naV is the amplitude of machine armature voltage at n times the base
speed.

116
Therefore, to assure meeting both current and voltage constraints and to
develop rated torque, Equation 5.29 must be satisfied.
22( )n n n
br d q
b
EV I ILω
≥ − + (5.29)
The condition established by Equation 5.29 can be better visualized through
Figure 5.12. The minimum radius of the voltage limit circle is nr
V , which is the
-1200 -1000 -800 -600 -400 -200 0 200-600
-500
-400
-300
-200
-100
0
100
200
300
400
500
600
Iqn
Idn
VRMIN
- Ebω b L
id[A]
iq [A]
Fig. 5.12 Minimum radius of the voltage limit circle for PMSM to develop rated
power

117
hypotenuse of the Pythagorean triangle formed by nqI ,
n
bd
b
E ILω
− , and nr
V . Notice
that the term b
b
ELω
is the distance of the center of the voltage limit circle to the origin.
The expression of the minimum radius of the voltage limit circle is nr
V as a
function of the speed can be found from Equations 5.26, 5.27, and 5.28. Equation
5.30 shows this expression.
2 22m m( ) 1
n
b ax axr
b
E I IV n nL n nω
= − − +
(5.30)
Therefore, the minimum radius of the voltage limit circle at a certain speed
can be calculated using (5.30). Figure 5.13 was plotted to compare the voltage radius
provided by DMIC, VCFW, and the minimum radius given in (5.30). The radius
provided by DMIC and VCFW are the columns 8 and 9 of the Table 5.1 respectively.
The curve MIN represents the minimum voltage limit circle radius necessary for the
machine to develop rated power. The figure shows that the DMIC provides voltage
circle radius above or equal to the minimum requirement. In fact, for speeds below 5
times the base speed, the radius is bigger than the minimum required. This means that
up to 5 times base speed, the machine can actually develop more power than the rated
power without exceeding the current limit. On the other hand, the radius provided by
VCFW is below the minimum requirement for all speeds above 2 times the base
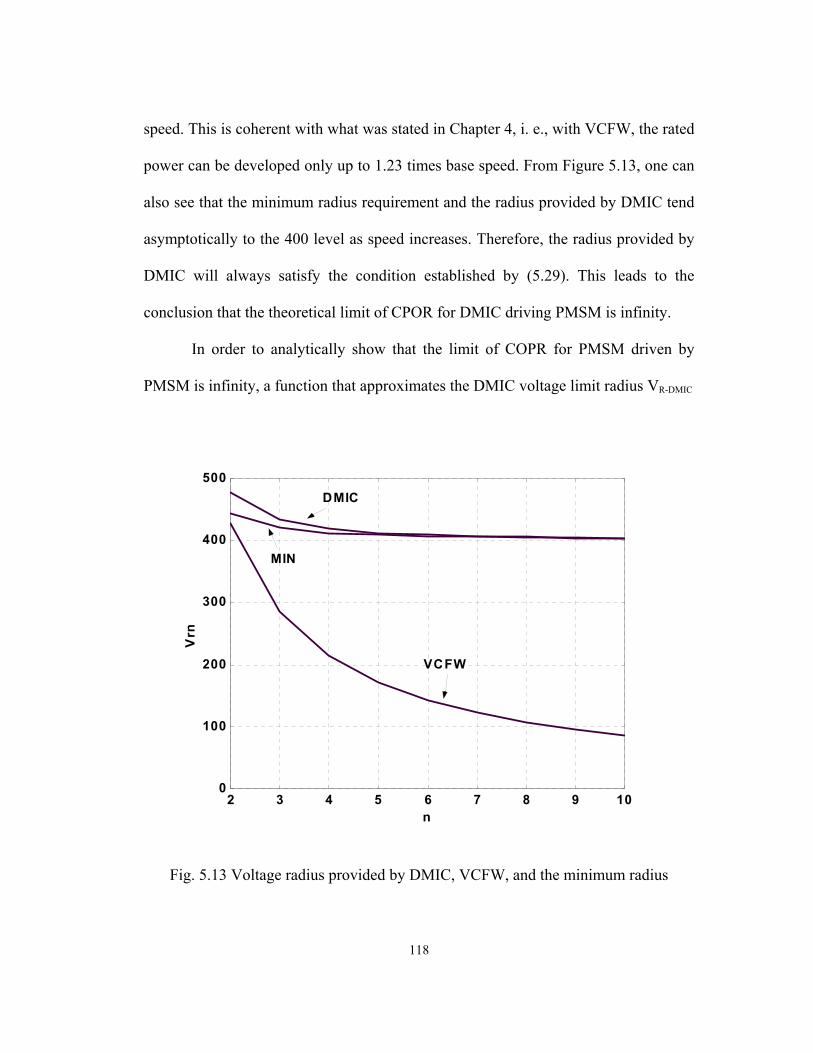
118
speed. This is coherent with what was stated in Chapter 4, i. e., with VCFW, the rated
power can be developed only up to 1.23 times base speed. From Figure 5.13, one can
also see that the minimum radius requirement and the radius provided by DMIC tend
asymptotically to the 400 level as speed increases. Therefore, the radius provided by
DMIC will always satisfy the condition established by (5.29). This leads to the
conclusion that the theoretical limit of CPOR for DMIC driving PMSM is infinity.
In order to analytically show that the limit of COPR for PMSM driven by
PMSM is infinity, a function that approximates the DMIC voltage limit radius VR-DMIC
2 3 4 5 6 7 8 9 100
100
200
300
400
500
n
Vrn
DMIC
MIN
VCFW
Fig. 5.13 Voltage radius provided by DMIC, VCFW, and the minimum radius

119
as function for speed ratio n was found using the data from Table 5.1. Because the
VR-DMIC is similar to that of the minimum radius requirement given in Equation 5.30,
the function that was found for VR-DMIC was also similar, only with a different
constant. The expression of VR-DMIC as a function of the speed ratio is then given by:
2 22m
m 2
21( )n
b axr DMIC ax
b
E InV n IL n nω−
− = − + (5.31)
In order to compare the actual VR-DMIC values with the fitting function, their
values were plotted and the maximum error was calculated. Figure 5.14 shows the
plot of the function versus the actual VR-DMIC values. The figure shows that the
function fits the points very well. The maximum error between the function and the
actual points is 1.16%.
Now, in order to find a relation between the minimum voltage radius and the
voltage limit radius provided by DMIC, the limits of (5.30) and (5.31) were found.
Equation (5.32) gives the limit of the ( )nr
V n as the speed goes to infinity.
2 22m
m m2
1lim ( ) limn
b ax br ax axn n
b b
E I EnV n I IL n n Lω ω→∞ →∞
− = − + = − (5.32)
The limit of ( )nr DMICV n− as the speed goes to infinity is given by:

120
2 3 4 5 6 7 8 9 100
50
100
150
200
250
300
350
400
450
n
Vrn
Function
Actual Points
Fig. 5.14 Actual and fitting function of the voltage limit radius provided by DMIC
2 22m
m m2
21( )n
b ax br DMIC ax axn n
b b
E I Enlim V n lim I IL n n Lω ω−→∞ →∞
− = − + = − (5.33)
Equations 5.32 and 5.33 show that both ( )nr
V n and ( )nr DMICV n− go to the same
value as the rotor speed goes to infinity. This value is mb
axb
E ILω
− . Therefore, this
confirms what was stated previous in this section, which is that theoretically there is
no limit of CPOR when PMSM is driven by DMIC. It is important to emphasize the
relevance of the results given by Equations 5.32 and 5.33, i.e. theoretically a PMSM
can be driven at any speed and still develop rated power. This makes possible to use

121
this type of machine for applications that require high-speed operation, such as
electric vehicles.
V.6 – Conclusions
The drive system DMIC/PMSM was analyzed in this chapter. The analysis
was concerned with explanation of the drive performance above base speed from the
machine perspective. Initially, the expressions of the current and voltages of the
machine in the three-phase, stationary reference frame were derived. These
expressions were shown to be very different from the one with the standard three-
phase operation of the machine.
In order to do the analysis of the system performance, the average values of
the currents and voltages were used. The average values of the id and iq currents were
found to be the required values for the PMSM to develop rated power. However, the
armature voltage was found to be higher than that value for standard three-phase
operation, and it increases as speed increases.
The plot of the current and voltage limit in the id-iq plane showed that the
PMSM armature voltage when DMIC is used provides a voltage limit circle that
allows the machine to develop rated power at different speeds. In the same plot, it
was shown that the VCFW had a much smaller voltage limit circle, and therefore
rated power could not be developed. This was shown for three different speeds, two,
five, and nine times the base speed.
Finally, in order to prove the limit of the CPOR when PMSM is driven by
DMIC, the theoretical minimum radius of voltage limit circle required for the

122
machine to develop rated power was found as a function of the system parameters. A
fitting function that approximates the radius of voltage limit circle provided by DMIC
was found. The function was found to have the same nature of theoretical minimum
radius of voltage limit circle. The limits of both functions when speed goes to infinity
were found to be the same. Therefore, there is not a theoretical speed limit for
DMIC/PMSM drive system. In other words, the DMIC gets rid of the voltage limit
circle constraint, and the current circle is then the only constraint for high-speed
operation of PMSM.

123
CHAPTER VI
SUMMARY
VI.1 Conclusions
In this work, Dual Mode Inverter Control driving Permanent Magnet
Synchronous Machines has been proposed, simulated and analyzed. The performance
of the DMIC/PMSM operating in a wide constant power range has been evaluated.
The PMSM three-phase model in stationary reference frame, as well as its
two-phase dq model in synchronously rotating reference frame has been reviewed.
The three-phase model is used to explain the strategy used by DMIC to drive a
PMSM over the constant power range, while the dq model is used to explain how
DMIC can achieve a wide constant power operation range.
The Phase Advance Angle (PHA) method driving a BDCM is described and
used for comparison. The method is evaluated through simulation and its performance
is found to be poor for low inductance machines. The reason of the inefficiency of
PHA for low inductance machine is identified as the regeneration through the bypass
diodes of the standard voltage-fed inverter.
DMIC driving a BDCM is presented, and its principle is described. In
contrast, the DMIC is shown to be more effective in driving low inductance BDCM

124
because of its ability to avoid the bypass diode conduction and therefore the
regeneration period.
The efficacy of the DMIC driving BDCM was the motivation to propose using
DMIC to drive PMSM, given the large number of similarities between BDCM and
PMSM. The same principle used to drive a BDCM above the base speed is used to
drive the PMSM, i. e., an ac-voltage controller interfacing the VFI and the machine to
block the bypass diode conduction. The PMSM, when driven by DMIC, changes
operation from purely three-phase below the base speed, to hybrid operation above
the base speed. In the hybrid case, the PMSM is in three-phase operation during the
commutation period and single-phase operation after the commutation period is over.
The performance of DMIC/PMSM drive system is found to be excellent. Simulation
results for the machine operating at five times the base speed show that the machine
can develop 15% more than the rated power at this speed with the peak and rms
currents exceeding just 11% and 6% the peak and rms rated values respectively.
Vector control of PMSM with field weakening (VCFW) is described and
analysis of the operation limits of the system is done. This analysis considers the
maximum voltage and current of the machine/inverter system. The result of this
analysis shows that the constant power operation range of the PMSM when using
VCFW strongly depends on the machine parameters and is narrow for low inductance
machines. For the machine under study the CPOR is only 23% of the base speed.
High armature current value is the cost of operating PMSM above critical base speed
at rated power

125
The expressions of the current and voltages of the machine in the three-phase,
stationary reference frame and dq rotating reference frame have been derived for
theDMIC/PMSM drive system. The average value of the voltages and currents in the
dq rotating reference frame was used to model the DMIC/PMSM system from the
machine point of view. The principle is found to be the same of the VCFW, where the
field component of the armature current is used to weaken the air gap field. However,
in VCFW the voltage limit circle is given by the maximum output voltage of the VFI
and therefore shrinks fast. In the DMIC, on the other hand, the voltage limit circle is a
result of the contribution of DC link voltage, the back emf, and the induced voltage
provided by the derivative of the on-phase currents and it shrinks slower as speed
increases compared to VCFW. Analysis of the ratio of the voltage limit circle
provided by DMIC shows that this circle will always satisfy the maximum current
limit condition to provide rated power above the base speed. The conclusion is that
there is no inherent speed limit of CPOR when PMSM/DMIC control scheme is used
because the voltage constraint is eliminated.
The drawback of the DMIC is the high pulsating torque opposing the constant
torque provided by the VCFW. However, considering that the frequency of the
pulsating torque is six times the fundamental frequency, the fundamental frequency is
high above base speed and moreover, the inertia of the machine and load can filter out
the pulsating torque. The pulsating torque should not be a problem for electric vehicle
application. Therefore, DMIC is an excellent option if wide constant power operation
range is required for high inertia load.

126
VI.2 Recommendation for future work
This work instigates questions that may be used as topics for future investigation.
These questions are mainly related to the control strategy for the transition from
below base speed to above base speed and converter topology.
• Control strategy for the transition from below base speed to above base
speed
DMIC driving PMSM above base speed is addressed in this work, but
operation up to base speed and slightly above base speed is not taken into
consideration. Standard Vector Control with optimum torque/ampere ratio is
widely accepted as the best choice for PMSM operating below base speed. If
DMIC is chosen to be used above base speed, then a transition strategy must
be developed. The transition has to be carefully analyzed because VC
provides constant torque and DMIC provides highly pulsating torque. The two
strategies that can be addressed in this topic are described below.
• In this work, the control variables used were the advance angle and the
blanking angle. Therefore, a strategy for smooth transition from below
base speed to above base speed using advance angle and blanking angle as
control variables must be found.

127
• In the inner loops, VC uses id and iq as the control variables, and they are
controlled to be DC. A promising research subject would then be to use
current control for DMIC and use the command currents to achieve
smooth transition from below to above base speed. This investigation
should follow the steps below:
• Generate profiles of id and iq that DMIC would generate as function of
speed, and use them as the current command. These profiles are given
by id and iq equations shown in this work
• In the transition range, make the currents smoothly changes from DC
to the pulsating current required by DMIC.
• Converter topology
The proposed converter topology works very well and is also the best
topology to explain the DMIC principle. However, different topologies that may be
more efficient or have lower cost can be investigated.
• Minimum inductance
The analysis done in this dissertation refers to a low inductance machine.
However the minimum inductance required for DMIC to work was also addressed.
Therefore, a complete study of the effect of the inductance in the DMIC/PMSM drive
system is an important subject to be investigated.

128
REFERENCES

129
[1] P. Pillay; R Krishnan; "Modeling, Simulation, and Analysis of Permanent-
Magnet Motor Drives, Part I: The Permanent-Magnet Synchronous Motor
Drive", IEEE Transactions on Industry Applications, Vol 25, No. 2, pp. 265-
273, March/April 1989
[2] Thomas M. Jahns, Variable Frequency Permanent Magnet AC Machine
Drives, Chapter 6 of the book "Power Electronics and Variable Frequency
Drives", IEEE Press, New York, 1997;
[3] J. M. Bailey, J. S. Lawler, B. Banerjee, "Five Phase Trapezoidal Back Emf
PM Synchronous Machines and Drives", Proc. European Power Electron.
Conference, Florence, Italy, pp. 1-61991.
[4] A. D. P. Kinniment, A. Jack, "An Integrated Circuit Controller for Brushless
DC Drives", Proc. European Elec. Conference. (EPE), Florence, Vol. 4, pp.
111-116, 1991.
[5] Lee, P. W. and C. Pollock, "Rotor Position Detection Techniques for
Brushless PM and Reluctance Motor Drives", IEEE-IAS Annual Meeting Rec.,
pp 448-455, 1992
[6] Wu, R., G. R. Slemon, "A Permanent Magnet Motor Control Without a Shaft
Sensor", IEEE-IAS Annual Meeting Rec., pp 553-558, 1990.
[7] P. Pillay; R Krishnan; "Modeling, Simulation, and Analysis of Permanent-
Magnet Motor Drives, Part II: The Brushless DC Motor Drive", IEEE
Transactions on Industry Applications, Vol 25, No. 2, pp. 274-279,
March/April 1989

130
[8] T. Sebastian, G. R. Slemon, "Operating Limits of Inverter-Driven Permanent
Magnet Motor Drives", IEEE Transactions on Industry Applications, Vol. 23,
No. 2, pp. 327-333, March/April, 1987.
[9] J.S. Lawler, J. M. Bailey, J. W. Mckeever, Extended Constant Power Speed
Range of the Brushless DC Motor through Dual Mode Inverter Control,
ORNL, 1999.
[10] S. Morimoto, Y. Takeda, T. Hirasa; "Flux-Weakening Control Method for
Surface Permanent Synchronous Motors, Proc. IPEC-Tokyo'90, pp. 942-949,
1990
[11] T. M. Jahns, "Flux-Weakening Regime Operation of tan Interior Permanent-
Magnet Synchronous Motor Drive", IEEE Transactions on Industry
Applications, Vol. 23, No. 4, pp. 681-689, July/August 1987.
[12] B. Sneyers, D. W. Novotny, T. A. Lipo, "Field Weakening in Buried
Permanent Magnet AC Motor Drives", IEEE Transactions on Industry
Applications, Vol. 21, No. 2, pp. 398-407, March/April 1985.
[13] C. C. Chan, J. Z. Jiang, W. Xia, K. T. Chau; "Novel Wide Range Speed
Control of Permanent Magnet Brushless Motor Drives", IEEE Transactions
on Power Electronics, Vol. 10, No. 5, pp. 539-546, September, 1995.
[14] C. S. Cambier, J. F. Lutz, "Brushless DC Motor Using Phase Timing
Advancement", United States Patent 5677605, October 14, 1997.
[15] P. C. Krause, "Analysis of electric machinery",McGraw-Hill, New York, 1986

131
[16] T. J. E. Miller, "Brushless Permanent- Magnet and Reluctance Motor Drives",
Oxford University Press, New York, 1989.
[17] B. K. Bose, "A High-Performance Inverter-Fed Drive System of Interior
Permanent Magnet Synchronous Machine", IEEE Transactions on Industry
Applications, Vol. 24, No. 6, pp. 987-997, November/December 1988.
[18] S. Morimoto, Y. Takeda, T. Hirasa, K. Taniguchi, "Expansion of Operating
Limits for Permanent Magnet Motor by Current Vector Control Considering
Inverter Capacity", IEEE Transactions on Industry Applications, Vol 26, No.
5, pp. 866-871, September/October 1990.
[19] M. Bodson, J. Chiasson, L. Tolbert, "A Complete Characterizations of Torque
Maximization for Permanent Magnet Non-salient Synchronous Motor", IEEE
American Controls Conference, June 25-27, 2001, Arlington, Virginia.
[20] Y. Sozer, D. A. Torrey, "Adaptive Flux Weakening Control of Permanent
Magnet Synchronous Motors" IEEE-IAS Annual Meeting Rec., pp 475-482,
1998
[21] L. Werner, "Control of Electrical Drives", Springer-Verlag, Berlin, 1996
[22] D. W. Novotny, T. A. Lipo, "Vector Control and Dynamics of AC Drives",
Oxford University Press, New York, 1996.
[23] A. Kumamoto, Y. Hirane, "A Flux-Weakening Method of a Buried Permanent
Magnet Motor with Consideration of Parameter Detuning on System
Performance",

132
[24] B. J. Chalmers, L. Musaba, D. F. Gosden, "Performance Characteristics of
Synchronous Motor Drives with Surface Magnets and Field Weakening"
IEEE-IAS Annual Meeting Rec., pp 511-517, 1996
[25] L. Xu, C. Wang, "Implementation and Experimental Investigation Sensorless
Control Schemes for PMSM in Super-High Variable Speed Operation", IEEE-
IAS Annual Meeting Rec., pp 483-489, 1998
[26] J. Kim, S. Sul, "Speed Control of Interior Permanent Magnet Synchronous
Motor Drive for he Flux Weakening Operation", ", IEEE Transactions on
Industry Applications, Vol 33, No. 1, pp. 43-48, January/February 1997.
[27] S. R. Macminn, T. M. Jahns, "Control Techniques for Improved High-Speed
Performance of Interior PM Synchronous Motor Drives", IEEE Transactions
on Industry Applications, Vol 27, No. 5, pp. 997-1004, September/October
1991.
[28] J. A. Haylock, B. C. Mecrow, A. G. Jack, D. J. Atkinson, "Enhaced Current
Control of PM Machine Drives Through the Use of Flux Controllers", ",
IEEE-IAS Annual Meeting Rec., pp 467-474, 1998
[29] Z. Q. Zhu, Y. S. Chen, D. Howe, "Online Optimal Flux-Weakening Control of
Permanent-Magnet Brushless AC Drives", IEEE Transactions on Industry
Applications, Vol 36, No. 6, pp. 1661-1668, November/December 2000

133
[30] S. D. Sudhoff, K. A. Corzine, H. J. Hegner, "A Flux-Weakening Strategy for
Current-Regulated Surface-Mounted Permanent-Magnet Machine Drives",
IEEE Transactions on Energy Conversion, Vol 10, No. 3, pp. 431-437,
September 1995
[31] L. Xu, L. Ye, L. Zhen, A. El-Antably, "A New Design Concept of Permanent
Magnet Machine for Flux Weakening Operation", IEEE Transactions on
Industry Applications", Vol 31, No. 2, pp. 373-378, March/April 1995.
[32] P. Vas, "Vector Control of AC Machines" Oxford University Press, New
York, 1990.
[33] C. C. Chan, W. Xin, J. Z. Jiang, K. T. Chau, M. L. Zhu, "Permanent Magnet
Brushless Drives" IEEE Industry Applications Magazine", pp. 16-22,
November/December 1998.
[34] J.O.P.Pinto, B.K.Bose, L.E.Borges and M.P.Kazmierkowski, “A neural
network based space vector PWM controller for voltage-fed inverter induction
motor drive”, IEEE Transactions on Industry Applications, Vol 36, No. 6, pp.
1628-1636, November/December 2000.
[35] J. Holtz, “Pulse width modulation for electric power conversion”, Proc. of the
IEEE, vol. 82, pp. 1194-1214, August 1994.
[36] J. O. Krah and J. Holtz, “High performance current regulation for low
inductance servo motors”, IEEE-IAS Annual Meeting Rec., pp. 490-499, 1998.

134
[37] A. M. Hava, R. J. Kerkman, and T. A. Lipo, "Carrier-based PWM-VSI
overmodulation strategies: analysis, comparison, and design", IEEE
Transactions on Power Electronics, vol. 13, pp. 674-689, July 1998
[38] J. Holtz, W. Lotzkat and M. Khambadkone, “On continuous control of PWM
inverters in the overmodulation range including the six-step mode”, IEEE
Transactions on Power Electronics, vol. 8, pp. 546-553, October 1993.
[39] H.W. Van Der Broeck, H.C. Skudelny, G. Stanke, “Analysis and realization
of a pulse width modulator based on voltage space vectors”, IEEE
Transactions on Industry Applications, vol. 24, pp. 142-150, Jan./Feb. 1988.
[40] J. Kim, S. Sul, “A Novel Voltage Modulation Technique of the Space Vector
PWM”, International. Power Electronics Conference Rec., Japan, April 1995.
[41] C. Ong, "Dynamic Simulation of Electric Machinery: Using
Matlab/Simulink", Prentice Hall, New York, 1997.
[41] "MATLAB, The Language of Technical Computing- Version 5 – User's
Guide", Prentice Hall, UpperSaddle River, 1997.
[43] "MATLAB/SIMULINK User's Guide", The MathWorks Inc

135
APPENDIX

136
SIMULATION BLOCK DIAGRAM

137
PM SM VCVFIM ODEL
sin
Sin
v ds
v qs
s in(wet)
cos(wet)
S1
S2
S3
S4
S5
S6
cos(theta e)
s in(theta e)
SVPWM 2
SPEED COM M AND
wthetar
POSIT ION
S1
S2
S3
S4
S5
S6
cos(wrt)
s in(wrt)
we*
id
iq
Vd0
Vq0
TL
Te
wr
INVERT ER/PM SM /LOAD
P/2Gain2
2*p i
Ga in
cos
Cos
id
iq
v d0
v q0
wr*
wr
v dc
v qc
CONT ROLLER

138
CONTROLLERS
2
vqc
1
vdc
iq*
wr
iq*1
iq* FUNCT ION
in
v q0
out
iq PI CONT ROLLER
f(u)
id* FUNCT ION v d0
inout
id P ICONT ROLLER
Vd
Vq
Vq0
Vdc
Vqc
VOLT AGE COM PENSAT OR
Switch
Sum 5
Sum 4
Sum
in out
SPEED PICONT ROLLER
M ux
M ux1
0
Id*2
6
wr
5
wr*
4
vq0
3
vd0
2
iq
1
id

139
SVPWM 2
8s in(theta e)
7cos (theta e)
6
S6
5
S5
4
S4
3
S3
2
S2
1
S1v ds
v qs
s in(wet)1
cos(wet)2
v ao*
v bo*
v co*
s in(wet)
cos(wet)
VECT OR ROT AT OR
V*
alpha
setor
pulse a
pulse b
pulse c
SVPWM ALGORIT HM
NOT
NOT 3
NOT
NOT 2
NOT
NOT 1v a*
v b*
v c*
V*
alpha*
setor*
CONV. 3-2
4
cos(wet)
3
sin(wet)
2
vqs
1
vds

140
SVPWM ALGORITHM
3pulse c
2pulse b
1pulse a
Vdc
Vdc
setor
TA
TB
T0
ta-on
ta-of f
tb-on
tb-of f
tc-on
tc-of f
SECTOR SWITCHING AND ton-toff CALCULATION
In1
In2
pulse a
PULSE GENERATOR - C
In1
In2
pulse a
PULSE GENERATOR - B
In1
In2
pulse a
PULSE GENERATOR - A
alpha
setor
v dc
V*
Ta
Tb
T0
CALCULATION OF T0, Ta, Tb
3
setor
2alpha
1V*

141
INVERTER/PMSM/LOAD
7wr
6Te
5TL
4Vq0
3Vd0
2iq
1id
In1
In2
In3
In4
In5
In6
In7
In8
In9
Vao
Vbo
Vco
VOLTAGE-FED INVERTER
Vd
Vq
TL
wr1
Id
Iq
Te
thetar
Vd*
Vdm
Vqm
Vd0
Vq0
wr
PMSM DQ MODEL1
Memory8
Memory7
Memory6
wr
we*
TL
LOAD
cos(wet)
sin(wet)
in_Vao*
in_Vbo*
in_Vco*1
out_v ds
out_v qs
3-2 TRANSF
sin(wet)
cos(wet)
Ids
Iqs
Ia
Ib
Ic
2-3 TRANSF1
9we*
8sin(wrt)
7cos(wrt)
6S6
5S5
4S4
3S3
2S2
1S1

142
VOLTAGE-FEED INVERTER
3Vco
2Vbo
1Vao
Sum9
Sum11
Sum10
Ic
S5
S2
Vc
IS5
ID5
IS2
ID2
PHASE LEG C
Ib
S3
S6
Vb
IS3
ID3
IS6
ID6
PHASE LEG B
Ia
S1
S4
Va
IS1
ID1
IS4
ID4
PHASE LEG A
-1/3
Gain17
-1/3
Gain16
2/3
Gain15
2/3
Gain14
2/3
Gain13
-1/3
Gain12
9In9
8In8
7In7
6In6
5In5
4In4
3In3
2In2
1In1

143
PMSMDQMODEL1
10
wr
9Vq0
8Vd0
7Vqm
6Vdm
5
Vd*
4
thetar
3
Te
2
Iq
1
Id
Te
TLwr
mech. Dynamics
iq Te
Torque calc.
Vq
Id
wr
Iq
Vqm
Vq0
Q-axis
w thetar
Position
Vd
Iq
wr
Id
Vd*
Vdm
Vd0
D-axis
4wr1
3TL
2Vq
1Vd

144
VITA
João Onofre Pereira Pinto was born in Valparaiso, Brazil in 1966. He attended
Universidade Estadual Paulista at Ilha Solteira, SP, Brazil in 1986, where he received
his Bachelor's degree in Electrical Engineering in 1990. In 1991, he attended
Universidade Federal de Uberlândia, MG, Brazil where he received his Master's of
Science also in Electrical Engineering in 1993.
He has been an assistant professor at Universidade Federal do Mato Grosso do Sul at
Campo Grande, MS, Brazil since 1994, and is currently on leave of absence to pursue
the Ph.D. degree in The University of Tennessee, Knoxville Department of Electrical
Engineering since 1997.